Embed Size (px)
Citation preview

UNIVERSITI PUTRA MALAYSIA
MODELLING OF SUNSHINE DURATION FOR PENINSULAR MALAYSIA
WIN MAW HLAING 00
FSAS 1997 8

MODELLING OF SUNSHINE DURATION FOR PENINSULAR MALAYSIA
By
WIN MAW HLAING 00
Thesis Submitted in Fulfi lment of the Requirements for the Degree of Master of Science in the Faculty of
Science and Environmental Studies Universiti Putra Malaysia
December 1997

ACKNOWLEDGEMENTS
It is a pleasure to be able to thank the many people who have directly
or indirectly helped me in this work. I am grateful to a l l and especial ly to the
persons mentioned here.
F i rst and foremost, I would l ike to sincerely thank Professor
Dr. Mohd. Yusof Sulaiman, chairman of my superv isory committee, for h is
constant encouragement, useful discussions, valuable support and endless
patience.
Simi lar thanks must go to members of my supervisory committee,
Associate Professor Dr. Zainal Abidin Sulaiman, Dr. Mahdi Abdul Wahab,
and Dr. Azmi Zakaria, for their suggestions and guidance throughout the·
project.
I would l ike to thank members a nd staffs i n t he D epa rt ment of P hy sic s
who have always wi l l ing to offer assistance and advice, in particular, En.
Marzuki Hj. Ismai l , En. Razak Harun, En. Suhaimi Ibrahim and En.
Shaharuddin Hj . Abd. Rahman.
II

This work was financial ly supported in part by "Intensified Research
in Priority Area, IRPA programme" and PETRONAS.
Last, but not least, I dedicate this thesis to my parents, who give me
curiosity and a respect for education, and without whose encouragement I
never would have come this far.
III

TABLE OF CONTENTS
Page
ACKNOWLEDGEMENTS . . . . . . . . . . . . . . . . . . . . . . . . . . . . . . . . . . . . . . . . . . . . . . . .. . . . . . . . . . . . . .. .. . . . . 1\ LIST OF TABLES . . . . . . . . . . . . . . . . . . . . . . . . . . . . . . . . . . . . . . . . . . . . . . . . . . . . . . . . . . . . . . . . . . . . . . . .. . . . . . . . . VI LIST OF FIGURES . . . . . . . . . . .. . . . .. . .. . . . .. . . . . . ... .. . . . . .. . . . . . . . . .. ... . . . . . .. . . . . . . . . .. .. . .. .. . v i i i L IST OF SYMBOLS AND ABBREVIATIONS . . . . . . . . . . . . . . . . . . . . . . . . . . . . . . .. . . .. . . . . XI ABSTRACT . . . . . . . . . . . . . . . . . . . . . . . . . . . . . . . . . . . . . . . . . . . . . . . . . . . . . . . . . . . . . . . . . . . . . .. . . . . . . . . . . . . . . . . . . . . xiv ABSTRAK . . . . . . . . . . . . . . . . . . . . . . . . . . . . . . . . . . . . . . . . . . . . . . . . . . . . . . . . .. . . . . . . . . . . . . . . . . . . . . . . . . . . . . . . . . . . . . XVI
CHAPTER
1 INTRODUCTION.................................................... ............. ..... 1 Objectives of the Study . . . . . . . . . . . . . . . . . . . . . . . . . . . . . . . . . . . . . . . . . . . . . . . . .. . . . . . . . . . . 2 Brief Descriptions of the Cl imate of Peninsular Malaysia . . . . . . . . . 4 Locations of the Study and Avai labi lity of Data . . . . . . . . . . . . . . . . . . . . . . . . 5 Thesis Outl ine . . . . . . . . . . . . . . . . . . . . . . . . . . . . . . . . . . . . . . . . . . . . . . . . . . . .. .. . . . . . . . . . . . . . . . . . . . 8
2 ESTIMATION OF SOLAR RADIATION FROM SUNSHINE DURATION . . . . ... . . . .. . . . . . .. . . . . . . . . . . . . . . . . . . . . . . . . . . .. . . .. . . . . . . . . 9 I ntroduction . . . . . . . . . . . . . . . . . . . . . . . . . .. . . . . . . . . . . . . . . . . . . . . . . . . . . . . . . . . . .. . . . . . . . . . . . . . . . . 9 Angstrom Type Equation . . . . . . . . . . . . . . . . . . . . . . . . . . . . . . . . . . . . . . . . . . . . . . . . . . . . . . . . . . 10 Modifications of Angstrom Type Equation . . . . .. . .. . . . .. . . . . . . . . . . . . . . . . . . 12 Review of Previous Work on Analysis of Solar Radiation and Sunshine Duration Records from Peninsular Malaysia . . . . . 14 Data Analysis . . .. . . . . . . . . . . . . . . . .. . . . . . . . . . . . . . . .. . . . . . . . . . . . . . . . .. . . . . . . . . . . . . . . . . . . . . . 18 Results and Discussions . . . . . . . . . . . . . . . . . . . . . . . . . . . . . . . . . . . . . . . . . . . .. . . . . . . . . . . . . . 22
Correlation of Monthly Mean Val ues . . . . . . .. . . . . . . . . . . . . . . . . . .. .. . . . . . 22 Correlation of Dai ly Val ues . . . . . . . . . . . . . . ................ ................... 28 S ola r Ra dia ti on a t Da ys with Zero Sunshine Duration (Overcast Days) . . . . . . . . . . . . . . . . . . . . . . . . . . . . . . . . . . . . . . . . . . . . . . . .. . . 34 Seasonal Effect on Overcast Days . . . . . . . . . . . . . . . . . . . . . . . . . . . . . . . . . . . . . 38
Summary . . . . . . . . . . . . . . . . . . . . .. . . . . . . . . . . . . . . . . . . . . . .. . . . . . . . . . . . . . .. . . . . . . . . . . . . . . .. . . . . . . . 41
3 PROBABILITY MODEL OF RELATIVE SUNSHINE DURATION . . . . . . . . . . . . . . . . . . . . . . . . . . . . . . . . .. . . . . . . . . . . . . .. . . . . . . . . .. . . 42 I ntroduction . . . . . . . . . . . . . . . . . . . . . . . . . . . . . . . .. . . . . . . . . . . . . . . . . . . . . . . . . . . . . . . . . . . . . . . . . .. . . . . 42 Theoretical Background . . . . . . . . . . .. . . . . . . . . . . . . . . . . .. . . . . . . . . . . . . . . . . . . .. . . . . . . . . . . 43
Probabil ity Density Function (PDF) . . . . . . . . . . .......................... 43
IV

Cumulative Distribution Function (CDF) . . . . . ... . . . . .. . . .. . . . . . . . . . . . 44 Frequency D istribution of Clearness Index . . .. . . . . . . . . . . . . . . . . . . . . . 45 Probabi l ity Density F unction of C learness Index for Tropical Locations . . . . . . . . . . . . . . . . . . . . . . . . . . . . . . . . . . . . . . . . . . . . . . . .. . . . . . . , . 49
Data Analysis and Results . . . . . . . . . . . . . . . . . . . . . . . . . . . . . . . . . . . . . . . . . . . . . . . . . . . . . . . . 53 Estimation of Parameters of Distribution F unction ............. 57 T est of Goodness of F it . . . . . . . . . . . . . . . . . . . . . . . . . . . . . . . . . . . . . . . . . . . . . . . . . . . . . . 66 Comparison with Beta Distribution Model . . . . . . . . . . . . . . . . . . . . . . . . . . . 7 2
Discussions . . .. . .. . . . . . . . . . . . . . . . . . . . . . . . . . . . . . . . . . . . .......... ..... .................. .. .. 79 Petal ing Jaya and S ubang Stations . . . . . . . . . . . . . . . . . . . . . . . . . . .. . . . . . . . . 79 Bayan Lepas and Kota Bharu Stations . . . . . . . . . . . . . . . . . . . . . . . . . . . . . .. 81 Beta Distri bution Model . . . . . . . . . . . . . . . . . . . . . . . . . . . . . . . . . . . . . . . . . . . . . . . . . . . . . . . 81 Effect of Variance.. .. . . . . ... . . . . .. . . .... . . . . . . . .. ... . . . . . . ... . . . ... . . . . . .. . . .. . .. 84
Summary . . . . . . . . . . . . . . . . . . . . . . . . . . . . . . . . . . . . . . . . . . . . . . . . . . . . . . . . . . . . . . . . . . . . . . . . . . . . . . . . . . . . 86
4 TIME SERIES ANALYSIS OF RELATIVE SUNSHINE DURATION . . . . . . . . . . . . . . . . . . . . . . . . . .. . . . . . ........ ... ..... .............. 87 I ntroduction . . . . . . . . .. . . . . . . . . . . . . . . . .. . . . . . . . . . . . . . . . . . . . . . . . . . . . . . . . . . . . . . .. . . . . . . . .. . . . . . . 87 Previous Work . . . . . . . . . . . . . . . . . . . . . . . . . . . . . . . . . . . . . . . . . .. . . . . . . . . . . . . . . . . . . . . . . . . . . . . . . . . . 88 Data Analysis of Results . . . . . . . . . . . . . . . . . . . . . . . . . . . . . . . . . . . . . . . . . . . . . . . . . . . . . . . . . . . . . 92
Transformation of Relative S unshine D uration . . . . . ... . . . . . . . . . . . . . 92 Identification of the Time Series Model . . . . . . . . . . . . . . . . . . . . . . . . . . . . . . . . 93 Autoregressive Process . . . . . . . . . . . . . . . . . . . . . . . . . . . . . . . . . . . . .. . . . . . . . . . . . . . . . . . . 101 Estimation of the Model Parameters . . . . . . . . . . . . . . . . . . . . . .. . . . . . . . . . . . . . 102 Diagnostic Checking of the Models .. . . . . . . . . . . . . . . . . . . . . . . . . . . . . . . . . . . . 103
Discussions . . . . . . . . . . . . . . . . . . . . . . . . . . . . . . . . . . . . . . . . . . . . . .. . . . . . . . . . . . . .. . . . . . . . . . . . . . . . . . . . 113 Summary. . .. . ... . . . .. ... ... ... . . ... . .. .... . .. ... . ... .. . . . . . .. . .. . ..... .. . .. . .. .. . . . . . . . . .. . . 1 1 4
5 CONCLUSiONS.. ........... ... ........... ...... .............. ......... .... .. . .. . .... . . . 115
REFERENCES . . . .. . . . . . . . . . .. . . . . . . . . . . . . . . . . . . . .. . . . . . . . . . . . . . . . . . . . . . . . ......... ................... 117
VITA . . . . . . . . . . . . . . . . . . . . . . . . . . . . . . . . . . . . . . . . . . . . . . . . . . . . . . . . . . . . . . . . . . . . . . . . . . . . . . . . . . . . . . . . . . . . . . . . . . . . . . . . 123
v

LIST OF TABLES
Tables Page
1 Locations of the Stations . . . . . . . . . . . . . . . . , . . . . . . . . . . . . . . . . . . 6
2 Calculated Monthly Mean Extraterrestrial Solar Radiation and Maxim um Sunshine D uration . . . . . . . .. . . 21
3 Parameters a, b and Correlation Coefficient r from Regression of Monthly Mean Data . . . .. . . . . . . . . . . . , . . . . . . 22
4 Parameters a, b and Correlation Coefficient r from Regression of Daily Val ues for Petal ing Jaya Station . . , ' " . . . . . . ' " . . . . , . . . , . . . . . . . , . . . . . . . . . . . . . . . . . . . . , . . . . . . 29
5 Parameters a , b and Correlation Coefficient r from Regression of Dai ly Val ues for Subang Station . . . . . . . 30
6 Parameters a , b and Correlation Coefficient r from Regression of Dai ly Val ues for Bayan Lepas Station . . , . . . . . . . . , . . . . . . . , . . . , . . . . . . . , . . . . . . . . . . . . . . . . . . . . . . . . . . . 31
7 Parameters a, b and Correlation Coefficient r from Regression of Dai ly Val ues for Kota Bharu Station . .. . . . .. . .. . ' " . . . . , . .. . ' " . . . . . . .. . ... . . . ... ' " . . . . . . . . . . 32
8 Month ly Mean Relative Sunshine Duration .. . . . , .. . ' " 54
9 Parameters C and y for Bendt et al . Model . . . . . . . . . . . . . 63
10 Parameters C and y for Hol lands and H uget Model . . . . . . . . . . . . . . . . . . . . . . . . . . . . . . . . . . . . . . . . . . . . . . . . . . . . . . . . . . . . 64
11 Parameters C and y for Saunier et a l . Model . . . . . . . . . . . 65
12 The K-S statistics of Bendt et a l . Model . . . . . . . . . . , . . . ' " 69
13 The K-S statistics of Hol lands and Huget Model . . . ' " 70
14 The K-S statistics of Saunier et al . Model . . . . . . . . . . . . . . . 71
vi

1 5 Parameters a and b for Beta Distributions Model .. .. . 77
1 6 The K-S statistics of Beta Distribution Model . . . ... .. . . 78
1 7 Estimated Parameters of the Models . . . . ... . . . . . . .. . .. . ..... 1 02
1 8 Q Statistics of the Residuals �t . . . . . . . . . . .. .. . . .. . . . . . . . . . . . 1 04
vi i

LIST OF FIGURES
Figures Page
1 Map of Location of the Stations Used in the Study ... 7
2 Regression of Monthl y Mean Values for Petaling Jaya station ......... ........................... ............. 23
3 Regression of Monthl y Mean Values for Subang Station .... , . . .. . . .. . . ' " . .. . .. ... . . . " . . .. . , . . . . . . . .. , 24
4 Regression of Monthl y Mean Values for Sayan Lepas Station .. , . .. . . . . . .. . . . . . . . . . . . . . . . . . . . . . . . . . .. . 25
5 Regression of Monthl y Mean Values for Kota Sharu Station ..... .. , . . . . . . , . . . . , . . . . . . . . , . . . . . .. . .. . . . . . 26
6 Seasonal Variation of Prameters a and b . . . . . . . . . . . . . . . . . . . . . . . . . . . . . . . . . . . . . . . . . . . . . . . . . . . . . . . . . . . . . . . . . . . . . . . . 33
7 Frequency Distribution of K on Days with 8=0 (a) Petal ing Jaya, (b) Subang ..... , . , . . . . ' " . . . . , . . . . . . , . . , 35
8 Frequency Distribution of K on Days with 8=0 (a) Sayan Lepas, (b) Kota Sharu ., . . . . . . . . . . . , . ' " .. . . . . . . 36
9 Frequency Distribution of K on Days with 8=0 Seasonal Sepaerated (a) Petal ing Jaya (b) Subang ... . , . ' " . . , ' " . . .. . . . . . ' " . . . . . . . . , . . . . . . . . . . . .. . . . . . 39
1 0 Frequency Distribution of K on Days with 8=0 Seasonal Sepaerated (a) Bayan Lepas (b) Kota Bharu .. , . . . . . . . . . . . . . . . . . . . . . . . . . . . . . . . . , ., . . . . . .. .. .. . 40
1 1 Comparison of Monthly Mean Values of Relative Sunshine Duration with Past Records (a) Petal ing Jaya(b) Subang ................................ ..... 55
viii

1 2 Comparison of Monthly Mean Values of Relative Sunshine Duration with Past Records (a) Bayan Lepas, (b) Kota Bharu . . . . . . . . . . . . .. . . . . . . . . . . . . . ... 56
1 3 Plots of Bendt et a l . Model for D ifferent Mean Values. (a) PDF, (b) CDF . . . . . . . . . . . . . . . .. . . . . . . . . . .. . . .. . . . 60
1 4 Plots of Hol lands and Huget Model for Different Mean Values. (a) PDF, (b) CDF . . . . . . . . . . . . . . . . . . . . . . . . . . . 61
1 5 Plots of Saunier et a l . Model for D ifferent Mean Values. (a) PDF, (b) CDF . . . . . . . . . .. . . . . . . . . . . . . . . . . 62
1 6 Beta Distribution with Different Parameters . . . . . . . . , . . . 74
1 7 Cumulative Frequency Distribution of Relative Sunshine Duration. (a) Petal ing Jaya (Dec.) (b) Subang (Dec. ) . . . . . . . . . . . . . . . . . . . . . . . . . . . . . . . . . . . . . . .. . . . . . . . 80
1 8 Standard Deviation (j . vs. Mean Values of Relative Sunshine Duration . . . . . . . . . . . . . . . . . . . . . . . . . . . . . . . . . . . . . . . . . . . . . . . . 83
1 9 Distribution of Transformed Variable x. the Sol id Curves Represent the Normal Distribution with Mean Zero and Unit Variance. (a) Petal ing Jaya, (b)Subang . . . . . . . . . . . . . . . . . . . . . . . . . . . . . . . . . . . . . . . . . . . . . . . . . . . . . . . 94
20 Distribution of Transformed Variable x. the Solid Curves Represent the Normal Distribution with Mean Zero and Unit Variance. (a) Bayan Lepas, (b)Kota Bharu . . . . . . . . . . . . ' " . . . . . . . . . . . . . . . . . . . . . . . . . , . . , . . . . . . 95
21 ACF and PACF of T ime Se rie s Xt, fo r Peta l ing Jaya Stat io n . . . . . . . . . .. . . . . ' " . . . . . . . . . . . . . . . . . . . . . . . 97
22 ACF and PACF of Time Series Xt, for Subang Station . . . . . . .. . . . . . . . ' " . . . . . . . . , . . . . . , . . . . . . . . . . . . . . . 98
23 ACF and PACF of Time Series Xt, for Bayan Lepas Station . . . . . . . . . . . . . . . . . . . . . . . . . . . . , . . .. . " . .. 99
24 ACF and PACF of Time Series Xt, for Kota Bharu Station . . . . . . . . . . . . . . . ' " ' " . . . . . . . . . . . . . . . . . . . . . . . 1 00
ix
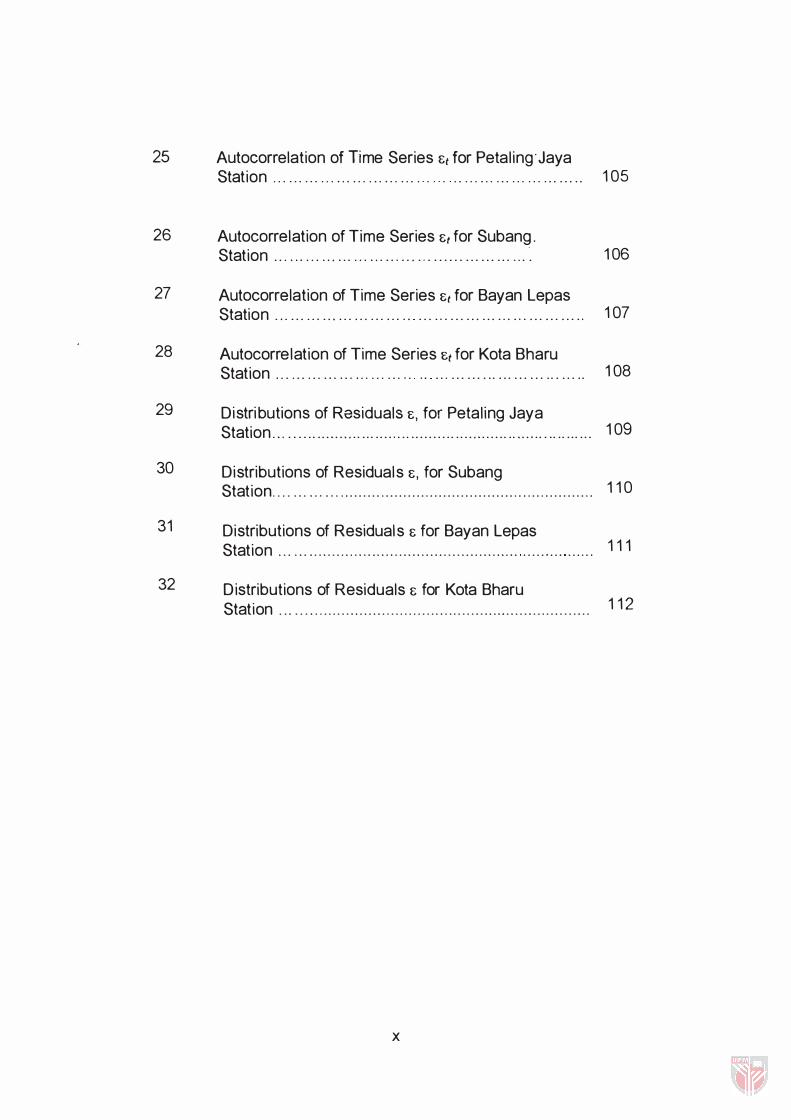
25 Autocorrelation of Time Series Et for Petal ing' Jaya Station . . . . . . . . . . . . . . . . . . . . . . . . . . . . . . . . . . . . . . . ... ... ... . . . ... ... .. 105
26 Autocorrelation of Time Series Et for Subang . Station . . . . . . . . . . .. . .. . . . . . , ...... ... ...... ... ... .. , ... '. .. ... . . . .. 106
27 Autocorrelation of Time Series Et for Sayan Lepas Station . . . . . . . . . . . . . . . . . . . . . . . . '" ... . , . ... ... ... .. , ., . ... ... ... .. 107
28 Autocorrelation of Time Series ct for Kota Sharu
29
30
31
Station . . . . .. . . . . . . . . . . . . . . . . . . . " '" ... ... ... . .. . .. ... ... .. . . . . .. 108
Distributions of Residuals c, for Petal ing Jaya Station . . . ... . . .. . .... . . . .. . .. . . . . . . .. . . . . . . . . .. ... ...... . .. .. . . . . ... .. .. . .. .. 1 09
Distributions of Residuals E, for Subang Station . . . . . . . . . , .. . ......... ................................ ................ 110
Distributions of Residuals E for Sayan Lepas Station . . . . . . . . . . . . . . . . . . . . . . . . . . . . . . . . .. . . . . . . .. . . . . . . .. . '" ........ " . . .. . . 111
32 Distributions of Residuals E for Kota Sharu Station.. . . . . . . . . . . . . . . . . . . . . . . . . . . . . . . . . . . . . . . . . . . . . . . . . . . . . . . . . . . . . . . . . . . .
112
x
Symbols
a and b
C andy
o
00.01
00.05
F(x)
H
H
Ho
Ho
K
Kmax
Kmin
K
N
n
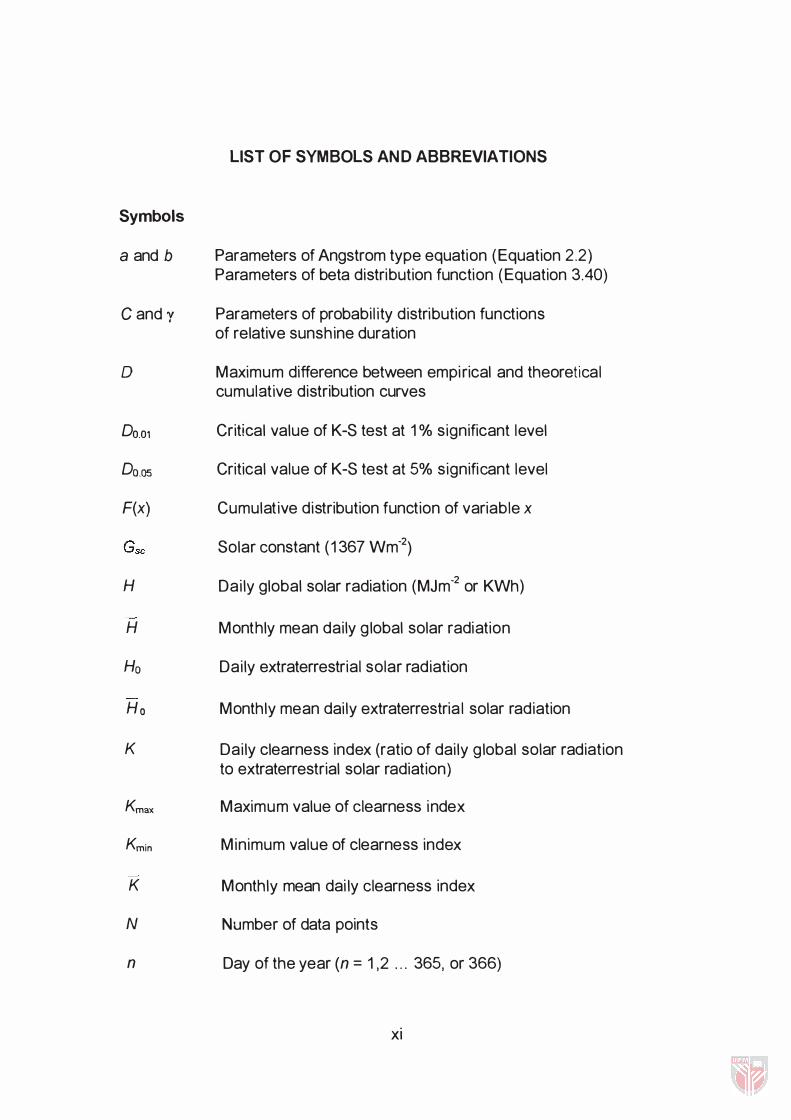
LIST OF SYMBOLS AND ABBREVIATIONS
Parameters of Angstrom type equation (Equation 2.2) Parameters of beta distribution function (Equation 3.40)
Parameters of probabi l ity distribution functions of relative sunshine duration
Maximum difference between empirical and theoretical cumulative distribution curves
Critical value of K-S test at 1 % significant level
Critical value of K-S test at 5% significant level
Cumulative distribution function of variable x
Solar constant ( 1 367 Wm-2)
Dai ly global solar radiation (MJm-2 or KWh)
Monthly mean daily g lobal solar radiation
Dai ly extraterrestrial solar radiation
Monthly mean dai ly extraterrestria l solar radiation
Dai ly clearness index (ratio of dai ly g lobal solar radiation to extraterrestrial solar radiation)
Maximum value of clearness index
Minimum value of clearness index
Monthly mean dai ly clearness index
Number of data points
Day of the year (n = 1 ,2 . . . 365, or 366)
xi

P(x) Probability density function of variable x
Q Values of Box-Pierce and Ljung-Box statistics
r Correlation coefficient
S Daily actual sunshine duration (hr)
S Monthly mean daily actual sunshine duration
So Daily maximum sunshine duration (hr)
So Monthly mean daily maximum possible sunshine duration
s Daily relative sunshine duration (ratio of daily actual sunshine duration to maximum possible sunshine duration)
s Monthly mean dai ly relative sunshine duration
t I ndex of daily time step (used in chapter 4)
x Normal distributed variable with zero mean and unit variance (used in chapter 4)
Solar decl ination (degree or radian)
E Uncorrelated random variables with normal distributions
c!> Latitude of the location (degree)
c!>k,k Partial autocorrelation coefficient at lag k
c!>1, c!>2, . . . , c!>p Parameters of autoregressive pth order process
2 0"
Autocorrelation coefficient at lag k
Standard deviation
Variance
Sunset hour angle (degree or radian)
xii

Abbrevi ations
ACF Autocorrelation function
AR(p) Autoregressive pth order process
CDF Cumulative Distribution Function
K-S test Kolmogorov-Smirnov test
PACF Partial autocorrelation function
PDF Probabi l i ty Density Function
l test Chi-square test
xii i

Abstract of thesis submitted to the Senate of Universiti Putra Malaysia in fulfilment of the requirements for the degree of Master of Science.
Chairman: Faculty:
MODELLING OF SUNSHINE DURA rlON FOR PENINSULAR MALAYSIA
By
WIN MAW HLAING 00
December 1 997
Professor Mohd. Yusof Sulaiman, Ph.D. Science and Environmental Studies
Knowledge of solar radiation at any area is important for designing
solar energy conversion systems, and is a lso useful for ecophysiological
studies. I n the present study, we have analysed the daily sunshine duration
records for Peninsular Malaysia and apply them in solar radiation model l ing.
Firstly, we fitted Angstrom type equation to solar radiation and
sunshine d ur ation, to deter mine the r ela tion betw een them. We have found
that the seasonal variations of the regression parameters, are different for
even two nearby locations. Variation of solar radiation within a small area
are also noticable.
XIV
Secondly, we have studied on the probabi l i ty distribution nature of
dai ly relative sunshine duration. Dai ly relative sunshine duration data are
fitted to three models. Parameters of the models are estimated only from the
monthly mean. Kolmogorov-Smirnov test is appl ied to determine the
goodness of fit. We have found that the four stations can model led by two
distributions. Data are also fitted to wel l known beta distribution model . The
effect of variance is also presented.
Final ly, t ime series analysis of dai ly relative sunshine duration data
are presented in chapter 4. Using gaussian mapping technique, non
stationary and non-normal distribution nature of the sunshine can be
transformed into stationary and normal distribution. The autocorrelation
function and partial autocorrelation function show the characteristics of
autoregressive process. Results from the Box-Pierce and Ljung-Box
statistics indicate that the first order autoregressive model is not suitable,
whi le the second order autoregressive model gives satisfactory results. The
relative sunshine duration of a ny da y i s dependent on the previous two
days.
xv

Abstrak tesis yang d ikemukakan kepada senat Universiti Putra Malaysia sebagai memenuhi keperluan untuk i jazah Master Sains.
PEMODELAN TEMPOH SINARAN SURIA UNTUK SEMENANJUNG MALAYSIA
Oleh
WIN MAW HLAING 00
Disember 1 997
Pengerusi: Profesor Mohd. Yusof Sulaiman, Ph.D.
Fakulti: Sains dan Pengajian Alam Sekitar
Pengetahuan mengenai sinaran suria bagi sesuatu kawasan adalah
penting di dalam usaha merekabentuk sistem penukaran tenaga suria serta
juga berguna untuk kajian ekofisiolog i . Dalam penyelidikan yang d ijalankan,
rekod tempoh sinaran suria harian bagi beberapa lokasi d i Semenanjung
Malaysia dianal isa dan kemudiannya digunakan dalam pemodelan sinaran
suria.
Pad a mulanya, bacaan sinaran suria dan tempoh sinaran telah
dipadankan dengan persamaan jenis Angstrom bagi memastikan hubungan
antara kuantiti tersebut. Didapati bahawa perubahan disebabkan oleh
musim ke atas parameter regresi adalah ketara walaupun untuk dua
xvi

kawasan yang berhampiran. Perubahan sinaran suria dalam satu kawasan
yang keci l juga dapat d i l ihat dengan jelas.
Kedua, kami juga telah menjalankan kajian ke atas sifat taburan
kebarangkalian tempoh sinaran relatif harian dan ianya telah dipadankan
kepada tiga jenis model . Parameter-parameter model d ianggarkan hanya
dari min bulanan bacaan sinaran suria sahaja. U jian Kolmogorov-Smirnov
dijalankan bagi menentukan kesesuian hasii pemadanan dan didapati
empat stesyen boleh dimodelkan oleh dua taburan. Data juga telah
d ipadankan kepada model taburan Beta yang lebih terkenal.
Akhirnya, anal isis menggunakan siri masa ke atas tempoh sinaran
relatif harian diberikan di dalam bab 4. Dengan menggunakan teknik
pemetaan Gaussian, jenis taburan tidak pegun dan tak normal sinaran suria
telah ditransformasikan kepada taburan berbentuk pegun dan taburan
normal . Fungsi otokorelasi biasa dan otokorelasi separa dapat
menunjukkan sifat proces otoregresi f. Ha si l ya ng diperolehi dari statistik
Box-Pierce dan Ljung-Box menunjukkan bahawa model otoregresif jenis
pertama tidak sesuai digunakan sementara model otoregresif jenis kedua
menghasilkan keputusan yang memuaskan. Tempoh sinaran suria dua
pada sebarang hari adalah bergantung kepada tempoh sinaran suria pada
dua hari sebelumnya.
xvi i

CHAPTER 1
INTRODUCTION
Measurement of solar radiation is important in developing solar
energy devices to supplement existing energy sources. This is of particular
importance for country like Malaysia where the solar radiation is available in
abundance throughout of the year. There are aiso other uses of such
information in quantitative ecophysiological studies such as the source of
energy used in photosynthesis and evapotranspiration.
The solar radiation climatology of the world has been extensively
studied by numerous researchers in the past. However, since solar radiation
reaching the earth's surface depends on the factors such as cloud cover,
water vapour contents, and other meteorological factors which are not
consistent globally, the measurements of on-site radiation data are
essential. But unfortunately, for most of the locations, a detailed historical
record (without missing values) of the solar radiation values does not exist.
And even for locations having reliable data, the effort of incorporating them
in applications require the user to handle enormous amount of data.
1

2
To overcome this problem, a stochastic model, which can explain the
statistical properties of historical records, only from summarized parameters
(e. g. monthly mean) need to be developed.
In the present study, we analysed the daily sunshine duration data for
Peninsular Malaysia to apply in solar radiation modelling. Sunshine duration
is one of the meteorological parameter which is most correlated to solar
radiation.
Daily sunshine duration is the total time during the day when the sun
in unobscured by cloud . And it can be measured easily using simple devices
such as Campbell-Stokes sunshine recorder (Linacre, 1992). Sunshine
duration measurements are available at many more locations than solar
radiation, and it can be used for model construction and calibrations.
Objectives of the Study
The overall purpose of this work is to derive a mathematicai model of
daily sunshine duration. The model requires a minimum number of
parameters that are readily assessable.

3
More specifically the objectives are to:
• determine the correlation between solar radiation and sunshine
duration. The results can be applied in the estimation of the global
solar radiation from sunshine duration .
• study the probability distribution nature of daily relative sunshine
duration. The results will determine the appropriate probability
density and cumulative d istribution function of the relative sunshine
duration.
• study for the sequential structure of daily relative sunshine duration.
The results wi l l be useful in the construction of a time series model
which can generate a long term synthetic sequence of daily sunshine
duration.

4
Brief Descriptions of Climate of Peninsular Malaysia
Peninsular Malaysia is located roughly between 1 0 and 60 north
latitude and 1 000 and 1 040 longitude east. The country is bordered by
Thai land in the north. The South China sea on the east side of the country,
whi le the strait of Malacca on the west coast separates the peninsula from
Sumatra.
The climate of Peninsular Malaysia has seasonal rhythm, mainly
determined by changes in d irections and speed of the air streams that cross
the peninsula (Dale, 1 959).
Temperature conditions are best characterized by the term
'uniformity'. This applies to the lack of seasonal variation and the annual
range of temperature everywhere in the country remains low. The daily
cycle of the temperature proceeds usual ly vary regularly, without large
var iatio ns f ro m day to day , such as occur in the temperate climates.
The main characteristic of rainfal l in Peninsular Malaysia is its
variab i l ity. Rainfal l is the most changeable element of climate, both in the
relation to time and place. Its d iurnal , seasonal and annual distributions vary
strongly from region to region and from year to year.

5
The rainy seasons are main ly influenced by the Asian monsoons.
The South-west monsoon brings rain and cloud to the west coast from June
to early October, while the North-east monsoon brings rain and cloud to
east coast from November to March. Therefore, the west coast is dry from
November to March whi le the east coast is dry from June to September.
The relative humidity of the lower atmosphere in Peninsular Malaysia
is usua l ly high. Mean values at night-time for a l l stations are between 95%
and 1 00%, only the day-time values have the regional and seasonal
d ifferences.
Locations of the Study and Availability of Data
Daily g lobal solar radiation and sunshine duration for ten years
[1 985-1 994], are suppl ied by the Meteorological Department, Ministry of
Science, Technology and Environment of Malaysia. The data are for four
stations, namely, Petaling Jaya, Subang, Sayan Lepas and Kota Bharu. The
locations of these stations are described in Table 1 and Figure 1 .

6
Table 1 : Locations of the Stations
Stations Latitude Longitude Altitude
Petaling Jaya 3°06'N 101° 39' E 45.7 m
Subang 3° 01' N 101° 33' E 16.5m
Sayan Lepas 5° 18' N 100° 16' E 2.8m
Kota Sharu 6°10'N 102011' E 4.6m

Sayan Lepas
Subang •
• Petaling Jaya
Figure 1: Map of the Locations of the Stations Used in the Study
7