Embed Size (px)
Citation preview

UNIVERSITI PUTRA MALAYSIA
SIMULTANEOUS REMOVAL OF CARBON, NITROGEN AND PHOSPHORUS FROM DOMESTIC WASTEWATER BY
SEQUENCING BATCH REACTOR
HO YUN KIT
FK 2001 5
SIMULTANEOUS REMOVAL OF CARBON, NITROGEN AND PHOSPHORUS FROM DOMESTIC WASTEWATER BY
SEQUENCING BATCH REACTOR
By
HOYUNKIT
Thesis Submitted in Fulfilment of the Requirement for the Degree of Master of Science in Faculty of Engineering
Universiti Putra Malaysia
September 2001

Abstract of thesis presented to the Senate of Universiti Putra Malaysia in fulfilment of the requirement for the degree of Master of Science
SIMULTANEOUS REMOVAL OF CARBON, NITROGEN AND PHOSPHORUS FROM DOMESTIC WASTEWATER BY
SEQUENCING BATCH REACTOR
By
HO YUNKIT
September 2001
Chairman: Dr. Fakhru'I-Razi Ahmadun
Faculty : Engineering
Sequencing Batch Reactor(SBR) had been found to be an alternative biological
treatment for simultaneous removal of carbon, nitrogen and phosphorus from
domestic wastewater. Nevertheless studies of this alternative treatment system are
few in Malaysia. Thus, research has to be done to explore the potentials of such
treatment in our country.
A bench scale SBR with a working volume of 2 L, was set up. The reactor had a
stable flowrate of 1.4Ltbr maintaining a food to microorganism ratio of around 0.16
and a minimum sludge age of 6-9 days. In this study, two major operational
strategies were used in achieving the best removal of the three nutrients. In the first
operational strategy where different total cycle hours were applied, the 6 hour total
11
cycle hour produced the best removal efficiency in tenns of total suspended solids
(TSS)[97%], biological oxygen demand (BOD)[85%), chemical oxygen demand
(COD)[87%] and total Kjeldahl nitrogen (TKN)(>90%]. Nevertheless phosphorus
removal seemed to be comparable with the other strategy operations, 8hr and 10hr
total cycle time.
The next operational strategy involved the manipulation of various ratio of aerobic
and anaerobic period. Three main ratio, anaerobic:aerobic(fill:react) ratio of 1 :2.7,
1:1 and 1.7:1 were taken into consideration. Longer aerobic period (fill:react ratio
1:2.7) produced the best removal efficiency for TSS(95%), COD(89%), BOD(90%)
and TKN (>90%). Total phosphate removal efficiency averaged about 38%. Hence,
longer aerobic period strategy produced better overall nutrients removal efficiency.
In operational strategy involving fill:react ratio, the nitrification rates ranged from
1.2 to 2.4 mg.g"l VSS day" I which were comparable to previous studies(Palis &
Irvine., l985� Vuoriranta et.al.,1993; Rustrian et.al., 1998). The denitrification rates
ranged from 1.2 to 3.7 mg.g-l VSS day"l which were also comparable to previous
works(Palis & Irvine, 1985; Vuoriranta et.al.,1993; Bortone et.al., 1994; Rustrian
et.al., 1998). The P-release rates ranged from 0.018 to 0.027 mg Pig VSS/min while
P-uptake rates ranged from 0.010 to 0.024 mg Pig VSS/min.
III
Abstrak tesis yang dikemukakan kepada Senat Universiti Putra Malaysia sebagai memenuhj keperluan untuk ijazah Master Sains
RA WATAN BERSAMA UNTUK KARBON, NITROGEN DAN FOSFORUS DALAM DAR! AIR SISA KUMBAHAN DOMESTIK MELALUI
'SEQUENCING BATCH REACTOR'
Oleh
HO YUNKIT
Septem ber 2001
Pengerusi: Dr. Fakhru'l-Razi Ahmadun
Fakulti : Kejuruteraan
'Sequencing Batch Reactor'[SBR] telah mendapat perhatian meluas sebagai salah
proses altematif biologi dalam rawatan bersama elemen karbon, nitrogen serta
fosforus dari air kumbahan domestik. Walau bagaimapun, proses ini kurang
dikajiselidik oleh para saintis di negara Malaysia. Oleh yang demikian, kajian perlu
dijalankan meggunakan proses ini dalam memenuhi keperluan negara.
Dalam kajian ini, sebuah reaktor kecil dengan isipadu berfungsi 2L telah digunakan.
Reaktor ini berfungsi the kadar aliran masuk dan keluar yang mantap iatu 1.4LIhr
serta mempunyai nisbah makanan kepada. mikroorganisma sebanyak 0.16. Reaktor
ini juga megekalkan umur enapan kumbahan selama 6-9 hari.
Dalam kajian ini, dua strategi operasi telah digunakan dalam rawatan air sisa
kumbahan. Dalam strategi operasi pertama telah melibatkan jumlah masa proses
IV

yang berlainan. Dalam jwnlah masa proses SBR 6jam, etlislen pengurangan dalam
rawatan adalah paling berkesan dari segi aspek jwnlah pepejal terampai (TSS)
[97%], penentuan permintaan oksigen biologi (BOD) )[85%], penentuan pennintaan
oksigen kimia (COD) [87%], nitrogen (TKN)[>90%]. Namun begitu, rawatan untuk
fosforus tidak setanding dengan strategi operasi yang lain.
Dalam operasi strategi yang berikutnya, manipulasi pelbagai nisbah masa aerobik
serta anaerobik telah dijalankan. Dalam tiga nisbah yang dikaji iaitu
anaerobik:aerobik 1:2.7, 1:1 dan 1 .7:1, strategi yang mempunyai masa aerobik yang
lebih tinggi iaitu anaerobik:aerobik 1:2.7 telah memperolehi rawatan yang terbaik.
Strategi ini telah memperolehi effisien rawatan tertinggi bagi aspek TSS(95%),
COD(89%), BOD(90%) and TKN (>90%). Namun begitu, rawatan untuk fosforus
tidak setanding dengan strategi operasi yang lain. Ia hanya effisien rawatan
pemulihan sebanyak 38%. Namun demikian perbezaan effisien rawatan adalah
setanding the 2 strategi lain.
Dalam nisbah masa aerobik serta anaerobik, kadar nitrifikasi adalah dalam
lingkungan l.2-2.4 mg.g-I VSS dail setanding dengan kajian terdahulu (Palis &
Irvine.,1985; Vuoriranta et.al.,1993; Rustrian et.al., 1998). Bagi kadar denitrifikasi,
kajian ini mendapat kadar dalam lingkungan 1. 2-3.7 mg.g-1 VSS dail juga setanding
kajian lain (Palis & Irvine, 1985); Vuoriranta et.al.,1993; Bortone et.al., 1994;
Rustrian et.al., 1998). Bagi kadar pe1epasan fosforus adalah dalam lingkungan 0.018
- 0.027 mg Pig VSS/min dan kadar pengambi1an fosforus ialah dari 0.010-0.024 mg
Pig VSS/min.
v

ACKNOWLEDGEMENTS
First and foremost, I would like to thank my main supervisor, Dr. Fakhru'l
Razi for his constant guidance and advises throughout the period of my study.
In addition, I wish to thank members of my supervIsory committees,
Dr.Azni, En. Abdul Ghani Malik: and Dr. Sa' ari, for their time and energy spent in
making this a better work.
My appreciation also goes to the laboratory staff and lab members for their
support and assistance throughout my stay in the laboratory.
VI

I certify that an Examination Committee met on 29 September 2001 to conduct the final examination of Ho Yun Kit on his Master of Science thesis entitled "Simultaneous Removal of Carbon, Nitrogen and Phosphorus from Domestic Wastewater by Sequencing Batch Reactor" in accordance with Universiti Pertanian Malaysia (Higher Degree) Act 1980 and Universiti Pertanian Malaysia (Higher Degree) Regulations 1981 . The Committee recommends that the candidate be awarded the relevant degree. Members of the Examination Committee are as follows:
Thomas Choong Shean Yaw, Ph.D. Faculty of Engineering Universiti Putra Malaysia (Chainnan)
Fakhru'l-Razi Ahmadun, Ph.D. Associate Professor Faculty of Engineering Universiti Putra Malaysia (Member)
En. Abdul Ghani Liew Abdullah, M. Sc. Faculty of Engineering Universiti Putra Malaysia (Member)
Sa'ari Mustapha, Ph.D. Associate Professor Faculty of Engineering Universiti Putra Malaysia (Member)
M�SOHAYIDIN' Ph.D. ProfessorlDeputy Dean of Graduate School Universiti Putra Malaysia
Date: 2 9 NCV 2001
Vll

This thesis submitted to the Senate of Universiti Putra Malaysia has been accepted as fulfilment of the requirement for the degree of Master of Science.
Vlll
AINI IDERIS, Ph.D. Associate Professor/ Dean of Graduate School Universiti Putra Malaysia
Date: 1 0 JAN 2002

DECLARATION FORM
I hereby declare that the thesis is based on my original work except for quotatIOns and citations which have been duly acknowledged. I also declare that it has not been previously or concurrently submitted for any other degree at UPM or other institutions.
IX

TABLE OF CONTENTS
Page
ABSTRACT 11 ABSTRAK IV ACKNOWLEDGE.rv1ENTS VI APPRO V AL SHEETS vii DECLARATION FORM IX TABLE OF CONTENTS X LIST OF TABLES xii LIST OF FIGURES Xlll LIST OF ABBREVIATIONS XlV
CHAPTER
I INTRODUCTION 1 Objective
..., -'
n LITERATURE REVIEW 4 Sequencing Batch Reactor 4 Biological Nitrogen Removal 1 1 Biological Phosphate Removal 16 Kinetic Studies 2 1
Maximum Cell Yield Coefficient & Endogenous Decay Coefficient 2 1 Nitrification Rate 23 Denitrification Rate 25 Phosphate Release and Uptake Rates 26
SBR in Malaysia 27 Economic Comparison 29
m MATERIAL AND METHOD 31 Study Site 31 Experimental Design 31 Study Parameters 32 Laboratory Analysis 34 Storage of Wastewater and Samples 34 Preservation 35 Experimental Procedure 36 SBR Cycle Strategies 42
x

IV
v
VI
RESULTS Preliminary Stage (Strategy A)
Physical Parameten. Chemical Parameters
Advanced Stage (Strategy B) Physical Parameters Chemical Parameters
DISCUSSIONS Preliminary Stage (Strategy A)
Physical Parameters Chemical Parameters
Advanced Stage (Strategy B) Physical Parameters Chemical Parameters Kinetic Studies
CONCLUSION Recommendation
REFERENCES
APPENDICES A Experimental Data B Material and Method
BIODATA OF THE AUTHOR
xi
48 46 53 62 62 66
76 76 76 77 83 83 85 99
107 108
1 1 1
1 16 1 34
145

LIST OF TABLES
Table Page
2 . 1 Advantages and disadvantages of Sequencing Batch Reactor 10
2.2 List of SBR Wastewater Treatment Plants in Malaysia. 28
2.3 The comparison of the economy of the main treatment systems. 30
3 . 1 Summary of analysis used based on "Standard Methods For the Examination of Water And Wastewater 14 edition, 1975". 33
3 .2 Form of Preservations 35
3 .3 Summary of the conditions for Strategy A 37
3.4 Summary of the conditions for Strategy B 3 8
4. 1 Influent and eftluent characteristics for SBR systems with operational strategy of 6hr , 8hr and 10hr cycle time. 46
4.2 Influent and eftluent characteristics for SBR systems with operational strategy based on different aerobic : anaerobic ratio. 47
5 . 1 Kinetic coefficient obtained from different operational strategy of fill:react ratio manipulating aerobic and anaerobic phase 99
5.2 Nitrification rate obtained from different operational strategies of Fil1:react ratio manipulating aerobic and anaerobic phase 101
5 .3 Nitrification rate obtained from different operational strategies of Fill:react ratio manipulating aerobic and anaerobic phase 102
5 .4 Phosphate uptake and release rate obtained from different operational Strategies of fill:react ratio manipulating aerobic and anaerobic phase 105
xii
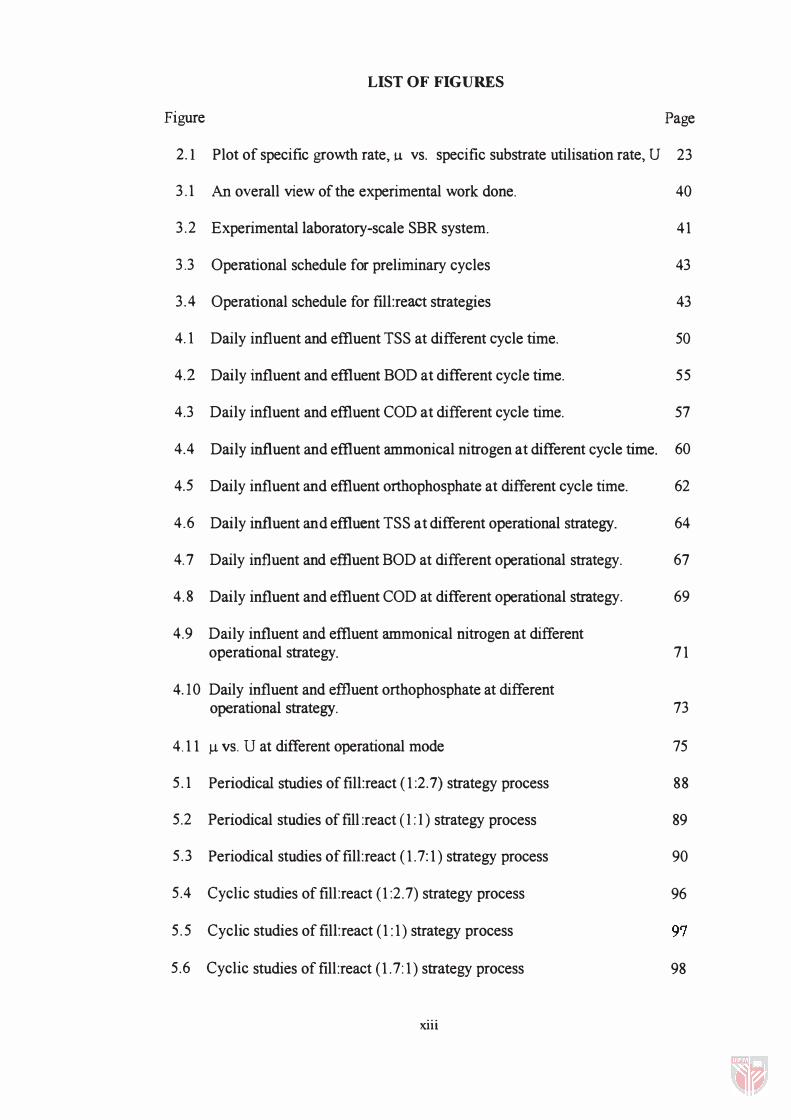
LIST OF FIGURES
Figure Page
2.1 Plot of specific growth rate, U vs. specific substrate utilisation rate, U 23
3 . 1 An overall view of the experimental work done.
3 .2 Experimental laboratory-scale SBR system.
3.3 Operational schedule for preliminary cycles
3 .4 Operational schedule for fill:react strategies
4. 1 Daily influent and effiuent TSS at different cycle time.
4.2 Daily influent and eflluent BOD at different cycle time.
4.3 Daily influent and effiuent COD at different cycle time.
4.4 Daily influent and eflluent ammonical nitrogen at different cycle time.
4.5 Daily influent and effiuent orthophosphate at different cycle time.
4.6 Daily influent and eflluent TSS at different operational strategy.
4.7 Daily influent and effluent BOD at different operational strategy.
4. 8 Daily influent and effiuent COD at different operational strategy.
4.9 Daily influent and effiuent ammonical nitrogen at different operational strategy.
4. 10 Daily influent and effluent orthophosphate at different operational strategy.
4.1 1 � VS. U at different operational mode
5. 1 Periodical studies of fill:react ( 1 :2.7) strategy process
5.2 Periodical studies offill:react (1:1) strategy process
5.3 Periodical studies offill:react ( 1 .7: 1 ) strategy process
5.4 Cyclic studies offill:react ( 1 :2 .7) strategy process
5.5 Cyclic studies offill:react ( 1 : 1 ) strategy process
5.6 Cyclic studies offill:react ( 1 .7: 1 ) strategy process
xiii
40
41
43
43
50
55
57
60
62
64
67
69
7 1
73
75
88
89
90
96
98

LIST OF ABBREVIA nONS
ASAP As Soon As Possible
BODs Biological Oxygen Demand of 5 days
COD Chemical Oxygen Demand
MLSS Mixed Liquor Suspended Solids
MLVSS Mixed Liquor Suspended Solids
N Nitrogen
na Not Available
N03-N Nitrate Nitrogen
N02-N Nitrite Nitrogen
NOx-N Inorganic Nitrogen
Ortho Orthophosphate
P Phosphate
PVC Polyvynilchloride
TKN Total Kjeldahl Nitrogen
TP Total Phosphate
TSS Total Suspended Solids
SBR Sequencing Batch Reactor
SS Suspended Solids
VFA Volatile Suspended Solids
SVI Sludge Volume Index
XIV

CHAPTER I
INTRODUCTION
As the world progresses into the new millennium, countries continue to move ahead
seeking advancement and better living lifestyle. In the process, wastewater generates
from all aspects of human activity increase in volume and diversity in characteristic.
Hence, the preferred continuous flow treatment system would also become more
complex in set-up and operation processes.
In addition, as treatment processes develop in complexity, land needed for treatment
plant set-up would increase too. But in reality, not many countries could afford such
a situation. Therefore, wastewater treatment systems presently in used worldwide,
needed some diversification in set-up or better if new technologies are invented.
Even if land factor is not a constraint, a complicated plant may need high capital
investment. Treatment plant with many reactors and clarifiers and other equipment
would normally increase cost in maintenance for the operational equipment. In
addition, advanced technologies treatment plant would also need highly skilled
operators. This would also definitely increase operation costs.
As years gone by, rules and regulation of wastewater treatment plant discharge has
become more stringent. Such a development in regulation would continue in future.
Therefore, more efficient and advanced treatments have to be developed in order to
achieve the required standards. Another issue on hand is the eutrophication of lakes,
rivers and other water resources, which is receiving worldwide attention. Nutrients

2
lIke nItrogen and phosphorus are the pnmary causes of eutrophIcatIOn It 1S therefore
not unusual to realize that standard for both nutnents have been mcreasmgly
stnngent over the past two decades Though eXIstIng bIOlOgical and chemIcal
processes can remove these nutnents, nonetheless It has not come m a slffiple way
and It does Increase the cost of treatment Therefore researchers are now workmg
round the clock to search for better, slffipler and cost effective solutions
One of the alternatIve treatments that surface, sequencIng batch reactor (SBR) stands
out for a few particular reasons. SBR IS makIng a comeback as a chOlce of
wastewater treatment for the future Though once neglected for vanous reasons, ItS
populanty seems to mcrease owmg to the fact that tremendous Improvement and
advancement m automatIon technology had taken place The strong pomt about SBR
IS that It does not need a tram of reactors lIke contlnuous flow treatment systems All
It does need IS a sIngle reactor In order to achIeve a sImultaneous removal of carbon,
mtrogen and phosphorus from wastewater In short, SBR offers fleXibIlIty that not
many treatments system could offer In performIng many tasks at hand effiCIently
Another advantage of the SBR system IS that land space occupIed IS lower than the
presently preferred contInUOUS flow system Thus thts would reduce the capItal
mvestment m settmg up treatment plant WIth good computatIonal software and
automatIOn technology, SBR could functIon effectIvely and eaSIly be mamtaIned
Thus m the long term, operatIonal and mamtenance cost would also be lower

3
In short, though SBR thus has Its own shortcommgs, such as the need to has skIlled
operator, currently restncted to small and medium treatment plants, but the
advantageous of a well managed and efficient SBR system cannot be overlooked.
SBR stands out as a system that are space and cost effective with capabilities of
removmg nutnents such as rutrogen and phosphorus.
Objective
To mvestigate whether sequencing batch reactor can be an alternative process in
managing simultaneous removal of carbon, nitrogen and phosphorus from domestic
wastewater.
Scope of study:
i) To study the effects of nutrient removals on effluent quality through�
a) The effect of different Cycle Time (6 hr, 8hr, lOhr).
b) The effect of different Operational Mode (Anaerobic and Aerobic ratio),
(1/2.7, 1'1 and 1 7/1)

CHAPTER II
LITERATURE REVIEW
Sequencing Batch Reactor
Activated sludge wastewater treatment system has evolved tremendously since
Ardem and Lockett introduced it in 1914. The original activated sludge system
introduced was operated in a batch mode (fill and draw type). From that point in
history, the present day preferred continuous flow system were developed thereafter
and since then it has replaced fill and draw treatment schemes. As continuous flow
system gained popularity, batch mode schemes had taken a step backward in
development. Batch processes usage have never reaches its capacity because of few
design constraints (Hoepker & Schroeder, 1979):
1) High oxygen uptake rates during fill phase.
2) Aeration time necessary to achieve organic removal and nitrification.
3) Amount of denitrification that can be obtained through endogenous respiration.
4) Process stoichiometry and kinetics.
5) Effluent turbidity caused by dispersed (nonflocculant) cells.
5
Continuous-flow wastewater treatment, has since dominated in wastewater
treatment process especially in biological waste treatment (Irvine, & Dennis, 1979;
Irvine et.al. , 1979; Hoepker, & Schroeder,1979). Completely mixed activated sludge
tank: has become the standard for secondary waste treatment. However, continuous
flow systems were found later not to be as perfect as it should be. They are prone to
suffer occasional upsets. Effluent quality from a secondary waste treatment plant in
reality is not found to be as consistent and reliable as theoretically predicted by
steady-state design equations. Fluctuations in influent flow-rate and influent waste
strength were found to be the main culprits in causing inconsistency results when
operate under steady-state (Irvine, & Dennis, 1979).
As countries become more advanced in technologies, wastewater characteristics
around the world have diversified into more complex components. Without having
really solved its initial drawbacks, continuous-flow activated sludge system became
progressively more complex and sophisticated in synchrony with the progress and
advancement achieved by countries (Fang et.al. , 1994). Under such circumstances,
Irvine and co-workers (Irvine et.al., 1979; Fang et.al., 1994) had taken the chance to
re-examine the fill-and-draw type batch operation, renaming it Sequencing Batch
Reactor (SBR). This development is the second resurgence of this treatment since
the first short-lived initial resurgence of SBR treatment by Eastern Regional
Research Laboratory by Hoover et.al. in the early 1950's (Irvine et.al., 1979).
6
The second resurgence by Irvine and co-workers has since open the eyes of many
groups of other researchers. Since then SBR has made significant progresses
especially with contribution by Irvine research group. The recent advances in
process control and digital process computers have added to SBR progresses.
Therefore, as the world move toward the new millennium, SBR has been hand
picked as one of the alternative treatment system that have much to offer as
continuous-flow activated sludge had contributed in the last few decades.
Sequencing Batch Reactor (SBR) is a draw-and-fill activated sludge treatment
system and thus the units involved are the same as conventional activated sludge
system. SBR is a time-oriented system as compared to the space oriented
conventional activated sludge system. There are five discrete operational periods
during one cycle for each batch tank in a sequencing batch treatment facility. Each
treatment cycle includes the following stages: fill, react, settle, draw/decant and idle
(Irvine et.a!., 1979� Irvine, & Dennis, 1979� Irvine et.al., 1993� Garzon-Zuniga &
Gonzalez-Martinez, 1996).
The cyclic operation in SBR gives the option of mixing or/and aeration or vice versa
producing aerobic or anoxic or anaerobic condition at different time of treatment.
Each condition set-up in reactor will be in best interest of targeted influent
characteristics ( e.g. poly-p organisms need anaerobic condition follow by aerobic
condition in order to have complete removal of phosphorus).

7
Dunng the fill stage, the tank IS fill Wlth mtluent dunng a dIstmct penod of tIme In
the fill penod, orgamsm selectIOn can be controlled by mampulatmg the actual
specIfic growth rates of the mIcrobes and by regulatmg the oxygen tenSIOn m reactor
(e g from anaerobIC to anOXIC to anaerobIC) [Irvme, et.a!., 1993] However, pnor to
a fill penod, settled solIds would be contamed m the bottom portIOn of the reactor at
a concentratIOn of 8000 mg/l to 10 000 mg/l (Irvme, & Denms, 1979, Irvme et.al.,
1979) As a result, the tank contams an actIve and SIzeable orgarusm populatlon
Therefore, bulk of the treatment may be completed pnor to the end of fill stage
unless measure IS taken to slow down the reactlon (e g elImmatIOn of aeratIon)
In some clfcumstances, tank reaches maximum lIqwd holdIng capaCIty pnor to the
cessatlon of wastewater flow for that day Hence, m a SBR system, two or more
reactors would be reqUIred to accommodate a contmuous flow of wastewater
(Irvme, & Denms, 1979) However, the flow profile for many rural murucipalItles
and mdustnes IS such that lIttle or no discharge occurs for an appreCIable portIOn of
the day Under these CIrcumstances, a smgle tank should be suffiCIent (Irvme et.al.,
1979, Okada & Sudo, 1986)
The react penod IS the stage where the tank receIves m no flow Mechamcal mIxmg
orland aIr supply can be adjusted to complete the deslfed reactIOns The react penod
normally takes up about 35% of the total cycle tIme m a standard SBR system
Dunng the fill stage, much deslfed reactIOn can be brought to Virtual completIOn
(e g mtnficatIOn and demtnficatIOn) Nonetheless, react penod, offers fleXIbIlIty
necessary to ensure that proper reactIons are completed and a partIcular reactIOn
would not have adverse effect on other reactIOns

8
The subsequent stage of treatment after react is settle period. During settle period,
all mixing and aeration are stopped and the organisms are allowed to settle leaving
the clarified treated water above. Settle period in standard SBR systems take up
about 20% of the total cycle time. A prolonged settled period must be avoided since
settled sludge may begin to float to the surface (Irvine et.al., 1979).
After sufficient solids separation the clarified waters are discharged. The period of
discharge is termed the draw/decant period. An idle period in system followed after
the draw period while it awaits the return of the next cycle wastewater. Mixing and
aeration may be an option during the idle period if necessary. In addition, solids can
be wasted during the idle period. The frequency of wastage is determined by the net
solids increase in the system each day and the capacity of mixing and aeration
equipment (Irvine et.a!., Peavy et.al., 1985).
Contribution of many works done on SBR system by researchers such as Irvine and
co-workers has identified a number of advantages of SBR over conventional
activated sludge systems:
i) cycling between anoxic and aerobic periods of operation (Dikshitulu et. a!. ,
1993).
ii) greater flexibility in meeting changes in feed conditions (Dikshitulu et.al., 1993;
Okada & Sudo, 1986).
iii) Reactions that must be physically separated in continuous-flow systems such as
nitrification and denitrification can be carried out in a single tank. (Dikshitulu
et.a!.,1993; Okada, & Sudo, 1986).

9
IV) Better control over settlIng charactensncs of the sludge (DIkshitulu et af . 1993)
v) Smgle tank batch system, sequencmg on dally cycle provIdes low capItal and
operatIng costs (IrvIne et. al., 1 979)
VI) HIgh mIxed lIquor solIds concentratIOn lImIts lIght penetratIon, thus preventIng
algae growth (IrvIne et.al.,1979)
vu) BIOmass In SBR, subjected to hIgh substrate tensIOn, provIde effective means
for control of filamentous bactena and thus, sludge bulkmg (Fang et.al.,1993)
Vlll) ProfessIonal mamtenance works are not necessary SInce configuratIOn of SBR
system IS relanvely SImple (Okada, & Sudo, 1986)
IX) EffectIve SImultaneous removal of mtrogen, carbon and phosphorus (Okada, &
Sudo, 1986, Fang et.al.,1993 , Subramanlam et.al., 1994)

1 0
Table 2. 1 Advantages and disadvantages of Sequencing Batch Reactor
Advantages Disadvantages I 1. Operational flexibility (variation of 1. High construction and operation costs.
cycles).
2. Satisfactory N and possible P removal. 2. Higher installed power than other activated sludge systems.
3. Secondary settler and recycle pumps 3. Need of sludge treatment and disposal not necessary. (variable with conventional and
extended mode). 4. Simpler than other activated sludge 4. Usually more competitive for smaller
systems populations.
5. High efficiency in BOD removal.
6. Low land Requirements.
Source: (Marcos, 1996)


![Ultra-High Frequency Magnetic Resonance Imagingeprints.nottingham.ac.uk/10740/1/magill_thesis.pdf · Introduction Nuclear Magnetic Resonance (NMR) was first observed by Purcell [1]](https://img.pdfslide.net/doc/110x75/5ed96476f59b0f56f45f6848/ultra-high-frequency-magnetic-resonance-introduction-nuclear-magnetic-resonance.jpg)