Embed Size (px)
Citation preview

FINANCIAL AUDIT
Universities 2020 audits
18 JUNE 2021
NEW SOUTH WALES AUDITOR-GENERAL’S REPORT

The roles and responsibilities of the Auditor-General, and hence the Audit Office, are set out in the Public Finance and Audit Act 1983 and the Local Government Act 1993.
We conduct financial or ‘attest’ audits of State public sector and local government entities’ financial statements. We also audit the Total State Sector Accounts, a consolidation of all agencies’ accounts.
Financial audits are designed to add credibility to financial statements, enhancing their value to end-users. Also, the existence of such audits provides a constant stimulus to entities to ensure sound financial management.
Following a financial audit the Audit Office issues a variety of reports to entities and reports periodically to parliament. In combination these reports give opinions on the truth and fairness of financial statements, and comment on entity compliance with certain laws, regulations and government directives. They may comment on financial prudence, probity and waste, and recommend operational improvements.
We also conduct performance audits. These examine whether an entity is carrying out its activities effectively and doing so economically and efficiently and in compliance with relevant laws. Audits may cover all or parts of an entity’s operations, or consider particular issues across a number of entities.
As well as financial and performance audits, the Auditor-General carries out special reviews and compliance engagements.
Performance audits are reported separately, with all other audits included in one of the regular volumes of the Auditor-General’s Reports to Parliament – Financial Audits.
GPO Box 12 Sydney NSW 2001
The Legislative Assembly Parliament House Sydney NSW 2000
In accordance with section 52B of the Public Finance and Audit Act 1983, I present a report titled ‘Universities 2020 audits’.
Margaret CrawfordAuditor-General 18 June 2021
The Legislative Council Parliament House Sydney NSW 2000
© Copyright reserved by the Audit Office of New South Wales. All rights reserved. No part of this publication may be reproduced without prior consent of the Audit Office of New South Wales. The Audit Office does not accept responsibility for loss or damage suffered by any person acting on or refraining from action as a result of any of this material.
THE ROLE OF THE AUDITOR-GENERAL
audit.nsw.gov.au

contents
Universities 2020 audits
Section one – Universities 2020 audits Executive summary 1 Introduction 5 Financial reporting 6 Internal controls 30 Teaching and research 40
Section two – Appendices Appendix one – Status of 2019 recommendations 47 Appendix two – Universities' controlled entities 48

Section one
Universities 2020 audits This report analyses the results of our audits of the New South Wales university sector for the year ended 31 December 2020.

1
NSW Auditor-General's Report to Parliament | Universities 2020 audits | Executive summary
Executive summary This report analyses the results of our audits of the financial statements of the ten universities in NSW for the year ended 31 December 2020. The table below summarises our key observations.
1. Financial reporting
Financial reporting The 2020 financial statements of all ten universities received unmodified audit opinions. Two universities reported retrospective corrections of prior period errors. The University of Sydney reported errors relating to the underpayment of staff entitlements and the fair value of buildings. Charles Sturt University reported an error relating to how it had calculated right-of-use assets and lease liabilities on initial application of the new leasing standard in the previous year.
Impacts of COVID-19 Student enrolments decreased in 2020 compared to 2019 by 10,032 (3.3 per cent). Of this decrease, 8,310 students were from overseas. The ongoing impact of COVID-19 in the short-term, on semester one enrolments for 2021 compared to semester one of 2020, has been mixed: • all universities in NSW experienced a growth in their
domestic student enrolments • eight universities experienced decreases in overseas
student enrolments.
During 2020, universities provided welfare support to students, created student hardship funds, provided accommodation, and flexibility on payment of course fees. State and Commonwealth governments provided additional support to the sector: • those university controlled entities eligible to receive
JobKeeper payments received a combined amount under the Commonwealth scheme totalling $47.6 million in 2020
• the NSW Government launched a University Loan Guarantee scheme.

2
NSW Auditor-General's Report to Parliament | Universities 2020 audits | Executive summary
Financial results Six universities recorded negative net operating results in 2020 (two in 2019). While most universities experienced decreased revenue in 2020, only four had reduced their expenses to a level that was less than revenue.
Revenue from operations Universities' revenue streams were impacted in 2020 by the COVID-19 pandemic, with fees and charges decreasing by $361 million (5.8 per cent). Government grants as a proportion of total revenue increased for the first time in five years to 34 per cent in 2020. Nearly 40 per cent of universities' total revenue from course fees in 2020 (40.9 per cent in 2019) came from overseas students from three countries: China, India and Nepal (same in 2019). Students from these countries of origin contributed $2.2 billion ($2.4 billion in 2019) in fees. Some universities continue to be dependent on revenues from students from these destinations and their results are more sensitive to fluctuations in demand as a result.
Other revenues Overall philanthropic contributions to universities increased by 32.2 per cent in 2020 to $222 million ($167.9 million in 2019). The University of Sydney and the University of New South Wales attracted 75.2 per cent of the total philanthropic contributions in 2020 (69.5 per cent in 2019). Total research income for universities was $1.4 billion in 20191, with the University of Sydney and the University of New South Wales attracting 66.5 per cent of the total research income of all universities in NSW (65.2 per cent in 2018).
Expenditure Universities initiated cost saving measures in response to the COVID-19 pandemic. The cost of redundancy programs increased employee related expenses in 2020 by 4.4 per cent to $6.5 billion ($6.2 billion in 2019). The cost of redundancies offered in 2020 across the universities totalled $293.9 million. Combined other expenses decreased to $2.8 billion in 2020, a reduction of $436 million (13.4 per cent).
1 2020 data, which is compiled by the Australian Department of Education and Training, is not yet available.

3
NSW Auditor-General's Report to Parliament | Universities 2020 audits | Executive summary
2. Internal controls and governance
Internal control findings One hundred and ten internal control deficiencies were identified in 2020 (108 in 2019). Forty-five findings were repeated from 2019, of which 23 related to information technology. Recommendation: Universities should prioritise actions to address repeat findings on internal control deficiencies in a timely manner. Risks associated with unmitigated control deficiencies may increase over time. Three high risk internal control deficiencies were identified, namely: • The University of New South Wales should continue
work to assess its liability for the underpayment of casual staff entitlements. This issue was also reported last year.
• Two high risk deficiencies were identified at Charles Sturt University. One related to misunderstanding the requirements of the new accounting standard in relation to recognising grant funding revenue for construction work. The second related to resolving issues identified by an ongoing internal review of its employment contracts to enable a reliable quantification as to the university's liability to its employees.
Gaps in information technology (IT) controls comprised the majority of the remaining deficiencies. Deficiencies included a lack of sufficient privileged user access reviews and monitoring, payment files being held in editable formats and accessible by unauthorised persons, and password settings not aligning with the requirements of information security policies.
Business continuity and disaster recovery planning
All universities have a business continuity policy supported with a business impact analysis. Except for Macquarie University, all other universities had disaster recovery plans prepared for all of the IT systems that support critical business functions. Macquarie University’s disaster recovery plans were still in progress at 31 December 2020. Only half of the universities' policies require regular testing of their business continuity plans and six universities' plans do not specify staff must capture, asses and report disruptive incidents.
3. Teaching and research
Graduate employment outcomes Eight out of ten universities were reported as having full-time employment rates of their undergraduates in 2020 that were greater than the national average. Six universities were reported as having full-time employment rates of their postgraduates in 2020 that were greater than the national average.
Student enrolments by field of education
Enrolments at universities in NSW decreased the most in Management and Commerce courses and Engineering and Related Technologies courses. The largest increase in enrolments was in Society and Culture courses.

4
NSW Auditor-General's Report to Parliament | Universities 2020 audits | Executive summary
Achieving diversity outcomes Five universities in 2019 were reported as meeting the target enrolment rate for students from low socio-economic status (SES) backgrounds. Seven universities were reported to have increased their enrolments of students from Aboriginal and Torres Strait Islander backgrounds in 2019. The target growth rate for increases in enrolments of Aboriginal and Torres Strait Islander students (to exceed the growth rate of enrolments of non-indigenous students by at least 50 per cent) was achieved in 2019.

5
NSW Auditor-General's Report to Parliament | Universities 2020 audits | Introduction
1. Introduction This report provides Parliament with the results of our financial audits of universities in NSW and their controlled entities in 2020, including our analysis, observations and recommendations in the following areas:
• financial reporting • internal controls and governance • teaching and research.
1.1 Snapshot of universities in NSW
* Of the 23 entities not audited, 22 were relieved from reporting requirements and one entity did not comply with requirements to provide financial
statements to the Audit Office of NSW. Further details are in Section 2.1 of this report.
** Equivalent Full-Time Student Load (EFTSL) represents the equivalent full-time study load for one year.
*** Full-Time Equivalent. Source: Student and staff numbers are provided by universities (unaudited).
10 Universities51 Local controlled entities23 Overseas controlled entities
59 Unqualified audit opinions2 Audits in progress23* Not audited
289,667** Student enrolments(EFTSL)3.3 per cent from 2019
63.1% Domestic
36.9% Overseas
17,729*** Academic staff (FTE)7.6 per cent from 2019
23,212*** General staff (FTE)7.9 per cent from 2019

6
NSW Auditor-General's Report to Parliament | Universities 2020 audits | Financial reporting
2. Financial reporting Financial reporting is an important element of governance. Confidence and transparency in university sector decision making are enhanced when financial reporting is accurate and timely.
This chapter outlines our audit observations on the financial reporting of universities in NSW for 2020.
2.1 Quality of financial reporting
Audit results Unmodified audit opinions were issued for all universities
The 2020 financial statements of all ten universities received unmodified audit opinions for the purposes of satisfying the requirements of the Public Finance and Audit Act 1983 (PF&A Act).
The University of Sydney reported retrospective correction of prior period errors
The University of Sydney reported the retrospective correction of two prior period errors. One related to the underpayment of staff entitlements and the other related to fair value of buildings.
During 2020, the University of Sydney identified that certain employees covered by the university's Enterprise Agreement 2018–2021 were paid less than their correct entitlements in certain instances. While the review is continuing, the University of Sydney recognised an accrual for the remediation of the underpaid staff entitlements of $31.1 million at 31 December 2020. This accrual, covering the period from 2014 to 2020, comprises $25.6 million relating to salary payment shortfalls (including superannuation, payroll tax, and associated leave benefits) and $5.5 million in interest and other remediation costs.
As part of the revaluation process conducted in 2020, the University of Sydney identified that the valuation for commercial buildings included embedded equipment attached to or built within those commercial buildings. This equipment is recognised at cost less accumulated depreciation separately to the commercial buildings, resulting in an overstatement of the asset value of $14.9 million. This error was corrected by restating each of the affected financial statement line items in the Statement of Financial Position as at 31 December 2019, and opening retained earnings as at 1 January 2019.
Charles Sturt University reported retrospective correction of a prior period error
Charles Sturt University reported the retrospective correction of a prior period error relating to the restatement of right-of-use assets and lease liabilities. Right-of-use assets are leased assets that are recorded by a lessee.
On initial adoption of AASB 16 'Leases' as at 1 January 2019 and at the 31 December 2019 remeasurement date, Charles Sturt University incorrectly recognised right-of-use assets and lease liabilities for rooms in a student accommodation building that were not yet available for use. The financial effect as at 1 January 2019 was a reduction of $15.2 million in right-of-use assets and lease liabilities. This error resulted in a restatement of the 2019 comparative figures, being a reduction in right-of-use assets by $14.1 million, lease liabilities of $15.3 million and $1.2 million to the net result for depreciation and interest.

7
NSW Auditor-General's Report to Parliament | Universities 2020 audits | Financial reporting
All university controlled entities' financial statements submitted for audit, where completed, received unmodified audit opinions
Of the 74 university controlled entities:
• 49 received unmodified audit opinions • 22 university controlled entities were relieved from PF&A Act reporting requirements • one did not comply with the PF&A Act as it did not submit financial statements to the
Audit Office (Suzhou Xi Su Business Consulting Co) • the audits of two entities are still in progress (refer to 'Timeliness of financial reporting'
section).
Suzhou Xi Su Business Consulting Co, an overseas controlled entity of the University of Sydney, did not submit separate financial statements for audit as required by the PF&A Act. The company prepares financial statements for local jurisdictional purposes only. The technical non-compliance was reported in the Statutory Audit Report for the University of Sydney.
Twenty-two university controlled entities were relieved from preparing financial statements in 2020
The NSW Government introduced special provisions in 2020 as a result of the COVID-19 pandemic which amended the PF&A Act and the Public Finance and Audit Regulation 2015. The special provisions relieved certain entities from having to prepare financial statements for 2019–20 if all of the following criteria were met:
• The assets, liabilities, income, expenses, commitments and contingent liabilities of the entity are each less than $5.0 million.
• The total cash or cash equivalents held by the entity is less than $2.5 million. • At least 95 per cent of the entity’s income is derived from money paid out of the
Consolidated Fund or from money provided by other relevant agencies. • The entity does not administer legislation for a minister by or under which members of the
public are regulated.
As a result of the special provisions, 22 university controlled entities were relieved from PF&A reporting requirements in 2020, compared with ten in 2019. The entities relieved in 2019 were primarily dormant entities. Entities that are exempted from financial reporting obligations are not audited by the Auditor-General.
Timeliness of financial reporting Three universities finalised their 2020 audited financial statements earlier than they did last year
All ten universities and 51 of the 52 university controlled entities that were required to prepare financial statements for 2020 met the statutory timetable for submitting their financial statements for audit. As noted above, one controlled entity did not comply with the reporting requirements of the PF&A Act.
Nine universities and 46 university controlled entities met the statutory timetable for completion of the 2020 audit. The finalisation of the audit of Charles Sturt University was delayed as the university withdrew its signed financial statements and reissued them. Of the five controlled entities that did not meet the statutory timetable:
• one entity controlled by the University of Sydney was completed later than the statutory date • two entities controlled by Western Sydney University were completed later than the statutory
date • two entities controlled by the University of Technology Sydney are still in progress.

8
NSW Auditor-General's Report to Parliament | Universities 2020 audits | Financial reporting
Our audit opinions on universities' financial statements for 2020 were issued between 26 March 2021 and 16 June 2021. Audit completion dates are presented in the following diagram.
Note: The audits of three universities were completed on the same date in both years. The 2020 audit of Charles Sturt University was delayed because signed financial statements were withdrawn and reissued by the university. Source: Independent Auditor's Reports issued by the Audit Office.
A company jointly owned by two universities has not completed its 2019 financial audit
Sydney Education Broadcasting Pty Ltd is a company jointly owned by the University of Technology Sydney and Macquarie University. It is a prescribed entity and prepares financial statements for audit by the Auditor-General under sections 44 and 45 of the PF&A Act.
The 2019 financial statements were submitted for audit on 22 July 2020 and the financial audit for 31 December 2019 has not been completed. As a result, the financial statements for 2020 have not been submitted and the financial audit for 2020 is delayed.
Implementation of new accounting standards AASB 15 ‘Revenue from Contracts with Customers’ and AASB 1058 'Income of Not-for-Profit Entities' changed how universities report income
AASB 15 and AASB 1058 became effective for all universities from 1 January 2019. AASB 2019-6 'Amendments to Australian Accounting Standards - Research Grants and Not-for-Profit Entities' allowed universities to defer the application of these standards in respect of research grant revenue until 1 January 2020. Three universities - Macquarie University, the University of New England and the University of New South Wales elected to defer the application of the new standards until 2020. Because universities implemented AASB 15 in different years in relation to research grant income, the 2019 financial data for all universities is not directly comparable.
The introduction of AASB 15 and AASB 1058 required universities to reassess the way they accounted for revenue, depending on whether it arose from contracts for sales of goods and services, grants and other contributions. With the exception of capital grants, revenue from contracts for services is now recognised only when performance obligations have been satisfied. This has tended to delay the point at which universities and their subsidiaries recognise revenue in their financial statements, particularly in relation to research grant funding tied to specific deliverables.
15-M
ar
25-M
ar
4-Ap
r
14-A
pr
24-A
pr
4-M
ay
14-M
ay
24-M
ay
3-Ju
n
13-J
un
23-J
un
Audit completion dates
2021 2020
Charles Sturt University
Macquarie University
Southern Cross University
University of New England
University of NSW
University of Newcastle
University of Wollongong
University of Sydney
University of Technology Sydney
Western Sydney University

9
NSW Auditor-General's Report to Parliament | Universities 2020 audits | Financial reporting
Universities adopted the modified retrospective approach to transition to AASB 15 and AASB 1058. This method does not require the restatement of prior period financial statement figures. Instead, the cumulative effect of applying the standards on prior periods is presented as an adjustment to opening retained earnings at the transition date.
On 1 January 2020, Macquarie University, the University of New England and the University of New South Wales reclassified $243.7 million from opening retained earnings to contract assets and contract financial liabilities (deferred revenue) on transition to AASB 15 and AASB 1058.
AASB 1059 ‘Service Concession Arrangements: Grantors' changed the recognition and measurement of service concession assets
AASB 1059 ‘Service Concession Arrangements: Grantors’ became effective from 1 January 2020 for all universities. AASB 1059 provides guidance for public sector entities (grantors) that enter into service concession arrangements with private sector operators for the delivery of public services.
An arrangement within the scope of AASB 1059 typically involves a private sector operator designing, constructing or upgrading assets used to provide public services, and operating and maintaining those assets for a specified period of time. In return, the private sector operator is compensated by the public-sector entity.
The University of New South Wales, University of Wollongong and Macquarie University identified service concession arrangements within the scope of AASB 1059. These service concession arrangements relate to the design, construction and operation of student accommodation facilities. On initial application of AASB 1059 these universities recognised service concession assets of $406.1 million and service concession liabilities of $328.0 million. As a result of the derecognition of land and finance lease receivables recognised under previous accounting treatments, the net impact on opening retained earnings was $13.1 million.
2.2 Impacts of COVID-19
The outbreak of the COVID-19 pandemic presented challenges for the university sector in 2020. International border restrictions reduced enrolments of overseas students. Social distancing and other infection control measures disrupted the traditional means of teaching students and impacted other aspects of service delivery such as student accommodation. These challenges and disruptions also had a consequential impact on the financial results of universities for 2020 with reduced revenue from overseas students and greater employee related expenses in the form of staff redundancies.

10
NSW Auditor-General's Report to Parliament | Universities 2020 audits | Financial reporting
The timeline of the COVID-19 outbreak and the impact on the university sector is presented below.
• 31 December – first cases of COVID-19 reported by Wuhan officials
• 31 December – year-end reporting date for NSW Universities
• 1 February – Australian borders close to foreign arrivals from mainland China
December 2019
January 2020
February 2020
• 25 January – first cases of COVID-19 reported in Australia (in both Victoria and NSW)
• 30 January – World Health Organisation (WHO) declares the coronavirus to be a ‘public health emergency of international concern’
• Early March – beginning of semester one at NSW universities
• 1 March – first Australian death from COVID-19 reported in Western Australia
• 3 March – first death from COVID-19 reported in NSW
• 11 March – WHO officially declares COVID-19 as a pandemic
• 20 March – Australian borders close to all non-residents
• 23 March – NSW Premier announces new restrictions in which non-essential activities and businesses would be temporarily shutdown
March 2020

11
NSW Auditor-General's Report to Parliament | Universities 2020 audits | Financial reporting
Universities are responding to the challenges presented by COVID-19
All universities established committees or taskforces of senior executives to oversee and address all aspects of the impact of COVID-19. These committees are tasked with assessing the evolving situation and determining their university’s response to it.
Key actions taken by universities in response to the outbreak of COVID-19 include:
• establishing dedicated phone and email channels for staff and student enquiries • developing alternative course delivery options including on-line delivery of teaching • updating cleaning protocols with increased frequency and providing information on hygiene
measures • moving some administration activities to remote delivery and closing some buildings and
facilities • reconfiguring student accommodation to enable students to quarantine or socially distance,
where necessary • implementing programs and financial support for support students who are adversely
impacted • cancelling large non-essential gatherings including graduation ceremonies.
Universities are closely monitoring the financial impact of COVID-19 and the pressure put on liquidity. Universities have implemented cost saving measures including reducing the casual and contractor workforce, delaying the hire of new staff, limiting travel, and pausing other discretionary expenditure. They are also closely monitoring liquidity requirements and have deferred planned capital expenditures and renegotiated lines of credit.
The impact of COVID-19 is being felt differently at each university
The impact of COVID-19 has exposed the university sector to new financial risks in 2020. However, the impact is being felt differently at each university.
The travel restrictions on the arrival of international students in 2020 impacted those universities with a higher dependence on revenue streams from international students. Revenue from overseas students decreased by $286.6 million (7.9 per cent) across the universities in 2020 compared to the previous year. The impact on individual universities ranged from a decrease of 26.5 per cent to an increase of 4.1 per cent. Two universities (University of Sydney and University of New England) experienced a growth in revenue from overseas students.
The exposure was reduced for some universities that were able to change the delivery of their offerings to online study and other remote learning programs or were able to attract more domestic students. Revenue from domestic students (full fee paying) decreased overall by $42.2 million (14.8 per cent) but increased at four universities.
Student enrolments in 2020 decreased by 3.3 per cent
The total number of students attending universities in NSW in 2020 was 289,667, a decrease of 10,032 students (3.3 per cent) compared to 2019. The graph below shows the movement in the numbers of equivalent full-time students at each university in 2020.

12
NSW Auditor-General's Report to Parliament | Universities 2020 audits | Financial reporting
Note: Equivalent Full-Time Student Load (EFTSL) represents the equivalent full-time study load for one year. Student numbers do not include Non-Award, Higher Degree Research or Foundation enrolments. Source: Student numbers are provided by universities (unaudited).
As noted above, this generally correlated with the decrease in overseas student enrolments and consequently revenue from overseas students. There were 106,984 overseas students enrolled at universities in NSW in 2020 compared to 115,294 in 2019, a decline of 8,310 students (7.2 per cent).
Overseas student enrolments continue to be lower in semester one 2021 at eight universities, compared to semester one 2020
We collected information about universities' student enrolments for the first semester of 2021 (at 31 March 2021) as an indicator of the likely ongoing impact of COVID-19 on the university sector in the short-term. The universities' expectation was that travel restrictions would continue to affect student enrolments.
The disruption is not being felt equally across the sector. Overseas student enrolments in semester one of 2021 decreased at eight universities, compared to those in semester one of 2020 when the impacts of the pandemic were first being felt. Overseas enrolments increased at the University of Sydney and University of New South Wales by 32.5 per cent and 39.2 per cent respectively. The increases at these two universities contributed to an overall increase in enrolments of overseas students by 1,536 or 4.3 per cent in semester one of 2021.
0.5%
(7.7%)
(0.3%)
(5.0%)
2.8%
(5.4%)
(3.2%)
(3.6%)
(6.4%)
(3.4%)
(4,000) (3,000) (2,000) (1,000) 0 1,000 2,000
Western Sydney University
University of Wollongong
University of Technology Sydney
University of Sydney
University of Newcastle
University of NSW
University of New England
Southern Cross University
Macquarie University
Charles Sturt University
EFTSL
Movement in EFTSL by university in 2020

13
NSW Auditor-General's Report to Parliament | Universities 2020 audits | Financial reporting
The graph below shows the movement in overseas student enrolments in semester one 2021 by university.
Source: Student enrolments are provided by universities (unaudited).
In 2020, the University of New South Wales and University of Sydney established fast network access capabilities to support overseas students in China study online and remotely, which has allowed students to continue enrolments.
Over time, our audits will note whether the shift to remote learning for foreign students is sustained.
Domestic student enrolments increased in semester one 2021 compared to semester one 2020
Domestic student enrolments in semester one 2021 increased at all universities, compared to semester one 2020 enrolments. The increases ranged from 0.9 per cent to 13.7 per cent. In 2021, the Australian Government introduced the Job-Ready Graduates Package which provided additional funding for higher education short courses in national priority areas.
(5.1%)
(12.0%)
(24.8%)
32.5%
(10.4%)
39.2%
(45.7%)
(15.6%)
(10.9%)
(42.7%)
(2,000) (1,000) 0 1,000 2,000 3,000 4,000
Western Sydney University
University of Wollongong
University of Technology Sydney
University of Sydney
University of Newcastle
University of NSW
University of New England
Southern Cross University
Macquarie University
Charles Sturt University
EFTSL
Change in overseas student enrolments in semester one of 2021 compared to semester one of 2020 by university

14
NSW Auditor-General's Report to Parliament | Universities 2020 audits | Financial reporting
The graph below shows the movement in domestic student enrolments in semester one 2021 by university.
Source: Student enrolments are provided by universities (unaudited).
Only the University of Sydney and the University of New South Wales increased their student enrolments for both domestic and overseas students in semester one of 2021. For other universities, the increase in domestic students has, at least to some extent, offset the reduction in overseas student numbers.
Universities have provided welfare support to students affected due to COVID-19
Many international students were in New South Wales when travel restrictions were introduced in March 2020. Universities identified this group as particularly vulnerable following the outbreak of COVID-19 as they were young, culturally and linguistically diverse, and without secure family support. As temporary visa holders, they were ineligible for various welfare support packages offered by the Australian Government. The economic shutdown caused by COVID-19 also impacted the circumstances of many domestic students.
The universities collectively introduced student welfare support instruments for students, which included:
• developing dedicated COVID-19 communication portals for mental health and wellbeing • creating student hardship funds to provide hardship relief and emergency financial support to
assist with basic living expenses, costs associated with unexpectedly studying online and other expenses
• providing accommodation and other domestic support for students including those needing safe accommodation for self-isolating
• providing flexibility on the payment of course fees and waiving fees for courses failed in 2020 • providing academic flexibility including allowing students to retake courses without academic
penalty and allowing students to enrol in courses without pre-requisites to enable progression.
4.3%
10.0%
0.9%
8.2%
5.5%
10.0%
1.9%
8.9%
13.7%
5.1%
0 500 1,000 1,500 2,000
Western Sydney University
University of Wollongong
University of Technology Sydney
University of Sydney
University of Newcastle
University of NSW
University of New England
Southern Cross University
Macquarie University
Charles Sturt University
EFTSL
Change in domestic student enrolments in semester one 2021 by university

15
NSW Auditor-General's Report to Parliament | Universities 2020 audits | Financial reporting
Some universities' controlled entities were eligible to receive JobKeeper payments
The Australian Government introduced the JobKeeper Payment scheme as a subsidy for businesses significantly affected by COVID-19. All universities failed the turnover tests to be eligible for JobKeeper payments. However, some university controlled entities were eligible for payments under the scheme. The combined amount paid to controlled entities of universities under the JobKeeper Payment scheme totalled over $47.6 million in 2020.
The table below shows the amount of JobKeeper payments received by university controlled entities, grouped by the parent university.
Source: University controlled entities' financial statements (audited).
The Australian Government announced a Higher Education Relief Package
On 12 April 2020, the Australian Government announced a Higher Education Relief Package intended to help Australian universities and other tertiary education providers respond to the challenges presented by COVID-19.
Under the package, the Australian Government committed to maintain the Commonwealth Grant Scheme (CGS) and the Higher Education Loan Program (HELP) funding streams for higher education providers at agreed amounts for the rest of 2020, even if domestic student numbers fell. Ordinarily, the amount of funding provided would be revised throughout the year based on variations to enrolments. Also, the performance-based funding amounts introduced in 2020 were guaranteed for the current year.
The package also aimed to subsidise the cost of short on-line courses to help Australians retrain. The courses, targeting priority areas including nursing, teaching, health, IT and science, started at the beginning of May 2020 with successful completion by December 2020.
For domestic students, the Australian Government announced a six-month exemption from the loan fees associated with FEE-HELP and Vocational Fee and Training (VET) student loans in the sector to encourage full-fee paying students to continue their studies.
These measures are expected to contribute $100 million to the Australian university sector.
0 5 10 15
Western Sydney University
University of Wollongong
University of Technology Sydney
University of Sydney
University of Newcastle
University of NSW
University of New England
Southern Cross University
Macquarie University
Charles Sturt University
$m
JobKeeper payments received by university group in 2020

16
NSW Auditor-General's Report to Parliament | Universities 2020 audits | Financial reporting
The NSW Government launched a University Loan Guarantee Scheme
On 6 June 2020, the NSW Government announced that it would guarantee up to $750 million in commercial loans to help universities recover from the impact of COVID-19. The loans are conditional on universities demonstrating how they are making their operations more sustainable.
Three universities have reported engaging with the Loan Guarantee Scheme in 2020. Two universities withdrew from the process as agreement could not be achieved on terms and conditions or preferred financiers. One university has applied for the Loan Guarantee Scheme and is currently in negotiations with NSW Treasury on the loan amount and other terms and conditions.
New research funding for universities is expected from January 2021
As part of the 2020–21 Budget handed down on 6 October 2020, the Australian Government announced an additional $1.0 billion in research funding to alleviate the financial pressure on Australian universities caused by the COVID-19 pandemic. The funding will be delivered through the Research Support Program (RSP) from January 2021, taking total RSP funding for 2021 to $3.0 billion.
The RSP provides block grants, on a calendar year basis, to higher education providers to support the systemic costs of research not supported directly through competitive and other grants, such as libraries, laboratories, consumables, computing centres and the salaries of support and technical staff.
2.3 Financial performance
Financial results The graph below shows the net results of individual universities for 2020.
Note 1: The figures used relate to the continuing operations in the consolidated financial statements of each university, which includes their controlled entities. Source: University financial statements (audited).
Six universities recorded negative net operating results in 2020 (two in 2019).
22.0
(48.8)
(50.6)
109
7.5
(7.5)
(16.3)
(2.6)
(51.4)
19.5
(70) (40) (10) 20 50 80 110
Western Sydney University
University of Wollongong
University of Technology Sydney
University of Sydney
University of Newcastle
University of NSW
University of New England
Southern Cross University
Macquarie University
Charles Sturt University
$m
Net results by university for 2020

17
NSW Auditor-General's Report to Parliament | Universities 2020 audits | Financial reporting
The graph below presents the revenue and expenditure for each university in 2020.
Note 1: The figures used relate to the consolidated financial statements of each university, which includes their controlled entities. Source: University financial statements (audited).
The movement in revenue and expenditure for both individual universities and for the sector is analysed later in this report.
Revenue from operations A snapshot of the universities' revenue for the year ended 31 December 2020 is shown below.
Note 1: The figures used relate to the consolidated financial statements of each university, which includes their controlled entities.
Note 2: Government grants do not include Higher Education Loan Programs, such as the Higher Education Contribution Scheme (HECS), which are included in revenue from domestic students. Source: University financial statements (audited).
0 500 1,000 1,500 2,000 2,500 3,000
Western Sydney University
University of Wollongong
University of Technology Sydney
University of Sydney
University of Newcastle
University of NSW
University of New England
Southern Cross University
Macquarie University
Charles Sturt University
$m
Revenue and expenditure by university in 2020
Revenue Expenditure
Fees and charges$5.8 billion
Government grants$3.7 billion
Other revenue$0.3 billion
Investment income$1.1 billion
Combined revenue of universities in NSW in 2020
Total combined revenue
$10.9 billion

18
NSW Auditor-General's Report to Parliament | Universities 2020 audits | Financial reporting
Note 1: Figures relate to the consolidated financial statements of each university, which include their controlled entities.
Note 2: Government grants do not include Higher Education Loan Programs, such as HECS, which are included in fees and charges. Source: University financial statements (audited).
Combined revenue for universities totalled $10.9 billion in 2020. This is a decrease of $538.5 million (4.7 per cent) from 2019.
Universities' revenue streams were impacted in 2020 by the COVID-19 pandemic
The graph below presents the aggregated revenue streams for all universities in NSW from 2016 to 2020.
Note 1: The figures used relate to the consolidated financial statements of each university, which includes their controlled entities.
Note 2: Government grants do not include Higher Education Loan Programs, such as the Higher Education Contribution Scheme (HECS), which are included in fees and charges. Source: University financial statements (audited).
50% 52% 54% 54% 53%
37%34%
33%31% 34%
10%11%
12%11% 10%3%
32%2%
4%3%
0
1
2
3
4
5
6
7
8
9
10
11
12
13
2016 2017 2018 2019 2020
$bn
Combined revenue of universities in 2020 compared to recent years
Investmentincome
Other revenue
Governmentgrants
Fees andcharges
0
1
2
3
4
5
6
7
2016 2017 2018 2019 2020
$bn
Universities' combined revenue streams
Fees and charges Government grants Other revenue Investment income

19
NSW Auditor-General's Report to Parliament | Universities 2020 audits | Financial reporting
The revenue stream recording the overall strongest growth for all universities between 2016 and 2019 was fees and charges. Fees and charges revenue increased by $1.5 billion in the four years between 2016 and 2019. This revenue stream recorded the biggest decline in 2020, decreasing by $361.0 million (5.8 per cent).
The other revenue and investment income streams also recorded declines in 2020, decreasing by $125.0 million (10.2 per cent) and $201.8 million (42.4 per cent) respectively.
The only revenue stream to record an increase in 2020 was government grants revenue, which increased by $149.5 million (4.2 per cent).
Government grants as a proportion of total revenue increased for the first time in five years
In previous years, various higher education reforms have been proposed by the Australian Government to manage the cost of tertiary education and to reduce the reliance of universities on government grants. Prior to the onset of the COVID-19 pandemic, combined government grants as a proportion of the total revenue of universities in NSW had been steadily reducing, from 37.1 per cent in 2016 to 31.1 per cent in 2019. This was despite an increase in combined government grants revenue by $61.0 million over the same period.
Combined government grants revenue increased by $149.5 million in 2020 to total $3.7 billion ($3.6 billion in 2019). Combined fees and charges revenue received by universities reduced in 2020 by $360.8 million to $5.8 billion ($6.2 billion in 2019). As a consequence, the proportion of government grants to total revenue of universities increased for the first time in five years to 34.0 per cent in 2020 (31.1 per cent in 2019).
The following graph shows major revenue streams by universities for 2020.
Note 1: The figures used relate to the consolidated financial statements of each university, which includes their controlled entities.
Note 2: Government grants do not include Higher Education Loan Programs, such as HECS, which are included in fees and charges. Source: University financial statements (audited).
In 2020, three universities (two in 2019) received more than 40 per cent of their total revenue from government grants.
40%
34%
27%
27%
44%
39%
46%
36%
26%
44%
50%
57%
65%
57%
42%
52%
42%
55%
51%
50%
8%
7%
7%
12%
10%
7%
10%
8%
21%
3%
2%
2%
1%
4%
4%
2%
2%
1%
1%
4%
0% 20% 40% 60% 80% 100%
Western Sydney University
University of Wollongong
University of Technology Sydney
University of Sydney
University of Newcastle
University of NSW
University of New England
Southern Cross University
Macquarie University
Charles Sturt University
Components of total revenue by universities in 2020
Government grants Fees and chargesOther revenue Investment income

20
NSW Auditor-General's Report to Parliament | Universities 2020 audits | Financial reporting
In the current year, the change in revenue from government grants at individual universities varied from a decrease of 7.4 per cent to an increase of 19.4 per cent. The graph below shows government grants received at individual universities in 2020 with the percentage change from 2019.
Source: University financial statements (audited).
Lower overseas student enrolments drove the overall decrease in revenue from fees and charges
Universities' overseas and domestic student course fees and charges revenue for 2016 to 2020 is presented in the following graph.
Note 1: The figures used relate to the consolidated financial statements of each university, which includes their controlled entities.
Note 2: Revenue from domestic students includes amounts from Higher Education Loan Programs, such as HECS and excludes non-course fees and charges. Source: University financial statements (audited).
+4.4%
+3.9%
+9.6%
-0.5%
+1.7%
+6.1%
+0.8%
-7.4%
+3.9%
+19.4%
0 200,000 400,000 600,000 800,000 1,000,000
Western Sydney University
University of Wollongong
University of Technology Sydney
University of Sydney
University of Newcastle
University of NSW
University of New England
Southern Cross University
Macquarie University
Charles Sturt University
Government grants by university in 2020 (change from 2019)
Government grants Change since 2019
1.0
1.5
2.0
2.5
3.0
3.5
4.0
2016 2017 2018 2019 2020
$bn
At 31 December
Universities' overseas and domestic student course fees and charges revenue
Domestic students Overseas students

21
NSW Auditor-General's Report to Parliament | Universities 2020 audits | Financial reporting
Fees and charges revenue from overseas students increased by $1.3 billion in the four years between 2016 and 2019. Fees and charges revenue from domestic students only increased by $156.1 million over this same period.
In 2020, fees and charges revenue from overseas students declined by $286.6 million (7.9 per cent) compared to 2019. As noted earlier in Section 2.2 of this report, this decrease was driven by a fall in overseas students studying at universities in NSW, from 115,294 students in 2019 to 106,984 students in 2020.
Fees and charges revenue from domestic students increased by $45.1 million in 2020 to total $2.2 billion despite a decrease in the number of domestic students by 0.9 per cent. There were 182,683 domestic students enrolled at universities in NSW in 2020 compared to 184,405 in 2019, a fall of 1,722 students. The increase was due to higher course fee rates.
The graph below shows individual universities' revenue in 2020 from overseas and domestic students. Income from overseas students exceeds that from domestic students at two universities (three in 2019). These were the University of New South Wales and the University of Sydney.
Note 1: The figures used relate to the consolidated financial statements of each university, which includes their controlled entities.
Note 2: Revenue from domestic students includes amounts from Higher Education Loan Programs, such as HECS. Government grants for domestic students represents the CGS funding for Commonwealth Supported Places. Source: University financial statements (audited).
Nearly 40 per cent of universities' total revenue from course fees in 2020 came from overseas students from three countries
In 2020, overseas students contributed $3.1 billion in course fees to universities in NSW. Students from the top three countries of origin contributed $2.2 billion in fees ($2.4 billion in 2019), which closely approximates the universities' total revenue from domestic students for 2020. These countries were China, India and Nepal (same in 2019). Revenue from students from these countries comprised 39.8 per cent (40.9 per cent in 2019) of total student revenues for all universities and 71.8 per cent of total overseas student revenues in 2020.
As we have reported previously, the universities that are most dependent on revenue from students from these three countries are at risk from unexpected shifts in demand. Demand for education can change rapidly due to changes in the geo-political or geo-economic landscape, or from restrictions over visas or travel. The consequence of the reliance on students from particular countries was realised as travel restrictions were implemented following the outbreak of COVID-19 in early 2020.
0 200 400 600 800 1,000 1,200
Western Sydney University
University of Wollongong
University of Technology Sydney
University of Sydney
University of Newcastle
University of NSW
University of New England
Southern Cross University
Macquarie University
Charles Sturt University
$m
Revenue from overseas and domestic students including government grants for each university in 2020
Domestic – student revenue Domestic – government grants
Overseas

22
NSW Auditor-General's Report to Parliament | Universities 2020 audits | Financial reporting
The graph below shows universities' revenue in 2020 from overseas and domestic student fees.
Note 1: The figures used for revenue relate to students enrolled in bachelor or higher degrees at the parent university.
Note 2: Revenue from domestic students includes amounts from Higher Education Loan Programs, such as HECS but excludes non-course fees and charges. Source: Total revenue from domestic and overseas students was sourced from university financial statements (audited). Revenue from students by country of origin was provided by universities (unaudited).
The countries of origin of overseas students enrolled at universities in NSW are set out below. All universities continue to market their educational products in international markets, focusing on countries in Asia. While the countries of origin of overseas students have diversified, a concentration risk remains. Over 42 per cent of all overseas students attending universities in NSW come from one country (China), but not all universities are dependent on students from China. Enrolments of students from India and Nepal had increased in the four years up to 2019, although 2020 saw a decrease.
Domestic students44%
Overseas students (top 3 countries)
40%
Overseas students (other)
16%
Universities' revenue from student course fees in 2020
$2.2 billion
$0.9 billion
$2.5 billion

23
NSW Auditor-General's Report to Parliament | Universities 2020 audits | Financial reporting
Source: Australian Department of Education and Training, international student data (provided by the Australian Trade and Investment Commission).
The highest proportion of overseas student revenue sourced from a single country at individual universities ranged from 23 to 77 per cent (2019: 24 per cent to 75 per cent). The graph below illustrates the relative reliance of each university on a single country for their overseas student revenue.
Note: The figures used for revenue relate to students enrolled in bachelor or higher degrees at the parent university. The percentage has been calculated based on the university parent total overseas student revenue. Source: Provided by universities (unaudited).
42.9% 43.0% 42.6% 42.2% 42.8%
11.7%12.5%
14.3%15.5% 13.9%
9.2%
11.6%
13.4%
14.7%14.6%
36.2%
32.9%
29.6%
27.6%28.6%
0
20
40
60
80
100
120
140
160
180
2016 2017 2018 2019 2020
Enro
lmen
ts ('
000s
)
Year ended 31 December
Universities' overseas student enrolments by country of origin
Others
Nepal
India
China
India
India
China
China
China
China
Nepal
India
China
India
-1%
-1%
+2%
+3%
0%
-3%
-1%
-14%
-7%
-3%
0% 20% 40% 60% 80% 100%
Western Sydney University
University of Wollongong
University of Technology Sydney
University of Sydney
University of Newcastle
University of NSW
University of New England
Southern Cross University
Macquarie University
Charles Sturt University
Highest proportion of overseas student revenue from a single country of origin at each university in 2020 (with change since 2019)
Top country 2020 Change since 2019

24
NSW Auditor-General's Report to Parliament | Universities 2020 audits | Financial reporting
Other revenues Overall philanthropic contributions to universities increased in 2020
Universities and many of their controlled entities are charities and are registered as deductible gift recipients for taxation purposes. They can attract significant donations and bequests from public, private and corporate philanthropists. Some bequests received are tied to specific research activities and under the terms of the bequest, cannot be used for other purposes.
Despite the COVID-19 pandemic, philanthropic contributions to universities increased by 32.2 per cent from $167.9 million in 2019 to $222.0 million in 2020. Philanthropic contributions increased at eight universities in 2020. Two universities, being Charles Sturt University and Macquarie University, did not attract the level of donations that they received in 2019.
The University of Sydney and the University of New South Wales attracted 75.2 per cent of the total philanthropic contributions to the universities in 2020 (69.5 per cent in 2019). The newer, smaller and non-metropolitan universities have been least able to attract donations.
The graph below presents the donations revenue received by each of the universities in 2020.
Note: The figures used relate to the consolidated financial statements of each university, which includes their controlled entities. Source: University financial statements (audited).
Total research income for universities was $1.4 billion in 2019
Universities' total research income increased by $323 million (30.8 per cent) in the five years between 2014 and 2019 from $1.0 billion to $1.4 billion, almost half attributed to increased industry and other funding (non-government) of $155.6 million. Research income statistics for 2020 will be available from the Australian Department of Education and Training after July 2021.
+63.5%
+15.5%
+59.4%
+46.4%
+74.2%
+16.3%
+232.4%
+15.8%
-29.1%
-53.7%
0 20 40 60 80 100 120
Western Sydney University
University of Wollongong
University of Technology Sydney
University of Sydney
University of Newcastle
University of NSW
University of New England
Southern Cross University
Macquarie University
Charles Sturt University
$m
Philanthropic revenue for each university in 2020(with change since 2019)
2020 Change since 2019

25
NSW Auditor-General's Report to Parliament | Universities 2020 audits | Financial reporting
Two universities attracted 66.5 per cent of the total research income of all universities (65.2 per cent in 2018) as shown in the graph below.
Note: Due to three universities (Macquarie University, University of New England, and University of New South Wales) deferring the application of new Accounting Standards to research grants, the data may not be comparable across all universities. Source: Australian Department of Education and Training statistics on Higher Education Research Income (audited).
Expenditure A snapshot of combined expenditure at universities in NSW for the year ended 31 December 2020 is shown below.
Note 1: The figures used relate to the consolidated financial statements of each university, which includes their controlled entities. Source: University financial statements (audited).
+14%
+0%
+13%
+15%
+4%
+15%
+12%
+7%
+22%
-25%
0 100 200 300 400 500
Western Sydney University
University of Wollongong
University of Technology Sydney
University of Sydney
University of Newcastle
University of NSW
University of New England
Southern Cross University
Macquarie University
Charles Sturt University
$m
Research income for each university in 2019 (with change since 2018)
2019 Change since 2018
Employee related expenses
$6.5 billion
Depreciation and amortisation$1.0 billion
Scholarships and grants
$0.6 billion
Other$2.8 billion
Combined expenditure at universities in 2020
Total combined expenditure $11.0 billion

26
NSW Auditor-General's Report to Parliament | Universities 2020 audits | Financial reporting
Note 1: The figures used relate to the consolidated financial statements of each university, which includes their controlled entities. Source: University financial statements (audited).
Combined expenditure for universities totalled $11.0 billion in 2020. This was a decrease of $147.8 million (0.9 per cent) from 2019.
Universities have been managing expenditure and optimising cost efficiencies over recent years so that they could operate in a competitive environment with less direct government support in the form of grants. However, the outbreak of the COVID-19 pandemic put immediate financial pressure on the sector. Universities responded by implementing cost saving measures including reducing the casual and contractor workforce, delaying the hire of new staff, eliminating travel, and pausing other discretionary expenditure.
Redundancies increased employee related expenses in 2020
Combined employee related expenses for universities increased to $6.5 billion in 2020. This was a rise of $270.3 million (4.4 per cent) from 2019.
The increase in employee related expenses was largely driven by redundancy programs implemented by universities in response to financial pressures resulting from the COVID-19 pandemic. The total cost of the redundancies offered in 2020 across the university sector in NSW totalled $293.9 million. In all, some 2,162 positions were made redundant. The redundancy programs are expected to result in decreased employee related expenses in future years.
New legislation may impact the status of casuals employed by universities from 2021
The Fair Work Amendment (Supporting Australia’s Jobs and Economic Recovery) Act 2021 (the Amendment Act), dealing with casual employment, commenced on 26 March 2021.
The Amendment Act provides a new definition of casual employment which is an objective test based on the circumstances existing between the employee and the employer at the time of engagement. An employee will be a casual employee where an offer is made and accepted on the basis that the employer makes ‘no firm advance commitment to continuing and indefinite work according to an agreed pattern of work’ for the person.
58% 57% 56% 56% 59%
8%8%
7%9%
9%
5%6%
6%6%
6%30%
32%
30%
29% 26%
0
1
2
3
4
5
6
7
8
9
10
11
12
2016 2017 2018 2019 2020
$bn
Combined expenditure at universities in 2020 compared to recent years
Other
Scholarshipsand grants
Depreciationandamortisation
Employeerelatedexpenses

27
NSW Auditor-General's Report to Parliament | Universities 2020 audits | Financial reporting
The Amendment Act also requires employers to offer current casual employees conversion to full-time or part-time permanent employment where they have worked for their employer for at least 12 months and have, during at least the last six months of that time, worked a regular pattern of hours on an ongoing basis. While this entitlement is subject to exemptions, it may impact the status of some casuals employed by universities from 2021 and the structure of the universities’ workforce.
The decrease in other expenses in 2020 was in response to the COVID-19 pandemic
Combined other expenses for universities decreased in 2020 from $3.3 billion in 2019 to $2.8 billion in 2020. This reduction of $436.4 million, or 13.4 per cent, was largely driven by cost saving measures introduced to respond to the COVID-19 pandemic.
Notable decreases in combined other expenses at universities in 2020 were in:
• travel, entertainment and staff development expenses, which were $59.6 million in 2020 compared to $248.9 million in 2019, a decrease of $189.3 million (76.1 per cent)
• consultants and contractors expenses, which were $165.9 million in 2020 compared to $207.6 million in 2019, a decrease of $41.7 million (20.1 per cent).
Despite the overall trend downward in combined other expenses in 2020, there were some flow on impacts of the COVID-19 pandemic that contributed to notable increases in the following expenses:
• impairment of assets were $76.9 million in 2020 compared to $21.5 million in 2019, an increase of $55.4 million (258.0 per cent), primarily in relation to investment assets which decreased in value due to financial market movements
• borrowing costs were $131.0 million in 2020 compared to $120.8 million in 2019, an increase of $10.2 million (9.6 per cent).
The expenditure for each university with change since 2019 is shown below.
Note 1: The figures used relate to the consolidated financial statements of each university, which includes their controlled entities. Source: University financial statements (audited).
Five universities reduced expenses in 2020 compared to 2019. The biggest reduction in dollar value was at the University of New South Wales where savings of $120.2 million were achieved.
-9.2%
+1.2%
-1.7%+5.3%
-5.0%
+2.7%
-1.0%
+2.6%
+0.7% -3.6%
0.0
0.5
1.0
1.5
2.0
2.5
CSU MU SCU UNE UNSW UON USYD UTS UOW WSU
$bn
Expenditure for each university in 2020(with change since 2019)
2020 Change since 2019

28
NSW Auditor-General's Report to Parliament | Universities 2020 audits | Financial reporting
The graph below shows the key components of expenditure for each university in 2020.
Note 1: The figures used relate to the consolidated financial statements of each university, which includes their controlled entities. Source: University financial statements (audited).
Employee related expenses represent the major portion of expenses at each university and ranged from 56.8 per cent to 62.2 per cent of total expenditure.
Controlled entities The overall number of universities' controlled entities decreased
While some universities have started to streamline and reduce the number of their controlled entities to contain administrative and compliance costs, others have established new entities to expand their operations overseas or commence new business activities. Universities created two new controlled entities and deregistered five entities in 2020, resulting in three fewer controlled entities this year overall.
Out of 74 controlled entities, there were 14 dormant entities in 2020, including corporate trustees that do not trade and entities that have ceased to operate due to business rationalisation.
Twenty-two of the universities' controlled entities required letters of financial support from their parent in 2020 (23 in 2019).
0 500 1,000 1,500 2,000 2,500 3,000
Western Sydney University
University of Wollongong
University of Technology Sydney
University of Sydney
University of Newcastle
University of NSW
University of New England
Southern Cross University
Macquarie University
Charles Sturt University
$m
Key components of expenditure for each university in 2020
Employee related expenses Scholarships and grantsDepreciation and amortisation Other

29
NSW Auditor-General's Report to Parliament | Universities 2020 audits | Financial reporting
The table below details the number of universities' controlled entities.
University at 31 December 2020 Total number of controlled entities
Number of dormant entities
Number of overseas controlled entities
Charles Sturt University 2 -- --
Macquarie University 14 9 1
Southern Cross University 1 -- --
University of New England 6 1 --
University of NSW 15 2 7
University of Newcastle 3 -- 1
University of Sydney 3 -- 1
University of Technology Sydney 10 -- 5
University of Wollongong 13 1 8
Western Sydney University 7 1 --
Total 74 14 23 Source: University and controlled entities' financial statements (audited).

30
NSW Auditor-General's Report to Parliament | Universities 2020 audits | Internal controls
3. Internal controls Appropriate and robust internal controls help reduce risks associated with managing finances, compliance and administration of universities.
This chapter outlines the internal controls related observations and insights across universities in NSW for 2020, including overall trends in findings, level of risk and implications.
Our audits do not review all aspects of internal controls and governance every year. The more significant issues and risks are included in this chapter. These along with the less significant matters are reported to universities for management to address.
3.1 Internal controls
Internal control findings Internal control deficiencies marginally increased on the prior year
Our audits identified 110 internal control deficiencies (108 in 2019) at universities of which 45 were repeated from the previous year (35 in 2019). Information technology (IT) deficiencies accounted for 38 of the findings. Universities increasingly rely on IT for efficient and effective delivery of services such as online/remote learning, as well as for their financial processes and internal and external financial reporting. While IT delivers considerable benefits, increasing reliance on IT systems with known vulnerabilities presents additional risks that universities need to address.
The graphs below describe the spread of findings reported to management by risk rating across four key areas.
Source: Management letters issued by the Audit Office for the parent universities.
14
25
0
Low risk
Moderate risk
High risk
Information technology
7
5
0
Low risk
Moderate risk
High risk
Policies and procedures
15
18
2
Low risk
Moderate risk
High risk
Financial controls
13
10
1
Low risk
Moderate risk
High risk
Financial reporting

31
NSW Auditor-General's Report to Parliament | Universities 2020 audits | Internal controls
The table below shows the level of risks on the management letter findings by university for 2020.
Management letter findings 2020
University High Moderate Low Repeat
Charles Sturt University 2 8 4 3
Macquarie University -- 7 6 6
Southern Cross University -- 7 2 3
University of New England -- 6 6 8
University of New South Wales 1 8 5 6
University of Newcastle -- 4 6 --
University of Sydney -- 5 7 8
University of Technology Sydney -- 3 4 5
University of Wollongong -- 10 5 5
Western Sydney University -- -- 4 1 Source: Management letters issued by the Audit Office for the parent universities.
We reported three high risk findings in 2020 compared to one in 2019
In 2020 we reported three high risk findings, one relating to financial controls and carried forward from 2019, one new financial controls finding, and one new financial reporting finding. The three high risk issues are summarised below:
The University of New South Wales had one high risk finding
Last year, the University of New South Wales identified that correct payment rates had not been consistently applied to casual academic staff in some cases. The absence of effective financial controls, which may have prevented the need to provide for a potential underpayment of casual staff salaries, resulted in extended audit procedures to confirm the material accuracy and completeness of the underpayment.
In response, the University in 2020 continued work on assessing and quantifying the value of underpayments, and continues to liaise with the Fair Work Ombudsman, external legal and accounting experts on their underpayment's assessment methodology. The University advised it has taken actions in May 2021 to further address this issue.
At 31 December 2020, the University recognised a provision to reflect the extent of underpayments across all faculties and all associated remediation costs.

32
NSW Auditor-General's Report to Parliament | Universities 2020 audits | Internal controls
Charles Sturt University had two high risk findings
• The audit of Charles Sturt University identified an error in recognition of revenue in relation to revenue received to fund capital works. The errors arose because of the university misunderstanding the requirements of the new accounting standard in relation to recognising grant funding revenue for construction work. A reassessment of the underlying agreements supporting two funded projects resulted in the University adjusting its financial statements to correct two material errors and recognise an additional $34.5 million in revenue for 2020. We recommend the university address the root cause of these errors, and put in place controls for sign-offs by the operational, legal and accounting teams so that the risks related to contracts are known prior to execution.
• During the year, the University engaged external expert advisors to perform a review of its payroll function. The expert has provided a draft report, which has identified instances of under and over payment of staff. The amount of the University's liability to its employees is yet to be quantified. We have recommended the University continue to investigate the extent of the underpayments and institute controls to avoid reoccurrence of the problem.
We identified 58 moderate risk findings, of which 25 related to IT
A summary of moderate risk control deficiencies identified in 2020 is set out below.
Areas No. of moderate risk control deficiencies Summary of the control deficiencies
Information technology
25 IT control deficiencies included: • lack of sufficient privileged user access review and
monitoring, including that of super user accounts and terminated employees' access
• payment files being held in editable formats and accessible to unauthorised staff
• password settings for applications did not align with the requirements of information security policies.
Poor IT controls increase the risk of inappropriate access, cyber security attacks, data manipulation and misuse of information and assets.
Financial controls 18 Financial control deficiencies included: • lack of independent reviews for changes to supplier
and payroll master file data • deficiencies in payroll systems that lacked
configuration to account for all entitlements set out in Enterprise Agreements, resulting in underpayments of staff salaries
• incomplete or no stocktake of assets undertaken during the year
Financial control weaknesses increase the risk of error or fraud in transactions that may result in financial loss to the university or misstatement in financial statements.
Policies and procedures
5 Deficiencies around policies and procedures included: • absence of key policies e.g. borrowing policy • key policies not reviewed within scheduled review
dates.

33
NSW Auditor-General's Report to Parliament | Universities 2020 audits | Internal controls
Areas No. of moderate risk control deficiencies Summary of the control deficiencies
Financial reporting 10 Financial reporting deficiencies included: • key judgements and assumptions used in
determining provisions were no longer being relevant • incomplete or inaccurate data was used to support
reported balances. For example, employee provision balances were based on incomplete employee listings
• significant fully depreciated assets remained in use • incomplete key management personnel returns.
These increase the risk that the financial statements will be materially misstated or require correction in subsequent years.
Total 58 Source: Management letters issued by the Audit Office for the parent universities.
Forty-five findings were raised in previous years compared to 35 in 2019
Recommendation Universities should prioritise actions to address repeat findings on internal control deficiencies in a timely manner. Risks associated with unmitigated control deficiencies may increase over time.
There were 45 repeat findings (35 in 2019) identified in 2020. Repeat findings arise when the university has not implemented recommendations from previous audits. Twenty-three repeat findings related to IT control deficiencies. These findings were determined as moderate as in most cases the related risk was partially addressed by some level of mitigating controls. Universities have agreed to prepare implementation plans to address these repeat issues.
IT issues can take some time to rectify because specialist skill and/or partnering with software suppliers is required to implement appropriate controls. Changes to complex systems or IT architecture may involve extensive testing and assessment before they are put into production. However, until rectified, the vulnerabilities those control deficiencies present can be significant.

34
NSW Auditor-General's Report to Parliament | Universities 2020 audits | Internal controls
The graph below shows the spread of repeat findings by area of focus and risk rating.
Source: Management letters issued by the Audit Office for the parent universities.
3.2 Business continuity and disaster recovery planning
Background The response to the recent emergencies and the COVID-19 pandemic has encompassed a wide range of activities, including internal policy setting, on-going service delivery, safety and availability of staff, availability of IT and other systems and financial management. Universities were not immune to the impact of these emergencies. In response, universities expedited the revision or establishment of business continuity and disaster recovery plans to ensure they remained resilient to existing and emerging threats, and could recover critical systems and transition to normal operations in a timely manner.
Universities deliver an ongoing service to the public that is critical to the social and economic outcomes of the State. Business continuity management helps universities to respond and manage business disruptions, maintain or restore critical services and return to business as usual with minimal impact to service delivery.
Information and communications technology (ICT) disaster recovery planning forms part of a university's business continuity management, focussing on the recovery and restoration of information and communications ICT systems that are critical to maintaining business continuity. Residual risks in cyber security management are compounded by incomplete or ineffective disaster recovery or business continuity plans.
While there are no specific requirements or minimal standards universities must adhere to with regards to their business continuity and disaster recovery planning arrangements, best practice standards do exist.

35
NSW Auditor-General's Report to Parliament | Universities 2020 audits | Internal controls
As a result, our review considers how well universities' business continuity and disaster recovery planning arrangements align to aspects of:
• ISO22301: 2019 Security and Resilience - Business Continuity Management Systems - Requirements
• ISO27031:2011 Information technology - Security techniques - Guidelines for information and communication technology readiness for business continuity.
In particular, we have focused on whether universities have:
• implemented and maintained up-to-date business continuity and disaster recovery plans • performed comprehensive risk assessments and business impact analysis • regularly tested their business continuity and disaster recovery plans • implemented processes to monitor and evaluate the performance of their business continuity
and disaster recovery plans.
Policy framework All universities have a business continuity policy
For the period 1 January 2020 to 31 December 2020, all ten universities had developed a business continuity policy. However, we noted three universities' policies were past their scheduled revision date. Business continuity policies generally include key requirements of the business continuity framework, such as the development of business continuity plans for critical business functions, performance of business impact analysis and establishment of roles and responsibilities.
In light of the current environment, it is increasingly critical for universities to review and ensure their key resilience frameworks are aligned, so that business impacts, roles and responsibilities and recovery times are clear to stakeholders and consistent with the changing environment.
Business impact analysis A key step of the business continuity management framework is to perform and document a business impact analysis (BIA). The BIA helps identify critical business functions that support a university's business objectives, including target recovery times and resource dependencies for each critical business function. The BIA should be supported by a comprehensive risk assessment to identify critical business functions.
All universities have prepared a business impact analysis
All ten universities have prepared a BIA to identify critical business functions and determine their business continuity priorities at 31 December 2020. However, only eight schedule periodic updates of their BIAs. Our review noted universities can improve the content of their BIA by ensuring key elements to strengthen their BIAs are included, such as those detailed in the table below:
Elements of a business impact analysis Number of universities
that did include the element in their BIA
Business processes and functions deemed critical to the university (inclusive of locations and scope of services) 10
Key IT systems used to support critical business processes and functions 10
Dependencies and interdependencies within critical business processes 9
Impact over time resulting from the disruption of these critical business processes 9
Maximum tolerable period of disruption (i.e. the time frame within which the impacts of not resuming activities would be unacceptable) 9
Recovery time objective (i.e. prioritised time frames within the time for resuming disrupted activities at a specified minimum acceptable capacity) 8

36
NSW Auditor-General's Report to Parliament | Universities 2020 audits | Internal controls
Without an up-to-date and comprehensive BIA there is a risk that universities will not be able to restore critical business functions within an acceptable timeframe. Universities may also not know how to respond in the event of a disruption if key systems and dependencies and interdependencies have not been identified, further elevating the risk that critical business functions will not be restored within acceptable timeframes.
All but one university had business continuity plans for IT systems that support critical business functions
Most universities had a plan in place to recover some or all of their critical IT systems and infrastructure that support university operations and functions as at 31 December 2020. Macquarie University had a business continuity plan and disaster recovery framework, but disaster recovery plans were yet to be developed for all critical IT systems and infrastructure at 31 December 2020.
Comprehensive plans are important because they are the key document that will guide staff in the event of an interruption, disaster or crisis. In general, the more detailed and up to date a plan the more effective it is. There remains a risk for those universities that do not have plans in place for all key business functions or IT systems and infrastructure, or do not have effective plans in place because the BIA has not captured key elements.
While the purpose of our review of universities’ business continuity and disaster recovery arrangements was not to review universities' risk identification and assessment processes, the recent emergency situations provided an opportunity for universities to re-visit and update the nature, likelihood and consequence of risks impacting on business continuity and related risk treatments. For example, the COVID-19 pandemic has highlighted several new risks that universities may not have previously captured in their risk registers or BIA, such as:
• concentration risks associated with being dependent on certain suppliers • additional technology risks (e.g. ability to support a workforce working from home) • increased cyber risks from higher electronic traffic and use of home networks • increased risks related to the online delivery of key services, such as remote teaching.
Business continuity and disaster recovery plans should be prepared for critical business functions and key IT systems and infrastructure identified as part of the BIA process. Business continuity plans provide guidance and information to help teams to respond to a disruption and to help the university respond and recover. A disaster recovery plan helps universities maintain IT services in the event of an interruption or restore IT systems and infrastructure in the event of a disaster or similar scenario.
The table below outlines whether universities had identified some common business continuity risks. We reviewed whether, during the period 1 January 2020 to 31 December 2020, universities had identified the risk and had a plan to mitigate it.
Risk Number of universities identifying the BCP risk
Natural disasters (e.g. floods, storms, bushfires and drought) 8
Health pandemic 8
Legal (e.g. insurance issues, contractual breaches, non-compliance with laws and regulations) 8
IT failure (hardware and software), and cyber-attack (malware, virus, spams, scams and phishing etc.) 8
Security (e.g. theft, fraud, online security and fraud) 8
Supply chain breakdowns (such as issues within their business or industry resulting in failure or interruptions to the services delivered) 8
Utilities and securities (such as failures or interruptions to the delivery of power, water, transport and telecommunications) 8

37
NSW Auditor-General's Report to Parliament | Universities 2020 audits | Internal controls
The tables below compare the results of our review with elements of what are observed best practices. Gaps in processes expose universities to increased risk and should be addressed.
Business continuity plan elements Number of universities
Purpose, scope and objectives 8
Roles and responsibilities 9
Actions the business continuity team (or equivalent) will take to continue or to recover critical business activities within predetermined time frames, monitor the impact of the disruption and the university's response to it 9
Resource requirements 9
Activation criteria to allow the business continuity team (or equivalent) to determine which situations warrant the invocation of the plan 8
Details on how to manage immediate consequences of disruption, giving due regard to: • the welfare of individuals • the prevention of further loss or unavailability of prioritised activities • the impact on the environment
8
Reporting requirements (e.g. who to report to and by when) 8
Documented processes to stand down the plan and to restore and return business activities from temporary measures implemented to 'business as usual' 8
Requirement to perform a post incident review 8
Disaster recovery plan elements Number of universities
Purpose, scope and objectives 8
Roles and responsibilities 9
Specific technology and process that will support alternative arrangements until the IT system is recovered 7
Resource requirements 8
Activation criteria to allow the disaster recovery team (or equivalent) to determine which situations warrant the invocation of the plan 9
References key material to guide the disaster recovery team 9
Reporting requirements (e.g. who to report to and by when) 9
Nine out of ten universities had developed a defined program to help staff in the event of the business continuity plan being invoked
At 31 December 2020, nine universities had developed a defined program to help key staff involved in managing business continuity apply the business continuity plan in the event it is invoked. This helps staff understand their role and responsibilities and implement the key requirements of the business continuity plan, particularly when faced with the pressure of an emergency situation or other interruption. Western Sydney University was in the process of redeveloping its business continuity plan. In response to the COVID-19 pandemic, it had implemented an agile crisis management framework, which the University contends might be applied more broadly to deal with other emergencies.

38
NSW Auditor-General's Report to Parliament | Universities 2020 audits | Internal controls
Universities should consider whether the current level of support and guidance provided to staff involved in managing business continuity is sufficient. Scenario testing and post incident reviews provide useful insights in understanding whether this is the case. As noted below, there exist opportunities for improvement as only half of the universities have prepared summaries of the business continuity plan and duty/role cards for key officers.
Guidance material Number of universities
Procedural checklists 8
Summaries of the business continuity plan (such as a ‘plan on a page’) 6
Duty/role cards for key officers involved in business continuity management 7
Contact details of key staff 9
Half of the universities regularly test their business continuity plans
Whilst all universities have a business continuity plan, only five conducted business continuity scenario testing during 2020. A lack of testing increases the risk universities may not be well prepared to respond to business disruptions or incidents that arise.
Responding to disruptions Actual incidents or events provide an important feedback loop on the effectiveness of current business continuity and disaster recovery arrangements. It is therefore important that universities record incidents that led to the activation (or not) of the business continuity or disaster recovery plan. Universities should perform post incident reviews to identify what went well and what can be improved and report the outcomes of these reviews to those charged with governance.
Logs to capture, assess and report disruptive incidents were maintained by four universities
An incident log of events that led to the activation of the business continuity or disaster recovery plans was maintained by four out of ten universities in each case. Two universities, the University of Newcastle, and the University of New England, maintained logs for both arrangements. In some cases, the absence of a register was due to neither arrangement being required to be activated during the period 1 January 2020 to 31 December 2020. Nonetheless, establishing procedures for capturing, assessing and reporting incidents, even those that did not require activation of either the disaster recovery or business continuity plan, means staff are familiar with procedures. Even where the incident is not deemed significant on its own, it can be assessed in the light of other, similar incidents, or with incidents or control failures that may compound the risks. A log or register of incidents also enables university management and those charged with governance to assess trends and determine the consistency of responses. It also means there is a complete trail of incidents (and associated records) in the event that key staff leave the university so that knowledge is not lost.
The absence of a log or register makes it difficult for those charged with governance to determine whether the actions taken in relation to the incident were appropriate.
Incident logs Business continuity arrangements
Disaster recovery arrangements
Incident log maintained where plan has been activated (number of universities) 4 4
Incident log captures events or disruptions where the relevant team has determined not to activate the plan (number of universities) 1 1

39
NSW Auditor-General's Report to Parliament | Universities 2020 audits | Internal controls
Our review of recorded incidents between the period 1 January 2020 to 31 December 2020 noted one instance where a university had performed a post incident review in respect of disaster recovery. The incident was reported to those charged with governance.
Business continuity arrangements
Disaster recovery arrangements
Post incident review performed (number of universities) Nil 1
Outcomes reported to relevant governance committee or executive management committee (number of universities) Nil 1
Without performing a post incident review, universities may not adequately capture lessons learnt from the incident, and importantly, will not continuously improve the suitability, adequacy and effectiveness of business continuity and disaster recovery arrangements. Reporting to those charged with governance is also an essential accountability mechanism that helps to ensure universities responses to incidents are consistent and appropriate.
Universities should update and refine their business continuity, disaster recovery or other business resilience frameworks
Universities should ensure that they assess their existing controls and update their business continuity, disaster recovery or other business resilience frameworks. This should capture, but is not limited to:
• misalignment of business resilience frameworks and key indicators • identification of previously unidentified risks and opportunities, and strategies to mitigate the
risk or exploit the opportunity • identification of procedural gaps in recovery, ‘stand down’ or other processes • completeness of critical business functions, key IT systems, dependences or
inter-dependencies • appropriateness of resources and roles and responsibilities and identifying any lack of clarity
that may exist • regular reporting to senior management and those charged with governance about incidents,
the university's response to those incidents, and an assessment of remaining vulnerabilities or remedial action required to address residual risks.
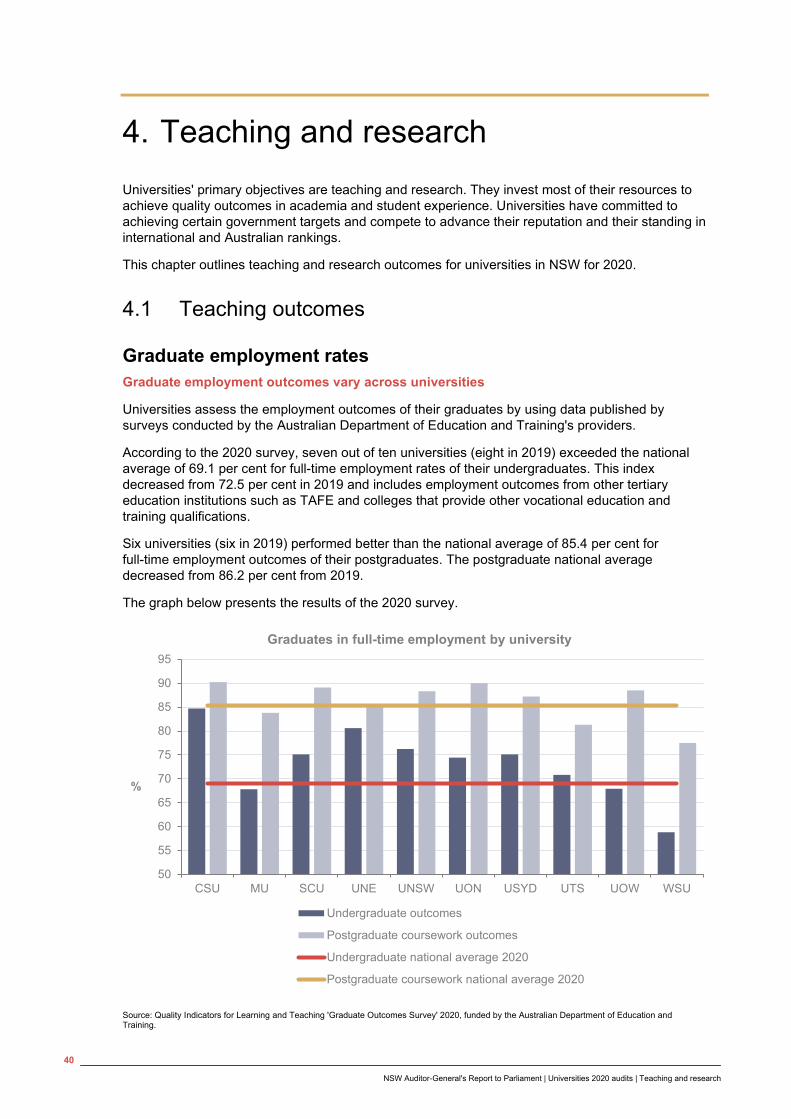
40
NSW Auditor-General's Report to Parliament | Universities 2020 audits | Teaching and research
4. Teaching and research Universities' primary objectives are teaching and research. They invest most of their resources to achieve quality outcomes in academia and student experience. Universities have committed to achieving certain government targets and compete to advance their reputation and their standing in international and Australian rankings.
This chapter outlines teaching and research outcomes for universities in NSW for 2020.
4.1 Teaching outcomes
Graduate employment rates Graduate employment outcomes vary across universities
Universities assess the employment outcomes of their graduates by using data published by surveys conducted by the Australian Department of Education and Training's providers.
According to the 2020 survey, seven out of ten universities (eight in 2019) exceeded the national average of 69.1 per cent for full-time employment rates of their undergraduates. This index decreased from 72.5 per cent in 2019 and includes employment outcomes from other tertiary education institutions such as TAFE and colleges that provide other vocational education and training qualifications.
Six universities (six in 2019) performed better than the national average of 85.4 per cent for full-time employment outcomes of their postgraduates. The postgraduate national average decreased from 86.2 per cent from 2019.
The graph below presents the results of the 2020 survey.
Source: Quality Indicators for Learning and Teaching 'Graduate Outcomes Survey' 2020, funded by the Australian Department of Education and Training.
50
55
60
65
70
75
80
85
90
95
CSU MU SCU UNE UNSW UON USYD UTS UOW WSU
%
Graduates in full-time employment by university
Undergraduate outcomes
Postgraduate coursework outcomes
Undergraduate national average 2020
Postgraduate coursework national average 2020
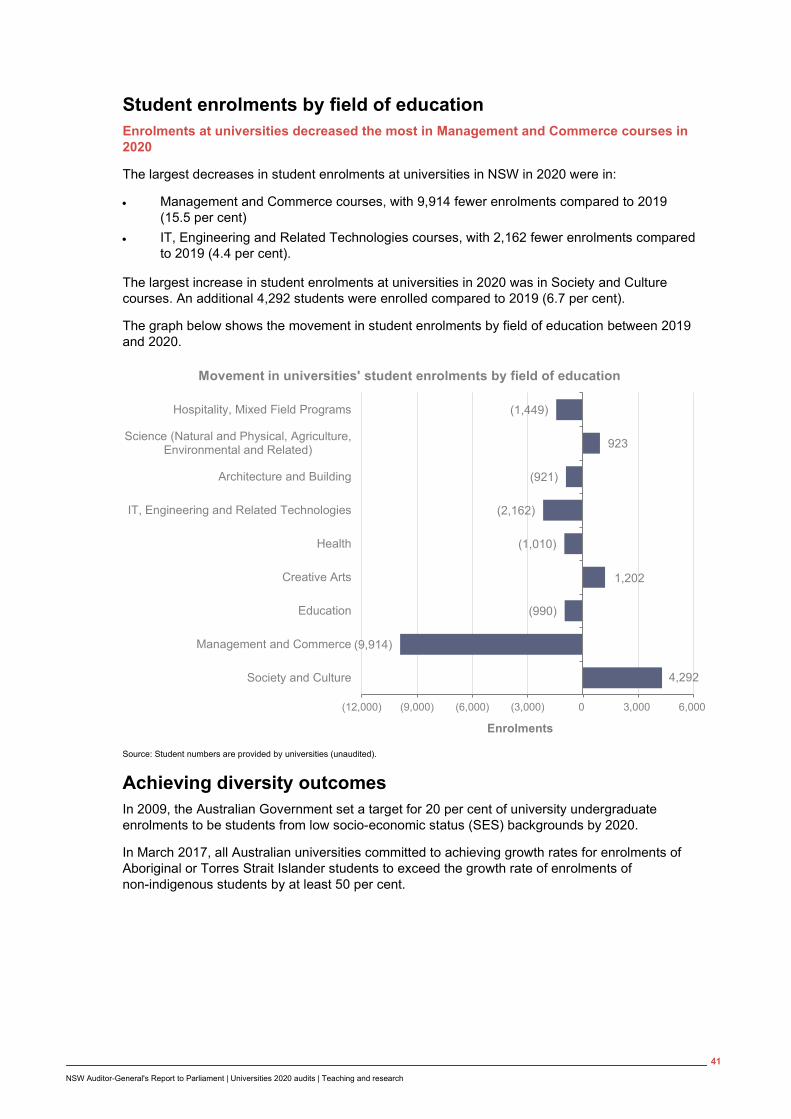
41
NSW Auditor-General's Report to Parliament | Universities 2020 audits | Teaching and research
Student enrolments by field of education Enrolments at universities decreased the most in Management and Commerce courses in 2020
The largest decreases in student enrolments at universities in NSW in 2020 were in:
• Management and Commerce courses, with 9,914 fewer enrolments compared to 2019 (15.5 per cent)
• IT, Engineering and Related Technologies courses, with 2,162 fewer enrolments compared to 2019 (4.4 per cent).
The largest increase in student enrolments at universities in 2020 was in Society and Culture courses. An additional 4,292 students were enrolled compared to 2019 (6.7 per cent).
The graph below shows the movement in student enrolments by field of education between 2019 and 2020.
Source: Student numbers are provided by universities (unaudited).
Achieving diversity outcomes In 2009, the Australian Government set a target for 20 per cent of university undergraduate enrolments to be students from low socio-economic status (SES) backgrounds by 2020.
In March 2017, all Australian universities committed to achieving growth rates for enrolments of Aboriginal or Torres Strait Islander students to exceed the growth rate of enrolments of non-indigenous students by at least 50 per cent.
4,292
(9,914)
(990)
1,202
(1,010)
(2,162)
(921)
923
(1,449)
(12,000) (9,000) (6,000) (3,000) 0 3,000 6,000
Society and Culture
Management and Commerce
Education
Creative Arts
Health
IT, Engineering and Related Technologies
Architecture and Building
Science (Natural and Physical, Agriculture,Environmental and Related)
Hospitality, Mixed Field Programs
Enrolments
Movement in universities' student enrolments by field of education

42
NSW Auditor-General's Report to Parliament | Universities 2020 audits | Teaching and research
The 2019 results showed:
• five universities (five in 2018) achieved enrolments of more than 20 per cent of domestic undergraduate students from low SES backgrounds
• seven universities achieved increased enrolments of students from Aboriginal and Torres Strait Islander backgrounds (eight in 2017).
Enrolment statistics for 2020 are not expected to be available from the Australian Department of Education and Training until July 2021.
Universities can continue to improve outcomes for these students by consistently setting targets, tracking achievement against those targets, implementing policies to increase enrolments and supporting students to graduation.
Five universities reported that they currently enrol more students from low SES backgrounds than the target
Universities reported a small decrease in the number of low SES domestic undergraduate student enrolments from 40,082 in 2018 to 40,066 in 2019. Overall, university student enrolments (headcount) in NSW marginally increased in the same period from 298,978 in 2018 to 300,731 in 2019.
Reported enrolments of domestic undergraduate students from low SES backgrounds in 2019 for universities as a percentage of total domestic undergraduate students are shown in the table below.
Source: Australian Department of Education and Training, Equity Performance Data.
0
5
10
15
20
25
30
35
CSU MU SCU UNE UNSW UON USYD UTS UOW WSU
%
Low SES domestic undergraduate student enrolments (headcount percentage) for each university in 2019
2019 Target (20% by 2020)

43
NSW Auditor-General's Report to Parliament | Universities 2020 audits | Teaching and research
Seven universities reported increased enrolments of students from Aboriginal and Torres Strait Islander backgrounds in 2019
Universities reported increased overall number of indigenous student enrolments in 2019 by 403, taking the total number to number of indigenous student enrolments in 2019 to 6,818. This represents a growth of 6.3 per cent since 2018. Overall, non-indigenous student enrolments in NSW marginally increased in the same period from 292,563 in 2018 to 293,913 in 2019. Consequently, the target growth rate for enrolments of Aboriginal or Torres Strait Islander students to exceed the growth rate of enrolments of non-indigenous students by at least 50 per cent was achieved in 2019.
The indigenous student enrolments for 2019 by university is shown below, together with the change in indigenous student enrolments since 2018.
Source: Australian Department of Education and Training, Equity Performance Data.
+11.3%
+4.7%
-0.5%
+17.6%
+5.4%
+5.9%
-9.6% +2.7%
+14.8%
-0.3%
0
200
400
600
800
1,000
1,200
CSU MU SCU UNE UNSW UON USYD UTS UOW WSU
Indigenous student enrolments for each university in 2019(with change since 2018)
2019 Change since 2018

Section two
Appendices

47
NSW Auditor-General's Report to Parliament | Universities 2020 audits | Appendix one – Status of 2019 recommendations
Appendix one – Status of 2019 recommendations
Recommendation Current status
Controlled entities
Universities should strengthen their governance arrangements to oversight their overseas controlled entities' legal and policy compliance functions.
Five of the six universities with overseas controlled entities reported that they have adequate governance arrangements to oversight their overseas controlled entities' legal and policy compliance functions. One university is in the process of implementing compliance procedures to address the recommendation. Refer to Section 2.3 for more details.
Performance reporting
Universities should strengthen processes to review and validate published performance information.
Seven universities reported they have established adequate review processes over published performance information. Two universities are in the process of reviewing internal controls around reporting performance information. One university has not addressed the recommendation.
Cyber security
Universities should strengthen cyber security risks frameworks and controls to protect sensitive data and prevent financial and reputational losses.
Nine universities are working to strengthen their cyber security risks frameworks and controls. One university does not have a specific cyber security risk framework in place. Refer to Section 3.2 for more details.
Procurement
Universities should review their procurement and contract management policies and procedures to ensure that they are relevant and effective in reducing risk and improving purchasing outcomes.
Universities are still in the process of reviewing their procurement and contract management policies and procedures.
Key Fully addressed Partially addressed Not addressed

48
NSW Auditor-General's Report to Parliament | Universities 2020 audits | Appendix two – Universities' controlled entities
Appendix two – Universities' controlled entities Universities and their controlled entities are listed in the table below.
Agency
Charles Sturt University (CSU)
Charles Sturt Campus Services Limited
The Charles Sturt University Foundation Trust
Macquarie University (MU)
Access Macquarie Limited
AusUni Pty Ltd
COH Property Trust
Macquarie University Clinical Associates Limited
Macquarie University Hong Kong Foundation Limited
Macquarie University Investment Company No. 3 Pty Limited
Macquarie University Property Investment Company Pty Limited
Macquarie University Property Investment Trust
MGSM Limited
MQ Health Pty Ltd
MUH Operations Pty Ltd
MUPH Clinic Pty Limited
MUPH Hospital Pty Ltd
U@MQ Limited
Southern Cross University (SCU)
Southern Cross Campus Services Limited
University of New England (UNE)
Ag360
Agricultural Business Research Institute
UNE Foundation
UNE Foundation Ltd
UNE Life Pty Ltd
UNE Partnerships Pty Ltd
University of New South Wales (UNSW)
NewSouth Innovations Pty Limited
NSW Minerals Industry / UNSW Education Trust
Qucor Pty Limited
Scientia Clinical Research Limited

49
NSW Auditor-General's Report to Parliament | Universities 2020 audits | Appendix two – Universities' controlled entities
Agency
UK Foundation of UNSW Australia
University of NSW Foundation Ltd
University of NSW Foundation Trust
University of NSW Press Ltd
UNSW and Study Abroad – Friends and US Alumni Inc
UNSW Centre for Transformational Technologies (Yixing)
UNSW Global India Private Limited
UNSW Global Pty Limited
UNSW Hong Kong Foundation Limited
UNSW Hong Kong Limited
UNSW SinoAustralia Innovative Technology and Education (Shanghai) Co. Ltd
University of Newcastle (UON)
NUServices Pty Limited
UON Singapore Pte Ltd
The University of Newcastle Research Associates Ltd
University of Sydney (USYD)
A14 Holdings Pty Ltd
Suzhou Xi Su Business Consulting Co
Westmead IVF
University of Technology Sydney (UTS)
accessUTS Pty Ltd
lnsearch (Shanghai) Limited
lnsearch Education lnternational Pty Limited
Insearch Global Pty Ltd
lnsearch India
lnsearch Lanka PVT
lnsearch Limited
UTS Beijing Ltd
UTS Global Pty Ltd
UTS Research and Innovation Institute (Shenzhen) Co Ltd
University of Wollongong (UOW)
CCCU Deed of Trust
The Sydney Business School Pty Ltd
The University of Wollongong USA Foundation
UOW College Hong Kong Ltd (formerly CCCU Ltd)
UOWC Ltd
UOWD Ltd
UOWD FZ-LLC
UOWGE Ltd
50
NSW Auditor-General's Report to Parliament | Universities 2020 audits | Appendix two – Universities' controlled entities
Agency
UOWM Sdn Bhd
UOW Malaysia KDU College Sdn Bhd
UOW Malaysia KDU Penang University College Sdn Bhd
UOW Malaysia KDU University College Sdn Bhd
UOW Pulse Limited
Western Sydney University (WSU)
Western Growth Developments (Innovation Hub Parramatta) Pty Ltd
Western Growth Developments (Westmead) Pty Ltd
Western Sydney University Early Learning Ltd
Western Sydney University Enterprises Pty Limited (The College)
Western Unlimited Limited
Whitlam Institute Within Western Sydney University Limited
Whitlam Institute Within Western Sydney University Trust

Our insights inform and challenge government to improve outcomes
for citizens.
OUR VISION
OUR PURPOSETo help parliament hold government
accountable for its use of public resources.
OUR VALUESPride in purpose
Curious and open-minded
Valuing people
Contagious integrity
Courage (even when it’s uncomfortable)
Professional people with purpose
audit.nsw.gov.au

Level 19, Darling Park Tower 2 201 Sussex Street
Sydney NSW 2000 Australia
PHONE +61 2 9275 7100EMAIL [email protected]
audit.nsw.gov.auaudit.nsw.gov.au
Office hours: 8.30am-5.00pmMonday to Friday.


![Quality Management @ Uni GrazThe quality management system of universities […] shall be subject to periodic audits. Audits […] may be performed by the Agency for Quality Assurance](https://img.pdfslide.net/doc/110x75/5f41abd4f3c8e616c208632e/quality-management-uni-graz-the-quality-management-system-of-universities-shall.jpg)