Embed Size (px)
Citation preview

Universität Hamburg, Department Biologie
GENETIC TRANSFORMATION OF KENYAN SORGHUM ( SORGHUM
BICOLOR (L.) MOENCH) WITH ANTI-FUNGAL GENES AND RESPONSE
TO COLLETOTRICHUM SUBLINEOLUM INFECTION
Dissertation
Submitted to the Department of Biology
Faculty of Mathematics, Informatics and Natural Sciences
University of Hamburg, Germany
for the degree of
Doctor rerum naturalium
(Dr. rer. nat.)
Linus Moses Kosambo Ayoo
from Kisumu, Kenya
Hamburg, 2008

ii
AUTHORITY
iii
ENGLISH CERTIFICATE
iv
DEDICATION
To Atieno, Aluoch, Ajwang
and Frömming-Kosambo
v
SUMMARY
Sorghum (Sorghum bicolor (L.) Moench) is an important food crop in Kenya as well as scores of
other African and Asian countries. It ranks fifth worldwide in production among cereals and it is
unique in its adaptation to adverse environmental conditions. Anthracnose, caused by
Colletotrichum sublineolum, is one of the destructive fungal diseases of sorghum that cause
extensive annual yield losses. Classical breeding and genetic engineering for traits conferring
tolerance and resistance against fungal pathogens is one of the strategies of boosting production.
Genetic engineering could be used to exploit the natural anti-fungal proteins produced by
saprophytic fungi, such as Trichoderma harzianum. Lytic antifungal proteins, like the chitinases
and chitosanases, degrade chitin and chitosan that are components fungal cell walls. This renders
the cell walls osmotically sensitive and ultimately destroys target fungi. Constitutive expression of
the chitinase (HarChit) and chitosanase (HarCho) genes from T. harzianum in transgenic plants
could confer resistance to fungal diseases. Particle Bombardment and Agrobacterium tumefaciens
were used to genetically transform sorghum lines sampled from Kenya with HarChit and HarCho
genes from T. harzianum. Three stable transgenic lines, KOSA-1, KOSA-2 and KOSA-3,
integrated the two anti-fungal genes were generated from the wild type line KAT 412 through
particle bombardment of immature zygotic embryos. Quantitative RT-PCR analysis of the
transgenic plants revealed that both genes were expressed in the transformants. In planta and ex
planta C. sublineolum infection assays were carried out with 2 weeks old sorghum seedlings to
study the level of disease tolerance by the transgenic and the parent wild type (Wt) lines. The
transgenic line, KOSA-1, was found to be more tolerant to anthracnose than the parent Wt. This is
the first report of successful co-transformation and genetic enhancement of sorghum after
integration of HarChit and HarCho, two economically important anti-fungal genes. Response to
anthracnose was also studied in six Wt sorghum sampled from Kenya: KAT L5, SDSH 513, KAT
412, KAT 487, GBK 0460812, GBK 0460844 and Serena. Qualitative and quantitative rating of the
susceptibility and tolerance of different sorghum genotypes showed that the Kenyan cultivar KAT
L5 was the most tolerant among the lines studied. Quantitative RT-PCR was used to study the
expression of the 2 transgenes, HarChit and HarCho and 4 endogenous pathogenesis-related (PR)
genes: sorghum leucine-rich repeat (SbLRR), sorghum chitinase gene (SbChit), chalcone-like
synthase gene 2 (SbCHS2) and gene 8 (SbCHS8) after infection with C. sublineolum. The fold
change (FC) in the expression of SbLRR, SbChit and SbCHS8 gene were found to be significantly
low in the tolerant KAT L5 but high in the susceptible SDSH 513 after infection with C. sublineolum.
There was a significant difference in expression pattern of the 4 PR-genes in the disease
susceptible and resistant cultivars.

vi
TABLE OF CONTENTS
AUTHORITY................................................................................................................................................................... II
ENGLISH CERTIFICATE .......................................................................................................................................... III
DEDICATION ................................................................................................................................................................IV
SUMMARY...................................................................................................................................................................... V
TABLE OF CONTENTS ...............................................................................................................................................VI
ABBREVIATIONS......................................................................................................................................................VIII
LIST OF FIGURES AND TABLES............................................................................................................................ XII
LIST OF FIGURES ......................................................................................................................................................XII LIST OF TABLES.......................................................................................................................................................XIII
1 INTRODUCTION .................................................................................................................................................... 1
1.1 SORGHUM AND FOOD SECURITY.......................................................................................................................... 1 1.2 ANTHRACNOSE IN SORGHUM............................................................................................................................... 2 1.3 DISEASE RESISTANCE MECHANISMS IN PLANTS ................................................................................................... 5
1.3.1 Sorghum Leucine-Rich Repeat Gene .......................................................................................................... 5 1.3.2 Chitinases and other PR Proteins in Disease Response ............................................................................. 6 1.3.3 Chalcone Synthase Gene Family ................................................................................................................ 7 1.3.4 Anthracnose-Resistance in Sorghum .......................................................................................................... 8
1.4 GENETIC ENGINEERING FOR DISEASES RESISTANCE .......................................................................... 9 1.4.1 Targeting Fungal Cell Wall Polymers ...................................................................................................... 10 1.4.2 Trichoderma Harzianum Chitinases and Disease Resistance .................................................................. 11 1.4.3 Chitosanase in Defence Response............................................................................................................. 13 1.4.4 Co-expression of HarChit and HarCho for Enhanced Defence................................................................ 14 11..44..55 GGeenneettiicc TTrraannssffoorrmmaattiioonn tthhrroouugghh MMiiccrroopprroojjeeccttiillee BBoommbbaarrddmmeenntt ............................................................. 14 11..44..66 TTrraannssffoorrmmaattiioonn wwiitthh AAggrroobbaacctteerriiuumm ttuummeeffaacciieennss..................................................................................... 15 11..44..77 TTiissssuuee CCuullttuurree aanndd TTrraannssffoorrmmaattiioonn ooff SSoorrgghhuumm....................................................................................... 16 11..44..88 TTrraannssffoorrmmaattiioonn ffoorr DDiisseeaassee RReessiissttaannccee .................................................................................................... 17
1.5 RESEARCH GOAL AND OBJECTIVES ....................................................................................................... 18
2 MATERIALS AND METHODS ........................................................................................................................... 19
2.1 MATERIALS ................................................................................................................................................... 19 2.1.1 Laboratory Consumables.......................................................................................................................... 19 2.1.2 Kenyan Sorghum Lines ............................................................................................................................. 19 22..11..33 Agrobacterium tumefaciens Strain............................................................................................................ 20 22..11..44 Colletotrichum sublineolum...................................................................................................................... 20
2.2 METHODS....................................................................................................................................................... 20 2.2.1 Experimental Scope, Design and Statistical Analyses .............................................................................. 20 2.2.2 Cloning of Vectors for Particle Bombardment Transformation ............................................................... 21 2.2.3 Cloning Agrobacterium Transformation Vectors ..................................................................................... 23 2.2.4 Primers ..................................................................................................................................................... 24 2.2.5 Tissue Culture Media................................................................................................................................ 26 22..22..66 MMiiccrrooppaarrttiiccllee BBoommbbaarrddmmeenntt..................................................................................................................... 26 22..22..77 TTrraannssffoorrmmaattiioonn ooff AAggrroobbaacctteerriiuumm ............................................................................................................ 27 2.2.8 Transformation of IZE with Agrobacterium tumefaciens ......................................................................... 28 2.2.9 Tissue Culture of Immature Zygotic Embryos .......................................................................................... 28 2.2.10 Analysis of Genes Integration and Expression ......................................................................................... 29 2.2.11 Colletotrichum sublineolum Infection....................................................................................................... 32 2.2.12 Real Time Quantification of Gene Expression.......................................................................................... 34
33 RREESSUULLTTSS ................................................................................................................................................................ 36
3.1 PARTICLE BOMBARDMENT....................................................................................................................... 36 3.1.1 Sorghum Regeneration through IZE Tissues Culture ............................................................................... 36 3.1.2 Effect of Genotype on Tissue Culture Regeneration ................................................................................. 37 3.1.3 Bombardment Pressure and Transient GUS Activity................................................................................ 38

vii
3.1.4 Effect of Pre-culture on Calli and Regenerants Formation...................................................................... 39 33..11..55 TTrraannssffoorrmmaattiioonn wwiitthh TTaarrggeett GGeenneess ........................................................................................................... 40
3.2 AGROBACTERIUM-MEDIATED TRANSFORMATION............................................................................ 46 3.2.1 Liquid and Solid Phase Agrobacterium Infection ..................................................................................... 47 3.2.2 Effect of the Duration of Agrobacterium Infection ................................................................................... 48 3.2.3 Sorghum Embryos Orientation and Regeneration .................................................................................... 48 3.2.4 Effect of IZE Pre-culture on Mortality and Callus formation................................................................... 49 3.2.5 Co-cultivation Temperature Effect on Callus Formation ......................................................................... 50 3.2.6 MgSO4 Activation and Regeneration Potential......................................................................................... 51 3.2.7 Transient and Stable GUS Activity in Agrobacterium-............................................................................. 51
3.3 RESPONSES TO COLLETOTRICHUM SUBLINEOLUM INFECTION .....................................................52 3.3.1 Ex Planta Infection Responses.................................................................................................................. 52 3.3.2 In planta C. sublineolum Infection Assay ................................................................................................. 56
3.4 REAL TIME QUANTIFICATION OF GENE EXPRESSION........................................................................ 61 3.4.1 Expression of Chitinase and Chitosanase in Transgenic Sorghum .......................................................... 62 3.4.2 Expression of Innate PR-Genes ................................................................................................................ 63 3.4.3 Comparison of In Planta and Ex Planta Gene Expression ....................................................................... 67
4 DISCUSSION.......................................................................................................................................................... 70
4.1 SOMATIC EMBRYOGENESIS AND MICROPARTICLE BOMBARDMENT........................................... 70 4.1.1 Genotypic Variation in Somatic Embryogenesis....................................................................................... 71 4.1.2 Microprojectile Acceleration Pressure ..................................................................................................... 72 4.1.3 Effect of Pre-Culture................................................................................................................................. 74 4.1.4 Putative Transformation ........................................................................................................................... 74 4.1.5 Stable Genetic Transformation ................................................................................................................. 75 4.1.6 Transgenes Integration and Progeny Segregation.................................................................................... 77
4.2 AGROBACTERIUM-MEDIATED TRANSFORMATION............................................................................ 78 4.2.1 Transformation and Tissues Culture Conditions ...................................................................................... 78 4.2.2 Challenges in Agrobacterium-mediated Transformation of Sorghum ...................................................... 82
4.3 RESPONSE OF SORGHUM TO C. SUBLINEOLUM INFECTION ............................................................. 85 4.3.1 Ex Planta Infection Assay ......................................................................................................................... 85 4.3.2 In planta Infection Assay .......................................................................................................................... 86
4.4 REAL TIME EXPRESSION OF PR-GENES .................................................................................................. 88 4.4.1 Expression of Chitosanase and Chitinase................................................................................................. 89 4.4.2 Expression of Innate PR-Genes ................................................................................................................ 90 4.4.3 Expression of SbCHS2 in KOSA-1 and KAT 412 Wt ................................................................................ 90 4.4.4 Expression of SbCHS8 .............................................................................................................................. 91 4.4.5 Endogenous Sorghum Chitinase Gene...................................................................................................... 93 4.4.6 Sorghum Leucine-Rich Repeat.................................................................................................................. 95 4.4.6 Comparison of in planta and ex planta Gene Expression......................................................................... 97
5 CONCLUSION AND OUTLOOK ........................................................................................................................ 99
REFERENCES ............................................................................................................................................................. 101
APPENDICES............................................................................................................................................................... 110
ACKNOWLEDGEMENTS ......................................................................................................................................... 116
CURRICULUM VITAE .............................................................................................................................................. 117

viii
ABBREVIATIONS
aa amino acids
Avr-Gen avirulence gene
BAP 6-benzylaminopurine
cDNA complementary DNA
CaMV cauliflower mosaic virus
CSPD 3-(4-methoxyspiro{1,2-dioxetan-3,2’-(5’chloro) tricyclo [3.3.1.13,7]decan} -4-
yl) phenylphosphate, disodium salt
dATP 2'-deoxyadenosine 5´-triphosphate
dCTP 2'-deoxycytidine 5'-triphosphate
dGTP 2'-deoxyguanosine 5'-triphosphate
dNTP 2´-deoxyribonucleoside 5´-triphosphates
dTTP 2'-deoxythymidine 5'-triphosphate
dUTP 2’-deoxyuridine 5’-triphosphate
2,4-D 2,4-dichlorophenoxyacetic acid
DIG digoxigenin
DMSO dimethylsulfoxide
DNA deoxyribonucleic acid
DNAse deoxyribonuclease
E. coli Escherichia coli
EtBr ethidium bromide
FAO Food and Agriculture Organization of the United Nations
GUS β-Glucuronidase
HPI hours post infection
HR hypersensitive response
ISR induced systemic resistance
JA jasmonic acid
LRR leucine rich repeat
ix
MAR matrix attachment regions
mRNA messenger RNA
NBS nucleotide binding site
nos nopaline synthase
pat-gene phosphinotricin-acetyltransferase gene
PCR polymerase chain reaction
PR-Proteins pathogenesis related proteins
PR-Genes pathogenesis related genes
qRT-PCR quantitative reverse transcription polymerase chain reaction
RNAse ribonuclease
R-Gen resistance gene
RIP ribosome inactivating proteins
ROS reactive oxygen species
RT reverse transcription
SA salicylic acid
SAR systemic acquired resistance
SSC sodiumchloride-sodiumcitrate
SD standard deviation
SE standard error
T0 direct transgenes regenerant
T1 first generation from to self crossing
T2 second generation from T1 self crossing
T3 third generation from T2 self crossing
TBE Tris/Borate/EDTA electrophoresis buffer
ubi1-Promotor ubiquitin1-promotor
uidA, gus-gene β-glucuronidase gene
Wt wild type
X-Gluc 5-bromo-4-chloro-3-indolyl-β-D-glukuronsäure
x
bp base pair
°C degree Celsius
cm centimeter
g gram
h hour
kb kilo basepair
kDa kilo dalton
m meter
M molar
Min minute
mJ millijoule
ml millilitre
mm millimeter
mM millimolar
mmol millimole
ng nanogram
nm nanometer
nM nanomolar
Pa Pascal
p.A. per analyse
pg picogram
psi pound per square inch
µg microgram
µl microliter
µm micrometer
µM micromolar
rpm rounds per minute
sec second
xi
temp. temperature
Tm melting temperature
U unit (restriction enzyme)
UV ultraviolet light
xii
LIST OF FIGURES AND TABLES
LIST OF FIGURES
Figure 1.1. Sorghum leaf anthracnose …………………………………………………………………..….. 4
Figure 1.2. Structural component of fungal cell wall ……………………………………………………… 10
Figure 2.1: pUbiHarChit vector ………………………………………………………………………...……. 21
Figure 2.2: pUbiCho vector …………………………………………………………………………….……. 22
Figure 2.3: pUbiGus vector ……………………………………………………………………………..…… 22
Figure 2.4: p35SAcS vector …………………………………………………………………………….…… 23
Figure 2.5: p7intCho Agrobacterium vector ………………………………………………………..……… 23
Figure 2.6: p7intHarChit Agrobacterium vector ……………………………………………………….…… 24
Figure 3.1: Main stages in sorghum tissue culture …………………………………………………..……. 36
Figure 3.2: Sorghum kernel, seeds colour and phenolics secretion in regeneration media ……..…… 37
Figure 3.3: Transient gus expression in IZE at various bombardment pressures ………………...…… 38
Figure 3.4: Transient gus expression IZE and calli at different bombardment pressure ……………… 39
Figure 3.5: Effect of Pre-Culture on regenerants formation ………………………………………...……. 40
Figure 3.6: Microparticle bombarded IZE and regenerants formed from various sorghum lines …..… 41
Figure 3.7: KOSA-1 BASTA herbicide resistance test in the greenhouse ……………………………… 42
Figure 3.8a: Southern blot analysis of KOSA-1 T0 ………………………………………………...……… 44
Figure 3.8b: Southern blot for gene integration in KOSA-1 T0 and KOSA-1 T1 ………………...……… 44
Figure 3.9: Southern blot for gene integration and inheritance in KOSA-1, 2 and 3 …………..……… 45
Figure 3.10: Southern blot for gene integration and inheritance in KOSA-1 T0-T3 ………………….…. 45
Figure 3.11: qRT-PCR expression of HarChit and HarCho in KOSA-1 T0 ………………………...…… 46
Figure 3.12: Effect of Agrobacterium liquid and solid phase inoculation of KAT 412 IZE …….…….… 47
Figure 3.13: Effect of duration of infection of KAT 412 IZE with Agrobacterium on IZE survival …….. 48
Figure 3.14: Effect of co-cultivation temperature on calli formation after Agrobacterium infection ..… 50
Figure 3.15: Organogenesis and regeneration of sorghum after Agrobacterium infection ………….... 51
Figure 3.16: Transient and stable gus expression in Agrobacterium-infected Aralba IZE ………..….. 52
Figure 3.17: Point and spray infection ……………………………………………………………………… 53
Figure 3.18: Leaf Segment response to infection …………………………………………………………. 54

xiii
Figure 3.19: Ex planta leaf assay ……………………………………………………………………..…….. 54
Figure 3.20: Cultivars comparison of ex planta response …………………………………………..…… 55
Figure 3.21: In planta sorghum infection experiment …………………………………………………….. 57
Figure 3.22: In planta infection response in transgenic and Kenya cultivars ………………………….. 58
Figure 3.23: Seedlings response to C. sublineolum infection …………………………………….……… 59
Figure 3.24: Symptoms development after C. sublineolum infection …………………………………… 60
Figure 3.25: Expression of HarChit and HarCho after C. sublineolum infection ………………….…… 62
Figure 3.26: Expression of SbCHS2 in KOSA-1 T1 and KAT 412 Wt ……………………………...…… 64
Figure 3.27: Expression of SbChit in sorghum 0-144 hours after infection with C. sublineolum ...….. 65
Figure 3.28: Expression of SbCHS8 in KAT 412, KOSA-1 T1, KAT L5 and SDSH ………………..….. 66
Figure 3.29: Expression SbLRR in Sorghum after infection with C. sublineolum ……………………….67
Figure 3.30: Comparison of in planta and ex planta genes expression assays ……………………….. 69
LIST OF TABLES
Table 2.1: qRT-PCR Primers ………………..………………..………………..……………….……...…… 26
Table 3.1: Sorghum cultivars and regenerants formation ……………..………………..…………..……. 38
Table 3.2: Putative and stable transformation frequency of sorghum cultivars ………………...……… 42
Table 3.3: Segregation of T1 Progeny of the transgenic sorghum lines - KOSA-1 ………………...….. 43
Table 3.4: Effect of IZE abaxial and adaxial co-cultivation with Agrobacterium ……………………….. 49
Table 3.5: Effect of Pre-culture on calli formation after Agrobacterium transformation ……………….. 50
Table 3.6: Anthracnose Symptoms in the transgenic and wild type KAT 412 …………………...…….. 56
INTRODUCTION
1
1 INTRODUCTION
1.1 SORGHUM AND FOOD SECURITY
According to a UN estimate the world population will likely rise to 9.2 billion by 2050 (UN,
2007). The challenge of feeding the world through the next decades brings into focus the
importance of sustainable food supply. This challenge is exemplified by the chronic
incidences of food shortages around the world (FAO, 2005). Food insecurity is exacerbated
by rapid rise in food prices together with challenges such as climate change, greater demand
for food products in emerging economies, agricultural production used for biofuels, rapid
population growth, urbanization and animal and plant diseases (FAO, 2008). Poor
agricultural practises such as over-tillage, dependence on unreliable precipitation, use of
poor seeds, over/under soil fertilization, among others has further compounded this problem
(FAO, 2008). Sub-Saharan Africa could have a shortfall of nearly 90 Mt of cereals by the
year 2025 if the current agricultural practices are maintained (Thomson, 2008). The
unprecedented hike in food prices, which rose by 52% between 2007 and 2008, potents
severe economic, social and political consequences (FAO, 2008).
A multi-faceted approach to boost and sustain food production into the next decades will
have to integrate both classical and innovative technologies in crop husbandry. Biotic and
abiotic factors that limit food production will have to be tackled. It is also inevitable that food
production will have to be expanded into hitherto underutilised and marginal arid and semi-
arid lands (ASAL). Crops and cultivars that exhibit biotic and abiotic stress tolerance
prevalent in ASALs would form the frontline of concerted greening of such austere marginal
areas. Sorghum (Sorghum bicolor (L.) Moench) is one of the crops that are traditionally
produced in marginal areas, where low soil moisture and high ambient temperatures are the
main limiting abiotic factors (Wenzel and Van Rooyen 2001; Machado et al., 2002;
Gebeyehu et al., 2004; ICRISAT, 2008). The productivity of sorghum in such areas outstrips
those of the main staples such as rice, wheat, barley and maize. Sorghum is a primary
staple in the semiarid tropics of Africa and Asia for over 300 million people (ICRISAT, 2008).
INTRODUCTION
2
Sorghum is a tropical plant belonging to the poaceae family and it is believed to have
originated in northeast Africa, where it was domesticated about 3000-5000 years ago
(Pederson et al., 2003). The main races of cultivated sorghum are bicolor, vulgare,
caudatum, kafir, guinea and durra (Deu et al., 1994). Sorghum ranks fifth among cereals in
world production, which was 57 million tonnes in 2006, with the developing world accounting
for 84% of this total (FAO, 2008). More than 35% of the sorghum produced is directly used
for human consumption (Awika and Rooney, 2004). The rest is used primarily for animal
feed, production of alcohol and industrial products (Awika and Rooney, 2004). This crop is
even of more critical importance in Africa and Asia where farmers have limited farm inputs, a
plight worsened by insufficient precipitation. In Kenya sorghum provides better food security
in areas where rainfall is limited (KARI, 1996). For example, in Machakos District, which was
hit by a drought in 1996, those who planted sorghum fared better than those who planted
maize (Zea mays) (KARI, 1996). Any intervention that can drastically increase the
productivity of this crop would contribute immensely to food security.
1.2 ANTHRACNOSE IN SORGHUM
Plant diseases and pests limit sorghum productivity. Sorghum plants are attacked by fungal,
bacterial, and viral pathogens causing root, stalk, foliar, panicle, and caryopsis diseases
(Sutton, 1980; Bueso et al., 2000; Waniska, 2001; Waniska et al., 2001; Prom et al., 2005).
Fungi cause many severe diseases, such as root and stalk rot caused by Fusarium
moniliforme, Fusarium thapsinum, or Colletotrichum spp, seedling diseases induced by
Pythium sp., foliar disease such as leaf blight, caused by Exserohilum turcicum, zonate leaf
spot by Glococercospora sorghi, sooty stripe by Ramulispora sorghi, rust by Puccinia
purpurea, Ergot by Claviceps sorghi and head smut by Sporisorium reilianum, respectively
(Waniska et al., 2001; Prom et al., 2005).
One of the diseases of great economic significance is anthracnose caused by Colletotrichum
sublineolum (Sutton, 1980; Hammer et al., 1988; Nicholson and Epstein, 1991).
INTRODUCTION
3
Anthracnose is associated with black, sunken lenticular symptoms on the infected organs of
host species (Nicholson and Epstein, 1991). Sorghum anthracnose was first reported in
1902 in Togo, West Africa (Sutton, 1980), and has since been observed in most regions
worldwide, where sorghum is grown. This disease is coupled with great loses in tropical belts
where high humidity and temperature is conducive for C. sublineolum growth, propagules
dispersal and sporulation (Tarr, 1962; Pastor-Corrales and Frederiksen, 1980). Severe
sorghum infection retards plant growth or causes death prior to maturity. Ali and Warren
(1987) reported sorghum grain yield losses due to foliar infection of 30% for a susceptible
cultivar when inoculated with a virulent isolate of the pathogen. Reduction in yields of up to
50% has also been reported in warm and humid areas where grain yields from susceptible
cultivars are greatly reduced during severe epidemics (Tarr, 1962; Harris and Cunfer, 1976;
Pastor-Corrales and Frederiksen, 1980). Grain yield losses from 41-67% for a susceptible
cultivar from natural infection of foliar tissue were reported in Mali (Thomas et al., 1996).
Apart from anthracnose, Colletotrichum species also cause damping-off, blight and spot
disease on infected plants (Nicholson and Epstein, 1991).
C. sublineolum is a hemibiotroph whose pathogenesis strategy commences from a transient
post-penetrative asymptomatic biotrophy that is rapidly succeeded by a phase of destructive
necrotrophy culminating in the appearance of symptoms of disease and production of
conidiomata of the pathogen (Pastor-Corrales and Frederiksen, 1980). The pathogen is
capable of infecting all above ground tissues of the sorghum plant. Anthracnose in sorghum
is commonly divided into three categories based on where symptoms develop on the plant:
leaf, stalk, panicle and grain anthracnose (Frederiksen, 1984). Primary infection occurs
when conidia are windblown or splashed from debris. Conidia germinate and infection
occurs directly through the epidermis or stomata (Hamer et al., 1988; Nicholson and Epstein,
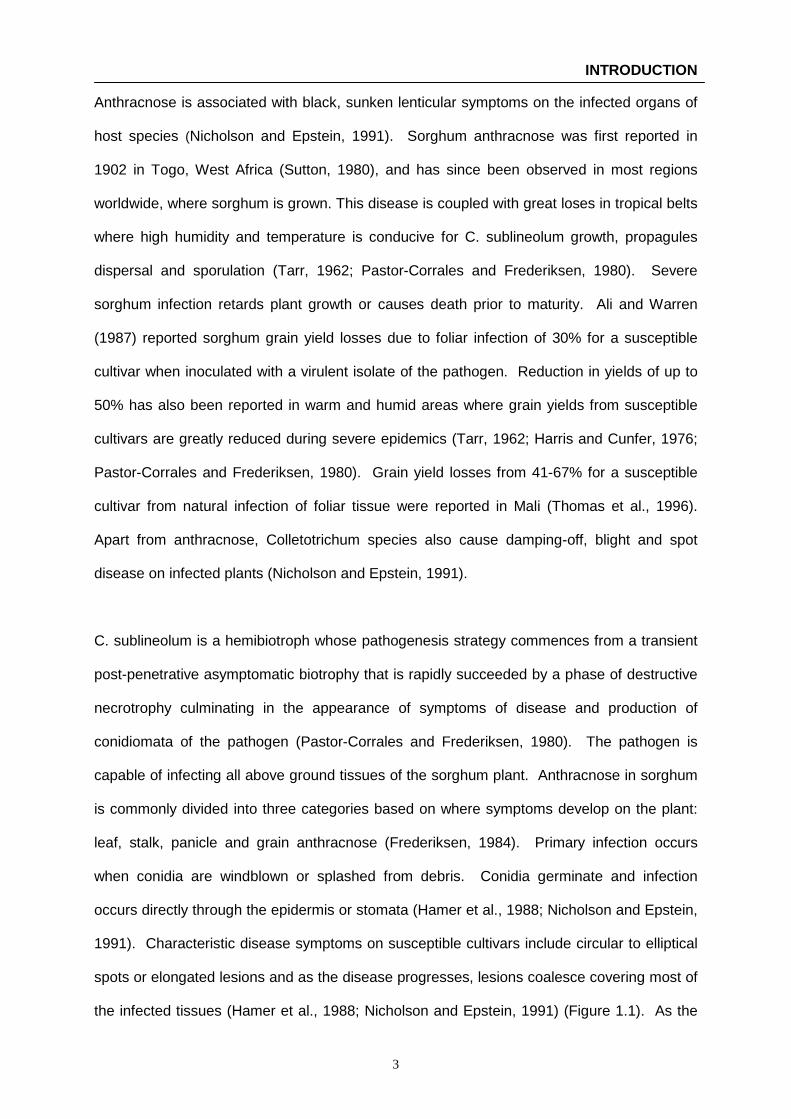
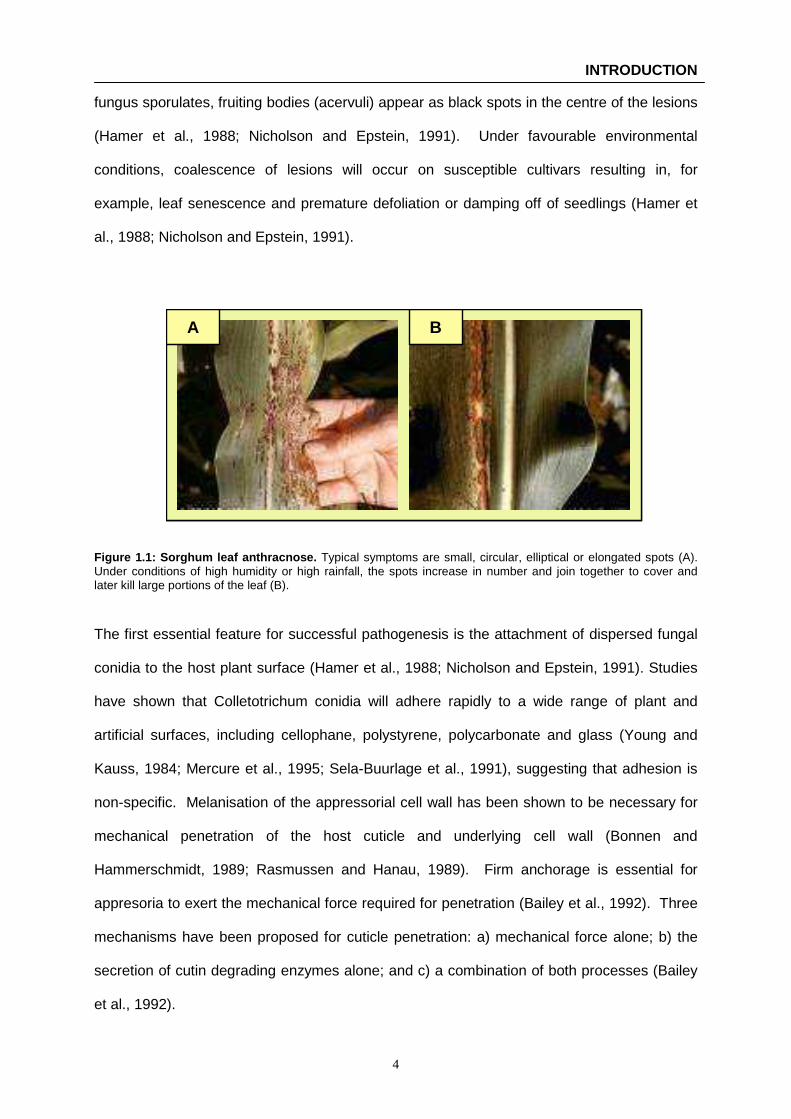
1991). Characteristic disease symptoms on susceptible cultivars include circular to elliptical
spots or elongated lesions and as the disease progresses, lesions coalesce covering most of
the infected tissues (Hamer et al., 1988; Nicholson and Epstein, 1991) (Figure 1.1). As the
INTRODUCTION
4
fungus sporulates, fruiting bodies (acervuli) appear as black spots in the centre of the lesions
(Hamer et al., 1988; Nicholson and Epstein, 1991). Under favourable environmental
conditions, coalescence of lesions will occur on susceptible cultivars resulting in, for
example, leaf senescence and premature defoliation or damping off of seedlings (Hamer et
al., 1988; Nicholson and Epstein, 1991).
Figure 1.1: Sorghum leaf anthracnose. Typical symptoms are small, circular, elliptical or elongated spots (A). Under conditions of high humidity or high rainfall, the spots increase in number and join together to cover and later kill large portions of the leaf (B).
The first essential feature for successful pathogenesis is the attachment of dispersed fungal
conidia to the host plant surface (Hamer et al., 1988; Nicholson and Epstein, 1991). Studies
have shown that Colletotrichum conidia will adhere rapidly to a wide range of plant and
artificial surfaces, including cellophane, polystyrene, polycarbonate and glass (Young and
Kauss, 1984; Mercure et al., 1995; Sela-Buurlage et al., 1991), suggesting that adhesion is
non-specific. Melanisation of the appressorial cell wall has been shown to be necessary for
mechanical penetration of the host cuticle and underlying cell wall (Bonnen and
Hammerschmidt, 1989; Rasmussen and Hanau, 1989). Firm anchorage is essential for
appresoria to exert the mechanical force required for penetration (Bailey et al., 1992). Three
mechanisms have been proposed for cuticle penetration: a) mechanical force alone; b) the
secretion of cutin degrading enzymes alone; and c) a combination of both processes (Bailey
et al., 1992).
A BA B

INTRODUCTION
5
To resist C. sublineolum and other fungal pathogen infection, sorghum possesses physical
and physiological mechanisms that limit conidia attachment, penetration and spread into
surrounding tissues.
1.3 DISEASE RESISTANCE MECHANISMS IN PLANTS
Plants carry a surveillance system to recognize attacking microorganisms and to induce
effective defence mechanisms (Dangl and Jones, 2001; Jones and Dangl, 2006).
Resistance is often controlled by a gene-for-gene interaction between plant resistance (R)
and pathogen avirulence (avr) genes (Hammond-Kosack and Jones, 1997; Dangl and Jones,
2001; Jones and Dangl, 2006). Recognition of pathogen Avr-genes products by the plants
R-genes coded surveillance proteins leads to activation of the hypersensitive response (HR),
a type of programmed cell death (PCD) that occurs at or near the site of pathogen entry
(Morel and Dangl, 1999; Heath, 2000). The HR is thought to confine the pathogen by
stopping its spread from the site of attempted infection, and is likely to involve active plant
metabolism (Levine et al., 1996). R-gene mediated resistance is also associated with the
activation of a salicylic acid (SA)-dependent signalling pathway that leads to the expression
of certain pathogenesis related (PR) proteins, which are thought to contribute to establishing
resistance (Saskia et al., 2000). Genetic analysis of the HR has led to the cloning of R-
genes, many of which encode receptor-like proteins (Bent, 1996).
1.3.1 Sorghum Leucine-Rich Repeat Gene
Many R-genes-encoded R-proteins are composed of three major structural features: a
nucleotide binding site (NBS), a leucine-rich repeat (LRR) domain and either a coiled-coil
(CC) or a Toll-interleukin receptor (TIR) domain at their N-termini (Dangl and Jones, 2001).
The CC, TIR, and NBS domains are known to play roles in protein-protein interactions and
signal transduction (Srinivasula et al., 1998; Kopp and Medzhitov, 1999; Burkhard et al.,
2001). LRR domains in R-proteins mediate direct or indirect interaction with pathogen

INTRODUCTION
6
molecules (Jia et al., 2000; Dangl and Jones, 2001). Individual LRR form repeats of β-strand-
loop and α-helix-loop units and compose a binding surface predicted to be involved in protein
recognition (Kobe and Kajava, 2001). The β-sheets may interact with pathogen ligands and
hence determine specificity for pathogen elicitors (Thomas et al., 1997; Ellis and Jones 1999;
Ellis et al., 2000). Regulation of genes encoding putative LRR proteins has been studied in
sorghum (Salzman et al., 2005). A sorghum LRR strongly induced by SA, among other
signalling compounds has been described (Salzman et al., 2005). The NBS-LRR gene
family is involved in response to fungal infection (Salzman et al., 2005). Expression of
sorghum LRR (SbLRR) is strongly induced by SA and jasmonic acid (JA), the key signals in
the induction of the systemic acquired resistance (SAR) (Salzman et al., 2005). It is
therefore evident that evaluation of the expression pattern of SbLRR in transgenic, resistant
and susceptible lines could be insightful in understanding the mechanisms of response of
sorghum to pathogen invasion. Understanding the timing of SbLRR activity in response to
pathogen attack could be important in elucidating tolerance.
1.3.2 Chitinases and other PR Proteins in Disease R esponse
Sorghum has other innate response mechanisms against pathogens that involve PR-
proteins. These involve the inducible plant defences that restrict the spread of the pathogen
in incompatible interactions and allow the establishment of SAR (Cao et al., 1998; Saskia et
al., 2000). Many members of this group of proteins have in vitro antifungal activity and
selectively target cellular components of the pathogen. Included in this group are chitinases
and β-1,3-glucanases, which attack the cell walls of fungi, and thaumatin-like proteins (TLP)
that affect the permeability of fungal membranes (Linthorst, 1991; Cao et al., 1998; Waniska
et al., 2001). Recent studies have shown that PR-proteins such as sormatin, chitinases,
glucanases, and ribosome-inhibiting protein may play a role in disease resistance in sorghum
(Rodriguez-Herrera, 1999; Rodriguez-Herrera et al., 1999; Bueso et al., 2000). Similar
activitiy have been noted in other cereals. For example, a coordinated induction of the

INTRODUCTION
7
expression of 3 chitinase isoforms was observed in maize seeds in response to infection by
the fungus Fusarium moniliforme (Cordero et al., 1994). Several chitinases (three in the 21-
24 kDa range; 28 kDa 30 kDa) have been reported in sorghum (Darnetty, 1993). The level of
these chitinases were noted to rise during caryopsis development, however their antifungal
activities was not confirmed (Darnetty, 1993). However, chitinase is known to be involved in
resistance to plant diseases (Rodriguez-Herrera, 1999; Rodriguez-Herrera et al., 1999;
Bueso et al., 2000)
1.3.3 Chalcone Synthase Gene Family
Sorghum synthesizes a unique class of flavonoid phytoalexins, the 3-deoxyanthocyanidins,
as an essential component of defence mechanism against pathogen infection (Lo et al.,
2002). In sorghum, accumulation of 3-deoxyanthocyanidins is preceded by accumulation of
transcripts encoding chalcone synthase (CHS), a key enzyme in flavonoid biosynthesis (Lo
et al., 2002). CHS, or naringenin CHS, is a plant specific polyketide synthase that catalyzes
the condensation of three units of malonyl-CoA with p-coumaroyl-CoA to form naringenin
chalcone (Lo et al., 2002). This reaction is generally regarded as the committed step leading
to the synthesis of different flavonoid compounds (Lo et al., 2002). In higher plants, CHS is
encoded by a family of genes. A family of 8 CHS genes, SbCHS1 to SbCHS8, has been
described in sorghum (Lo et al., 2002). SbCHS1 to SbCHS7 are highly conserved and
closely related to the maize C2 and Whip genes encoding CHS enzymes (Lo et al., 2002). It
has been shown that SbCHS2, a member of the SbCHS1-7 family, encodes a typical CHS
that synthesizes naringenin chalcone, which is necessary for the formation of different
flavonoid metabolites (Lo et al., 2002). On the other hand, SbCHS8, re-termed SbSTS1,
encoded an enzyme with stilbene synthase activity, suggesting that sorghum accumulate
stilbene-derived defence metabolites in addition to the well-characterized 3-
deoxyanthocyanin phytoalexins. SbCHS8 is only 81-82% identical to SbCHS1 to SbCHS7 at
the amino acid level and appears to be more distantly related as revealed by phylogenic
analysis (Lo et al., 2002). It was later demonstrated that SbCHS8 , retermed SbSTS1, is not

INTRODUCTION
8
involved in flavonoid biosynthesis in planta, instead synthesized pinosylvin and resveratrol as
major products in vitro using cinnamoyl and p-coumaroyl-CoA as starter molecules,
respectively (Yu et al., 2005). SbCHS8 is considered not to be constitutively expressed but
inducible following fungal inoculation. Differential expression of SbSTS1 in resistant and
susceptible sorghum lines suggested that the gene plays a key role in the expression of
resistance against C. sublineolum (Yu et al., 2005). Therefore, SbCHS1-7 and SbCHS8
represent a chalcone synthase gene family that are expressed differently during infection (Yu
et al., 2005). SbCHS1-7, such as SbCHS2 are generally expressed upon non-specific
elicitation while SbCHS8 seems to be active in response to fungal attack (Yu et al., 2005). It
is therefore expected that a variation exists in the expression of these genes in sorghum
cultivars that are susceptible and tolerant to anthracnose.
1.3.4 Anthracnose-Resistance in Sorghum
Resistance of plants to pathogen is based upon physical factors such as mechanical strength
of the cuticle, epidermal wall and the resistance of their structural polymers to enzymatic
degradation, surface features (e.g. topography, leaf hairs, and epicuticular waxes) that
impede the formation of infection structures; structural barriers such as papillae that delay
penetration; and secondary metabolites that are toxic or otherwise inhibitory to fungal growth
(Heath, 1981). These physical barriers represent the first line of defence to fungal pathogens
and some may contribute to tolerance to Colletotrichum spp (Mercer et al., 1975). Juvenile
sorghum plants rarely exhibit visible symptoms of infection when challenged with fungal
pathogens such as C. sublineolum (Nicholson, 1988). This apparent expression of resistance
has been attributed to the presence of substantial levels of the preformed cyanogenic
glycoside, dhurrin, in juvenile sorghum leaves (Ferreira and Warren, 1982). However, studies
have shown that fungal pathogens, including C. sublineolum, can detoxify hydrogen cyanide,
which is the toxic breakdown product of dhurrin (Fry and Munch, 1975; Fry and Evans, 1977;
Myers and Fry, 1978).
INTRODUCTION
9
It has been shown that young sorghum leaves accumulate a complex of phenols in response
to invasion by both pathogenic and non-pathogenic fungi, and the five major components of
this complex are the 3-deoxyanthocyanidin flavonoids: apigeninidin, luteolinidin, arabinosyl-
5-O-apigeninidin, 7-methylapigeninidin, and 5-methoxyluteolinidin (Nicholson et al., 1988;
Hipskind et al., 1990; Lo et al., 1996). All these compounds have exhibited fungitoxic activity
towards C. sublineolum, and are considered to be phytoalexins (Nicholson et al., 1988). In
leaf tissue, these phenolics first appear in the cell being invaded, accumulating in inclusions
in the cytoplasm (Snyder & Nicholson, 1990; Snyder et al., 1991). These cytoplasmic
inclusions migrate to the site of penetration, become pigmented, lose their spherical shape
and ultimately release their contents into the cytoplasm, killing the cell and restricting further
pathogen development (Snyder & Nicholson, 1990; Snyder et al., 1991).
Unfortunately, the action of the innate defence machinery does not give sorghum total
protection and fungal diseases continue to reduce its global productivity. Genetic
engineering offers an opportunity for enhancing disease tolerance by introducing traits that
limit pathogens ingression.
1.4 GENETIC ENGINEERING FOR DISEASES RESISTANCE
There are a number of options that could be exploited to control plant diseases. These
include: use of fungicides, cultural methods (good crop husbandry, e.g. crop rotation),
cultivation of resistant/tolerant cultivars and bio-control. The toxicity, environmental harm
and expense that come with fungicides, decry their use. Breeding of resistant/tolerant
cultivars is a sustainable approach to tackling disease menace. Genetic engineering offers
an alternative avenue of increasing the array of traits that could infer anthracnose tolerance.
Genes encoding fungitoxic and fungistatic protein could be cloned from a variety of sources
and introduced into susceptible crops.

INTRODUCTION
10
1.4.1 Targeting Fungal Cell Wall Polymers
One of the principles of action of fungitoxic proteins that could be harnessed in genetic
engineering is their lytic action on chitin and chitosan. Chitin and chitosan are structural
polymers found in the cell wall of various organisms, especially fungi and arthropods
(Hendrix and Stewart, 2002; Steyaert et al., 2004). Chitin is generally distributed in fungi,
occurring in basidiomycetes, ascomycetes and phycomycetes, where it is a major
component of the cell walls and structural membranes of mycelia, stalks and spores (Hendrix
and Stewart, 2002; Steyaert et al., 2004) (Figure 1.2). Chitinases endolytically hydrolyse the
β-1,4-linkages of chitin (Cabib, 1987; Hendrix and Stewart, 2002; Steyaert et al., 2004).
These enzymes are widely distributed in nature including plants (Chen et al., 1982; Jones et
al., 1986). Chitinases play a defensive role against fungal pathogens in plants (Bartnicki-
Garcia, 1968; Collinge et al., 1993). In fungi, chitinases seem to play a morphogenetic role
during apical growth, cell division and differentiation, as well as a nutritional role related to
those species saprophytic and mycoparasitic in fungi (Papavizas, 1985; Cabib, 1987;
Kuranda and Robin, 1991).
Figure 1.2: Structural component of fungal cell wall . Potential targets of action by cell wall-lysis enzymes are indicated (GPI – glycophosphatidylinositol).

INTRODUCTION
11
Due to the interest generated from their lytic action against fungal cell wall, a number of
genes encoding chitinases have been isolated, sequenced and cloned. Genes encoding
chitinases have been cloned from bacteria (Jones et al., 1986; Watanabe et al., 1990; 1992),
yeast (Kuranda and Robbins, 1991), plants (Collinge et al., 1993) and filamentous fungi,
such as Rhizopus oligosporus (Yanai et al., 1992) and Aphanocladium album (Blaisean and
Lafay, 1992). A cloned chitinase gene from Serratia marcescence, when introduced into the
Trichoderma harzianum genome, gave rise to transformants having remarkable advantage in
controlling Sclerotium rolfsii compared to wild type (Chet et al., 1993). Cosmids which carry
chitinase genes from S. marcescence were mobilised into Pseudomonas strains which
inhibited growth of Rhizoctonia solani and Magnaporte grisea and reduced disease induced
by Fusarium oxysporium (Sundheim, 1992).
1.4.2 Trichoderma Harzianum Chitinases and Disease Resistance
Nature offers a great opportunity for fungal diseases control through the existence of
saprophytic fungi, group of fungi that parasitizes others as a source of nutrition. Trichoderma
harzianum, a soil-borne fungus known to be a control agent of fungal plant pathogens
(Papavizas, 1985), is one of these fungi that produce degrading enzymes which destroy key
cell wall structural polymers of fungal pathogens (Hendrix and Stewart, 2002). The
degradation and further assimilation of phytopathogenic fungi, namely mycoparasitism, has
been proposed as the mechanism accounting for the antagonistic action of Trichoderma spp
(Sundheim, 1992; Garcia et al., 1994; Steyaert et al, 2004). Trichoderma spp are biocontrol
agents of many economically important pathogens, such as species of Botrytis, Rhizoctonia
and Sclerotina (Sundheim, 1992; Lorito, 1998; Steyaert et al, 2004). A majority of the
biocontrol agents currently used are isolates of T. harzianum or T. atroviride, from which 16
genes implicated in mycoparasitism have been sequenced (Kubicek and Penttila, 1998;
Lorito, 1998; Cohen-Kupiec et al., 1999; Donzelli et al., 2001). Biocontrol activity of
Trichoderma spp is attributed to 5-7 distinct enzymes (Haran et al., 1995). In the best
characterized Trichoderma spp. isolate (isolate TM), the system is apparently composed of 2

INTRODUCTION
12
β-(1,4)-N-acetylglucosaminedases (102 and 73 kDa) and 4 endochitinases (52, 42, 33 and
31 kDa) (Haran et al., 1995). The most interesting individual enzyme of the complex is the
42 kDa endochitinase, which can hydrolyze Botrytis cinerea cell wall in vitro and inhibit
spores germination and germ tube elongation of various fungi (Lorito et al., 1998; Lorito et
al., 1994, Schirmböck et al., 1994). Chitinases represent therefore one of the key groups of
enzymes involved in mycoparasitism (Chérif and Benhaman, 1990; Ridout et al., 1986).
The purified enzymes from T. harzianum are strong inhibitors of many important plant
pathogens and are also able to lyse not only the ´soft´ structures of the hyphal tip but also
the ´hard´ chitin wall of mature hyphae, conidia, chlamydospores and sclerotia (Lorito et al.,
1998). They are substantially more chitinolytic and glucanolytic than the enzymes from other
known sources (i.e. up to 100 times more active than the corresponding plant enzymes and
effective on a much wider range of pathogens) (Lorito et al., 1994; Lorito et al., 1996). They
are also non toxic to plants even at high concentration (Carsolio et al., 1998). Furthermore,
the anti-fungal activity is synergistically enhanced when different Trichoderma cell wall
degrading enzymes are used together or in combination with plant PR-proteins, commercial
fungicides, cell membrane-affecting toxins or biocontrol bacteria (Lorito et al., 1998; Steyaert
et al., 2004).
Chitinase genes have been cloned and their products used in bioassays for their
effectiveness against a number of fungi (Lorito et al., 1993; Lorito et al., 1994; Schirmböck et
al., 1994). In planta studies have demonstrated that chitinases are effective against many
economically important plant pathogens. A chitinase from T. harzianum was cloned in E. coli
and a significant suppression of disease caused by S. rolfsii was detected when irrigating
with engineered E. coli (Chet et al., 1993).
The interest in the chitinase genes is not only based on their potential application as
antifungal agents but also because chitinase genes of mycoparasitic fungi are excellent
INTRODUCTION
13
candidates for reinforcing plant defences through genetic engineering. Subsequently a
cDNA (named Chit42) of T. harzianum, coding for an endochitinases of 42 kDa was cloned
(Garcia et al., 1994). The cDNA codes for a protein of 423 amino acids. Disease resistance
in transgenic tobacco and potato plants was improved by the insertion of the 42 kDa
endochitinase from T. harzianum (Lorito et al., 1998). Selected transgenic lines were highly
tolerant or completely resistant to the foliar pathogen Altenaria alternate, A. solani, Botrytis
cinerea, and the soil-borne pathogen Rhizoctonia solani (Lorito et al., 1998). It was also
found that introduction of multiple copies of the 33 kDa endochitinase in T. harzianum
resulted in increased biocontrol ability (Dana et al., 2001). Based on these proofs of activity,
42 kDa endochitinase from T. harzianum (HarChit) was cloned and used in the
transformation of sorghum in this research.
1.4.3 Chitosanase in Defence Response
Chitosanases have the potential of slowing or preventing fungal infection by degrading the
structural chitosan found in the cell wall of many fungi (Hendrix and Stewart, 2002).
Chitosanase is an enzyme similar to chitinase, capable of hydrolyzing the β-1,4-linkages
between N-acetyl-D-glucosamine and D-glucosamine residues in a partially acetylated fungal
cell wall polymer (Hendrix and Stewart, 2002).
Glucosamine oligomers, released from fungal cell walls after hydrolysis with chitinase or
chitosanase, are elicitors of plant defence response such as stomata closure (Lee et al.,
1999) and cell wall lignifications (Vander et al., 1998). The response elicited by these
molecules depends on the length and degree of acetylation of the oligomers released
(Vander et al., 1998). Long oligomers or intact fungal cell walls will cause little or no
reactions whereas oligomers that are relatively short (e.g. products of chitosanase
hydrolysis) are aaccttiivvee eelliicciittoorrss ooff ppllaanntt ddeeffeennccee ssyysstteemmss ((Vander et al., 1998)..

INTRODUCTION
14
MMaannyy ppllaannttss hhaavvee bbeeeenn ttrraannssffoorrmmeedd wwiitthh cchhiittiinnaassee ggeenneess iinn aann eeffffoorrtt ttoo iimmpprroovvee ppllaanntt ffuunnggaall
rreessiissttaannccee ((PPuunnjjaa,, 22000011)).. HHoowweevveerr,, ffeewweerr eeffffoorrttss hhaavvee bbeeeenn mmaaddee ttoowwaarrddss ttrraannssffoorrmmaattiioonn ooff
ppllaannttss wwiitthh cchhiittoossaannaassee ggeenneess ((HHeennddrriixx aanndd SStteewwaarrtt)).. AA cchhiittoossaannaassee ggeennee ffrroomm
PPaaeenniibbaacciilllluuss sspp 6611772244 wwaass cclloonneedd aanndd mmooddiiffiieedd ffoorr ppllaanntt eexxpprreessssiioonn aanndd uusseedd ffoorr ttoobbaaccccoo
lleeaaff ddiisskk ttrraannssffoorrmmaattiioonn ((HHeennddrriixx eett aall..,, 22000011;; HHeennddrriixx aanndd SStteewwaarrtt,, 22000022)).. IItt wwaass
ddeemmoonnssttrraatteedd tthhaatt tthhee cchhiittoossaannaassee ggeennee eexxpprreessssiinngg ttrraannssggeenniicc ttoobbaaccccoo lliinneess wweerree aabbllee ttoo
aaccttiivvaattee ggeenneerraall iinnnnaattee ddeeffeennccee mmeecchhaanniissmmss ffaasstteerr tthhaann tthhee wwiilldd ttyyppee ppllaannttss ((HHeennddrriixx aanndd
SStteewwaarrtt,, 22000022))..
1.4.4 Co-expression of HarChit and HarCho for Enhanced Defence
PPllaanntt ddeeffeennccee ssyysstteemm aaggaaiinnsstt mmiiccrroobbiiaall ppaatthhooggeennss ccoouulldd bbee bboollsstteerreedd tthhrroouugghh iinnttrroodduuccttiioonn
aanndd ccoonnssttiittuuttiivvee eexxpprreessssiioonn ooff ggeenneess ccooddiinngg ffoorr aannttii--mmiiccrroobbiiaall ccoommppoouunnddss ssuucchh aass cchhiittiinnaasseess
aanndd cchhiittoossaannaasseess.. IItt iiss aallssoo ppllaauussiibbllee tthhaatt cchhiittiinnaasseess aanndd cchhiittoossaannaasseess ccoouulldd iinnddeeppeennddeennttllyy
aanndd ssyynneerrggiissttiiccaallllyy bboooosstt ppllaanntt ddeeffeenncceess aaggaaiinnsstt ffuunnggaall ppaatthhooggeennss.. CCoo--eexxpprreessssiioonn ooff
cchhiittiinnaassee aanndd cchhiittoossaannaassee ggeenneess ffrroomm TT.. hhaarrzziiaannuumm ccoouulldd tthheerreeffoorree rreessuulltt iinn aa ssyynneerrggiissttiicc
eennhhaanncceemmeenntt ooff aannttii--ffuunnggaall aaccttiivviittyy.. IInn tthhee pprreesseenntteedd iinnvveessttiiggaattiioonn ssoorrgghhuumm wwaass ggeenneettiiccaallllyy
ttrraannssffoorrmmeedd wwiitthh ttwwoo ggeenneess iissoollaatteedd ffrroomm TT.. hhaarrzziiaannuumm:: tthhee cchhiittiinnaassee ((HHaarrCChhiitt)) aanndd tthhee
cchhiittoossaannaassee ((HHaarrCChhoo)) ggeenneess,, aass aa mmeeaannss ooff ddeevveellooppiinngg ddiisseeaassee ttoolleerraanntt ttrraannssggeenniicc ssoorrgghhuumm
lliinneess..
11..44..55 GGeenneett iicc TTrraannssffoorrmmaatt iioonn tthhrroouugghh MMiiccrroopprroojjeecctt ii llee BBoommbbaarrddmmeenntt
Two methods of genetic transformation, microprojectile bombardment and Agrobacterium
mediated transformation are commonly used to deliver exogenous nucleic acid into plants
cells to produce transgenic plants. Particle bombardment involves the use of a mechanical
devise to deliver genes into plants. Micron-sized metal particles are coated with DNA and
accelerated into target cells at velocities sufficient to penetrate the cell wall but below that
which will cause lethal damage. In this manner, desired DNA can be transported into the

INTRODUCTION
15
cell’s interior where it becomes detached from the microprojectile and integrates into the
genome.
Normally, the genes are cloned into appropriate plasmids, loaded onto a macrocarrier and
accelerated into embryogenic tissue that is thereafter cultured to generate transgenic plants.
Several of the major cereal crops including rice (Hies et al., 1994), maize (Ishida et al.,
1996), barley (Tingay et al., 1997), wheat (Cheng et al., 1997) and creeping beatgrass (Yu et
al., 2001) have been genetically transformed (Repellin et al., 2001). However, fewer
successes have been achieved in sorghum transformation. There are fewer reports of
successful transformation of this crop than other cereals (Battraw and Hall, 1991; Casas et
al., 1993, 1997; Goodwin and Chiwamba, 1994; Zhu et al., 1998; Zhao et al., 2000; Able et
al., 2001). Most of these studies have involved only marker genes and did not include genes
of agronomical importance. No commercial transgenic sorghum product has so far reached
the consumer market.
11..44..66 TTrraannssffoorrmmaatt iioonn wwii tthh AAggrroobbaacctteerriiuumm ttuummeeffaacciieennss
About a century after its discovery as the causative agent of crown gall disease (Smith and
Townsend, 1907), the Gram-negative soil borne phytopathogen Agrobacterium tumefaciens
is still central in plant genetic engineering (Tzfira and Citovsky, 2002; Gelvin, 2000). The
molecular basis of genetic transformation of plant cells by Agrobacterium is the transfer and
integration of a region of a large tumour-inducing (Ti) or rhizogenic (Ri) plasmid resident in
this bacterium into the plant nuclear genome. The size of the Ti plasmid ranges from 200 to
800 kbp (De Vos et al., 1981; Fortin et al., 1993; Gerard et al., 1992; Unger et al., 1985;
Wood et al., 2001). The transferred DNA (T-DNA) is approximately 10-30 kbp in size (Baker
et al., 1983; Byrne et al., 1983; Lemmers et al., 1980; Suzuki et al., 2000; Zambryski et al.,
1980).

INTRODUCTION
16
The molecular machinery needed for T-DNA production and transport into the host cell
comprises proteins that are encoded by a set of bacterial chromosomal (chv) and Ti-plasmid
virulence (vir) genes and a type IV secretion system (T4SS) (Garfinkel et al., 1980;
Hooykaas et al., 1984; Horsch et al., 1990; Lundquist et al., 1984; Stam et al., 1997), a
process that resembles DNA transfer between bacteria during conjugation. In addition,
various host proteins have been reported to participate in Agrobacterium mediated
transformation (Tzfira and Citovsky, 2002; Gelvin, 2003), mostly during the later stages of the
process (i.e. T-DNA intracellular transport, nuclear import and integration).
In nature, the T-DNA carries a set of oncogenes (Gandin et al., 1994) and opine-catabolism
genes whose expression in the plant cells leads to neoplastic growth of the transformed
tissue and the production of opines, amino acid derivatives used almost exclusively by the
bacteria as a carbon and nitrogen source. Recombinant Agrobacterium strains in which the
native T-DNA has been replaced with genes of interest, are the most efficient vehicles used
for the introduction of foreign genes for the production of transgenic plants (Draper et al.,
1988). Many crops have been successfully transformed with this bacterium. The first
transgenic sorghum plant produced by Agrobacterium mediated transformation was reported
by Zhao et al. (2000).
11..44..77 TTiissssuuee CCuull ttuurree aanndd TTrraannssffoorrmmaatt iioonn ooff SSoorrgghhuumm
Identification of appropriate explants and development of a prolific tissue culture system for
transformation and generation of transgenic plants from transformed tissues is crucial in
genetic engineering. This involves careful choice of totipotent tissues and organs to serve as
explant. A number of explants have been used in sorghum tissue culture. These include
mesophyll protoplast (Sairam et al., 1999), immature zygotic embryos (Gamborg et al., 1977;
Thomas et al., 1977; Dunstan et al., 1978; 1979; Brar et al., 1979; Cai et al., 1987; Ma and
Liang, 1987; Zhang et al., 1998; Oldach et al., 2001; Takashi et al., 2002; Girijashankar et
al., 2005), immature inflorescence (Brettel et al., 1980; Boyes and Vasil, 1984; Cai and
INTRODUCTION
17
Butler, 1990; Keppler and Pederson, 1997), cell suspensions from shoot tip meristem (Mythili
et al., 1999), leaf tips of seedlings (Masteller and Holden, 1970; Brar et al., 1979; Davis and
Kidd, 1980; Smith et al., 1983), leaf fragments (Wernicke and Brettel, 1980), mature embryos
(Thomas et al., 1977; Cai et al., 1987) and anthers (Rose et al., 1986). Immature zygotic
embryos (IZE) have been the explant of choice for the production of transgenic plant (Casas
et al., 1993; Zhu et al., 1998; Zhao et al., 2000; Able et al., 2001; Emani et al., 2002;
Tadesse et al., 2003; Gao et al., 2005). This investigation used IZE as the explant in the
tissue culture.
Sorghum is considered one of the recalcitrant crops to tissue culture, plant regeneration, and
genetic transformation. Recalcitrance in sorghum tissue culture is reportedly due to the
release of phenolics, lack of regeneration in long term in vitro cultures, and a high degree of
genotype dependence. Sorghum tissues are problematic to culture mainly because of the
copious amount of phenolic substances secreted into the culture by its explants (Carvalho et
al., 2004; Casas et al., 1993). Cultured sorghum cells release phenolics into the culture
media whose oxidized products inhibit morphogenesis and growth (Casas et al., 1993). This
problem is even more limiting in the highly pigmented and phenolics-rich sorghum lines.
Sorghum explants are also not responsive to most culture media systems routinely used in
the transformation of crops such as maize, wheat, barley, and tobacco. The release of
phenolics into the culturing medium can be overcome by frequent subculture and by the
addition of polyvinyl pyrrolidone phosphate (PVPP) in the medium. White, cream, brown and
red sorghum with varying reponse in tissue culture were used.
11..44..88 TTrraannssffoorrmmaatt iioonn ffoorr DDiisseeaassee RReessiissttaannccee
Sorghum has been previously transformed with transgenes in an attempt to boost disease
resistance and to introduce other traits of economic importance. Girijashankar et al. (2005)
produced transgenic sorghum plants carrying the synthetic gene “BT cry1Ac” under the
control of a wound inducible promoter from a maize protease inhibitor gene (mpi). Tadesse

INTRODUCTION
18
and Jacob (2003) introduced the dhdps-raec1 mutated gene, which encodes an insensitive
form of dihydropicolinate synthase, the key regulatory enzyme of the lysine pathway.
Overexpression of the gene produced sorghum lines with elevated lysine content. A plant
gene, chiII, encoding rice chitinase under control of the constitutive CaMV 35S promoter,
was transferred to sorghum for resistance to stalk rot (Fusarium thapsinum) by Zhu et al.
(1998) and Krishnaveni et al. (2001). Few reports exist of plant transformation with
chitosanase gene and fewer studies describing its in planta anti-fungal potential (El
Quakfaoui et al., 1995; Hendrix and Stewart, 2002). Tobacco plants were transformed with
the Paenibacillus spp 61724 chitosanase and it was found that the chitosanase expressing
lines were able to activate defence mechanisms faster than was possible in wild type plants
(Hendrix and Stewart, 2002). It was therefore concluded that the enhanced response along
with direct attack on fungus through cell wall degradation would translate into increased plant
fungal resistance (Hendrix and Stewart, 2002). Based on these, this work was designed to
transform sorghum with two genes encoding anti-fungal proteins for disease resistance.
1.5 RESEARCH GOAL AND OBJECTIVES
The goal of this research was to genetically transform sorghum with chitinase (HarChit) and
a chitosanse (HarCho) genes towards development of fungal diseases resistant lines.
To meet this goal, the following objectives were pursued:
1. Optimise sorghum tissue culture protocol and establish a regeneration system for
particle bombardment and Agrobacterium-mediated transformation.
2. Isolate and clone the chitinase (HarChit) and chitosanase (HarCho) genes into
appropriate vectors for genetic transformation.
3. Carry out genetic transformation of selected sorghum cultivars.
4. Undertake ex planta and in planta assays to determine the responses of the
transformed and wild type sorghum to Colletotrichum sublineolum infection.
5. Profile the expression of selected PR-genes in the transgenic and Wt sorghum lines.

MATERIALS AND METHODS
19
2 MATERIALS AND METHODS
2.1 MATERIALS
2.1.1 Laboratory Consumables
Purity grade “p.A.” chemicals and deionised water (Milli-Q Plus Water system, Millipore,
Bedford, U.S.A.) were used for preparation of all solutions and media. As dictated by
different requirements, solutions and media were autoclaved (20 min, 120°C, 2 x 10⁵ Pa) or
filter sterilised (0.22 µm Millex® GP or SteritopTM, Millipore, Bedford, U.S.A.). General
laboratory chemicals were purchased from: AgrEvo (Düsseldorf), Applichem (Darmstadt),
Biomol (Hamburg), Brand (Wertheim/Main), Duchefa (Harlem, The Netherlands), Fluka
(Buchs), Merck-Schuchard (Darmstadt), Roth (Karlsruhe), Serva (Heidelberg) and Sigma-
Aldrich (München). Restriction endonucleases, dNTPs, DNA polymerases, DNA/RNA
modifying enzymes and other molecular biology reagents were from Invitrogen (Karlsruhe),
Fermentas Life Sciences (St. Leon-Rot) and New England BioLabs (NEB, Frankfurt/Main).
Gel-blotting papers were from Schleicher & Schüll (Dassel) and photographic papers for
agarose gels were from Mitsubishi (Kyoto, Japan).
2.1.2 Kenyan Sorghum Lines
CClleeaann sseeeeddss ooff iinnddiiggeennoouuss KKeennyyaann ssoorrgghhuumm lliinneess wweerree pprroovviiddeedd bbyy KKeennyyaa AAggrriiccuullttuurraall
RReesseeaarrcchh IInnssttiittuuttee ((KKAARRII)),, KKaattuummaannii aanndd KKAARRII PPllaanntt GGeennee BBaannkk,, MMuugguuggaa.. AArraallbbaa sseeeeddss
wweerree oobbttaaiinneedd ffrroomm ssoorrgghhuumm sseeeedd ccoolllleeccttiioonn aatt tthhee DDeeppaarrttmmeenntt ooff AApppplliieedd MMoolleeccuullaarr PPllaanntt
BBiioollooggyy,, UUnniivveerrssiittyy ooff HHaammbbuurrgg.. PPllaannttss wweerree ccuullttiivvaatteedd iinn tthhee ggrreeeennhhoouussee uunnddeerr tthhee
rreeccoommmmeennddeedd ccoonnddiittiioonnss aass rreeppoorrtteedd bbyy OOllddaacchh eett aall.. ((22000011)) ((1166hh//88hh ddaayy//nniigghhtt pphhoottooppeerriioodd
ooff 222200 ∓∓2200 µµEE//mm22//ss aatt cchhaannggiinngg ddaayy//nniigghhtt tteemmppeerraattuurree ooff 2244ooCC//2200ooCC))..

MATERIALS AND METHODS
20
22..11..33 Agrobacterium tumefaciens Strain
A binary vector system was used in this study. A tetracycline resistant Agrobacterium strain,
LBA4404 (pSB1) (Japan Tobacco Inc) containing a disarmed pSB1 plasmid was transformed
with vector constructs containing the gus, chitosanase (HarCho) and chitinase (HarChit)
genes and used for sorghum transformation.
22..11..44 Colletotrichum sublineolum
Isolates of Colletotrichum sublineolum cultured on half-strength potato dextrose (1/2 PDA)
agar were acquired from USDA-ARS, College Station, Texas. The isolates were periodically
sub-cultured onto ½ PDA and grown in darkness at 26°C to maintain actively growing
colonies used to induce sporulation for further experiments. Spores of C. sublineolum were
used in infection experiments. Sporulation was induced by growing ½ PDA derived colonies
on 7.25% oatmeal agar (OMA) at 26°C with backlight illumination for at least 2 weeks.
2.2 METHODS
2.2.1 Experimental Scope, Design and Statistical An alyses
This research was designed to genetically transform sorghum and carry out a comparative
study of the morphological and genetic responses to infection with C. sublineolum of the
transgenic (T) and wild type (Wt) sorghum lines. This study was divided into 4 parts:
1. Genetic transformation through particle bombardment
2. Agrobacterium mediated transformation
3. Ex planta and in planta C. sublineolum infection studies
4. qRT-PCR expression studies of pathogenesis-related genes
Ten sorghum cultivars, including white, brown and red lines, were used for transformation
and infection studies. In planta and ex planta assays were employed to determine the
MATERIALS AND METHODS
21
response to C. sublineolum infection. Gene expression studies were done in transgenic
lines, respective parent Wt line, susceptible and tolerant sorghum cultivars sampled from
Kenya.
Three independent experiments were carried out to study the variables whose effects were
under investigation. The independent experiments were done in triplicates, unless otherwise
stated. The minimum sample size used in infection and transformation experiments was 30.
Data figures were composed from averages from independent experiments and triplicates.
ANOVA and Chi-test were used to determine significance of observed differences. Statistical
significance was determined with 95% level of confidence of P = 0.05 at respective degree of
freedom (df) - P 0.05, df Statistica 6.0 statistical computer software was used for analysis. Data
were presented as values (standard error – in brackets).
2.2.2 Cloning of Vectors for Particle Bombardment T ransformation
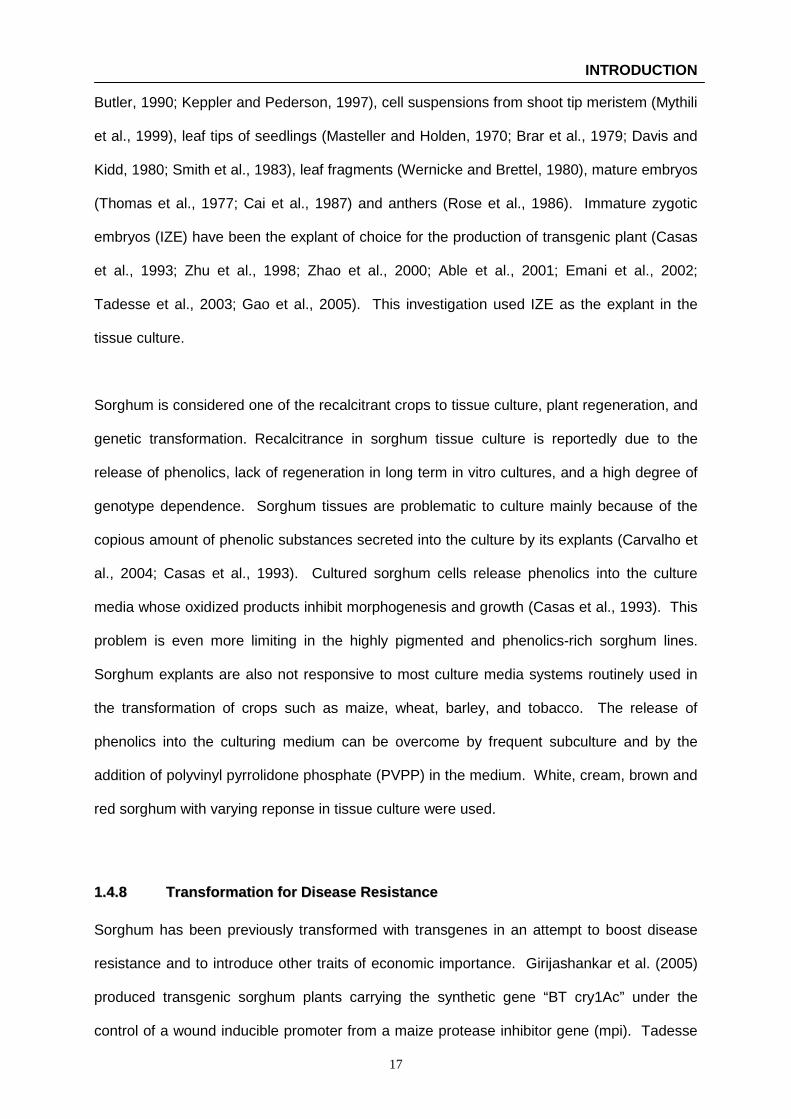
2.2.2.1 pUbiHarChit
An inducible 1.275 kb chitinase (HarChit) gene was isolated from mycelia of Trichoderma
harzianum. The gene was polymerized through PCR with primers containing HincII
restriction sites-overhangs. The HincII fragment was cloned into the pUbiCas vector (Dr. D.
Becker, University of Hamburg, Germany, unpublished) with the constitutive ubiquitin1
promoter (ubi1 promoter) from maize (Christensen et al., 1992) and the nopaline synthase
terminator (Tnos) from Agrobacterium tumefaciens (Figure 2.1). The constructed
pUbiHarChit vector of 5.766 kbp also carried a bla gene coding the beta lactamase gene
conferring ampicilin resistance as a selection marker (Appendix 1.1).
Figure 2.1: pUbi HarChit vector showing ubi1 promoter, HarChit and Tnos terminator gene regions and restriction sites used in cloning and Southern blot analysis.
TnosUbi1-Promoter
1.5 kb
HarChit
1.275 kb 0.25 kb
HindIII HincII HincII EcoRI
TnosUbi1-Promoter
1.5 kb
HarChit
1.275 kb 0.25 kb
HindIII HincII HincII EcoRI
MATERIALS AND METHODS
22
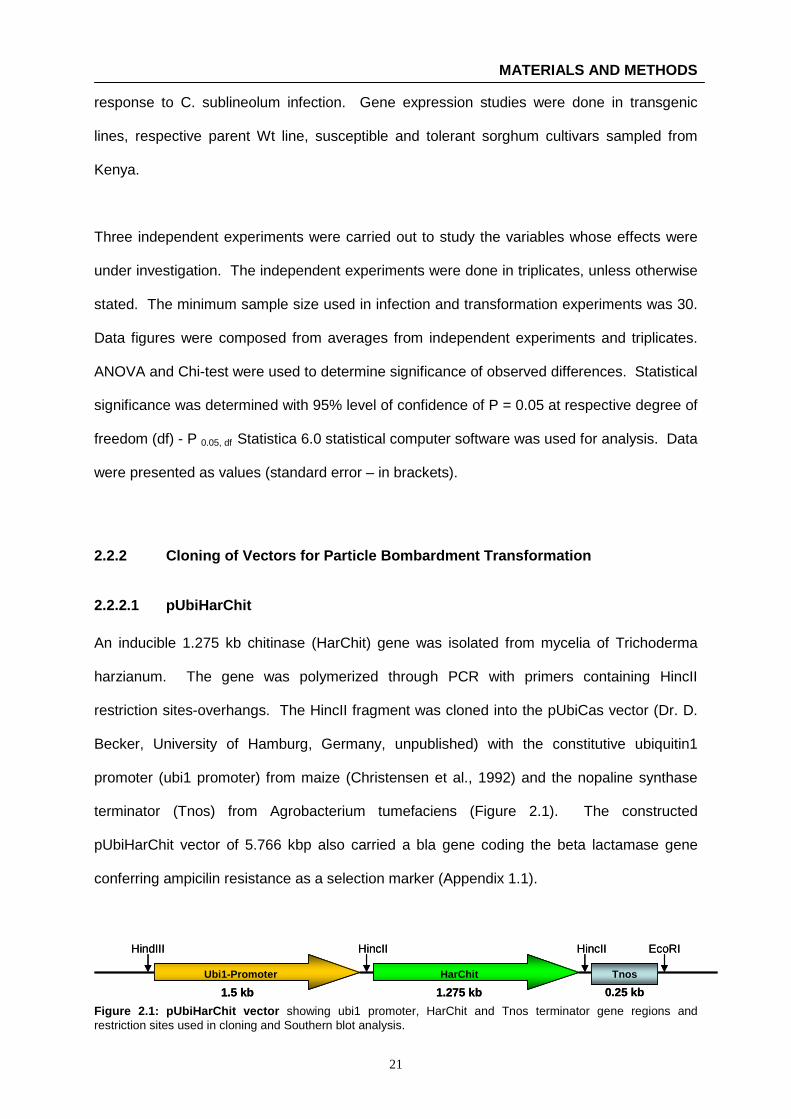
2.2.2.2 pUbiCho
A 5.184 kb plasmid containing the chitosanase gene was constructed by cloning the
BamHI/SacI 708bp HarCho gene region from T. harzianum into the pUbiCas vector
containing ubi1 promoter, nos terminator and the bla gene (Figure 2.2 and Appendix 1.2).
Figure 2.2: pUbiCho vector showing ubi1 promoter, HarCho and Tnos terminator gene regions and restriction sites used in cloning and Southern blot analysis.
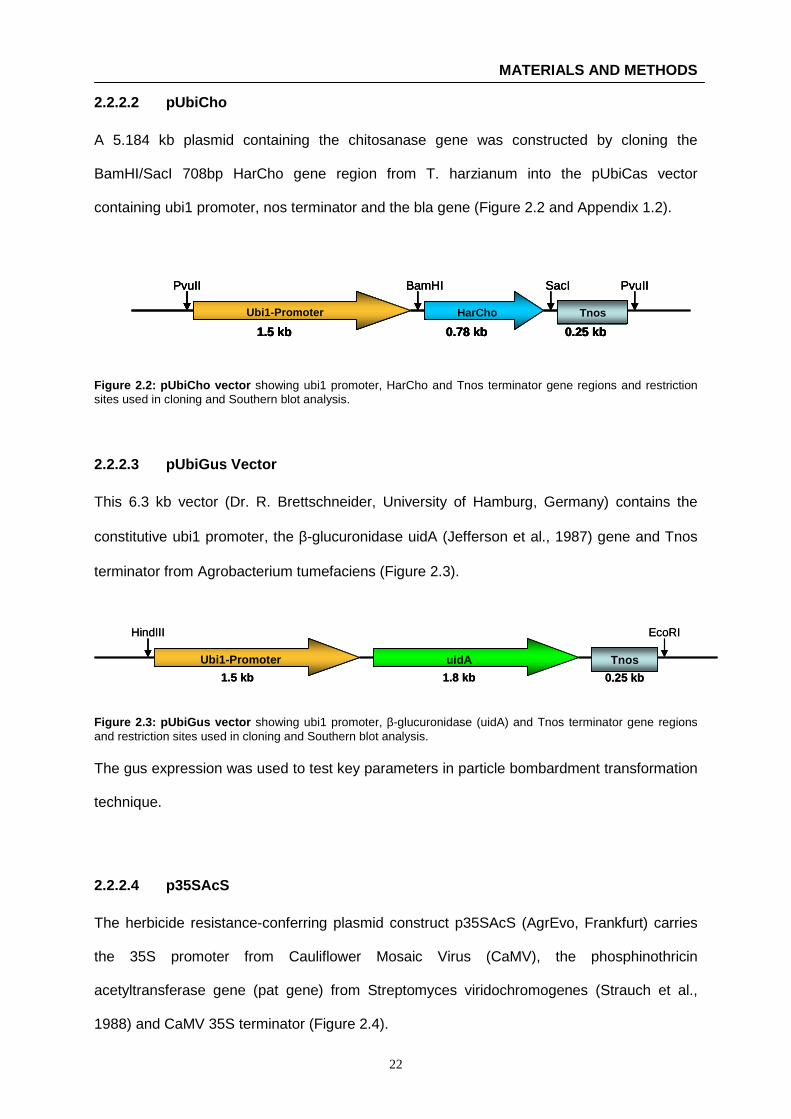
2.2.2.3 pUbiGus Vector
This 6.3 kb vector (Dr. R. Brettschneider, University of Hamburg, Germany) contains the
constitutive ubi1 promoter, the β-glucuronidase uidA (Jefferson et al., 1987) gene and Tnos
terminator from Agrobacterium tumefaciens (Figure 2.3).
Figure 2.3: pUbiGus vector showing ubi1 promoter, β-glucuronidase (uidA) and Tnos terminator gene regions and restriction sites used in cloning and Southern blot analysis. The gus expression was used to test key parameters in particle bombardment transformation
technique.
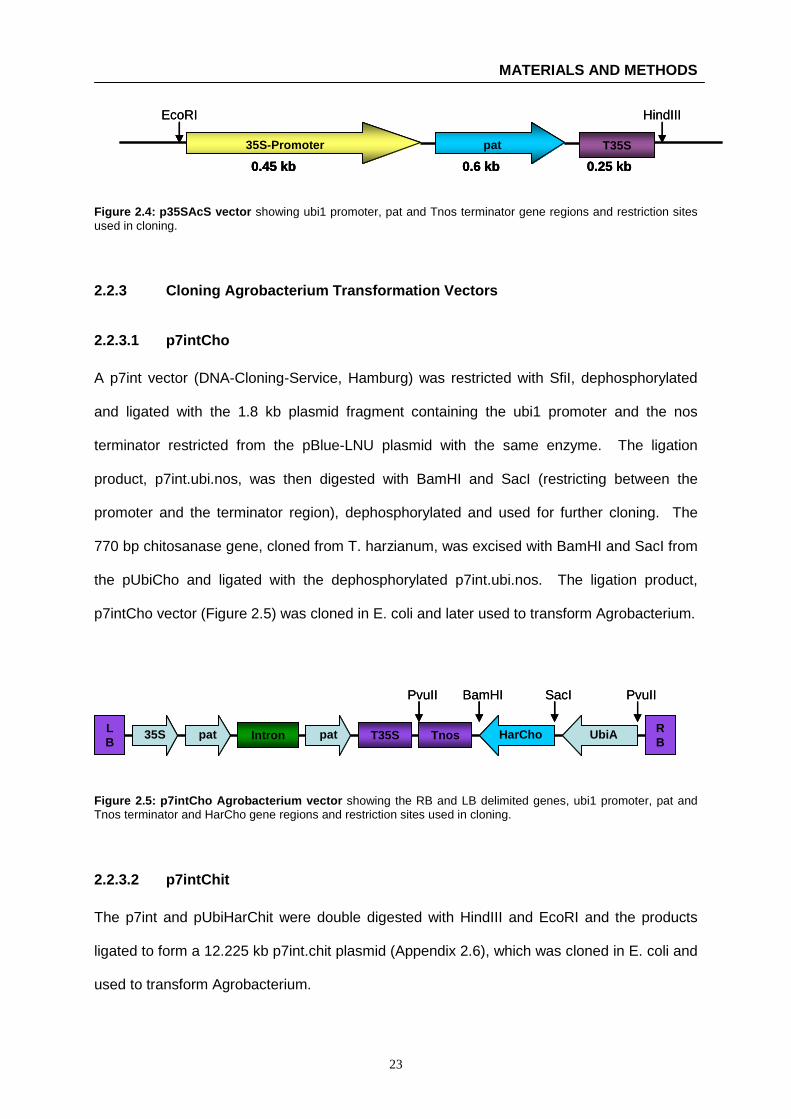
2.2.2.4 p35SAcS
The herbicide resistance-conferring plasmid construct p35SAcS (AgrEvo, Frankfurt) carries
the 35S promoter from Cauliflower Mosaic Virus (CaMV), the phosphinothricin
acetyltransferase gene (pat gene) from Streptomyces viridochromogenes (Strauch et al.,
1988) and CaMV 35S terminator (Figure 2.4).
Ubi1-Promoter HarCho
PvuII BamHI
Tnos
1.5 kb 0.78 kb 0.25 kb
SacI PvuII
Ubi1-Promoter HarCho
PvuII BamHI
Tnos
1.5 kb 0.78 kb 0.25 kb
SacI PvuII
Ubi1-PromoterUbi1-Promoter HarCho
PvuII BamHI
Tnos
1.5 kb 0.78 kb 0.25 kb1.5 kb 0.78 kb 0.25 kb
SacI PvuII
TnosUbi1-Promoter
1.5 kb
uidA
1.8 kb 0.25 kb
HindIII EcoRI
TnosUbi1-PromoterUbi1-Promoter
1.5 kb
uidA
1.8 kb 0.25 kb
HindIII EcoRI
MATERIALS AND METHODS
23
Figure 2.4: p35SAcS vector showing ubi1 promoter, pat and Tnos terminator gene regions and restriction sites used in cloning.
2.2.3 Cloning Agrobacterium Transformation Vectors
2.2.3.1 p7intCho
A p7int vector (DNA-Cloning-Service, Hamburg) was restricted with SfiI, dephosphorylated
and ligated with the 1.8 kb plasmid fragment containing the ubi1 promoter and the nos
terminator restricted from the pBlue-LNU plasmid with the same enzyme. The ligation
product, p7int.ubi.nos, was then digested with BamHI and SacI (restricting between the
promoter and the terminator region), dephosphorylated and used for further cloning. The
770 bp chitosanase gene, cloned from T. harzianum, was excised with BamHI and SacI from
the pUbiCho and ligated with the dephosphorylated p7int.ubi.nos. The ligation product,
p7intCho vector (Figure 2.5) was cloned in E. coli and later used to transform Agrobacterium.
Figure 2.5: p7intCho Agrobacterium vector showing the RB and LB delimited genes, ubi1 promoter, pat and Tnos terminator and HarCho gene regions and restriction sites used in cloning.
2.2.3.2 p7intChit
The p7int and pUbiHarChit were double digested with HindIII and EcoRI and the products
ligated to form a 12.225 kb p7int.chit plasmid (Appendix 2.6), which was cloned in E. coli and
used to transform Agrobacterium.
LB
35S pat Intron pat T35S Tnos HarCho UbiA RB
PvuII BamHI SacI PvuII
LB
35S35S patpat Intron patpat T35S Tnos HarChoHarCho UbiAUbiA RB
PvuII BamHI SacI PvuII
35S-Promoter pat
EcoRI
T35S
0.45 kb 0.6 kb 0.25 kb
HindIII
35S-Promoter35S-Promoter patpat
EcoRI
T35S
0.45 kb 0.6 kb 0.25 kb0.45 kb 0.6 kb 0.25 kb
HindIII

MATERIALS AND METHODS
24
Figure 2.6: p7intHarChit Agrobacterium vector showing the RB and LB delimited genes ubi1 promoter, pat and Tnos terminator and HarChit gene regions and restriction sites used in cloning.
2.2.3.3 p7intChoChit
A blunt-end ligation strategy was used to construct the vector p7inChoChit. The 12.225 kb
p7int.chit was linearized with EcoRI, dephosphorylated and the protruding termini blunted
using the T4 DNA polymerase according to manufacturer’s instruction (Fermentas Life
Sciences). The 5.184 kb pUbiCho was restricted with PvuII and the resulting ubi1-cho-nos
fragment was isolated and purified after gel electrophoresis. The two fragments were
ligated. Two ligation schemes were produced: p7int-nos-cho-ubi-nos-chit-ubi (Cho-Chit:
head-tail) and p7int-ubi-cho-nos-nos-chit-ubi (Cho-Chit: tail-tail). Both were used to
transform Agrobacterium tumefaciens.
2.2.3.4 p7intgus
A spectinomycin and tetracycline resistant LBA4404 (pSB131) strains containing a T-DNA
consisting of T-borders, 35S-bar-nos and intron-GUS (Japan Tobacco Inc.) were used.
2.2.4 Primers
2.2.4.1 Chitinase Cloning Primer
HarChit42-HincII (5´-Primer): 5´-CGC GCG TCG ACA TGT TGA GCT TCC TCG GAA A-3´
HarChit42-HincII (3´-Primer): 5´-CGC GCG TCG ACT TAG TTC AGA CCA TTC TTG A-3´
The forward and reverse primers attached at start and stop codons, respectively.
LB
35S pat Intron pat T35S Tnos HarChit UbiA RB
EcoRI EcoRI
LB
35S35S patpat Intron patpat T35S Tnos HarChitHarChit UbiAUbiA RB
EcoRI EcoRI

MATERIALS AND METHODS
25
2.2.4.4 Southern Blot HarChit Primers
• HarChitDig (5´-Primer): 5´-TCT CTG GCG ATA CCT ACG CT-3´(Primer attachment
at position 244-264)
• HarChitDig (3´-Primer): 5´-AGA TCG GAC TTC CTT CAG CA-3´(Primer attachment
at position 556-576). Product length: 332 bp
2.2.4.5 Southern Blot HarCho Primers
• HarChoDig (5´-Primer): 5´-TAG TGG CGG AGC TAC T-3´ (Primer attachment at
position 135-151)
• HarChoDig (3´-Primer): 5´- GCT TGC TTT GGG TAA G-3´ (Primer attachment at
position 500- 516). Product length: 381 bp
2.2.4.6 qRT-PCR Primers
Primers producing fragments of 167-237 bp were designed from gene sequences of the
respective genes under study. The primers were designed to have an optimum annealing
temperature of about 60°C to enable concurrent qRT- PCR runs (Table 2.1).
Table 2.1: qRT-PCR Primers. Table showing target genes, their respective forward and reverse primers, optimal annealing temperatures, polymerization fragment length, primers efficiencies and NCBI accession numbers.
Gene Primer Identity Forward Primer Reverse Primer
Annealing Temperature
Fragment Length (bp)
Average Primer Efficiency
Accession Numbers
1 Sorghum Leucine-rich Repeat (SbLRR)
RT1-SbLRR
GAC AGG TAT ACC ATC ATC GTT
TCA GTG CCA TCC AGG TTG TTT CTA
55.6°C 237 96.75% BG356045
2 Sorghum Actin (SbAct)
RT4-Actin AGG CGC AGT CCA AGA GGG GTA
ATG GCG GGG GGT GTT GAA GGT
59.7°C 226 93% X79378
3 Sorghum Chalcone Synthase-like Gene 2 (SbCHS2)
RT3-CHS2 GAC GTG CCC GGG CTC ATC TCC
CGC ATT CGC TCC TTC TCC AG 59.6°C 167 96.67%
AF152549
4 Sorghum Chalcone Synthase-like Gene 8 (SbCHS8)
RT2-CHS8 GTG GTG GGA ACG TGG GTA GC
GGG TGA CAT GGG CGA AGA AA 59.5°C 195 93.87% AY069951
5 Sorghum Chitinase (SbChit)
RT-SbChit TAC TGC GGC ACG GAC GGA CGA CTA C
TTG GCG GCG CTC AGG AAC G
62.3°C 200 93.37% AY047608
6 Trichoderma harzianum Chitinase (HarChit)
RT-HarChit ACC CCA ATG CCA CCC CCTTCA A
TAC CGG CCT CCC AGC TTC CAC TT 58.4°C 174 99.37% AB041751
7 Trichoderma harzianum Chitosanase
RT2-Cho GTG GCC AGA GCG AGA CT
TCA CCC CAG ATA CCA TAG AA
53.4°C 199 79.83% AY571342

MATERIALS AND METHODS
26
2.2.5 Tissue Culture Media
2.2.5.1 Microprojectile Bombardment Media
IIssoollaatteedd IIZZEE wweerree ccuullttuurreedd iinn aa rreeggiimmee ooff MS-based (Murashige and Skoog, 1962) ccaalllluuss
iinndduuccttiioonn ((CCIIMM)),, rreeggeenneerraattiioonn ((RREEMM)) aanndd rroooottiinngg mmeeddiiaa ((RROOMM)),, wwiitthh rreeqquuiissiittee
mmaaccrrooeelleemmeennttss,, mmiiccrrooeelleemmeennttss,, vviittaammiinnss,, aammiinnoo aacciiddss,, rreeccoommmmeennddeedd aaddddiittiivveess aanndd ppllaanntt
hhoorrmmoonneess ((AAppppeennddiixx 11..33)).. TThhee mmeeddiiaa wweerree solidified with 0.3% gelrite.
2.2.5.2 Agrobacterium mediated Transformation Media
Four transformation media systems were tested for their effectiveness in an Agrobacterium-
meidated transformation tisusue culture regime. These media were of 4 categories:
Agrobacterium Inoculation Medium (AIM), Co-Cultivation Medium (ACCM), Resting Medium
(ARM), Regeneration Medium (AREM), and Rooting Medium (AROM) (Appendix 1.4).
22..22..66 MMiiccrrooppaarr tt iiccllee BBoommbbaarrddmmeenntt
Immature seeds were harvest 14-20 days after flowering, washed 3 times with distilled water,
sterilized with 2% sodium hypochlorite containing 0.1% Mucasol for 25 minutes at room
temperature on a shaker set at 200 rpm. The seeds were then rinsed 3 times with sterile
double distilled water under a sterile hood. Immature embryos were thereafter aseptically
isolated from the immature seeds under a dissecting microscope under standard sterile
tissue culture conditions.
Gene delivery into the IZE was carried out by particle bombardment using the BIORAD PDS-
1000/He Particle Gun (BioRad, München). Isolated IZEs were cultured overnight on CIM
and incubated on osmotic medium for 4 hours prior to bombardment. IZE were bombarded
with DNA-coated gold particle. DNA coating of gold particles and bombardment of scutellar
tissue of sorghum were based on the procedure described by Oldach et al. (2001). 2 mg
MATERIALS AND METHODS
27
gold particles with diameters of 0.4-0.8 µm were coated with 2 µg of plasmids DNA of each of
the pUbiCho, pUbiHarChit and p35SAcS plasmids and suspended in 250 µl of absolute
ethanol, from which 3-10 µl were loaded on a macro-carrier and used to transform an
average of 30 IZE (80-267 ng plasmid DNA/embryo) (Appendix 1.5). For gus transformation,
5 µg of the pUbiGus was used. Particle bombardment was carried out with helium gas at
900-1550 psi under a partial vacuum of 27 mmHg according to Brettschneider et al. (1997).
Immature embryos were co-bombarded with gold particles coated with the three plasmids
containing HarChit, HarCho and the herbicide resistance, pat genes. The bombarded IZE
remained on the osmotic media for 18-24 hours before being transferred to CIM.
22..22..77 TTrraannssffoorrmmaatt iioonn ooff AAggrroobbaacctteerriiuumm
2.2.7.1 Preparation of Competent Cells
A single colony of Agrobacterium strain LBA4404 (p7int) was grown overnight with 10 µg/ml
tetracycline in 5 ml LB medium (Appendix 1.6) at 28°C. 2 ml of this culture was added to 50
ml LB medium and incubated at 28°C until the cultur e grew to an OD600 of 0.5-1.0, chilled on
ice and centrifuged at 3000 xg for 5 min at 4°C. T he pelleted cells were resuspended in ice-
cold 20 mM CaCl2 solution, dispensed in 0.1 ml aliquots, shock-frozen in liquid nitrogen and
stored at -70°C until used.
2.2.7.2 Plasmid transformation of Agrobacterium tumefaciens
Agrobacterium was transformed with the appropriate plasmid through heat shock treatment.
About 0.1-1 µg of the respective plasmid was added to the 0.1 ml of frozen Agrobacterium
competent cells. The cells were incubated with the plasmids at 37°C in a water bath for 5
min and thereafter placed on ice for 30 min. The cells were then spread on pre-warmed LB
plates (28°C) containing 10 µg/ml tetracycline and 100 µg/ml spectinomycin and incubated
for 2 days at 28°C. Cells successfully transformed formed colonies under selection.
MATERIALS AND METHODS
28
2.2.7.3 Culture of transformed Agrobacterium tumefaciens
A single colony of Agrobacterium carrying the appropriate vector was taken from solid LB
media plate and cultured in 10 ml liquid YEB medium (Appendix 1.7) containing the
antibiotics for selection. The culture was incubated at 28°C at 250 rpm until an OD 600 of 0.4
was attained. Equal volume of 500 µl Agrobacterium culture and 30% glycerine were shock
frozen in liquid nitrogen and stored at -70°C until used in the transformation of sorghum IZE.
2.2.8 Transformation of IZE with Agrobacterium tumefaciens
Frozen 1 ml aliquots were cultured to an OD500 0.2-0.8 in 30 ml AB medium (Appendix 1.8) at
28°C with appropriate antibiotics and 100 µM acetos yringone on rotary shaker. Culture was
then centrifuged at 5,000 rpm at 4°C for 10 min. T he bacterial pellet was resuspended and
washed with 15 ml of 10 mM MgSO4 and pelleted as described above. The pellet was
resuspended in appropriate inoculation medium with 100-200 µM acetosyringone, diluted to
the right OD600 (0.2-0.8) and used in the inoculation of sorghum IZE. Infection was done in
liquid or solid medium and involved incubating IZE with Agrobacterium tumefaciens at the
specific OD600 and duration.
2.2.9 Tissue Culture of Immature Zygotic Embryos
2.2.9.1 Bombarded IZE
Immature sorghum embryos (IZE) were used as the explant for somatic embryogenesis.
Sorghum tissue culture was carried out according to the protocol described by Oldach et al.,
(2001). Immature seeds were harvested from sorghum plants produced under standard
conditions in the greenhouse. IIZZEE wweerree mmiiccrroossccooppiiccaallllyy iissoollaatteedd ffrroomm ddeevveellooppiinngg sseeeeddss
uunnddeerr sstteerriillee ccoonnddiittiioonn,, ccuullttuurreedd iinn aa sseerriieess ooff ddeeffiinneedd ccaalllluuss iinndduuccttiioonn,, rreeggeenneerraattiioonn aanndd
rroooottiinngg mmeeddiiaa.. RReeggeenneerraannttss wweerree ttrraannssffeerrrreedd ttoo tthhee ggrreeeennhhoouussee,, hhaarrddeenneedd ooffff aanndd ccuullttiivvaatteedd
uunnddeerr nnoorrmmaall ccoonnddiittiioonnss..
MATERIALS AND METHODS
29
For induction of callus formation, sorghum IZE were cultured in darkness for 2 weeks at 26°C
on CIM containing 2.5 mg/l and 0.1 mg/ml 2,4-D (2,4-dichlorophenoxyacetic acid) and BAP
(6-benzylaminopurine), respectively. Calli were thereafter transferred onto a regeneration
medium (REM) with 1 mg/l of BAP and cultured under 16/8Hrs light/darkness cycle at 26°C
for organogenesis. The calli were cultured on REM for 2 weeks without selection and
thereafter sub-cultured onto SEL-REM plates with 2 mg/l BASTA for 4-10 weeks, i.e., until
ready for transfer to rooting medium. Calli and young regenerants were sub-cultured every
2-3 weeks onto fresh media. Organogenic regenerants with well formed shoots were cultured
onto ½ MS rooting-induction media with 2 mg/l BASTA selection (SEL-ROM) without
hormones. When regenerants have formed leaves and roots and reached a height of 7-10
cm they were transferred to the Greenhouse, hardened-off (covered with a translucent plastic
for 7 days) and finally cultivated under standard light and temperature conditions.
2.2.9.2 Agrobacterium transformed IZE
Transformed IZE were co-cultivated with Agrobacterium for 3-7 days in a co-cultivation
containing 100-300 µM acetosyringone, 2.5 mg/l 2,4-D and 0.1 mg/l BAP at 21, 26 or 28°C.
The calli were thereafter transferred to Agrobacterium selection media containing 250 µg/ml
Cefotaxime, 2.5 mg/l 2,4-D and 0.1 mg/l BAP and cultured 14 days at 26°C. Calli were then
transferred to regeneration and rooting media as described for bombarded embryos.
2.2.10 Analysis of Genes Integration and Expression
2.2.10.1 Histochemical GUS Assay
β-Glucuronidase (GUS) activity in transformed tissues was analysed histochemically
(Jefferson et al., 1987). Tissues were incubated for 12-16 hours at 37°C in staining buffer
containing X-Gluc {(5-Bromo-4-chloro-3-ndolyl-β-D-glucuronic acid); 100 mM NaH2PO4 (pH
MATERIALS AND METHODS
30
7.0); 10 mM EDTA (pH 7.0); 0.5% Triton X-100)} as a substrate (Appendix 1.9). GUS signals
were visually enumerated under a dissecting microscope.
2.2.10.2 DNA Isolation
Genomic DNA from sorghum was isolated as described by Dellaporta et al. (1983).
Approximately 300 g of sorghum leaves were cut and frozen in 2 ml tubes in liquid nitrogen
and stored at -70°C until used. The frozen leaves were ground with ball-bearings through
vigorous shaking for 2 minutes at 90 rpm in a Retsch MM2000 Shaker (with a variable
amplitude and timer). The milled powder was sequentially extracted with 1 ml extraction
buffer (Appendix 1.10), 1 ml phenol/chloroform/isoamylalcohol (25:24:1) and centrifuged at
5000 rpm. The DNA was precipitated from the aqueous phase was with 1/10 volume 3 M
sodium acetate of pH 4.8 and 1 volume isopropanol, centrifuged at 1300 rpm, pellet washed
twice with 70% ethanol, air dried and dissolved in 400 µl R40 buffer (40 µg/ml RNAse A in 1x
TE). The purity, integrity and concentration of the isolated DNA were checked by absorbance
spectrophotometry and gel electrophoresis. DNA was stored at 4°C until analysed.
2.2.10.3 RNA Isolation
Total RNA was extracted from the samples using the peqGOLD TriFast extraction protocol
according to the manufacturer’s instruction (PeqLab Biotechnologie, Erlangen) (Appendix
1.11). DNA-free RNA was generated by using an endonuclease, DNAse, which digests
single and double stranded DNA. The extracted 10 µg total-RNA was treated with 10 U of
RNA-free DNAse, appropriate buffer and RNAse inhibitor as described by reagents
manufacturer (Fermentas Life Sciences). The purity and integrity of the RNA was checked
through gel electrophoresis and absorbance spectrophotometry. The DNA-free RNA was
frozen in liquid nitrogen and stored at -70°C until used in reverse transcription for the
generation of cDNA.
MATERIALS AND METHODS
31
2.2.10.4 cDNA Synthesis
cDNA was synthesized from the total RNA using 18-mer oligonucleotide (Oligo(dT)18) primer,
dNTPs, RNAse inhibitor and the Moloney murine leukaemia virus reverse transcriptase (M-
MuLV) as recommended by the reagents manufacturer (Fermentas Life Science) (Appendix
1.12).
2.2.10.5 PCR
PCR analysis was done using a Biometra TGradient cycler (Goettingen, Germany).
Parameters and concentrations of primers, requisite buffers, dNTPs, polymerase, template
DNA and salts were as described by the reagents manufacturer (Fermentas Life Sciences)
(Appendix 1.13)
2.2.10.6 Digoxigenin-Labelling of DNA Probes
Digoxigenin-11-dUTP (DIG-dUTP) from Roche Diagnostics was used to mark DNA probes
used in molecular analysis of gene integration through Southern blotting. DIG-marking was
done through PCR of plasmid DNA with specific DIG-primers. The PCR reaction mix used
for DIG-marking included 0.3 µM of each DIG Primers; 0.3 mM of each dATP, dGTP, dCTP;
0.2 mM dTTP; 35 µM DIG-dUTP; 2 mM MgCl2, 1x PCR buffer; 1 U Taq-Polymerase and 50
ng template DNA.
2.2.10.7 Southern Blot Analysis
Southern blotting was carried out as described by Sambrook et al., (1989). 10-25 µg
genomic DNA were restricted with endonucleases and separated in 0.8% agarose gels. Gel
treatments for Southern blots were performed as described in Sambrook et al. (1989). DNA
was transferred onto HybondTM NX nylon membranes by capillary transfer (20 x SSC) and
fixed to membranes with 120 mJ using StratalinkerTM 1800 UV crosslinker (Stratagene, La
MATERIALS AND METHODS
32
Jolla, U.S.A.). For detection hybridisation with DIG-labelled with HarChit and HarCho DNA
probes (20-25 ng/ml hybridisation solution) was performed at 42°C using DIG Easy Hyb
solution (Roche, Mannheim). Chemiluminescence detection was done with CSPD® substrate
according to the manufacturer’s prescriptions (Roche, Mannheim).
2.2.10.8 Progeny Segregation
Segregation of the transgenes in sorghum progeny was evaluated from the expression of the
herbicide resistance gene. T1 seedlings were sprayed twice with 200 and 300 mg/l BASTA
herbicide 7 and 14 days, respectively, after germination. Surviving and dead plants were
then enumerated and computed to establish the segregation ratio.
2.2.11 Colletotrichum sublineolum Infection
Sorghum lines studied were: KAT 412 Wt, KOSA1 T1, KAT L5, KAT 487, GBK 046812, GBK
046820, GBK 046844, Serena and SDSH 513. Sorghum seeds were grown in autoclaved
soil in a RUMED growth chamber (Jencons Scientific Ltd, West Sussex, UK). Germination
time and rate were recorded to standardize the age of the seedlings used for infection.
In planta and ex planta infection experiments were used to study the response of the
transgenic, wild type KAT 412 and selected sorghum cultivars to infection with C.
sublineolum. Preliminary evaluation of anthracnose tolerance was done on 8 sorghum lines.
Three cultivars, a tolerant and two susceptible lines, were thereafter chosen for further
studies. In planta infection involved foliar spray of 1 week old seedlings with conidia while ex
planta infection entailed infection of leaf segments excised from 2-weeks old seedlings with
C. sublineolum. Symptoms development was evaluated at specific intervals between 0-144
hours post infection (HPI).

MATERIALS AND METHODS
33
2.2.11.1 Sporulation, Conidia Harvesting and Counting
Conidia of C. sublineolum were used in infection experiments. To induce conidia formation,
samples of fast growing mycelia maintained on ½ PDA were cultured on 7.25% Oatmeal
agar (OMA) medium at 26°C with backlight illuminati on for at least 2 weeks.
C. sublineolum conidia-laden 7.25% OMA plate was flooded with 20 ml of sterile double
distilled water containing 0.01% Tween 20 and gently scrapped with a sterile plastic brush to
free conidia from the setae. The suspension was filtered through a 50 nm nylon filter. The
conidia-containing stock filtrate was immediately set on ice until used for infection. Serial
dilutions of the stock filtrate were pipetted onto a counting chamber and used to estimate the
conidia count under a light microscope. Inoculums suspension of 1 x 10⁶ conidia/ml was
used in all infection experiments.
2.2.11.2 Ex Planta Infection
The second leaf of 2 weeks old sorghum seedling was cut in three equal parts (triplicate) of
approximately 3x6 cm using a cutting mould, plated on 0.8% neutral Agar plates with 40 mg/l
of anti-senescence compound, benzimidazole, and incubated at 26°C under 16/8 h light/dark
conditions. Two infection methods were used:
1) Point infection: 10 µl aliquot of the conidial suspension was pipetted onto the excised
leaf segments.
2) Floral dip infection: leaf segments were briefly dipped into a bath of conidial suspension
for 10-15 seconds. Infection chambers were sealed and the leaf response was visually
analyzed under natural light every 24 hours post infection (HPI).
2.2.11.3 In Planta Infection
Sorghum seedlings grown on trays in the growth chamber were used. Two leaves-stage
seedlings were sprayed with 106 conidia/ml suspension until run-off. Seedlings were grown

MATERIALS AND METHODS
34
in 80% RH, 8/16 h light/dark cycle at 28°C for 48 h and thereafter 12/12 h cycle for the rest of
the experimental period. Observations were made at specific time interval between 0-144
HPI. Observations made included: timing of the appearance of infection symptoms, number
of leaves showing symptoms, degree and distribution of symptoms, differences in symptoms
development and severity in the transgenic, parent Wt KAT 412 and other Kenyan sorghum
lines were studied.
2.2.12 Real Time Quantification of Gene Expression
Spatial expression of the introduced genes and selected innate sorghum genes were
quantified at the specific time intervals after C sublineolum infection. Real time genes
expression was computed from levels of cDNA as a measure of abundance of respective
template mRNA. Total RNA was extracted at specific intervals from ex planta and in planta
samples and used in the synthesis of cDNA which was used in qRT-PCR analysis.
2.2.12.1 Analysed Genes
The sorghum actin gene (NCBI Accession no. X79378) was used as the internal standard for
gene expression studies. Expression of the transgenes, HarCho and HarChit was quantified.
The effect of C. sublineolum infection on 3 genes: sorghum chalcone synthase like gene 2
and 8 (SbCSH2 and SbCHS8), sorghum leucine rich repeat (SbLRR) and sorghum chitinase
5 (SbChit), was studied. Homologous sequences in NCBI public database were used in the
design of the primers.
2.2.12.2 qRT-PCR Primers, Standard Curves and Primer Efficiencies
The cDNA was used as the template in qRT-PCR gene expression study using specific
primers of the genes of interest. Primers were designed by PrimerSelect (DNASTAR) to
anneal under the same conditions. Concurrent runs across genes and sorghum lines were

MATERIALS AND METHODS
35
performed (Table 4.1). The primers were used to polymerize their respective genes from
cDNA synthesised from the total RNA. 1 ng-1 fg of the polymerized gene fragments were
used as the templates in qRT-PCR Biorad iCycler® to determine their respective standard
curves and primer efficiencies.
2.2.12.3 qRT-PCR Conditions Optimization
SYBR Green 1 with fluorescein was used in qRT-PCR (Eurogentec, Köln, Germany). The
reaction mixtures and thermocycler program were as described by the manufacturer. A
primer titration matrix was used to standardize the primers concentration. The dilution and
concentration of the cDNA was also optimized towards a 20-35 Ct (threshold cycle) range.

RESULTS
36
33 RREESSUULLTTSS
3.1 PARTICLE BOMBARDMENT
3.1.1 Sorghum Regeneration through IZE Tissues Cult ure
Sorghum IZE were isolated from immature seeds 14-20 days after flowering and cultured
through 3 stages of tissues cultures – calli induction, tissues regeneration and rooting.
Regeneration of sorghum from IZE was achieved through tissue culture on callus induction
(CIM), regeneration (REM) and rooting media (ROM) (Figure 3.1). Selection of genetic
transformants was done by culturing and rooting regenerants in SEL-REM and SEL-ROM
media containing 2 mg BASTA/l. The average time taken for each stage was 14 days for
each CIM and REM, 30 days in SEL-REM and SEL-ROM. It therefore took 3 months to
develop a tissue culture regenerant ready for transfer to the greenhouse.
Figure 3.1: Main stages in sorghum tissue culture. Harvesting of immature sorghum seeds 14-20 days after flowering (i), isolated embryo after 2 days in CIM (ii), calli after 2 weeks in CIM (iii), calli after 2 weeks in REM (iv), regenerants in REM (v-viii), regenerant 14 days in SEL-ROM (viii), regenerants in the greenhouse (ix).
(i)
(ii)
(iii)
(iv)
(v)
(vi)
(vii)
(viii)
(ix)
(i)
(ii)
(iii)
(iv)
(v)
(vi)
(vii)
(viii)
(ix)
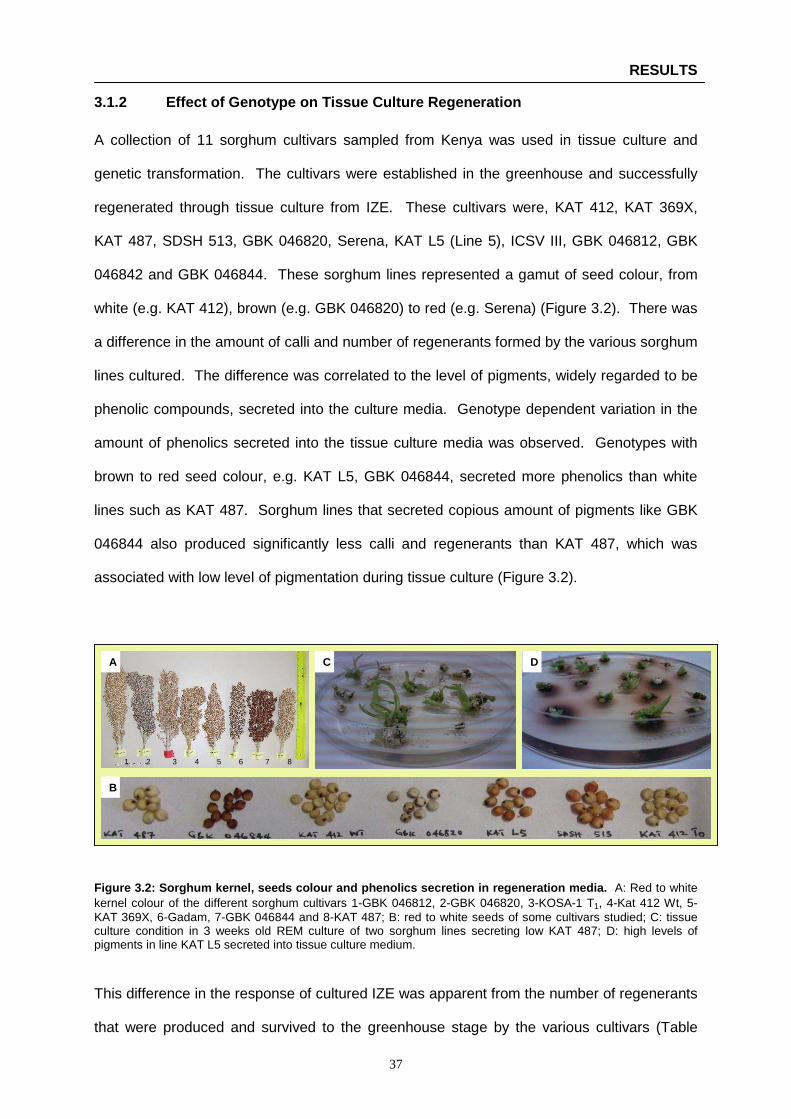
RESULTS
37
3.1.2 Effect of Genotype on Tissue Culture Regenera tion
A collection of 11 sorghum cultivars sampled from Kenya was used in tissue culture and
genetic transformation. The cultivars were established in the greenhouse and successfully
regenerated through tissue culture from IZE. These cultivars were, KAT 412, KAT 369X,
KAT 487, SDSH 513, GBK 046820, Serena, KAT L5 (Line 5), ICSV III, GBK 046812, GBK
046842 and GBK 046844. These sorghum lines represented a gamut of seed colour, from
white (e.g. KAT 412), brown (e.g. GBK 046820) to red (e.g. Serena) (Figure 3.2). There was
a difference in the amount of calli and number of regenerants formed by the various sorghum
lines cultured. The difference was correlated to the level of pigments, widely regarded to be
phenolic compounds, secreted into the culture media. Genotype dependent variation in the
amount of phenolics secreted into the tissue culture media was observed. Genotypes with
brown to red seed colour, e.g. KAT L5, GBK 046844, secreted more phenolics than white
lines such as KAT 487. Sorghum lines that secreted copious amount of pigments like GBK
046844 also produced significantly less calli and regenerants than KAT 487, which was
associated with low level of pigmentation during tissue culture (Figure 3.2).
Figure 3.2: Sorghum kernel, seeds colour and phenoli cs secretion in regeneration media. A: Red to white kernel colour of the different sorghum cultivars 1-GBK 046812, 2-GBK 046820, 3-KOSA-1 T1, 4-Kat 412 Wt, 5-KAT 369X, 6-Gadam, 7-GBK 046844 and 8-KAT 487; B: red to white seeds of some cultivars studied; C: tissue culture condition in 3 weeks old REM culture of two sorghum lines secreting low KAT 487; D: high levels of pigments in line KAT L5 secreted into tissue culture medium.
This difference in the response of cultured IZE was apparent from the number of regenerants
that were produced and survived to the greenhouse stage by the various cultivars (Table
1 2 3 4 5 6 7 8
1 2 3 4 5 6 7 8
A
B
C D
1 2 3 4 5 6 7 8
1 2 3 4 5 6 7 8
A
B
C D

RESULTS
38
3.1). For example only 0.7% of 608 Serena IZE, a cultivar that secreted high levels of
phenolics into culture media, developed regenerants that reached the greenhouse stage as
compared to 3% in lower phenolics producing line KAT 412.
Table 3.1: Sorghum cultivars and regenerants formation. Correlation between cultivar’s grain colour and pigments secretion into culture media and sorghum regenerants formation after particle bombardment. Key: +very low, ++ - low, +++ moderate and ++++ - high phenolics production.
Sorghum line Grain Colour Amount of Phenol in
Culture Embryos Cultured
Regenerants to Greenhouse
% Embryos forming Regenerants
KAT 412 White + 3455 105 3.0
Serena Red ++++ 608 4 0.7
KAT 487 White + 674 8 1.2
SDSH 513 Brown +++ 1746 12 0.7
GBK 046820 Brown ++ 600 6 1.0
ICSV Red ++++ 265 2 0.8
KAT L5 Brown +++ 346 3 0.9
3.1.3 Bombardment Pressure and Transient GUS Activi ty
Microprojectile bombardment conditions were optimized to ensure high survival rate of
embryos and high transient gus gene expression. Three bombardment pressure levels,
namely 1100, 1350 and 1550 psi were evaluated. A triplicate of 30 KAT 412 IZE were
bombarded with the plasmid carrying the gus gene at 1100, 1350 and 1550 psi, cultured on
CIM and transient GUS activity quantified 2 and 14 days after bombardment IZE (Figure.3.3).
Figure 3.3: Transient gus expression in IZE at various bombardment pressure. GUS signal foci in embryos bombarded with 3 µl of suspension containing DNA-coated gold particles at 1100 psi (A), 1350 psi (B) and 1550 psi (C). The average GUS signal/embryo (standard deviation in brackets) from the three bombardment pressures were 276 (18.945), 344 (13.164) and 287 (26.978).
a b c A B CA B C

RESULTS
39
As shown in figure 3.3, it was observed that gus expression after 2 days was not significantly
different between the 3 pressure levels as all the embryos bombarded dyed blue for GUS
gene. All the embryos showed at least 250 GUS signals per scutellum. Expression after 14
days under CIM at 26°C was pointedly different. Th e highest level of GUS expression, 58%
of bombarded embryos, was recorded with 1350 psi as compared to 37% achieved with
1550 psi (Figure 3.4). Bombardment at 1350 psi was found to result into higher GUS activity
and subsequent transformation experiments were carried out at this pressure.
Figure 3.4: Transient gus expression in 2 and 14 days IZE and calli at differ ent bombardment pressure. Percentage of KAT 412 IZE bombarded at the different pressures 1100, 1350 and 1550 psi showing GUS activity after 2 and 14 days of culture in CIM. The gus expression was higher in at 1350 psi than at 1100 and 1550 psi.
3.1.4 Effect of Pre-culture on Calli and Regenerant s Formation
An evaluation was carried out to establish the best pre-culture condition for the formation of
regenerants from sorghum IZE. KAT 412 IZEs were pre-cultured on CIM for 1 or 3 days.
Average number of regenerants was determined from triplicates consisting of 322 (1-day)
and 209 (3-days) pre-cultured embryos that were cultured for 2 weeks in CIM and 2 months
in REM (Figure 3.5). Regenerants which had undergone successful organogenesis resulting
in developed shoot axis were sub-cultured from REM onto ROM and remaining calli further
cultured. Through this, it was possible to carry out 3 and 2 sub-cultures from the 1-day and
0
20
40
60
80
100
120
140
1100psi 1350psi 1550psi
Bombardment Pressure (psi)
% o
f Em
bryo
s
% GUS Positive -2 Days
% GUS Positive 14 Days
0
20
40
60
80
100
120
140
1100psi 1350psi 1550psi
Bombardment Pressure (psi)
% o
f Em
bryo
s
% GUS Positive -2 Days
% GUS Positive 14 Days
% GUS Positive -2 Days
% GUS Positive 14 Days

RESULTS
40
3-days pre-cultured embryos, respectively. The 1-day pre-cultured embryos produced more
regenerants, with an average (standard deviation in brackets) of 34 (19.09), 29 (7.44), 35
(9.90) as compared to 19 (11.43), 33.25 (9.00) regenerants in 3-days pre-culture. An
average of 80.50 (14.89) and 52.25 (7.56) regenerants were produced in 1-day and 3-days
pre-cultured plates. Embryos pre-cultured for 1 day were used in all subsequent
transformation and tissue culture experiments.
Figure 3.5: Effect of pre-Culture on regenerants formation. 1 day and 3 days pre-cultured IZE were incubated on CIM for 2 weeks and transferred to REM. Regenerants with well developed shoot axis were transferred to ROM and the remaining calli cultured further. 1 day pre-cultured embryos produced more regenerants than 3 days pre-cultured embryos with, respectively, an average of 80 and 55 regenerants from a culture plate containing 30 IZE.
33..11..55 TTrraannssffoorrmmaatt iioonn wwii tthh TTaarrggeett GGeenneess
Transformation was attempted on 8 sorghum lines: Aralba, KAT 412, KAT 487, KAT L5, GBK
046820, ICSV III, SDSH 513 and Serena. A total of 10,269 embryos from these lines were
bombarded in batches of 30 IZE/Petri dish with a plasmid mix containing HarChit, HarCho
and pat genes coding for chitinase, chitosanase and herbicide resistance, respectively
(Figure 3.5). Bombarded IZE were cultured in CIM, REM, SEL-REM, SEL-ROM and
surviving transformants transferred to the greenhouse.
0
20
40
60
80
100
120
1 Day Preculture 3 Days Preculture
Preculture
No.
of R
egen
eran
ts
First Sub-cultureSecond Sub-cultureThird Sub-cultureTotal no. Regenerants/Plate
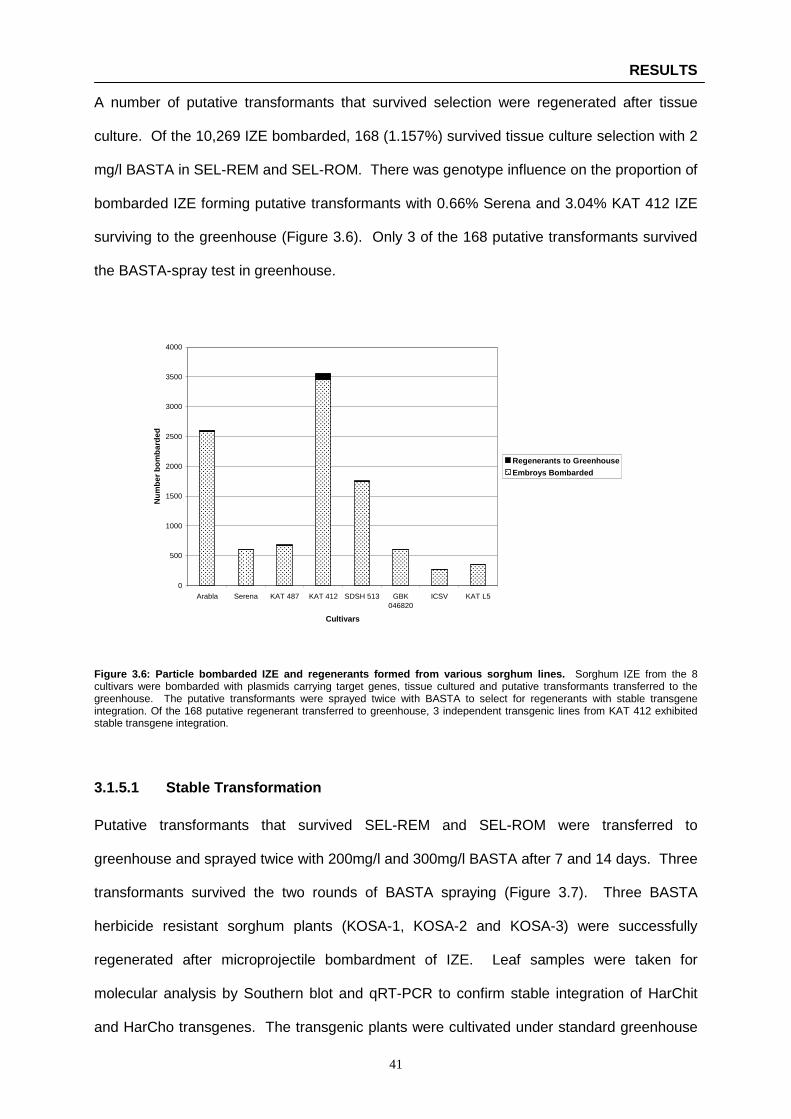
RESULTS
41
A number of putative transformants that survived selection were regenerated after tissue
culture. Of the 10,269 IZE bombarded, 168 (1.157%) survived tissue culture selection with 2
mg/l BASTA in SEL-REM and SEL-ROM. There was genotype influence on the proportion of
bombarded IZE forming putative transformants with 0.66% Serena and 3.04% KAT 412 IZE
surviving to the greenhouse (Figure 3.6). Only 3 of the 168 putative transformants survived
the BASTA-spray test in greenhouse.
Figure 3.6: Particle bombarded IZE and regenerants formed from various sorghum lines. Sorghum IZE from the 8 cultivars were bombarded with plasmids carrying target genes, tissue cultured and putative transformants transferred to the greenhouse. The putative transformants were sprayed twice with BASTA to select for regenerants with stable transgene integration. Of the 168 putative regenerant transferred to greenhouse, 3 independent transgenic lines from KAT 412 exhibited stable transgene integration.
3.1.5.1 Stable Transformation
Putative transformants that survived SEL-REM and SEL-ROM were transferred to
greenhouse and sprayed twice with 200mg/l and 300mg/l BASTA after 7 and 14 days. Three
transformants survived the two rounds of BASTA spraying (Figure 3.7). Three BASTA
herbicide resistant sorghum plants (KOSA-1, KOSA-2 and KOSA-3) were successfully
regenerated after microprojectile bombardment of IZE. Leaf samples were taken for
molecular analysis by Southern blot and qRT-PCR to confirm stable integration of HarChit
and HarCho transgenes. The transgenic plants were cultivated under standard greenhouse
0
500
1000
1500
2000
2500
3000
3500
4000
Arabla Serena KAT 487 KAT 412 SDSH 513 GBK046820
ICSV KAT L5
Cultivars
Num
ber
bom
bard
ed
Regenerants to Greenhouse
Embroys Bombarded
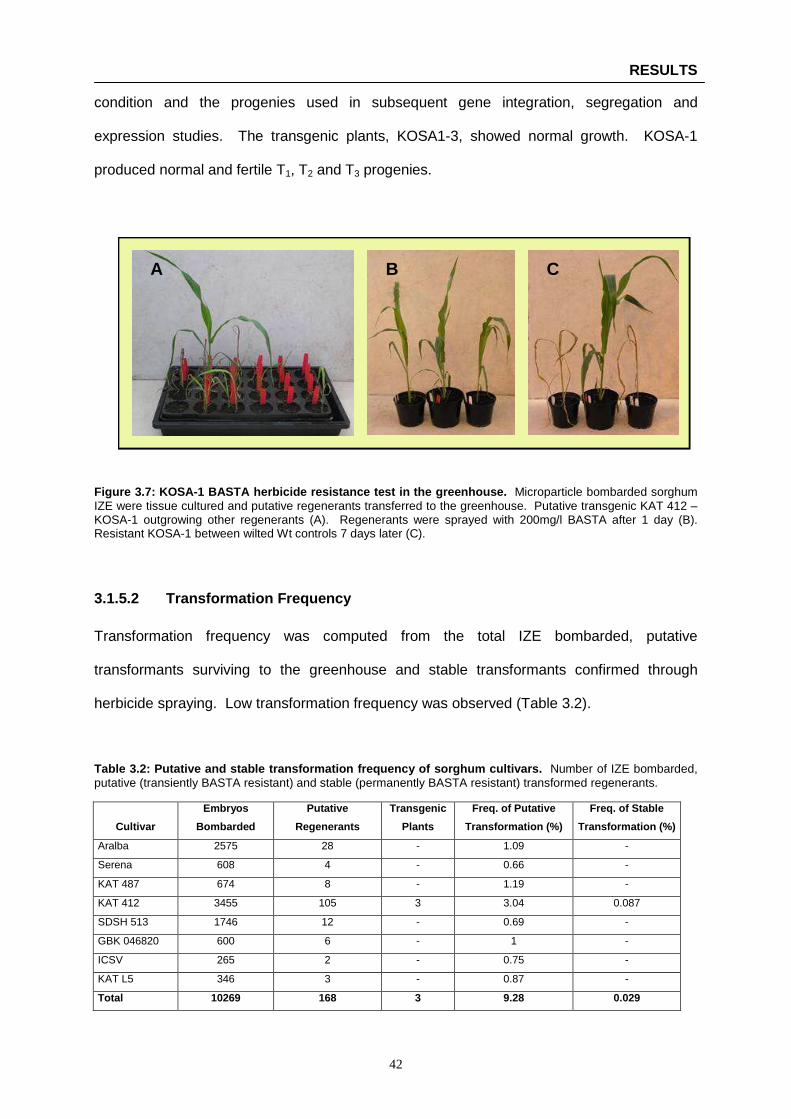
RESULTS
42
condition and the progenies used in subsequent gene integration, segregation and
expression studies. The transgenic plants, KOSA1-3, showed normal growth. KOSA-1
produced normal and fertile T1, T2 and T3 progenies.
Figure 3.7: KOSA-1 BASTA herbicide resistance test in the greenhouse. Microparticle bombarded sorghum IZE were tissue cultured and putative regenerants transferred to the greenhouse. Putative transgenic KAT 412 – KOSA-1 outgrowing other regenerants (A). Regenerants were sprayed with 200mg/l BASTA after 1 day (B). Resistant KOSA-1 between wilted Wt controls 7 days later (C).
3.1.5.2 Transformation Frequency
Transformation frequency was computed from the total IZE bombarded, putative
transformants surviving to the greenhouse and stable transformants confirmed through
herbicide spraying. Low transformation frequency was observed (Table 3.2).
Table 3.2: Putative and stable transformation freque ncy of sorghum cultivars. Number of IZE bombarded, putative (transiently BASTA resistant) and stable (permanently BASTA resistant) transformed regenerants.
Cultivar
Embryos
Bombarded
Putative
Regenerants
Transgenic
Plants
Freq. of Putative
Transformation (%)
Freq. of Stable
Transformation (%)
Aralba 2575 28 - 1.09 -
Serena 608 4 - 0.66 -
KAT 487 674 8 - 1.19 -
KAT 412 3455 105 3 3.04 0.087
SDSH 513 1746 12 - 0.69 -
GBK 046820 600 6 - 1 -
ICSV 265 2 - 0.75 -
KAT L5 346 3 - 0.87 -
Total 10269 168 3 9.28 0.029
A B CA B CA B C

RESULTS
43
Evaluation of transformation frequency from the number of cultivars transformed revealed
that 1 of 8 cultivars (12.5%) was amenable to transformation. From the total of 10,269 IZE
bombarded 3 (0.029%) were herbicide resistant. The 3 (0.087%) of the transformants were
part of the 3455 KAT 412 IZE bombarded. Only 2 (105+300) batches of KAT 412 IZE
produced the transgenic plants. This reveals a transformation frequency of 0.74%.
3.1.5.3 Progeny Segregation Ratio
A total of 341 seeds of KOSA-1 were planted and sprayed twice with 200 mg/l and 300 mg/l
BASTA at 7 and 14 days after germination, respectively. Analysis of BASTA resistant T1
progeny of KOSA-1 showed that an average of 73.92% were transgenic (Table 3.3). The
expected segregation ratio of single locus dominant gene integration is 3:1 (75% transgenic).
The segregation ratio showed that the pat gene was integrated at a single locus and was
inherited in simple Mendelian fashion.
Table 3.3: Segregation of T 1 Progeny of the transgenic sorghum line - KOSA-1 . Percentage germination, number of transgenic plants after BASTA spray test and percentage transgenic progenies from 4 experiments with 100 seeds each.
% Germination No.
Transgenic
No. Non
Transgenic % Transgenic
1 80 55 25 68.75
2 89 70 19 78.65
3 90 72 18 80.00
4 82 56 26 68.29
Total 341 253 88
Average 85.25 63.25 22 74.19
3.1.5.4 Southern Blot Analysis of Gene Integration
Southern blot analysis was carried out using DIG-labelled HarChit and HarCho probes. DNA
of KAT 412 Wt, KOSA-1 T0 and positive control plasmids: pUbiCho and pUbiChit, were
digested with the respective restriction enzymes that linearised and excised out the Ubi1-
gene-nos regions of the chitinase and chitosanase genes. Southern blot analysis showed a

RESULTS
44
different integration pattern of HarChit and HarCho. There were at least a single and 6
integration of HarChit and HarCho, respectively (Figure 3.8a). Multiple copy integration of
HarChit in KOSA-1 was apparent.
Figure 3.8a: Southern blot analysis of KOSA-1 T 0 with HarChit (left) and Cho (right) probes, positive control – linearized (L) and cassette cut-out (C) of pUbiHarChit and pUbiCho were used. Cassette out fragment –ubi1-Chit-nos- of 4.525 kb lane C (A) and ubi1-HarCho-nos of 2.53 kb lane C (A). A single band representing a single integration was noted HarChit blot (A). Several bands (at least 5 in Cho) representing multiple integrations can be seen (B). Southern blot analysis of KOSA-1 T0 and T1 was carried out to confirm the inheritance of the
transgenes. Results showed that the transgenes were inherited in KOSA-1 T1 (Figure 3.8b).
Figure 3.8b: Southern blot analysis for gene integra tion in KOSA-1 T 0 and KOSA-1 T 1. Southern blot of KAT 412 T0 and T1 with DIG-labelled HarChit (A) and HarCho (B) probes. Linearized band (green arrow), cassette out band (white arrow). 1-3 (KAT 412 Wt), 4-6 (KOSA-1 T0), 7-9 (KOSA-1 T1), a-c (plasmid positive control). DNA samples were linearized with HindIII and EcoRI for HarChit and BamHI and SacI for HarCho. HarChit gene cassettes were excised with EcoRI and HindIII double digestion and HarCho with PvuII.
The 3 independent transgenic lines KOSA-1, 2 and 3 were analyzed by Southern blot. DNA
was extracted from these primary transformants, restricted with respective enzymes that
ChiWT WT To To L C
Cho
WT WT To To CL
Cho
WT WT To To CLWT WT To To L CWT WT To To L C
8576
2799
3639
8576
2799
3639
8576
27992799
36393639
Cho
WT WT To To CL
Cho
WT WT To To CL
Cho
WT WT To To CL
ChoWT WT To To CLWT WT To To CL CL
36393639
27992799
3639
2799
36393639
27992799
3639
2799
36393639
27992799
36393639
2799279927992799
36393639
27992799
ChiWT WT To To L C
Cho
WT WT To To CL
Cho
WT WT To To CLWT WT To To L CWT WT To To L C
8576
2799
3639
8576
2799
3639
8576
27992799
36393639
8576
2799
3639
8576
2799
3639
8576
27992799
36393639
Cho
WT WT To To CL
Cho
WT WT To To CL
Cho
WT WT To To CL
ChoWT WT To To CLWT WT To To CL CL
36393639
27992799
3639
2799
36393639
27992799
3639
2799
36393639
27992799
36393639
2799279927992799
36393639
27992799
36393639
27992799
3639
2799
36393639
27992799
3639
2799
36393639
27992799
36393639
2799279927992799
36393639
27992799
1 2 3 4 5 6 7 8 9 a b c 1 2 3 4 5 6 7 8 9 a b c
A B
1 2 3 4 5 6 7 8 9 a b c1 2 3 4 5 6 7 8 9 a b c 1 2 31 2 3 4 5 64 5 6 7 8 97 8 9 a b ca b c
A B
1 2 3 4 5 6 7 8 9 a b c1 2 3 4 5 6 7 8 9 a b c 1 2 31 2 3 4 5 64 5 6 7 8 97 8 9 a b ca b c
A B
1 2 3 4 5 6 7 8 9 a b c1 2 3 4 5 6 7 8 9 a b c 1 2 31 2 3 4 5 64 5 6 7 8 97 8 9 a b ca b c
A B
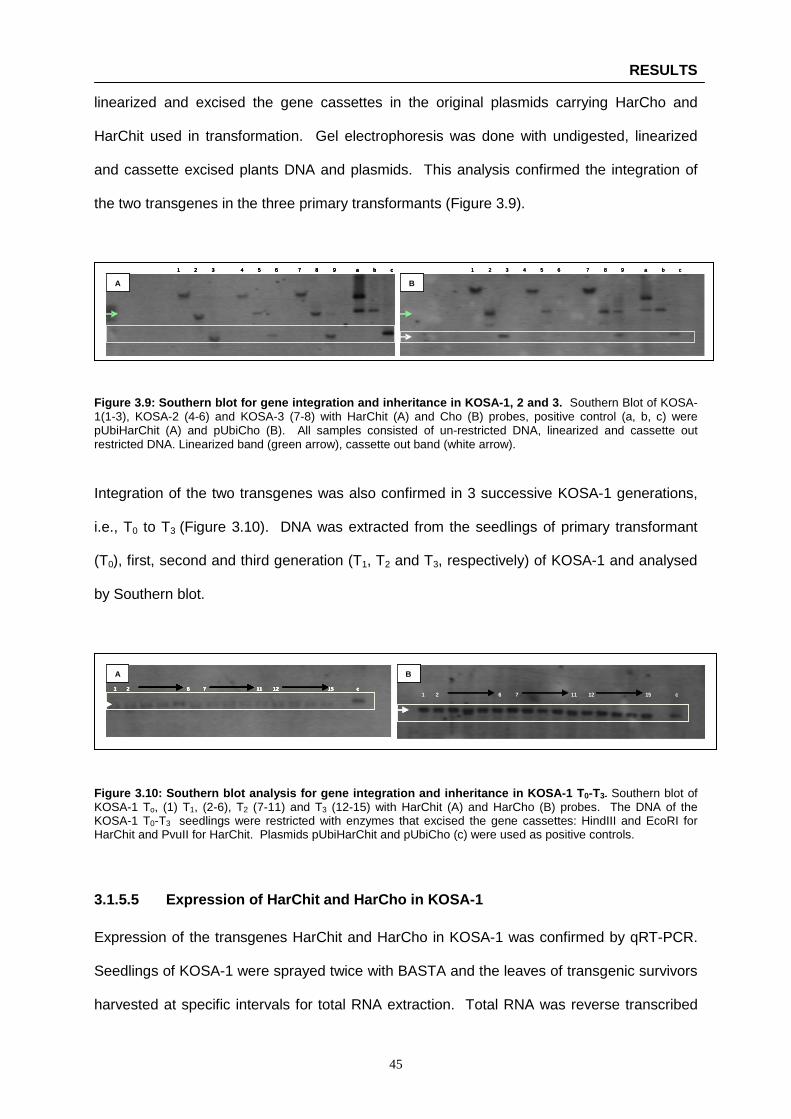
RESULTS
45
linearized and excised the gene cassettes in the original plasmids carrying HarCho and
HarChit used in transformation. Gel electrophoresis was done with undigested, linearized
and cassette excised plants DNA and plasmids. This analysis confirmed the integration of
the two transgenes in the three primary transformants (Figure 3.9).
Figure 3.9: Southern blot for gene integration and i nheritance in KOSA-1, 2 and 3. Southern Blot of KOSA-1(1-3), KOSA-2 (4-6) and KOSA-3 (7-8) with HarChit (A) and Cho (B) probes, positive control (a, b, c) were pUbiHarChit (A) and pUbiCho (B). All samples consisted of un-restricted DNA, linearized and cassette out restricted DNA. Linearized band (green arrow), cassette out band (white arrow).
Integration of the two transgenes was also confirmed in 3 successive KOSA-1 generations,
i.e., T0 to T3 (Figure 3.10). DNA was extracted from the seedlings of primary transformant
(T0), first, second and third generation (T1, T2 and T3, respectively) of KOSA-1 and analysed
by Southern blot.
Figure 3.10: Southern blot analysis for gene integra tion and inheritance in KOSA-1 T 0-T3- Southern blot of KOSA-1 To, (1) T1, (2-6), T2 (7-11) and T3 (12-15) with HarChit (A) and HarCho (B) probes. The DNA of the KOSA-1 T0-T3 seedlings were restricted with enzymes that excised the gene cassettes: HindIII and EcoRI for HarChit and PvuII for HarChit. Plasmids pUbiHarChit and pUbiCho (c) were used as positive controls.
3.1.5.5 Expression of HarChit and HarCho in KOSA-1
Expression of the transgenes HarChit and HarCho in KOSA-1 was confirmed by qRT-PCR.
Seedlings of KOSA-1 were sprayed twice with BASTA and the leaves of transgenic survivors
harvested at specific intervals for total RNA extraction. Total RNA was reverse transcribed
1 2 3 4 5 6 7 8 9 a b c
A
1 2 3 4 5 6 7 8 9 a b c
B
1 2 3 4 5 6 7 8 9 a b c1 2 3 4 5 6 7 8 9 a b c1 2 3 4 5 6 7 8 9 a b c
A
1 2 31 2 3 4 5 64 5 6 7 8 97 8 9 a b ca b c
B
A B
1 122 76 11 15 c1 122 76 11 15 c
A B
1 122 76 11 15 c1 122 76 11 15 c1 122 76 11 15 c1 122 76 11 15 c1 122 76 11 15 c
A B
1 122 76 11 15 c1 122 76 11 15 c1 122 76 11 15 c1 122 76 11 15 c1 122 76 11 15 c
A B
1 122 76 11 15 c1 122 76 11 15 c1 122 76 11 15 c1 122 76 11 15 c1 122 76 11 15 c1 122 76 11 15 c1 122 76 11 15 c1 122 76 11 15 c

RESULTS
46
into cDNA and used for gene expression study in a Biorad qRT-PCR iCycler. Expression of
the transgenes was quantified from the reverse transcribed cDNA which was a measure
abundance of their respective mRNA. Fold changes were computed in respect to the
expression of the sorghum actin gene (SbAct), a house-keeping gene which was used as the
internal control. It was established that both genes were expressed in all the transgenic
seedlings of KOSA-1 analyzed. The expression level varied between 0.5-2 FC (Figure 3.11).
Figure 3.11: qRT-PCR expression of HarChit and HarCho in KOSA-1 T 0. cDNA of KOSA-1 T0, pUbiHarChit and pUbiHarCho were analysed by qRT-PCR. HarChit (A) and HarCho (B) were profiled in KOSA-1 T1 and the plasmids used as the positive control. Analysis of the melting curves of HarChit (C) and HarCho (D) in comparison to their respective positive controls (E) confirmed their identities and expression in sorghum. Determination of fold changes (FC) in the activity of the two transgenes in 2 weeks old seedlings of KOSA-1 established their expression in all the samples studied during a 72 hour analysis window (F).
3.2 AGROBACTERIUM-MEDIATED TRANSFORMATION
The Agrobacterium tumefaciens strain expressing the gus marker gene was used to study
the optimum conditions for Agrobacterium-mediated transformation. The following variables
were studied: 1) 4 media sets: inoculation, co-cultivation, resting, selection and regeneration
media; 2) Inoculation time (60-240 min); 3) Embryos inoculation technique: liquid vs. solid; 4)
Co-cultivation method: scutelli direction (adaxial and abaxial); 5) Co-cultivation temperature:
21, 26 and 28oC; 6) Co-cultivation duration: 2 – 7 days.
0
0,5
1
1,5
2
2,5
3
3,5
4
0 HPI 18 HPI 24 HPI 48 HPI 72 HPI
HPI
FC HarCho
HarChit
0
10
20
30
40
50
60
70
80
90
100
KOSA-1 - HarCho pHarCho - (+vecontrol)
Water (-ve control) KOSA-1 - HarChit pHarChit - (+vecontrol)
Water (-ve control)
qRT Samples
Tem
pera
ture
(°C
)/C
t
Average Melting Temperature (°C)
Average Ct
A B C
D E F
0
0,5
1
1,5
2
2,5
3
3,5
4
0 HPI 18 HPI 24 HPI 48 HPI 72 HPI
HPI
FC HarCho
HarChit
0
10
20
30
40
50
60
70
80
90
100
KOSA-1 - HarCho pHarCho - (+vecontrol)
Water (-ve control) KOSA-1 - HarChit pHarChit - (+vecontrol)
Water (-ve control)
qRT Samples
Tem
pera
ture
(°C
)/C
t
Average Melting Temperature (°C)
Average Ct
A B C
D E F

RESULTS
47
3.2.1 Liquid and Solid Phase Agrobacterium Infection
The effect of inoculation phase was studied to establish whether liquid immersion negatively
affected IZE survival and calli formation after infection with Agrobacterium. Two inoculation
phases were used: liquid and solid phase. 3 batches, each containing 30 IZE of KAT 412,
were infected with Agrobacterium either in liquid or solid state. In solid phase-infection, IZE
were infected with droplets of inoculums while embedded on co-cultivation medium and in
liquid phase-infection embryos were suspended in AIM for 30 minutes (Figure 3.12). The
number and proportion of surviving IZE developing calli was quantified 4 and 10 days after
Agrobacterium infection.
Figure 3.12: Effect of Agrobacterium liquid and solid phase inoculation of KAT 412 IZE. KAT 412 IZE were
infected with Agrobacterium on either liquid or solid phase. Survival of IZE calli was analysed after 4 and 10 days
in calli induction media. Liquid phase inoculation resulted in better IZE survival and calli development.
The results showed no significant difference between the liquid and solid media after 4 days
in culture. However, survival after 10 days was markedly higher in IZE cultures infected in
liquid than solid medium. Liquid suspension positively affected calli formation. The result
showed that liquid phase infection was associated with higher calli formation (29.28%) than
solid phase (16.13%).
0
20
40
60
80
100
120
4 Days 10 Days
Days of Co-cultivation
% S
urvi
val
Average Liquid Phase
Average Solid Phase

RESULTS
48
3.2.2 Effect of the Duration of Agrobacterium Infection
An experiment was carried out to determine the effect of the duration of Agrobacterium
infection on the calli development from IZE infected on solid and in liquid media. Triplicates
of 30 KAT 412 IZE were incubated with Agrobacterium culture for 60-240 minutes under the
two phases of inoculation and the number of IZE that developed calli formed enumerated
after culturing at 26°C for 10 days in ARM. Infect ion duration significantly affected calli
development (Figure 3.13). A longer inoculation period did not negatively affect the
development of calli. Better calli development was noted in IZE that was incubated for longer
duration with Agrobacterium in liquid media. Inoculation for 60 minutes and 240 was
associated with 1.01% and 53% in liquid medium and 1.5% and 49.67% in solid medium,
respectively.
Figure 3.13: Effect of infection duration of KAT 412 IZE with Agrobacterium on IZE survival . IZE were inoculated for 50-240 minutes under shaking. The surviving IZE were enumerated 10 Days after Inoculation. Longer periods of inoculation did not have a negative effect on IZE survival.
3.2.3 Sorghum Embryos Orientation and Regeneration
Intimate contact with Agrobacterium is prerequisite for any transformation event. Increasing
the level of contact of scutelli with culture media containing acetosyringone could be a way of
0
10
20
30
40
50
60
70
60Min 120Min 180Min 240Min
Innoculation Medium
% s
urvi
val
Liquid Medium
Solid Medium
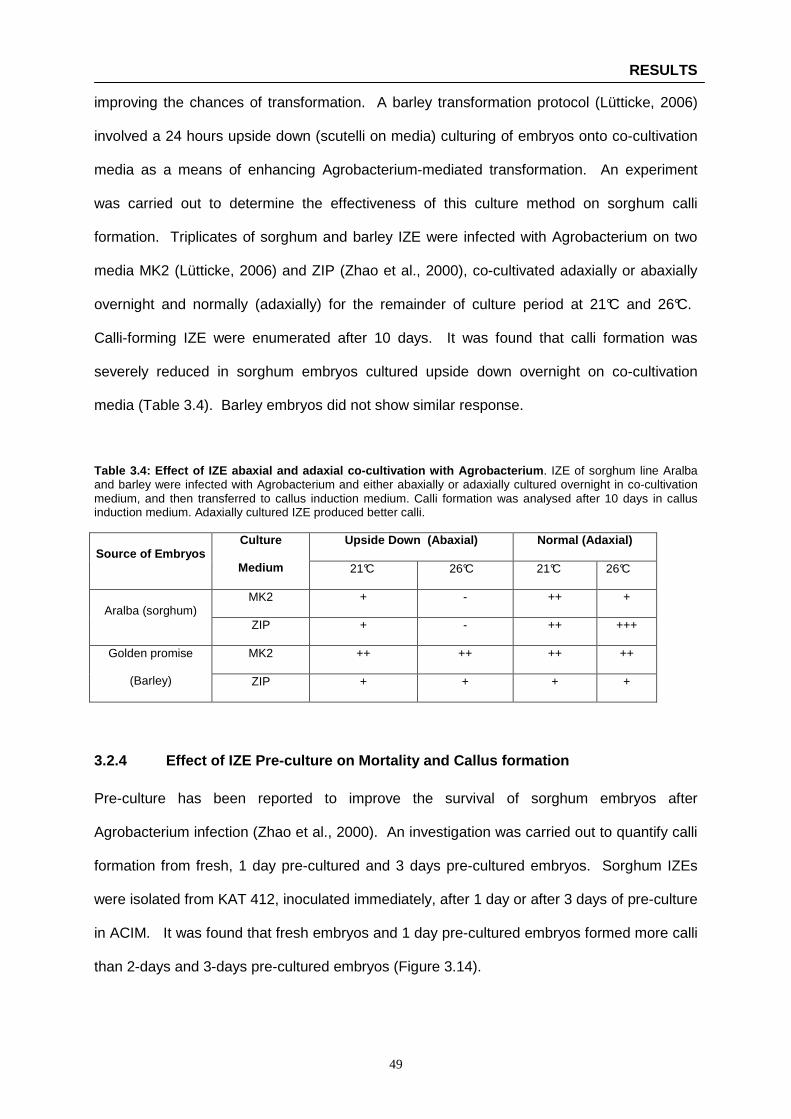
RESULTS
49
improving the chances of transformation. A barley transformation protocol (Lütticke, 2006)
involved a 24 hours upside down (scutelli on media) culturing of embryos onto co-cultivation
media as a means of enhancing Agrobacterium-mediated transformation. An experiment
was carried out to determine the effectiveness of this culture method on sorghum calli
formation. Triplicates of sorghum and barley IZE were infected with Agrobacterium on two
media MK2 (Lütticke, 2006) and ZIP (Zhao et al., 2000), co-cultivated adaxially or abaxially
overnight and normally (adaxially) for the remainder of culture period at 21°C and 26°C.
Calli-forming IZE were enumerated after 10 days. It was found that calli formation was
severely reduced in sorghum embryos cultured upside down overnight on co-cultivation
media (Table 3.4). Barley embryos did not show similar response.
Table 3.4: Effect of IZE abaxial and adaxial co-culti vation with Agrobacterium. IZE of sorghum line Aralba and barley were infected with Agrobacterium and either abaxially or adaxially cultured overnight in co-cultivation medium, and then transferred to callus induction medium. Calli formation was analysed after 10 days in callus induction medium. Adaxially cultured IZE produced better calli.
Upside Down (Abaxial) Normal (Adaxial) Source of Embryos
Culture
Medium 21°C 26°C 21°C 26°C
MK2 + - ++ + Aralba (sorghum)
ZIP + - ++ +++
MK2 ++ ++ ++ ++ Golden promise
(Barley) ZIP + + + +
3.2.4 Effect of IZE Pre-culture on Mortality and Ca llus formation
Pre-culture has been reported to improve the survival of sorghum embryos after
Agrobacterium infection (Zhao et al., 2000). An investigation was carried out to quantify calli
formation from fresh, 1 day pre-cultured and 3 days pre-cultured embryos. Sorghum IZEs
were isolated from KAT 412, inoculated immediately, after 1 day or after 3 days of pre-culture
in ACIM. It was found that fresh embryos and 1 day pre-cultured embryos formed more calli
than 2-days and 3-days pre-cultured embryos (Figure 3.14).
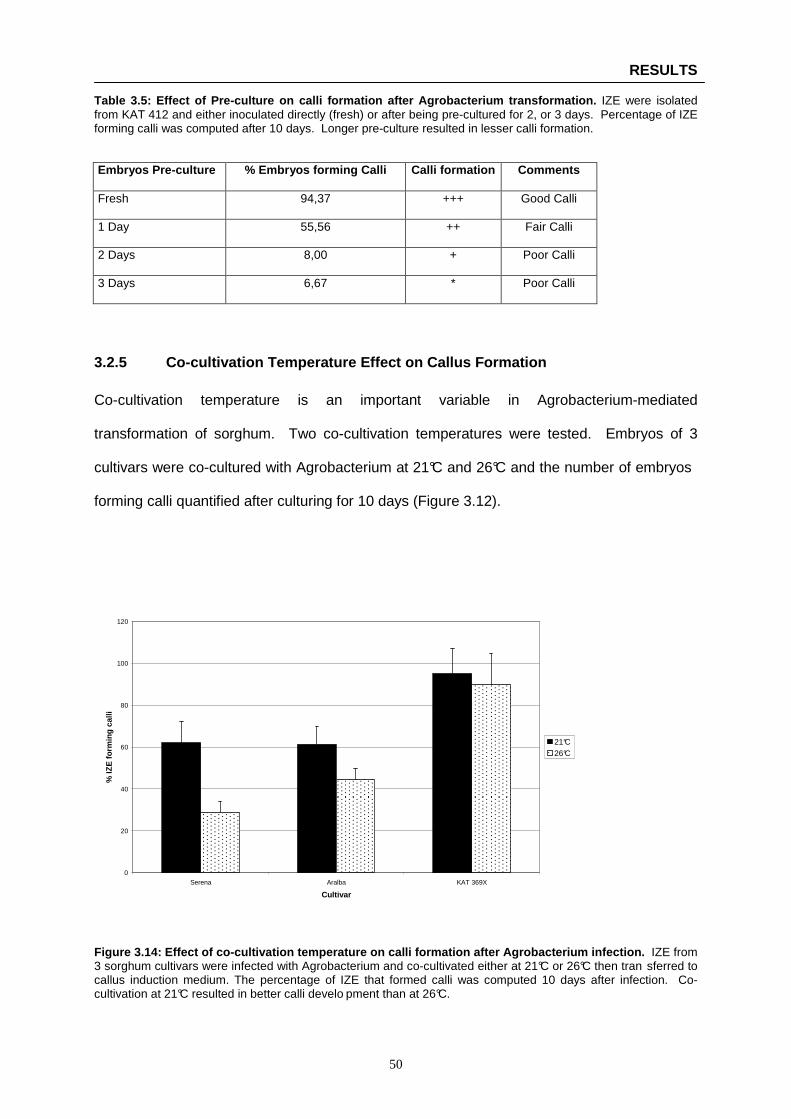
RESULTS
50
Table 3.5: Effect of Pre-culture on calli formation a fter Agrobacterium transformation. IZE were isolated from KAT 412 and either inoculated directly (fresh) or after being pre-cultured for 2, or 3 days. Percentage of IZE forming calli was computed after 10 days. Longer pre-culture resulted in lesser calli formation.
Embryos Pre-culture % Embryos forming Calli Calli form ation Comments
Fresh 94,37 +++ Good Calli
1 Day 55,56 ++ Fair Calli
2 Days 8,00 + Poor Calli
3 Days 6,67 * Poor Calli
3.2.5 Co-cultivation Temperature Effect on Callus F ormation
Co-cultivation temperature is an important variable in Agrobacterium-mediated
transformation of sorghum. Two co-cultivation temperatures were tested. Embryos of 3
cultivars were co-cultured with Agrobacterium at 21°C and 26°C and the number of embryos
forming calli quantified after culturing for 10 days (Figure 3.12).
Figure 3.14: Effect of co-cultivation temperature on calli formation after Agrobacterium infection. IZE from 3 sorghum cultivars were infected with Agrobacterium and co-cultivated either at 21°C or 26°C then tran sferred to callus induction medium. The percentage of IZE that formed calli was computed 10 days after infection. Co-cultivation at 21°C resulted in better calli develo pment than at 26°C.
0
20
40
60
80
100
120
Serena Aralba KAT 369X
Cultivar
% IZ
E fo
rmin
g ca
lli
21°C26°C

RESULTS
51
The results showed that co-cultivation at 21°C resu lted in more calli formation than at 26°C.
This was observed in all the three sorghum lines studied.
3.2.6 MgSO4 Activation and Regeneration Potential
A set of pre-culture treatment and culture conditions were studied to establish the best
parameters for IZE survival and calli development (Figure 3.15). Embryos were pre-
suspended in inoculation medium, 200 µM acetosyringone and 0.01% Silwet®. These were
then inoculated with either Agrobacterium culture-pellet that was unwashed or washed (with
10 mM MgSO4). Sorghum IZE that were pre-washed formed more calli and were readily
regenerated.
Figure 3.15: Organogenesis and regeneration of sorg hum after Agrobacterium infection under different pre-culture treatment. IZE were isolated and infected with Agrobacterium (OD=0.3) that was either pre-washed with 10 mM MgSO4 (A and B) or unwashed (C). The washed embryos were either cultured at 21°C (A) or 26°C (B). IZE infected with washed Agrobacterium and cultivated at 21°C produced the best calli.
3.2.7 Transient and Stable GUS Activity in Agrobacterium-
The sorghum line, Aralba, was transformed with Agrobacterium containing the gus gene.
Aralba IZE were isolated, pre-cultured for 1 day and infected with Agrobacterium carrying
gus gene. The IZE and Agrobacterium were co-cultivated for 4 days and then transferred to
callus induction medium for 2 weeks. GUS activity was histochemically tested after 2 days
and 14 days in callus induction media (Figure 3.16).
(i) (ii)
(iii)(iv)
(a) (b)
(c)(d)
(1) (2)
(3)(4)
A B C(i) (ii)
(iii)(iv)
(a) (b)
(c)(d)
(1) (2)
(3)(4)
A B C(i) (ii)
(iii)(iv)
(a) (b)
(c)(d)
(1) (2)
(3)(4)
A B C

RESULTS
52
Transient and stable gus expression on sorghum calli were achieved. The transient gus
expression events were observed after two days in culture did not lead to stable integration
except for one event out of the 1,578 transformed IZE.
Figure 3.16: Transient and stable gus expression in Agrobacterium-infected Aralba IZE. Aralba IZE were infected with Agrobacterium carrying gus gene. The IZE and Agrobacterium were co-cultivated for 4 days and then transferred to callus induction medium for 2 weeks. GUS activity was histochemically tested after 2 days (A and B) and 14 days (C) in callus induction media. Transient (A and B) and stable gus expression on sorghum calli (C) (arrow) was achieved.
3.3 RESPONSES TO COLLETOTRICHUM SUBLINEOLUM INFECTION
3.3.1 Ex Planta Infection Responses
Ex Planta (in vitro) infection was carried out on 2 weeks old sorghum leaf segments of 8
sorghum lines. Leaves of 24 seedlings of each cultivar were excised and cut into 3 equal
segments and plated on 0.8% neutral agar contain 40 mg/l benzimidazole (Figure 3.17).
Figure 3.17 Point and spray infection. Sorghum leaf segments on in vitro culture chambers after point infection with 10 µl inoculum (A) and spray infection (B). The samples in culture plates were left to briefly dry under a sterile hood (C) and thereafter incubated in a growth chamber under standard light and temperature conditions.
A B CA B C
A B CA B C
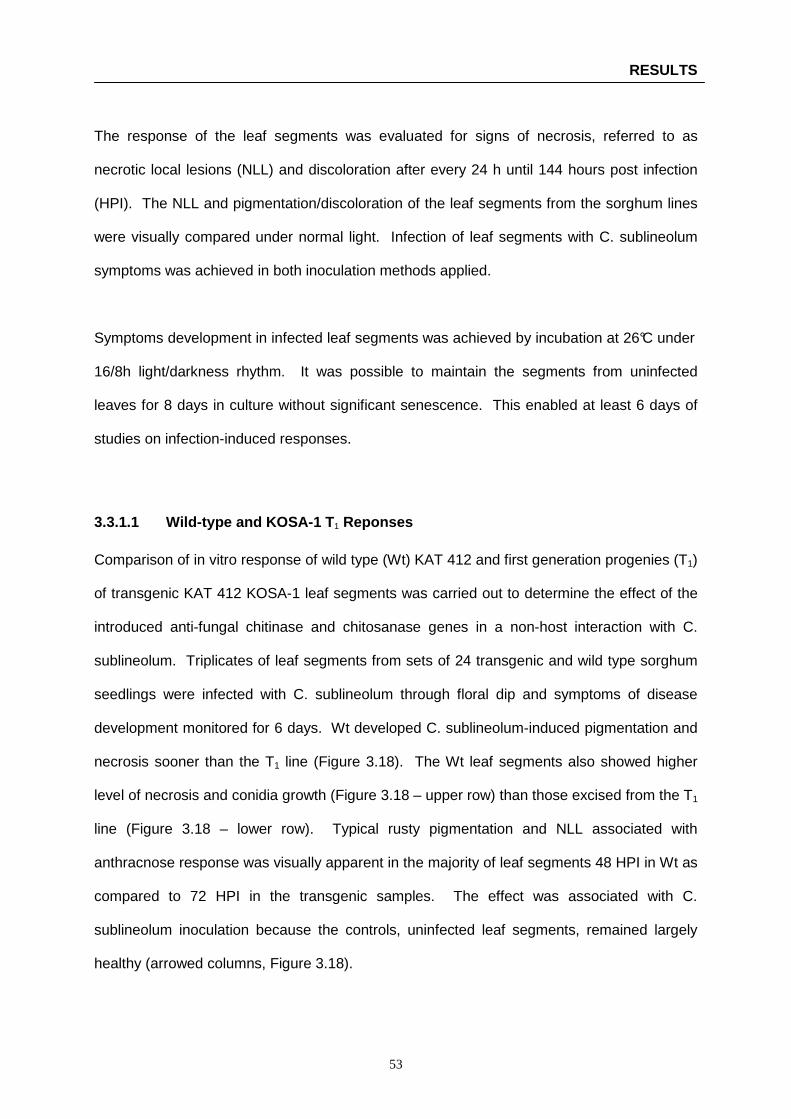
RESULTS
53
The response of the leaf segments was evaluated for signs of necrosis, referred to as
necrotic local lesions (NLL) and discoloration after every 24 h until 144 hours post infection
(HPI). The NLL and pigmentation/discoloration of the leaf segments from the sorghum lines
were visually compared under normal light. Infection of leaf segments with C. sublineolum
symptoms was achieved in both inoculation methods applied.
Symptoms development in infected leaf segments was achieved by incubation at 26°C under
16/8h light/darkness rhythm. It was possible to maintain the segments from uninfected
leaves for 8 days in culture without significant senescence. This enabled at least 6 days of
studies on infection-induced responses.
3.3.1.1 Wild-type and KOSA-1 T1 Reponses
Comparison of in vitro response of wild type (Wt) KAT 412 and first generation progenies (T1)
of transgenic KAT 412 KOSA-1 leaf segments was carried out to determine the effect of the
introduced anti-fungal chitinase and chitosanase genes in a non-host interaction with C.
sublineolum. Triplicates of leaf segments from sets of 24 transgenic and wild type sorghum
seedlings were infected with C. sublineolum through floral dip and symptoms of disease
development monitored for 6 days. Wt developed C. sublineolum-induced pigmentation and
necrosis sooner than the T1 line (Figure 3.18). The Wt leaf segments also showed higher
level of necrosis and conidia growth (Figure 3.18 – upper row) than those excised from the T1
line (Figure 3.18 – lower row). Typical rusty pigmentation and NLL associated with
anthracnose response was visually apparent in the majority of leaf segments 48 HPI in Wt as
compared to 72 HPI in the transgenic samples. The effect was associated with C.
sublineolum inoculation because the controls, uninfected leaf segments, remained largely
healthy (arrowed columns, Figure 3.18).
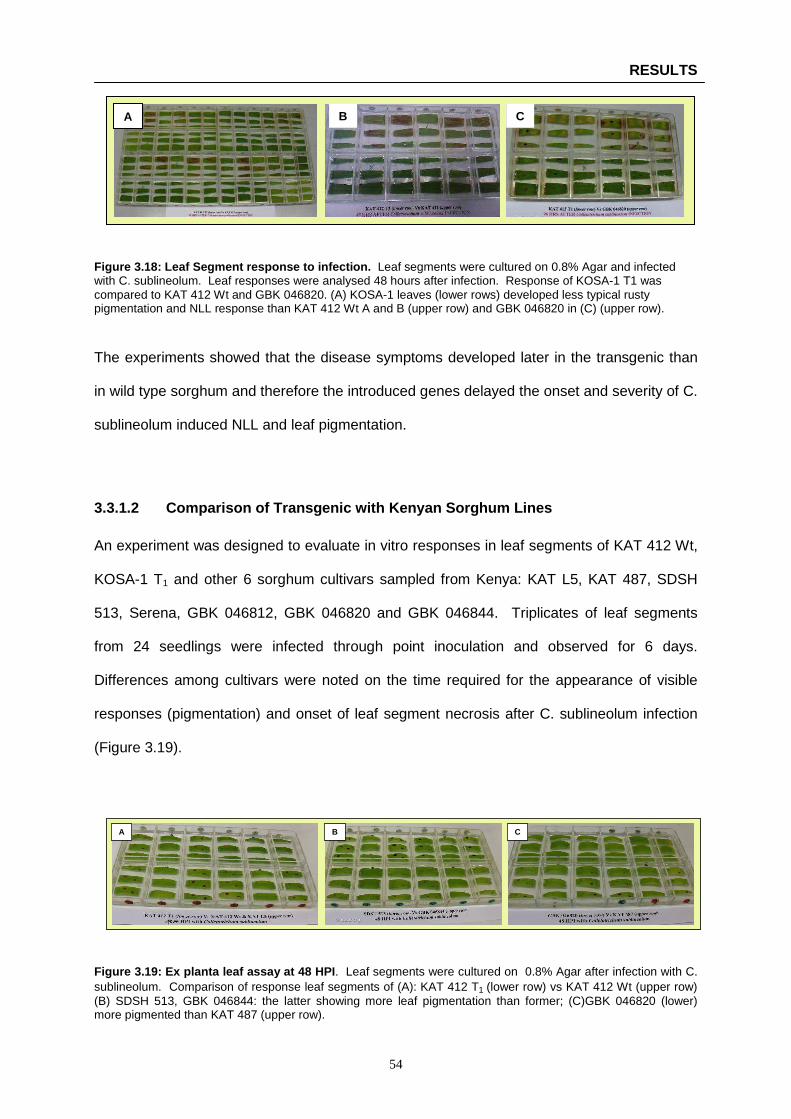
RESULTS
54
Figure 3.18: Leaf Segment response to infection. Leaf segments were cultured on 0.8% Agar and infected with C. sublineolum. Leaf responses were analysed 48 hours after infection. Response of KOSA-1 T1 was compared to KAT 412 Wt and GBK 046820. (A) KOSA-1 leaves (lower rows) developed less typical rusty pigmentation and NLL response than KAT 412 Wt A and B (upper row) and GBK 046820 in (C) (upper row).
The experiments showed that the disease symptoms developed later in the transgenic than
in wild type sorghum and therefore the introduced genes delayed the onset and severity of C.
sublineolum induced NLL and leaf pigmentation.
3.3.1.2 Comparison of Transgenic with Kenyan Sorghum Lines
An experiment was designed to evaluate in vitro responses in leaf segments of KAT 412 Wt,
KOSA-1 T1 and other 6 sorghum cultivars sampled from Kenya: KAT L5, KAT 487, SDSH
513, Serena, GBK 046812, GBK 046820 and GBK 046844. Triplicates of leaf segments
from 24 seedlings were infected through point inoculation and observed for 6 days.
Differences among cultivars were noted on the time required for the appearance of visible
responses (pigmentation) and onset of leaf segment necrosis after C. sublineolum infection
(Figure 3.19).
Figure 3.19: Ex planta leaf assay at 48 HPI . Leaf segments were cultured on 0.8% Agar after infection with C. sublineolum. Comparison of response leaf segments of (A): KAT 412 T1 (lower row) vs KAT 412 Wt (upper row) (B) SDSH 513, GBK 046844: the latter showing more leaf pigmentation than former; (C)GBK 046820 (lower) more pigmented than KAT 487 (upper row).
A B CA B C
A B CA B C
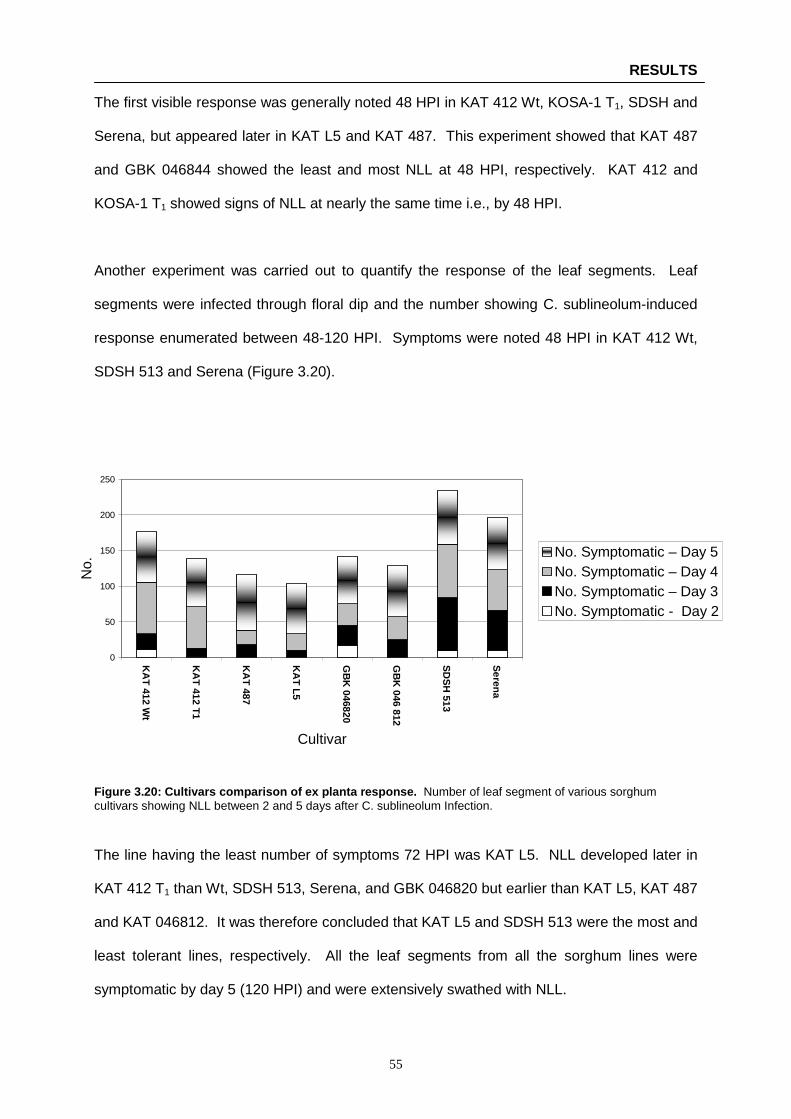
RESULTS
55
The first visible response was generally noted 48 HPI in KAT 412 Wt, KOSA-1 T1, SDSH and
Serena, but appeared later in KAT L5 and KAT 487. This experiment showed that KAT 487
and GBK 046844 showed the least and most NLL at 48 HPI, respectively. KAT 412 and
KOSA-1 T1 showed signs of NLL at nearly the same time i.e., by 48 HPI.
Another experiment was carried out to quantify the response of the leaf segments. Leaf
segments were infected through floral dip and the number showing C. sublineolum-induced
response enumerated between 48-120 HPI. Symptoms were noted 48 HPI in KAT 412 Wt,
SDSH 513 and Serena (Figure 3.20).
Figure 3.20: Cultivars comparison of ex planta response. Number of leaf segment of various sorghum cultivars showing NLL between 2 and 5 days after C. sublineolum Infection.
The line having the least number of symptoms 72 HPI was KAT L5. NLL developed later in
KAT 412 T1 than Wt, SDSH 513, Serena, and GBK 046820 but earlier than KAT L5, KAT 487
and KAT 046812. It was therefore concluded that KAT L5 and SDSH 513 were the most and
least tolerant lines, respectively. All the leaf segments from all the sorghum lines were
symptomatic by day 5 (120 HPI) and were extensively swathed with NLL.
0
50
100
150
200
250
KA
T 412 W
t
KA
T 412 T
1
KA
T 487
KA
T L5
GB
K 046820
GB
K 046 812
SD
SH
513
Serena
Cultivar
No.
No. Symptomatic – Day 5No. Symptomatic – Day 4No. Symptomatic – Day 3No. Symptomatic - Day 2
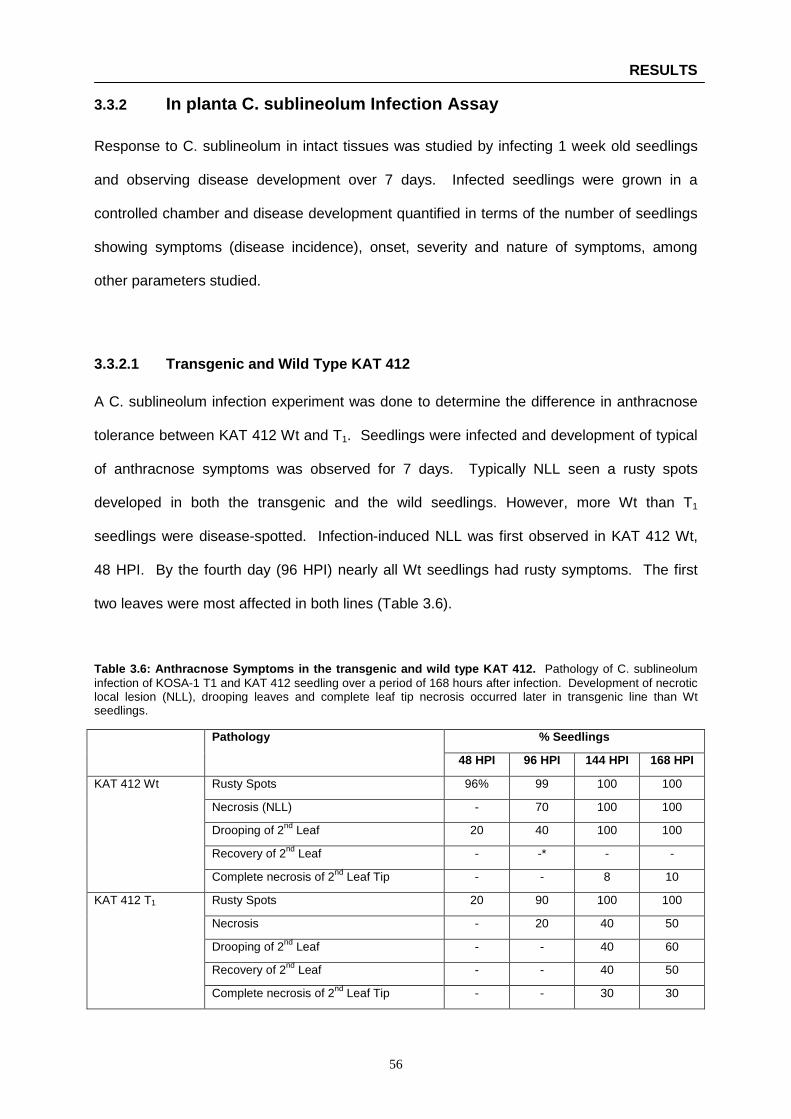
RESULTS
56
3.3.2 In planta C. sublineolum Infection Assay
Response to C. sublineolum in intact tissues was studied by infecting 1 week old seedlings
and observing disease development over 7 days. Infected seedlings were grown in a
controlled chamber and disease development quantified in terms of the number of seedlings
showing symptoms (disease incidence), onset, severity and nature of symptoms, among
other parameters studied.
3.3.2.1 Transgenic and Wild Type KAT 412
A C. sublineolum infection experiment was done to determine the difference in anthracnose
tolerance between KAT 412 Wt and T1. Seedlings were infected and development of typical
of anthracnose symptoms was observed for 7 days. Typically NLL seen a rusty spots
developed in both the transgenic and the wild seedlings. However, more Wt than T1
seedlings were disease-spotted. Infection-induced NLL was first observed in KAT 412 Wt,
48 HPI. By the fourth day (96 HPI) nearly all Wt seedlings had rusty symptoms. The first
two leaves were most affected in both lines (Table 3.6).
Table 3.6: Anthracnose Symptoms in the transgenic a nd wild type KAT 412. Pathology of C. sublineolum infection of KOSA-1 T1 and KAT 412 seedling over a period of 168 hours after infection. Development of necrotic local lesion (NLL), drooping leaves and complete leaf tip necrosis occurred later in transgenic line than Wt seedlings.
% Seedlings Pathology
48 HPI 96 HPI 144 HPI 168 HPI
Rusty Spots 96% 99 100 100
Necrosis (NLL) - 70 100 100
Drooping of 2nd Leaf 20 40 100 100
Recovery of 2nd Leaf - -* - -
KAT 412 Wt
Complete necrosis of 2nd Leaf Tip - - 8 10
Rusty Spots 20 90 100 100
Necrosis - 20 40 50
Drooping of 2nd Leaf - - 40 60
Recovery of 2nd Leaf - - 40 50
KAT 412 T1
Complete necrosis of 2nd Leaf Tip - - 30 30

RESULTS
57
Tips of the third leaf were also symptomatic. Drooping of the second leaves was also
pronounced in Wt. The 2nd leaves of T1 showed resilience and recovery without drooping.
These results were clearer by 120 HPI. Leaf rusting, drooping and necrosis were severe in
Wt than T1. There was complete necrosis of the 2nd leaf in all Wt and 3/11 T1 seedlings 7
days after infection.
Comparison of symptoms development confirmed that the leaves of the transgenic line
exhibited lesser necrosis than wild types. For example by 168 HPI nearly all the second leaf
of KAT 412 Wt seedlings showed complete necrosis as compared to only 30% of T1
seedlings. Recovery of leaves after developing symptoms of infections was higher in
transgenic line (arrows, Figure 3.21).
Figure 3.21: In Planta sorghum infection experiment. KAT 412 Wt and KOSA-1 T1 seedlings were spray-infected with C. sublineolum. Symptoms development was recorded on the 5th day after infection. Shrivelled and necrotic Wt (A) and more tolerant and healthier-looking transgenic KOSA-1 (B) 5 days after infection.
3.3.2.2 Evaluation of C. sublineolum Tolerance in Sorghum Lines
In addition to the above pair-wise evaluation of transgenic and wilt type KAT 412, multiple
comparison involving 6 other Kenyan sorghum lines: KAT 487, KAT L5, GBK 046820, GBK
047844, SDSH 513 and Serena was carried out to rank in planta responses. 30 seedlings of
A BA B

RESULTS
58
one week old sorghum seedlings of each of the cultivars under investigation were infected
with C. sublineolum conidia and cultivated in a growth chamber under standard conditions.
Development of disease symptoms was evaluated for 144 hours. Infection of sorghum
seedlings was achieved in all the sorghum lines studied under high humidity and
temperature. Seedlings of KAT L5 and SDSH 513 developed the least and most symptoms,
respectively (Figure 3.20). Comparison of the Wt and T1 showed that the seedlings of the
former (62.07%) and the latter (28.21%) had developed symptoms by 144 HPI. By the same
time, 13.51% and 96.97% of KAT L5 and SDSH seedlings, respectively, showed signs of
infection. This experiment established that the transgenic line was more tolerant to
anthracnose than the wild type. It was also confirmed that KAT L5 and SDSH 513 were the
most tolerant and susceptible lines respectively (Figure 3.22).
Figure 3.22: In Planta infection response in transgenic and Kenyan cultiv ars. Average number of seedlings of transgenic and various sorghum cultivars showing symptoms at 144 HPI with C. sublineolum.
3.3.2.3 Anthracnose in Transgenic, Susceptible and Tolerant Sorghum
Comparison of response to infection was made between the transgenic line and the two
cultivars that showed extreme responses under ex planta and in planta assays: tolerant KAT
L5 and susceptible SDSH 513. An experiment was designed by infecting 30 seedlings from
each cultivar with conidia of C. sublineolum. Development of symptoms was quantified after
0
5
10
15
20
25
30
35
40
KAT 412 Wt KAT 412 T1 KAT 487 KAT L5 GBK 046820 GBK 046844 SDSH 513 Serena
Sorghum Lines
Ave
rage
sym
ptom
atic
see
dlin
gs

RESULTS
59
24, 48, 72, 96, 120 and 144 HPI. The experiment was repeated 3 times. The number of
seedlings showing any signs of C. sublineolum infection was enumerated at every
observation interval. Results showed that the response varied among the 4 lines studied,
with SDSH 513 seedlings suffering the most necrosis and senescence on the first two leaves
(Figure 3.23).
Figure 3.23: Seedlings response to C. sublineolum infection. Sorghum seedlings were infected and disease development monitored over a period of 144 HPI. Anthracnose symptoms on the first two leaves at 144 HPI: no symptoms on KAT L5 leaves – resistant (A), few necrotic local lesions ((NLL) on KAT 412 T1 leaves - tolerant (B), extensive NLL in KAT 412 Wt – less tolerant (C) and extensive NLL on both leaf blades and sheath, chlorosis and discoloration of both leaves of SDSH 513 – susceptible (D).
Seedlings of the transgenic line showed more tolerance than the Wt, while KAT L5 was the
most tolerant. A large proportion of KAT L5 seedlings showed no signs of disease during the
experimental period. It was also apparent that, unlike KAT L5, infection in KAT 412 Wt, T1
and SDSH 513 extended to the first and second leaf blades and sheaths by 144 HPI. The
timing of the onset, distribution and severity of disease symptoms varied among the cultivars.
The first symptoms appeared 48 HPI on the leaves of SDSH 513 and Kat 412 Wt. Disease
symptoms were apparent in all the cultivars by 72 HPI. Observation of the symptoms
distribution revealed that by 144 HPI, infection symptoms in KAT L5 were restricted to the
leaf blades of the second leaves which were spotted with few NLL. Similar pattern was seen
on leaves of T1 seedlings, albeit with higher density. However, infection symptoms in KAT
412 Wt were more severe and extended to the blade and leaf sheath of first and second
A B C DA B C D
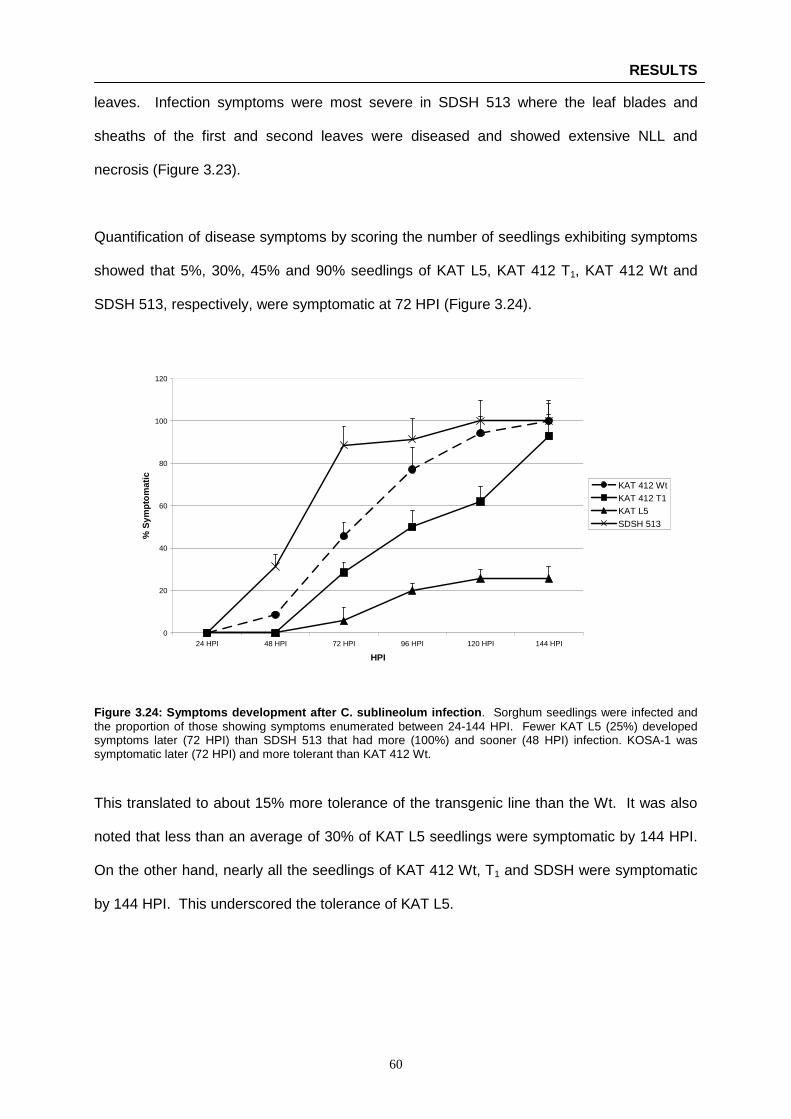
RESULTS
60
leaves. Infection symptoms were most severe in SDSH 513 where the leaf blades and
sheaths of the first and second leaves were diseased and showed extensive NLL and
necrosis (Figure 3.23).
Quantification of disease symptoms by scoring the number of seedlings exhibiting symptoms
showed that 5%, 30%, 45% and 90% seedlings of KAT L5, KAT 412 T1, KAT 412 Wt and
SDSH 513, respectively, were symptomatic at 72 HPI (Figure 3.24).
Figure 3.24: Symptoms development after C. sublineolum infection . Sorghum seedlings were infected and the proportion of those showing symptoms enumerated between 24-144 HPI. Fewer KAT L5 (25%) developed symptoms later (72 HPI) than SDSH 513 that had more (100%) and sooner (48 HPI) infection. KOSA-1 was symptomatic later (72 HPI) and more tolerant than KAT 412 Wt.
This translated to about 15% more tolerance of the transgenic line than the Wt. It was also
noted that less than an average of 30% of KAT L5 seedlings were symptomatic by 144 HPI.
On the other hand, nearly all the seedlings of KAT 412 Wt, T1 and SDSH were symptomatic
by 144 HPI. This underscored the tolerance of KAT L5.
0
20
40
60
80
100
120
24 HPI 48 HPI 72 HPI 96 HPI 120 HPI 144 HPI
HPI
% S
ympt
omat
ic
KAT 412 WtKAT 412 T1KAT L5SDSH 513

RESULTS
61
3.4 REAL TIME QUANTIFICATION OF GENE EXPRESSION
Expression of the transgenes, chitinase (HarChit) and chitosanase (HarCho), and sorghum
innate genes were profiled by quantitative real time PCR (qRT-PCR). Four innate PR-genes
representing the upstream and downstream pathogenesis response system were also
selected for analysis. These were sorghum leucine-rich repeat (SbLRR), sorghum chalcone
synthase-like gene 2 (SbCHS2), sorghum chalcone synthase-like gene 8 (SbCHS8) and
sorghum chitinase (SbChit). The expression of HarChit, HarCho, SbChit, SbCHS2, SbCHS8
and SbLRR were studied in leaves of seedlings of one transgenic line, KOSA-1 and 5 other
wild sorghum lines. The 5 sorghum lines, KOSA-1, KAT 412 Wt, KAT L5, Serena and SDSH
513 and were planted under controlled temperature and light conditions in a growth chamber.
One week old seedlings were infected with 1 x 10⁶ conidia/ml of C. sublineolum. Triplicate
random samples of the infected second leaf were taken at specific time intervals for RNA
extraction, first strand cDNA synthesis and real time gene expression quantification. Two
types of samples were infected: intact seedlings (in planta assay) and detached second
leaves (ex planta assay). The detached leaves were cultured on 0.8% neutral agar
containing 40 mg/l benzimidazole. Leaf samples from intact leaves were taken at specific
time interval (hours post infection – HPI) and expression of the PR-genes quantified between
0-144 HPI. Samples of detached leaves were taken only at 48 HPI. Quantification of gene
expression in qRT-PCR cycler was done by evaluating the changes in level of cDNA. Paired
analyses of infected and non-infected samples were done. Gene expression was denoted as
fold changes (FC) and was computed from the difference in the level of cDNA between the
infected and control samples. Up- or down-regulation were deduced from the FC, i.e., FC =
1 denoted no change in gene activity; thus up-regulation >FC=1> down-regulation. House-
keeping gene, sorghum actin, was used as the reference control. Analysis of variation
(ANOVA) and post ANOVA Newman-Keuls test was done to determine the significance of
the FC variation noted between the time (HPI), genes and cultivars.
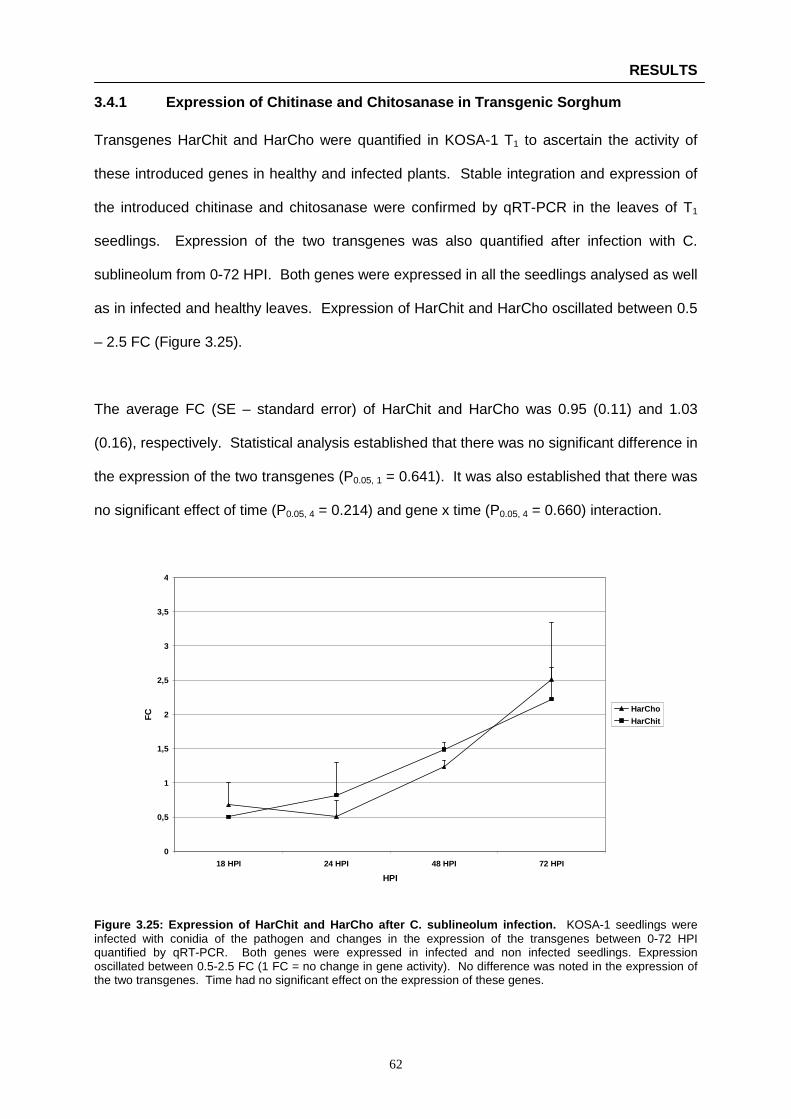
RESULTS
62
3.4.1 Expression of Chitinase and Chitosanase in Tr ansgenic Sorghum
Transgenes HarChit and HarCho were quantified in KOSA-1 T1 to ascertain the activity of
these introduced genes in healthy and infected plants. Stable integration and expression of
the introduced chitinase and chitosanase were confirmed by qRT-PCR in the leaves of T1
seedlings. Expression of the two transgenes was also quantified after infection with C.
sublineolum from 0-72 HPI. Both genes were expressed in all the seedlings analysed as well
as in infected and healthy leaves. Expression of HarChit and HarCho oscillated between 0.5
– 2.5 FC (Figure 3.25).
The average FC (SE – standard error) of HarChit and HarCho was 0.95 (0.11) and 1.03
(0.16), respectively. Statistical analysis established that there was no significant difference in
the expression of the two transgenes (P0.05, 1 = 0.641). It was also established that there was
no significant effect of time (P0.05, 4 = 0.214) and gene x time (P0.05, 4 = 0.660) interaction.
Figure 3.25: Expression of HarChit and HarCho after C. sublineolum infection. KOSA-1 seedlings were infected with conidia of the pathogen and changes in the expression of the transgenes between 0-72 HPI quantified by qRT-PCR. Both genes were expressed in infected and non infected seedlings. Expression oscillated between 0.5-2.5 FC (1 FC = no change in gene activity). No difference was noted in the expression of the two transgenes. Time had no significant effect on the expression of these genes.
0
0,5
1
1,5
2
2,5
3
3,5
4
18 HPI 24 HPI 48 HPI 72 HPI
HPI
FC HarCho
HarChit
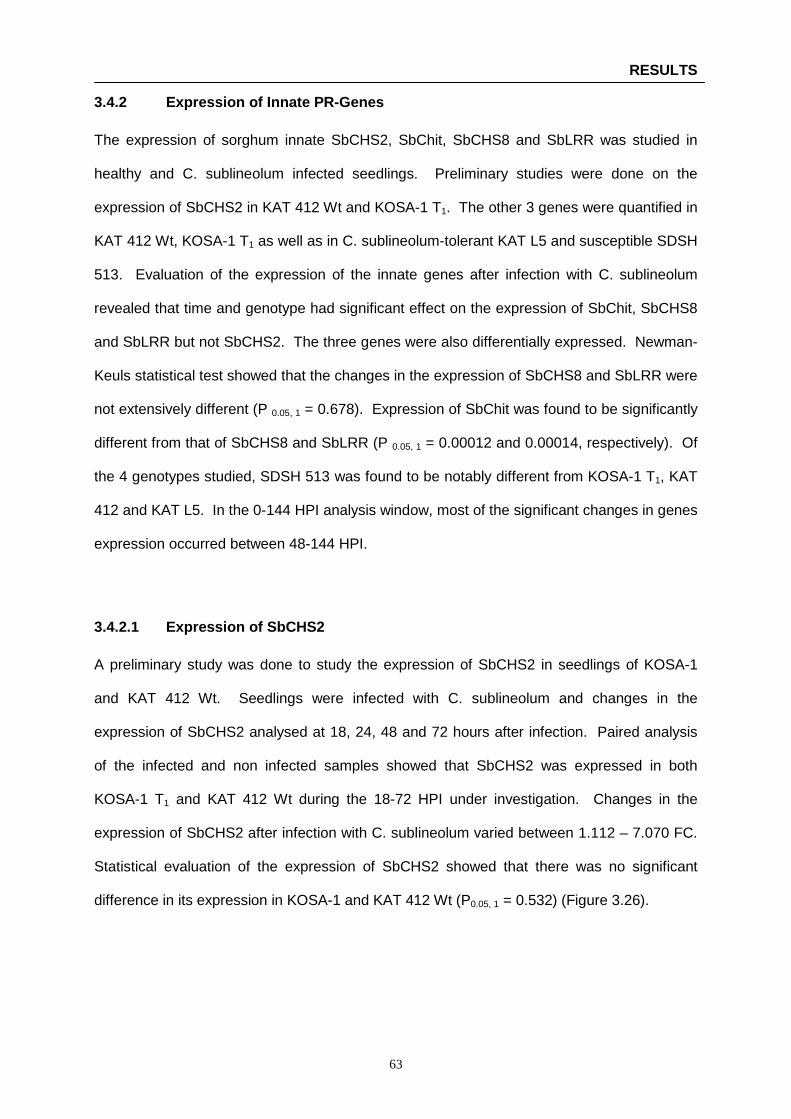
RESULTS
63
3.4.2 Expression of Innate PR-Genes
The expression of sorghum innate SbCHS2, SbChit, SbCHS8 and SbLRR was studied in
healthy and C. sublineolum infected seedlings. Preliminary studies were done on the
expression of SbCHS2 in KAT 412 Wt and KOSA-1 T1. The other 3 genes were quantified in
KAT 412 Wt, KOSA-1 T1 as well as in C. sublineolum-tolerant KAT L5 and susceptible SDSH
513. Evaluation of the expression of the innate genes after infection with C. sublineolum
revealed that time and genotype had significant effect on the expression of SbChit, SbCHS8
and SbLRR but not SbCHS2. The three genes were also differentially expressed. Newman-
Keuls statistical test showed that the changes in the expression of SbCHS8 and SbLRR were
not extensively different (P 0.05, 1 = 0.678). Expression of SbChit was found to be significantly
different from that of SbCHS8 and SbLRR (P 0.05, 1 = 0.00012 and 0.00014, respectively). Of
the 4 genotypes studied, SDSH 513 was found to be notably different from KOSA-1 T1, KAT
412 and KAT L5. In the 0-144 HPI analysis window, most of the significant changes in genes
expression occurred between 48-144 HPI.
3.4.2.1 Expression of SbCHS2
A preliminary study was done to study the expression of SbCHS2 in seedlings of KOSA-1
and KAT 412 Wt. Seedlings were infected with C. sublineolum and changes in the
expression of SbCHS2 analysed at 18, 24, 48 and 72 hours after infection. Paired analysis
of the infected and non infected samples showed that SbCHS2 was expressed in both
KOSA-1 T1 and KAT 412 Wt during the 18-72 HPI under investigation. Changes in the
expression of SbCHS2 after infection with C. sublineolum varied between 1.112 – 7.070 FC.
Statistical evaluation of the expression of SbCHS2 showed that there was no significant
difference in its expression in KOSA-1 and KAT 412 Wt (P0.05, 1 = 0.532) (Figure 3.26).
RESULTS
64
Figure 3.26: Expression of SbCHS2 in KOSA-1 T 1 and KAT 412 Wt. Transgenic and Wt sorghum were infected with C. sublineolum and the activity of SbCHS2 profiled for 72 HPI. A fold change of a maximum of about 7 FC was noted. No significant difference was observed in the change in gene activity between the transgenic and Wt sorghum (P0.05, 1 = 0.532). Time was also found not to affect the changes in expression of this gene (P0.05, 5 = 0.207).
The average change in the expression of SbCHS2 during the first 72 hours after C.
sublineolum infection was 6.96 (3.994) and 3.78 (1.394) in KAT 412 Wt and KOSA-1 T1,
respectively. Time was found to be inconsequential in the expression of this gene after
infection with the pathogen (P0.05, 5 = 0.207).
3.4.2.2 Expression of SbChit
Expression of innate sorghum chitinase gene, SbChit was evaluated in the transgenic and
wild type sorghum lines viz. KOSA-1 T1, Wt, KAT L5 and SDSH 513. Differences in the
expression of this gene according to time and cultivar were analysed. SbChit was expressed
in all the seedlings tested. The average fold change in the expression of this gene between
0-144 HPI was 15.891 (4,719). Significant difference was noted in the expression of SbChit
between the 4 sorghum lines evaluated (P 0.05 = 0.0006-0.001). The highest expression of
SbChit was noted in SDSH 513 while the least was in KAT L5 (Figure 3.27).
0
1
2
3
4
5
6
7
8
9
18 24 48 72
HPI
FC KAT 412 Wt
KOSA-1 T1
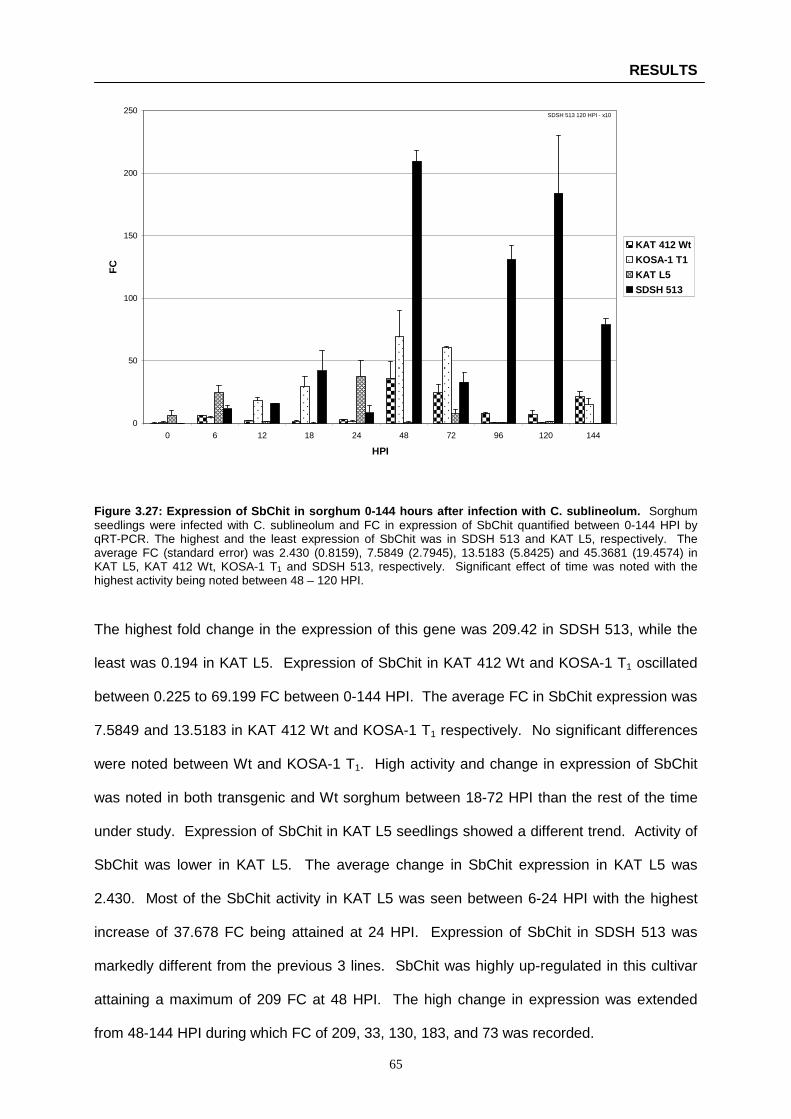
RESULTS
65
Figure 3.27: Expression of SbChit in sorghum 0-144 hours after infection with C. sublineolum. Sorghum seedlings were infected with C. sublineolum and FC in expression of SbChit quantified between 0-144 HPI by qRT-PCR. The highest and the least expression of SbChit was in SDSH 513 and KAT L5, respectively. The average FC (standard error) was 2.430 (0.8159), 7.5849 (2.7945), 13.5183 (5.8425) and 45.3681 (19.4574) in KAT L5, KAT 412 Wt, KOSA-1 T1 and SDSH 513, respectively. Significant effect of time was noted with the highest activity being noted between 48 – 120 HPI.
The highest fold change in the expression of this gene was 209.42 in SDSH 513, while the
least was 0.194 in KAT L5. Expression of SbChit in KAT 412 Wt and KOSA-1 T1 oscillated
between 0.225 to 69.199 FC between 0-144 HPI. The average FC in SbChit expression was
7.5849 and 13.5183 in KAT 412 Wt and KOSA-1 T1 respectively. No significant differences
were noted between Wt and KOSA-1 T1. High activity and change in expression of SbChit
was noted in both transgenic and Wt sorghum between 18-72 HPI than the rest of the time
under study. Expression of SbChit in KAT L5 seedlings showed a different trend. Activity of
SbChit was lower in KAT L5. The average change in SbChit expression in KAT L5 was
2.430. Most of the SbChit activity in KAT L5 was seen between 6-24 HPI with the highest
increase of 37.678 FC being attained at 24 HPI. Expression of SbChit in SDSH 513 was
markedly different from the previous 3 lines. SbChit was highly up-regulated in this cultivar
attaining a maximum of 209 FC at 48 HPI. The high change in expression was extended
from 48-144 HPI during which FC of 209, 33, 130, 183, and 73 was recorded.
0
50
100
150
200
250
0 6 12 18 24 48 72 96 120 144
HPI
FC
KAT 412 Wt
KOSA-1 T1
KAT L5
SDSH 513
SDSH 513 120 HPI - x10

RESULTS
66
3.4.2.3 Expression of SbCHS8
Expression of SbCHS8 was evaluated in KOSA-1, KAT 412, KAT L5 and SDSH 513. The
activity of this gene was also monitored over a period of 144 hours after infection with C.
sublineolum. SbCHS8 was expressed in both the non- and infected samples of all the
seedlings analysed. Expression of SbCHS8 was different to that SbCHS2 but similar to
SbLRR. The average change in the expression of SCHS8 was 46.1083 (19.992). Significant
difference in the expression of SbCHS8 was noted at 120-144 HPI (P 0.05 = 0.0001-0.016).
The main difference in the expression of this gene was observed in SDSH 513, where it was
markedly up-regulated (Figure 3.28). A comparison of the transgenic and Wt KAT 412
revealed that the changes in the expression of SbCHS8 was higher in KOSA-1 than in Wt
with an average FC of 20.489 and 16.293 in the former and the latter, respectively.
Figure 3.28: Expression of SbCHS8 in KAT 412, KOSA-1 T 1, KAT L5 and SDSH 513 after infection with C. sublineolum. Transgenic and wild type sorghum lines were infected with C. sublineolum and thereafter the gene activity quantified for 144 hours. Expression of SbCHS8 was higher in SDSH 513 than the other 3 cultivars. Activity was lowest in Kat L5 where an average FC of 7.373 was recorded.
Highest activity of SbCHS8 was at 48 and 96 HPI in KAT 412 Wt and KOSA-1, respectively.
A different trend was found in KAT L5 where the average activity of SbCHS8 was 7.373.
Expression of this gene was significantly up-regulated in SDSH 513, in which the average
fold change in the activity was 185.728.
0
200
400
600
800
1000
1200
0 6 12 18 24 48 72 96 120 144
HPI
FC
KAT 412 Wt
KOSA-1
KAT L5
SDSH 513
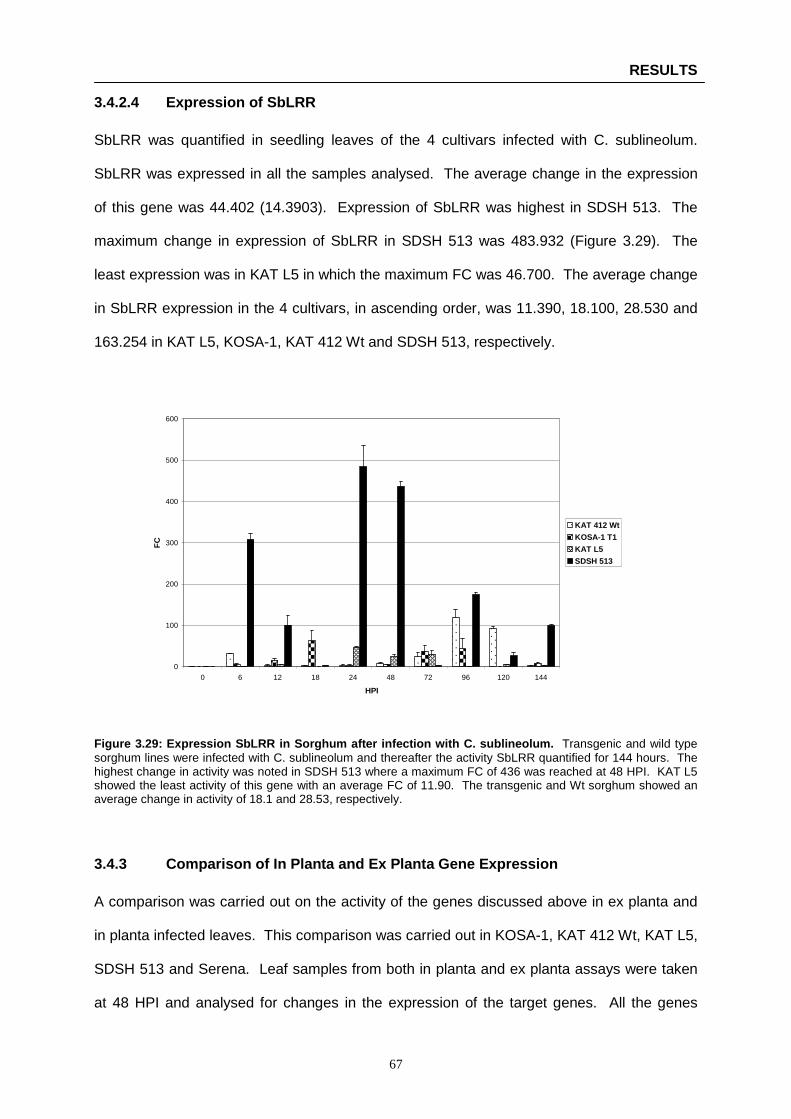
RESULTS
67
3.4.2.4 Expression of SbLRR
SbLRR was quantified in seedling leaves of the 4 cultivars infected with C. sublineolum.
SbLRR was expressed in all the samples analysed. The average change in the expression
of this gene was 44.402 (14.3903). Expression of SbLRR was highest in SDSH 513. The
maximum change in expression of SbLRR in SDSH 513 was 483.932 (Figure 3.29). The
least expression was in KAT L5 in which the maximum FC was 46.700. The average change
in SbLRR expression in the 4 cultivars, in ascending order, was 11.390, 18.100, 28.530 and
163.254 in KAT L5, KOSA-1, KAT 412 Wt and SDSH 513, respectively.
Figure 3.29: Expression SbLRR in Sorghum after infection with C. sublineolum. Transgenic and wild type sorghum lines were infected with C. sublineolum and thereafter the activity SbLRR quantified for 144 hours. The highest change in activity was noted in SDSH 513 where a maximum FC of 436 was reached at 48 HPI. KAT L5 showed the least activity of this gene with an average FC of 11.90. The transgenic and Wt sorghum showed an average change in activity of 18.1 and 28.53, respectively.
3.4.3 Comparison of In Planta and Ex Planta Gene Expression
A comparison was carried out on the activity of the genes discussed above in ex planta and
in planta infected leaves. This comparison was carried out in KOSA-1, KAT 412 Wt, KAT L5,
SDSH 513 and Serena. Leaf samples from both in planta and ex planta assays were taken
at 48 HPI and analysed for changes in the expression of the target genes. All the genes
0
100
200
300
400
500
600
0 6 12 18 24 48 72 96 120 144
HPI
FC
KAT 412 Wt
KOSA-1 T1
KAT L5
SDSH 513
RESULTS
68
were expressed in the ex planta and in planta samples (Figure 3.30). Two general trends of
responses were observed: higher genes activity in ex planta than in in planta samples of
KOSA-1, KAT 412 Wt and KAT L5 and vice versa in SDSH 513. All the samples, except
SDSH 513, showed higher changes in the expression of all the genes studied in ex planta
than in planta samples.
Fold changes in the expression of the two transgenes, HarCho and HarChit, was quantified.
Comparison of the changes in the expression of HarCho and HarChit in ex planta and in
planta samples showed that there was no significant difference in the activity of the
transgenes. The average change in expression of HarCho was 1.246 and 1.01, while that of
HarChit was 1.381 and 1.021 in in planta and ex planta samples, respectively.
Analysis of KOSA-1 T1 showed that the changes in the expression of SbCHS2, SbCHS8,
SbChit and SbLRR was higher in the ex planta than in planta samples. The average fold
change in expression of all these genes was 1.095 and 2.405 in in planta and ex planta
samples respectively. The same trend was found in Wt KAT 412 where the average change
in in planta and ex planta genes expression was 0.936 and 3.693, respectively. No
significant difference was noted between the wild type and transgenic KAT 412. Of the 4
genes studied in both KOSA-1 and KAT 412 Wt, SbCHS2 showed the highest activity,
reaching a maximum FC of 10.133.
Analysis of KAT L5 revealed that there was consistent down-regulation of all the genes
studied in the in planta as compared to ex planta samples. The average fold changes in the
expression of all genes was 0.163 and 4.491 in in planta and ex planta samples,
respectively. The highest gene activity was noted in SbCHS2 whose FC was 6.089 in ex
planta assay. The least active was SbLRR that had an FC of 0.072 in in planta samples.
The trend observed in KAT412 Wt, KOSA-1 and KAT L5 was also seen in the activity of the
innate PR-genes in Serena. The activities of these genes were lower in the in planta than in

RESULTS
69
ex planta samples reaching an average of 0.955 and 6.340 in the former and the latter
assays, respectively. The main difference was noted in the expression of SbLRR, which was
relatively lower in KOSA-1, KAT 412 Wt and KAT L5 but was up-regulated by an average of
12.871 FC in Serena.
The activity of the PR-genes was different in SDSH 513 in comparison to KOSA-1, KAT 412
Wt, KAT L5 and Serena. The activity of SbCHS2, SbCHS8, SbChit and SbLRR were higher
in in planta than in ex planta infected samples. The average change in the expression of
these genes was 4.919 and 0.819 in in planta and ex planta infected leaves, respectively.
The gene showing the highest activity was SbCHS2, whose up-regulation reached an
average of 15.325 in in planta samples.
Figure 3.30: Comparison of in planta and ex planta genes expression assays . Intact (in planta) and excised (ex planta) sorghum leaves were infected with C. sublineolum and sampled 48 HPI for gene expression analysis. The ex planta infected leaves of all the cultivars except for SDSH 513 showed higher activity of all the innate sorghum genes than the in planta samples. High activity of SbCHS2 and SbLRR was noted, reaching a FC of 10.133 and 15.325, respectively. The expression level of the transgenes HarCho and HarChit was the same in both assays.
0
2
4
6
8
10
12
KAT 412 Wt - inplanta
KAT 412 Wt - explanta
KOSA-1 T1 - inplanta
KOSA-1 T1 - explanta
KAT L5 - in planta KAT L5 - ex planta SDSH 513 - inplanta
SDSH 513 - explanta
Samples
FC
HarChoHarChitSbCHS2SbCHS8SbChit

DISCUSSION
70
4 DISCUSSION
The goal of this research was to genetically transform sorghum with antifungal genes in order
to develop lines that are resistant to fungal diseases. Two antifungal genes, HarChit and
HarCho, encoding antifungal enzymes, chitosanase and chitinase, were cloned from
Trichoderma harzianum and used in the transformation. To achieve this goal, tissues culture
methods were optimised for in vitro regeneration of selected sorghum cultivars from
immature zygotic embryos (IZE). Particle bombardment and Agrobacterium-mediated
transformation were used to transform sorghum IZE with the target genes. Transformation
was carried out in 8 sorghum lines, from which KAT 412 was successfully transformed with
the target genes, HarChit, HarCho and the selection marker pat gene encoding the
herbicide-resistance conferring enzyme phosphinothricin acetyltransferase. Three
independent sorghum transformants were generated and stable integration and inheritance
of the anti-fungal genes were confirmed by molecular analysis. Colletotrichum sublineolum
infection assays were carried out to test the response of transgenic line KOSA-1 to pathogen
challenge. In planta and ex planta assays showed that transgenic progenies were more
tolerant to anthracnose than the parent Wt. KOSA-1 T1 was further compared to other
sorghum cultivars sampled from Kenya. The comparison revealed the existence of sorghum
genotypes that are either more tolerant or susceptible than the transgenic line. Quantitative
RT-PCR analysis was done to profile the expression of the transgenes and selected PR-
genes. The real time gene expression investigation confirmed the expression of the
transgenes and demonstrated a genotype-dependent difference in the activity of PR-genes
such as SbLRR, SbCHS8 and SbChit in the susceptible and tolerant sorghum lines.
4.1 SOMATIC EMBRYOGENESIS AND MICROPARTICLE BOMBARD MENT
A collection of sorghum cultivars consisting of white, brown and red lines, were sampled from
Kenya and used as explants for genetic transformation through microprojectile
bombardment. A tissue culture protocol was optimised for successful regeneration of
DISCUSSION
71
plantlets from transformed embryonic tissues of IZE. This work achieved somatic
embryogenesis of all the Kenyan sorghum cultivars sampled through tissue culture of IZE.
4.1.1 Genotypic Variation in Somatic Embryogenesis
Somatic embryogenesis was achieved with sorghum lines that secreted low (e.g., KAT 487,
KAT 412) and high (e.g., Serena, KAT L5) amount of phenolics into the culture medium. A
genotype-dependent effect on calli development and plantlets regeneration ability was
observed. The cultivars that secreted high levels of phenolics developed less calli and
regenerants. This was observed in the number of plantlets regenerated in vitro and
transferred to the greenhouse. An average of 0.7% of 608 Serena IZE, a cultivar that
secreted high levels of phenolics into culture media, developed regenerants that reached the
greenhouse stage as compared to 3% in lower phenolics producing KAT 412. The phenolics
production was also correlated to the seed colour. Sorghum lines with brown-red seeds
secreted more phenolics than the white lines. This observation was further demonstrated by
the lower number of regenerants achieved with other brown-red phenolics-rich cultivars such
as KAT L5, GBK 046844 and SDSH 513. Such genotype influence on somatic
embryogenesis has been reported. It has been observed that sorghum explants, especially
from cultivars that are rich in phenolics, are recalcitrant to morphogenesis during tissues
culture (Cai and Butler, 1990; Casas et al., 1993). Tissue culture of high phenolics producing
sorghum is challenging and because such lines are less responsive to the standard media
used in routine tissue culture of other grasses such as wheat, maize, and barley (Cai and
Butler, 1990). Such genotypic variation in the response of immature embryos to tissue
culture has been previously noted (Casas et al., 1993; Takashi, 2002). Nevertheless,
successful regeneration was obtained in all the sorghum cultivars studied. Similar success is
not routinely achieved in the tissue culture that involves a cross section of sorghum lines
varying seed colour because some lines have low morphogenesis and rarely produce
regenerants, even after months of tissue culture (Casas et al., 1993).
DISCUSSION
72
Attempts have been made to ameliorate the negative effect of phenolics secretion into
culture media. Anti-oxidants and anti-phenolics compounds and formulations such as
polivinylpyrrolidone (PVP), polyvinylpolypyrrolidone (PVPP), dithiothreitol, coconut water,
silver nitrate and active carbon are been used in sorghum tissue culture with mixed results
(Zhao et al., 2000; Takashi, 2002). Prolific tissue culture and regenerants formation was
achieved in this study without these additives. This was done by focussing on the effect of
pre-culture and timing of various tissue culture stages. One day pre-cultured embryos
cultured for 14 days in CIM and thereafter in successive regeneration and rooting media
produced good results.
The significance of the successful tissues culture of both phenolics-rich and white lines lies in
the potential use of such an established and prolific tissue culture regime to tap into the
genetic resource present in the Kenyan land races for further transformation work. This is
important considering the fact that most of the high tannins and phenolics-rich brown-red
sorghum lines are relatively tolerant to biotic and abiotic stress (Jambunathan, 1992; Esele et
al., 1993; Andilakshmi et al., 1999; Waniska et al., 2001). These lines are more resistant to
pest and diseases as compared to the white lines. On the flipside, copious secretion of
phenolics into the culture media also presents a good opportunity for bioengineering of
sorghum for in vitro biosynthesis and harvesting of economically important secondary
metabolites.
4.1.2 Microprojectile Acceleration Pressure
It is important to optimise the microparticle bombardment parameters to minimise injuries to
IZE since this is detrimental to their eventual morphogenesis in culture. To establish the
most appropriate particle acceleration pressure, one-day pre-cultured IZE were bombarded
with the gus gene at 1100 to1550 psi and cultured in CIM for 14 days. Gus expression was
evaluated at day 2, 7 and 14. Expression of the gus gene revealed that differences exist
between the bombardments pressures studied. However, this difference was not apparent

DISCUSSION
73
soon after bombardment but was clear by day 7. Bombardment at higher pressure led to low
gus counts than at 1100 and 1350 psi. Higher levels of GUS expression, 58% of bombarded
embryos, were recorded with 1350 psi as compared to 37% achieved with 1550 psi.
Mortality of the bombarded embryos with higher pressure could contribute to the lower
transient gus expression after bombardment with 1550 psi. Successful transformation
through microparticle bombardment is hinged on the acceleration of desired DNA into cells
without causing lethal damage. An intricate balance must be struck between the
acceleration pressure and associated tissue injury to limit post-bombardment trauma. The
negative effects of IZE injury have been noted, whereby injured IZE secreted copious
amount of phenolics in culture media which in turn limited morphogenesis (Carvalho et al.,
2004).
One of the treatments used to limit cell rupture during particle bombardment is osmotic
treatment. Explants were pre-cultured in high sucrose (60 g/l) media for 4 hours before
bombardment. This treatment reduces cell turgor pressure and tissues rupture at high
pressure bombardment. It has also been shown that osmotic pre-treatment increases
transient expression and enhances integration of transferred DNA (Vain et al., 1992).
Profiling of transient GUS activity in bombarded IZE established that there was no detectable
gene expression at the end of calli induction phase, 14 days after bombardment. It is
probable that the transgene expression at this point is only possible from genes that are
stably integrated into the genome of the cultured tissues. Casas et al. (1993) also found that
gus expression could not be detected in sorghum tissues later than 3 weeks after
bombardment. This difference in the duration of expression could be attributed to the effect
of genotype. Casas et al. (1993) showed that the greatest effect on reporter gene
expression was attributed to variation amongst genotypes.
DISCUSSION
74
4.1.3 Effect of Pre-Culture
An evaluation of the effect of longer (3 days) pre-culture of sorghum IZE in improving tissue
culture output established that this technique was not better than a shorter (overnight) period.
Theoretically, longer pre-culture is expected to result into more cells available for
transformation and further tissue culture. However, the limited calli development noted after
longer pre-culture of IZE suggests a negative effect of bombardment on these tissues.
4.1.4 Putative Transformation
Immature zygotic embryos were isolated from a collection of sorghum cultivars and used in
genetic transformation through particle bombardment. Transformation was attempted in
10,269 IZE, from which a number of putative transformants survived BASTA herbicide
selection in regeneration medium (SEL-REM) and rooting medium (SEL-ROM) and reached
the greenhouse. Of the 10,269 IZE bombarded, 168 (1.157%) survived tissue culture
selection with 2 mg/l BASTA in SEL-REM and SEL-ROM and were transferred to the
greenhouse. Of the 168 regenerants that expressed resistance to selection under tissue
culture, 3 exhibited stable integration of the target genes. A high number of regenerants
showed transient resistance under BASTA selection during tissue culture. This phenomenon
of transient resistance was noted by Casas et al. (1993), who observed the survival of
putative transformed calli under herbicide treatment on maintenance medium. However,
these putative transformants died when transferred to BASTA-containing regeneration
medium under alternating light/dark conditions. Exposure to light accelerates the
development of phytotoxic activity of the herbicide and the mortality of the putative
transformants could be attributed to this enhanced phytotoxicity (Casas et al., 1993). Similar
observations were made in the transformation of pearl millet, another plant related to
sorghum and belonging to the poaceae family (Girgi, 2003).
Death of regenerants that survived herbicide selection until the greenhouse stage has been
ascribed to gene silencing. Gene silencing is considered to be an obstacle in the

DISCUSSION
75
transformation of sorghum (O´Kennedy, 2006). In a study using gus as a reporter gene, it
was observed that GUS activity, which was high in transient assays, could not be detected in
calli that had been maintained for prolonged periods on BASTA selection pressure despite of
the fact that Southern blot analysis indicated the presence of the uidA gene. Lack of gus
gene expression, in spite of its integration, pointed to gene silencing. It was concluded that
DNA methylation occurred in sorghum cells that inactivated the expression of transferred
genes (Casas et al., 1993). Emani et al. (2002) reported methylation-based transgene
silencing of the reporter gene uidA and the herbicide resistance bar gene in transgenic
sorghum. Girijashanakar et al. (2005) obtained low level of cry1Ac transgene expression but
not complete silencing. Probable correlation exists between gene silencing and the promoter
used. Zhu et al. (1998) observed that gene silencing was restricted to the chitinase gene
driven by the CaMV 35S promoter, whereas the selectable marker gene bar driven by the
ubi1 promoter was fully expressed in all transgenic progeny of all transformation events.
This phenomenon of gene silencing could also be responsible for the overall low
transformation achieved in this investigation.
4.1.5 Stable Genetic Transformation
Of the 8 sorghum lines targeted for transformation, one line, KAT 412, was successfully
transformed with HHaarrCChhiitt and HarCho genes. Three BASTA herbicide resistant sorghum
plants (KAT 412, KOSA-1, KOSA-2 and KOSA-3) were successfully developed after particle
bombardment of IZE. Co-integration and expression of the two transgenes were confirmed
by Southern blot and qRT-PCR analysis: This integration and expression of the two
transgenes of agronomic importance into the genome of sorghum is an significant success in
the development of disease tolerant plants. The production of transgenic sorghum plants via
particle bombardment of IZEs was reported for the first time by Casas et al. (1993) and
subsequently by Zhu et al. (1998), Able et al. (2001), Emani et al. (2002), Tadesse et al.
(2000, 2003), Gao et al. (2005) and recently by Howe et al. (2006). Transformation of
sorghum, like most other plants in the poaceae family, is a rare event. The transformation

DISCUSSION
76
frequencies reported in these successful efforts are generally lower than those achieved in
other plants such as wheat, barley and tobacco.
Evaluation of transformation frequency belies the lack of standardized method of its
calculation. In this investigation, 4 transformation frequencies could be computed: 12.5%
(from the number of cultivars transformed), 0.029% (from the total number of IZE
transformed), 0.087% (from the total number of KAT 412 IZE transformed) and 0.74% (from
the 2 batches of IZE that produced the 3 transgenic plants). Nevertheless, the overall
transformation frequency was low. Transformation frequency in microparticle bombardment
transformation is notably low. Successful transformation of sorghum has been achieved with
low frequencies: 0.008 – 0.33% (Casas et al., 1993; 1997), 1.3% (Tadesse et al., 2003) and
1.5% (Girijashankar et al., 2005). Higher transformation frequency has been achieved with
Agrobacterium-mediated transformation. Frequencies of 2.1-2.5% were, for example,
reported by Zhao et al. (2000) and Gao et al. (2005). The transformation frequency attained
in this research was much lower than previously reported.
The low transformation frequency of sorghum may be attributed to various factors that affect
the response of sorghum to morphogenesis as well as innate characteristics that make the
transgene integration and transformants regeneration difficult. The possibility of inherent
characteristics of sorghum scutellar cells that make them unresponsive to transformation was
contemplated (Casas et al., 1993). The large amount of phenolics produced by sorghum
cultures (Cai and Butler, 1990; Casas et al., 1993) may also be responsible to the low
transformation frequency. Studies have been done to optimise sorghum transformation
parameters, such as media composition, use of anti-oxidants (e.g. polyvinylpyrrolidone),
frequent sub-culture to avoid phenolics accumulation (Zhao et al., 2000), distance between
the rupture disk and the target tissue in biolistic transformation, helium inlet aperture and
pressure of helium gas (Able et al., 2001). However, these have not significantly improved
the transformation frequency of sorghum to the level noted in other monocots like wheat and

DISCUSSION
77
barley or dicots such as tobacco. It was shown that osmotic pre-treatment increase transient
expression and enhances integration of transferred DNA (Vain et al., 1992). Low
transformation was noted in this research regardless of the osmotic pre-treatment.
The low transformation frequency confounds the theoretical basis of gene delivery and
integration during tissue culture. It is postulated that DNA is delivered into the primary
explant resulting in the transformation of the embryogenically competent cells in the
scutellum prior to the initiation of embryogenesis. Regardless of whether the somatic
embryos arise directly from competent cells or are derived from callus intermediary, DNA is
delivered at a stage when one (or few) progenitor cell(s) of each organized structure exists
(Casas et al., 1993). These cells are expected to undergo neoplastic multiplication into
masses of cells that form the calli, undifferentiated clones of the original transformants. This
should result in an appreciable high number of transgenic plants, an eventuality not achieved
in sorghum transformation. Studies into the origin and location of transformable/competent
IZE cells would be an important step in improving transformation frequency.
Transformation is known to be affected by the physiological condition of the explant. Biotic
and abiotic stress affects the transformation success. Artificial growth conditions in
greenhouse marked by low illumination affected the state and quality of the explant used for
transformation and tissue culture. These factors have more adverse effects on tropical
plants, such as sorghum when grown in a greenhouse in a temperate land with winter-
summer season fluctuations. Short days, low illumination and overcast skies in winter were
sources of abiotic stress to sorghum used in this investigation. Biotic stress, such as
greenhouse diseases and pests, further compromised the explant quality.
4.1.6 Transgenes Integration and Progeny Segregatio n
Stable integration of the transgenes into the genome of the transformed KAT 412 was
confirmed by Southern blot which showed multiple and single copy integration of HarCho and
DISCUSSION
78
HarChit, respectively. The segregation ratio of T1 progeny was determined by selecting for
the bar gene through spraying with the BASTA herbicide. Averages of 74.19% of the T1
progenies from KOSA-1 were transgenic. The segregation conformed to the expected
Mendelian inheritance. Single dominant locus integration of transgenes is expected to result
in a 3:1 (75% dominant) segregation ratio. Similar segregation was previously proved by the
analysis of the T1 progeny which showed an average segregation ratio of 97/129, 145/182
and 52/69 of the seedlings survived after treatment with the herbicide (Casas et al., 1993).
Microprojectile bombardment genes delivery and integration into plant genomes is essentially
random (Hansen and Wright, 1999; Taylor and Fauquet, 2002), therefore the integrations
observed in this investigation were also random events.
4.2 AGROBACTERIUM-MEDIATED TRANSFORMATION
Agrobacterium mediated transformation of sorghum was carried out using a binary system.
This method is associated with higher transformation frequency and also less expensive than
microparticle bombardment. Hence, a transformation protocol using the reporter gene gus
was used to optimise Agrobacterium transformation protocol. A number of sorghum cultivars
were used in the protocol optimization and transformation.
4.2.1 Transformation and Tissues Culture Conditions
Agrobacterium-mediated transformation involves a series of culture media for bacterial
growth, inoculation, co-cultivation with IZE, selection, callus induction and regeneration of
transformants. Optimization of the transformation stages is critical for the gene delivery and
recovery of transformants. Preliminary Agrobacterium inoculation and co-cultivation showed
that bacterial-induced mortality was a problem. Most IZE did not survive Agrobacterium
inoculation and co-culture. Survival of IZE and subsequent callus development after their
inoculation and co-cultivation with Agrobacterium are critical in transformation. The
sensitivity of immature embryos to Agrobacterium infection is considered to be a limiting step

DISCUSSION
79
for high transformation efficiency (Zhao et al., 2000; Carvalho et al., 2004). Two ways were
used to limit the IZE mortality: 1) use of Agrobacterium inoculums with low OD (usually below
0.2-0.8) and 2) removal excess Agrobacterium after infection by rinsing of IZE with
inoculation medium without Agrobacterium. Removal of excess Agrobacterium have been
found to significantly improve the survival rate of sorghum explant (Carvalho et al., 2004).
4.2.1.1 Effect Solid and Liquid Phase inoculation
To limit the Agrobacterium-induced mortality, two inoculation methods were tested: solid and
liquid phase inoculation. The result showed that liquid phase infection was associated with
higher calli formation (29.28%) than solid phase (16.13%). This observation could be
explained by the microscopy investigations that were done to clarify the Agrobacterium
induced mortality of IZE. Immature embryos observed by scanning electron microscope
during co-cultivation were noted to be coated with a layer of Agrobacterium cells embedded
and trapped in a crust of material probably produced by Agrobacterium (Carvalho et al.,
2004). This crust could be considered to be involved in the Agrobacterium sensitivity of the
sorghum embryos. The formation of such matrix and Agrobacterium mediated necrosis
might have been more enhanced in solid phase than in liquid phase infection. Point
inoculation with a toothpick or needle, made without injuring the embryos, showed that only
those sectors that received Agrobacterium became brown. This indicated a localized
necrotic effect.
4.2.1.1 Effect of Pre-culture
Sorghum IZEs have been noted to be sensitive to infection with Agrobacterium (Zhao et al.,
2000). Pre-culture of IZE is regarded as another method that could limit this sensitivity.
Sorghum IZE were pre-cultured for 1-3 days and thereafter infected and co-cultivated with
Agrobacterium. It was found that pre-culture did not lead to better calli development.
Previous observation indicated that pre-cultured IZE were less affected by Agrobacterium
DISCUSSION
80
infection (Zhao et al., 2000). Immature embryos cultured for 3-5 days before co-cultivation
and callus which was 2-4 weeks old showed a much higher survival rate than fresh IZE
(Carvalho et al., 2004). This finding was in contrast to the result of this investigation.
However, these results should be considered in respect to the effect suspending calli-forming
pre-culture IZE in liquid infection media. It is apparent that actively dividing and calli-forming
cells may be more sensitive to the Agrobacterium inoculation and co-cultivation procedure
that intact embryos.
4.2.1.2 Infection Duration
The duration of infection of IZE with Agrobacterium can be optimised to reduced post-
infection necrosis. To determine the most conducive infection duration, IZE were incubated
with Agrobacterium for 60-240 minutes. It was found that longer duration of infection did not
negatively affect calli formation. Incubating the embryos for longer duration led to higher
survival rate of IZE. It is probable that longer duration of incubation under shaking eliminated
the formation of the adhesive matrixes over IZE. This demonstrated the importance of
limiting the OD of the inoculums for better calli formation. It also augmented the importance
of rinsing off of excess Agrobacterium from IZE for better calli formation.
4.2.1.3 Effect of Co-Cultivation Temperature
Sorghum IZE and Agrobacterium were co-cultivated at 21 and 26°C to test the effe ct of
temperature on GUS activity and callus formation. Co-culture at 21°C resulted in more calli
formation in the 3 sorghum lines studied. This result confirms the effect Agrobacterium-
induced necrosis on IZE. Necrosis reduced post-infection survival IZE and calli formation.
Agrobacterium growth was slower at 21°C than at 26°C resulting i n lower mortality of IZE.
This led to higher numbers of IZE that developed calli. This result is also important towards
development of tissue culture protocols that could lead to higher transformation frequencies.
The importance of temperature in Agrobacterium transformation could be further clarified by
DISCUSSION
81
the mechanism of bacterial T-DNA transfer into the plant. Bacterial mature T-DNA is
exported into the host cell by VirB/D4 type IV secretion system (Veronst et al., 2000; Christie,
1997). VirB proteins either form the membrane channel or serve as ATPase to provide
energy for export channel assembly and export process (Gelvin, 2003). Several proteins,
including VirB2, VirB5 and VirB7 make up the T-pilus of the type IV secretion system
(Sagulenko et al., 2001; Lai and Kado, 2000). VirB2, which is processed and cyclised, is the
major pilin protein (Eisenbrandt et al., 1999; Jones et al., 1996; Lai and Kado 1998; Lai and
Kado, 2000). Although vir genes induction is maximal at approximately 25 – 27°C (Alt-
Moebe et al., 1988; Jin et al., 1993; Turk et al., 1991), the pilus has been found to be more
stable at lower temperature (approximately 18-20°C) (Fullner and Nester, 1996; Lai et al.,
2000; Baron et al., 2001). Reviewing co-cultivation temperatures among other
transformation parameters, could contribute to a higher transformation success.
4.2.1.4 Physiological and Physical State of Explant
Physiological state of the explants used in tissue culture has been reported to affect calli
formation and even transformation frequency. Immature embryos isolated from donor plants
growing under sub-optimal conditions, such as water stress and low temperature, did not
show any apparent growth during co-cultivation and often died later (Carvalho et al., 2004).
When cut or injured, IZE produced toxic compounds that inhibited Agrobacterium growth
during co-cultivation (Carvalho et al., 2004). Some embryos also produced black pigments
that inhibited growth of Agrobacterium. These effects may restrict transformation because of
the limited interaction of the explant with Agrobacterium. The following key observations
were made:
1) adaxially cultured embryos showed poor calli development and regeneration;
2) the potential of sorghum embryos to develop calli after co-cultivation is critical to the
success of Agrobacterium mediated transformation;

DISCUSSION
82
3) up to 3 days of co-cultivation gave better calli development, longer days of co-
cultivation were associated with Agrobacterium overgrowth and high embryos
mortality.
4.2.2 Challenges in Agrobacterium-mediated Transformation of Sorghum
Sorghum genetic transformation with Agrobacterium remains a challenge. Source and
physiological condition of explant, type of transformation vectors, tissue culture condition and
innate plant protein (such as H2A, VIP 1, BTI, KU70 and Rad 52) have been cited to
influence transformation (Mysore et al., 2000; Zhao et al., 2000; Carvalho, 2002; Tzfira et al.,
2002; Van Attikum and Hooykaas, 2003; Hwang and Gelvin, 2004; Gao et al., 2005; Tzifira
and Citovsky, 2006). It is postulated that Agrobacterium adopts cellular processed to
transform its host (Tzfira and Citovsky, 2002; Gelvin, 2003). Various host proteins have
been reported to participate in key stages of Agrobacterium-mediated process, i.e. T-DNA
intracellular transport, nuclear import and integration (Tzfira and Citovsky, 2002; Gelvin,
2003). The difficulty in the transformation of sorghum may lie in the inability of
Agrobacterium to adopt cellular responses critical for eventual T-DNA integration into the
genome of this plant. Such cellular responses include DNA and protein transport, targeted
proteolysis and DNA repair (Tzfira and Citovsky, 2002; Gelvin, 2003).
Agrobacterium transformation process begins with the bacterium-plant attachment. The two-
component sensory signal antenna, which consists of VirA and VirG proteins, plays an
important role in Agrobacterium transformation. This stage of transformation has been
greatly improved by the use of acetosyringone, whose addition mimics wounding of the
natural dicotyledonous host plants and induces autophosphorylation of VirA and ultimately
expression Vir genes. Reports have showed that the effect of acetosyringone is
concentration sensitive. Higher level has been found to be inhibitory. At the same time,
effect of concentration was also found to be related to the tissue used as the explant. A
working concentration of 100-300 µM has been found to be effective in most sorghum

DISCUSSION
83
transformation. A similar concentration range was used in this investigation. However, this
did not lead to successful transformation, pointing towards a different causative mechanism
or agent.
The export of T-DNA into the host cell is mediated by VirB/D4 type IV secretion system
(T4SS) (Chritie, 2004). This step is known to require the interaction of the bacterial T-pilus
with at least one-host specific protein (Hwang and Gelvin, 2004). Several proteins, including
VirB2, VirB5 and VirB7 make up the T-pilus (Schmidt-Eisenlohr et al., 1999). VirB2 which is
processed and cyclised, is the major pilin protein. The pilus may function as a conduit or
hook. Two critical factors that relate to pilus docking are relevant for the success of T-
complex export into the host cell. These are culture temperature and phenolics secretion
response of sorghum explant. Although vir gene induction is maximal at approximately 25-
27°C (Alt-Moebe et al., 1988; Turk et al., 1991; Jin et al., 1993), the pilus of some
Agrobacterium strains is most stable at lower temperatures (approximately 18-21°C) (Fullner
and Nester, 1996; Lai et al., 2000; Baron et al.,. 2001). To test the significance of
temperature on transformation, IZE and Agrobacterium were co-cultivated at 21, 26, and
28°C. However, none of these temperature levels re sulted into stable transformation of the
sorghum lines studied.
Sorghum IZE secrete copious amount of phenolics into culture media. It has been noted that
red and brown sorghum lines, which are associated with higher amount of these compounds
than white lines, respond poorly to morphogenesis and transformation (Zhao et al., 2000;
Gao et al., 2005). It is therefore interesting to investigate the probable role of these
compounds in the process of the Agrobacterium pilus docking, its initial interaction with plant
cell membrane and eventual export of the T-complex into the sorghum IZE cells. The dense
structure of the cytoplasm is another huddle that separates T-complex from its final
destination, the nucleus. Cytoplasmic transit is another stage of the transformation process
that may limit transformation. The dense structure of the cytoplasm composed of a mesh of

DISCUSSION
84
microtubules, actin and intermediate filament network, greatly restricts the Brownian diffusion
of large macromolecules (Luby-Phelps, 2000). It is very likely that the T-complex, similar to
many DNA viruses (Dohner and Sodeik, 2005), is delivered to the cell nucleus with the
assistance of the host intracellular transport machinery (Tzfira and Citovsky, 2006).
Biophysical particle tracking and fluorescently labelled VirE2-ssDNA complexes, suggests
that dynein motors are required for the directed movement of the T-complex towards the
nucleus (Salzman et al., 2005).
The large size (~15.7 nm outer diameter) of the mature T-complex (Abu-Arish et al., 2004)
suggests an active mechanism for its nuclear import, most likely by the nuclear-import
machinery of the host cell. It has been suggested that VirD2 and VirE2 interact with host
proteins for their nuclear import (Tzfira and Citovsky, 2006). VirD2 interacts with AtKAPα, a
member of the Arabidopsis karyopherin α-family (Ballas and Citovsky, 1997) while VirE2
interacts with the plant VirE2-interacting protein 1 (VIP1) (Tzfira et al., 2001) and its
functional homolog, the bacterial VirE3 protein (Lacroix et al., 2005). Both act as molecular
adaptors between VirE2 and the host cell karyopherin-α, enabling VirE2 to be ´piggy-backed´
into the host cell nucleus (Tzfira et al., 2002; Lacroix et al., 2005). The ability of VIP1 to
interact with the chromosomal protein H2A-1 histone, known to function during the T-DNA
integration step, and its interaction with VirE2 suggests that Agrobacterium uses VIP1´s
intranuclear mobility to deliver the T-complex to the point of integration in the host chromatin.
This understanding of the mechanism of trans-cellular T-DNA transport and its integration
opens the possibility of developing easily transformable sorghum lines by expression
(preferably, transiently) of the genes known to be involved in transformation.
DISCUSSION
85
4.3 RESPONSE OF SORGHUM TO C. SUBLINEOLUM INFECTION
4.3.1 Ex Planta Infection Assay
In this study leaf segments of sorghum seedlings were used to test the response of sorghum
lines to Colletotrichum sublineolum infection. Ex planta assays compared the response of
transgenic KOSA-1, KAT 412 Wt, KAL L5, SDSH 513 and 4 other sorghum cultivars.
Infection of leaf segments allows a fast and high throughput method for scoring the response
of large numbers of lines under the same conditions. Similar methods were used for in vitro
infection assays as described by Girgi et al. (2006) in pearl millet and by Oldach et al. (2001)
in wheat. Leaf segments studies are made possible through the use of anti-senescence
compounds such as benzimidazole. In this study, excised leaves were in 0.8% neutral agar
containing 40 mg/l benzimidazole. It was therefore possible to carry out ex planta assay of
the responses of excised leaf segments to C. sublineolum infection over a period of at least 7
days without undue senescence.
A comparison was made between the response of the transgenic KOSA-1 T1 and wild type
KAT 412 sorghum lines. Leaf segments from the transgenic KOSA-1 were found to be more
tolerant to C. sublineolum and exhibited delayed and lower levels of necrosis and
pigmentation after infection than those excised from the wild type plants. This assay showed
that introduction of the two genes into sorghum caused a significant protection against C.
sublineolum under the conditions of this investigation.
Further comparison was made between the transgenic and selected sorghum lines from
Kenya. This study revealed the existence of genotypic variation in the response to C.
sublineolum infection. Tolerant and susceptible lines were represented in the lines studied.
KAT L5 and SDSH 513 were found to be the most tolerant and susceptible of all the lines
tested. This demonstrated the existence of genetic diversity in Kenya that could be exploited
for further transformation for anthracnose resistance.
DISCUSSION
86
Symptom development in the excised leaves after C. sublineolum infection varied. There
was difference in the time taken for the onset of necrosis of the leaf segments among the
tested lines. The localised distribution of the infection, especially in point inoculated samples
was a demonstration of localised plant response to infection that is targeted at the point of
pathogen entry. The lines that took longer to develop symptoms like KAT L5 could be
considered to possess innate localised protection mechanisms that do not require systemic
resistance machinery. However, the importance of systemic protection was shown by the
development of symptoms in all the excised leaf segments in all the sorghum lines. All the
excised leaves eventually developed symptom and were totally colonised with fungal fruiting
structures by the end of the experiment. Cooperation of systemic and local defence
machinery can function only in intact leaves and therefore all the excised leaves succumbed
to anthracnose by the end of experiment (8 days).
4.3.2 In planta Infection Assay
Response to infection by intact sorghum was studied by infecting 1 week old seedlings and
observing disease development over a period of 7 days. Sorghum seedlings were infected
through spraying with 106 conidia/ml of C. sublineolum. Infected seedlings were grown in a
chamber under controlled conditions and disease development quantified in terms of the
number of seedlings showing symptoms (disease incidence), onset, severity and distribution
of the symptoms. Studies with intact leaves and seedlings confirmed the observation made
with leaf segments. KOSA-1 was found to be more tolerant than Wt seedlings, in which
higher incidences of anthracnose was seen. Further examination revealed that seedlings
from Wt did not show recovery after infection. The transgenic lines were however more
resilient and showed recovery and the infected leaves continued to grow beyond the
experimental period. This observation highlighted the importance of intact systemic defence
machinery in disease response. In excised leaves, necrosis and death of entire segments
was observed in both transgenic and wild type lines by the end of the 7-day experimental
period.

DISCUSSION
87
The in planta infection study was extended to compare the transgenic with other Kenyan
sorghum lines. Results from disease incidence analysis showed a largely similar trend with
the ex planta experiment. KAT L5 and SDSH 513 were found to be the most and the least
tolerant sorghum lines, respectively. There was however differences in the order of
tolerance among the cultivars that fell between the SDSH 513-KAT L5 susceptible-tolerant
extremes. The order of tolerance from the ex planta assays, from the least to most tolerant,
was: SDSH 513, Serena, KAT 412 Wt, GBK 046820, KAT 412 Wt, GBK 046812, KAT 487
and KAT L5; while the order with in planta study was: SDSH 513, GBK 046820, Serena,
GBK 046844, KAT 487, KAT 412 Wt, KAT 412 T1 and KATL5. This difference may be an
exemplification of the importance of systemic defence system.
Further experiments were done to profile the response of sorghum seedlings of KAT 412 Wt,
KOSA-1 T1 and the two lines that were most susceptible and tolerant, i.e., SDSH 513 and
KAT L5. The results showed that symptoms appeared within 48 HPI in SDSH and KAT 412
Wt. By 72 HPI, all the sorghum lines showed some signs of the disease, in which
approximately 5%, 30%, 45% and 90% of KAT L5, KAT 412 T1, KAT 412 Wt and SDSH 513
were symptomatic. This confirmed the difference in response to anthracnose in the sorghum
lines studied. It was also confirmed that the transgenic line was more tolerant than the wild
type KAT 412.
The temporal development of symptoms noted above bears a correlation to similar studies
previously done to profile accumulation of pathogenesis-related secondary metabolites. It
has been shown that young sorghum leaves accumulate a complex of phenols in response
to invasion by both pathogenic and non-pathogenic fungi, and the five major components of
this complex are the 3-deoxyanthocyanidin flavonoids: apigeninidin, luteolinidin, arabinosyl-
5-O-apigeninidin, 7-methylapigeninidin, and 5-methoxyluteolinidin (Nicholson et al., 1988;
Hipskind et al., 1990; Lo et al., 1996). All five of these compounds have exhibited fungitoxic
DISCUSSION
88
activity towards C. sublineolum, and are considered to be phytoalexins (Nicholson et al.,
1988). In leaf tissue, these phenolics first appear in the cell being invaded, accumulating in
inclusions in the cytoplasm (Snyder & Nicholson, 1990; Snyder et al., 1991). These
cytoplasmic inclusions migrate to the site of penetration, become pigmented, lose their
spherical shape and ultimately release their contents into the cytoplasm, killing the cell and
restricting further pathogen development. Studies to document responses of sorghum
leaves after infection with C. sublineolum, noted that by 24 HPI colourless inclusions
accumulate in the cytoplasm of cells beneath fungal appresoria (Nicholson et al., 1988) and
by 30 HPI inclusions have increased in size and become pigmented orange and start to
coalesce and are intensely red pigmented by 36 HPI. The inclusions release their contents
into the cell and pigmented inclusions start to accumulate in surrounding cells after 42 HPI.
It was found that by 54 HPI the cells have released their contents into the cells and the cell
walls are intensely red. These responses form part of the visible manifestation of the
pathogen-plant interaction normally seen as rusty/red pigmentation on infected leaves.
Sorghum seedling leaves exhibit few, if any, symptoms when inoculated with various fungi. It
has been reported that anthracnose resistant and susceptible cultivars are asymptomatic in
the seedling stage and plants must be about 5 weeks old before they will exhibit symptoms in
response to inoculation (Ferreira and Waren, 1982). The resistance has been attributed to
dhurrin, sorgoleone and other secondary metabolites. It was however, possible to infect
sorghum seedlings and induce pathogenesis through growth in high humidity and
temperature for the first 48 HPI. These conditions were favourable to C. sublineolum conidia
germination and infection.
4.4 REAL TIME EXPRESSION OF PR-GENES
Expression of the transgenes, the chitinase and chitosanase, and 4 sorghum innate genes
representing the upstream and downstream pathogenesis response system were profiled by
qRT-PCR after infection of seedlings with C. sublineolum. The four innate PR-genes

DISCUSSION
89
selected for analysis were sorghum leucine rich repeat (SbLRR), sorghum chalcone
synthase-like gene 2 (SbCHS2), sorghum chalcone synthase-like gene 8 (SbCHS8) and
sorghum chitinase (SbChit). Study of the real time expression of the PR-genes was divided
into two parts: in planta and ex planta analysis. In planta analysis entailed expression
studies in intact seedlings over a period of 144 hours after infection. Leaf samples were
taken for analysis at specific intervals. Ex planta studies was carried out from samples of
excised leaves 48 hours after infection. In planta expression of these genes was studied in
the leaves of seedlings of one transgenic line, KOSA-1, KAT 412 Wt, KAT L5, and SDSH
513. One week old seedlings were infected with 1 x 10⁶ conidia/ml of C. sublineolum.
Triplicate random samples of the infected second leaf were taken at specific time interval for
RNA extraction, first strand cDNA synthesis through reverse transcription and real time gene
expression quantification in a qRT-PCR cycler.
4.4.1 Expression of Chitosanase and Chitinase
Transgenes HarChit and HarCho were quantified in KOSA-1 T1 to ascertain the activity of
these introduced genes after infection with the pathogen. Expression of HarCho and HarChit
were confirmed in KOSA-1 T0, and T1. This is the first report of co-expression of two
transgenes of agronomic relevance in sorghum. Co-expression of HarChit and HarCho were
profiled in sorghum leaves over a period of 72 hours after infection with C. sublineolum.
Expression of HarChit and HarCho oscillated between 0.5–2.5 FC and the average fold
change of these genes were 0.95 and 1.03, respectively. Statistical analysis established that
there was no significant difference in the expression of the two transgenes (P0.05, 1 = 0.641).
It was also established that there was no significant effect of time (P0.05, 4 = 0.214) and gene x
time (P0.05, 4 = 0.660) interaction. Expression of both genes was under the control of the
constitutively expressed ubi1 promoter from maize. Both genes were therefore expected to
be constitutively expressed regardless of biotic or abiotic stress or time. The observed
insignificant change in expression was a proof of the expected expression pattern.

DISCUSSION
90
4.4.2 Expression of Innate PR-Genes
The expression of SbCHS2, SbChit, SbCHS8 and SbLRR was studied in C. sublineolum
infected and healthy seedlings. Preliminary studies were done on the expression of SbCHS2
in KAT 412 Wt and KOSA-1 T1. SbChit, SbCHS8 and SbLRR were quantified in KAT 412
Wt, KOSA-1 T1 as well as in C. sublineolum-tolerant KAT L5 and susceptible SDSH 513.
Evaluation of the expression of the innate genes after infection with C. sublineolum
established that time and genotype had significant effect on the expression of SbChit,
SbCHS8 and SbLRR but not SbCHS2. The three genes were also differentially expressed.
Newman-Keuls statistical test of variance showed that the changes in the expression of
SbCHS8 and SbLRR were not significantly different (P 0.05, 1 = 0.678). Expression of SbChit
was found to be significantly different from that of SbCHS8 and SbLRR (P 0.05, 1 = 0.00012
and 0.00014, respectively). Of the 4 genotypes studied, SDSH 513 was found to be
significantly different from KOSA-1 T1, KAT 412 and KAT L5. In the 0-144 HPI analysis
window, most of the significant changes in genes expression occurred between 48–144 HPI.
4.4.3 Expression of SbCHS2 in KOSA-1 and KAT 412 Wt
A preliminary study was done to study the expression of SbCHS2 in seedlings of KOSA-1
and KAT 412 Wt. Paired analysis of the infected and non infected samples showed that
SbCHS2 was expressed in both KOSA-1 T1 and KAT 412 Wt during the 18-72 HPI under
investigation. Statistical evaluation of the expression of SbCHS2 showed that there was no
significant difference in its expression in KOSA-1 and KAT 412 Wt (P0.05, 1 = 0.532). Time
after infection with the pathogen was also found to have no significant effect in the
expression of this gene (P0.05, 5 = 0.207). The insignificance in the change of expression of
SCHS2 could be explained by role of this gene secondary metabolism and stress-associated
response system.
Chalcone synthase (CHS) catalyzes the first committed step in flavonoid biosynthesis, in the
same pathway that is involved in biosynthesis of phytoalexins and an array other flavonoid-
DISCUSSION
91
derived phytochemicals (Austin and Noel, 2003). The enzyme is the prototype of the plant
type III polyketide synthase (PKS) family, including the closely related stilbene synthases
(STSs), pyrone synthases, acridone synthases, valerophenone synthases, and
benzalacetone synthases (Springob et al., 2003), giving rise to the diversity of type III PKS-
derived phytochemicals throughout the plant kingdom (Austin and Noel, 2003). CHS has
been described to consist of a family of 8 CHS genes, SbCHS1 to SbCHS8, in sorghum (Lo
et al., 2002). SbCHS1 to SbCHS7 (AF152548–AF152554) are highly conserved (at least
97.5% sequence identity at amino acid level) and closely related to the maize C2 and Whp
genes encoding CHS enzymes. Expression of SbCHS2 like other members of this gene
family (SbCHS1 to SbCHS7) has been suggested to be not specific to fungal infection (Lo et
al., 2002). Growing seedlings have been noted to accumulate certain flavonoids for which
the involvements and upregulation of SbCHS2 is a prerequisite (Lo et al., 2002). The
observed expression of SbCHS2 could therefore be explained to be part of general cellular
basal metabolism that are not directly influenced by biotic stress exerted by C. sublineolum
infection. Previous studies have noted that this gene was not specifically expressed in
response to pathogen infection (Lo et al., 2002). This study confirmed this observation in
KOSA-1 and Wt sorghum. This is a demonstration that the introduction of the transgenes did
not have a negative effect on the expression of the polyketide family of genes.
4.4.4 Expression of SbCHS8
Expression of SbCHS8 was evaluated in KOSA-1, KAT 412 Wt, KAT L5 and SDSH 513.
SbCHS8 was expressed in both the non- and infected seedlings of sorghum. Expression of
SbCHS8 was different to that SbCHS2 but similar to SbLRR. The average change in the
expression of SCHS8 was 46.1083 (19.992). A comparison of the transgenic and Wt KAT
412 revealed that the changes in the expression of SbCHS8 in KOSA-1 and KAT 412 Wt
were not significantly different. The average FC were 20.489 and 16.293 in the former and
latter, respectively. Highest activity of SbCHS8 was at 48 and 96 HPI in KAT 412 Wt and
KOSA-1, respectively. A different trend was found in anthracnose tolerant KAT L5 where the

DISCUSSION
92
activity of this gene was lower with an average change in expression being 7.373. Much
higher activity was recorded in SDSH 513. The activity of this gene was significantly up-
regulated in the anthracnose susceptible SDSH 513, in which the average fold change in the
activity was 185.728. The above results were different from the previous reports in 2
aspects. Previous reports contended that SbCHS8 was only expressed after infection (Lo et
al., 2002). The reports also postulated that higher expression of this gene is related to
disease tolerance (Lo et al., 2002).
The expression of this gene was first noted in sorghum seedlings that infected with C.
sublineolum (Lo et al., 2002). SbCHS8 (AY069951) was isolated as one of the genes in the
chalcone synthase gene family. It was found that it is only 81% to 82% identical to the other
members of the family, viz., SbCHS1 to SbCHS7, at the amino acid level and appeared to be
more distantly related as revealed by phylogenetic analysis (Lo et al., 2002). These findings
suggested that SbCHS8 was duplicated from the ancestral form of SbCHS1 to SbCHS7 and
diverged in protein coding sequence. It was later demonstrated that SbCHS8 encodes a
stilbene synthase (STS) enzyme and gene expression was activated during host and non-
host defence responses (Yu et al., 2005). The high and low activity of this gene in
susceptible and tolerant sorghum cultivars, respectively, raises questions on its role in the
defence response.
Similarity of response in Wt and T1 established that the expression SbCHS8 was not
significantly affected by the introduction of the two transgenes in sorghum. Gene responses
are multi-channelled and interlinked (Ryals, 1996; Cao et al., 1998). A deletion or addition of
one gene product in a complex pathway such as in chalcone biosynthesis, may not affect the
expression of other genes involved in the synthesis of other intermediates. Complex
compensatory, alternative and feedback mechanisms exist that modulate the responses.
Insignificant effect of the introduced HarChit and HarCho expression on the action of
SbCHS8 is a demonstration of such interplay in complex pathways regulation.
DISCUSSION
93
The different trend in the expression of SbCHS8 observed in KAT L5 and SDSH 513 could
be clarified by correlating its activity and the state of the leaf samples in which it was up-
regulated. It was noted that SbCHS8 was up-regulated in all leaf samples that exhibited
disease symptoms. Statistical analysis of SbCHS8 showed that most of the up-regulations
occurred between 96-144 HPI when the seedlings were showing clear symptoms. In
addition, leaves of SDSH 513 on the other hand, showed signs of infection as early as 48
HPI, which corresponded to a fold change of 108.080. It should be therefore concluded that
up-regulation of SbCHS8 in sorghum is associated with symptoms development.
Asymptomatic stages of infection are associated with low activity of this gene. A previous
report indicated that SbCHS8 was preferentially up-regulated in sorghum lines that showed
tolerance to anthracnose (Yu et al., 2005). SbCHS8 was expressed in anthracnose tolerant
KAT L5, but in its activity was much higher in susceptible SDSH 513.
It is also relevant to point out that SbCHS8 was considered to be expressed exclusively upon
C. sublineolum infection (Yu et al., 2005). This study, however, established that SbCHS8
was also expressed in non-infected leaves. This critical observation could be interpreted
from results obtained from other plant species where it was found that the expression of STS
genes was induced by a variety of abiotic and biotic stresses, such as elicitor treatment,
pathogen inoculation, wounding, UV irradiation, and post-harvest wilting procedures (Preisig-
Müller et al., 1999; Versari et al., 2001). Constitutive expression of CHS8-related STS genes
was described in young seedlings of grapes (Sparvoli et al., 1994). It was concluded that this
presumably representing a pre-existing defence mechanism (Sparvoli et al., 1994). It was
demonstrated in this study that constitutive expression of SbCHS8 occurs in sorghum.
4.4.5 Endogenous Sorghum Chitinase Gene
Expression of endogenous sorghum chitinase gene, SbChit was evaluated in KOSA-1 T1,
Wt, KAT L5 and SDSH 513. SbChit was expressed in all infected and healthy seedlings.

DISCUSSION
94
The average fold change in the expression of this gene between 0-144 HPI was 15.891
(4,719). Significant difference was noted in the expression of SbChit between the 4 sorghum
lines evaluated (P 0.05 = 0.0006-0.001). The highest expression of SbChit was noted in
SDSH 513 while the least was in KAT L5 (Figure 3.27). The fold change in the expression of
this gene was 209.42 in SDSH 513, while the least was 0.194 in KAT L5.
Involvement of sorghum innate chitinase in disease resistance has been studied in kernels
(Castor, 1981; Seetharaman et al., 1996). Diseases resistance in sorghum involves several
mechanisms that include hardness of the kernel, kernels with red pericarp, endosperm
textures, high tannins, high concentration of anthocyanidins and plants with pericarp
intensifier genes (Castor, 1981; Forbes et al., 1992; Waniska et al., 2001). It was found that
antifungal proteins such as sormatin, chitinases, glucanases and ribosomal inhibiting protein
(RIP) may play a role in grain mold resistance (Bueso et al., 2000; Waniska et al., 2001).
Chitinase and sormatin contents in sorghum kernel increased from the period after anthesis
to physiological maturity when some resistant sorghum lines were inoculated with a mixture
of Fusarium moniliforme and Curvularia lunata (Bueso et al., 2000). These studies did not
clearly demonstrate a strong association between resistance to grain mold and the
accumulation of sormatin and chitinase. It was concluded that moderately resistant cultivars
could employ other strategies to eschew or restrict fungal invasion either before or after
physiological maturity (Prom et al., 2005). Rodriguez-Herrera et al. (1999) compared levels
of 4 AFP using mold resistant and susceptible lines. Infection with grain mold resulted in the
induction and/or retention of more AFP in the resistant lines suggesting that coexpression of
AFP may be required to confer resistance (Rodriguez-Herrera et al., 1999). It was also
found that chitinase, sormatin and RIP concentration were 1.5-14 fold higher in the resistant
lines compared to susceptible lines and were associated with grain mold resistance
(Rodriguez-Herrera et al., 1999). Further in vitro studies have established that plant
chitinases readily attack and degrade chitin (Boller, 1985). A coordinated induction of
expression of 3 chitinase isoforms was observed in maize seeds in response to infection by
DISCUSSION
95
the fungus F. moniliforme (Cordero et al., 1994). Form the above studies it is consistent to
associate the expression of innate sorghum chitinase (SbChit) to disease response.
No significant difference was noted between the expression SbChit in Wt and T1 samples. In
contrast SbChit in KAT L5 showed a consistent low activity. However, it should be noted that
was expressed in both healthy and infected KAT L5 leaves. This could serve as baseline
deterrence to pathogens ingression and infection. It was also eminent that samples with
clear signs of infection, contained higher levels of SbChit than control samples. This gene
could therefore be considered to be intricately involved in disease response and its level
could be a good indicator of the degree of tolerance to anthracnose.
The involvement of chitinases in plant defence against invading fungi was demonstrated in
development of a transgenic sorghum carrying a gene coding for a rice chitinase (Zhu et al.,
1998). It was found that the development of stalk rot symptoms was significantly reduced in
transgenic sorghum plants with higher expression of rice chitinase, whereas plants with low
or no expression of the transgene showed normal disease progression (Zhu et al., 1998).
The baseline high expression of chitinase in the more tolerant KAT L5 could therefore be
associated to the tolerance to anthracnose in this cultivar.
4.4.6 Sorghum Leucine-Rich Repeat
SbLRR was quantified in seedling leaves of the 4 cultivars infected with C. sublineolum.
SbLRR was expressed in all the samples analysed. The average change in the expression
of this gene was 44.402 (14.390). Expression of SbLRR was highest in SDSH 513. The
maximum change in expression of SbLRR in SDSH 513 was 483.932. The least expression
was in KAT L5 in which the maximum FC was 46.700. The average change in SbLRR
expression in the 4 cultivars, in ascending order, was 11.390, 18.100, 28.530 and 163.254 in
KAT L5, KOSA-1, KAT 412 Wt and SDSH 513, respectively.

DISCUSSION
96
SbLRR is involved in direct and indirect interaction with pathogen molecules during infection
(Jia et al., 2000; Dangl and Jones, 2001). SbLRR is known to be involved in pathogen-signal
transduction. Higher activity of this gene therefore is an indication of defence response
system induction through its interaction with the pathogen. The low level of activity noted in
KAT L5 is reminiscent of the limited activity of most of the genes studied in this cultivar.
However, the low response in KAT L5 did not lead to a higher disease infestation. On the
contrary, KAT L5 remained asymptomatic longer than all the sorghum lines studied. This
observation points to another mechanism of pathology and response.
It has been elucidated that Botrytis cinerea, a necrotrophic fungus, caused disease in
Nicotiana benthamiana through the activation of two plant signalling genes, EDS1 and SGT1,
which have been shown to be essential for resistance against biotrophic pathogens (Oirdi
and Bouarab, 2007). Interestingly, virus-induced gene silencing of these two plant signalling
components enhanced N. benthamiana resistance to B. cinerea. This mechanism, whereby
pathogens counteract plant immune response of the host to infect and spread into
surrounding tissues has also been seen in several pathogens (Boaurab et al., 2002;
Abrahamovitch et al., 2003; 2006a; 2006b). Hypersentive reaction to pathogen ingression
does not therefore necessarily lead to disease resistance. The low response and disease
tolerance in KAT L5 could point to a different mechanism of tolerance that renders induction
pathogenesis-related genes irrelevant. A number of mechanisms of tolerance are known in
sorghum. The first line of defence is usually the cuticle. C. sublineolum is known to infect
sorghum through stomata and directly through the cuticle. Plant mechanisms that make it
difficult for C. sublineolum to attach onto and penetrate the plant cuticle offer a strategy of
tolerance. C. sublineolum is known to exert extreme invasive pressure through the infection
peg that makes infection upon attachment and germination of conidia a largely physical
process. The force exerted by the infection peg was computed to amount to 16.8±3.2 µN
(Bechinger et al., 1999). According to an analogy, a force of 17 µN exerted over the palm of
a human hand would enable it to support an 8 tonne school bus or an adult killer whale
DISCUSSION
97
(Money, 1999). The magnitude of this force convinced researchers to analyse the nature of
attachment of conidia onto leaf surfaces. This penetrative force of the infection peg would be
little significance if the conidia are not firmly attached onto the leaf surface. It has been
therefore postulated that conidia attachment may be a critical stage in the infection process.
It is therefore plausible that KAT L5 posses leaf surface agents that make it difficult for the
conidia of C. sublineolum to attach onto its leaves.
4.4.6 Comparison of in planta and ex planta Gene Expression
A comparison was carried out on the activity of the PR-genes in ex planta and in planta
infected leaves of KOSA-1, KAT 412 Wt, KAT L5, SDSH 513 and Serena. Leaf samples
from both in planta and ex planta assays were taken at 48 HPI and analysed for changes in
the expression of the target genes. All the genes were expressed in the ex planta and in
planta samples. All the samples, except SDSH 513, showed higher changes in the
expression of all the genes studied in ex planta than in planta samples. Analysis of KOSA-1
T1 showed that the changes in the expression of SbCHS2, SbCHS8, SbChit and SbLRR was
higher in the ex planta than in in planta samples. The average expression of all these genes
was 1.095 and 2.405 in in planta and ex planta samples, respectively. The same trend was
found in Wt KAT 412 where the average change in in planta and ex planta genes expression
was 0.936 and 3.693, respectively. No significant difference was noted between the wild
type and transgenic KAT 412.
SbCHS2 showed higher activity than SbCHS8, SbChit and SbLRR in KOSA-1 and KAT 412
Wt, reaching a maximum FC of 10.133. There was consistent lower expression of all the
PR-genes in KAT L5´s in planta as compared to ex planta samples. The average fold
changes in the expression of all genes was 0.163 and 4.491 in in planta and ex planta
samples, respectively. The least active was SbLRR that had an FC of 0.072 in KAT L5 in
planta samples. The trend observed in KAT412 Wt, KOSA-1 and KAT L5 was also seen in
the activity of the innate PR-genes in Serena. The activities of these genes were lower in the

DISCUSSION
98
in planta than in ex planta samples reaching an average of 0.955 and 6.340 in the former
and the latter assays, respectively. The activity of the PR-genes was different in SDSH 513
in comparison to KOSA-1, KAT 412 Wt, KAT L5 and Serena. The activity of SbCHS2,
SbCHS8, SbChit and SbLRR were higher in in planta than in ex planta infected samples.
These results could be interpreted in terms of the visually observed response of the ex planta
and in planta samples. Ex planta samples showed clear symptoms consisting of necrotic
local lesions. As noted previously in this discussion, development of symptoms and leaf
pigmentation after infection with C. sublineolum is correlated to accumulation of
pathogenesis-related secondary metabolites. It has been shown that young sorghum leaves
accumulate a complex of phenols in response to invasion by both pathogenic and non-
pathogenic fungi, and the five major components of this complex are the 3-
deoxyanthocyanidin flavonoids: apigeninidin, luteolinidin, arabinosyl-5-O-apigeninidin, 7-
methylapigeninidin, and 5-methoxyluteolinidin (Nicholson et al., 1988; Hipskind et al., 1990;
Lo et al., 1996). The higher fold changes in the expression of SbCHS8, SbLRR and SbChit
in ex planta than in planta samples is correlated to the more symptoms development in the
former. Infection and complete colonization of ex planta excised leaf samples by C.
sublineolum occurred by 144 HPI. Associated higher activity of SbCHS8, SbLRR and SbChit
in KOSA-1, KAT 412 and KAT T5 is a proof that these genes are involved in pathogenesis
response. The low activity of these genes in ex planta samples of SDSH 513, a cultivar
which was also found to be susceptible, demonstrates the intricate relationship in the
expression of these genes,

99
5 CONCLUSION AND OUTLOOK
The goal of this research was to transform sorghum with two antifungal genes, HarChit and
HarCho, in order to develop transgenic plants resistant to fungal diseases. This research
produced 3 independent, transgenic sorghum lines co-expressing the two target genes,
through particle bombardment. The transformation frequency achieved in this study was
0.087%. This augmented the challenges in sorghum transformation and the necessity for
further work on the optimization of the transformation process and investigations into the
molecular and cellular basis of non-homologous transformation and transgenes integration.
Transient gus expression in sorghum calli was achieved with Agrobacterium-mediated
transformation. The difficulty in achieving stable transformation with Agrobacterium indicates
that there is still work to be done for efficient modification of sorghum for successful genetic
engineering. Optimization of parameters that are considered to be crucial for transformation,
such as the screening of highly regenerative genotypes and the development of an efficient
plant tissue culture system should be pursued. Research into plant proteins involved in T-
complex plant docking, cytoplasmic transport, nuclear pore import and genome integration
will definitely open new possibilities of how to make Agrobacterium-mediated transformation
widely applicable in grasses such as sorghum.
Ex and in planta Colletotrichum sublineolum assays demonstrated the tolerance of
transgenic plants towards fungal infection compared to wild type plants. Transgenic
sorghum developed infection symptoms later than the wild type lines. Transgenic lines also
showed resilience and recovery after infection. Comparison of ex planta and in planta
infection assays revealed the importance of intact tissues in disease response. This
demonstrated the importance of innate systemic response to C. sublineolum tolerance.
Tolerant and susceptible lines were found in the collection of sorghum sampled from Kenya.
The transgenic sorghum was found to be less tolerant to C. sublineolum than KAT L5, which
was found to be the most resistant of the lines studied. This demonstrated the existence of a
100
genetic diversity among the Kenyan land races and cultivars that could be used for further
transformation work for disease resistance.
The transgenes HarChit and HarCho were constitutively expressed in healthy and infected
transgenic plants. Genotypic variation existed in the expression of parthenogenesis-related
genes: SbChit, SbCHS8 and SbLRR. This research established that SbChit, SbSTS and
SbLRR could be used as indicators of C. sublineolum tolerance. This investigation also
showed that SbCHS8 was constitutively expressed in sorghum and its up-regulation is an
indication of the severity of infection rather than a response per se. It was also demonstrated
that genetic transformation of sorghum did not result in significant changes in the expression
of the PR-genes in the transgenic lines. The PR genes could therefore be used as RNA-
based marker system for tolerance of sorghum to fungal diseases.

REFERENCE
101
REFERENCES
Able, J.A., Rathus, C., Godwin, I.D., (2001). The investigation of optimal bombardment parameters for transient and stable transgene expression in sorghum. In vitro Cellular Development Biology—Plant 37, 341–348. Albright, L. M., E. Huala, and F. M. Ausubel. (1989). Prokaryotic signal transduction mediated by sensor and regulator protein pairs. Annu. Rev. Genet. 23:311–336. Ali, M. E. K., and Warren, H. L., (1987). Physiological Races of Colletotrichum graminicola on Sorghum. Plant Disease 71:402-404. Ali, M. E. K., and Warren, H. L., (1992). Anthracnose of Sorghum. In: de Millano W. A. J., Frederiksen, R. A., and Bengston, G. D., (eds), Sorghum and Millet Diseases: A Second World Review. ICRISAT, Patancheru, AP 502 324, India, pp. 203-208. Awika JM, Rooney LW, Waniska RD (2004). Properties of 3-deoxyanthocyanins from sorghum. J Agric Food Chem. 52(14):4388-94. Battraw M and Hall TC, (1991). Stable transformation of Sorghum bicolor protoplasts with chimeric neomycin phosphotransferase II and β-glucuronidase genes. Theor. Appl. Genet. 82:161–168. Barker, R. F., K. B. Idler, D. V. Thompson, and J. D. Kemp. (1983). Nucleotide sequence of the T-DNA region from the Agrobacterium tumefaciens octopine Ti-plasmid pTi15955. Plant Mol. Biol. 2:335–350. Bartnicki-Garcia S (1968). Cell wall chemistry, morphogenesis and taxonomy of fungi. Annu Rev Microbiol 22:87-109. Bailey, J. A., O'Connell, R. J., Pring, R. J., and Nash, C., (1992). Infection strategies of Colletotrichum species. In: Bailey, J. A., and Jeger, M. J., eds., Colletotrichum: Biology, Pathology and Control. C. A. B. International, Wallingford, pp. 88 - 120. Bedell JA, et al. (2005) Sorghum genome sequencing by methylation filtration. PLoS Biol 3, 313. Bechinger, C., Giebel, K.-F., Shnell, M. and Deising, H.B. and Bastmeyer, M. (1999) Optical measurements of invasive forces exerted by appressoria of a plant pathogenic fungus. Science, 285:1896–1899. Bent, A. F. (1996). Plant disease resistance genes: function meets structure. Plant Cell 8:1757-1771. Blaiseau PL, Lafay JF (1992) Primary structure of a chitinase-encoding gene (chi1) from the filamentous fungus Aphanocladium album: similarity to bacterial chitinases. Gene 120:243–248. Bonnen, A. M., and Hammerschmidt, R., (1989). Role of cutinolytic enzymes in infection of cucumber by Colletotrichum lagenarium. Physiological and Molecular Plant Pathology 35:475 – 481. Boyes, C.J., Vasil, I.K. (1984). Plant regeneration by somatic embryogenesis from cultured young inflorescences of Sorghum arundinaceum (Desv.) Stapf. var. sudanense (susangrass). Plant Science Letters 35, 153–157. Brar, D.S., Rambold, S., Gamborg, O., Constabel, F. (1979). Tissue culture of corn and sorghum. Zeitschrift fur Pflanzenphysiologie 95:377–388. Brettschneider R., Becker D., Lorz H. (1997). Efficient transformation of scutellar tissue of immature maize embryos. Theor. Appl. Genet. 1997;94:737-748. Burkhard P, Stetefeld J, Strelkov SV. (2001). Coiled coils: a highly versatile protein folding motif. Trends Cell Biol. 11(2):82-88. Bueso, F. J.; Waniska, R. D.; Rooney, W. L.; Bejosano, F. (2000). Activity of antifungal proteins against mold in sorghum caryopses in the field. J. Agric. Food Chem. 4: 810-816. Byrne, M. C., J. Koplow, C. David, J. Tempe, and M.-D. Chilton. (1983). Structure of T-DNA in roots transformed by Agrobacterium rhizogenes. J. Mol. Appl. Genet. 2:201–209. Cabib E (1987). The synthesis and degradation of chitin. In: Meisler A (ed) Advances in enzymology and related areas of molecular biology. Wiley, New York, pp 59-101. Cai, T., Butler, L. (1990). Plant regeneration from embryogenic callus initiated from immature inflorescences of several high-tannin sorghums. Plant Cell Tissue Organ Culture 20, 101–110.

REFERENCE
102
Cai, T., Daly, B., Butler, L. (1987). Callus induction and plant regeneration from shoot portions of mature embryos of high-tannin sorghum. Plant Cell Tissue Culture 9, 245. Casas, A.M., Kononowicz, A.K., Zehr, U.B., Tomes, D.T., Axtell, J.D., Butler, L.G., Bressan, R.A., Hasegawa, P.M. (1993). Transgenic sorghum plants via microprojectile bombardment. Proceedings of the National Academy of Sciences USA 90, 11212–11216. Casas, A.M., Kononowicz, A.K., Haan, T.G., Zhang, L., Tomes, D.T., Bressan, R.A., Hasegawa, P.M. (1997). Transgenic sorghum plants obtained after microprojectile bombardment of immature inflorescences. In vitro Cell Development Biology—Plant 33:92–100. Celenza JL (2001). Metabolism of tyrosine and tryptophan - new genes for old pathways. Curr. Opin. Plant Biol. 4:234-240. Chen AC, Mayer RT, De Loach JR (1982). Purification and characterization of chitinase from the stable fly, Stomoxys calcitrans. Arch Biochem Biophys 216:314-321. Cheng, M., Fry, J.E., Pang, S., Zhou, H., Hironaka, C.M., Duncan, D.R., Conner, T.W., Wan, Y. (1997). Genetic transformation of wheat mediated by Agrobacterium tumefaciens. Plant Physiology 115:971–980. Cherif M and Benhamou N (1990). Cytochemical aspects of chitin breakdown during the parasitic action of a Trichoderma sp. on Fusarium oxysporium f. sp. radicislycopersici. Phytopathology 80:1406-1414. Chet I, Schichler H, Haran S, Appenheim AB (1993). Cloned chitinase and their role in biological control of plant pathogenic fungi. Int Sym Chitin Enzymol, Senigallia (italy), pp 47-48. Chiu WI, Niwa Y, Zeng W, Hirano T, Kobayashi H and Sheen J (1996). Engineered GFP as a vital reporter for plants. Curr. Biol. 6:325–330. Cohen-Kupiec R, Broglie KE, Friesem D, Broglie RM, Chet I. (1999). Molecular characterization of a novel ß-1,3-exoglucanase related to mycoparasitism of Trichoderma harzianum. Gene 226:147–154. Cordero MJ, Raventós D, San Segundo B (1994). Expression of a maize proteinase inhibitor gene is induced in response to wounding and fungal infection: systemic wound-response of a monocot gene. Plant J. 6(2):141-50. Collinge DB, Kragh KM, Mikkelsen JD, Nielsen KK, Rasmussen U, Vad K (1993). Plant Chitinases. Plant J 3:31-40. Christie, P.J. (2004) Type IV secretion: the Agrobacterium VirB/D4 and related conjugation systems. Biochim. Biophys. Acta 1694:219–234. Christensen A.H., R.A. Sharrock and P.H. Quail, Maize polyubiquitin genes: structure, thermal perturbation of expression and transcript splicing, and promoter activity following transfer to protoplasts by electroporation, Plant Mol Biol 18 (1992), pp. 675–689. Dana De las Mercedes, M, Limón MC, Mejías R, Mach RL, Benítez T, Pintor-Toro JA, Kubicek CP. (2001). Regulation of chitinase 33 (chit33) gene expression in Trichoderma harzianum. Curr Genet 38:335–342 Dangl JL, Jones JD. Nature (2001). Plant pathogens and integrated defence responses to infection. Nature 411(6839):826-33. Darnetty, Leslie, J.F., Muthukrishnan, S., Swegle, M., Vigers, A., Selitrennikoff, C.P. (1993) Variability in antifungal proteins in the grains of maize, sorghum and wheat. Physiologia Plantarum 88: 339-349. Davis SJ and Vierstra RD, (1998). Soluble, highly fluorescent variants of green fluorescent protein (GFP) for use in higher plants. Plant Mol. Biol. 36:521–528. Dellaporta SL, Wood J, Hicks JB (1983) A plant DNA minipreparation: version II. Plant Mol Biol Rep 1:19–21. Deu M, Gonzalez-de-Leon D, Glaszmann J.C., Degremont I, Chantereau J., Lanaud C., Hamon R (1994). RFLP diversity in cultivated sorghum in relation to racial differentiation. Theoretical and Applied Genetics. 88:838-844. De Vos, G., M. DeBeuckeleer, M. Van Montagu, and J. Schell (1981). Restriction endonuclease mapping of the octopine tumor-inducing plasmid pTiAch5 of Agrobacterium tumefaciens — addendum. Plasmid 6:249–253. Donzelli BGG, Lorito M, Scala F, Harman GE. (2001). Cloning, sequence and structure of a gene encoding an antifungal glucan 1,3-ß-glucosidase from Trichoderma atroviride (T. harzianum). Gene 277:199–208.
REFERENCE
103
Doty, S. L., M. C. Yu, J. I. Lundin, J. D. Heath, and E. W. Nester (1996). Mutational analysis of the input domain of the VirA protein of Agrobacterium tumefaciens. J. Bacteriol. 178:961–970. Dunstan, D.I., Short, K.C., Thomas, E. (1978). The anatomy of secondary morphogenesis in cultured scutellum tissue of Sorghum bicolor. Protoplasma 97:251–260. Dunstan, D.I., Short, K.C., Dhaliwal, H., Thomas, E. (1979). Further studies on plantlet production from cultured tissues of Sorghum bicolor. Protoplasma 101, 355–361. Elliott AR, Campbell JA, Dugdale B, Brettell RIS and Grof CPL, (1999). Green-fluorescent protein facilitates rapid in vivo detection of genetically transformed plant cells. Plant Cell Rep. 18:707–714. Ellis J, Jones D (1998). Structure and function of proteins controlling strain-specific pathogen resistance in plants. Curr Opin Plant Biol. 1(4):288-93. Ellis J, Dodds P, Pryor T (2000). Structure, function and evolution of plant disease resistance genes. Curr Opin Plant Biol. 3(4):278-84. Emani, C., Sunilkumar, G., Rathore, K.S., 2002. Transgene silencing and reactivation in sorghum. Plant Science 162:181–192. FAO 2008. Sorghum FAO Statistics – 2006 Production. http://faostat.fao.org. Ferreira, A. S., and Warren, H. L., 1982. Resistance of sorghum to Colletotrichum graminicola. Plant Disease 66:773-775. Filichkin SA, Gelvin SB. (1993). Formation of a putative relaxation intermediate during T-DNA processing directed by the Agrobacterium tumefaciens VirD1,D2 endonuclease. Mol Microbiol. 8(5):915–926. Fry, W. E., and Evans, P. H. (1977). Association of formamide hydrolase with fungal pathogenicity to cyanogenic plants. Phytopathology 67:1001-1006. Fry, W. E., and Munch, D. C., (1975). Hydrogen cyanide detoxification by Gloeocercospora sorghi. Physiological Plant Pathology 7:23-33. Garfinkel, D. J., and E. W. Nester. (1980). Agrobacterium tumefaciens mutants affected in crown gall tumorigenesis and octopine catabolism. J. Bacteriol. 144:732–743. Gamborg, O.L., Shyluk, J.P., Brar, D.S., Constabel, F., (1977). Morphogenesis and plant regeneration from callus of immature embryos of sorghum. Plant Science Letters 10:67–74. Gao, Z., Jayaraj, J., Muthukrishnan, S., Claflin, L., Liang, G.H. (2005). Efficient genetic transformation of sorghum using a visual screening marker. Genome 48:321–333. Gelvin, S.B. (2000). Agrobacterium and plant genes involved in T-DNA transfer and integration. Annu. Rev. Plant Physiol. Plant Mol. Biol. 51:223–256. Gelvin, S.B. (2003). Agrobacterium-Mediated Plant Transformation: the Biology behind the “Gene-Jockeying” Tool. Microbiology and Molecular Biology Reviews. 16–37. Gerard, J.-C., J. Canaday, E. Szegedi, H. de la Salle, and L. Otten (1992). Physical map of the vitopine Ti plasmid pTiS4. Plasmid 28:146–156. Girgi, M., O’Kennedy, M.M., Morgenstern, A., Smith, G., Lörz, H., Oldach, K.H., (2002). Transgenic and herbicide resistant pearl millet (Pennisetum glaucum L.) R.Br. via microprojectile bombardment of scutellar tissue. Molecular Breeding 10:243–252. Girgi, M., Breese, W.A., Lörz, H., Oldach, K.H. (2006). Rust and downy mildew resistance in pearl millet (Pennisetum glaucum) mediated by heterologous expression of the afp gene from Aspergillus giganteus. Transgenic Research 15:313–324. Girijashankar, V., Sharma, H.C., Sharma, K.K., Swathisree, V., Prasad, L.S., Bhat, B.V., Royer, M., Secundo, B.S., Narasu,M.L., Altosaar, I., Seetharama, N. (2005). Development of transgenic sorghum for insect resistance against the spotted stem borer (Chilo partellus). Plant Cell Reports 24:513–522. Godwin ID (2005) Sorghum genetic engineering: Current status and prospectus. Pages 1-8 in Sorghum tissue culture and transformation. N. Seetharama and Ian Godwin, eds. Oxford & IBH Publishing Co. Pvt. Ltd, New Delhi.

REFERENCE
104
Godwin ID and Chikwamba R, (1994). Transgenic grain sorghum (Sorghum bicolor) plants via Agrobacterium. In: Improvement of cereal quality by genetic engineering, (eds RJ Henry and JA Ronalds), Plenum Press, New York, NY. Hamer, J. E., Howard, R. J., Chumley, F. G., and Valent, B., (1988). A mechanism for surface attachment in spores of a plant pathogenic fungus. Science 239:288-290.
Heath, M. C. (1981). Non-host resistance. In: Staples, R. C., and Toenniessen, G. H., eds., Plant Disease Control: Resistance and Susceptibility. John Wiley and Sons, New York, pp. 201 - 217.
Hiei, Y., Ohta, S., Komari, T., Kumashiro, T. (1994). Efficient transformation of rice (Oryza sativa L.) mediated by Agrobacterium and sequence analysis of the boundaries of the T-DNA. The Plant Journal 6:271–282. Hammond-Kosack, K.E. and Jones, J.D.G. (1997) Plant disease resistance genes. Annual Review of Plant Physiology and Plant Molecular Biology 48:573-605. Haran S, Schickler H, Oppenheim A and Chet I (1995). New components of the chitinolytic system of Trichoderma harzianum. Mycol Res 99:441-446. Harris, H. B., and Cunfer, B. M. (1976). Observations on sorghum anthracnose in Georgia. Sorghum Newsletter 19:100-101. Heath MC. (2000). Hypersensitive response-related death. Plant Mol Biol. 44(3):321-34. Hendrix B. and Stewart J Mc D. (2002). Chitosanse may enhance anti-fungal defence response. AAES Research Series 507:2154-217. Heim R and Tsien RY, (1996). Engineering green fluorescent protein for improved brightness, longer wavelengths and fluorescent resonance energy transfer. Curr. Biol. 6:178–182. Hipskind, J. D., Hanau, R., Leite, B., and Nicholson, R. L. (1990). Phytoalexin accumulation in sorghum: Identification of an apigeninidin acyl ester. Physiological and Molecular Plant Pathology 36:381-396. Howe A, Sato S, Dweikat I, Fromm M, Clemente T (2006). Rapid and reproducible Agrobacterium-mediated transformation of sorghum. Plant Cell Rep 25:784–791. Huang, S., Adams, W.R., Zhou, Q., Malloy, K.P., Voyles, D.A., Anthony, J., Kriz, A.L., Luethy, M.H. (2004). Improving nutritional quality of maize proteins by expressing sense and antisense zein genes. Journal of Agricultural and Food Chemistry 52:1958–1964. Hooykaas, P. J. J., M. Hofker, H. den Dulk-Ras, and R. A. Schilperoort (1984). A comparison of virulence determinants in an octopine Ti plasmid, a nopaline Ti plasmid, and an Ri plasmid by complementation analysis of Agrobacterium tumefaciens mutants. Plasmid 11:195–205. Horsch, R. B., H. J. Klee, S. Stachel, S. C. Winans, E. W. Nester, S. G. Rogers, and R. T. Fraley (1986). Analysis of Agrobacterium tumefaciens virulence mutants in leaf disks. Proc. Natl. Acad. Sci. USA 83:2571–2575. Hu W and Cheng CL, (1995). Expression of Aequorea green fluorescent protein in plant cells. FEBS Lett. 369:331–334. International Crops Research Institute for the Semi-Arid Tropics (ICRISAT) (2008). An Endowment Fund for Sorghum and Pearl Millet Research Enhanced nutritional security, biodiversity and environmental sustainability. www.icrisat.org/Investors/Flyers/59_Endowment%20fund_D_scr.pdf. Ishida, Y., Saito, H., Ohta, S., Hiei, Y., Komari, T., Kumashiro, T., (1996). High efficiency transformation of maize (Zea mays L.) mediated Agrobacterium tumefaciens. Nature Biotechnology 6, 745–750. Jefferson RA, Kavanagh TA and Bevan MW (1987). Gus fusion:β-glucuronidase as a sensitive and versatile gene fusion marker in higher plants. EMBO J. 6: 3901–3907. Jeoung JM, Krishnaveni S, Muthukrishnan S, Trick HN, Liang GH. (2002). Optimization of sorghum transformation parameters using genes for green fluorescent protein and beta-glucuronidase as visual markers. Hereditas 137(1):20-8. Jia Y, McAdams SA, Bryan GT, Hershey HP, Valent B(2000). Direct interaction of resistance gene and avirulence gene products confers rice blast resistance. EMBO J. 9(15):4004-4014.
REFERENCE
105
Jones JD, Dangl JL (2006). The plant immune system. Nature. 444(7117):323-329. Jones JDG, Grady K, Suslow T, Bedbrook J (1986) Isolation and characterization of genes encoding two chitinase enzymes from Serratia marcescens. EMBO J 5:467–473. KARI (Kenya Agricultural Research Institute) (1996). Annual report. KARI, Nairobi, Kenya. Kempin, S. A., S. J. Liljegren, L. M. Block, S. D. Roundsley, M. F. Yanofsky, and E. Lam (1997). Targeted disruption in Arabidopsis. Nature 389:802–803. Kobe B, Kajava AV. (2001). The leucine-rich repeat as a protein recognition motif. Curr Opin Struct. 11(6):725-32. Kopp EB, Medzhitov R. (1999). The Toll-receptor family and control of innate immunity. Curr Opin Immunol. (1):13-8. Krishnaveni, S., Jeoung, J.M., Muthukrishnan, S., Liang, G.H. (2001). Transgenic sorghum plants constitutively expressing a rice chitinase gene show improved resistance to stalk rot. Journal of Genetics and Breeding 55:151–158. Kubicek CP, Penttilä ME. (1998). Regulation of production of plant polysaccharide degrading enzymes by Trichoderma. In: Harman GE, Kubicek CP, eds. Trichoderma and Gliocladium, vol 2: enzymes, biological control and commercial application. London: Taylor & Francis. p 49–72. Kuranda MJ and Robin PW (1991). Chitinase is required for cell separation during growth of Saccharomyces cerevisiae. J Biol Chem 266:19758-19767. Lacroix Benoit , Tzvi Tzfira, Alexander Vainstein and Vitaly Citovsky (2006). A case of promiscuity: Agrobacterium’s endless hunt for new partners 1 TRENDS in Genetics Vol.22 No.1. Lee S, Choi H, Suh S, et al. (1999). Oligogalacturonic acid and chitosan reduce stomatal aperture by inducing the evolution of reactive oxygen species from guard cells of tomato and Commelina communis. Plant Physiology 121:147-152. Lemmers, M., M. DeBeuckeleer, M. Holsters, P. Zambryski, A. Depicker, J. P. Hernalsteens, M. Van Montagu, and J. Schell (1980). Internal organization, boundaries and integration of Ti-plasmid DNA in nopaline crown gall tumours. J. Mol. Biol. 144:353–376. Levine A, Pennell RI, Alvarez ME, Palmer R, Lamb C. (1996). Calcium-mediated apoptosis in a plant hypersensitive disease resistance response. Curr Biol. 6(4):427-37. Linthorst, H. J. M. (1991). Pathogenesis-related proteins of plants. Crit. Rev. Plant Sci. 10:123-150. Lo, S.-C., Weiergang, T., Bonham, C., Hipskind, J., Wood, K., and Nicholson, R. L., (1996). Phytoalexin accumulation in sorghum: Identification of a methyl ether of luteolinidin. Physiological and Molecular Plant Pathology 49:21-31. Lo S-CC, de Verdier K, Nicholson RL (1999). Accumulation of 3-deoxyanthocyanidin phytoalexins and resistance to Colletotrichum sublineolum in sorghum. Physiol Mol Plant Pathol 55:263–273. Lo C, Coolbaugh RC, Nicholson RL (2002). Molecular characterization and in silico expression analysis of a chalcone synthase gene family in sorghum. Physiol Mol Plant Pathol 61: 179–188. Masteller, V.J., Holden, D.J., (1970). The growth of and organ formation from callus tissue of sorghum. Plant Physiology 45:362–364. Lorito M, Peterbauer C, Hayes CK, Harman GE (1994). Synergistic interaction between fungal cell wall degrading enzymes and different antifungal compounds enhances inhibition of spore germination. Microbiology.140 (3):623-9. Lorito M, Farkas V, Rebuffat S, Bodo B, Kubicek CP (1996). Cell wall synthesis is a major target of mycoparasitic antagonism by Trichoderma harzianum. J Bacteriol. 178(21):6382-6385. Lorito M, Woo SL, Garcia I, Colucci G, Harman GE, Pintor-Toro JA, Filippone E, Muccifora S, Lawrence CB, Zoina A, Tuzun S, Scala F (1998). Genes from mycoparasitic fungi as a source for improving plant resistance to fungal pathogens. Proc Natl Acad Sci U S A. 95(14):7860-7865. Lundquist, R. C., T. J. Close, and C. I. Kado (1984). Genetic complementation of Agrobacterium tumefaciens Ti plasmid mutants in the virulence region. Mol. Gen. Genet. 193:1–7.
REFERENCE
106
Mercer, P. C., Wood, R. K. S., and Greenwood, A. D. (1975). Ultrasrtucture of parasitism of Phaseolus vulgaris by Colletotrichum lindemuthianum. Physiological Plant Pathology 5:203-214. Mercure, E. W., Kunoh, H., and Nicholson, R. L. (1995). Visualization of materials released from adhered, ungerminated conidia of Colletotrichum graminicola. Physiological and Molecular Plant Pathology 46:121-135. Money, N.P. (1999a) Fungus punches its way in. Nature, 401:332–333. Money, N.P. (1999b) To perforate a leaf of grass. Fungal Genet. Biol. 28:146–147. Morel JB, Dangl JL (1999). Suppressors of the arabidopsis lsd5 cell death mutation identify genes involved in regulating disease resistance responses. Genetics 151(1):305-319. Mysore, K. S., J. Nam, and S. B. Gelvin (2000). An Arabidopsis histone H2A mutant is deficient in Agrobacterium T-DNA integration. Proc. Natl. Acad. Sci. USA 97:948–953. Nicholson, R. L., Jamil, F., Snyder, B. A., Lue, W. L., and Hipskind, J. (1988). Phytoalexin synthesis in the juvenile sorghum leaf. Physiological and Molecular Plant Pathology 33:271-278. Nicholson, R. L., and Epstein, L. (1991). Adhesion of fungi to the plant surface. Prerequisite for pathogenisis. In: Cole, G. T., and Hoch, H. C., eds., The fungal spore and disease initiation in plants and animals. Plenum Press, New York. Oldach, K.H., Morgenstern, A., Rother, S., Girgi, M., O’Kennedy, M.M., Lo¨ rz, H. (2001). Efficient in vitro plant regeneration from immature zygotic embryos of pearl millet [Pennisetum glaucum (L.) R. Br.] and Sorghum bicolor (L.) Moench. Plant Cell Reports 20:416–421. Pang AZ, DeBoer DL, Wan Y, Ye G, Layton JG, Neher MK, Armstrong CL, Fry JE, Hinchee MA and Fromm ME, (1996). An improved green fluorescent protein gene as a marker in plants. Plant Physiol. 112:893–900. Pastor-Corrales, M. A., and Frederiksen, R. A. (1980). Sorghum anthracnose. Pages 289-294 in: Sorghum Diseases: A World Review. Proc. Int. Workshop Sorghum Dis. R. J. Williams, R. A. Frederiksen, and L. K. Mughogho, eds. International Crops Research Institute for the Semi-Arid Tropics, Patancheru, India. Papavizas CG (1985). Trichoderma and Gliocladium: biology, ecology and potential for biocontrol. Annu Rev Phytopathol 23:23-54. Pedersen, J.F., Marx, D.B., Funnell, D.L. (2003). Use of A3 cytoplasm to reduce risk of gene flow through sorghum pollen. Crop Science 43:1506–1509. Rasmussen, J. B., and Hanau, R. M. (1989). Exogenous scytalone restores appressorial melanization and pathogenicity in albino mutants of Colletotrichum graminicola. Canadian Journal of Plant Pathology 11:349-352. Reddy, B.V.S., Ramesh, S., Longvah, T. (2005). Prospects of breeding for micronutrients and b-carotene-dense sorghum. International Sorghum and Millets Newsletter 46:11–14. Repellin A, Baga M, Jauhar P and Chibbar RN, (2001). Genetic enrichment of cereal crops via alien gene transfer: new challenges. Plant Cell Org. Cul. 64: 159–183. Ridout CJ, Coley Smith JR, Lynch JM (1986). Enzyme activity and electrophoretic profile of extracellular protein induced in Trichoderma spp. by cell walls of Rhizoctonia solani. J Gen Microbiol 132:2345-2352. Rodriguez-Herrera, R. (1999). Grain mold resistance in sorghum (Sorghum bicolor (L) Moench): Genetic, physical and biochemical analysis. Ph.D. Dissertation, Texas A&M, University, College Station, TX, 1999; 143 pp. Rodriguez-Herrera, R.; Waniska, R. D.; Rooney, L. W. Antifungal proteins and grain mold resistance in Seetharaman, K.; Waniska, R. D.; Rooney, L. W. (1996). Physiological changes in sorghum antifungal proteins. J. Agric. Food Chem. 44,2435-2441. Sambrook J, Fritsch EF, Maniatis T (1989). Molecular cloning: a laboratory manual, 2nd edn, Cold Spring Habour Laboratory, Cold Spring Harbor, New York. Salzman RA, Brady JA, Finlayson SA, Buchanan CD, Summer EJ, Sun F, Klein PE, Klein RR, Pratt LH, Cordonnier-Pratt MM, Mullet JE (2005). Transcriptional profiling of sorghum induced by methyl jasmonate, salicylic acid, and aminocyclopropane carboxylic acid reveals cooperative regulation and novel gene responses. Plant Physiol.138(1):352-68.

REFERENCE
107
Saskia C. M. van Wees, Erik A. M. de Swart, Johan A. van Pelt, Leendert C. van Loon, and Corné M. J. Pieterse (2000). Enhancement of induced disease resistance by simultaneous activation of salicylate- and jasmonate-dependent defense pathways in Arabidopsis thaliana. PNAS July 18, 2000 vol. 97 no. 15 8711-8716 Sela-Buurlage, M., Epstein, L., and Rodriguez, R. J. (1991). Adhesion of ungerminated Colletotrichum musae conidia. Physiological and Molecular Plant Pathology 39:345-352. Schirmböck M, M Lorito, Y L Wang, C K Hayes, I Arisan-Atac, F Scala, G E Harman and C P Kubicek (1994). Parallel formation and synergism of hydrolytic enzymes and peptaibol antibiotics, molecular mechanisms involved in the antagonistic action of Trichoderma harzianum against phytopathogenic fungi. Appl Environ Microbiol. 60(12):4364-4370. Smith, R.H., Bhaskaran, S., Schertz, K., (1983). Sorghum plant regeneration from aluminium selection medium. Plant Cell Reports 2:129–132. Snyder, B. A., and Nicholson, R. L. (1990). Synthesis of phytoalexins in sorghum as a site specific response to fungal ingress. Science 248:1637-1639. Snyder, B. A., Leite, B., Hipskind, J., Butler, L. G., and Nicholson, R. L. (1991). Accumulation of sorghum phytoalexins induced by Colletotrichum graminicola at the infection site. Physiological and Molecular Plant Pathology 39:463-470. Srinivasula SM, Ahmad M, MacFarlane M, Luo Z, Huang Z, Fernandes-Alnemri T, Alnemri ES (1998). Generation of constitutively active recombinant caspases-3 and -6 by rearrangement of their subunits. J Biol Chem. 273(17):10107-11. Steyaert, J. M., Stewart, A., Jaspers, M. V., Carpenter, M., Ridgway, H. J. (2004). Co-expression of two genes, a chitinase (chit42) and proteinase (prb1), implicated in mycoparasitism by Trichoderma hamatum. Mycologia 96:1245-1252. Stachel, S. E., E. W. Nester, and P. C. Zambryski (1986). A plant cell factor induces Agrobacterium tumefaciens vir gene expression. Proc. Natl. Acad. Sci. USA 83:379–383. Stam, M., R. de Bruijn, S. Kenter, R. A. L. van der Hoorn, R. van Blokland, J. N. M. Mol, and J. M. Kooter (1997). Post-transcriptional silencing of chalcone synthase in Petunia by inverted transgene repeats. Plant J. 12:63– 82. Strauch E, Wohlleben W, Pühler A (1988) Cloning of a phosphinothricin N-acetyltransferase gene from Streptomyces viridochromogenes Tü494 and its expression in Streptomyces lividans and Escherichia coli. Gene 63: 65-74 Sundheim L (1992). Effect of chitinase-encoding genes in biocontrol of Pseudomonas spp. In James EC, Papavizas GC, Cook RJ (eds) Biological control of plant diseases. NATO ASI series, 230. Plenum Press, New York London, pp 331-332. Sutton, B. C. (1980). The Coelomycetes: Fungi Imperfecti with Pycnidia, Acervuli and Stromata. Commonwealth Mycological Institute, Kew, London, 696 pp. Suzuki, K., Y. Hattori, M. Uraji, N. Ohta, K. Iwata, K. Murata, A. Kato, and K. Yoshida (2000). Complete nucleotide sequence of a plant tumorinducing Ti plasmid. Gene 242:331–336. Stephanie Lüticke (2006). Personal Communication. Tadesse, Y.S., (2000). Genetic transformation of sorghum (Sorghum bicolor (L.) Moench) towards improving nutritional quality. Ph.D. thesis. Vrije Universiteit Brussel Instituut Voor Moleculaire Biologie, Faculteit Wetenschappen, Belgium. Tadesse, Y., Sgi, L., Swennen, R., Jacobs, M. (2003). Optimisation of transformation conditions and production of transgenic sorghum (Sorghum bicolor) via microparticle bombardment. Plant Cell, Tissue and Organ Culture 75, 1–18. Tarr S. A. J. (1962) Diseases of Sorghum, Sudan Grass and Broom Corn. The Commonwealth Mycological Institute, Kew, Surrey, 298 pp. Thomas CM, Jones DA, Parniske M, Harrison K, Balint-Kurti PJ, Hatzixanthis K, Jones JD.(1997). Characterization of the tomato Cf-4 gene for resistance to Cladosporium fulvum identifies sequences that determine recognitional specificity in Cf-4 and Cf-9. Plant Cell (12):2209-24.

REFERENCE
108
Thomas, M.D., I. Sissoko and M. Sacko (1996). Development of leaf anthracnose and its. effect on yield and grain weight of sorghum in West Africa. Plant Dis 89:151-153. Thomson JA (2008). The role of biotechnology for agricultural sustainability in Africa. Philos Trans R Soc Lond B Biol Sci. 363(1492):905-13. Tingay, S., McElroy, D., Kalla, R., Fieg, S., Wang, M., Thornton, S., Brettell, R. (1997). Agrobacterium tumefaciens-mediated barley transformation. The Plant Journal 11:1369–1376. Turk, S. C. H. J., R. P. van Lange, T. J. G. Regensburg-Tuink, and P. J. J. Hooykaas (1994). Localization of the VirA domain involved in acetosyringone- mediated vir gene induction in Agrobacterium tumefaciens. Plant Mol. Biol. 25:899–907. Tzfira, T. and Citovsky, V. (2002) Partners-in-infection: host proteins involved in the transformation of plant cells by Agrobacterium. Trends Cell Biol. 12:121–129. Tzfira, T., M. Vaidya, and V. Citovsky (2002). Increasing plant susceptibility to Agrobacterium infection by overexpression of the Arabidopsis nuclear protein VIP1. Proc. Natl. Acad. Sci. USA 99:10435–10440. UN (2007). World population will likely increase by 2.5 billion by 2050. Press Release POP/952 13 March 2007, World Population Prospects: The 2006 Revision, Highlights (United Nations, February 2005), www.unpopulation.org. UN (2008). 25th Regional Conference for Africa. 19 June 2008 Nairobi/Rome. Unger, L., S. F. Ziegler, G. A. Huffman, V. C. Knauf, R. Peet, L. W. Moore, M. P. Gordon, and E. W. Nester (1985). New class of limited-host-range- Agrobacterium mega-tumor-inducing plasmid lacking homology to the transferred DNA of a wide-host-range, tumor-inducing plasmid. J. Bacteriol. 164:723–730. Vander P, V rum KM, Domard A, Eddine El Gueddari N, Moerschbacher BM. (1998). Comparison of the ability of partially N-acetylated chitosans and chitooligosaccharides to elicit resistance reactions in wheat leaves. Plant Physiol. 118(4):1353-9. Vergunst, A. C., B. Schrammeijer, A. den Dulk-Ras, C. M. T. de Vlaam, T. J. G. Regensburg-Tuink, and P. J. J. Hooykaas (2000). VirB/D4-dependent protein translocation from Agrobacterium into plant cells. Science 290:979–982. Waniska RD, Venkatesha RT, Chandrashekar A, Krishnaveni S, Bejosano FP, Jeoung J, Jayaraj J, Muthukrishnan S, Liang GH. (2001). Antifungal proteins and other mechanisms in the control of sorghum stalk rot and grain mold. J Agric Food Chem. 49(10):4732-42. Ward, E. R., and W. M. Barnes (1988). VirD2 protein of Agrobacterium tumefaciens very tightly linked to the 5´ end of T-strand DNA. Science 242:927–930. Watanabe T, Oyanagi W, Suzuki H, Tanaka H (1990). Gene cloning of chitinse AI from Bacilllus circulans WL-12 revealed its evolutionary relationship to Serratia chitinase and to the type-III homology units of fibronectin J Biol Chem 265:15659-15665. Watanabe T, Oyanagi W, Suzuki H, Tanaka H (1992). Structure of the gene encoding chitinase-D of Bacillus circulans WL-12 and possible homology of the enzyme to other prokaryotic chitinases and class-III plant chitinases. J Bacteriol 174:408-414. Wernicke, W., Brettell, R. (1980). Somatic embryogenesis from Sorghum bicolor leaves. Nature 287, 138–139. Winans, S. C. 1991. An Agrobacterium two-component regulatory system for the detection of chemicals released from plant wounds. Mol. Microbiol. 5:2345–2350. Wood, D. W., J. C. Setubal, R. Kaul, D. E. Monks, J. P. Kitajima, V. K. Okura, Y. Zhou, L. Chen, G. E. Wood, N. F. Almeida, L. Woo, Y. Chen, I. T. Paulsen, J. A. Eisen, P. D. Karp, D. Bovee, P. Chapman, J. Clendenning, G. Deatherage, W. Gillet, C. Grant, T. Kutyavin, R. Levy, M.-J. Li, E. McClelland, A. Palmieri, C. Raymond, G. Rouse, C. Saenphimmachak, Z. Wu, P. Romero, D. Gordon, S. Zhang, H. Yoo, Y. Tao, P. Biddle, M. Jung, W. Krespan, M. Perry, B. Gordon-Kamm, L. Liao, S. Kim, C. Hendrick, Z.-Y. Zhao, M. Dolan, F. Chumley, S. V. Tingey, J.-F. Tomb, M. P. Gordon, M. V. Olson, and E. W. Nester (2001). The genome of the natural genetic engineer Agrobacterium tumefaciens C58. Science 294:2317–2323. Yanai K, Takaya N, Kojima N, Horiuchi H, Ohta A, Takagi M (1992). Purification of two chitinases from Rhizopus oligosporus and isolation and sequencing of the encoding genes. J Bacteriol 174: 7398-7406.

REFERENCE
109
Young , D. H., and Kauss, H. (1984). Adhesion of Colletotrichum lindemuthianum spores to Phaseolus vulgaris hypocotyls and to polystyrene. Applied Environmental Microbiology 47:616-619. Yu TT, Skinner DZ, Trick HN, Huang B, Muthukrishnan S and Liang GH (2001). Agrobacterium-mediated transformation of creeping bentgrass using GFP as a reporter gene. Hereditas 133:229–233. Yu, Christine K.Y., Karin Springob, Jürgen Schmidt, Ralph L. Nicholson, Ivan K. Chu, Wing Kin Yip and Clive Lo (2005). Stilbene Synthase Gene (SbSTS1) Is Involved in Host and Nonhost Defense Responses in Sorghum. Plant Physiology 138:393-401. Zambryski, P., M. Holsters, K. Kruger, A. Depicker, J. Schell, M. Van Montagu, and H. M. Goodman (1980). Tumor DNA structure in plant cells transformed by A. tumefaciens. Science 209:1385–1391. Zambryski, P., P. H. Joos, C. Genetello, J. Leemans, M. Van Montagu, and J. Schell (1983). Ti plasmid vector for the introduction of DNA into plant cells without alteration of their normal regeneration capacity. EMBO J. 2:2143–2150. Zhao, Z.-U., Cai, T., Tagliani, L., Miller, M., Wang, N., Pang, H., Rudert, M., Schroeder, S., Hondred, D., Seltzer, J., Pierce, D. (2000). Agrobacterium-mediated sorghum transformation. Plant Molecular Biology 44:789–798. Zhong, H., Wang, W., Sticklen, M. (1998). In vitro morphogenesis of Sorghum bicolor (L.) Moench: efficient plant regeneration from shoot apices. Journal of Plant Physiology 153:719–726. Zhu, H., Muthukrishnan, S., Krishnaveni, S., Wilde, G., Jeoung, J.M., Liang, G.H. (1998). Bioilistic transformation of sorghum using a rice chitinase gene. Journal of Genetics and Breeding 52:243–252. Zhu, X., Galili, G. (2003). Increased lysine synthesis coupled with a knockout of its catabolism synergistically boosts lysine content and also transregulates the metabolism of other amino acids in Arabidopsis seeds. Plant Cell 15:845–853.
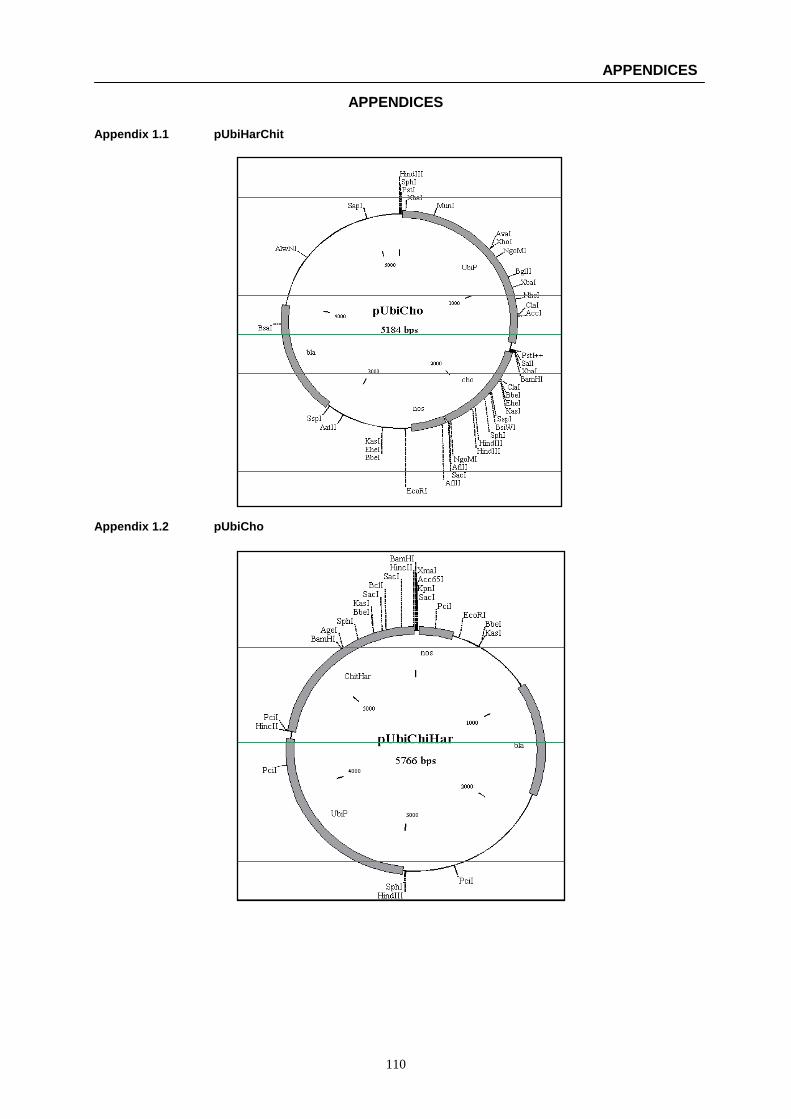
APPENDICES
110
APPENDICES
Appendix 1.1 pUbiHarChit
Appendix 1.2 pUbiCho
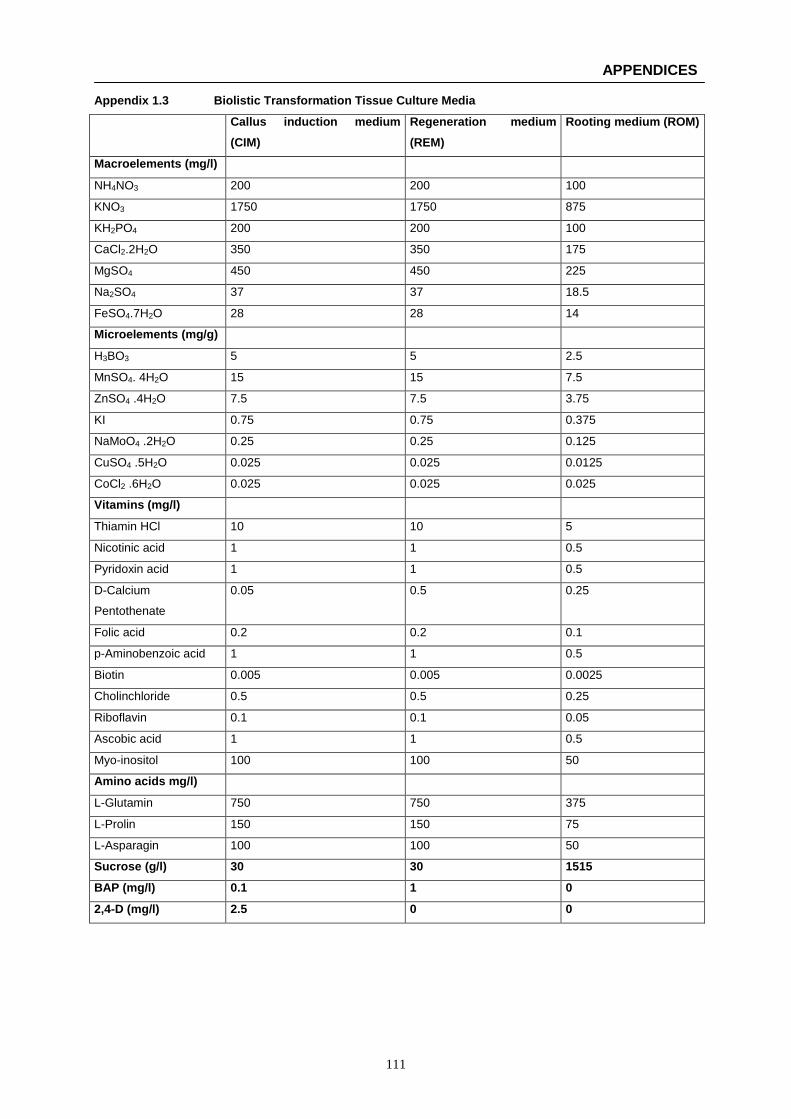
APPENDICES
111
Appendix 1.3 Biolistic Transformation Tissue Cultur e Media
Callus induction medium
(CIM)
Regeneration medium
(REM)
Rooting medium (ROM)
Macroelements (mg/l)
NH4NO3 200 200 100
KNO3 1750 1750 875
KH2PO4 200 200 100
CaCl2.2H2O 350 350 175
MgSO4 450 450 225
Na2SO4 37 37 18.5
FeSO4.7H2O 28 28 14
Microelements (mg/g)
H3BO3 5 5 2.5
MnSO4. 4H2O 15 15 7.5
ZnSO4 .4H2O 7.5 7.5 3.75
KI 0.75 0.75 0.375
NaMoO4 .2H2O 0.25 0.25 0.125
CuSO4 .5H2O 0.025 0.025 0.0125
CoCl2 .6H2O 0.025 0.025 0.025
Vitamins (mg/l)
Thiamin HCl 10 10 5
Nicotinic acid 1 1 0.5
Pyridoxin acid 1 1 0.5
D-Calcium
Pentothenate
0.05 0.5 0.25
Folic acid 0.2 0.2 0.1
p-Aminobenzoic acid 1 1 0.5
Biotin 0.005 0.005 0.0025
Cholinchloride 0.5 0.5 0.25
Riboflavin 0.1 0.1 0.05
Ascobic acid 1 1 0.5
Myo-inositol 100 100 50
Amino acids mg/l)
L-Glutamin 750 750 375
L-Prolin 150 150 75
L-Asparagin 100 100 50
Sucrose (g/l) 30 30 1515
BAP (mg/l) 0.1 1 0
2,4-D (mg/l) 2.5 0 0

APPENDICES
112
Appendix 1.4 Agrobacterium Transformation Media
A B C D Inoculation Medium
MS Salts MS Salts - 4.3g/l 1/10 MS MS Salts MS Salts
N6 Vitamins 0 N6 Vitamins 0 N6 Vitamins Nicotinic acid 0.5mg 0 0 0 Pyridoxine-HCl 0.5mg 0 0 0
Thiamine-HCl 1.0mg 0 1mg 0 Myo Inositol 0.1g 0 250mg 0
Vitamin Assay Casamino Acids
1.0g 0 1g 0
Sucrose 68.5g 30g 0 68.4g
Maltose 0 0 30g 0 Glucose 36.0g 10g 0 36.0g
L-Prolin 0 0 680mg 0.7g Glycin 0 0 0 2mg 3 AA 0 0 25ml (40x 3 AA) 0
Ascobic Acid 0 0 50mg 0 L-Cystein 0 0 200mg 0
MES 0 0.25g 3.9g (10mM) 0 Pluronic F-68 0 0.03% 0 0
2,4-D 0 0.002g 200µM 0 Silwet L-77 0 0 0.01% 0 Acetosyringone 100µM 0 200µM 100µl
pH pH 5.2 pH 5.6 pH 5.4 pH 5.2 Zhao et al 2000 Cavalho et al 2002 S. Lütticke 2004 Bronwyn 2006
Co-Cultivation Medium
MS Salts MS Salts MS Salts MS Salts N6 Salts
N6 Vitamins 0 N6 Vitamins 0 N6 Vitamins
Nicotinic acid 0.5mg 0 0 0 Pyridoxine-HCl 0.5mg 0 0 0
Thiamine-HCl 1.0mg 0 1mg 0 Myo Inositol 0.1mg 0 250mg 0 Vitamin Assay Casamino Acids
1.5mg 0 1g 0
Sucrose 20.0g 30g 0 30g
Maltose 0 0 30g 0 Glucose 10.0g 10g 0 0 L-Prolin 700mg 0 690mg 700mg
Glycin 0 0 0 0 3 AA 0 0 25ml 0
Ascobic Acid 10.0mg 0 50mg 0 L-Cystein 0 0 200mg 300mg
Silver Nitrate 0 0 0 0.85mg MES 0.5g 0.25g 3.9g 0 Pluronic F-68 0 0 0 0
Coconut Water 0 10% 0 0 PVPP 0 0.5 or 1% 0 0
DTT 0 0.2% 0 0 Kinetin 0 0 0 0 2,4-D 2.0mg 2.0mg 1.25mg 1.5mg
Acetosyringone 100µM 200µM 200µM 100µM pH pH 5.8 pH 5.6 pH 5.4 pH 5.8
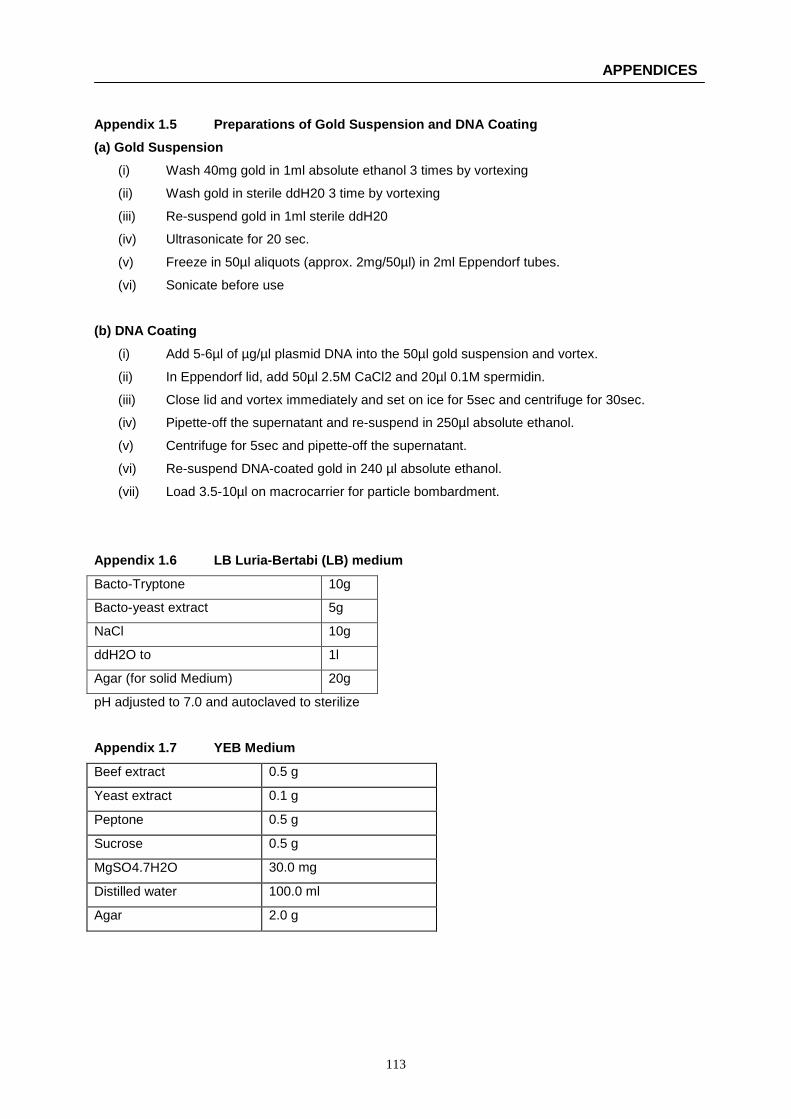
APPENDICES
113
Appendix 1.5 Preparations of Gold Suspension and DN A Coating
(a) Gold Suspension
(i) Wash 40mg gold in 1ml absolute ethanol 3 times by vortexing
(ii) Wash gold in sterile ddH20 3 time by vortexing
(iii) Re-suspend gold in 1ml sterile ddH20
(iv) Ultrasonicate for 20 sec.
(v) Freeze in 50µl aliquots (approx. 2mg/50µl) in 2ml Eppendorf tubes.
(vi) Sonicate before use
(b) DNA Coating
(i) Add 5-6µl of µg/µl plasmid DNA into the 50µl gold suspension and vortex.
(ii) In Eppendorf lid, add 50µl 2.5M CaCl2 and 20µl 0.1M spermidin.
(iii) Close lid and vortex immediately and set on ice for 5sec and centrifuge for 30sec.
(iv) Pipette-off the supernatant and re-suspend in 250µl absolute ethanol.
(v) Centrifuge for 5sec and pipette-off the supernatant.
(vi) Re-suspend DNA-coated gold in 240 µl absolute ethanol.
(vii) Load 3.5-10µl on macrocarrier for particle bombardment.
Appendix 1.6 LB Luria-Bertabi (LB) medium
Bacto-Tryptone 10g
Bacto-yeast extract 5g
NaCl 10g
ddH2O to 1l
Agar (for solid Medium) 20g
pH adjusted to 7.0 and autoclaved to sterilize
Appendix 1.7 YEB Medium
Beef extract 0.5 g
Yeast extract 0.1 g
Peptone 0.5 g
Sucrose 0.5 g
MgSO4.7H2O 30.0 mg
Distilled water 100.0 ml
Agar 2.0 g

APPENDICES
114
Appendix 1.8 AB Medium
K2HPO4 60g/l AB Buffer (20x)
pH adjusted to 7.0 with KOH and sterile filtered NaH2PO4 20g/l
NH4Cl 20g/l
MgSO4.7H2O 6g/l
CaCl2 0.2g/l
AB Salt (20X)
Sterilised through autoclaving
FeSO4.7H2O 0.05g/l
Glucose (100mM) - Sterile filtered Glucose 18.01g/l
AB Buffer (20X) 10ml
AB Salt (20X) 10ml
Glucose (100mM 100ml
AB Medium
H2O (dd sterile) 80ml
Appendix 1.9 GUS Staining Buffer and Histochemical staining
A. Preparation of GUS staining solution
(i) 80 mM sodium phosphate buffer [pH 7.0]
(ii) 0.4 mM potassium ferricyanide.
(iii) 0.4 mM potassium ferrocyanide
(iv) 8 mM EDTA
(v) 0.05% Triton X-100
(vi) 0.8 mg/mL 5-bromo-4-chloro-3-indolyl-β-D-glucuronide
(vii) Filter-sterilize using 0.2 micro filter.
(viiii) For 100 ml of GUS staining solution, add 25 ml MeOH (to give 20% MeOH concentration)
(ix) Before first use, add 60 ul of Triton-X for each 100 ml.
B. Histochemical assay
1 Dip the sample in GUS staining solution.
2 Incubate for one hour to overnight at 37C.
3 Remove GUS staining solution.
4 Add 70 – 100% ethanol.
5 Incubate at room temperature to remove chlorophyll.
6 Repeat steps 4 and 5 several times
Appendix 1.10 DNA Extraction Buffer
End Concentration Stock solution Quantity for 200ml
1% Lauryl Sarkosyl 30 6.6ml
100mM Tris-HCl 1M 20ml
100mM NaCl 1M 20ml
10mM EDTA 0.5M 4ml

APPENDICES
115
Appendix 1.11 peqGold Trifast RNA Isolation
1 Homogenisation 1.0 ml peqGOLD TriFast™ + 50-100 mg leaf sample
2 Phase separation Homogenate + 0.2 ml Chloroform
3 RNA-Precipitation Watery Phase + 0.5 ml Isopropanol
4 RNA washing 1 ml 75 % Ethanol
5 Dissolving RNA Formamide, 0.5 % SDS or Water
Appendix 1.12 1 st Strand cDNA Synthesis
1. In sterile tube: Total RNA - 0.1 – 5µg
Primer oligo(dT)18 - 1.0µl
H20, nuclease-free - 9.0µl
2. Incubate the mix at 70°C for 5min and chill on i ce.
3. Add in the order: 5X M-MuLV Buffer - 4µl
10mM 4dNTPs Mix - 2µl
Ribonuclease inhibitor - 0.5µl (20U)
DEPC-treated H20 - 12.5µl
4. Incubate at 37°C for 5min
5. Add 200U of RevertAid™ H Minus M-MuLV Reverse Transcriptase = 1µl
6. Incubate reaction mix at 42°C for 60min
7. Stop reaction by heating at 70°C for 10min
8. Chill on ice.
Appendix 1.13 PCR Reaction Mix
Reagent Final Concentration
Sterile deionized water to reaction volume
10X Taq buffer 1X
2mM dNTP mix 0.2mM of each
Primer I 0.1-1µM
Primer II 0.1-1µM
Taq DNA Polymerase 1.25U/50µl
25mM MgCl2 1-4mM
Template DNA 10pg-1µg
116
ACKNOWLEDGEMENTS
This work was undertaken at Hamburg University, Department of Applied Molecular Plant
Biology (AMPII). The work was made possible through a Deutscher Akademischer
Austausch Dienst (DAAD) scholarship and a study leave from my employer Kenya Industrial
Research and Development Institute (KIRDI).
I am grateful to Prof. Dr. Horst Lörz who gave me the opportunity to join his research group
and pursue my long held ambition to work in the field of biotechnology. This ambition was
realised under the patient tutelage of Dr. Maram Bader and Dr. Dirk Becker to whom I am
immensely grateful. Much thanks to Prof. Dr. Erhard Kranz for making sure that my work
was successfully finalised.
The good working relationship in the AMPII research group, especially the hospitality of Dr.
Stephan Scholten, Dr. Stephanie Meyer, Iqrar Ahmad Rana, Tobias Schenk, Marlis Nissen,
Margarete Hunt, Ursula Reinitz, Kirsten Kollek, Sabina Miaskowska, Julia Sandberg-
Meinhardt, Petra von Wiegen Bärbel Hagemann and Simone Amati made this travail much
easier than it could have been.
A word of gratitude to Louis Prom, PhD of USDA-ARS, College Station, TX, who provided
the Colletotrichum sublineolum strains used in this study. I would also like to thank Calleb
Olweny of Kenya Sugar Research Foundation (KESREF) at Kibos; Kenya; Evans Mutegi of
Kenya Agricultural Research Institute (KARI)-Genebank at Mugugaa, Kenya; P.K. Kamau,
Silas Nzioki and Rachel Maswili of KARI-Katumani who made sure that I got all the sorghum
seeds I needed and proffered background information on disease reaction of the lines used
in this study.
117
CURRICULUM VITAE
Name Linus Moses Kosambo Ayoo Place of Birth Kisumu, Kenya Contact KIRDI P.O. Box 30650-00100 Nairobi, Kenya
PhD Studies
2005-2008 PhD in Bioengineering – Genetic Transformation of Sorghum for Fungal Diseases Resistance. University of University, Department of Applied Molecular Biology (Biozentrum – Klein Flottbek).
Graduate Studies
1995 - 1998 MSc. Botany - Plant Biochemistry and Physiology. University of Nairobi
Undergraduate Studies
1990 - 1994 B.Sc. in Botany and Zoology. University of Nairobi, Kenya.
Employment 1999 – Present: Research Officer - Kenya Industrial Research and Development
Institute (KIRDI). Nairobi, Kenya. Other Training
2004 Evaluation of National Research and Development Projects
JICA – Mitsubishi Research Institute, Inc. (MRI) and Industrial Science and Technology Policy and Environment Bureau of the Japanese Ministry of Economy, Trade and Industry (METI). Tokyo, Japan.
2003 Management Functions, Principles and Practices - Kenya Institute of Administration (KIA), Kabete, Nairobi
2002 Hazard Analysis and Critical Control Point (HACCP) and Quality Systems Development.
World Association of Industrial and Technological Research Institute (WAITRO) sponsored training held in Impala Hotel, Arusha - Tanzania
Publication
L. M. K'osambo, E. E. Carey, A. K. Misra, J. Wilkes and V. Hagenimana. Influence of Age, Farming Site, and Boiling on Pro-Vitamin A Content in Sweet Potato (Ipomoea batatas(L.) Lam.) Storage Roots. Volume 11, Issue 4, December 1998, Pages 305-321.