Embed Size (px)
Citation preview

University Extension/Department of Economics
Biofuels
Farm Management In-ServiceAmes, Iowa
Oct. 12, 2010
Chad HartAssistant Professor/Grain Markets Specialist

University Extension/Department of Economics
Ethanol Production
0
3
6
9
12
15
Bill
ion g
allo
ns
Source: EIA2010 Projection by Hart

University Extension/Department of Economics
Biodiesel Production
0
100
200
300
400
500
600
700
1999 2000 2001 2002 2003 2004 2005 2006 2007 2008 2009 2010
Mil
lio
n g
all
on
s
Source: EIA2010 Projection by Hart
University Extension/Department of Economics
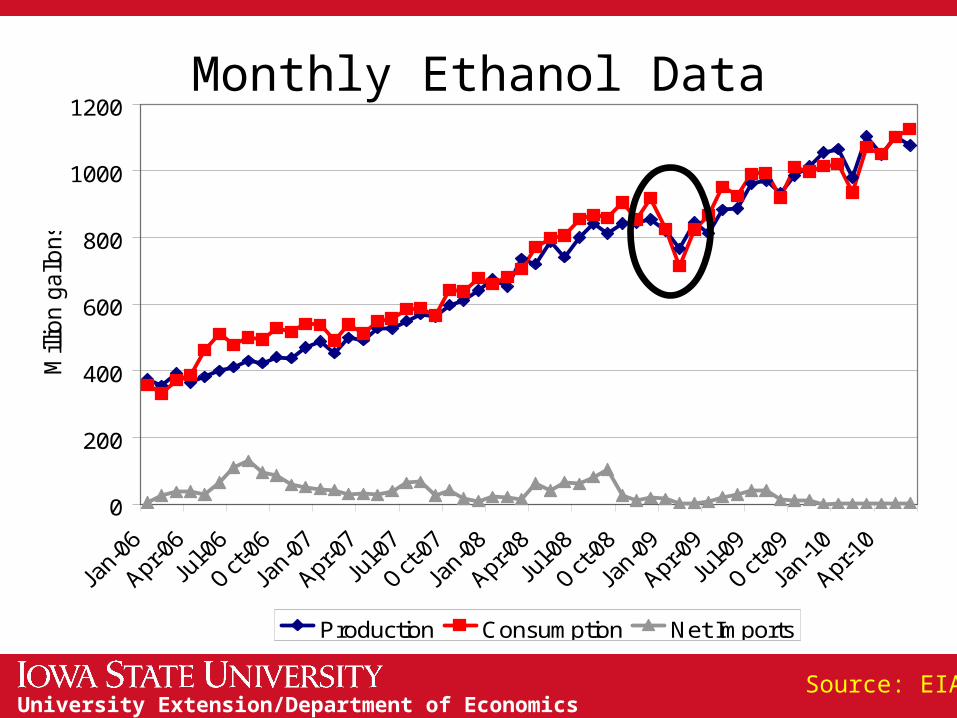
Monthly Ethanol Data
0
200
400
600
800
1000
1200
Mill
ion g
allo
ns
Production Consumption Net Imports
Source: EIA
University Extension/Department of Economics
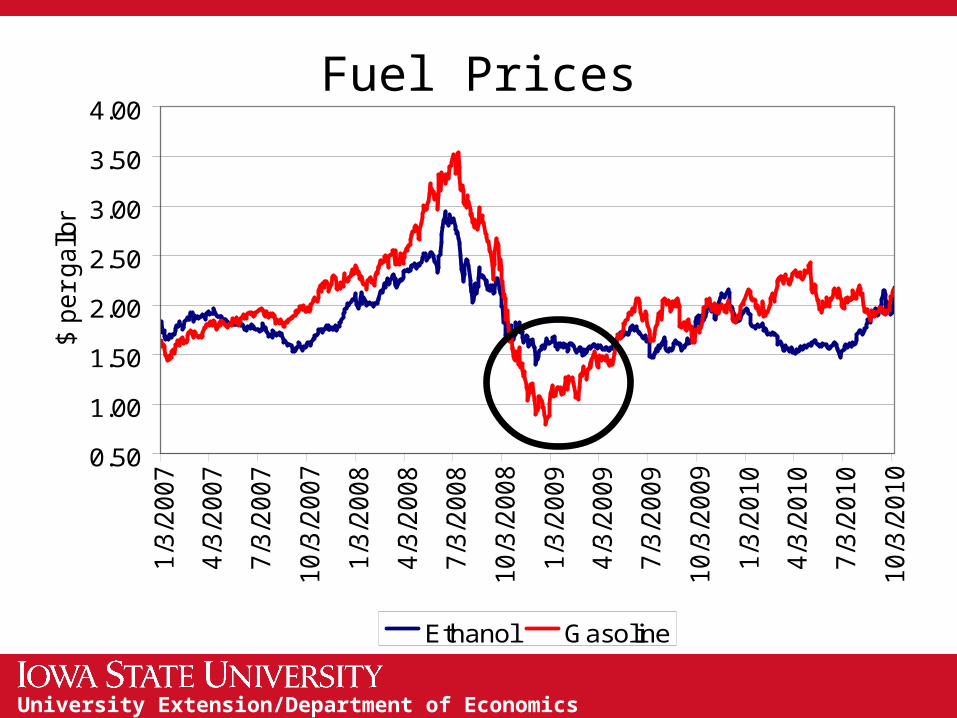
Fuel Prices
0.50
1.00
1.50
2.00
2.50
3.00
3.50
4.00
1/3
/20
07
4/3
/20
07
7/3
/20
07
10
/3/2
00
7
1/3
/20
08
4/3
/20
08
7/3
/20
08
10
/3/2
00
8
1/3
/20
09
4/3
/20
09
7/3
/20
09
10
/3/2
00
9
1/3
/20
10
4/3
/20
10
7/3
/20
10
10
/3/2
01
0
$ p
er
ga
llon
Ethanol Gasoline

University Extension/Department of Economics
Ethanol Penetration
20%
30%
40%
50%
60%
70%
80%
90%
100%5/7
/2004
9/7
/2004
1/7
/2005
5/7
/2005
9/7
/2005
1/7
/2006
5/7
/2006
9/7
/2006
1/7
/2007
5/7
/2007
9/7
/2007
1/7
/2008
5/7
/2008
9/7
/2008
1/7
/2009
5/7
/2009
9/7
/2009
1/7
/2010
5/7
/2010
9/7
/2010

University Extension/Department of Economics
Monthly Biodiesel Data
Source: EIA
0
10
20
30
40
50
60
70
80
Mill
ion
gallo
ns
Production Consumption Imports Exports
End of “Splash and Dash”
End of Tax Credit

University Extension/Department of Economics
Renewable Fuels Standard (RFS)
0
5
10
15
20
25
30
35
40
2009 2012 2015 2018 2021
Bill
ion g
allo
ns
Conventional Biofuels Cellulosic Biofuels
Biodiesel Additional Advanced Biofuels

University Extension/Department of Economics
Renewable Fuels Standard (RFS)
11.75
12
12.25
12.5
12.75
13
2010 2010 Adj.
Bill
ion g
allo
ns
Conventional Biofuels Cellulosic Biofuels
Biodiesel Additional Advanced Biofuels
University Extension/Department of Economics
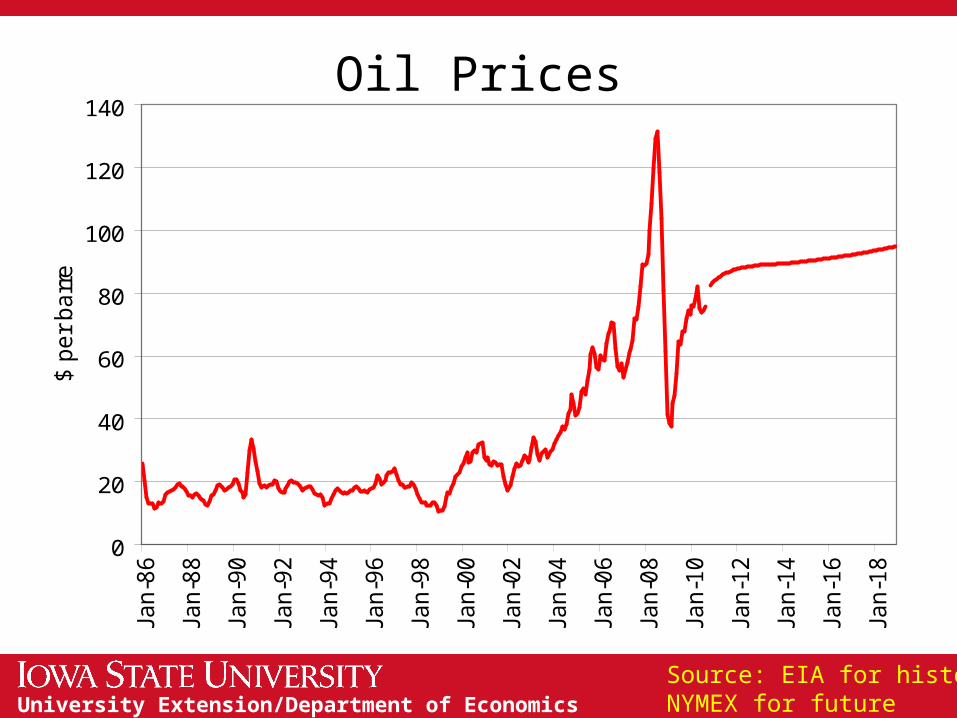
Oil Prices
Source: EIA for historyNYMEX for future
0
20
40
60
80
100
120
140
Jan-8
6
Jan-8
8
Jan-9
0
Jan-9
2
Jan-9
4
Jan-9
6
Jan-9
8
Jan-0
0
Jan-0
2
Jan-0
4
Jan-0
6
Jan-0
8
Jan-1
0
Jan-1
2
Jan-1
4
Jan-1
6
Jan-1
8
$ p
er
ba
rrel
University Extension/Department of Economics
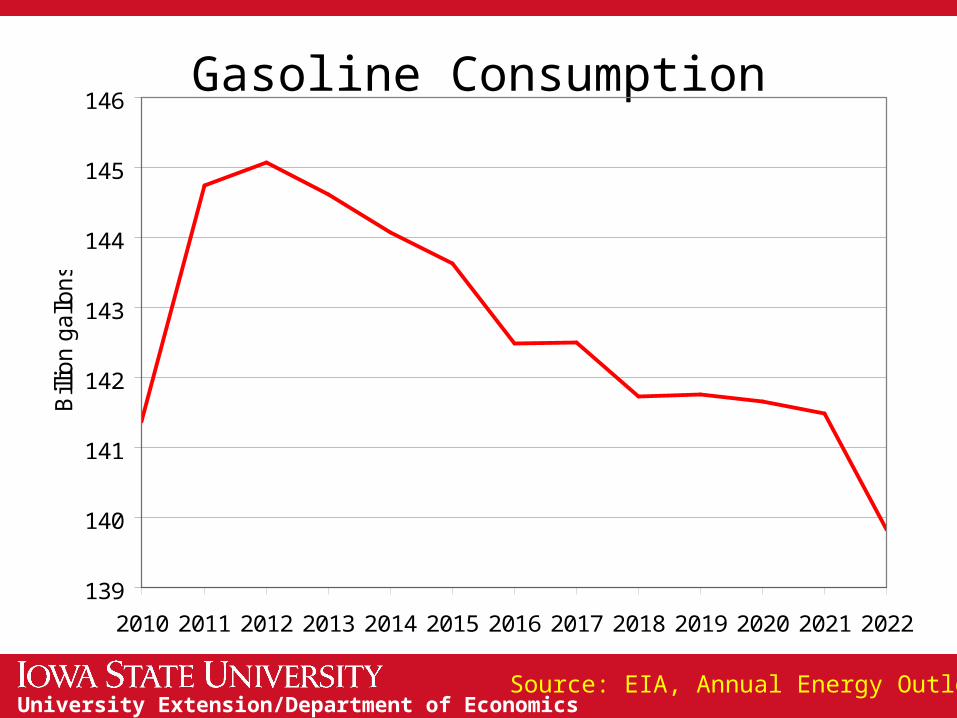
Gasoline Consumption
Source: EIA, Annual Energy Outlook
139
140
141
142
143
144
145
146
2010 2011 2012 2013 2014 2015 2016 2017 2018 2019 2020 2021 2022
Bill
ion g
allo
ns

University Extension/Department of Economics
Ethanol Blends
13
15
17
19
21
23
2010 2011 2012 2013 2014 2015 2016 2017 2018 2019 2020 2021 2022
Bill
ion g
allo
ns
@E10 @E12 @E15

University Extension/Department of Economics
RFS
0
5
10
15
20
25
30
35
40
2010 2013 2016 2019 2022
Bill
ion g
allo
ns
Conventional Biofuels Cellulosic Biofuels Biodiesel Additional Advanced Biofuels

University Extension/Department of Economics
0
5
10
15
20
25
30
35
40
2010 2013 2016 2019 2022
Bill
ion g
allo
ns
Conventional Biofuels Cellulosic BiofuelsBiodiesel Additional Advanced Biofuels@E10 @E12@E15
RFS Coverage

University Extension/Department of Economics
Ethanol Blending Advantage
-0.04
-0.02
0.00
0.02
0.04
0.06
0.08
0.10
0.12
0.14
0.16
1/3
/20
07
4/3
/20
07
7/3
/20
07
10/3
/20
07
1/3
/20
08
4/3
/20
08
7/3
/20
08
10/3
/20
08
1/3
/20
09
4/3
/20
09
7/3
/20
09
10/3
/20
09
1/3
/20
10
4/3
/20
10
7/3
/20
10
10/3
/20
10
$ p
er
gallo
n

University Extension/Department of Economics
Co-Product Pricing (Jan. 2010 = 1)
0.75
0.8
0.85
0.9
0.95
1
1.05
1.1
1.15
Ethanol Corn Oil DDGs

University Extension/Department of Economics
Corn Composition
Source: 2009 FEW Conference presentation by Reg Ankrom (CPT)
Looking for:Improved efficiencyReduced energy usageReduced water usageDiversified product stream
Why Fractionate?

University Extension/Department of Economics
Capital Costs Range from $10 million to $40 million for a 50 million
gallon ethanol plant The inclusion of corn oil extraction technologies moves
costs to the higher end of the spectrum Most vendors point to a payback period of under 3 years
Variable Costs Decreased energy needs per gallon for:
Liquidification and cookingDistillationDrying of distillers grains and solubles
Possible energy generation from bran Could reduce energy demand by nearly 50%

University Extension/Department of Economics
Product StreamsCorn costs: $4.98 per bushel, Illinois ethanol plant report
(USDA-AMS, as of Oct. 8, 2010)
Traditional ethanol plant:2.8 gallons of ethanol @ $2.01/gallon = $5.6317.75 lbs. of DDGS @ $144.50/ton = $1.28Revenues per bushel = $6.91
Ethanol plant w/ fractionation:2.72 gallons of ethanol @ $2.01/gallon = $5.4713.5 lbs. of high protein DG @ $154.50/ton = $1.045 lbs. of germ @ $158/ton = $0.403 lbs. of bran @ $75/ton = $0.11Revenues per bushel = $7.02

University Extension/Department of Economics
Tapping into Many MarketsBiorefinery
Process Corn DST™
ProcessBiofuels
Germ Bran Wet Cake
Syrup
Starch
Animal Feed
Animal Feed
Solvent ExtractSolvent Extract
Corn Oil
Corn Meal
Burn CHPBurn CHP
Animal Feed
Animal Feed
WCGFWCGF
Cellulose Ethanol
Cellulose Ethanol
Cellulose Ethanol
Cellulose Ethanol
A.D.A.D.
Combine all – DDGSCombine
all – DDGSProtein IsolatesProtein Isolates
Burn CHPBurn CHP
Animal Feed
Animal Feed
Zein Protein
Zein Protein
Other Fermentation
Other Fermentation
FoodFood
Source: 2009 FEW Conference presentation by Neal Jakel (Delta-T)

University Extension/Department of Economics
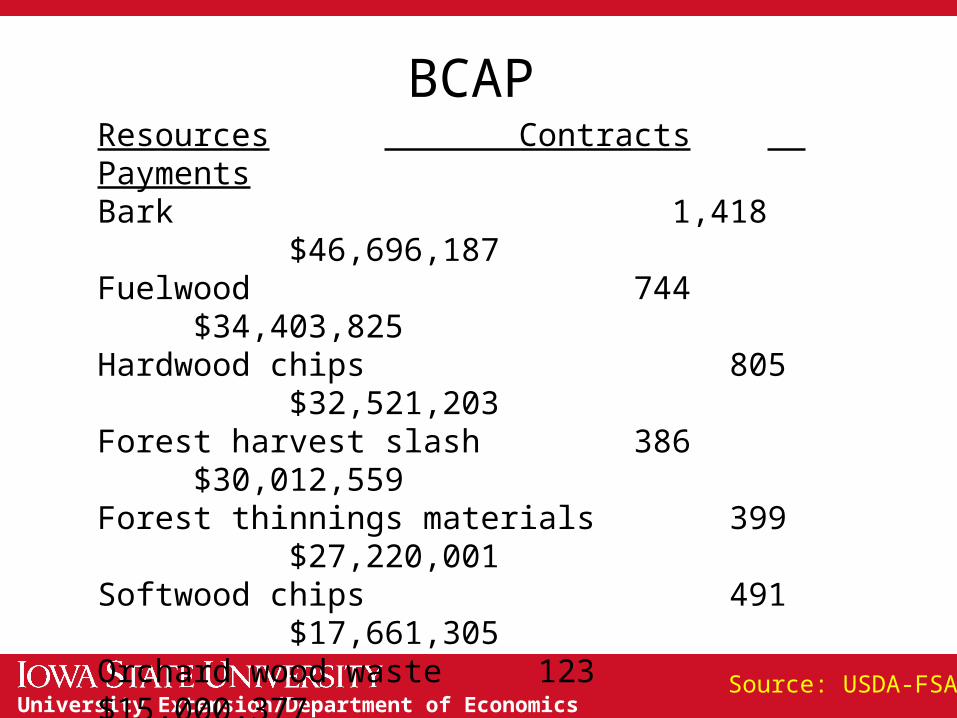
BCAP
Biomass Crop Assistance ProgramTo support production of crops for bioenergy and
assist with collection, harvest, storage, and transportation of biomass to conversion facilities
Matching payments$1 for each $1 per ton paid by conversion facility, up to $45
per ton, for 2 years

University Extension/Department of Economics
BCAP
Iowa has fewer than 4 contracts, so no payment figures are released.
State Contracts PaymentMaine 408 $34,842,076 California 291 $29,458,438 Alabama 586 $24,509,263 Georgia 354 $21,499,949 South Carolina 253 $14,638,308 Florida 134 $12,595,046 New Hampshire 130 $11,822,402 Michigan 247 $10,268,635 Texas 114 $ 8,468,858 New York 142 $ 7,703,127
Source: USDA-FSA
University Extension/Department of Economics
BCAPResources Contracts PaymentsBark 1,418 $46,696,187Fuelwood 744 $34,403,825Hardwood chips 805 $32,521,203Forest harvest slash 386 $30,012,559Forest thinnings materials 399 $27,220,001Softwood chips 491 $17,661,305Orchard wood waste 123 $15,000,377Sawdust 357 $12,400,919Pellets 70 $ 5,367,939Non-edible, non Title 1 56 $ 3,226,417plant processing waste and scraps Corn cobs 15 $ 61,612
Source: USDA-FSA

University Extension/Department of Economics
Thank you for your time!
Any questions?
My web site:http://www.econ.iastate.edu/~chart/
Iowa Farm Outlook:http://www.econ.iastate.edu/outreach/agriculture/periodicals/ifo/
Ag Decision Maker:http://www.extension.iastate.edu/agdm/