Embed Size (px)
Citation preview

OFFICE OF INSTITUTIONAL ASSESSMENT AND RESEARCH
University Fact Book 2014-2015
Transforming Education to Develop the Whole Student

ENTER TO LEARN. DEPART TO SERVE. This publication is provided as an official source of important facts and statistics about enrollment, retention and graduation at Winston-Salem State University. Data contained in this publication are derived from files and publications of The University of North Carolina General Administration. The version found on our website is the most current and should be referenced periodically for updates.
If the data in this Fact Book do not meet your needs, then please submit a request through WSSU’s RAMtech Support Portal at
https://ramtech.wssu.edu/scripts/texcel/servicewise/servicewise.dll.
Office of Institutional Assessment and Research Thompson Center
Winston-Salem State University Winston-Salem, NC 27110
(336) 750-8036http://www.wssu.edu/iar
Dr. Becky J. Mussat-Whitlow, Director of Institutional Assessment and Research Laura Crist, Assessment Coordinator
Virginia Moench, Research Associate I Kimberly Parks, Advanced Administrative Support Associate
Christine Whitaker, Business and Technology Applications Analyst Allyson Wood, Statistical Analyst

TABLE OF CONTENTS
Page
ADMISSIONS .....................................................................................................................1 Freshmen Applicant Profile .....................................................................................2
First-Time Freshmen Applicants, Acceptances, & Enrollees by Residency & Gender ........................................................................... 2
Average SAT Scores of First-Time Freshmen .............................................3 High School Class Rank, Average High School GPA,
& Average ACT Scores of First-Time Freshmen .....................................4 Transfer Applicant Profile ........................................................................................5
Transfer Applicants, Acceptances, & Enrollees by Residency & Gender....5 Transfer Institutions of Origin ......................................................................6
Graduate Applicant Profile ......................................................................................7 Graduate Applicants, Acceptances, & Enrollees
by Residency & Gender ...........................................................................7 ENROLLMENT ...................................................................................................................9
Total Headcount & FTE Enrollment ......................................................................10 Undergraduate Enrollment .....................................................................................11
Undergraduate Headcount & FTE Enrollment ...........................................11 Undergraduate Enrollment by Degree Program .........................................12 Undergraduate Enrollment by Race, Load & Gender ................................14
Graduate Enrollment ..............................................................................................15 Graduate Headcount & FTE Enrollment ....................................................15 Graduate Enrollment by Degree Program ..................................................16 Graduate Enrollment by Race, Load & Gender .........................................17
Enrollment Breakdown by Load, Race, Degree Intent, & Class Level ..................18 DEGREES CONFERRED .................................................................................................19
Undergraduate Degrees Conferred by Major & Academic Year ...........................20 Undergraduate Programs with the Highest Number of Graduates .........................22 Graduate Degrees Conferred by Major & Academic Year ....................................23
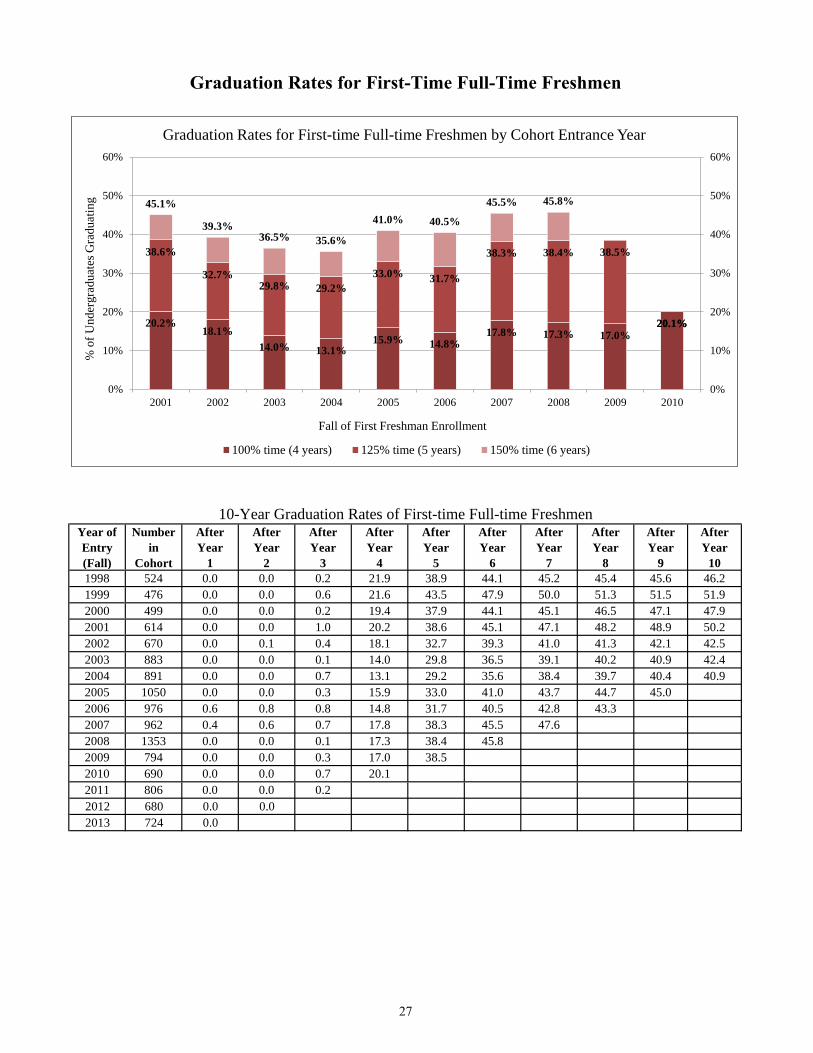
RETENTION & GRADUATION RATES ........................................................................25 Retention Rates for First-Time Full-Time Freshmen .............................................26 Graduation Rates for First-Time Full-Time Freshmen ...........................................27
FACULTY & STAFF ........................................................................................................29 All Employees by Race & Gender .........................................................................30 All Faculty by Race & Gender...............................................................................31 Faculty by Race, Gender, Academic Rank, & Tenure Status ................................32
GLOSSARY.......................................................................................................................35


ADMISSIONS
Imagine possibilities. Realize success.

In-StateOut-of-State Total In-State
Out-of-State Total In-State
Out-of-State Total
Applied 4173 991 5164 3416 778 4194 3911 522 4433Male 1314 317 1631 1022 268 1290 1177 140 1317
Female 2859 674 3533 2394 510 2904 2734 382 3116Accepted 2335 539 2874 2198 458 2656 2394 273 2667
Male 682 158 840 618 159 777 658 75 733Female 1653 381 2034 1580 299 1879 1736 198 1934
Enrolled 618 67 685 654 74 728 778 72 850Male 174 14 188 196 23 219 216 26 242
Female 444 53 497 458 51 509 562 46 608
Fall 2012 Fall 2013 Fall 2014First-Time Freshmen by Residency & Gender
2005 2006 2007 2008 2009 2010 2011 2012 2013 2014Applied 2889 3332 3345 4067 3490 3483 3893 5164 4194 4433Accepted 2286 2165 2270 2192 1979 2161 2198 2874 2656 2667Enrolled 1083 992 969 1355 795 691 807 685 728 850
0
1000
2000
3000
4000
5000
6000
First-Time Freshmen Applicants, Acceptances & EnrolleesFall 2005 - Fall 2014
2

2005 2006 2007 2008 2009 2010 2011 2012 2013 2014Critical Reading 445 441 436 435 444 447 443 445 443 431Math 455 450 451 442 449 457 457 462 452 437Writing 418 424 426 424 425 420 411Traditional Total 900 891 892 876 893 904 900 907 895 868
0
100
200
300
400
500
600
700
800
900
1000
Average SAT ScoresFirst-Time Freshmen
Fall 2005-2014
3

2010 2011 2012 2013 2014
Average High School GPA 3.00 3.10 3.15 3.15 3.11*Based on the number of first-time freshmen who reported high school GPA
2010 2011 2012 2013 2014Average
ACT Score 17 18 18 18 17
Average Composite ACT Scores of First-Time Freshmen*Fall 2010-2014
High School Class Rank, Average High School GPA, and Average ACT ScoresFirst-Time Freshmen
Average High School GPA of First-Time Freshmen*Fall 2010-2014
Top Fifth Second Fifth Third Fifth Fourth Fifth Bottom Fifth Did Not Report2012 25.5% 31.8% 26.3% 9.3% 1.9% 5.1%2013 22.7% 30.5% 25.1% 13.6% 1.9% 6.2%2014 16.8% 27.3% 27.1% 17.8% 3.1% 8.0%
0.0%
5.0%
10.0%
15.0%
20.0%
25.0%
30.0%
35.0%
High School Class Rank of First-Time FreshmenFall 2012-2014
4

In-StateOut-of-State Total In-State
Out-of-State Total In-State
Out-of-State Total
Applied 863 101 964 912 91 1003 762 87 849Male 237 38 275 236 35 271 191 39 230
Female 626 63 689 676 56 732 571 48 619Accepted 749 79 828 799 70 869 690 76 766
Male 182 28 210 184 29 213 164 34 198Female 567 51 618 615 41 656 526 42 568
Enrolled 565 41 606 578 42 620 482 44 526Male 139 16 155 135 18 153 122 24 146
Female 426 25 451 443 24 467 360 20 380
New Undergraduate Transfers
Fall 2012 Fall 2013 Fall 2014by Residency & Gender
2005 2006 2007 2008 2009 2010 2011 2012 2013 2014Applied 708 788 976 888 1007 1092 1055 964 1003 849Accepted 708 664 870 663 801 990 746 828 869 766Enrolled 452 376 607 557 669 769 661 606 620 526
0
200
400
600
800
1000
1200
New Undergraduate TransferApplicants, Acceptances, & Enrollees
Fall 2005 - Fall 2014
Transfer Applicant Profile
5

2010 2011 2012 2013 2014NC Public Senior Universities 132 139 129 140 105NC Community and Technical Colleges 371 262 272 271 200NC Private Senior Universities 74 77 49 49 60NC Private Junior Colleges 5 7 5 4 6Other NC Institutions 17 10 3 34 20Out-of-State Institutions 166 159 140 118 135Foreign Institutions 4 7 8 4 8Total 769 661 606 620 534
NC Public Senior Institutions 2010 2011 2012 2013 2014Appalachian State University 14 10 15 12 8East Carolina University 18 17 18 16 10Elizabeth City State University 3 3 3 9 3Fayetteville State University 4 14 5 8 6NC A&T State University 28 32 17 31 25North Carolina Central University 18 14 16 18 12North Carolina School of the Arts 0 0 0 0 1North Carolina State University 14 6 2 8 3UNC-Asheville 0 3 1 1 1UNC-Chapel Hill 3 3 8 4 6UNC-Charlotte 11 8 10 8 6UNC-Greensboro 10 21 20 18 17UNC-Pembroke 5 1 10 2 5UNC-Wilmington 0 2 0 2 1Western Carolina University 4 5 4 3 1Total 132 139 129 140 105
Transfer Institutions of OriginNew Undergraduate Transfers
Fall
Fall
6

In-StateOut-of-State Total In-State
Out-of-State Total In-State
Out-of-State Total
Applied 285 194 479 266 68 334 290 303 593Male 50 40 90 52 16 68 36 45 81
Female 235 154 389 214 52 266 254 258 512Accepted 141 56 197 165 37 202 135 57 192
Male 31 13 44 38 9 47 21 10 31Female 110 43 153 127 28 155 114 47 161
Enrolled 115 20 135 125 16 141 101 13 114Male 24 5 29 27 5 32 14 3 17
Female 91 15 106 98 11 109 87 10 97
Graduate Student Applicants, Acceptances, & Enrollees
Fall 2012 Fall 2013 Fall 2014by Residency & Gender
2005 2006 2007 2008 2009 2010 2011 2012 2013 2014Applied 135 181 240 285 269 285 343 479 334 593Accepted 118 147 206 209 175 193 164 197 202 192Enrolled 109 119 168 174 144 153 143 135 141 114
0100200300400500600700
New Graduate StudentsApplicants, Acceptances, & Enrollees
Fall 2005 - Fall 2014
Graduate Applicant Profile
7

8

ENROLLMENT
Imagine possibilities. Realize success.
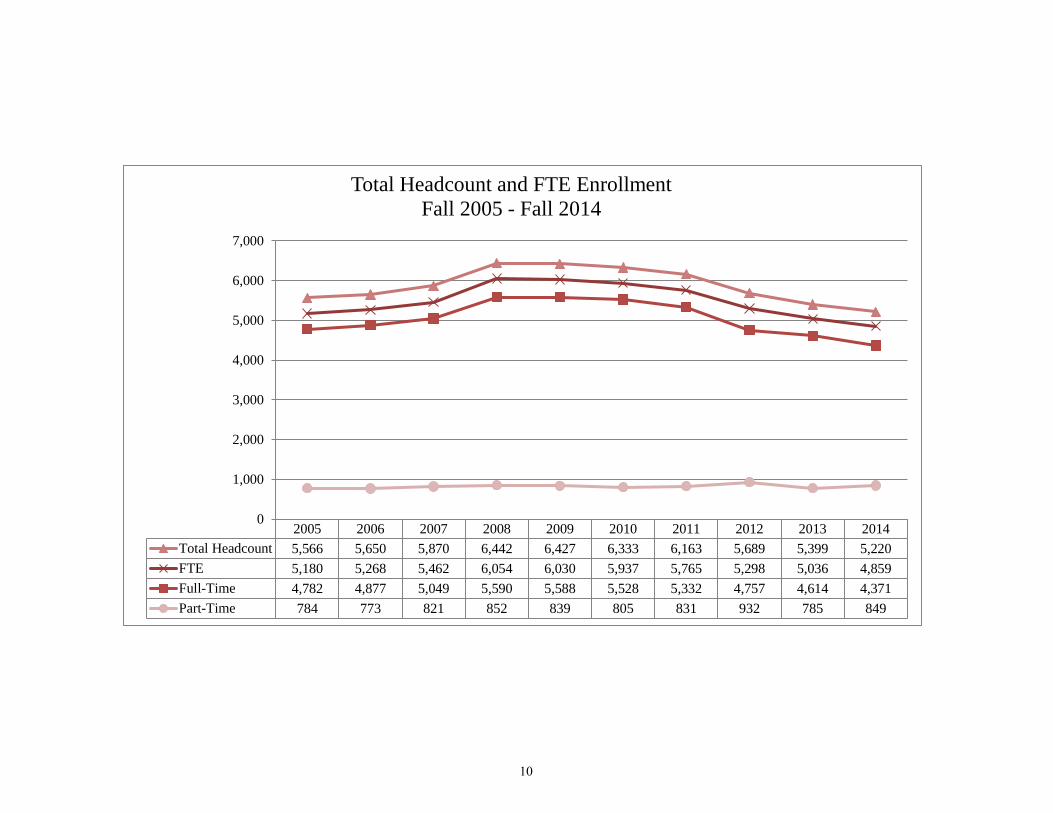
2005 2006 2007 2008 2009 2010 2011 2012 2013 2014Total Headcount 5,566 5,650 5,870 6,442 6,427 6,333 6,163 5,689 5,399 5,220FTE 5,180 5,268 5,462 6,054 6,030 5,937 5,765 5,298 5,036 4,859Full-Time 4,782 4,877 5,049 5,590 5,588 5,528 5,332 4,757 4,614 4,371Part-Time 784 773 821 852 839 805 831 932 785 849
0
1,000
2,000
3,000
4,000
5,000
6,000
7,000
Total Headcount and FTE EnrollmentFall 2005 - Fall 2014
10
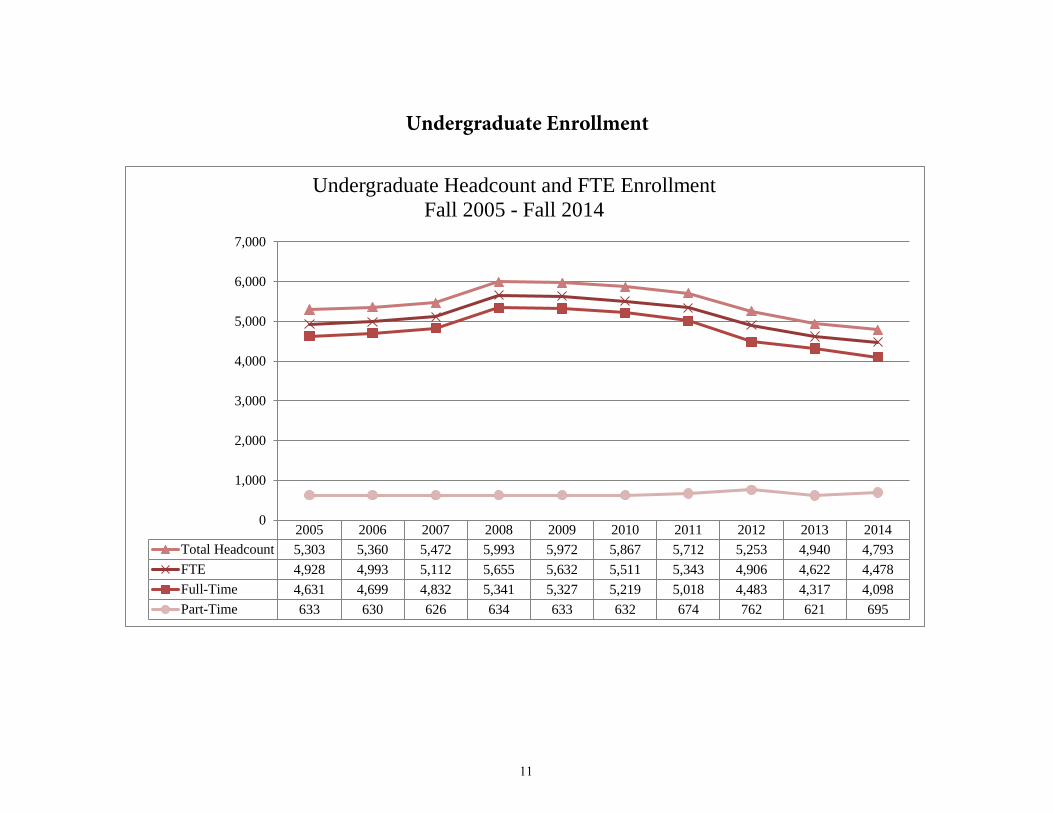
2005 2006 2007 2008 2009 2010 2011 2012 2013 2014Total Headcount 5,303 5,360 5,472 5,993 5,972 5,867 5,712 5,253 4,940 4,793FTE 4,928 4,993 5,112 5,655 5,632 5,511 5,343 4,906 4,622 4,478Full-Time 4,631 4,699 4,832 5,341 5,327 5,219 5,018 4,483 4,317 4,098Part-Time 633 630 626 634 633 632 674 762 621 695
0
1,000
2,000
3,000
4,000
5,000
6,000
7,000
Undergraduate Headcount and FTE EnrollmentFall 2005 - Fall 2014
Undergraduate Enrollment
11

College/School 2010 2011 2012 2013 2014
The College - Arts, Sciences, Business & Education 3477 3424 2768 2384 2048
School of Health Sciences 1806 1740 1720 1761 1710
Undeclared 584 528 757 793 1035
Undergraduate Total 5867 5692 5245 4938 4793
The College - Arts, Sciences, Business & Education 2010 2011 2012 2013 2014
Accounting & Management Information Systems 181 154 114 96 91
Accounting 126 115 85 72 69
Management Information Systems 55 39 29 24 22
Art & Visual Studies 78 81 69 51 39
Art 78 81 69 51 39
Behavioral Sciences 282 312 232 162 120
Gerontology 21 46 53 31 22
Social Work 114 141 98 79 60
Sociology 147 125 81 52 38
Biological Sciences 200 205 195 176 186
Biology 185 182 166 154 171
Biotechnology 9 11 20 18 14
Molecular Biology 6 12 9 4 1
Chemistry 69 52 48 54 41
Chemistry 69 52 48 54 41
Communication & Media Studies 169 187 141 122 90
Mass Communications 169 187 141 122 90
Computer Science 140 144 96 105 105
Computer Science 110 104 66 83 74
Information Technology 30 40 30 22 31
Economics & Finance 282 249 208 193 185
Business Administration 229 196 160 153 153
Economics 15 20 16 20 15
Finance 38 33 32 20 17
Education 449 402 313 270 249
Art Education 3 2 0 0 0
Birth to Kindergarten Education 135 125 108 84 82
Elementary Education 199 157 109 100 100
English Education 0 5 16 11 7
Mathematics Education 1 6 6 10 10
Middle Grades Education 29 28 23 20 18
Music Education 44 48 33 30 20
Special Education 38 31 18 15 12
English 57 61 44 31 26
English 57 61 44 31 26
Health, Physical Education & Sport Studies 221 241 177 160 149
Motorsports Management 27 29 20 17 11
Physical Education 79 92 60 51 48
Sport Management 115 120 97 92 90
History, Politics & Social Justice 329 333 265 219 142
History 37 32 36 30 19
Justice Studies 175 183 140 119 77
Political Science 117 118 89 70 46
Human Service Studies 217 206 185 200 174
Rehabilitation Studies 153 132 107 106 83
Therapeutic Recreation 64 74 78 94 91
Undergraduate Enrollment by Major, Department, & School/CollegeFall
12

The College - Arts, Sciences, Business & Education (cont.)
Liberal Studies 163 189 199 151 96
African-American Studies 0 0 0 0 0
Interdisciplinary Studies 163 189 199 151 96
Management & Marketing 208 202 145 87 80
Management 113 114 91 56 43
Marketing 95 88 54 31 37
Mathematics 25 21 15 18 17
Mathematics 25 21 15 18 17
Music 43 47 30 25 13
Music 0 0 0 0 0
Music Business 43 47 30 25 13
Psychological Sciences 360 331 285 257 238
Psychology 360 331 285 257 238
World Languages & Culture 4 7 7 7 7
Spanish 4 7 7 7 7
Total 3477 3424 2768 2384 2048
Health Sciences 2010 2011 2012 2013 2014
Clinical Laboratory Science 175 214 184 161 153
Exercise Physiology 272 252 203 199 157
Health Care Management 170 156 151 153 128
Nursing 1188 1117 1182 1248 1272
Occupational Therapy 1 1 0 0 0
Total 1806 1740 1720 1761 1710
2010 2011 2012 2013 2014
Undeclared 584 528 757 793 1035
Undegraduate Enrollment by Degree Program (cont.)
Fall
13

Undergraduate Enrollmentby Race, Load, & Gender
Fall 2014
ASIA
N
BLAC
K
HISP
ANIC
/LAT
INO
AMER
ICAN
INDI
AN/
ALAS
KA N
ATIV
ENA
TIVE
HAW
AIIA
N/
OTHE
R PA
CIFI
C IS
LAND
ERNO
N-RE
SIDE
NT A
LIEN
WHI
TE
TWO
OR M
ORE
RACE
SUN
KNOW
N
TOT
AL
9 1029 27 4 1 30 171 31 38 13400.2 % 21.5 % 0.6 % 0.1 % 0.0 % 0.6 % 3.6 % 0.6 % 0.8 % 28.0 %
6 956 23 4 1 22 132 29 28 12010.1 % 19.9 % 0.5 % 0.1 % 0.0 % 0.5 % 2.8 % 0.6 % 0.6 % 25.1 %
3 73 4 0 0 8 39 2 10 1390.1 % 1.5 % 0.1 % 0.0 % 0.0 % 0.2 % 0.8 % 0.0 % 0.2 % 2.9 %
19 2418 82 17 1 49 670 107 90 34530.4 % 50.4 % 1.7 % 0.4 % 0.0 % 1.0 % 14.0 % 2.2 % 1.9 % 72.0 %11 2177 63 14 1 37 428 97 69 2897
0.2 % 45.4 % 1.3 % 0.3 % 0.0 % 0.8 % 8.9 % 2.0 % 1.4 % 60.4 %8 241 19 3 0 12 242 10 21 556
0.2 % 5.0 % 0.4 % 0.1 % 0.0 % 0.3 % 5.0 % 0.2 % 0.4 % 11.6 %
28 3447 109 21 2 79 841 138 128 47930.6 % 71.9 % 2.3 % 0.4 % 0.0 % 1.6 % 17.5 % 2.9 % 2.7 % 100.0 %17 3133 86 18 2 59 560 126 97 4098
0.4 % 65.4 % 1.8 % 0.4 % 0.0 % 1.2 % 11.7 % 2.6 % 2.0 % 85.5 %11 314 23 3 0 20 281 12 31 695
0.2 % 6.6 % 0.5 % 0.1 % 0.0 % 0.4 % 5.9 % 0.3 % 0.6 % 14.5 %Part-Time
Male
Full-Time
Part-Time
Female
Full-Time
Part-Time
Grand Total
Full-Time
14

2005 2006 2007 2008 2009 2010 2011 2012 2013 2014Total Headcount 302 321 412 467 467 482 471 444 461 427FTE 252 276 350 399 399 426 422 393 414 380Full-Time 151 178 217 249 261 309 314 274 297 273Part-Time 151 143 195 218 206 173 157 170 164 154
0
100
200
300
400
500
600
Graduate Headcount and FTE EnrollmentFall 2005 - Fall 2014
Graduate Enrollment
15

CIP Code Graduate Degree Program 2010 2011 2012 2013 201411.0101 Computer Science & Information Technology (CST) 18 19 17 12 1013.1202 Elementary Education (MEd) 27 8 11 5 113.1299 Master of Arts in Teaching (MAT) 32 35 20 20 1113.1401 Teaching ESL & Linguistics (ESL) 10 2 11 19 2051.0701 Health Care Administration (MHA) 30 28 27 23 1751.2306 Occupational Therapy (OCC) 84 89 86 81 82
Physical Therapy (DPT) 0 0 53 79 79Physical Therapy (MPT) 59 58 2 0 0
51.2310 Rehabilitation Counseling (RCP) 64 59 53 43 4551.3805 Nursing (MSN) 96 111 105 115 11551.3818 Doctor of Nursing Practice (DNP) 0 0 0 7 552.0201 Business Administration (MBA) 46 42 51 55 36
Special (Non-degree seeking) 16 20 8 2 6Total 482 471 444 461 427
Graduate Enrollment by Degree Program
Fall
51.2308
Special1.4%
MEd 0.2%
DNP1.2%CST
2.3%
ESL4.7%
MAT2.6% MHA
4.0%
RCP10.5%
MBA8.4%
DPT18.5%
OCC19.2%
MSN26.9%
Fall 2014 Graduate Enrollment by Degree Program
16

Graduate Enrollment by Race, Load, & GenderFall 2014
ASI
AN
BLA
CK
HIS
PAN
IC/L
ATI
NO
AM
ERIC
AN
IND
IAN
/
ALA
SKA
NA
TIV
EN
ATI
VE
HAW
AIIA
N/
OTH
ER P
ACI
FIC
ISLA
NDE
RN
ON-
RESI
DEN
T AL
IEN
WHI
TE
TWO
OR
MO
RE R
ACE
SU
NKN
OW
N
TO
TAL
2 41 4 0 0 7 50 0 9 1130.5 % 9.6 % 0.9 % 0.0 % 0.0 % 1.6 % 11.7 % 0.0 % 2.1 % 26.5 %
1 22 1 0 0 3 41 0 6 740.2 % 5.2 % 0.2 % 0.0 % 0.0 % 0.7 % 9.6 % 0.0 % 1.4 % 17.3 %
1 19 3 0 0 4 9 0 3 390.2 % 4.4 % 0.7 % 0.0 % 0.0 % 0.9 % 2.1 % 0.0 % 0.7 % 9.1 %
5 130 5 2 0 21 110 2 39 3141.2 % 30.4 % 1.2 % 0.5 % 0.0 % 4.9 % 25.8 % 0.5 % 9.1 % 73.5 %
3 67 5 1 0 11 87 2 23 1990.7 % 15.7 % 1.2 % 0.2 % 0.0 % 2.6 % 20.4 % 0.5 % 5.4 % 46.6 %
2 63 0 1 0 10 23 0 16 1150.5 % 14.8 % 0.0 % 0.2 % 0.0 % 2.3 % 5.4 % 0.0 % 3.7 % 26.9 %
7 171 9 2 0 28 160 2 48 4271.6 % 40.0 % 2.1 % 0.5 % 0.0 % 6.6 % 37.5 % 0.5 % 11.2 % 100.0 %
4 89 6 1 0 14 128 2 29 2730.9 % 20.8 % 1.4 % 0.2 % 0.0 % 3.3 % 30.0 % 0.5 % 6.8 % 63.9 %
3 82 3 1 0 14 32 0 19 1540.7 % 19.2 % 0.7 % 0.2 % 0.0 % 3.3 % 7.5 % 0.0 % 4.4 % 36.1 %
Male
Full-Time
Part-Time
Full-Time
Part-Time
Female
Full-Time
Part-Time
Grand Total
17

Men Women Men Women
Degree-seeking, first time freshmen 239 605 3 3
Other first-year, degree seeking 154 257 10 21
All other degree-seeking 807 2,032 112 500
Total degree seeking 1,200 2,894 125 524
All other undergraduates enrolled in credit courses 1 3 14 32
Total undergraduates 1,201 2,897 139 556
Degree-seeking, first time 12 78 5 19
All other degree-seeking 62 121 33 91
All other graduates enrolled in credit courses 0 0 1 5
Total graduates 74 199 39 115
Total Fall 2014 enrollment, all undergraduates 4793
Total Fall 2014 enrollment, all graduates 427
GRAND TOTAL FALL 2014 ENROLLMENT 5220
Men Women Men Women
Degree-seeking, first time freshmen 218 506 1 3
Other first-year, degree seeking 113 256 12 18
All other degree-seeking 928 2,295 133 394
Total degree seeking 1,259 3,057 146 415
All other undergraduates enrolled in credit courses 1 0 26 34
Total undergraduates 1,260 3,057 172 449
Degree-seeking, first time 16 74 16 35
All other degree-seeking 62 144 28 84
All other graduates enrolled in credit courses 0 1 1 0
Total graduates 78 219 45 119
Total Fall 2013 enrollment, all undergraduates 4938
Total Fall 2013 enrollment, all graduates 461
GRAND TOTAL FALL 2013 ENROLLMENT 5399
Enrollment Breakdown by Load, Race, Degree Intent & Class Level
Fall 2014
Full-Time Part-Time
Undergraduate
Graduate
Fall 2013
Full Time Enrollment Part Time Enrollment
Undergraduate
Graduate
18

DEGREES CONFERRED
Imagine possibilities. Realize success.

College/School 2009-10 2010-11 2011-12 2012-13 2013-14Arts & Sciences 362 365 452 465 404Business & Economics 137 119 117 141 85Education & Human Performance 150 181 189 188 177Health Sciences 495 581 537 604 705
Undergraduate Total 1144 1246 1295 1398 1371
COLLEGE OF ARTS & SCIENCES 2009-10 2010-11 2011-12 2012-13 2013-14Art & Visual Studies Department 5 21 14 24 15
Art (50.0701) 5 21 14 24 15Behavioral Sciences & Social Work Department 54 62 64 65 47
Gerontology (30.1101) 9 6 7 26 8Social Work (44.0701) 5 18 26 14 22Sociology (45.1101) 40 38 31 25 17
Chemistry Department 11 14 8 5 10Chemistry (40.0501) 11 14 8 5 10
Computer Science Department 20 10 30 21 20Computer Science (11.0701) 11 6 19 11 16Information Technology (11.0103) 9 4 11 10 4
English Department 8 6 8 10 9English (23.0101) 8 6 8 10 9
Music Department 8 3 9 7 8Music (50.0901) 8 0 4 0 0Music Business (50.1003) 0 3 5 7 8
Interdisciplinary Studies Department 82 62 92 112 100Interdisciplinary Studies (24.0102) 82 62 92 112 100
Life Sciences Department 22 25 24 21 25Biology (26.0101) 20 25 21 17 23Biotechnology (26.1201)* 0 0 2 2 2Molecular Biology (26.0204)* 2 0 1 2 0
Mathematics Department 7 4 6 3 1Mathetmatics (27.0101) 7 4 6 3 1
Mass Communications Department 28 27 32 34 38Mass Communications (09.0102) 28 27 32 34 38
Psychological Sciences Department 58 63 84 87 75Psychology (42.0101) 58 63 84 87 75
Social Sciences Department 59 68 78 75 56African-American Studies (05.0201) 0 0 0 0 0History (54.0101) 13 16 5 11 4Justice Studies (43.0104) 18 24 44 35 34Political Science (45.1001) 28 28 29 29 18
World Languages & Cultures Department 0 0 3 1 0Spanish (16.0905) 0 0 3 1 0
TOTAL 362 365 452 465 404
Undergraduate Degrees Conferred by Major & Academic YearJuly 1, 2013 - June 30, 2014
20

SCHOOL OF BUSINESS & ECONOMICS 2009-10 2010-11 2011-12 2012-13 2013-14Accounting & Management Information Systems Department 25 28 30 26 20
Accounting (52.0301) 19 14 14 11 15Management Information Systems (11.0401) 6 14 16 15 5
Economics & Finance Department 81 45 32 51 31Business Administration (52.0201) 61 33 19 24 19Economics (45.0601) 6 2 4 5 8Finance (52.0801) 14 10 9 22 4
Management & Marketing Department 31 46 55 64 34Management (52.0201) 15 16 26 38 21Marketing (52.1401) 16 30 29 26 13
TOTAL 137 119 117 141 85
SCHOOL OF EDUCATION & HUMAN PERFORMANCE 2009-10 2010-11 2011-12 2012-13 2013-14Education Department 38 65 59 60 42
Art Education (13.1302) 2 0 0 0 0Birth to Kindergarten Education (13.1209) 12 23 27 17 13Elementary Education (13.1202) 17 32 18 21 14English Teacher Education (13.1305) 0 1 2 4 2Mathematics Teacher Education (13.1311) 0 0 0 1 2Middle Grades Education (13.1203) 3 5 4 2 2Music Teacher Education (13.1312) 3 2 5 12 5Special Education (13.1011) 1 2 3 3 4
Human Performance & Sports Sciences Department 112 116 130 128 135Exercise Science (31.0505) 35 41 40 36 45Motorsport Management (31.0301) 1 1 5 6 6Physical Education (13.1314) 10 8 11 8 10Rehabilitation Studies (51.2310) 40 44 47 34 30Sport Management (31.0504) 18 16 18 31 17Therapeutic Recreation (51.2309) 8 6 9 13 27
TOTAL 150 181 189 188 177
SCHOOL OF HEALTH SCIENCES 2009-10 2010-11 2011-12 2012-13 2013-14Clinical Laboratory Science (51.1005) 18 21 31 42 38Health Care Management (51.0701) 0 8 37 36 55Nursing (51.3801) 477 552 469 526 612
TOTAL 495 581 537 604 705
*The Biotechnology program merged with the Molecular Biology program in fall of 2010.
Undergraduate Degrees Conferred by Major & Academic Year (cont.)July 1, 2013 - June 30, 2014
21

612
10075
55 45 38 38 34 30 27
0
100
200
300
400
500
600
700
Num
ber o
f Gra
duat
es
Undergraduate Degree Program
Undergraduate Programs with the Highest Number of Graduates
2013-14
22

Degrees 2009-10 2010-11 2011-12 2012-13 2013-14Business Administration (MBA) 19 24 16 11 18Computer Science & Information Technology (MS) 6 7 11 5 9Elementary Education (MEd) 28 23 3 2 2Teaching ESL & Linguistics (MA) 0 4 1 5 1Health Care Administration (MHA) 0 9 8 7 9Master of Arts in Teaching (MAT) 3 3 16 9 5Nursing (MSN) 60 32 43 39 49Occupational Therapy (MS) 15 25 28 29 28Physical Therapy (MPT) 24 0 30 28 0Physical Therapy (DPT) 0 0 0 0 25Rehabilitation Counseling (MS) 26 19 21 22 13
CertificatesFamily Nursing Practitioner (Post-Masters Certificate) 0 0 0 1 0Total 181 146 177 158 159
Graduate Degrees & Certificates by Major & Academic Year
MBA, 11.3%
Computer Science & Info Tech, 5.7%
MEd , 1.3%Teaching ESL & Linguistics,
0.6%
MHA, 5.7%
MAT, 3.1%
MSN, 30.8%
Occupational Therapy, 17.6%
Physical Therapy, 15.7%
Rehabilitation Counseling, 8.2%
Family Nurse Practitioner
Certificate, 0.0%
Graduate Degrees & Certificate by MajorJuly 1, 2013 - June 30, 2014
23

24

RETENTION AND GRADUATION RATES
Imagine possibilities. Realize success.

Year ofEntry(Fall)
Numberin
Cohort
After Year
1
After Year
2
After Year
3
After Year
4
After Year
5
After Year
6
After Year
7
After Year
8
After Year
9
After Year
101998 524 73.1 63.2 57.6 31.3 10.9 4.0 1.7 1.5 1.3 0.81999 476 72.1 65.3 62.6 36.3 12.2 6.7 4.0 2.1 1.9 1.12000 499 73.1 63.1 59.5 34.3 11.4 4.8 3.4 1.8 1.2 0.62001 614 78.3 68.4 63.4 37.5 14.0 6.0 3.1 2.3 1.6 0.52002 670 76.7 65.5 61.8 35.2 13.0 4.3 2.2 1.5 1.3 1.32003 883 77.7 65.6 58.2 36.7 15.2 6.5 2.8 2.4 1.9 1.12004 891 75.3 61.8 54.7 33.0 13.0 5.9 2.5 1.0 0.8 0.72005 1050 73.0 59.3 55.2 33.4 14.4 4.8 1.4 0.4 0.62006 976 68.0 58.1 52.4 35.1 13.8 3.7 1.4 1.82007 962 73.4 62.3 57.3 35.9 12.3 4.1 1.82008 1353 77.8 61.9 56.8 35.4 12.4 3.92009 794 77.0 64.4 56.9 37.7 12.52010 690 80.4 62.6 57.5 32.62011 806 78.3 61.5 56.82012 680 75.0 60.12013 724 78.6
First Year Retention Rates for First-Time Full-Time Freshmen
Retention Rates for First-Time Full-Time Freshmen
77.7%75.3%
73.0%
68.0%
73.4%77.8% 77.0%
80.4%78.3%
75.0%78.6%
60%
65%
70%
75%
80%
85%
90%
95%
100%
2003 2004 2005 2006 2007 2008 2009 2010 2011 2012 2013Freshman Cohort Year
26
Year ofEntry(Fall)
Numberin
Cohort
After Year
1
After Year
2
After Year
3
After Year
4
After Year
5
After Year
6
After Year
7
After Year
8
After Year
9
After Year
101998 524 0.0 0.0 0.2 21.9 38.9 44.1 45.2 45.4 45.6 46.21999 476 0.0 0.0 0.6 21.6 43.5 47.9 50.0 51.3 51.5 51.92000 499 0.0 0.0 0.2 19.4 37.9 44.1 45.1 46.5 47.1 47.92001 614 0.0 0.0 1.0 20.2 38.6 45.1 47.1 48.2 48.9 50.22002 670 0.0 0.1 0.4 18.1 32.7 39.3 41.0 41.3 42.1 42.52003 883 0.0 0.0 0.1 14.0 29.8 36.5 39.1 40.2 40.9 42.42004 891 0.0 0.0 0.7 13.1 29.2 35.6 38.4 39.7 40.4 40.92005 1050 0.0 0.0 0.3 15.9 33.0 41.0 43.7 44.7 45.02006 976 0.6 0.8 0.8 14.8 31.7 40.5 42.8 43.32007 962 0.4 0.6 0.7 17.8 38.3 45.5 47.62008 1353 0.0 0.0 0.1 17.3 38.4 45.82009 794 0.0 0.0 0.3 17.0 38.52010 690 0.0 0.0 0.7 20.12011 806 0.0 0.0 0.22012 680 0.0 0.02013 724 0.0
10-Year Graduation Rates of First-time Full-time Freshmen
Graduation Rates for First-Time Full-Time Freshmen
20.2%18.1%
14.0% 13.1%15.9% 14.8%
17.8% 17.3% 17.0%20.1%
45.1%
39.3%36.5% 35.6%
41.0% 40.5%
45.5% 45.8%
38.6%
32.7%29.8% 29.2%
33.0% 31.7%
38.3% 38.4% 38.5%
20.1%
0%
10%
20%
30%
40%
50%
60%
0%
10%
20%
30%
40%
50%
60%
2001 2002 2003 2004 2005 2006 2007 2008 2009 2010
% o
f Und
ergr
adua
tes G
radu
atin
g
Fall of First Freshman Enrollment
Graduation Rates for First-time Full-time Freshmen by Cohort Entrance Year
100% time (4 years) 125% time (5 years) 150% time (6 years)
27

28

fAcUlty And stAff
Imagine possibilities. Realize success.

Full-time Part-time Full-time Part-time Full-Time Part-TimeAmerican Indian/Alaska Native 0 0 1 0 1 0Asian 0 0 0 0 0 0Black/African-American 233 15 390 51 623 66Hispanic 8 1 9 1 17 2Native Hawaiian/Other Pacific Islander 0 0 0 0 0 0Non-Resident Alien 7 0 1 0 8 0Two or more races 0 0 0 0 0 0Unknown 18 1 9 3 27 4White 113 9 89 47 202 56Total 379 26 499 102 878 128
TotalFemaleMale
American Indian/Alaska Native0.1%
Black/African-
American68.5%
Hispanic1.9%
Non-Resident Alien0.8% Unknown
3.1%
White25.6%
RaceMale
40.3%
Female59.7%
Gender
Fall 2014All Employees by Race and Gender
30

American Indian/Alaska Native
Black or African
American Asian Hispanic
NativeHawaiian/
OtherPacific
Islander White
Two or more races
Non-resident
alien Unknown TotalMale 0 64 0 2 0 65 0 7 18 156
Full-time 0 50 0 1 0 56 0 7 17 131Part-time 0 14 0 1 0 9 0 0 1 25
Female 1 159 0 3 0 98 0 0 10 271Full-time 1 111 0 2 0 51 0 0 7 172Part-time 0 48 0 1 0 47 0 0 3 99
Total Faculty 1 223 0 5 0 163 0 7 28 427Full-time 1 161 0 3 0 107 0 7 24 303Part-time 0 62 0 2 0 56 0 0 4 124
Full-Time & Part-Time Faculty by Race & Gender
American Indian/Alaska Native0.2%
Black/African-
American52.2%
Hispanic1.2%
Non-Resident Alien1.6% Unknown
6.6%
White38.2%
Race Male36.5%
Female63.5% Gender
31

American Indian/Alaska Native
Black or African
American Asian Hispanic
NativeHawaiian/
OtherPacific
Islander WhiteTwo or
more races
Non-resident
alien Unknown TotalTenured 0 78 0 0 0 66 0 6 15 165
Professor 0 28 0 0 0 23 0 0 4 55Male 0 11 0 0 0 18 0 0 4 33Female 0 17 0 0 0 5 0 0 0 22
Associate Professor 0 50 0 0 0 43 0 6 10 109Male 0 19 0 0 0 23 0 6 8 56Female 0 31 0 0 0 20 0 0 2 53
Assistant Professor 0 0 0 0 0 0 0 0 1 1Male 0 0 0 0 0 0 0 0 0 0Female 0 0 0 0 0 0 0 0 1 1
Not Tenured but on Tenure Track 0 30 0 2 0 20 0 1 5 60Professor 0 0 0 0 0 0 0 0 0 0
Male 0 0 0 0 0 0 0 0 0 0Female 0 0 0 0 0 0 0 0 0 0
Associate Professor 0 2 0 0 0 1 0 0 0 3Male 0 1 0 0 0 0 0 0 0 1Female 0 1 0 0 0 1 0 0 0 2
Assistant Professor 0 28 0 2 0 19 0 1 5 55Male 0 5 0 1 0 8 0 1 2 17Female 0 23 0 1 0 11 0 0 3 38
Instructor/Lecturer/No Academic Rank 0 2 0 0 0 0 0 0 0 2Male 0 0 0 0 0 0 0 0 0 0Female 0 2 0 0 0 0 0 0 0 2
Not on a Tenure Track 1 51 0 1 0 21 0 0 4 78Male 0 14 0 0 0 7 0 0 3 24Female 1 37 0 1 0 14 0 0 1 54
Full-Time Faculty by Race, Gender, Academic Rank, and Tenure Status
32

33

GLOSSARY
Imagine possibilities. Realize success.

Glossary
First-Time Freshman - enrolled freshmen who have not been enrolled previously at this level at any institution
New Undergraduate Transfer - transfer students who were previously enrolled at this degree level at another institution
New Graduate Students - students enrolled at the post-baccalaureate level who have not been previously enrolled at WSSU.
Headcount Enrollment counts students equally, regardless of the number of credit hours for which each student is enrolled.
FTE (full-time equivalent) Enrollment counts are based on the number of credit hours a student is taking in a given semester. Most full-time undergraduates are expected to take 12 semester hours, and most full-time graduate students are expected to take 9 credit hours each semester. UNC institutions use a stair-step method of determining FTE, so undergraduates taking 9, 10, or 11 hours are all considered to be three-quarters of an FTE, rather than 0.75, 0.83, and 0.92 FTE, respectively.
Academic Load. Most full-time undergraduates are expected to take 12 semester hours. Most full-time graduate students are expected to enroll for 9 credit hours each semester.
35