Embed Size (px)
Citation preview
Annals of Library Science and Documentation 1987.34(4). 149-162
UNIVERSITY LIBRARIES AS ECONOMIC SYSTEMS
.4 time series study is attempted to identify thedevelopment (if the library in different periods.Variation in library budget and its allocation ondifferent eleincn ts are calculated to find out theadequacy of library finance. Per capita expendi-tu re of a t'O/1I me, user and service are calculatedto measure 11u: adeouacy and efficiency oflibra-ry services .. -111 at temp t is also made to estimatethe imp act of the library services on the researchoutput of the institution.
INTRODUCTION
Libraries as well other institutions and organisa-tions in public and private sectors are facedwith economic problem of allocating theirlimited resources in such a manner as to gene-rate maximum benefits. In the enterprise,input price, budget allocation, cash flow, unitcosts and profits are the most used econo-mic measures both of enterprise activityand performance achieved. In the libraryand information unit this must be broad-ly analogous, even if the final definitionof some of the measures differs - most notablythe notion of profit, which may be replacedby measures of value, welfare and satisfaction.
It is interesting to note that the applicationof Cost-Benefit Analysis to information opera-tions and services is of fairly recent origin but itsuse is growing rapidly. CBA is an attempt toapply economic rationality to decision making.
With the growth in the research activities inthe university environment has come growth inthe information requirements. It implies in-creases in library materials, services and staffsize. As the growth is obvious at all levels, theproblem of justifying the allocation of resour-ces and rationalizing requests for continued orincreased operating funds become particularlyacute. Hence in libraies the cost benefit studybecomes imperative. It is defined as a "syste-
Vol 34 No 3 December 1987
M SURIYADepartment of Library and Information ScienceA nnamalai UniversityA nnamalainagar
NMALATHIDepartment of EconomicsA nnamalai UniversityA nnamalainagar
matic comparison between the cost of carryingout a service or activity and the value of thatservice or activity quantified as far as possible;all costs and benefits (direct and indirect, finan-cial and social) being taken into account" (1]The cost of carrying out a service can be calcu-lated by taking into account the library mate-rials, labour and overhead expenses. The valueof that service is assessed by the extent to whichthe library contributes towards achieving theobjectives of the institution.
STATEMENT OF THE PROBLEM
The centre of Advanced study in Linguisticsin Annamalai University is one of the pioneerinstitutions in India promoting higher researchand learning in linguistics. This centre did yeo-man service to develop linguistic studies, particu-larly Dravidian Linguistics in India and cele-brated its Silver Jubilee, in 1985. It has made re-markable academic progress; so far it has turnedout 83 Ph.D.scholars, published 140 books and2100 research papers and also completed 14UGC research projects. This academic achievement would not have been a possibility withouta proper library system in its centre.
This study mainly aims at measuring thequality and the value of the library in the Centreof Linguistic Studies at Annamalai University.Quality refers to its capability for meeting theuser needs it is iritended to serve and value refersto the beneficial effective accruing from its use.
OBJECTIVES
The objectives of this study are.
1. to study the ratio of total library expendi-ture to the total institutional expenditureand the library material expenditure to thetotal library expenditure.
149

SURlY A & MALATHI
2. to identify the number of input variablesthat enter into the library system andexamine the growth rate of these severalvariables over the years.
3. to study the relationship among inputvariables in order to determine the inputstability.
4. to propose a microeconomic model fordetermining optimum library size andminimum unit costs.
5. to measure the efficiency, quality andbeneficial effect of library system.
METHOD OF STUDYInformation related to the total library expen-diture, number of users, number of books andjournals added and the total amount of re-search output for the period 1960-61 to 1984-85 are collected from the budget estimates,annual reports, year books of the Universityand the Department. Besides the accessionregister and circulation register of the Libraryare consulted. In order to examine the utili-zation of the library, primary data is collectedby taking a random sample of 3 P.G. students,11 research scholars and 6 staff members. Apersonal investigation is made by circulating awell structured questionnaire containing inform-action relating to (1) Status (2) Personal collec-tion of books and journals (3) Number of re-search publications (4) Use of library servicesand (5) Opinion of the users about the librarycollection. These data are collected only forthe previous year (1985-86). (Appendix I).
As there is variation in the input and outputvariables, the period of study is divided into fiveequal parts covering 1960-65 to 1980-85. Duringthe second period (1965-70) the Department ofLinguistics was upgraded as the Centre ofAdvanced Study. This status has continuedupto the IVth period (1975-80). Only in theVth Period (1980-85) this centre has beenstopped from getting the UGC special grantfor CAS.
In order to get a real picture of the amountinvested on the library, the actual budgets areconverted into constant price for the year(1970-79) by referring the whole sale priceindex given in the Reserve Bank Bulletin.
In the circulation of cost per user, thetotal number of library users are converted
150
into credit points by assigning 1 credit pointto the staff researchers and 0.25 credit pointto the P.G and Diploma students. Similarlyin measuring the research outputs of the centre,credit points have been assigned as follows:
10 credit points to one Ph.D awarded andone Book published.
5 credit points to one M.Phil awarded andone UGC projectcompleted.
2 credit points to one research articlepublished in the journal or presentedin the conference or seminar.
RESULTS AND DISCUSSION
Analysis of Library Budget
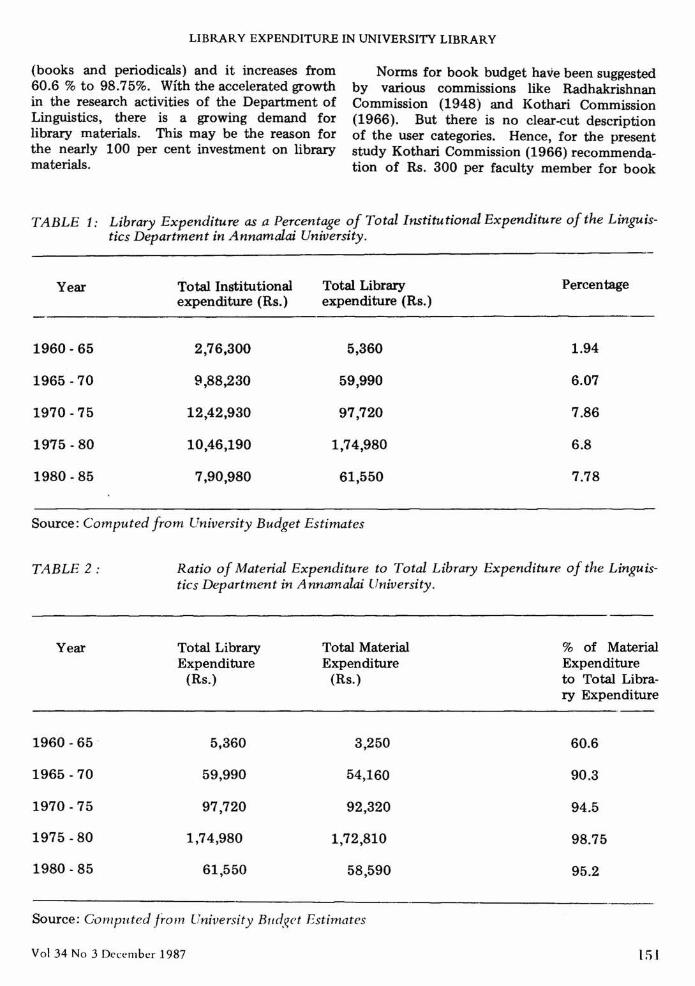
For university libraries in higher education, thenorm for library budget varies from 6 per centto 10 per cent of the total institutional budget.Table 1 shows that excepting the first period,the percentage of library expenditure to totalexpenditure of the institution ranges from 6 to8, which is well within the overall norm of 6 to10. In the first period the percentage of thelibrary budget is below the norm. From thisit is inferred that not only the actuals but alsothe percentage of library budget increases inall the periods from 2 to 8. This constantincrease may be due to the realisation thatwell-equiped library is indispensable for highlevel research.
Fammers has presented a tentative stati-stics, relating to the actual current operationof the British university libraries. [3] He hasrecommended the following break up of lib-rary expenditure among its elements;
SalariesBooksPeriodi-calsBuildingsSundries
50%25 %
13%6%6%
In the Indian context, the suggested norm ofstaff salary and library material is 40 :60[ 4]Table 2 shows that a major chunk of the libraryexpenditure comprises the material expenditure
Ann Lib Sci Docu
LIBRARY EXPENDITURE IN UNIVERSITY LIBRARY
(books and periodicals) and it increases from60.6 % to 98.75%. With the accelerated growthin the research activities of the Department ofLinguistics, there is a growing demand forlibrary materials. This may be the reason forthe nearly 100 per cent investment on librarymaterials.
Norms for book budget have been suggestedby various commissions like RadhakrishnanCommission (1948) and Kothari Commission(1966). But there is no clear-cut descriptionof the user categories. Hence, for the presentstudy Kothari Commission (1966) recommenda-tion of Rs. 300 per faculty member for book
TABLE 1: Library Expenditure as a Percentage of Total Institutional Expenditure of the Linguis-tics Department in Annamalai University.
Year Total Institutional Total Libraryexpenditure (Rs.) expenditure (Rs.)
2,76,300 5,360
£1,88,230 59,990
12,42,930 97,720
10,46,190 1,74,980
7,90,980 61,550
Percentage
1960 - 65 1.94
1965 - 70 6.07
1970 -75 7.86
1975 - 80 6.8
1980 - 85 7.78
Source: Computed from University Budget Estimates
TABLE 2: Ratio of Material Expenditure to Total Library Expenditure of the Linguis-tics Department in Annamalai University.
Year Total LibraryExpenditure
(Rs.)
Total MaterialExpenditure
(Rs.)
% of MaterialExpenditureto Total Libra-ry Expenditure
1960 - 65· 5,360
59,990 90.3
1980 - 85 61,550
3,250
54,160
92,320
1,72,810
58,590
60.6
1965 - 70
1970 -75 97,720 94.5
1975 - 80 1,74,980 98.75
95.2
Source: Computed from University Budget Estimates
Vol 34 No 3 December 1987 ISI

SURlY A & MALATHI
budget is taken as the common norm for allkinds of users. But taking into considerationthe degree of utilisation of the library by differ-ent categories of users, credit points are assignedto each category of users. As the teachers andresearch scholars use the library more oftenthan the others, they are assigned 1 creditpoint; P.G. students and Diploma studentsare assigned 0.25 credit point. Then bookbudget norm for each year is calculated usingconstant price.Table 3 reveals that there is a vast differencebetween the actuals and the norms suggestedduring the initial stage of the development ofthe Linguistics Department. It is mainly dueto the low library budget. In the second stage,the actuals are closer to the suggested normbecause there is an increase in the librarybudget in consonance with the increasein the research activities of the Department.In the third and fourth stage, the variationis enoITI'OUSmainly due to the heavy invest-ment made on library by the UGC. In thefinal stage, the gap is very less. That is, thereis only a marginal difference between the actualsand the norm. It is because of the decline inthe total library expenditure.
Growth of Library Inputs
Library inputs are the books, journals and thelibrary staff. This study also aims at measuring
the percentage increase of material and labourbudget over previous year.
Tab'le 4 shows that the growth of book expen-diture is not uniform and it varies from 7.2 % to370 %. In the second period there is an enor-mous growth in the book expenditure (370%)and this may be due to the upgradation ofthe Department of Linguistics into a centreof advanced study during this period. As itis the "take off" period, a large portion isallotted for the procurement of books. Thisperiod has witnessed a tremendous growth of370 per cent book expenditure. In the thirdand fourth periods, the growth rate of bookexpenditure is stable, ranging from 7.2 to16.6 per cent. But in the fifth period, thereis a decline in the rate of growth which reflectsthe fall in the total expenditure (both insti-tutional and library expenditure).
Regarding journals, there is a growth of463 per cent during the third period. Thisis the boon period in the collection of bothcurrent journals and the back volumes. Butin the subsequent years, there is a decreasein the growth of journal expenditure. Simi-larly the growth of labour and total expendituredecrease continuously in these periods.
It is inferred that there is no consistentpattern of growth in the input variables viz.total library expenditure, material expenditureand labour expenditure.
TABLE 3: Analysis of Book Budget as Per Norm
Total Book Budget Total Book Budget Variation(Actuals) Rs. (as per norm) Rs. (%)
3,250 41,400 - 92.24
54,160 53,700 + 0.09
92,320 56,800 + 62.54
1,72,810 71,500 +141.69
58,590 59,600 0.02
Year
1960 - 65
1965 - 70
1970 - 75
1975 - 80
1980-85
Source: Computed from University Budget Estimates
152 Ann Lib Sri Docu

LlBRAR Y EXPENDITURE IN UNIVERSITY LIBRARY
TABLE 4 : Average Annual Growth Rate of Material and Labour Expenditure
Period Total Expenditure Total Expenditure Labour Expenditure Total Library(on Books (Rs.) on Journals (Rs.) (Us.) Expenditure (Rs.)
I1810 53601960-65 2330 1220
39300 1470 4870 45640II1965-70 (370) (4.0) (30.0) (161.0)
III 53000 35320 9420 977401970-75 (7.2) (462.6) (18.0) (22.8)
IV 97000 65810 12170 1749801975-80 (16.6) (17.0) (6.4) (15.8)
V 17000 37580 ~2960. 675401980-85 (-16.5 ) (-8.1) (-1.5) (-12.4)
--.--
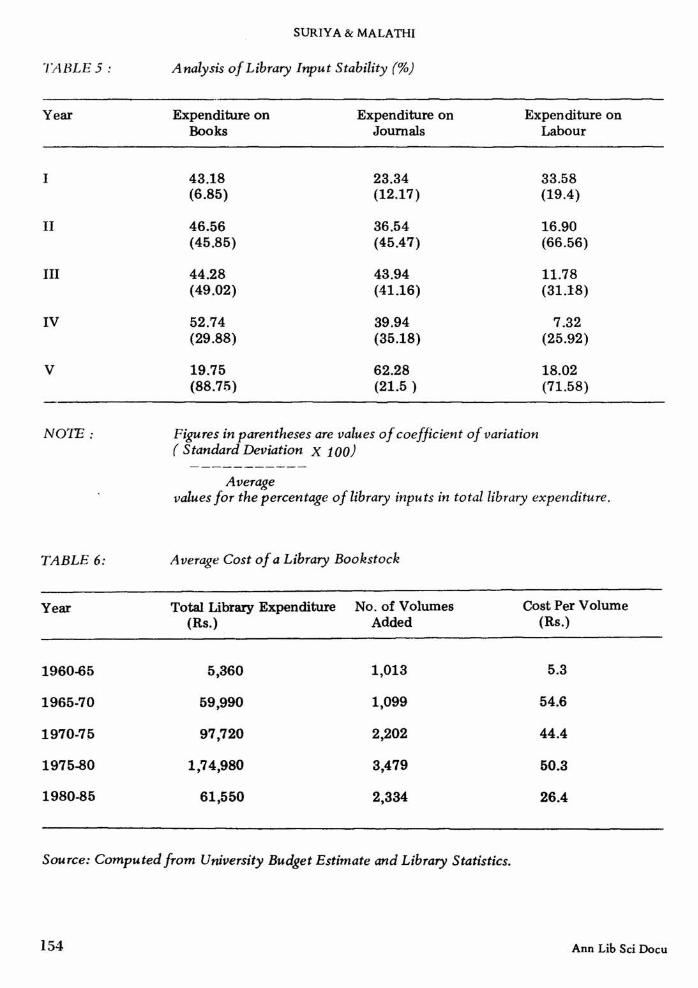
From Table 5 it is inferred that exceptinglast period the share of book expenditure showsstability and it ranges from 43 per cent to 53per cent. The instability of the percentage ofjournal expenditure reveals its growing expen-diture. In case of labour expenditure, exceptfor the last period, there is a decline in itsshare on total library expenditure.
The value of coefficient of variance for the per-centage value calculated for each library inputreflects their yearly variability. In the nextthree periods, ie. during the upgradation stageof the Department into CAS, the yearly variabi-lity is much pronounced. From this it is inferr-ed that the library input depends mainly on thepolicy of the institution and the financial assis-tance the library receives.
Having seen the interrelationship betweenthe library inputs, it is necessary to study theeffect of these inputs on the outputs of thelibrary. One such measure is to determine theoptimum library size and minimum unit costs.
Optimum Library Size of the Library
In any institution, the parameter to assessefficiency is to examine the supply side anddetermine the minimum average cost. The
Vol 34 No 3 December 1987
theory of the firm determines optimum orleast expensive output per period. Similarlythe efficiency of the library is determined bythe optimum or least expensive bookstockavailable during a given period. [5] Averagecost of a library bookstock may be definedas the library's total cost for a given perioddivided by the library's bookstock added forthat period.
Excepting the first and the last period,cost per volume or unit cost has been decreas-ing over the years. It implies that the librarybudget is wisely spent in enriching the collec-tion and makes available enormous libraryresources for the benefit of the users. Averagecost per volume is Rs. 44.4 and it indicatesthat optimum library size is obtained during1970-75 which is illustrated in Fig-1 drawnfor the second! third and fourth periods.(Table 6).
Cost per Circulation
If library services are to survive economically,it is confirmed that the cost of using the librarymust remain lower than or equal to that of asubstitute non-library service, other things beingequal. The average cost of a lending or referencetransaction per period is calculated by dividing
1:1:3
SURlY A & MALATHI
TABLE 5: Analysis of Library Input Stability (%)
v
Expenditure on Expenditure on Expenditure onBooks Journals Labour
43.18 23.34 33.58(6.85) (12.17) (19.4)
46.56 36.54 16.90(45.85) (45.47) (66.56)
44.28 43.94 11.78(49.02) (41.16) (31.18)
52.74 39.94 7.32(29.88) (35.18) (25.92)
19.75 62.28 18.02(88.75) (21.5 ) (71.58)
Year
I
II
III
IV
NOTE : Figures in parentheses are values of coefficient of variation( Standard Deviation X 100)
Averagevalues for the percentage of library inputs in total library expenditure.
TABLE 6: Average Cost of a Library Bookstock
Year Total Library Expenditure No. of Volumes Cost Per Volume(Rs.) Added (Rs.)
1960-65 5,360 1,013 5.3
1965-70 59,990 1,099 54.6
1970-75 97,720 2,202 44.4
1975-80 1,74,980 3,479 50.3
1980-85 61,550 2,334 26.4
Source: Computed from University Budget Estimate and Library Statistics.
154 Ann Lib Sci Docu

LIBRARY EXPENDITURE IN UNIVERSITY LIRRAAY
60
55
'"0'".....'"lJ<0r:
50c:I:'"l
45
SCALE:
'X' axis 3 em = 1000
'V' axis 3 em = 5 Rupees
o 4
BOOK STOCK IN ('000)
Fig. 1
the library's real budget for that period by thetotal number of transactions.
Table 7 shows that the average cost of usingthe library diminishes, the more frequently thelibrary is used. Initially, the number of trans-action is less in spite of a heavy investment onlibraries. Hence the cost per transaction is highamounting to Rs. 133. In the last four years,the optimum use of library service is obtainedsince the cost per transaction is maintained with-in Rs. 14 (during 1982-83 to 1985-86). Theresults are illustrated in Fig.2.
COST PER USER
The per capita expenditure of user has beensuggested as an important parameter to measurethe library services by the Parry Committee [6]which states that "Library cost must increasewith the rise in student members and the conse-quent increase in the number of academic staff.Other things being equal, libraries in large insti-tutions can provide better service to scholarsfrom those small ones at the same cost perreader." [6]
Table 8 indicates that the per capita user costgenerally increased in all the periods excepting1980-85. An attempt has been made to
Vol 34 No 3 December 1987
compare the cost per user with the suggestednorm. It is based primarily on the enrolmentof the user.
The norm suggested is applicable for the year1978-79 and it is converted to 1970-71 price.The per user cost is compared with the suggest-ed norm. Excepting the 1st and the 5th period,the cost per user is greater than the norm. Inthe 3rd period the variation is very less and inthe 1st and 5th periods, the variation betweenthe per user cost and the suggested norm isgreater which may be due to the decline in thetotal library budget. (Table 9).
EFFICIENCY OF THE LIBRARY SYSTEM
In evaluating the library one must consider till'efficiency of its services and its effectivenessin implementing the goal of the institution.The most basic formula as suggested by Sal-verson [71' for determining the efficiency ofan information system is: EfficiencyOutput/Input. In the present study, thv-research publications of the Department ofLinguistics are taken as the output of thoinstitution. Input is the total library budget.Efficiency of the library service is determined
I,").)

TABLE 7:
SURlYA & MALATHI
Cost per circulation in the Library of Linguistics Department inAnnamalai University
Total Library Total Number of Cost perExpenditure Circulation Transaction
(Rs.) (Rs.)
37,410 467 80
23,090 173 133
11,840 165 71
11,250 232 48.5
5,710 410 13.9
15,970 1,268 12.6
16,780 1,333 12.6
18,930 1,500 12.6
Year
1978-79
1979-80
1980-81
1981-82
1982-83
1983-84
1984-85
1985-86
Source: Compu ted from Library Statistics.
80
70
60
..; 50a:~c0 40:;:;'":il:! 30·u•..•Q. 20-VI0u
10
SCALE:
'X' axis 1 em '"' 200'v' axis 1 cm = Rs.'j 0
o 2 4 6 8 10 12 14 16 18
Circulation COO)
Fig. 2
Ann Lib Sci Docu

LIBRARY EXPENDITURE IN UNIVERSITY LIBRARY
TABLE 8: Cost per user in the Library of Linguistics Department inAnnamalai University
Year Total Library Total No. of Cost per Cost per VariationExpenditure User User (Rs.) User (Rs.)
(Rs.) (actuals) (as per norm)
1960-65 5,360 179 30 143 -133
1965-70 59,990 241 249 211 + 38
1970-75 97,720 275 355 309 + 46
1975-80 1,74,980 319 549 450 + 99
1980-85 61,550 200 308 694 -386
Source: Computed from Library Statistics.
TABLE 9: Suggested Norm for Library Budget (As applicable in 1979)
Enrolment Per User Cost(1) (2) (Rs.) (Rs.)
Within 500 450
500 - 3500 400
3501 -10000 350
10001 - 35000 300
35001 - 50000 250
50001 & Above 200
Source: A.K. Guha & P.K. [ay aswal, Budget Manangement in Libraries for Higher Educationin Delhi - A Comperative study. IASLIC Special Publication No.19, P.78.
by dividing the total number of research publi-cations of that centre by the library's realbudget for that period.
Table 10 shows that the research publicationsincrease as the total library budget increasesduring the last 25 years. There is a directrelation between these two, though not. propor-tionately. The efficiency of the library alsoshows a consistent rise in all the periods exceptfor the last one.
Vol 34 No 3 December 1987
Quality of the Library Service
The parameter to study the quality of thelibrary service is its recall ratio which is definedas
Number of relevant documents retrieved X 100
Total Number of Relevant documents inthe collection.
157

SURlY A & MALATHl
The recall ratio expresses the capability of thesystem in meeting the user needs. The followingtable illustrates the number of relevant docu-ments retrieved from the library during 1985-86.(Table 11).
It is encouraging to note that the recallratio is ranging from 55 to 77 per cent in the•case of books and from 38 to 100 per cent inthe case of journals. The relevancy of the totaldocuments available in the library is 63 per cent.
'J>1BLF, 10:
implying the fact that the library consists mostlyof the relevant documents needed by the users.
THE BENEFICIAL EFFECT OF THE LIB-RARY SYSTEM
The value of the library service will be ultimate-ly judged in terms of the beneficial effectsaccruing from its use. An attempt is made
Efficiency of the Library of the Linguistics Department inA nnamalai University
Year Total LibraryExpenditure(Rs.1000's)
Total Number of ResearchPublications (CreditPoints)
Output per UnitInput
INPUT OUTPUT EFFICIENCY
1960-65 5.36 27 5.04
1965-70 59.99 474 7.90
1970-75 97.72 970 9.93
1975-80 174.98 1427 8.16
1980-85 61.55 1159 5.3
Source: Computed from Annual Report and University Budget Estimate.
TABLE 11: Quality of the Library Service in the Linguistics Department,
Categoryof users
No. ofBooksreferred
No. ofrelevantBooks
No. ofJournalsreferred
No. ofrelevantJournalsfound
Ratio of relevancyBooks % Journals %
M.A.Ph.DStaffOverall
751037195
1307
58645108811
.4727628
352
1819528
241
77.362.255.462.0
38.370.7
100.068.7
SOI/ rce: Conipu ted from the Primary Data.
Ann Lib Sei Doell

LIBRARY EXPENDITURE IN UNIVERSITY LIBRARY
to study the impact of the utilisation of thelibrary services (circulation service) on thebeneficial effect i.e. the amount of researchoutput of the institution.
From 'I'able 12 it is inferred that Ph.D scho-lars utilise the library to a greater extent thanthe staff members. Invariably the library re-sources are utilised to the maximum by allthe categories of users. The research scholarshave spent more or less the same amount onthe purchase of books and journals. The re-search publications of the staff members aremore than the researcher.
In order to fine out the influence of li-brary use and personal collection separatelyon the number of research publications,Pear-son's Correlation Coefficient is calculated.
The calculated values given in Table 13reveal that there is a positive correlation bet-
ween the use of libraries and the number ofpublications in the case of scholars while thereis a high positive correlation between the person-al collection and number of publications inthe case of staff members. This may be dueto the fact that the scholars depend more onthe library for their information requirements,while the staff members have many sources tocollect their needed information.
In order to find out the combined influenceof library use and personal collection on thenumber of publications, the coefficient ofdetermination (R2 1(23) is computed. It isinferred from these results that in the caseof staff 76 per cent of change in the numberof publications is due to their personal collec-tion and books borrowed from the library.For scholars, the use of library and personalcollection explain 48 per cent of variation inthe number of publications among them.
TA.BLE 12: Al'erage Use of Library, Personal Collection and Research Output
Category Booksborrow-ed
Journalsborrowed
Amountspent
ResearchPublica-tion
Thesesborrow-ed
Totalitemsborrow-ed
Bookspurch-ased
Journalsubscr-ibed
M.A.Ph.DStaff
277137
583
5223
37101
4312301255
1124
714
13
Source: Compu tci! from Primary Data.
TABLE 13: BCI/cficial Effect of Library
User Pearson's Simple CorrelationCoefficient
Coefficient ofDetermination
Staff 0.22
Ph.D 0.43
,\107L:(1) .\"'. of ['u/)/icdtioll.\·(2) So. d" /('IIIS Borro u-ccl(1) +m ou n t spent on [lcr\·u/I.i/ Colu-ction,
Vol 3-+ No 3 [)"c<'lllbn 1<)87
0.83
R2(23)
0.76
0.18 0.48
I.jl)

SURIYA & MALATHI
CONCLUSION
Thus the application of cost benefit analysisin library would assist the librarian in properallocation of resources. It also helps him toevaluate the efficiency and effectiveness ofthe library system.
REFERENCES
1. Treasury H M: Glossary ot management tech-niques. London: HIMSO, 1967,
2. Guha A K Jayaswal P K: Budget management inlibraries for higher education in Delhi - A com-parative study. IASLIC Special Publication No. 19,Calcutta: IASLlC, 1979, p. 71.
3. Ellsworth R : Some aspects of the problem ofallocating book fund for a "university library",Library Quarterly 1968, 2, 489.
160
4. India, Kothari Commission, 1966.
5. Rowe D: Application of the theory of the rumto library costing. Aslib Reader, Series Volume 5.Costing and the Economics of Library and In-formation Services, Ed. by Stephen A. RobertyAslib,London, 1984,P.302.
6. Op cit; Guha and Jayaswal, P: 79.
7. Mahapatra, M : "System analysis as a tool forresearch in scientific management of libraries :A State of the art review," (Costing and theeconomics of library and Information services,Ed. by Stephen A. Roberts Aslib Reader Series,Vol. 5, Aslib, London, 1984, P. 42).
8. Lancester F : Information retrieval systems :Characteristics; Testing and evaluation, NewYork: John Wiley & Sons, 1979, P: 112.
Ann Lib Sci Doeu

L1BRAR Y EXPENDITURE IN UNIVERSITY LIBRARY
:\I'/'I:ND[X i
MEASURING THE EFFECTIVENESS OF LIBRARY SERVICES - CENTRE OF ADVANCED
STUDY IN LINGUISTICS
I. GENERAL INFORMATION:
1. Status : P.G. Student
M.Phil Scholar
Ph.D ScholarStaff
2. Personal Collection of Documents (last year Procurement)
Document(Rs.)
Number Amount Spent
BooksJournalsReprints &
OthersTotal
-------------------------------_ .._-_.
3. No. of Research Publications in the last year.
Published in JournalsPresented at Conference and SeminarsBook PublishedProjects Completed
II. USE OF LIBRARY SERVICES: (last year Statistics)
1. No. of Documents Borrowed
DOCUMENTS NUMBER1. Books2. Journals3. Others
2. Number of Relevant Documents Located: (last year)---------------------_._------------.-
Documents No. of Consulted No. of found relieve-d
BooksJournalsReprints &
Others
Vol 34 No 3 December 1987

SURlY A & MALATHI
III. USE OF INTER LIBRARY LOAN SERVICES (last Year).
Documents No. of Requested No. of Received
BooksJournalsThesesReprints &
Others
IV. TO WHAT EXTENT ARE THE RESOURCES IN YOUR LIBRARY SATISFY YOUR IN-FORMATION REQUIREMENTS?
(a) More than sufficient.(b) Sufficient(c) Not at all Sufficient.
162 Ann Lib Sci Docu