Embed Size (px)
Citation preview
MichiganUniversity of
ResearchRetirementCenter
Working Paper WP 2010-223
Financial Knowledge and Financial Literacy at the Household Level
Alan L Gustman Thomas L Steinmeier and Nahid Tabatabai
M RR C Project UM10-12
Financial Knowledge and Financial Literacy at the Household Level
Alan L Gustman Dartmouth College and NBER
Thomas L Steinmeier Texas Tech University
Nahid Tabatabai Dartmouth College
September 2010
Michigan Retirement Research Center University of Michigan
PO Box 1248 Ann Arbor MI 48104
httpwwwmrrcisrumichedu (734) 615-0422
Acknowledgements
This work was supported by a grant from the Social Security Administration through the Michigan Retirement Research Center (Grant 10-M-98362-5-01) The findings and conclusions expressed are solely those of the author and do not represent the views of the Social Security Administration any agency of the Federal government or the Michigan Retirement Research Center
Regents of the University of Michigan Julia Donovan Darrow Ann Arbor Laurence B Deitch Bingham Farms Denise Ilitch Bingham Farms Olivia P Maynard Goodrich Andrea Fischer Newman Ann Arbor Andrew C Richner Grosse Pointe Park S Martin Taylor Gross Pointe Farms Katherine E White Ann Arbor Mary Sue Coleman ex officio
Financial Knowledge and Financial Literacy at the Household Level
Abstract
This paper uses data from the Health and Retirement Study to explore the mechanism that underlies the robust relation found in the literature between cognitive ability and in particular numeracy and wealth income constant We have a number of findings First the more valuable the pension the more knowledgeable are covered workers about their pensions We suggest that causality is more likely to run from pension wealth to pension knowledge rather than the other way around Second most measures of cognitive ability including numeracy are not significant determinants of pension and Social Security knowledge Third standardizing for incomes and other factors a pension of higher value does not substitute for other forms of wealth Rather counting pensions in total wealth those with more valuable pensions save more for retirement other things the same Fourth there is no evidence that wealth held outside of pensions is influenced by knowledge of pensions
In sum numeracy does not influence wealth in whole or in part by affecting financial knowledge of ones pension plan where financial knowledge of the pension then influences other decisions about retirement saving
These findings raise questions about the mechanism that underlies the relation between cognition especially numeracy and wealth From a policy perspective they suggest that the numeracy-wealth relation should not be taken as evidence that increasing financial literacy will increase the wealth of households as they enter into retirement
Authorsrsquo Acknowledgements
This research was supported by a grant from the US Social Security Administration (SSA) through the Michigan Retirement Research Center under grant number UM10-12 Measures of knowledge of pensions and Social Security are drawn from our recent book Pensions in the Health and Retirement Study based on work principally supported by NIA grant R01 AG024337 ldquoBehavioral Analysis in Structural Retirement Modelsrdquo The findings and conclusions expressed are solely those of the authors and do not represent the views of SSA NIA or the MRRC We are grateful to James Smith and Jonathan Zinman for suggestions and comments
I Introduction
Pensions and Social Security together account for half the wealth of those approaching
retirement age Thus one would expect knowledge of pensions and Social Security to play a central
role in shaping the financial decisions made by those in their early to mid-fifties In addition recent
studies confirm a link between numeracy and household wealth (Lusardi and Mitchell 2006 Banks
and Oldfield 2007) Indeed measures of numeracy based on simple questions testing the ability to
calculate fractions percentages and compounding seem to dominate more elaborate measures of
cognition in explaining the wealth of those approaching retirement age (McArdle Smith and Willis
2009)2 Thus one would suspect there is a link between numeracy and knowledge of pensions and
Social Security so that holding the influence of cognition on earnings constant each plays a role in
shaping the accumulation of retirement wealth
To learn more about these potential relationships we use the Health and Retirement Study
to create a number of measures of knowledge of pensions and Social Security We then demonstrate
that knowledge of pensions is higher where the value of the pension is higher Next we consider the
relation of cognition to pension knowledge with special emphasis on the role played by numeracy
Following that we relate wealth held outside of pensions and Social Security to measures of
2 McArdle Smith and Willis describe a set of measures of the various dimensions of cognitive ability being developed as part of an ongoing survey that is complementary to the Health and Retirement Study Their research focuses on measures of cognition taken directly from the psychology literature including measures of the stock of accumulated knowledge (crystallized intelligence) and the dimensions of cognitive ability associated with processing decisions (fluid intelligence)
The measures of cognition from their new survey are not yet available in a sample that also includes detailed measures of pension and Social Security wealth from respondents and employers allowing development of an array of measures of pension and Social Security knowledge Both sets of measures will eventually be available for the HRS once the 2010 wave is returned from the field and the respondent information from that wave is supplemented by administrative data The 2010 wave includes the new set of cognition questions detailed questions about pensions and Social Security and eventually will have matched employer produced pension plan descriptions and Social Security earnings histories Right now however detailed measures of cognition are only available for a small share of the HRS population in an experimental module
Therefore we proceed by using the less elaborate measures of numeracy and other dimensions of cognition that are currently available in the HRS These same measures are used by McArdle Smith and Willis (2009) in a portion of their paper (Also see Ofstedal Fisher and Herzog 2005) Supporting this decision their work suggests that in explaining wealth the more elaborate measures of cognition are dominated by simple measures of numeracy which are available to us
1
cognition including numeracy to measures of knowledge of pensions and Social Security and to
wealth accumulated in the form of pensions We consider the relationship to total wealth as well
In some respects our analysis conforms to our expectations In other respects it generates
surprises and more disturbing inconsistencies that are difficult to square with simple stories of the
demand for and effects of knowledge on economic decision making To be more specific
We are able to generate a number of measures of pension and Social Security knowledge
indicating knowledge of plan type age of eligibility for retirement benefits and benefit amounts
Some of the measures of pension knowledge are directly related to pension wealth the
more valuable the pension the more knowledgeable the covered worker Apparently those whose
pensions are valuable enough to make it worthwhile to understand them are more likely to be
knowledgeable about their pensions Moreover most pension wealth held by those in their early and
mid-fifties is in defined benefit plans Given the wage premium paid on these jobs and the history of
changes in these plans causality is more likely to run from pension wealth to pension knowledge
rather than the other way around So far so good
A first puzzle is that most measures of cognitive ability including numeracy are not
significant determinants of pension and Social Security knowledge
A second puzzle is related to findings by previous researchers and confirmed in our earlier
work with HRS data (Cagan 1965 Katona 1965 Gustman and Steinmeier 1999) The amount of
wealth a household accumulates outside of pensions and Social Security does not decline as the
value of the households pension wealth increases income constant That is standardizing for
individual differences such as time preference pensions do not seem to be a substitute for other
forms of wealth As a result counting pensions in total wealth those with pensions save more for
retirement The hypothesis set forth by earlier researchers is that pensions lead to greater
understanding of the mechanics of saving and a greater appreciation of the need for retirement
2
saving This suggests that wealth held outside of pensions should be related to knowledge of
pensions But we can find no evidence in support of that relationship
A third and related puzzle is that knowledge of pensions has no effect on the relation of
cognition to wealth We duplicate results from McArdle Smith and Willis (2009) indicating that
there is a relation between cognition and in particular numeracy and wealth held outside of
pensions and Social Security However once we find that knowledge of pensions and Social
Security is not strongly related to the wealth accumulated by the retirement age population and
knowledge of pensions and Social Security is not related to cognition it follows and we find that
inclusion of pension knowledge in wealth equations does not affect the estimated relation between
numeracy and wealth So we must conclude that numeracy does not influence wealth in whole or in
part by affecting financial knowledge of ones pension plan where financial knowledge of the
pension then influences other decisions about retirement saving
These findings not only raise questions about the role of knowledge of pensions and Social
Security in shaping retirement saving but they also raise questions about the linkage between
numeracy and wealth Not whether there is one -- the evidence supports the existence of such a link
The question is how it works We had thought that one avenue through which numeracy influences
wealth is through an effect on understanding of financial instruments But no financial instrument is
more crucial to retirement saving than pensions and Social Security So we are left with the
question what is the channel through which numeracy affects wealth accumulated by the age of
retirement
To set the stage for the empirical analysis Section II provides further discussion of the role
that knowledge of pensions and Social Security may play in influencing the relation of cognition to
wealth In Section III we discuss the construction of the measures of pension knowledge cognition
and wealth used in the analysis Section IV analyzes the relation of measures of knowledge of
3
pensions and Social Security to measures of cognition Section V analyzes first individually and
then jointly the relation of measures of knowledge of pensions and Social Security and cognition
to retirement wealth Section VI concludes
II An Intermediary Role for Knowledge of Pensions and Social Security
A Cognition and Knowledge of Pensions and Social Security
If higher cognitive ability leads to a greater appreciation of the need for retirement saving
or to more effective saving for retirement one might also expect higher cognitive ability to be
accompanied by greater knowledge of the instruments used in saving for retirement Pensions and
Social Security account for half of the wealth of US households nearing retirement age
One possibility is that those with higher cognitive ability have greater knowledge of
pensions and of Social Security which may contribute to their accumulating greater wealth Even if
there is no direct causality running from cognition through knowledge of pensions and Social
Security to wealth one would expect at least an indirect association where holding measures of
income constant those with highest levels of cognition accumulate greater wealth because they
recognize the need for retirement saving and at the same time accrue greater knowledge of
financial instruments
An indirect linkage might also arise if numeracy leads to increased planning activities
which in turn affect wealth (Lusardi and Mitchell 2007) Once again through this route one might
also expect to find numeracy linked to knowledge of the two most important sources of financial
wealth at retirement age pensions and Social Security
B Knowledge of Pensions and the Level of Non-Pension Non-Social Security Wealth
In Gustman and Steinmeier (1999) we found support for earlier findings by Cagan (1965)
and Katona (1965) regarding the relation of pensions to saving Contrary to the view that pensions
are a simple tax favored substitute for other forms of saving data from the 1992 HRS suggested
4
that pension coverage and pension values bear very little relation to saving outside of pensions That
is those with pensions save roughly the same amount outside of their plans as do those without
pensions who have comparable lifetime incomes Where there is some substitution between
pensions and other forms of wealth it is only for those with higher levels of income and education
For the rest there is little apparent substitution of pensions for other wealth even holding constant a
number of factors that might reflect differences in taste for saving Partly this is because an
important fraction of the population does not save for retirement outside of pensions and Social
Security But of greater interest even for those who do save in other forms in many cases there is
little substitution So those with pensions typically have higher total wealth than those without
pensions income and other factors the same
It is important to standardize for incomes when investigating the pension-wealth relation
Jobs offering a pension also offer higher wages (Gustman and Steinmeier 1993) But even when we
did standardize for lifetime incomes the positive link between pensions and wealth continued
Another possible reason for a pension-wealth relation has been suggested by Cagan (1965)
and Katona (1965) Their idea is that those with pensions may have been made more aware of the
need for retirement saving and so saved more It certainly is in the interest of employers to insure
that covered workers appreciate the contributions they are making to the workers pensions But if
the linkage between pensions and other wealth stemmed from the greater understanding of the need
for retirement saving by those with pensions one would also expect to find a relationship between
knowledge of pension plans and saving in other forms This will lead to one of the major
hypotheses we will be testing If Cagan and Katona were right we should find that greater
knowledge of pensions is associated with higher wealth accumulated outside of the pension income
constant
5
Still another possibility is that those with higher values of time preference may find
pensions an imperfect substitute for wealth in hand But in our earlier work we could find no
evidence that time preference was driving the relation between pensions and other forms of wealth
C Pension Knowledge and Total Wealth
What might account for the lack of a relationship between knowledge of pensions and
Social Security on the one hand and retirement wealth on the other There is evidence that many of
those with pensions are disengaged from the management of their plans Most pensions held by
those in their fifties are defined benefit plans Even among those with substantial balances in
defined contribution plans many never rebalance their portfolios Others rebalance infrequently
even during the course of a recession Many are not aware of the details of their plans Many do not
focus until they are very near their retirement ages Thus the lack of a relation between pension
knowledge and total wealth earnings constant may simply reflect the disengagement of those with
pensions from the management of their plans But why then would they be so aware of the need to
accumulate wealth held in other forms than pensions and Social Security People handle other
forms of wealth more frequently Thus cognition and in particular numeracy may affect the value
of other forms of wealth as long as people are paying more attention to and are engaged in
transactions involving these other forms of wealth But would this attention to other wealth be the
same for those with and without pensions
In trying to understand the relationship between pension knowledge and total wealth there
is another puzzle In exploring measures of pension knowledge similar to those reported here
Gustman and Steinmeier (2001) found that respondents to the Health and Retirement Study who
overestimated the values of their pensions and Social Security in a base year 1992 did not
eventually change their saving or retirement behavior in future years by saving more or delaying
their retirement relative to their initial plans Nor did those who had understated their plan values
6
change their behavior taking advantage of the unexpected excess in assets to save less in
subsequent years or to retire earlier than previously planned
D The Relation of Cognition to Wealth
In attempting to understand the relation of cognitive ability to wealth it is important to
realize that there need not be a statistical relationship Additional cognitive ability might raise
earnings but holding earnings constant greater cognitive ability may or may not be associated with
the accumulation of additional wealth Higher cognitive ability may reduce mistakes people make in
choosing how much to save for retirement but those mistakes might have resulted in either over
saving or under saving Moreover higher cognitive ability might reduce uncertainty but greater
uncertainty about needs in retirement might increase precautionary saving or it may lead to a lower
valuation of the effect of current saving on utility gained by additional consumption in retirement
and thereby reduce saving
Or basic numeracy might lead directly to the accumulation of additional wealth for
retirement Most obviously more able individuals may gain higher returns on their retirement
assets allocating their assets to tax favored instruments to investments with a higher payoff and
lower fees or they may make fewer mistakes adjusting their portfolios over time More able
individuals may also realize the need to save for retirement while the issue may either escape the
attention of those who have difficulties making financial calculations or who may simply be
overwhelmed by the task Some with lower cognitive ability may be unable to understand the need
for substantial retirement saving so they eventually will be able to support their current
consumption in retirement let alone to determine the amount of wealth required to meet their
consumption needs in retirement
If numeracy reduces financial errors this would create a direct link between numeracy and
wealth that would not necessarily involve greater specific knowledge of pensions and Social
7
Security One such linkage has been investigated by Zinman and Stango (2009) They find evidence
relating misunderstanding of how compound interest works to financial wealth Their argument is
that the tendency to linearize the exponential growth of interest leads to greater borrowing and
lower levels of wealth In a similar vein Gerardi Goette and Meier (2010) find that lower numeracy
is associated with greater chance of delinquency and default in the subprime housing market
III Sample and Construction of Variables
The sample used in our analysis is based on respondents to the Health and Retirement
Study from couple households The sample is restricted to the early boomer cohort those from
households with at least one member age 51 to 56 in 2004 We restrict the sample to the early
boomer cohort because it is the first HRS cohort for which we have measures of numeracy at the
time they entered the survey We focus on those 51 to 56 because most measures of pension
knowledge in the HRS are derived from questions asking about pensions on the respondentrsquos
current job3 Typically those jobs offering pensions to respondents over the age of fifty are the
same jobs they held at prime working age Thus we do not want to select an older population where
those remaining on their long term job are not representative of workers who were ever covered by
a pension
A Measures of Pension Variables
Using HRS data it is possible to construct a number of measures of pension and Social
Security knowledge A basic measure distinguishes between respondents who answer ldquodonrsquot knowrdquo
(dk) to questions about pension and Social Security characteristics or values and those who do
answer the relevant questions Another measure compares respondent answers with values
3 In the HRS those who have already retired are not asked about their expected benefits Those who are older than the early retirement age are not asked about their early retirement benefits Those who are older than the normal retirement age are not asked about their normal retirement benefits
8
calculated by evaluating employer plan descriptions using the relevant respondents work histories
Questions about pensions include plan type age of eligibility for early and normal retirement
benefits benefit amounts to be paid to holders of defined benefit plans at early or normal retirement
ages account balances in defined contribution plans and related questions Knowledge of Social
Security benefits is measured by the frequency of donrsquot know responses to questions about benefits
at early and normal retirement ages When analyzing the frequency of donrsquot know responses we use
two different measures One measure is a simple donrsquot know response to the question The second
indicator classifies the respondent as not knowing the answer only if the respondent responds ldquodonrsquot
knowrdquo to the initial question and when presented with a series of bracketed values for the variable
in question continues to respond ldquodonrsquot knowrdquo
The subsamples of the early boomer population used for analysis varies with the measure of
pension or Social Security knowledge being analyzed For example if we are investigating
knowledge of the account balance in a defined contribution plan the sample is limited to the subset
of the population with a defined contribution pension Similarly if we are investigating knowledge
of annual benefits to be paid at expected retirement age for those with a defined benefit plan the
sample is limited to those with a defined benefit plan Empirical work reported in the appendices
demonstrates that the main findings are not affected by the differences in population base created by
the use of different measures of pension and Social Security knowledge
Descriptive data for some of the measures of knowledge of pensions and Social Security
used in our analysis are reported in Appendix Table 2 Part B Some measures will be more useful
than others For example only 3 percent of those with a pension indicate they do not know their
plan type This will limit the usefulness of the dk plan type measure in our later analysis On the
other hand when we use indicators of whether the respondent and firm agree there is much more
variation in the knowledge measures For example the measure of agreement as to plan type is
9
based on a broad measure of agreement There we say the respondent and firm reported the same
plan type either when there is exact agreement or when one reported one plan type say DB while
the other reported coverage by both plan types When the broad measure of agreement is used the
level of agreement is very high at 88 percent The frequency of agreement is much lower when we
use a narrower definition of plan type For example to say the respondent and firm both agree the
plan type is DB only as in row 6 of Appendix Table 2 Part B or DC only as in row 7 they both
must respond the plan type is DB only or DC only If either responds both there is no match The
frequency of agreement is much lower when narrow agreement is required with 10 percent of
respondents agreeing the plan is DB only and 16 percent agreeing the plan is DC only
The measure of whether respondents know the value of their Social Security benefits either
at the early or normal age of eligibility exhibits considerable variability In Part C of Appendix
Table 2 37 percent of respondents say they do not know what their Social Security benefits would
be at the Social Security early age of benefit eligibility and 32 percent say they dont know their
benefits at the normal Social Security entitlement age
B Measures of Cognition
Our analysis uses three indicators of cognition from the Health and Retirement Study
(HRS) TICS questions word recall and numeracy These are available in the core of the HRS for
the early boomer cohort and as noted in the previous section have been shown in earlier studies to
be significantly correlated with wealth
Two ldquoTICSrdquo (Telephone Interview of Intact Cognitive Status) questions are used here They
rate a personrsquos ability to serially subtract 7 from 100 and to count backward (from 20 to 1)4
4 McArdle Smith and Willis (2009) investigate the relation of cognition to wealth for all HRS respondents over the age of fifty They include additional TICS measures beside the two included in our analysis The additional measures help to discriminate levels of cognition among those over 65 One such measure evaluates a second try at backward counting for those who failed the first try Others of the additional TICS questions ask about knowledge of the date of the interview names of the President and Vice President the name of the device for cutting paper and the name for a prickly plant that grows in the desert We do not include these additional measures in this paper because we
10
Backward counting equals 2 if the respondent could correctly count at the first try Otherwise it
equals zero The Series 7 value is the sum of correct answers to any of the questions in the series
The range for TICS is from 0 to 7
Word recall refers to an individualrsquos recall of a list of words using the average of the sum of
correct answers to the immediate and delayed word recalls It ranges between 0 and 10
The measure of numeracy is the sum of the number of correct answers to three questions
asking for calculations involving compound interest fractions and probability One question asks
for the calculation of how many people out of 1000 would be sick if there were a 10 percent chance
of contracting a disease Second if there were five winners of a lottery offering a $2 million prize
what will each receive Third with $200 in a saving account earning 10 percent interest per year
what will be in the account at the end of two years Numeracy ranges from 0 to 3
Descriptive statistics for the cognition variables for various subsamples of the Early Boomer
cohort used in our analysis are reported in Appendix Table 1
C Measures of Wealth
When relating knowledge to wealth two measures of wealth are used alternatively as
dependent variables The first is total wealth excluding pensions and Social Security wealth This
measure includes stocks and other financial instruments the value of the home real estate business
wealth ownership of autos and other sources of wealth The second measure is total wealth
including the wealth equivalent of pensions and Social Security Given the findings that we
discussed from earlier studies where pensions seemed to increase saving in other forms when
analyzing the relation between wealth and financial knowledge we include pension wealth on the
right hand side of the relevant regressions Our findings regarding the relation of cognition andor
focus on the population ages 51 to 56 where these measures are not very helpful in determining differences in cognition
11
pension knowledge to wealth are not however sensitive to whether pension wealth is included as a
covariate
IV Relation of Knowledge of Pensions and Social Security to Numeracy
Table 1 reports the results of a series of probit equations relating various measures of
respondent knowledge of their pensions and Social Security to the level of current pension wealth
(or DB or DC wealth where appropriate) and to measures of cognition including the score from
two elements of the TICS variables (backward counting and serial sevens) word recall and
numeracy5 A number of covariates listed below the table are also included The cells in the table
are dprobits reporting the effect of a one unit change in the independent variable on the probability
of observing the knowledge measure
The table is divided into three sections according to whether the dependent variable pertains
to plan type retirement age or to the value of the pension
We first consider evidence supporting a partial but important underlying economic
explanation for knowledge of pensions Knowledge of pensions is greater if the plan is more
valuable Pension wealth measures are significant at conventional levels in explaining the following
measures of pension knowledge Those with higher pension wealth are more likely to agree with
their employer as to plan type are less likely to say they do not know the early retirement age for
their defined contribution plan are more likely to agree with their firm about the age they will be
eligible for early retirement benefits are less likely to say they do not know the value of their
5 Gustman and Steinmeier (2005a) related these knowledge measures to the HRS indicator of word recall but found no significant results Other studies that include measures of cognitive ability using very simple measures of knowledge of pensions find that numeracy is related to pension knowledge (eg see Banks and Oldfield 2007) Their measure of pension knowledge is an indicator of whether or not the respondent says they know the benefit accrual rate or the level of pension benefits That is they focus on dk responses The relation of numeracy to these outcomes remains significant even when there are controls for other dimensions of cognitive ability and education
12
defined benefit pensions at normal retirement age and are more likely to agree with their firm on
the amount of benefits their DB plan is expected to pay
We do not believe there is strong reverse causality with greater knowledge of pensions
leading to higher pension wealth To be sure greater knowledge may lead to higher contribution
rates to DC plans and more effective investment strategies But it is harder to make the case that a
relationship between knowledge of defined benefit plans and pension wealth is due to reverse
causality Yet for the population approaching retirement age examined in this paper DB plans
represent two thirds of pension wealth The value of a defined benefit plan depends only on the
earnings and experience of the covered worker not on any additional activity that may be
disproportionately undertaken by better informed individuals Nor do we believe that selection into
pension jobs is an important issue Jobs with pensions carry much higher wages which are likely to
have driven the choice of employment when the worker was younger6
The results describing how respondents knowledge of their pensions or Social Security
varies with the respondents level of cognition are not nearly so straight-forward to understand
Indeed taken together these findings contribute to a major puzzle
Consider the coefficient on numeracy in row 1 column 4 of Table 1 A one unit increase in
numeracy which means the individual answered an additional one of the three numeracy questions
increases the probability of a respondent reporting he or she does not know the plan type by 26
percent Of course here the sign is in the wrong direction
To be sure taken by itself this result is not so surprising Ninety-seven percent of
respondents claim they know their plan type So there is little variation in the dependent variable to
6 At the time they joined their firms those approaching retirement age in 2004 faced plan provisions that were quite different from those found in later years Moreover pension jobs especially those offering defined benefit plans were typically in unionized firms and large firms that paid premium wages making the jobs attractive irrespective of the pension offer For further discussion see Gustman Steinmeier and Tabatabai (2010) chapter 2
13
be explained and the perverse sign can be treated as an anomaly It makes no sense that increased
numeracy would increase the number saying they donrsquot know their plan type
Yet a similar relation is found between numeracy and other measures of knowledge of plan
type For example as seen in row 2 column 4 the probability that the respondent and firm agree on
the type of pension plan is lower by 39 percent for those who have greater numeracy That is
greater numeracy leads to a reduction in agreement between respondent and firm reports of plan
type
Nor do the measures of cognition help in explaining other measures of plan type whether
donrsquot know responses or indicators that the respondentrsquos answer is the same as that from the
matched employer plan description Although some coefficients are significant there are no
systematic relations between measures of cognition and plan type that are consistent and plausible
Nor do the coefficients change when pension wealth is no longer included as a covariate Thus it is
not that one set of results or another is ignoring some indirect path from cognition to knowledge of
plan type
One might argue that knowledge of plan type is not an appropriate indicator of knowledge of
onersquos pension That is why we have tried such a wide range of other indicators of pension
knowledge Yet we find no plausibly consistent effect of any of the indicators of cognition on
knowledge of pensions and Social Security
Thus Section B of Table 1 presents analogous results on the relation of cognition to
knowledge of retirement age Once again there are no consistent and plausible relations between
measures of cognition and an indicator of knowledge of a respondentrsquos pension
Section C of Table 1 takes us to indicators of the relation of numeracy to knowledge of
benefit values When covariates are included there is no effect of numeracy on knowledge of plan
values Especially telling here numeracy is not related to knowledge of DC plan values
14
We also include in the last two rows of the table indicators of the respondents knowledge of
their Social Security benefits Counter intuitively the result in the last row of column 4 which
approaches significance suggests that greater numeracy increases the likelihood of saying one
doesnt know Social Security benefits at normal retirement age
So to this point it would appear that although earlier studies have shown that cognition and
numeracy in particular significantly affect wealth held outside of defined benefit pensions and
Social Security they have no effect on knowledge of pensions This result may create some doubt
about the efficacy of the many cognition variables we have examined Given an expectation that
these measures of cognition improve wealth by increasing basic knowledge of financial instruments
one would expect each of these measures TICS (serial 7 and backward counting) word recall and
numeracy to bear a systematic and consistent relation to measures of knowledge of pensions and
Social Security But they do not
So we are left wondering why the measures of knowledge of pensions are influenced so
strongly by pension values but are virtually unaffected by measures of cognition This mystery will
deepen as we examine the joint relation between knowledge of pensions and Social Security
cognition and the value of wealth
15
Table 1 Marginal Effects of Cognition Measures on Pension Knowledge Ages 51-56 in 2004
Dependent Variables Pension DBDC Wealth
TICS (absolute z)
Word Recall (absolute z)
Numeracy (absolute z)
of Obs Pseudo R2
A Indicators of Plan Type
DK plan type 0032 (144)
-0002 (034)
-0002 (037)
0026 (231)
651 02455
R amp firm agree on all plan types (wider restriction)
0164 (292)
0005 (055)
0024 (282)
-0039 (207)
626 01621
R amp firm agree plan is DB
-0025 (029)
-0015 (107)
-0004 (027)
0010 (033)
431 01365
R amp firm agree plan is DC
-0057 (048)
-0013 (057)
0013 (080)
-0005 (016)
404 03418
R reports DB amp firm reports DC plan
-0022 (136)
0004 (108)
-0006 (215)
0006 (094)
527 02644
R reports DC amp firm reports DB plan
-0133 (296)
-0003 (055)
-0002 (040)
0013 (115)
505 02144
B Indicators of Retirement Age
DK- ER age for DB -0062 (116)
-0004 (057)
0003 (046)
-0010 (065)
725 01758
DK- NR age for DB -0003 (010)
0003 (065)
0007 (154)
0005 (052)
725 02320
DK- ER age for DC -0197 (220)
-0008 (091)
0001 (013)
-0011 (063)
1013 01262
R and Firm agree on ER age
0448 (299)
0015 (063)
-0010 (043)
0071 (142)
361 01046
R and Firm agree on NR age
0177 (122)
0023 (097)
-0025 (109)
-0032 (066)
350 00886
C Indicators of Plan Value
DK- NR benefits for DB
-0284 (182)
0016 (074)
0032 (157)
-0018 (041)
729 05286
DK- XP benefits for DB
-0330 (144)
0036 (114)
0014 (042)
-0033 (043)
725 08618
R and Firm agree on expected DB benefits
0201 (431)
-0001 (010)
-0010 (103)
-0017 (076)
350 03854
DK- DC balances 0075 (077)
-0003 (012)
-0023 (115)
-0008 (020)
1076 08087
DK after brackets in 0017 -0000 -0001 0007 1062
16
Dependent Variables Pension DBDC Wealth
TICS (absolute z)
Word Recall (absolute z)
Numeracy (absolute z)
of Obs Pseudo R2
DC balances (141) (016) 024) (125) 03965
DK- SS benefits at ER age
0068 (109)
-0002 (029)
0008 (094)
0019 (107)
2392 00958
DK- SS benefits at NR age
-0009 (015)
-0002 (026)
0004 (049)
0032 (180)
2415 00893
Other covariates include indicators of respondentrsquos union and public employment status measures of TICS Recall and Numeracy for the respondents spouse a series of dummy variables for respondentrsquos education dummy variables indicating whether the respondent is female nonwhite Hispanic age and age squared for respondent and spouse spousersquos school years whether respondent is financially knowledgeable R dummy variables indicating Social Security Wealth on an if claim now basis (lt50000 50000 to100000 omitted 100000 to 150000 150000 to 200000 gt200000) [these measures are due to Kandice Kapinos of the Health and Retirement Study] dummy variables for missing values including those who were proxies whether the respondent answered dk to questions about cognition variables and a dummy if pension wealth is imputed Current pension DB and DC wealth are in millions of dollars DB wealth includes a calculation of the present value of the respondentrsquos expected DB benefits for hisher most important DB plan DC wealth includes the sum of all DC accounts from Rrsquos current job Nine cases who reported they have a DB plan from their current job but that they were receiving benefits currently are excluded z-statistics are reported in parentheses
17
V Relation of Household Wealth to Each Spousersquos Knowledge of Their Pension and Social
Security to Cognitive Ability and to Other Key Covariates
So far we have not been able to find a relation of cognition to knowledge of pensions and
Social Security We have however found a relation between knowledge of pensions and Social
Security and the level of pension wealth There also are the findings of a strong relationship
between cognition and wealth from McArdle Smith and Willis (2009) We put these findings
together by estimating the relation of total wealth to pension and Social Security knowledge
including pension wealth as a covariate Next using a sample comparable to the one we use to
analyze pension knowledge we reestimate the results from McArdle Smith and Willis (2009)
linking wealth to cognition Third we include all three elements in the same regression This will
allow us to answer three questions Does knowledge of pensions and Social Security bear any
systematic relation to non-pension non-Social Security wealth What is the role of pension wealth
in influencing the relation of pension knowledge to other forms of wealth Does knowledge of
pensions and Social Security affect the measured relation between cognition and wealth
To begin estimates in Table 2 relate the wealth of a respondents household to that persons
knowledge of their pensions and Social Security Observations are respondent based with one
observation for each individual member of couple households with at least one of them aged 51 to
56 in 2004 and having a pension Three different measures of wealth alternate as dependent
variables Results for total household wealth (in thousands of dollars) are reported in columns 1 and
2 Findings for the ratio of household wealth to household income are reported in columns 3 and 4
Regressions with total household wealth excluding pensions and Social Security as the dependent
variable are reported in columns 5 and 6 Measures of knowledge of the respondents pension and
Social Security are the same as those discussed earlier
18
The results in Table 2 provide little support for a view that greater knowledge of pensions is
a sign of the kind of greater financial sophistication that would increase retirement wealth Columns
1 3 and 5 of the table report the coefficients of the measure of pension or Social Security
knowledge in the regressions for wealth Only four out of thirty of these measures of knowledge
exhibit coefficients that are significant at or near conventional levels The coefficient in row 1
column 1 suggests that if a person reports not knowing what type of plan their pension is that
person will have $127300 less wealth than persons who say they know their plan type In row 3
column 1 when a respondent and firm agree the plan is defined benefit the total wealth is $93510
higher
However among the four statistically significant results there are also two counter-intuitive
findings Specifically in column 5 rows 4 and 5 if a person indicates not knowing the early or
normal retirement ages for a DB plan household wealth outside of the pension is higher by $67620
and $48570 respectively
Columns 2 4 and 6 report the coefficients estimated for the measures of pension wealth
where this variable is entered into the right hand side of the alternative wealth regressions Looking
down columns 2 and 4 allowing for considerable variation in the coefficient estimates and the fact
that some coefficients differ significantly from 10 each dollar of pension wealth is associated with
roughly another dollar in total wealth This suggests little substitution of pension wealth for other
forms of wealth Respondents do not save less outside of their pension because they have access to
more pension wealth The last column relates total wealth excluding pensions and Social Security to
pension wealth Here the coefficients are significantly greater than zero and suggest that those with
pensions save slightly more in other forms for each dollar of additional pension wealth Again there
is no suggestion of substantial substitution between pensions and other forms of wealth
19
To reconcile the coefficients in columns 2 and 6 note that column 6 tells us how a $1
increase in pension wealth is related to wealth outside of both the pension and Social Security
Column 2 indicates how a $1 increase in pension wealth is related to the sum of pension wealth
Social Security wealth and wealth held outside of pensions and Social Security Thus taking the
result in row 4 it is perfectly consistent to find on the one hand that an additional dollar of pension
wealth raises wealth outside of pensions and Social Security by 116 cents while increasing total
wealth by 839 cents The difference reflects the correlation between pensions and Social Security
One final note Although it might seem that a very limited effect of pension knowledge on total
wealth is the result of holding pension wealth constant the findings are similar when pension
wealth is not included in the equations reported in Table 2
20
Table 2 Marginal Effects of Pension and Social Security Knowledge on Household Wealth Ages 51-56 in 2004 (Note Measures of cognition are not included in these regressions)
Dependent Variable HH Total Wealth
(thousands of dollars)
Dependent Variable Ratio of HH Total Wealth to HH
Income
Dependent Variable HH Total Wealth Excluding Pension amp SS Wealth (thousands of dollars)
Independent Pension Knowledge
Variables
Coefficient for
PensionSS Knowledge
Variable
Coefficient for Pension
Wealth Variable
Coefficient for
PensionSS Knowledge
Variable
Coefficient for (Pension WealthHH
Income) Variable
Coefficient for
PensionSS Knowledge
Variable
Coefficient for Pension
Wealth Variable
A Indicators of Plan Type
DK plan type -12730 (222)
1120 (3030)
033 (059)
0979 (3456)
-2488 (074)
0226 (1036)
R amp firm agree on all plan types (wider restriction)
217 (049)
1100 (2065)
-057 (129)
0996 (1645)
1497 (063)
0180 (629)
R amp firm agree plan is DB
9351 (179)
0985 (996)
033 (065)
0881 (1004)
2595 (104)
0139 (295)
B Indicators of Retirement Age
DK- ER age for DB 7366 (145)
0839 (1103)
006 (013)
0747 (1595)
6762 (253)
0116 (291)
DK- NR age for DB 6707 (115)
0835 (1102)
042 (076)
0749 (1603)
4857 (160)
0105 (266)
C Indicators of Plan Value
DK- NR benefits for DB
4989 (121)
0850 (1110)
054 (140)
0752 (1613)
4667 (214)
0118 (293)
DK- XP benefits for DB
-272 (005)
0837 (1096)
-006 (011)
0748 (1599)
2674 (092)
0103 (260)
R and Firm agree on expected DB benefits
7386 (117)
0912 (779)
-043 (078)
0826 (890)
-1599 (051)
0170 (295)
DK- DC balances -5513 (131)
1411 (2613)
013 (032)
124 (3751)
-2692 (104)
0355 (1077)
DK- SS benefits at ER age
1460 (067)
1092 (2502)
011 (052)
105 (2292)
1101 (085)
0248 (954)
Estimated with robust regression Covariates not listed in the table include an indicator if respondent is female race age and age squared for respondent and spouse a series of dummy variables for respondentrsquos education spousersquos school years whether respondent is financially knowledgeable R if a union member or public employee dummy variables indicating Social Security Wealth on an if claim now basis (lt50000 50000 to100000 omitted 100000 to 150000 150000 to 200000 gt200000) dummy variables for missing values and a dummy if pension wealth is imputed
21
Before presenting wealth equations that include measures of pension knowledge together
with measures of cognition Table 3 provides a second baseline for the wealth regressions by
including only cognition measures and other covariates but not measures of pension knowledge as
explanatory variables The table presents estimates of marginal effects of the three key measures of
cognition on wealth TICS word recall and numeracy In alternative specifications wealth is
measured by non-pension non-Social Security wealth and total wealth The format of the equations
is the same as in McArdle Smith and Willis (2009) except that pension wealth is also included as a
covariate The population underlying the regressions in Table 3 is different from the one used in
their analysis which includes the entire HRS population for 2006 As noted previously to enable us
eventually to include measures of knowledge of pensions and Social Security which are available
for 2004 our sample for all tables is confined to couple households with at least one member 51 to
56 in 2004 In addition so the estimates of the equations used to analyze the relation of cognition to
wealth will be comparable to the samples used to analyze the effects of knowledge of pension plan
type retirement age and plan values the results in Table 3 are confined in one set of regressions to
those who report they are covered by a pension and in another to those HRS respondents for whom
there is a matched employer provided pension plan description
Otherwise these wealth equations are specified as in McArdle Smith and Willis (2009)
Specifically cognition measures are reported separately for the financially knowledgeable
respondent and the spouse Note however that the financially knowledgeable respondent may not
be the member of the household who has a pension What the wealth regressions show is how the
cognition of each spouse is related to the householdrsquos wealth not how the cognition of the spouse
with a pension is related to household wealth
22
None of our major findings are affected by differences between the populations used in the
two studies As in McArdle Smith and Willis (2009) numeracy of the financially knowledgeable
respondent is the dominant determinant of wealth among the six cognition measures shown7
From row 3 columns 1 and 2 of Table 3 a one unit increase in the numeracy score for a
financially knowledgeable respondent is associated with an additional $26000 in wealth
accumulated outside of the pension and Social Security From columns 3 and 4 among the
population with a pension higher numeracy for the financial R also increases the total wealth of the
household But it does not have a significant effect on total wealth within the population of those
who have a matched employer pension
7 Although not reported here we built a bridge between the wealth equations in McArdle Smith and Willis (2009) and those in this paper Given the number of differences in the underlying samples this bridge involves changing the specification of the wealth equation one difference at a time We are grateful to Jim Smith who provided the information required to duplicate the initial results from McArdle Smith and Willis (2009)
23
Table 3 Marginal Effects of Measures of Cognition and Current Pension on Household Wealth Ages 51-56 in 2004 (Wealth is measured in thousands of dollars)
Wealth Excluding Pensions and Social Security
Wealth Including Pensions and Social Security
Independent Variables Rs with Pension Rs with matched pension
Rs with Pension Rs with matched pension
(1) (2) (3) (4) Financial R TICS -617
(149) -490 (080)
-294 (043)
733 (067)
Word Recall -945 (242)
176 (030)
-680 (105)
-091 (009)
Numeracy 2654 (323)
2628 (208)
3169 (232)
1213 (054)
Non-Financial R TICS -404
(099) -365 (058)
307 (045)
-1221 (109)
Word Recall 1145 (286)
988 (166)
1767 (266)
3178 (302)
Numeracy 1556 (169)
2715 (197)
2176 (142)
1941 (080)
Covered Worker Current Pension Wealth 0139
(692) 0126 (453)
0942 (2820)
0949 (1939)
Estimated with robust regression Covariates not listed in the table include indices for female financial R Hispanic non-white household total income and its square respondentrsquos and hisher spousersquos age and their squares respondentrsquos and hisher spousersquos education t-statistics are reported in parentheses
24
The next step is to enter measures of cognition and pension and Social Security knowledge
in the same regressions for wealth Table 4 relates wealth excluding pensions and Social Security to
these measures Table 5 relates total wealth including pensions and Social Security to cognition
and measures of pension knowledge Given the effect of pension value on pension knowledge and
the relation of pension value to nonpension non-Social Security wealth the level of pension wealth
is included as a covariate in each equation Other covariates are listed below the table
The results are divided into three sections coefficients for the cognition measures for the
financially knowledgeable respondent coefficients for the cognition measures for the spouse who is
not the financially knowledgeable respondent and under the title Covered Worker measures of
pension knowledge exhibited by the worker who is covered by a pension Once again there are
three different sets of measures of pension knowledge ndash those pertaining to plan type those
pertaining to retirement age and those pertaining to plan value
There are three clear conclusions from the results in both tables First as seen in rows 3 and
6 of each table numeracy of the financially knowledgeable respondent followed by numeracy of
the nonfinancial respondent are the major cognitive determinants of wealth Second from Table 4
row 7 pension wealth is associated with a higher level of non-pension non-Social Security wealth
Third in a few cases greater pension knowledge is associated with higher wealth with some
variables bordering on significance But for the most part pension knowledge is not a major
determinant of either wealth held outside of the pension plan or of total wealth
Given the weak relation between measures of knowledge of pensions to measures of
cognition it is not surprising that the coefficients on knowledge variables are not affected when
measures of cognition are added to wealth regressions and coefficients on measures of cognition
are not affected when measures of pension and Social Security knowledge are added to wealth
regressions It is not just that the insignificant variables measuring the effects of pension knowledge
25
on wealth in say Table 2 column 5 remain insignificant when measures of cognition are added to
the regression It is that the coefficients on the cognition variables remain unchanged when
measures of pension knowledge are added to the regression This can be seen by comparing Table
3 column 2 with Table 4 column 1
Notice that within Tables 4 and 5 the coefficients on numeracy and on pension wealth
bounce around among regressions Further examination suggests it is not the differences in
covariates among regressions that is responsible Rather it is differences in samples that are
responsible The samples are restricted by the definition of the pension knowledge variable Column
1 includes those with a pension and matched employer pension plan description The sample in
columns 2 and 3 include those with a pension who report having a defined benefit plan In column
4 respondents have a matched employer plan description and a defined benefit plan Column 5
includes those with a defined contribution plan The sample for column 6 requires that the
respondent report expecting Social Security benefits
To summarize although the specifications relating pension knowledge to wealth outside of
pensions and Social Security do not suggest a relation between measures of pension knowledge and
other forms of wealth they all suggest that numeracy bears a significant relation to wealth outside
of pensions and Social Security As a consequence including measures of pension knowledge has
little or no effect on the estimated relation between measures of numeracy and wealth
26
Table 4 Marginal Effects of Measures of Financial Knowledge and Cognition on Household Wealth Excluding Pensions and Social Security Ages 51-56 in 2004 (Wealth is measured in thousands of dollars)
(1) (2) (3) (4) (5) (6) Financial R TICS -473
(077) -818 (140)
-922 (157)
-936 (113)
-447 (081)
-789 (166)
Word Recall 041 (007)
-559 (101)
-505 (091)
1026 (123)
-1193 (234)
-979 (221)
Numeracy 2637 (211)
2991 (254)
3164 (268)
1955 (109)
3350 (321)
3094 (334)
Non-Financial R TICS -351
(056) -641 (115)
-715 (127)
-037 (004)
-654 (119)
-449 (098)
Word Recall 923 (156)
1416 (255)
1478 (265)
937 (112)
1016 (192)
1106 (253)
Numeracy 2907 (211)
791 (062)
868 (068)
3634 (195)
2206 (185)
1669 (165)
Covered Worker Current pensionDBDC wealth
0120 (434)
0049 (137)
0045 (126)
0107 (192)
0251 (796)
0156 (639)
DK-Plan Type -2088 (040)
- - - - -
R and Firm Agree on All Plan Types (Wider Restriction)
1052 (040)
- - - - -
R and Firm Agree Plan is DB
1007 (042)
- - - - -
DK-ER Age for DB - 3680 (152)
- - - -
DK- expected DB benefit - - 6266 (146)
- - -
R amp firm agree on expected DB benefits
- - - -2880 (095)
- -
DK-DC Balances - - - - -6444 (179)
-
DK-ER Age for DC Plan - - - - -2142 (114)
-
DK- SS Ben at ER age - - - - - 764 (050)
DK- SS Ben at NR age - - - - - -339 (021)
Estimated with robust regression The dependent variable is household wealth excluding Social Security and pension benefits Covariates not listed in the table include indices for female financial R Hispanic non-white household total income and its square respondentrsquos and hisher spousersquos age and their squares and respondentrsquos and hisher spousersquos education t-statistics are reported in parentheses
27
Table 5 Marginal Effects of Measures of Financial Knowledge and Cognition on Total Household Wealth Ages 51-56 in 2004 (Wealth is measured in thousands of dollars)
Financial R (1) (2) (3) (4) (5) (6)
TICS 705 (065)
-1416 (128)
-1486 (134)
-1197 (078)
414 (047)
-270 (035)
Word Recall -288 (028)
-1031 (098)
-983 (094)
-1103 (072)
-753 (091)
-715 (100)
Numeracy 920 (042)
5578 (250)
5715 (256)
2784 (085)
4332 (257)
4030 (268)
Non-Financial R TICS -898
(081) 404
(038) 357
(034) 451
(029) 503
(057) 275
(037) Word Recall 3131
(300) 2937 (279)
2942 (280)
2752 (180)
1678 (197)
1836 (259)
Numeracy 2218 (091)
064 (003)
-016 (001)
4039 (118)
4252 (221)
2662 (163)
Covered Worker Current pensionDBDC wealth
0942 (1929)
0689 (1014)
0691 (1018)
0755 (738)
1262 (2479)
0901 (2274)
DK-Plan Type -5933 (064)
- - - - -
R and Firm Agree on All Plan Types (Wider Restriction)
-853 (018)
- - - - -
R and Firm Agree Plan is DB
6880 (162)
- - - - -
DK-ER Age for DB - 1934 (042)
- - - -
DK- Expected DB Benefit
- - 5843 (072)
- - -
R amp Firm Agree on Expected DB Benefits
- - - 590 (011)
- -
DK-DC Balances - - - - -6713 (115)
-
DK-ER Age for DC Plan - - - - -8039 (266)
-
DK- SS Ben at ER age - - - - - 1673 (067)
DK- SS Ben at NR age - - - - - -740 (028)
Estimated with robust regression The dependent variable is household wealth including Social Security and pension benefits Covariates not listed in the table include indices for female financial R Hispanic non-white household total income and its square respondentrsquos and hisher spousersquos age and their squares and respondentrsquos and hisher spousersquos education t-statistics are reported in parentheses
28
VI Conclusions and Policy Implications
Our initial hope in undertaking this paper was to shed further light on the role of
cognition and in particular of numeracy in shaping wealth accumulated for retirement
We thought that a part of the link between cognition and wealth reflected the fact that
higher cognition leads to increased knowledge of retirement finances which in turn leads
to higher wealth This idea was strengthened not only by findings in the literature on the
relation of cognition and especially numeracy to wealth but also by earlier findings
linking pension knowledge to pension wealth and a failure to find a reduction in non-
pension saving to correspond with higher pension wealth
We have not succeeded in establishing these linkages Although we confirm the
finding in the literature that higher cognition and in particular greater numeracy is
associated with the accumulation of additional retirement wealth we also find the initial
evidence that more numerate individuals better understand their pensions or Social
Security to be very fragile Nor do we find evidence linking cognition or numeracy to
wealth accumulation in association with increased knowledge of pensions and Social
Security Moreover we do not find that the substitution of pensions for other forms of
wealth varies with knowledge of pensions
Instead we find that many of the questions as to the avenues through which
cognition and numeracy increase retirement wealth remain unanswered As a result we
remain unsure of how best to use the apparently robust numeracy-wealth relation in
designing policies that are aimed at increasing retirement saving
To be sure many people do not have an incentive to understand their pensions
and Social Security even when reaching their early or mid-fifties For some their plans
29
are not sufficiently valuable to pay much attention For others their retirement is assured
due to a generous pension that does not require monitoring Perhaps most importantly for
those currently approaching retirement age the largest share of their pension wealth
remains in defined benefit plans where typically there is little for an individual to do in
order to increase retirement benefits
But shouldnrsquot greater numeracy that leads to greater wealth accumulation also
have created greater financial acumen which is then reflected indirectly as increased
knowledge of pensions When the finding that those with pensions are motivated to
accumulate higher balances outside of their pensions and Social Security was uncovered
in the literature it was argued that those with pensions learn from their providers about
the need for retirement saving and perhaps increased their understanding of how wealth
accumulation works Yet knowledge of pensions and Social Security does not affect
saving behavior
Why does numeracy play an important role in influencing saving even holding
income constant while knowledge of pensions plays none
When combined with findings from our earlier studies many puzzles remain In
previous work (Gustman and Steinmeier 2001) we found that those who overestimate the
values of their pensions and Social Security in the years before retirement nevertheless do
not eventually change their saving or retirement behavior by saving more over the next
eight years or retiring later Nor do those who understate their plan values change their
behavior Accordingly they must eventually adjust their consumption
It is not that people are totally clueless about the incentives created by their
retirement plans An extensive retirement literature is characterized by a strong response
30
of retirement to incentives from pensions and Social Security (eg Gustman and
Steinmeier 2005b) Moreover changes in Social Security rules designed to encourage
delayed retirement have clearly had predicted effects on retirement (Gustman and
Steinmeier 2009) One would certainly expect that it is easier for those with higher
cognition to understand these complex rules But we have been unable to find a direct
link empirically from cognition through measures of knowledge of pensions and Social
Security to accumulated wealth
We have tried a variety of specifications to ensure that the absence of a link
between knowledge of pensions and Social Security and numeracy and the knowledge
variables and wealth is not due to a particular specification we have adopted We have
tried specifications with and without pension wealth included as a covariate If there is no
link we are left with a list of questions Accepting the relation between numeracy and
wealth what exactly is the mechanism by which numeracy affects wealth What
calculations or behavior does numeracy affect that are not ultimately reflected in pension
or Social Security knowledge
Policy Implications
Our findings raise questions about the avenues through which cognition and
numeracy increase retirement wealth Accordingly our analysis raises questions about
whether the apparently robust numeracy-wealth relation provides a basis for designing
policies that are aimed at increasing retirement saving by increasing numeracy or
financial literacy
Financial education would seem to be a basic policy that would allow those with
lower levels of numeracy to nevertheless save adequately for their retirement The
31
numeracy-wealth relation which remains even after standardizing for the differences in
earnings that result from higher numeracy seems to suggest that those with higher
numeracy have an easier time accumulating knowledge of financial instruments
understanding risk and appreciating the need for and the best ways to accumulate
retirement saving But our findings suggest the numeracy-wealth relation may reflect
something else Perhaps numeracy reflects an unmeasured characteristic of the individual
that cannot be learned but does generate higher wealth If nothing else these findings
suggest a good deal of caution is warranted before assuming that classes in financial
basics tutorials or other efforts to convey financial knowledge will induce appropriate
saving habits choices in the face of risk or a proper approach to spending down assets
after retiring Although these policy initiatives may well ultimately encourage additional
saving they should be carefully and rigorously evaluated on an individual basis before
financial education and training programs are adopted on a significant scale
32
References
Banks James and Zoe Oldfield 2007 ldquoUnderstanding Pensions Cognitive Function Numerical Ability and Retirement Savingrdquo Fiscal Studies 28(2)143-170
Cagan Phillip 1965 The Effect of Pension Plans on Aggregate Savings New York National Bureau of Economic Research
Gerardi Kristopher Lorenz Goette and Stephan Meier 2010 ldquoFinancial Literacy and Subprime Mortgage Delinquency Evidence from a Survey Matched to Administrative Datardquo Social Science Research Network
Gustman Alan L and Thomas L Steinmeier 1993 Pension Portability and Labor Mobility Evidence from the Survey of Income and Program Participation Journal of Public Economics 50 299-323
_______________ 1999 Effects of Pensions on Savings Analysis with Data from the Health and Retirement Study Carnegie-Rochester Conference Series on Puble Policy 50 271-324
_______________ 2001 ldquoImperfect Knowledge Retirement and Savingrdquo Michigan Retirement Research Center Working Paper UM00-08
_______________ 2005a ldquoImperfect Knowledge of Social Security and Pensionsrdquo Industrial Relations 44(2) 373 -395
_______________ 2005b ldquoThe Social Security Early Retirement Age In A Structural Model of Retirement and Wealthrdquo Journal of Public Economics 89( 2-3) 441shy463
_______________ 2009 How Changes in Social Security Affect Recent Retirement Trends Research on Aging 31(2) 261-290
Gustman Alan L Thomas L Steinmeier and Nahid Tabatabai 2010 Pensions in the Health and Retirement Study Harvard University Press
Katona George 1965 Private Pensions and Individual Savings Ann Arbor Survey Research Center Institute for Social Research University of Michigan
Lusardi Annamaria and Olivia S Mitchell 2006 ldquoFinancial Literacy and Planning Implications for Retirement Wellbeingrdquo MRRC Working Paper No 2006-144 _______________ 2007 ldquoBaby Boomer Retirement Security The Role of Planning Financial Literacy and Housing Wealthrdquo Journal of Monetary Economics 54 205-224
McArdle John J James P Smith and Robert Willis 2009 ldquoCognition and Economic Outcomes in the Health and Retirement Surveyrdquo NBER Working Paper 15266
Ofstedal Mary Beth Gwenith G Fisher and A Regula Herzog 2005 ldquoDocumentation of Cognitive Functioning Measures in the Health and Retirement Studyrdquo HRS Documentation Report DR-006 Institute for Social Research Ann Arbor University of Michigan
Rohwedder Susann and Kristin J Kleinjans 2006 ldquoDynamics of Individual Information about Social Securityrdquo Rand
Stango Victor and Jonathan Zinman 2009 ldquoExponential Growth Bias and Household Financerdquo Journal of Finance 64(6) 2807-2849
33
Appendix 1 Measures of Cognition Demographic Characteristics Income and Wealth
in Different HRS Subsamples
Appendix Table 1 provides descriptive statistics for indicators of cognition
demographic characteristics income wealth and other variables used in our analyses
Column 1 shows the means and standard deviations for the full sample of couple
households with at least one member aged 51 to 56 in 2004 The columns that follow
restrict the sample to those with a pension those with a matched employer pension plan
description those with a defined benefit plan those with a defined contribution plan and
those expecting Social Security benefits at the early or normal retirement age
As can be seen by selecting a row and comparing means across the columns of
Appendix Table 1 there is not much variation in the independent variables as the sample
is restricted to those with a pension those with a pension who also have a matched
employer plan those with a DB plan and those with a DC plan To be sure as seen in the
first six rows of the table cognition measures are slightly higher for those with pensions
than for the general population of couple households However restricting the
populations to those with a matched employer plan those claiming a DB pension or
those with a DC pension does not have a systematic effect on the cognition variables
The means of some demographic measures do differ across populations For
example because Hispanics have lower pension coverage than whites or blacks they are
a smaller share of the pension covered population than of the overall population Income
also varies with sample composition Those with a pension have higher incomes than
those without a pension and those with a defined benefit (DB) pension have higher
incomes than those whose pension is not DB Also importantly total wealth is higher
34
among households with a pension and total wealth is lower among those households with
a DB pension On the whole the various sample restrictions have relatively modest
effects on the means of listed variables
35
Appendix Table 1 Selected Measures of Cognition Demographic Status Income and Wealth for Members of Two Person Households Health and Retirement Study Respondents Aged 51-56 in 2004 (Means and Standard Deviations in Various Subsamples)
Independent Variables All Rs (51-56)
Rs with Pension
Rs with Matched Pension
Rs with Any DB
Rs with Any DC
Rs Expecting SS Benefits At ER age
Rs Expecting
SS Benefits At NR age
Financial R TICS 537
(168) 555
(161) 547
(166) 553
(161) 562
(157) 552
(161) 551
(161) Word Recall 546
(146) 566
(135) 574
(134) 569
(133) 570
(134) 557
(142) 556
(142) Numeracy 143
(096) 158
(094) 162
(095) 163
(091) 161
(093) 153
(094) 153
(094) Non-Financial R TICS 481
(182) 507
(172) 510
(170) 506
(171) 515
(171) 507
(175) 506
(175) Word Recall 540
(145) 557
(134) 566
(137) 561
(140) 561
(138) 550
(148) 550
(148) Numeracy 106
(093) 119
(093) 121
(093) 120
(093) 123
(094) 120
(091) 120
(091) All Female 050
(050) 047
(050) 056
(050) 047
(050) 046
(050) 054
(050) 054
(050) Hispanic 014
(035) 009
(028) 009
(029) 008
(028) 008
(027) 012
(033) 012
(032) Non-white 015
(036) 015
(036) 015
(036) 017
(037) 014
(035) 014
(035) 014
(035) Rrsquos age 5360
(523) 5310 (419)
5304 (414)
5320 (408)
5295 (423)
5289 (398)
5297 (408)
Spousersquos age 5360 5335 5366 5337 5314 5354 5354
36
Independent Variables All Rs (51-56)
Rs with Pension
Rs with Matched Pension
Rs with Any DB
Rs with Any DC
Rs Expecting SS Benefits At ER age
Rs Expecting
SS Benefits At NR age
(523) (50) (478) (510) (505) (534) (532) Rrsquos of school years 1320
(310) 1411 (239)
1457 (232)
1430 (237)
1413 (236)
1354 (279)
1354 (279)
Rrsquos spousersquos of school years
1320 (310)
1386 (247)
1412 (238)
1391 (243)
1391 (242)
1348 (282)
1348 (282)
HH total income 1032 (1346)
1253 (1486)
1249 (1337)
1321 (1691)
1220 (1186)
1122 (1464)
1121 (1461)
HH Wealth excluding pension and SS wealth
4323 (1052)
4668 (1074)
4480 (832)
4368 (832)
4750 (1110)
4791 (1111)
4581 (1109)
HH Wealth including pension and SS wealth
8396 (1165)
9753 (1205)
10027 (982)
10017 (966)
9863 (1246)
8791 (1221)
8797 (1218)
N 3418 1520 639 743 1078 2398 2415 Standard deviations are in parenthesis In 1000 dollars
37
Appendix Table 2 has three sections Part A describes the underlying populations
according to employment pension and Social Security coverage availability of matched
pension plan descriptions from employers or Social Security records and reported
outcomes Part B reports means of measures of knowledge of pensions Part C does the
same for measures of knowledge of Social Security Given interest in the roles played in
households by the spouse who is financially knowledgeable (as identified by the
household) and important remaining differences between outcomes for men and women
the table separates the results both according to whether the household labels the
respondent as the financially knowledgeable respondent (labeled as Financial R) or the
other member of the household (Non-Financial R) The table also reports each of these
outcomes by the sex of the respondent Note also that in Appendix Table 2 the sample
sizes differ as we move down the rows These differences in sample composition should
be borne in mind
As can be seen in Appendix Table 2 Section A row 3 78 percent of men from
couple households and 69 percent of women held a job in 2004 From row 5 60 percent
of employed men and 61 percent of employed women from couple households reported
coverage by a pension From row 7 35 percent of men reporting a pension and 50
percent of women had a matched employer pension plan in 2004 About half of
respondents with a pension on their current job report they have a defined benefit plan
Around 73 percent of men and 68 percent of women reported having a defined
contribution (DC) plan Because many individuals have both a defined benefit and a
defined contribution pension the total of the share of those with pensions holding a
38
defined benefit plan and the share of those with pensions holding a defined contribution
plan exceeds 10 Moving toward the bottom of Section A of the table in couple
households 60 percent of men and 61 percent of women have a matched Social Security
record
39
Appendix Table 2 Descriptive Data Regarding Pension Coverage and Pension Knowledge Couple Households Health and Retirement Study Early Boomer Cohort in 2004
All Financial R Non-Financial R
All Males Females All Males Females All Males Females Part A Indicators of Employment Coverage Plan Type Matched Employer and Social Security Data
Total 3418 1708 1710 1709 1041 668 1709 667 1042 Number Employed 2510 1325 1185 1297 824 473 1213 501 712 Employed 73 78 69 76 79 71 71 75 68 Number Reporting Current Pension
1520 801 719 818 524 294 702 277 425
Percent Reporting Current Pension
61 60 61 63 64 62 58 55 60
Number Reporting Matched Employer Pension
639 280 359 340 197 143 299 83 216
Percent Reporting Matched Employer Pension
42 35 50 42 38 49 43 30 51
Percent (of R with current pension) Reporting DBcomb
49 50 48 52 52 51 46 45 46
Percent (of R with current pension) Reporting DCcomb
71 73 68 73 75 70 68 70 67
Number with Matched Social Security Data
2068 1029 1039 1068 664 404 1000 365 635
Percent with Matched Social Security Data
61 60 61 62 64 60 59 55 61
Number Expecting Social Security benefit
2647 1292 1355 1313 780 533 1334 512 822
Percent Expecting Social Security benefit
77 76 79 77 75 80 78 77 79
Part B Indicators of Pension Knowledge Percent (of R with current pension) Reporting DK Plan Type
3 2 3 2 2 2 4 3 4
Number Firm and Respondent 565 248 318 298 172 126 267 76 191
40
Report of Plan Type Agree ((broader restriction) Percent (of R with matched pension) Firm and Respondent Report of Plan Type Agree (broader restriction)
90 89 89 88 87 88 89 92 88
Number Firm and Respondent Report of Plan Type Agree (narrower restriction)
170 68 102 79 47 32 91 21 70
Percent (with matched pension) Firm and Respondent Report of Plan Type Agree (narrower restriction)
27 24 28 23 24 22 30 25 32
Percent (with matched pension) Reporting DB only with Matched DB only
10 11 10 9 11 8 11 11 11
Percent (with matched pension) Reporting DC only with Matched DC only
16 16 16 15 15 15 17 18 17
Percent with DBcomb Reporting DK on Early Retirement Age
9 7 12 7 7 7 12 9 15
Percent with Matched DBcomb Agreeing on Early Retirement Age (On Diagonal)
41 45 37 40 46 32 41 43 41
Percent with DBcomb Reporting DK on Normal Retirement Age
7 5 10 5 4 7 9 5 11
Percent with Matched DBComb Agreeing on Normal Retirement Age (On Diagonal)
34 37 32 36 41 28 33 28 35
Percent (of R with DBcomb) 5 4 7 3 3 4 8 6 9
41
with DB Reporting DK on Expected Retirement Age Percent (of R with DBcomb) Reporting DK on Normal Retirement Benefits
42 34 52 38 30 52 48 42 51
Percent with DBComb Reporting DK on Expected Retirement Benefits
40 31 51 37 28 52 45 37 50
Percent with Matched DB Agreeing on Benefits at Expected Retirement Age (On Diagonal)
18 20 16 21 23 19 13 13 13
Percent (of R with DCcomb) Reporting DK on Early Retirement Age
13 10 18 10 7 16 18 15 20
Percent (of R with DCcomb) Answering DK on Account Balance
34 30 39 31 28 35 38 32 41
Percent (of R with DCcomb) Answering DK after Brackets on Account Balance
11 10 12 11 11 12 11 9 12
Part C Indicators of Social Security Knowledge Percent (R expecting SS benefits) Reporting DK on Early Retirement Benefit
37 28 45 32 26 42 42 32 48
Percent (R expecting SS benefits) Reporting DK on Normal Retirement Benefit
32 23 40 28 21 38 36 26 42
Includes only those who provided a normal retirement age Includes under dk those who could not provide an expected retirement age Rs expecting benefits based on own work andor spousersquos work are included Source Gustman Steinmeier and Tabatabai (2010)
42
Next we turn to the many measures of knowledge of pensions in Part B of
Appendix Table 2 Together these measures confirm our findings from earlier work ndash the
glass is half full half empty If we look at the fraction of the relevant populations who
can call their plan type ages of retirement or plan value on average they do not do too
badly But if we look at measures of agreement between individual reports and relevant
values obtained from employer plan descriptions typically less than half fall on a
diagonal indicating the respondent report and value obtained from the employer plan
description agree More specifically plan values are reported in the following ranges all
in thousands of dollars 20-40 40-60 60 to 80 80-110 110-150 150 to 190 190-240
240-300 gt300 Plan values from respondents and firms are said to agree if both reports
fall within the same range
We begin with indicators of knowledge of plan type A simple ldquodonrsquot knowrdquo
report is not a helpful place to start As seen in Part B row 1 only 3 percent of
respondents report they do not know their plan type As a result it is unlikely that this
measure is a very interesting dependent variable Nor is it very helpful in explaining
variation in wealth
Other measures of pension knowledge are more interesting however If the
measure of correctly identifying plan type is whether when the firm reports a defined
benefit plan so does the respondent as seen in row 3 of part B agreement is obtained in
roughly 90 percent of the cases That is according to this broad definition of a match if
either the worker or firm reports both (DB and DC) plan types while the other reports
only one plan type we consider this to be a match However using a narrower definition
of plan type where a match requires that both the respondent and firm record indicate the
43
plan is DB only DC only or both only 24 percent of men and 28 percent of women in
couple households agree with their employer report of plan type Regarding the specifics
if the respondent reports a pension that is defined benefit or combination the matched
plan description is defined benefit or combination in 58 percent of the cases The
comparable match rate is 49 percent when the respondent reports the plan is DC or
combo In the case of reported plan type there is little difference between financially
knowledgeable respondents or those who are not labeled as financially knowledgeable
respondents However note that each person is talking about their own pension not their
spousersquos pension
Age of eligibility for benefits is another key characteristic of pensions Of those
reporting a defined benefit or combination pension 7 percent of males from couple
households and 12 percent of females from couple households report they do not know
at what age they will become eligible for early retirement benefits Yet for those
reporting a defined benefit pension whose employer agrees the plan is DB there is
agreement between early retirement age reported by respondents and early retirement
calculated from matched firm plan descriptions for 45 percent of males from couple
households and 37 percent of females Turning to normal retirement ages among those
reporting coverage by a defined benefit pension 5 percent of males from couple
households and 10 percent of females report they do not know their normal retirement
age There is agreement on normal retirement age for those with a DB plan between the
respondent report and the value computed from plan description for 37 percent of males
from couple households and 32 percent of women Among financially knowledgeable
respondents women (28 percent agreement with plan descriptions) know less than men
44
(41 percent agreement) about the normal retirement age of their defined benefit pension
Among those who are not the financially knowledgeable respondent women (35 percent
agreement with plan description) know more than men (28 percent) about the normal
retirement age from their defined benefit plans
Skipping to the third row from last in Part B of Appendix Table 2 when those
with defined contribution plans are asked about the age at which they will become
eligible for early retirement benefits 10 percent of men and 18 percent of women report
they do not know
Respondents exhibit similar limitations in their knowledge of benefit amounts as
they did in their knowledge of age of retirement Of those reporting they were covered by
a defined benefit pension 34 percent of men and 52 percent of women from couple
households report they do not know the value of the benefits they will receive from their
plan at normal retirement age In a small minority of cases the benefit at expected
retirement age matches the benefit obtained from employer plan descriptions The match
rates are 20 percent for males from couple households and 16 percent for females from
couple households
For males and females from couple households and females reporting coverage by
a defined contribution pension 30 percent of men and 39 percent of women answer they
do not know what the balance is in their defined contribution pension However most of
these are willing to report their account balance in the form of a bracket which does not
require them to report an exact amount Among those reporting a DC plan 10 percent of
males from couple households and 12 percent of females from couple households report
45
they do not know their plan balances even after presented with ranges of account
balances as an alternative to having to report exact amounts
Having received a report from the Social Security Administration increases the
information available to the respondent Today benefit reports are mailed annually to
respondents Nevertheless some respondents still report they do not know what their
Social Security benefits will be at early retirement age More specifically from Part C of
Table 3 28 percent of men from couple households and 45 percent of women from
couple households report not knowing their Social Security benefits at early retirement
even when given the opportunity to provide an answer in the form of brackets 8
There are similar results concerning benefits at normal retirement age For men
and women from couple households the percent reporting DK are 23 percent and 40
respectively
8 In examining knowledge of Social Security benefits Rohwedder and Kleinjans (2006) consider the changes in knowledge over time They find that HRS respondents do better in reporting Social Security wealth as they approach retirement They conclude that respondents who retired when they planned do a good job of reporting Social Security wealth However a minority misreports their wealth with 17 percent of their sample over or understating their future benefits by 20 percent or more
46
Appendix 2 Variables Used in the Analysis
Variable name Definition
Knowledge Variables DK- Plan type R doesnrsquot know plan type R and firm agree on all plan types (broad restriction)
If self-rep=DBcombamp firm-rep=DBcomb or If self-rep =DCcomb amp firm-rep =DCcomb
Firm and R agree plan is DB
Firm reports DB only self-report DB only
Firm and R agree plan is DC
Firm reports DC only self-report DC only
Firm reports DC amp self-rep DB
Firm reports DCcomb self-report DBcomb
Firm reports DB amp self-rep DC
Firm reports DBcomb self-report DCcomb
DK-ER age for DB R reports dk on the early retirement age for the most important DBcomb plan
DK-NR age for DB R reports dk on the normal retirement age for the most important DBcomb plan
DK-ER age for DC R reports dk on the early retirement age for the most important DC plan
DK-DC balances R reports dk on account balances for the most important DC plan
DK after brackets in DC R reports DK after bracket questions for DC account balances R amp Firm agree on NR age Firm-rep of normal retirement age agrees with self-report within
ranges of 2 years for the most important DBcomb plan DK-XP benefits for DB R reports dk on the benefits at expected age of retirement for
the most important DBcomb plan R amp Firm agree on expected DB benefits
Firm-rep of benefits at expected age of retirement agrees with self-rep for the most important DBcomb plan
DK-SS benefits at ER age R reports dk on social security benefits at early retirement age DK-SS benefits at NR age R reports dk on social security benefits at normal retirement age Current pension wealth Sum of DB wealth and DC balances Current DB wealth Self-rep expected DB benefits from current job Current DC wealth DC balances from current job Cognition Variables TICS Sum of series 7 and backward counting - Sum of correct
answers average for the missing Word recall Average of immediate +delayed recall- Missing values replaced
with the average Numeracy Sum of dummies for 10 chance winning lott and interest on
savings calculations- Each dummy if correct=1 else=0
47
Variable name Definition
sTICS Spousersquos tics sWord recall Spousersquos Word recall sTotal numeracy Spousersquos total numeracy Ddel Dummy var for delayed recall Dimm Dummy var for immediate recall dbwc20 Dummy var for backward counting dser7 Dummy var for series 7 Mischnc Dummy var for missing chance of getting disease Miswnn Dummy for missing Winning lottery Misntrst Dummy for missing interest on savings Other Covariates Public Dummy for if public employee Mispubl Dummy for missing public employee variable Dunion Dummy for union employee Misunion Dummy for missing union employee Dontwrk Dummy for not working Rs Rage Rrsquos age Sage Spousersquos age Rage squar Rrsquos age square Sage square Spousersquos age square Total income Total household income -- used in wealth equations Total income square Total household income square -- used in wealth equations Female Dummy for gender Hispanic Dummy var for hispanic Nonwhite Dummy var for non-white Finr Financial respondent Rschlyrs Rrsquos number of years of education -- used in wealth equations Sschlyrs spousersquos number of years of education -- used in both wealth amp
knowledge equations Dropout If did not finish high school -- used in knowledge equations Somecol R has some college education -- used in knowledge equations Colgrad R has a college degree -- used in knowledge equations Postgrad R has more than a college degree -- used in knowledge
equations Snopen Dummy for spouse with no pension Snomatchspd Dummy for spouse with no matched spd sswca50 SS wealth if claim now le 50k -- used in knowledge equations sswca100 SS wealth if claim now lt= 100k gt 50k -- used in knowledge
equations sswca150 SS wealth if claim now lt= 150k gt 100k -- used in knowledge
equations sswca200 SS wealth if claim now lt= 200k gt 1500k -- used in knowledge
48
Variable name Definition
equations sswca201 SS wealth if claim now gt 200k -- used in knowledge equations dmsswca Dummy var for missing ss wealth at claim now age -- used in
knowledge equations
49
Financial Knowledge and Financial Literacy at the Household Level
Abstract
This paper uses data from the Health and Retirement Study to explore the mechanism that underlies the robust relation found in the literature between cognitive ability and in particular numeracy and wealth income constant We have a number of findings First the more valuable the pension the more knowledgeable are covered workers about their pensions We suggest that causality is more likely to run from pension wealth to pension knowledge rather than the other way around Second most measures of cognitive ability including numeracy are not significant determinants of pension and Social Security knowledge Third standardizing for incomes and other factors a pension of higher value does not substitute for other forms of wealth Rather counting pensions in total wealth those with more valuable pensions save more for retirement other things the same Fourth there is no evidence that wealth held outside of pensions is influenced by knowledge of pensions
In sum numeracy does not influence wealth in whole or in part by affecting financial knowledge of ones pension plan where financial knowledge of the pension then influences other decisions about retirement saving
These findings raise questions about the mechanism that underlies the relation between cognition especially numeracy and wealth From a policy perspective they suggest that the numeracy-wealth relation should not be taken as evidence that increasing financial literacy will increase the wealth of households as they enter into retirement
Authorsrsquo Acknowledgements
This research was supported by a grant from the US Social Security Administration (SSA) through the Michigan Retirement Research Center under grant number UM10-12 Measures of knowledge of pensions and Social Security are drawn from our recent book Pensions in the Health and Retirement Study based on work principally supported by NIA grant R01 AG024337 ldquoBehavioral Analysis in Structural Retirement Modelsrdquo The findings and conclusions expressed are solely those of the authors and do not represent the views of SSA NIA or the MRRC We are grateful to James Smith and Jonathan Zinman for suggestions and comments
I Introduction
Pensions and Social Security together account for half the wealth of those approaching
retirement age Thus one would expect knowledge of pensions and Social Security to play a central
role in shaping the financial decisions made by those in their early to mid-fifties In addition recent
studies confirm a link between numeracy and household wealth (Lusardi and Mitchell 2006 Banks
and Oldfield 2007) Indeed measures of numeracy based on simple questions testing the ability to
calculate fractions percentages and compounding seem to dominate more elaborate measures of
cognition in explaining the wealth of those approaching retirement age (McArdle Smith and Willis
2009)2 Thus one would suspect there is a link between numeracy and knowledge of pensions and
Social Security so that holding the influence of cognition on earnings constant each plays a role in
shaping the accumulation of retirement wealth
To learn more about these potential relationships we use the Health and Retirement Study
to create a number of measures of knowledge of pensions and Social Security We then demonstrate
that knowledge of pensions is higher where the value of the pension is higher Next we consider the
relation of cognition to pension knowledge with special emphasis on the role played by numeracy
Following that we relate wealth held outside of pensions and Social Security to measures of
2 McArdle Smith and Willis describe a set of measures of the various dimensions of cognitive ability being developed as part of an ongoing survey that is complementary to the Health and Retirement Study Their research focuses on measures of cognition taken directly from the psychology literature including measures of the stock of accumulated knowledge (crystallized intelligence) and the dimensions of cognitive ability associated with processing decisions (fluid intelligence)
The measures of cognition from their new survey are not yet available in a sample that also includes detailed measures of pension and Social Security wealth from respondents and employers allowing development of an array of measures of pension and Social Security knowledge Both sets of measures will eventually be available for the HRS once the 2010 wave is returned from the field and the respondent information from that wave is supplemented by administrative data The 2010 wave includes the new set of cognition questions detailed questions about pensions and Social Security and eventually will have matched employer produced pension plan descriptions and Social Security earnings histories Right now however detailed measures of cognition are only available for a small share of the HRS population in an experimental module
Therefore we proceed by using the less elaborate measures of numeracy and other dimensions of cognition that are currently available in the HRS These same measures are used by McArdle Smith and Willis (2009) in a portion of their paper (Also see Ofstedal Fisher and Herzog 2005) Supporting this decision their work suggests that in explaining wealth the more elaborate measures of cognition are dominated by simple measures of numeracy which are available to us
1
cognition including numeracy to measures of knowledge of pensions and Social Security and to
wealth accumulated in the form of pensions We consider the relationship to total wealth as well
In some respects our analysis conforms to our expectations In other respects it generates
surprises and more disturbing inconsistencies that are difficult to square with simple stories of the
demand for and effects of knowledge on economic decision making To be more specific
We are able to generate a number of measures of pension and Social Security knowledge
indicating knowledge of plan type age of eligibility for retirement benefits and benefit amounts
Some of the measures of pension knowledge are directly related to pension wealth the
more valuable the pension the more knowledgeable the covered worker Apparently those whose
pensions are valuable enough to make it worthwhile to understand them are more likely to be
knowledgeable about their pensions Moreover most pension wealth held by those in their early and
mid-fifties is in defined benefit plans Given the wage premium paid on these jobs and the history of
changes in these plans causality is more likely to run from pension wealth to pension knowledge
rather than the other way around So far so good
A first puzzle is that most measures of cognitive ability including numeracy are not
significant determinants of pension and Social Security knowledge
A second puzzle is related to findings by previous researchers and confirmed in our earlier
work with HRS data (Cagan 1965 Katona 1965 Gustman and Steinmeier 1999) The amount of
wealth a household accumulates outside of pensions and Social Security does not decline as the
value of the households pension wealth increases income constant That is standardizing for
individual differences such as time preference pensions do not seem to be a substitute for other
forms of wealth As a result counting pensions in total wealth those with pensions save more for
retirement The hypothesis set forth by earlier researchers is that pensions lead to greater
understanding of the mechanics of saving and a greater appreciation of the need for retirement
2
saving This suggests that wealth held outside of pensions should be related to knowledge of
pensions But we can find no evidence in support of that relationship
A third and related puzzle is that knowledge of pensions has no effect on the relation of
cognition to wealth We duplicate results from McArdle Smith and Willis (2009) indicating that
there is a relation between cognition and in particular numeracy and wealth held outside of
pensions and Social Security However once we find that knowledge of pensions and Social
Security is not strongly related to the wealth accumulated by the retirement age population and
knowledge of pensions and Social Security is not related to cognition it follows and we find that
inclusion of pension knowledge in wealth equations does not affect the estimated relation between
numeracy and wealth So we must conclude that numeracy does not influence wealth in whole or in
part by affecting financial knowledge of ones pension plan where financial knowledge of the
pension then influences other decisions about retirement saving
These findings not only raise questions about the role of knowledge of pensions and Social
Security in shaping retirement saving but they also raise questions about the linkage between
numeracy and wealth Not whether there is one -- the evidence supports the existence of such a link
The question is how it works We had thought that one avenue through which numeracy influences
wealth is through an effect on understanding of financial instruments But no financial instrument is
more crucial to retirement saving than pensions and Social Security So we are left with the
question what is the channel through which numeracy affects wealth accumulated by the age of
retirement
To set the stage for the empirical analysis Section II provides further discussion of the role
that knowledge of pensions and Social Security may play in influencing the relation of cognition to
wealth In Section III we discuss the construction of the measures of pension knowledge cognition
and wealth used in the analysis Section IV analyzes the relation of measures of knowledge of
3
pensions and Social Security to measures of cognition Section V analyzes first individually and
then jointly the relation of measures of knowledge of pensions and Social Security and cognition
to retirement wealth Section VI concludes
II An Intermediary Role for Knowledge of Pensions and Social Security
A Cognition and Knowledge of Pensions and Social Security
If higher cognitive ability leads to a greater appreciation of the need for retirement saving
or to more effective saving for retirement one might also expect higher cognitive ability to be
accompanied by greater knowledge of the instruments used in saving for retirement Pensions and
Social Security account for half of the wealth of US households nearing retirement age
One possibility is that those with higher cognitive ability have greater knowledge of
pensions and of Social Security which may contribute to their accumulating greater wealth Even if
there is no direct causality running from cognition through knowledge of pensions and Social
Security to wealth one would expect at least an indirect association where holding measures of
income constant those with highest levels of cognition accumulate greater wealth because they
recognize the need for retirement saving and at the same time accrue greater knowledge of
financial instruments
An indirect linkage might also arise if numeracy leads to increased planning activities
which in turn affect wealth (Lusardi and Mitchell 2007) Once again through this route one might
also expect to find numeracy linked to knowledge of the two most important sources of financial
wealth at retirement age pensions and Social Security
B Knowledge of Pensions and the Level of Non-Pension Non-Social Security Wealth
In Gustman and Steinmeier (1999) we found support for earlier findings by Cagan (1965)
and Katona (1965) regarding the relation of pensions to saving Contrary to the view that pensions
are a simple tax favored substitute for other forms of saving data from the 1992 HRS suggested
4
that pension coverage and pension values bear very little relation to saving outside of pensions That
is those with pensions save roughly the same amount outside of their plans as do those without
pensions who have comparable lifetime incomes Where there is some substitution between
pensions and other forms of wealth it is only for those with higher levels of income and education
For the rest there is little apparent substitution of pensions for other wealth even holding constant a
number of factors that might reflect differences in taste for saving Partly this is because an
important fraction of the population does not save for retirement outside of pensions and Social
Security But of greater interest even for those who do save in other forms in many cases there is
little substitution So those with pensions typically have higher total wealth than those without
pensions income and other factors the same
It is important to standardize for incomes when investigating the pension-wealth relation
Jobs offering a pension also offer higher wages (Gustman and Steinmeier 1993) But even when we
did standardize for lifetime incomes the positive link between pensions and wealth continued
Another possible reason for a pension-wealth relation has been suggested by Cagan (1965)
and Katona (1965) Their idea is that those with pensions may have been made more aware of the
need for retirement saving and so saved more It certainly is in the interest of employers to insure
that covered workers appreciate the contributions they are making to the workers pensions But if
the linkage between pensions and other wealth stemmed from the greater understanding of the need
for retirement saving by those with pensions one would also expect to find a relationship between
knowledge of pension plans and saving in other forms This will lead to one of the major
hypotheses we will be testing If Cagan and Katona were right we should find that greater
knowledge of pensions is associated with higher wealth accumulated outside of the pension income
constant
5
Still another possibility is that those with higher values of time preference may find
pensions an imperfect substitute for wealth in hand But in our earlier work we could find no
evidence that time preference was driving the relation between pensions and other forms of wealth
C Pension Knowledge and Total Wealth
What might account for the lack of a relationship between knowledge of pensions and
Social Security on the one hand and retirement wealth on the other There is evidence that many of
those with pensions are disengaged from the management of their plans Most pensions held by
those in their fifties are defined benefit plans Even among those with substantial balances in
defined contribution plans many never rebalance their portfolios Others rebalance infrequently
even during the course of a recession Many are not aware of the details of their plans Many do not
focus until they are very near their retirement ages Thus the lack of a relation between pension
knowledge and total wealth earnings constant may simply reflect the disengagement of those with
pensions from the management of their plans But why then would they be so aware of the need to
accumulate wealth held in other forms than pensions and Social Security People handle other
forms of wealth more frequently Thus cognition and in particular numeracy may affect the value
of other forms of wealth as long as people are paying more attention to and are engaged in
transactions involving these other forms of wealth But would this attention to other wealth be the
same for those with and without pensions
In trying to understand the relationship between pension knowledge and total wealth there
is another puzzle In exploring measures of pension knowledge similar to those reported here
Gustman and Steinmeier (2001) found that respondents to the Health and Retirement Study who
overestimated the values of their pensions and Social Security in a base year 1992 did not
eventually change their saving or retirement behavior in future years by saving more or delaying
their retirement relative to their initial plans Nor did those who had understated their plan values
6
change their behavior taking advantage of the unexpected excess in assets to save less in
subsequent years or to retire earlier than previously planned
D The Relation of Cognition to Wealth
In attempting to understand the relation of cognitive ability to wealth it is important to
realize that there need not be a statistical relationship Additional cognitive ability might raise
earnings but holding earnings constant greater cognitive ability may or may not be associated with
the accumulation of additional wealth Higher cognitive ability may reduce mistakes people make in
choosing how much to save for retirement but those mistakes might have resulted in either over
saving or under saving Moreover higher cognitive ability might reduce uncertainty but greater
uncertainty about needs in retirement might increase precautionary saving or it may lead to a lower
valuation of the effect of current saving on utility gained by additional consumption in retirement
and thereby reduce saving
Or basic numeracy might lead directly to the accumulation of additional wealth for
retirement Most obviously more able individuals may gain higher returns on their retirement
assets allocating their assets to tax favored instruments to investments with a higher payoff and
lower fees or they may make fewer mistakes adjusting their portfolios over time More able
individuals may also realize the need to save for retirement while the issue may either escape the
attention of those who have difficulties making financial calculations or who may simply be
overwhelmed by the task Some with lower cognitive ability may be unable to understand the need
for substantial retirement saving so they eventually will be able to support their current
consumption in retirement let alone to determine the amount of wealth required to meet their
consumption needs in retirement
If numeracy reduces financial errors this would create a direct link between numeracy and
wealth that would not necessarily involve greater specific knowledge of pensions and Social
7
Security One such linkage has been investigated by Zinman and Stango (2009) They find evidence
relating misunderstanding of how compound interest works to financial wealth Their argument is
that the tendency to linearize the exponential growth of interest leads to greater borrowing and
lower levels of wealth In a similar vein Gerardi Goette and Meier (2010) find that lower numeracy
is associated with greater chance of delinquency and default in the subprime housing market
III Sample and Construction of Variables
The sample used in our analysis is based on respondents to the Health and Retirement
Study from couple households The sample is restricted to the early boomer cohort those from
households with at least one member age 51 to 56 in 2004 We restrict the sample to the early
boomer cohort because it is the first HRS cohort for which we have measures of numeracy at the
time they entered the survey We focus on those 51 to 56 because most measures of pension
knowledge in the HRS are derived from questions asking about pensions on the respondentrsquos
current job3 Typically those jobs offering pensions to respondents over the age of fifty are the
same jobs they held at prime working age Thus we do not want to select an older population where
those remaining on their long term job are not representative of workers who were ever covered by
a pension
A Measures of Pension Variables
Using HRS data it is possible to construct a number of measures of pension and Social
Security knowledge A basic measure distinguishes between respondents who answer ldquodonrsquot knowrdquo
(dk) to questions about pension and Social Security characteristics or values and those who do
answer the relevant questions Another measure compares respondent answers with values
3 In the HRS those who have already retired are not asked about their expected benefits Those who are older than the early retirement age are not asked about their early retirement benefits Those who are older than the normal retirement age are not asked about their normal retirement benefits
8
calculated by evaluating employer plan descriptions using the relevant respondents work histories
Questions about pensions include plan type age of eligibility for early and normal retirement
benefits benefit amounts to be paid to holders of defined benefit plans at early or normal retirement
ages account balances in defined contribution plans and related questions Knowledge of Social
Security benefits is measured by the frequency of donrsquot know responses to questions about benefits
at early and normal retirement ages When analyzing the frequency of donrsquot know responses we use
two different measures One measure is a simple donrsquot know response to the question The second
indicator classifies the respondent as not knowing the answer only if the respondent responds ldquodonrsquot
knowrdquo to the initial question and when presented with a series of bracketed values for the variable
in question continues to respond ldquodonrsquot knowrdquo
The subsamples of the early boomer population used for analysis varies with the measure of
pension or Social Security knowledge being analyzed For example if we are investigating
knowledge of the account balance in a defined contribution plan the sample is limited to the subset
of the population with a defined contribution pension Similarly if we are investigating knowledge
of annual benefits to be paid at expected retirement age for those with a defined benefit plan the
sample is limited to those with a defined benefit plan Empirical work reported in the appendices
demonstrates that the main findings are not affected by the differences in population base created by
the use of different measures of pension and Social Security knowledge
Descriptive data for some of the measures of knowledge of pensions and Social Security
used in our analysis are reported in Appendix Table 2 Part B Some measures will be more useful
than others For example only 3 percent of those with a pension indicate they do not know their
plan type This will limit the usefulness of the dk plan type measure in our later analysis On the
other hand when we use indicators of whether the respondent and firm agree there is much more
variation in the knowledge measures For example the measure of agreement as to plan type is
9
based on a broad measure of agreement There we say the respondent and firm reported the same
plan type either when there is exact agreement or when one reported one plan type say DB while
the other reported coverage by both plan types When the broad measure of agreement is used the
level of agreement is very high at 88 percent The frequency of agreement is much lower when we
use a narrower definition of plan type For example to say the respondent and firm both agree the
plan type is DB only as in row 6 of Appendix Table 2 Part B or DC only as in row 7 they both
must respond the plan type is DB only or DC only If either responds both there is no match The
frequency of agreement is much lower when narrow agreement is required with 10 percent of
respondents agreeing the plan is DB only and 16 percent agreeing the plan is DC only
The measure of whether respondents know the value of their Social Security benefits either
at the early or normal age of eligibility exhibits considerable variability In Part C of Appendix
Table 2 37 percent of respondents say they do not know what their Social Security benefits would
be at the Social Security early age of benefit eligibility and 32 percent say they dont know their
benefits at the normal Social Security entitlement age
B Measures of Cognition
Our analysis uses three indicators of cognition from the Health and Retirement Study
(HRS) TICS questions word recall and numeracy These are available in the core of the HRS for
the early boomer cohort and as noted in the previous section have been shown in earlier studies to
be significantly correlated with wealth
Two ldquoTICSrdquo (Telephone Interview of Intact Cognitive Status) questions are used here They
rate a personrsquos ability to serially subtract 7 from 100 and to count backward (from 20 to 1)4
4 McArdle Smith and Willis (2009) investigate the relation of cognition to wealth for all HRS respondents over the age of fifty They include additional TICS measures beside the two included in our analysis The additional measures help to discriminate levels of cognition among those over 65 One such measure evaluates a second try at backward counting for those who failed the first try Others of the additional TICS questions ask about knowledge of the date of the interview names of the President and Vice President the name of the device for cutting paper and the name for a prickly plant that grows in the desert We do not include these additional measures in this paper because we
10
Backward counting equals 2 if the respondent could correctly count at the first try Otherwise it
equals zero The Series 7 value is the sum of correct answers to any of the questions in the series
The range for TICS is from 0 to 7
Word recall refers to an individualrsquos recall of a list of words using the average of the sum of
correct answers to the immediate and delayed word recalls It ranges between 0 and 10
The measure of numeracy is the sum of the number of correct answers to three questions
asking for calculations involving compound interest fractions and probability One question asks
for the calculation of how many people out of 1000 would be sick if there were a 10 percent chance
of contracting a disease Second if there were five winners of a lottery offering a $2 million prize
what will each receive Third with $200 in a saving account earning 10 percent interest per year
what will be in the account at the end of two years Numeracy ranges from 0 to 3
Descriptive statistics for the cognition variables for various subsamples of the Early Boomer
cohort used in our analysis are reported in Appendix Table 1
C Measures of Wealth
When relating knowledge to wealth two measures of wealth are used alternatively as
dependent variables The first is total wealth excluding pensions and Social Security wealth This
measure includes stocks and other financial instruments the value of the home real estate business
wealth ownership of autos and other sources of wealth The second measure is total wealth
including the wealth equivalent of pensions and Social Security Given the findings that we
discussed from earlier studies where pensions seemed to increase saving in other forms when
analyzing the relation between wealth and financial knowledge we include pension wealth on the
right hand side of the relevant regressions Our findings regarding the relation of cognition andor
focus on the population ages 51 to 56 where these measures are not very helpful in determining differences in cognition
11
pension knowledge to wealth are not however sensitive to whether pension wealth is included as a
covariate
IV Relation of Knowledge of Pensions and Social Security to Numeracy
Table 1 reports the results of a series of probit equations relating various measures of
respondent knowledge of their pensions and Social Security to the level of current pension wealth
(or DB or DC wealth where appropriate) and to measures of cognition including the score from
two elements of the TICS variables (backward counting and serial sevens) word recall and
numeracy5 A number of covariates listed below the table are also included The cells in the table
are dprobits reporting the effect of a one unit change in the independent variable on the probability
of observing the knowledge measure
The table is divided into three sections according to whether the dependent variable pertains
to plan type retirement age or to the value of the pension
We first consider evidence supporting a partial but important underlying economic
explanation for knowledge of pensions Knowledge of pensions is greater if the plan is more
valuable Pension wealth measures are significant at conventional levels in explaining the following
measures of pension knowledge Those with higher pension wealth are more likely to agree with
their employer as to plan type are less likely to say they do not know the early retirement age for
their defined contribution plan are more likely to agree with their firm about the age they will be
eligible for early retirement benefits are less likely to say they do not know the value of their
5 Gustman and Steinmeier (2005a) related these knowledge measures to the HRS indicator of word recall but found no significant results Other studies that include measures of cognitive ability using very simple measures of knowledge of pensions find that numeracy is related to pension knowledge (eg see Banks and Oldfield 2007) Their measure of pension knowledge is an indicator of whether or not the respondent says they know the benefit accrual rate or the level of pension benefits That is they focus on dk responses The relation of numeracy to these outcomes remains significant even when there are controls for other dimensions of cognitive ability and education
12
defined benefit pensions at normal retirement age and are more likely to agree with their firm on
the amount of benefits their DB plan is expected to pay
We do not believe there is strong reverse causality with greater knowledge of pensions
leading to higher pension wealth To be sure greater knowledge may lead to higher contribution
rates to DC plans and more effective investment strategies But it is harder to make the case that a
relationship between knowledge of defined benefit plans and pension wealth is due to reverse
causality Yet for the population approaching retirement age examined in this paper DB plans
represent two thirds of pension wealth The value of a defined benefit plan depends only on the
earnings and experience of the covered worker not on any additional activity that may be
disproportionately undertaken by better informed individuals Nor do we believe that selection into
pension jobs is an important issue Jobs with pensions carry much higher wages which are likely to
have driven the choice of employment when the worker was younger6
The results describing how respondents knowledge of their pensions or Social Security
varies with the respondents level of cognition are not nearly so straight-forward to understand
Indeed taken together these findings contribute to a major puzzle
Consider the coefficient on numeracy in row 1 column 4 of Table 1 A one unit increase in
numeracy which means the individual answered an additional one of the three numeracy questions
increases the probability of a respondent reporting he or she does not know the plan type by 26
percent Of course here the sign is in the wrong direction
To be sure taken by itself this result is not so surprising Ninety-seven percent of
respondents claim they know their plan type So there is little variation in the dependent variable to
6 At the time they joined their firms those approaching retirement age in 2004 faced plan provisions that were quite different from those found in later years Moreover pension jobs especially those offering defined benefit plans were typically in unionized firms and large firms that paid premium wages making the jobs attractive irrespective of the pension offer For further discussion see Gustman Steinmeier and Tabatabai (2010) chapter 2
13
be explained and the perverse sign can be treated as an anomaly It makes no sense that increased
numeracy would increase the number saying they donrsquot know their plan type
Yet a similar relation is found between numeracy and other measures of knowledge of plan
type For example as seen in row 2 column 4 the probability that the respondent and firm agree on
the type of pension plan is lower by 39 percent for those who have greater numeracy That is
greater numeracy leads to a reduction in agreement between respondent and firm reports of plan
type
Nor do the measures of cognition help in explaining other measures of plan type whether
donrsquot know responses or indicators that the respondentrsquos answer is the same as that from the
matched employer plan description Although some coefficients are significant there are no
systematic relations between measures of cognition and plan type that are consistent and plausible
Nor do the coefficients change when pension wealth is no longer included as a covariate Thus it is
not that one set of results or another is ignoring some indirect path from cognition to knowledge of
plan type
One might argue that knowledge of plan type is not an appropriate indicator of knowledge of
onersquos pension That is why we have tried such a wide range of other indicators of pension
knowledge Yet we find no plausibly consistent effect of any of the indicators of cognition on
knowledge of pensions and Social Security
Thus Section B of Table 1 presents analogous results on the relation of cognition to
knowledge of retirement age Once again there are no consistent and plausible relations between
measures of cognition and an indicator of knowledge of a respondentrsquos pension
Section C of Table 1 takes us to indicators of the relation of numeracy to knowledge of
benefit values When covariates are included there is no effect of numeracy on knowledge of plan
values Especially telling here numeracy is not related to knowledge of DC plan values
14
We also include in the last two rows of the table indicators of the respondents knowledge of
their Social Security benefits Counter intuitively the result in the last row of column 4 which
approaches significance suggests that greater numeracy increases the likelihood of saying one
doesnt know Social Security benefits at normal retirement age
So to this point it would appear that although earlier studies have shown that cognition and
numeracy in particular significantly affect wealth held outside of defined benefit pensions and
Social Security they have no effect on knowledge of pensions This result may create some doubt
about the efficacy of the many cognition variables we have examined Given an expectation that
these measures of cognition improve wealth by increasing basic knowledge of financial instruments
one would expect each of these measures TICS (serial 7 and backward counting) word recall and
numeracy to bear a systematic and consistent relation to measures of knowledge of pensions and
Social Security But they do not
So we are left wondering why the measures of knowledge of pensions are influenced so
strongly by pension values but are virtually unaffected by measures of cognition This mystery will
deepen as we examine the joint relation between knowledge of pensions and Social Security
cognition and the value of wealth
15
Table 1 Marginal Effects of Cognition Measures on Pension Knowledge Ages 51-56 in 2004
Dependent Variables Pension DBDC Wealth
TICS (absolute z)
Word Recall (absolute z)
Numeracy (absolute z)
of Obs Pseudo R2
A Indicators of Plan Type
DK plan type 0032 (144)
-0002 (034)
-0002 (037)
0026 (231)
651 02455
R amp firm agree on all plan types (wider restriction)
0164 (292)
0005 (055)
0024 (282)
-0039 (207)
626 01621
R amp firm agree plan is DB
-0025 (029)
-0015 (107)
-0004 (027)
0010 (033)
431 01365
R amp firm agree plan is DC
-0057 (048)
-0013 (057)
0013 (080)
-0005 (016)
404 03418
R reports DB amp firm reports DC plan
-0022 (136)
0004 (108)
-0006 (215)
0006 (094)
527 02644
R reports DC amp firm reports DB plan
-0133 (296)
-0003 (055)
-0002 (040)
0013 (115)
505 02144
B Indicators of Retirement Age
DK- ER age for DB -0062 (116)
-0004 (057)
0003 (046)
-0010 (065)
725 01758
DK- NR age for DB -0003 (010)
0003 (065)
0007 (154)
0005 (052)
725 02320
DK- ER age for DC -0197 (220)
-0008 (091)
0001 (013)
-0011 (063)
1013 01262
R and Firm agree on ER age
0448 (299)
0015 (063)
-0010 (043)
0071 (142)
361 01046
R and Firm agree on NR age
0177 (122)
0023 (097)
-0025 (109)
-0032 (066)
350 00886
C Indicators of Plan Value
DK- NR benefits for DB
-0284 (182)
0016 (074)
0032 (157)
-0018 (041)
729 05286
DK- XP benefits for DB
-0330 (144)
0036 (114)
0014 (042)
-0033 (043)
725 08618
R and Firm agree on expected DB benefits
0201 (431)
-0001 (010)
-0010 (103)
-0017 (076)
350 03854
DK- DC balances 0075 (077)
-0003 (012)
-0023 (115)
-0008 (020)
1076 08087
DK after brackets in 0017 -0000 -0001 0007 1062
16
Dependent Variables Pension DBDC Wealth
TICS (absolute z)
Word Recall (absolute z)
Numeracy (absolute z)
of Obs Pseudo R2
DC balances (141) (016) 024) (125) 03965
DK- SS benefits at ER age
0068 (109)
-0002 (029)
0008 (094)
0019 (107)
2392 00958
DK- SS benefits at NR age
-0009 (015)
-0002 (026)
0004 (049)
0032 (180)
2415 00893
Other covariates include indicators of respondentrsquos union and public employment status measures of TICS Recall and Numeracy for the respondents spouse a series of dummy variables for respondentrsquos education dummy variables indicating whether the respondent is female nonwhite Hispanic age and age squared for respondent and spouse spousersquos school years whether respondent is financially knowledgeable R dummy variables indicating Social Security Wealth on an if claim now basis (lt50000 50000 to100000 omitted 100000 to 150000 150000 to 200000 gt200000) [these measures are due to Kandice Kapinos of the Health and Retirement Study] dummy variables for missing values including those who were proxies whether the respondent answered dk to questions about cognition variables and a dummy if pension wealth is imputed Current pension DB and DC wealth are in millions of dollars DB wealth includes a calculation of the present value of the respondentrsquos expected DB benefits for hisher most important DB plan DC wealth includes the sum of all DC accounts from Rrsquos current job Nine cases who reported they have a DB plan from their current job but that they were receiving benefits currently are excluded z-statistics are reported in parentheses
17
V Relation of Household Wealth to Each Spousersquos Knowledge of Their Pension and Social
Security to Cognitive Ability and to Other Key Covariates
So far we have not been able to find a relation of cognition to knowledge of pensions and
Social Security We have however found a relation between knowledge of pensions and Social
Security and the level of pension wealth There also are the findings of a strong relationship
between cognition and wealth from McArdle Smith and Willis (2009) We put these findings
together by estimating the relation of total wealth to pension and Social Security knowledge
including pension wealth as a covariate Next using a sample comparable to the one we use to
analyze pension knowledge we reestimate the results from McArdle Smith and Willis (2009)
linking wealth to cognition Third we include all three elements in the same regression This will
allow us to answer three questions Does knowledge of pensions and Social Security bear any
systematic relation to non-pension non-Social Security wealth What is the role of pension wealth
in influencing the relation of pension knowledge to other forms of wealth Does knowledge of
pensions and Social Security affect the measured relation between cognition and wealth
To begin estimates in Table 2 relate the wealth of a respondents household to that persons
knowledge of their pensions and Social Security Observations are respondent based with one
observation for each individual member of couple households with at least one of them aged 51 to
56 in 2004 and having a pension Three different measures of wealth alternate as dependent
variables Results for total household wealth (in thousands of dollars) are reported in columns 1 and
2 Findings for the ratio of household wealth to household income are reported in columns 3 and 4
Regressions with total household wealth excluding pensions and Social Security as the dependent
variable are reported in columns 5 and 6 Measures of knowledge of the respondents pension and
Social Security are the same as those discussed earlier
18
The results in Table 2 provide little support for a view that greater knowledge of pensions is
a sign of the kind of greater financial sophistication that would increase retirement wealth Columns
1 3 and 5 of the table report the coefficients of the measure of pension or Social Security
knowledge in the regressions for wealth Only four out of thirty of these measures of knowledge
exhibit coefficients that are significant at or near conventional levels The coefficient in row 1
column 1 suggests that if a person reports not knowing what type of plan their pension is that
person will have $127300 less wealth than persons who say they know their plan type In row 3
column 1 when a respondent and firm agree the plan is defined benefit the total wealth is $93510
higher
However among the four statistically significant results there are also two counter-intuitive
findings Specifically in column 5 rows 4 and 5 if a person indicates not knowing the early or
normal retirement ages for a DB plan household wealth outside of the pension is higher by $67620
and $48570 respectively
Columns 2 4 and 6 report the coefficients estimated for the measures of pension wealth
where this variable is entered into the right hand side of the alternative wealth regressions Looking
down columns 2 and 4 allowing for considerable variation in the coefficient estimates and the fact
that some coefficients differ significantly from 10 each dollar of pension wealth is associated with
roughly another dollar in total wealth This suggests little substitution of pension wealth for other
forms of wealth Respondents do not save less outside of their pension because they have access to
more pension wealth The last column relates total wealth excluding pensions and Social Security to
pension wealth Here the coefficients are significantly greater than zero and suggest that those with
pensions save slightly more in other forms for each dollar of additional pension wealth Again there
is no suggestion of substantial substitution between pensions and other forms of wealth
19
To reconcile the coefficients in columns 2 and 6 note that column 6 tells us how a $1
increase in pension wealth is related to wealth outside of both the pension and Social Security
Column 2 indicates how a $1 increase in pension wealth is related to the sum of pension wealth
Social Security wealth and wealth held outside of pensions and Social Security Thus taking the
result in row 4 it is perfectly consistent to find on the one hand that an additional dollar of pension
wealth raises wealth outside of pensions and Social Security by 116 cents while increasing total
wealth by 839 cents The difference reflects the correlation between pensions and Social Security
One final note Although it might seem that a very limited effect of pension knowledge on total
wealth is the result of holding pension wealth constant the findings are similar when pension
wealth is not included in the equations reported in Table 2
20
Table 2 Marginal Effects of Pension and Social Security Knowledge on Household Wealth Ages 51-56 in 2004 (Note Measures of cognition are not included in these regressions)
Dependent Variable HH Total Wealth
(thousands of dollars)
Dependent Variable Ratio of HH Total Wealth to HH
Income
Dependent Variable HH Total Wealth Excluding Pension amp SS Wealth (thousands of dollars)
Independent Pension Knowledge
Variables
Coefficient for
PensionSS Knowledge
Variable
Coefficient for Pension
Wealth Variable
Coefficient for
PensionSS Knowledge
Variable
Coefficient for (Pension WealthHH
Income) Variable
Coefficient for
PensionSS Knowledge
Variable
Coefficient for Pension
Wealth Variable
A Indicators of Plan Type
DK plan type -12730 (222)
1120 (3030)
033 (059)
0979 (3456)
-2488 (074)
0226 (1036)
R amp firm agree on all plan types (wider restriction)
217 (049)
1100 (2065)
-057 (129)
0996 (1645)
1497 (063)
0180 (629)
R amp firm agree plan is DB
9351 (179)
0985 (996)
033 (065)
0881 (1004)
2595 (104)
0139 (295)
B Indicators of Retirement Age
DK- ER age for DB 7366 (145)
0839 (1103)
006 (013)
0747 (1595)
6762 (253)
0116 (291)
DK- NR age for DB 6707 (115)
0835 (1102)
042 (076)
0749 (1603)
4857 (160)
0105 (266)
C Indicators of Plan Value
DK- NR benefits for DB
4989 (121)
0850 (1110)
054 (140)
0752 (1613)
4667 (214)
0118 (293)
DK- XP benefits for DB
-272 (005)
0837 (1096)
-006 (011)
0748 (1599)
2674 (092)
0103 (260)
R and Firm agree on expected DB benefits
7386 (117)
0912 (779)
-043 (078)
0826 (890)
-1599 (051)
0170 (295)
DK- DC balances -5513 (131)
1411 (2613)
013 (032)
124 (3751)
-2692 (104)
0355 (1077)
DK- SS benefits at ER age
1460 (067)
1092 (2502)
011 (052)
105 (2292)
1101 (085)
0248 (954)
Estimated with robust regression Covariates not listed in the table include an indicator if respondent is female race age and age squared for respondent and spouse a series of dummy variables for respondentrsquos education spousersquos school years whether respondent is financially knowledgeable R if a union member or public employee dummy variables indicating Social Security Wealth on an if claim now basis (lt50000 50000 to100000 omitted 100000 to 150000 150000 to 200000 gt200000) dummy variables for missing values and a dummy if pension wealth is imputed
21
Before presenting wealth equations that include measures of pension knowledge together
with measures of cognition Table 3 provides a second baseline for the wealth regressions by
including only cognition measures and other covariates but not measures of pension knowledge as
explanatory variables The table presents estimates of marginal effects of the three key measures of
cognition on wealth TICS word recall and numeracy In alternative specifications wealth is
measured by non-pension non-Social Security wealth and total wealth The format of the equations
is the same as in McArdle Smith and Willis (2009) except that pension wealth is also included as a
covariate The population underlying the regressions in Table 3 is different from the one used in
their analysis which includes the entire HRS population for 2006 As noted previously to enable us
eventually to include measures of knowledge of pensions and Social Security which are available
for 2004 our sample for all tables is confined to couple households with at least one member 51 to
56 in 2004 In addition so the estimates of the equations used to analyze the relation of cognition to
wealth will be comparable to the samples used to analyze the effects of knowledge of pension plan
type retirement age and plan values the results in Table 3 are confined in one set of regressions to
those who report they are covered by a pension and in another to those HRS respondents for whom
there is a matched employer provided pension plan description
Otherwise these wealth equations are specified as in McArdle Smith and Willis (2009)
Specifically cognition measures are reported separately for the financially knowledgeable
respondent and the spouse Note however that the financially knowledgeable respondent may not
be the member of the household who has a pension What the wealth regressions show is how the
cognition of each spouse is related to the householdrsquos wealth not how the cognition of the spouse
with a pension is related to household wealth
22
None of our major findings are affected by differences between the populations used in the
two studies As in McArdle Smith and Willis (2009) numeracy of the financially knowledgeable
respondent is the dominant determinant of wealth among the six cognition measures shown7
From row 3 columns 1 and 2 of Table 3 a one unit increase in the numeracy score for a
financially knowledgeable respondent is associated with an additional $26000 in wealth
accumulated outside of the pension and Social Security From columns 3 and 4 among the
population with a pension higher numeracy for the financial R also increases the total wealth of the
household But it does not have a significant effect on total wealth within the population of those
who have a matched employer pension
7 Although not reported here we built a bridge between the wealth equations in McArdle Smith and Willis (2009) and those in this paper Given the number of differences in the underlying samples this bridge involves changing the specification of the wealth equation one difference at a time We are grateful to Jim Smith who provided the information required to duplicate the initial results from McArdle Smith and Willis (2009)
23
Table 3 Marginal Effects of Measures of Cognition and Current Pension on Household Wealth Ages 51-56 in 2004 (Wealth is measured in thousands of dollars)
Wealth Excluding Pensions and Social Security
Wealth Including Pensions and Social Security
Independent Variables Rs with Pension Rs with matched pension
Rs with Pension Rs with matched pension
(1) (2) (3) (4) Financial R TICS -617
(149) -490 (080)
-294 (043)
733 (067)
Word Recall -945 (242)
176 (030)
-680 (105)
-091 (009)
Numeracy 2654 (323)
2628 (208)
3169 (232)
1213 (054)
Non-Financial R TICS -404
(099) -365 (058)
307 (045)
-1221 (109)
Word Recall 1145 (286)
988 (166)
1767 (266)
3178 (302)
Numeracy 1556 (169)
2715 (197)
2176 (142)
1941 (080)
Covered Worker Current Pension Wealth 0139
(692) 0126 (453)
0942 (2820)
0949 (1939)
Estimated with robust regression Covariates not listed in the table include indices for female financial R Hispanic non-white household total income and its square respondentrsquos and hisher spousersquos age and their squares respondentrsquos and hisher spousersquos education t-statistics are reported in parentheses
24
The next step is to enter measures of cognition and pension and Social Security knowledge
in the same regressions for wealth Table 4 relates wealth excluding pensions and Social Security to
these measures Table 5 relates total wealth including pensions and Social Security to cognition
and measures of pension knowledge Given the effect of pension value on pension knowledge and
the relation of pension value to nonpension non-Social Security wealth the level of pension wealth
is included as a covariate in each equation Other covariates are listed below the table
The results are divided into three sections coefficients for the cognition measures for the
financially knowledgeable respondent coefficients for the cognition measures for the spouse who is
not the financially knowledgeable respondent and under the title Covered Worker measures of
pension knowledge exhibited by the worker who is covered by a pension Once again there are
three different sets of measures of pension knowledge ndash those pertaining to plan type those
pertaining to retirement age and those pertaining to plan value
There are three clear conclusions from the results in both tables First as seen in rows 3 and
6 of each table numeracy of the financially knowledgeable respondent followed by numeracy of
the nonfinancial respondent are the major cognitive determinants of wealth Second from Table 4
row 7 pension wealth is associated with a higher level of non-pension non-Social Security wealth
Third in a few cases greater pension knowledge is associated with higher wealth with some
variables bordering on significance But for the most part pension knowledge is not a major
determinant of either wealth held outside of the pension plan or of total wealth
Given the weak relation between measures of knowledge of pensions to measures of
cognition it is not surprising that the coefficients on knowledge variables are not affected when
measures of cognition are added to wealth regressions and coefficients on measures of cognition
are not affected when measures of pension and Social Security knowledge are added to wealth
regressions It is not just that the insignificant variables measuring the effects of pension knowledge
25
on wealth in say Table 2 column 5 remain insignificant when measures of cognition are added to
the regression It is that the coefficients on the cognition variables remain unchanged when
measures of pension knowledge are added to the regression This can be seen by comparing Table
3 column 2 with Table 4 column 1
Notice that within Tables 4 and 5 the coefficients on numeracy and on pension wealth
bounce around among regressions Further examination suggests it is not the differences in
covariates among regressions that is responsible Rather it is differences in samples that are
responsible The samples are restricted by the definition of the pension knowledge variable Column
1 includes those with a pension and matched employer pension plan description The sample in
columns 2 and 3 include those with a pension who report having a defined benefit plan In column
4 respondents have a matched employer plan description and a defined benefit plan Column 5
includes those with a defined contribution plan The sample for column 6 requires that the
respondent report expecting Social Security benefits
To summarize although the specifications relating pension knowledge to wealth outside of
pensions and Social Security do not suggest a relation between measures of pension knowledge and
other forms of wealth they all suggest that numeracy bears a significant relation to wealth outside
of pensions and Social Security As a consequence including measures of pension knowledge has
little or no effect on the estimated relation between measures of numeracy and wealth
26
Table 4 Marginal Effects of Measures of Financial Knowledge and Cognition on Household Wealth Excluding Pensions and Social Security Ages 51-56 in 2004 (Wealth is measured in thousands of dollars)
(1) (2) (3) (4) (5) (6) Financial R TICS -473
(077) -818 (140)
-922 (157)
-936 (113)
-447 (081)
-789 (166)
Word Recall 041 (007)
-559 (101)
-505 (091)
1026 (123)
-1193 (234)
-979 (221)
Numeracy 2637 (211)
2991 (254)
3164 (268)
1955 (109)
3350 (321)
3094 (334)
Non-Financial R TICS -351
(056) -641 (115)
-715 (127)
-037 (004)
-654 (119)
-449 (098)
Word Recall 923 (156)
1416 (255)
1478 (265)
937 (112)
1016 (192)
1106 (253)
Numeracy 2907 (211)
791 (062)
868 (068)
3634 (195)
2206 (185)
1669 (165)
Covered Worker Current pensionDBDC wealth
0120 (434)
0049 (137)
0045 (126)
0107 (192)
0251 (796)
0156 (639)
DK-Plan Type -2088 (040)
- - - - -
R and Firm Agree on All Plan Types (Wider Restriction)
1052 (040)
- - - - -
R and Firm Agree Plan is DB
1007 (042)
- - - - -
DK-ER Age for DB - 3680 (152)
- - - -
DK- expected DB benefit - - 6266 (146)
- - -
R amp firm agree on expected DB benefits
- - - -2880 (095)
- -
DK-DC Balances - - - - -6444 (179)
-
DK-ER Age for DC Plan - - - - -2142 (114)
-
DK- SS Ben at ER age - - - - - 764 (050)
DK- SS Ben at NR age - - - - - -339 (021)
Estimated with robust regression The dependent variable is household wealth excluding Social Security and pension benefits Covariates not listed in the table include indices for female financial R Hispanic non-white household total income and its square respondentrsquos and hisher spousersquos age and their squares and respondentrsquos and hisher spousersquos education t-statistics are reported in parentheses
27
Table 5 Marginal Effects of Measures of Financial Knowledge and Cognition on Total Household Wealth Ages 51-56 in 2004 (Wealth is measured in thousands of dollars)
Financial R (1) (2) (3) (4) (5) (6)
TICS 705 (065)
-1416 (128)
-1486 (134)
-1197 (078)
414 (047)
-270 (035)
Word Recall -288 (028)
-1031 (098)
-983 (094)
-1103 (072)
-753 (091)
-715 (100)
Numeracy 920 (042)
5578 (250)
5715 (256)
2784 (085)
4332 (257)
4030 (268)
Non-Financial R TICS -898
(081) 404
(038) 357
(034) 451
(029) 503
(057) 275
(037) Word Recall 3131
(300) 2937 (279)
2942 (280)
2752 (180)
1678 (197)
1836 (259)
Numeracy 2218 (091)
064 (003)
-016 (001)
4039 (118)
4252 (221)
2662 (163)
Covered Worker Current pensionDBDC wealth
0942 (1929)
0689 (1014)
0691 (1018)
0755 (738)
1262 (2479)
0901 (2274)
DK-Plan Type -5933 (064)
- - - - -
R and Firm Agree on All Plan Types (Wider Restriction)
-853 (018)
- - - - -
R and Firm Agree Plan is DB
6880 (162)
- - - - -
DK-ER Age for DB - 1934 (042)
- - - -
DK- Expected DB Benefit
- - 5843 (072)
- - -
R amp Firm Agree on Expected DB Benefits
- - - 590 (011)
- -
DK-DC Balances - - - - -6713 (115)
-
DK-ER Age for DC Plan - - - - -8039 (266)
-
DK- SS Ben at ER age - - - - - 1673 (067)
DK- SS Ben at NR age - - - - - -740 (028)
Estimated with robust regression The dependent variable is household wealth including Social Security and pension benefits Covariates not listed in the table include indices for female financial R Hispanic non-white household total income and its square respondentrsquos and hisher spousersquos age and their squares and respondentrsquos and hisher spousersquos education t-statistics are reported in parentheses
28
VI Conclusions and Policy Implications
Our initial hope in undertaking this paper was to shed further light on the role of
cognition and in particular of numeracy in shaping wealth accumulated for retirement
We thought that a part of the link between cognition and wealth reflected the fact that
higher cognition leads to increased knowledge of retirement finances which in turn leads
to higher wealth This idea was strengthened not only by findings in the literature on the
relation of cognition and especially numeracy to wealth but also by earlier findings
linking pension knowledge to pension wealth and a failure to find a reduction in non-
pension saving to correspond with higher pension wealth
We have not succeeded in establishing these linkages Although we confirm the
finding in the literature that higher cognition and in particular greater numeracy is
associated with the accumulation of additional retirement wealth we also find the initial
evidence that more numerate individuals better understand their pensions or Social
Security to be very fragile Nor do we find evidence linking cognition or numeracy to
wealth accumulation in association with increased knowledge of pensions and Social
Security Moreover we do not find that the substitution of pensions for other forms of
wealth varies with knowledge of pensions
Instead we find that many of the questions as to the avenues through which
cognition and numeracy increase retirement wealth remain unanswered As a result we
remain unsure of how best to use the apparently robust numeracy-wealth relation in
designing policies that are aimed at increasing retirement saving
To be sure many people do not have an incentive to understand their pensions
and Social Security even when reaching their early or mid-fifties For some their plans
29
are not sufficiently valuable to pay much attention For others their retirement is assured
due to a generous pension that does not require monitoring Perhaps most importantly for
those currently approaching retirement age the largest share of their pension wealth
remains in defined benefit plans where typically there is little for an individual to do in
order to increase retirement benefits
But shouldnrsquot greater numeracy that leads to greater wealth accumulation also
have created greater financial acumen which is then reflected indirectly as increased
knowledge of pensions When the finding that those with pensions are motivated to
accumulate higher balances outside of their pensions and Social Security was uncovered
in the literature it was argued that those with pensions learn from their providers about
the need for retirement saving and perhaps increased their understanding of how wealth
accumulation works Yet knowledge of pensions and Social Security does not affect
saving behavior
Why does numeracy play an important role in influencing saving even holding
income constant while knowledge of pensions plays none
When combined with findings from our earlier studies many puzzles remain In
previous work (Gustman and Steinmeier 2001) we found that those who overestimate the
values of their pensions and Social Security in the years before retirement nevertheless do
not eventually change their saving or retirement behavior by saving more over the next
eight years or retiring later Nor do those who understate their plan values change their
behavior Accordingly they must eventually adjust their consumption
It is not that people are totally clueless about the incentives created by their
retirement plans An extensive retirement literature is characterized by a strong response
30
of retirement to incentives from pensions and Social Security (eg Gustman and
Steinmeier 2005b) Moreover changes in Social Security rules designed to encourage
delayed retirement have clearly had predicted effects on retirement (Gustman and
Steinmeier 2009) One would certainly expect that it is easier for those with higher
cognition to understand these complex rules But we have been unable to find a direct
link empirically from cognition through measures of knowledge of pensions and Social
Security to accumulated wealth
We have tried a variety of specifications to ensure that the absence of a link
between knowledge of pensions and Social Security and numeracy and the knowledge
variables and wealth is not due to a particular specification we have adopted We have
tried specifications with and without pension wealth included as a covariate If there is no
link we are left with a list of questions Accepting the relation between numeracy and
wealth what exactly is the mechanism by which numeracy affects wealth What
calculations or behavior does numeracy affect that are not ultimately reflected in pension
or Social Security knowledge
Policy Implications
Our findings raise questions about the avenues through which cognition and
numeracy increase retirement wealth Accordingly our analysis raises questions about
whether the apparently robust numeracy-wealth relation provides a basis for designing
policies that are aimed at increasing retirement saving by increasing numeracy or
financial literacy
Financial education would seem to be a basic policy that would allow those with
lower levels of numeracy to nevertheless save adequately for their retirement The
31
numeracy-wealth relation which remains even after standardizing for the differences in
earnings that result from higher numeracy seems to suggest that those with higher
numeracy have an easier time accumulating knowledge of financial instruments
understanding risk and appreciating the need for and the best ways to accumulate
retirement saving But our findings suggest the numeracy-wealth relation may reflect
something else Perhaps numeracy reflects an unmeasured characteristic of the individual
that cannot be learned but does generate higher wealth If nothing else these findings
suggest a good deal of caution is warranted before assuming that classes in financial
basics tutorials or other efforts to convey financial knowledge will induce appropriate
saving habits choices in the face of risk or a proper approach to spending down assets
after retiring Although these policy initiatives may well ultimately encourage additional
saving they should be carefully and rigorously evaluated on an individual basis before
financial education and training programs are adopted on a significant scale
32
References
Banks James and Zoe Oldfield 2007 ldquoUnderstanding Pensions Cognitive Function Numerical Ability and Retirement Savingrdquo Fiscal Studies 28(2)143-170
Cagan Phillip 1965 The Effect of Pension Plans on Aggregate Savings New York National Bureau of Economic Research
Gerardi Kristopher Lorenz Goette and Stephan Meier 2010 ldquoFinancial Literacy and Subprime Mortgage Delinquency Evidence from a Survey Matched to Administrative Datardquo Social Science Research Network
Gustman Alan L and Thomas L Steinmeier 1993 Pension Portability and Labor Mobility Evidence from the Survey of Income and Program Participation Journal of Public Economics 50 299-323
_______________ 1999 Effects of Pensions on Savings Analysis with Data from the Health and Retirement Study Carnegie-Rochester Conference Series on Puble Policy 50 271-324
_______________ 2001 ldquoImperfect Knowledge Retirement and Savingrdquo Michigan Retirement Research Center Working Paper UM00-08
_______________ 2005a ldquoImperfect Knowledge of Social Security and Pensionsrdquo Industrial Relations 44(2) 373 -395
_______________ 2005b ldquoThe Social Security Early Retirement Age In A Structural Model of Retirement and Wealthrdquo Journal of Public Economics 89( 2-3) 441shy463
_______________ 2009 How Changes in Social Security Affect Recent Retirement Trends Research on Aging 31(2) 261-290
Gustman Alan L Thomas L Steinmeier and Nahid Tabatabai 2010 Pensions in the Health and Retirement Study Harvard University Press
Katona George 1965 Private Pensions and Individual Savings Ann Arbor Survey Research Center Institute for Social Research University of Michigan
Lusardi Annamaria and Olivia S Mitchell 2006 ldquoFinancial Literacy and Planning Implications for Retirement Wellbeingrdquo MRRC Working Paper No 2006-144 _______________ 2007 ldquoBaby Boomer Retirement Security The Role of Planning Financial Literacy and Housing Wealthrdquo Journal of Monetary Economics 54 205-224
McArdle John J James P Smith and Robert Willis 2009 ldquoCognition and Economic Outcomes in the Health and Retirement Surveyrdquo NBER Working Paper 15266
Ofstedal Mary Beth Gwenith G Fisher and A Regula Herzog 2005 ldquoDocumentation of Cognitive Functioning Measures in the Health and Retirement Studyrdquo HRS Documentation Report DR-006 Institute for Social Research Ann Arbor University of Michigan
Rohwedder Susann and Kristin J Kleinjans 2006 ldquoDynamics of Individual Information about Social Securityrdquo Rand
Stango Victor and Jonathan Zinman 2009 ldquoExponential Growth Bias and Household Financerdquo Journal of Finance 64(6) 2807-2849
33
Appendix 1 Measures of Cognition Demographic Characteristics Income and Wealth
in Different HRS Subsamples
Appendix Table 1 provides descriptive statistics for indicators of cognition
demographic characteristics income wealth and other variables used in our analyses
Column 1 shows the means and standard deviations for the full sample of couple
households with at least one member aged 51 to 56 in 2004 The columns that follow
restrict the sample to those with a pension those with a matched employer pension plan
description those with a defined benefit plan those with a defined contribution plan and
those expecting Social Security benefits at the early or normal retirement age
As can be seen by selecting a row and comparing means across the columns of
Appendix Table 1 there is not much variation in the independent variables as the sample
is restricted to those with a pension those with a pension who also have a matched
employer plan those with a DB plan and those with a DC plan To be sure as seen in the
first six rows of the table cognition measures are slightly higher for those with pensions
than for the general population of couple households However restricting the
populations to those with a matched employer plan those claiming a DB pension or
those with a DC pension does not have a systematic effect on the cognition variables
The means of some demographic measures do differ across populations For
example because Hispanics have lower pension coverage than whites or blacks they are
a smaller share of the pension covered population than of the overall population Income
also varies with sample composition Those with a pension have higher incomes than
those without a pension and those with a defined benefit (DB) pension have higher
incomes than those whose pension is not DB Also importantly total wealth is higher
34
among households with a pension and total wealth is lower among those households with
a DB pension On the whole the various sample restrictions have relatively modest
effects on the means of listed variables
35
Appendix Table 1 Selected Measures of Cognition Demographic Status Income and Wealth for Members of Two Person Households Health and Retirement Study Respondents Aged 51-56 in 2004 (Means and Standard Deviations in Various Subsamples)
Independent Variables All Rs (51-56)
Rs with Pension
Rs with Matched Pension
Rs with Any DB
Rs with Any DC
Rs Expecting SS Benefits At ER age
Rs Expecting
SS Benefits At NR age
Financial R TICS 537
(168) 555
(161) 547
(166) 553
(161) 562
(157) 552
(161) 551
(161) Word Recall 546
(146) 566
(135) 574
(134) 569
(133) 570
(134) 557
(142) 556
(142) Numeracy 143
(096) 158
(094) 162
(095) 163
(091) 161
(093) 153
(094) 153
(094) Non-Financial R TICS 481
(182) 507
(172) 510
(170) 506
(171) 515
(171) 507
(175) 506
(175) Word Recall 540
(145) 557
(134) 566
(137) 561
(140) 561
(138) 550
(148) 550
(148) Numeracy 106
(093) 119
(093) 121
(093) 120
(093) 123
(094) 120
(091) 120
(091) All Female 050
(050) 047
(050) 056
(050) 047
(050) 046
(050) 054
(050) 054
(050) Hispanic 014
(035) 009
(028) 009
(029) 008
(028) 008
(027) 012
(033) 012
(032) Non-white 015
(036) 015
(036) 015
(036) 017
(037) 014
(035) 014
(035) 014
(035) Rrsquos age 5360
(523) 5310 (419)
5304 (414)
5320 (408)
5295 (423)
5289 (398)
5297 (408)
Spousersquos age 5360 5335 5366 5337 5314 5354 5354
36
Independent Variables All Rs (51-56)
Rs with Pension
Rs with Matched Pension
Rs with Any DB
Rs with Any DC
Rs Expecting SS Benefits At ER age
Rs Expecting
SS Benefits At NR age
(523) (50) (478) (510) (505) (534) (532) Rrsquos of school years 1320
(310) 1411 (239)
1457 (232)
1430 (237)
1413 (236)
1354 (279)
1354 (279)
Rrsquos spousersquos of school years
1320 (310)
1386 (247)
1412 (238)
1391 (243)
1391 (242)
1348 (282)
1348 (282)
HH total income 1032 (1346)
1253 (1486)
1249 (1337)
1321 (1691)
1220 (1186)
1122 (1464)
1121 (1461)
HH Wealth excluding pension and SS wealth
4323 (1052)
4668 (1074)
4480 (832)
4368 (832)
4750 (1110)
4791 (1111)
4581 (1109)
HH Wealth including pension and SS wealth
8396 (1165)
9753 (1205)
10027 (982)
10017 (966)
9863 (1246)
8791 (1221)
8797 (1218)
N 3418 1520 639 743 1078 2398 2415 Standard deviations are in parenthesis In 1000 dollars
37
Appendix Table 2 has three sections Part A describes the underlying populations
according to employment pension and Social Security coverage availability of matched
pension plan descriptions from employers or Social Security records and reported
outcomes Part B reports means of measures of knowledge of pensions Part C does the
same for measures of knowledge of Social Security Given interest in the roles played in
households by the spouse who is financially knowledgeable (as identified by the
household) and important remaining differences between outcomes for men and women
the table separates the results both according to whether the household labels the
respondent as the financially knowledgeable respondent (labeled as Financial R) or the
other member of the household (Non-Financial R) The table also reports each of these
outcomes by the sex of the respondent Note also that in Appendix Table 2 the sample
sizes differ as we move down the rows These differences in sample composition should
be borne in mind
As can be seen in Appendix Table 2 Section A row 3 78 percent of men from
couple households and 69 percent of women held a job in 2004 From row 5 60 percent
of employed men and 61 percent of employed women from couple households reported
coverage by a pension From row 7 35 percent of men reporting a pension and 50
percent of women had a matched employer pension plan in 2004 About half of
respondents with a pension on their current job report they have a defined benefit plan
Around 73 percent of men and 68 percent of women reported having a defined
contribution (DC) plan Because many individuals have both a defined benefit and a
defined contribution pension the total of the share of those with pensions holding a
38
defined benefit plan and the share of those with pensions holding a defined contribution
plan exceeds 10 Moving toward the bottom of Section A of the table in couple
households 60 percent of men and 61 percent of women have a matched Social Security
record
39
Appendix Table 2 Descriptive Data Regarding Pension Coverage and Pension Knowledge Couple Households Health and Retirement Study Early Boomer Cohort in 2004
All Financial R Non-Financial R
All Males Females All Males Females All Males Females Part A Indicators of Employment Coverage Plan Type Matched Employer and Social Security Data
Total 3418 1708 1710 1709 1041 668 1709 667 1042 Number Employed 2510 1325 1185 1297 824 473 1213 501 712 Employed 73 78 69 76 79 71 71 75 68 Number Reporting Current Pension
1520 801 719 818 524 294 702 277 425
Percent Reporting Current Pension
61 60 61 63 64 62 58 55 60
Number Reporting Matched Employer Pension
639 280 359 340 197 143 299 83 216
Percent Reporting Matched Employer Pension
42 35 50 42 38 49 43 30 51
Percent (of R with current pension) Reporting DBcomb
49 50 48 52 52 51 46 45 46
Percent (of R with current pension) Reporting DCcomb
71 73 68 73 75 70 68 70 67
Number with Matched Social Security Data
2068 1029 1039 1068 664 404 1000 365 635
Percent with Matched Social Security Data
61 60 61 62 64 60 59 55 61
Number Expecting Social Security benefit
2647 1292 1355 1313 780 533 1334 512 822
Percent Expecting Social Security benefit
77 76 79 77 75 80 78 77 79
Part B Indicators of Pension Knowledge Percent (of R with current pension) Reporting DK Plan Type
3 2 3 2 2 2 4 3 4
Number Firm and Respondent 565 248 318 298 172 126 267 76 191
40
Report of Plan Type Agree ((broader restriction) Percent (of R with matched pension) Firm and Respondent Report of Plan Type Agree (broader restriction)
90 89 89 88 87 88 89 92 88
Number Firm and Respondent Report of Plan Type Agree (narrower restriction)
170 68 102 79 47 32 91 21 70
Percent (with matched pension) Firm and Respondent Report of Plan Type Agree (narrower restriction)
27 24 28 23 24 22 30 25 32
Percent (with matched pension) Reporting DB only with Matched DB only
10 11 10 9 11 8 11 11 11
Percent (with matched pension) Reporting DC only with Matched DC only
16 16 16 15 15 15 17 18 17
Percent with DBcomb Reporting DK on Early Retirement Age
9 7 12 7 7 7 12 9 15
Percent with Matched DBcomb Agreeing on Early Retirement Age (On Diagonal)
41 45 37 40 46 32 41 43 41
Percent with DBcomb Reporting DK on Normal Retirement Age
7 5 10 5 4 7 9 5 11
Percent with Matched DBComb Agreeing on Normal Retirement Age (On Diagonal)
34 37 32 36 41 28 33 28 35
Percent (of R with DBcomb) 5 4 7 3 3 4 8 6 9
41
with DB Reporting DK on Expected Retirement Age Percent (of R with DBcomb) Reporting DK on Normal Retirement Benefits
42 34 52 38 30 52 48 42 51
Percent with DBComb Reporting DK on Expected Retirement Benefits
40 31 51 37 28 52 45 37 50
Percent with Matched DB Agreeing on Benefits at Expected Retirement Age (On Diagonal)
18 20 16 21 23 19 13 13 13
Percent (of R with DCcomb) Reporting DK on Early Retirement Age
13 10 18 10 7 16 18 15 20
Percent (of R with DCcomb) Answering DK on Account Balance
34 30 39 31 28 35 38 32 41
Percent (of R with DCcomb) Answering DK after Brackets on Account Balance
11 10 12 11 11 12 11 9 12
Part C Indicators of Social Security Knowledge Percent (R expecting SS benefits) Reporting DK on Early Retirement Benefit
37 28 45 32 26 42 42 32 48
Percent (R expecting SS benefits) Reporting DK on Normal Retirement Benefit
32 23 40 28 21 38 36 26 42
Includes only those who provided a normal retirement age Includes under dk those who could not provide an expected retirement age Rs expecting benefits based on own work andor spousersquos work are included Source Gustman Steinmeier and Tabatabai (2010)
42
Next we turn to the many measures of knowledge of pensions in Part B of
Appendix Table 2 Together these measures confirm our findings from earlier work ndash the
glass is half full half empty If we look at the fraction of the relevant populations who
can call their plan type ages of retirement or plan value on average they do not do too
badly But if we look at measures of agreement between individual reports and relevant
values obtained from employer plan descriptions typically less than half fall on a
diagonal indicating the respondent report and value obtained from the employer plan
description agree More specifically plan values are reported in the following ranges all
in thousands of dollars 20-40 40-60 60 to 80 80-110 110-150 150 to 190 190-240
240-300 gt300 Plan values from respondents and firms are said to agree if both reports
fall within the same range
We begin with indicators of knowledge of plan type A simple ldquodonrsquot knowrdquo
report is not a helpful place to start As seen in Part B row 1 only 3 percent of
respondents report they do not know their plan type As a result it is unlikely that this
measure is a very interesting dependent variable Nor is it very helpful in explaining
variation in wealth
Other measures of pension knowledge are more interesting however If the
measure of correctly identifying plan type is whether when the firm reports a defined
benefit plan so does the respondent as seen in row 3 of part B agreement is obtained in
roughly 90 percent of the cases That is according to this broad definition of a match if
either the worker or firm reports both (DB and DC) plan types while the other reports
only one plan type we consider this to be a match However using a narrower definition
of plan type where a match requires that both the respondent and firm record indicate the
43
plan is DB only DC only or both only 24 percent of men and 28 percent of women in
couple households agree with their employer report of plan type Regarding the specifics
if the respondent reports a pension that is defined benefit or combination the matched
plan description is defined benefit or combination in 58 percent of the cases The
comparable match rate is 49 percent when the respondent reports the plan is DC or
combo In the case of reported plan type there is little difference between financially
knowledgeable respondents or those who are not labeled as financially knowledgeable
respondents However note that each person is talking about their own pension not their
spousersquos pension
Age of eligibility for benefits is another key characteristic of pensions Of those
reporting a defined benefit or combination pension 7 percent of males from couple
households and 12 percent of females from couple households report they do not know
at what age they will become eligible for early retirement benefits Yet for those
reporting a defined benefit pension whose employer agrees the plan is DB there is
agreement between early retirement age reported by respondents and early retirement
calculated from matched firm plan descriptions for 45 percent of males from couple
households and 37 percent of females Turning to normal retirement ages among those
reporting coverage by a defined benefit pension 5 percent of males from couple
households and 10 percent of females report they do not know their normal retirement
age There is agreement on normal retirement age for those with a DB plan between the
respondent report and the value computed from plan description for 37 percent of males
from couple households and 32 percent of women Among financially knowledgeable
respondents women (28 percent agreement with plan descriptions) know less than men
44
(41 percent agreement) about the normal retirement age of their defined benefit pension
Among those who are not the financially knowledgeable respondent women (35 percent
agreement with plan description) know more than men (28 percent) about the normal
retirement age from their defined benefit plans
Skipping to the third row from last in Part B of Appendix Table 2 when those
with defined contribution plans are asked about the age at which they will become
eligible for early retirement benefits 10 percent of men and 18 percent of women report
they do not know
Respondents exhibit similar limitations in their knowledge of benefit amounts as
they did in their knowledge of age of retirement Of those reporting they were covered by
a defined benefit pension 34 percent of men and 52 percent of women from couple
households report they do not know the value of the benefits they will receive from their
plan at normal retirement age In a small minority of cases the benefit at expected
retirement age matches the benefit obtained from employer plan descriptions The match
rates are 20 percent for males from couple households and 16 percent for females from
couple households
For males and females from couple households and females reporting coverage by
a defined contribution pension 30 percent of men and 39 percent of women answer they
do not know what the balance is in their defined contribution pension However most of
these are willing to report their account balance in the form of a bracket which does not
require them to report an exact amount Among those reporting a DC plan 10 percent of
males from couple households and 12 percent of females from couple households report
45
they do not know their plan balances even after presented with ranges of account
balances as an alternative to having to report exact amounts
Having received a report from the Social Security Administration increases the
information available to the respondent Today benefit reports are mailed annually to
respondents Nevertheless some respondents still report they do not know what their
Social Security benefits will be at early retirement age More specifically from Part C of
Table 3 28 percent of men from couple households and 45 percent of women from
couple households report not knowing their Social Security benefits at early retirement
even when given the opportunity to provide an answer in the form of brackets 8
There are similar results concerning benefits at normal retirement age For men
and women from couple households the percent reporting DK are 23 percent and 40
respectively
8 In examining knowledge of Social Security benefits Rohwedder and Kleinjans (2006) consider the changes in knowledge over time They find that HRS respondents do better in reporting Social Security wealth as they approach retirement They conclude that respondents who retired when they planned do a good job of reporting Social Security wealth However a minority misreports their wealth with 17 percent of their sample over or understating their future benefits by 20 percent or more
46
Appendix 2 Variables Used in the Analysis
Variable name Definition
Knowledge Variables DK- Plan type R doesnrsquot know plan type R and firm agree on all plan types (broad restriction)
If self-rep=DBcombamp firm-rep=DBcomb or If self-rep =DCcomb amp firm-rep =DCcomb
Firm and R agree plan is DB
Firm reports DB only self-report DB only
Firm and R agree plan is DC
Firm reports DC only self-report DC only
Firm reports DC amp self-rep DB
Firm reports DCcomb self-report DBcomb
Firm reports DB amp self-rep DC
Firm reports DBcomb self-report DCcomb
DK-ER age for DB R reports dk on the early retirement age for the most important DBcomb plan
DK-NR age for DB R reports dk on the normal retirement age for the most important DBcomb plan
DK-ER age for DC R reports dk on the early retirement age for the most important DC plan
DK-DC balances R reports dk on account balances for the most important DC plan
DK after brackets in DC R reports DK after bracket questions for DC account balances R amp Firm agree on NR age Firm-rep of normal retirement age agrees with self-report within
ranges of 2 years for the most important DBcomb plan DK-XP benefits for DB R reports dk on the benefits at expected age of retirement for
the most important DBcomb plan R amp Firm agree on expected DB benefits
Firm-rep of benefits at expected age of retirement agrees with self-rep for the most important DBcomb plan
DK-SS benefits at ER age R reports dk on social security benefits at early retirement age DK-SS benefits at NR age R reports dk on social security benefits at normal retirement age Current pension wealth Sum of DB wealth and DC balances Current DB wealth Self-rep expected DB benefits from current job Current DC wealth DC balances from current job Cognition Variables TICS Sum of series 7 and backward counting - Sum of correct
answers average for the missing Word recall Average of immediate +delayed recall- Missing values replaced
with the average Numeracy Sum of dummies for 10 chance winning lott and interest on
savings calculations- Each dummy if correct=1 else=0
47
Variable name Definition
sTICS Spousersquos tics sWord recall Spousersquos Word recall sTotal numeracy Spousersquos total numeracy Ddel Dummy var for delayed recall Dimm Dummy var for immediate recall dbwc20 Dummy var for backward counting dser7 Dummy var for series 7 Mischnc Dummy var for missing chance of getting disease Miswnn Dummy for missing Winning lottery Misntrst Dummy for missing interest on savings Other Covariates Public Dummy for if public employee Mispubl Dummy for missing public employee variable Dunion Dummy for union employee Misunion Dummy for missing union employee Dontwrk Dummy for not working Rs Rage Rrsquos age Sage Spousersquos age Rage squar Rrsquos age square Sage square Spousersquos age square Total income Total household income -- used in wealth equations Total income square Total household income square -- used in wealth equations Female Dummy for gender Hispanic Dummy var for hispanic Nonwhite Dummy var for non-white Finr Financial respondent Rschlyrs Rrsquos number of years of education -- used in wealth equations Sschlyrs spousersquos number of years of education -- used in both wealth amp
knowledge equations Dropout If did not finish high school -- used in knowledge equations Somecol R has some college education -- used in knowledge equations Colgrad R has a college degree -- used in knowledge equations Postgrad R has more than a college degree -- used in knowledge
equations Snopen Dummy for spouse with no pension Snomatchspd Dummy for spouse with no matched spd sswca50 SS wealth if claim now le 50k -- used in knowledge equations sswca100 SS wealth if claim now lt= 100k gt 50k -- used in knowledge
equations sswca150 SS wealth if claim now lt= 150k gt 100k -- used in knowledge
equations sswca200 SS wealth if claim now lt= 200k gt 1500k -- used in knowledge
48
Variable name Definition
equations sswca201 SS wealth if claim now gt 200k -- used in knowledge equations dmsswca Dummy var for missing ss wealth at claim now age -- used in
knowledge equations
49
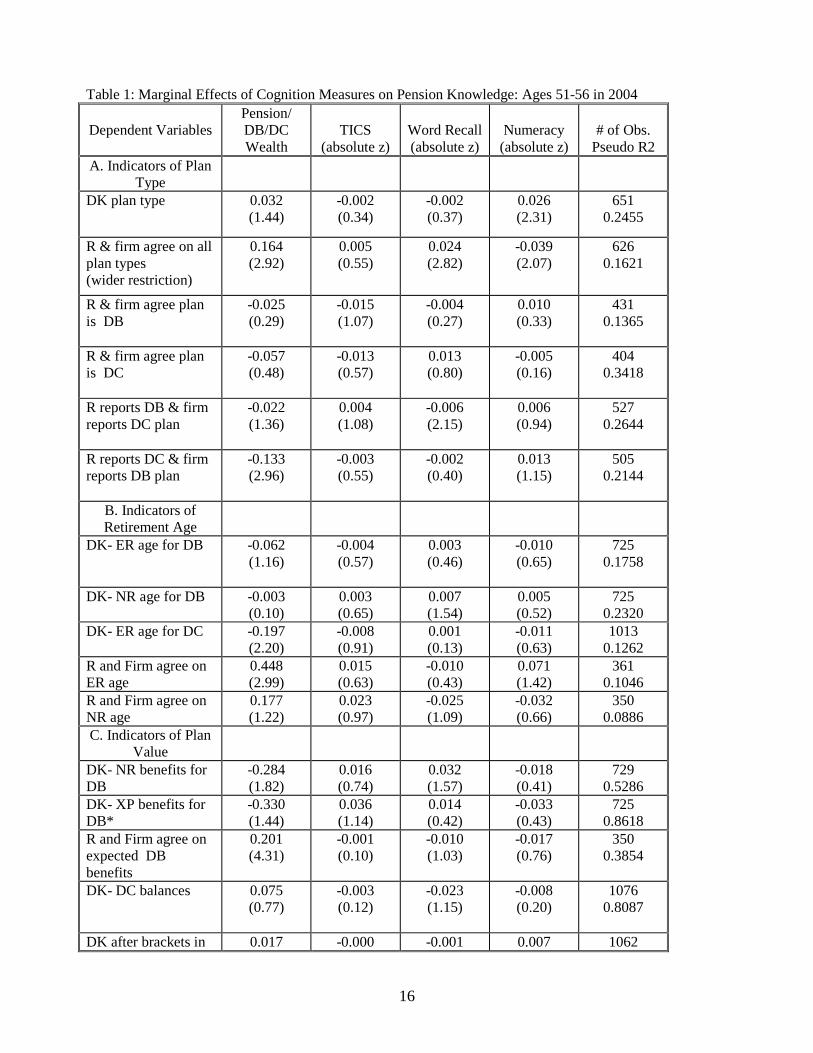
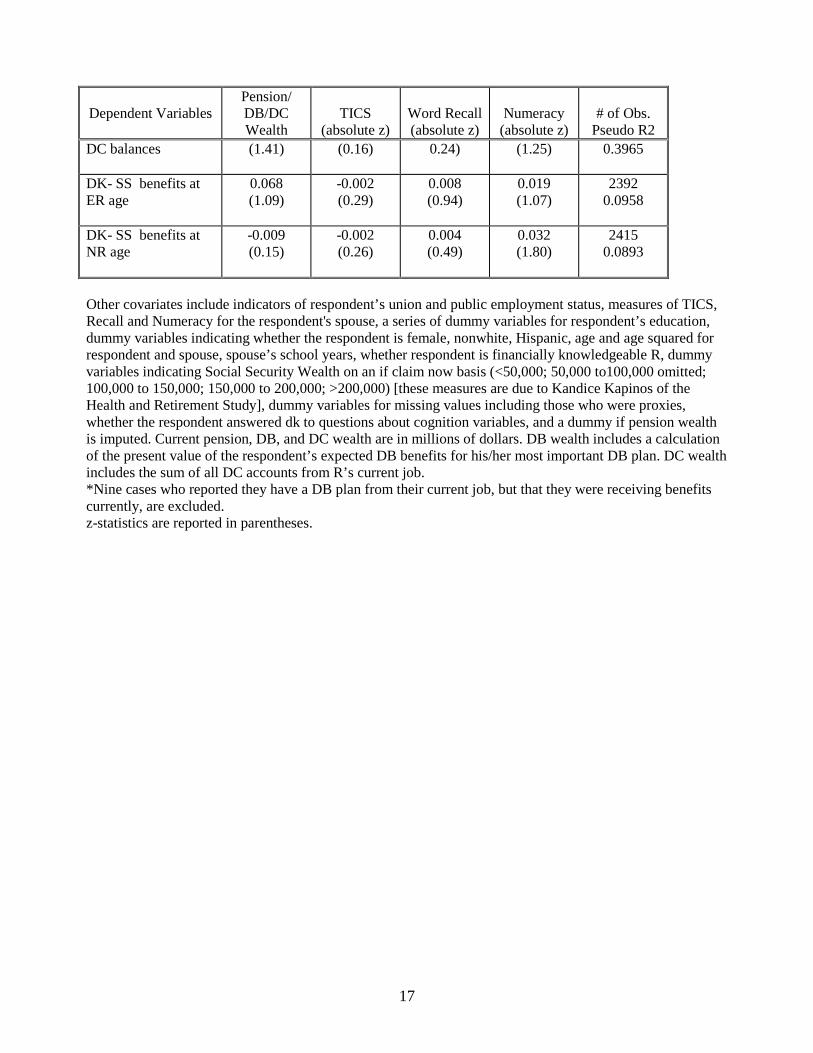
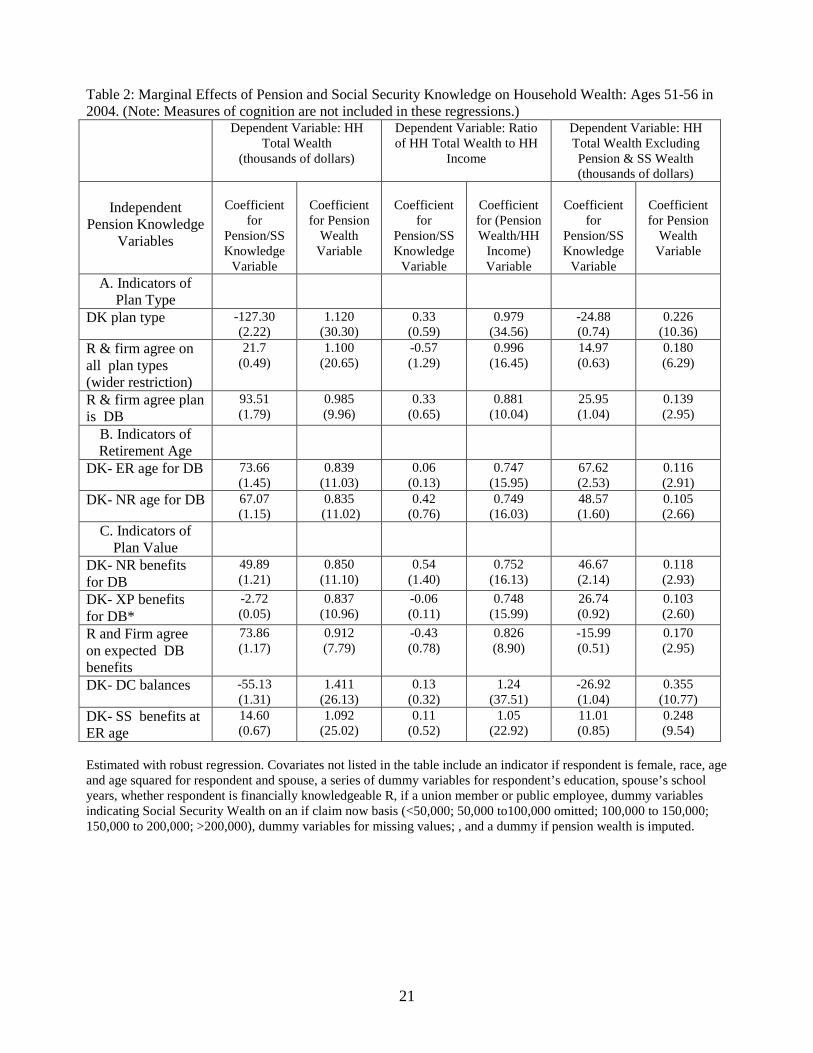
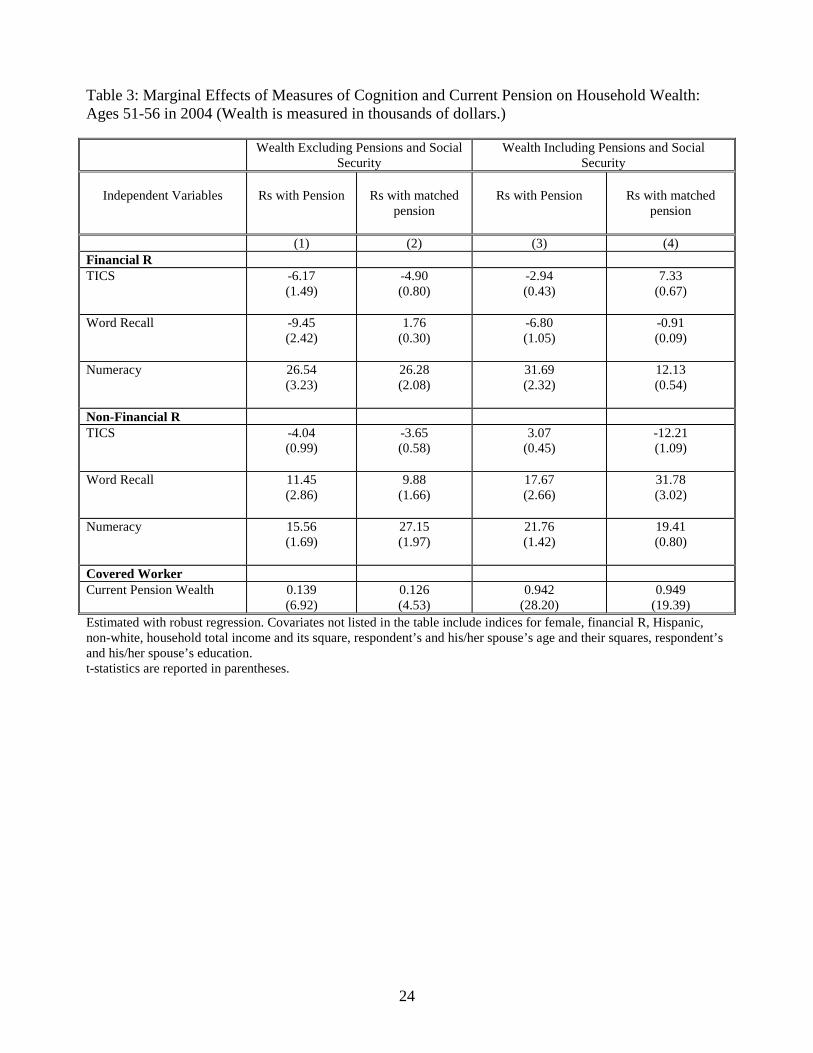
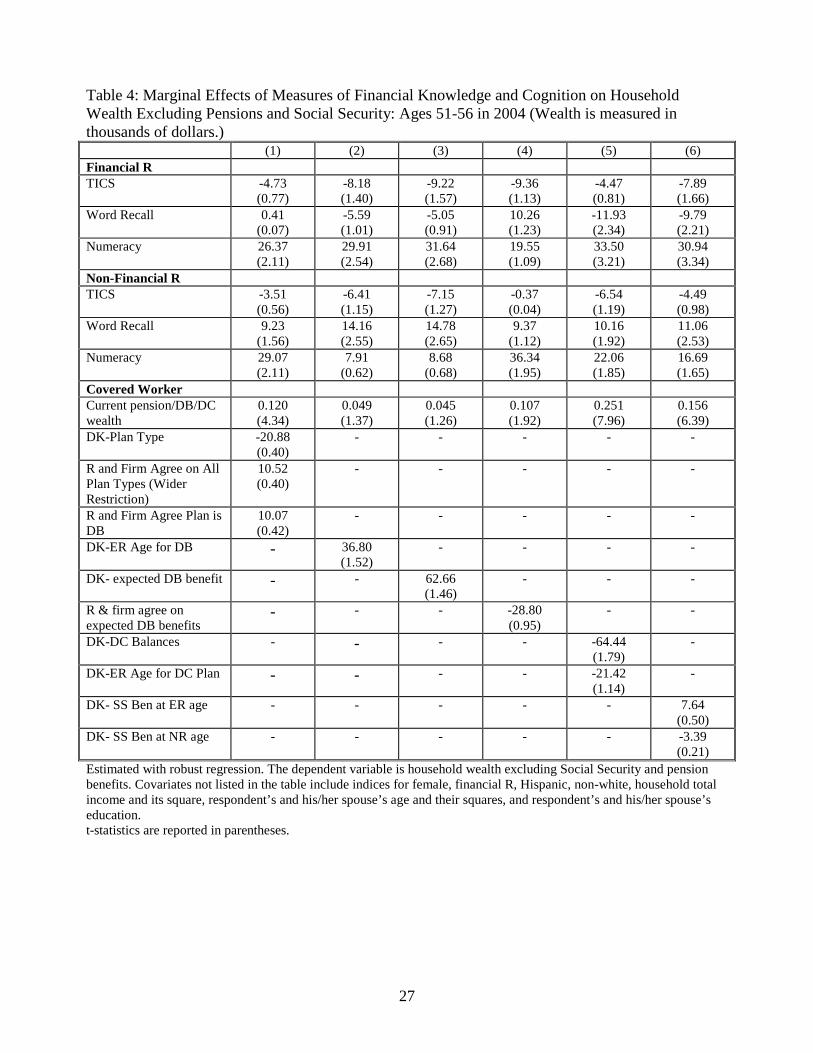
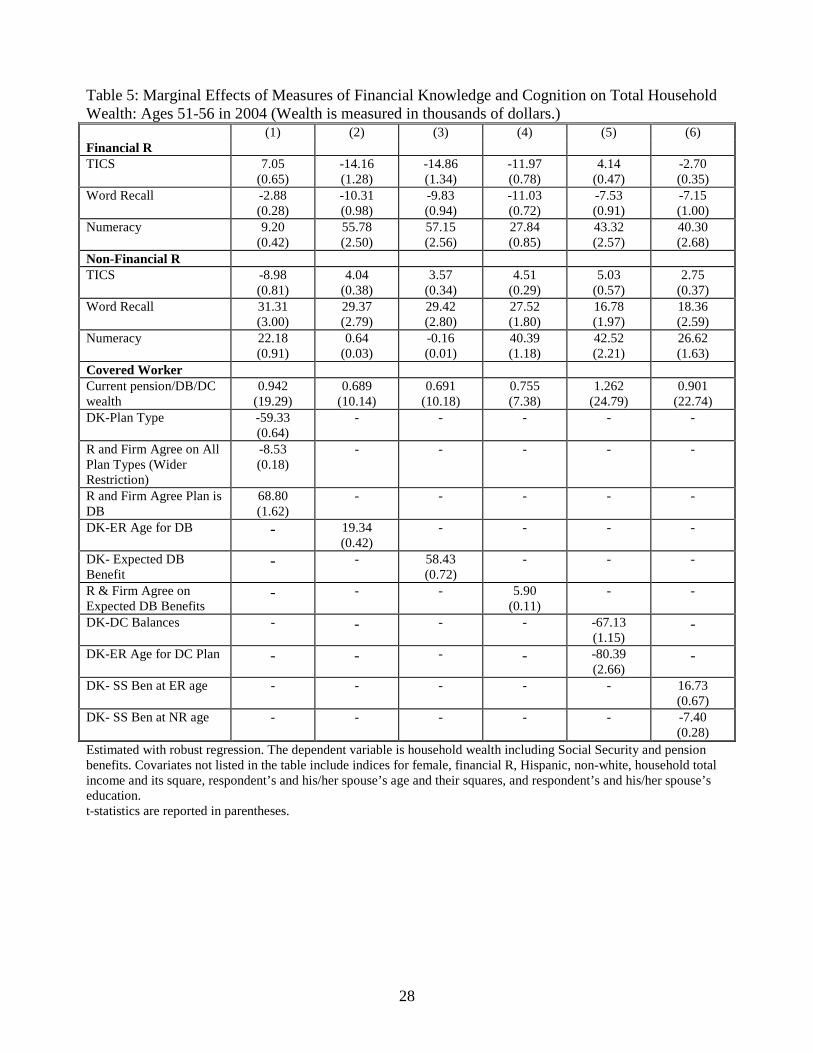
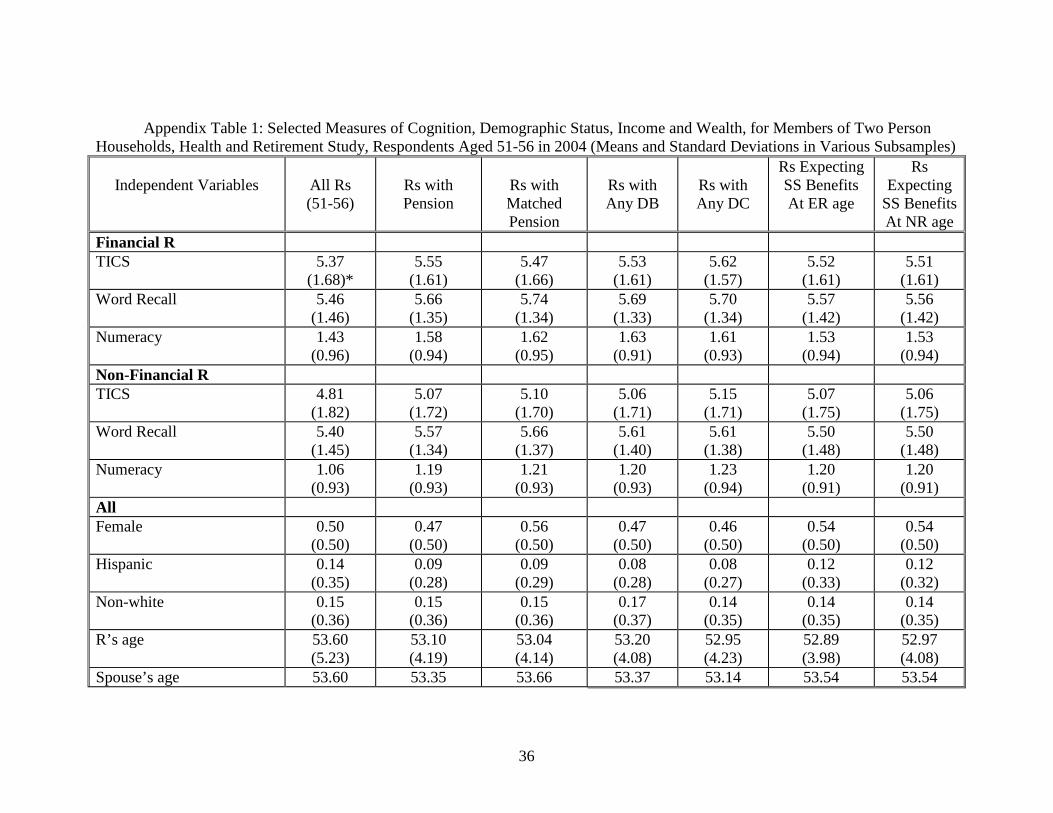
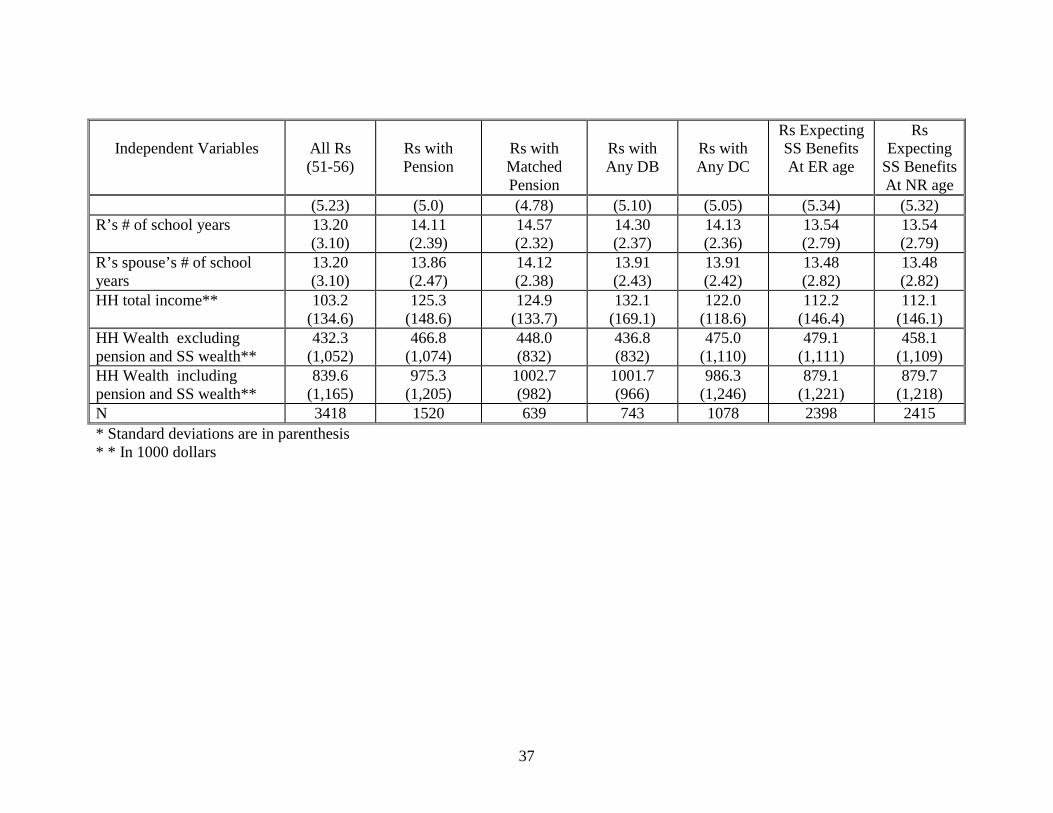
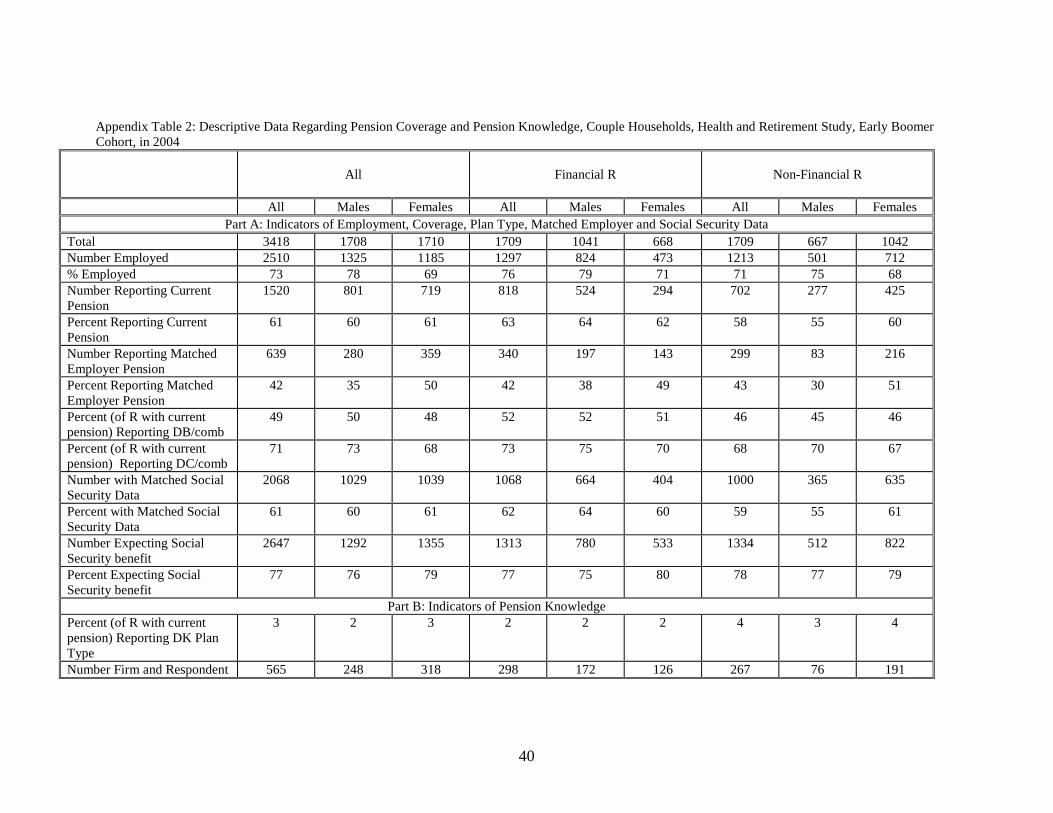
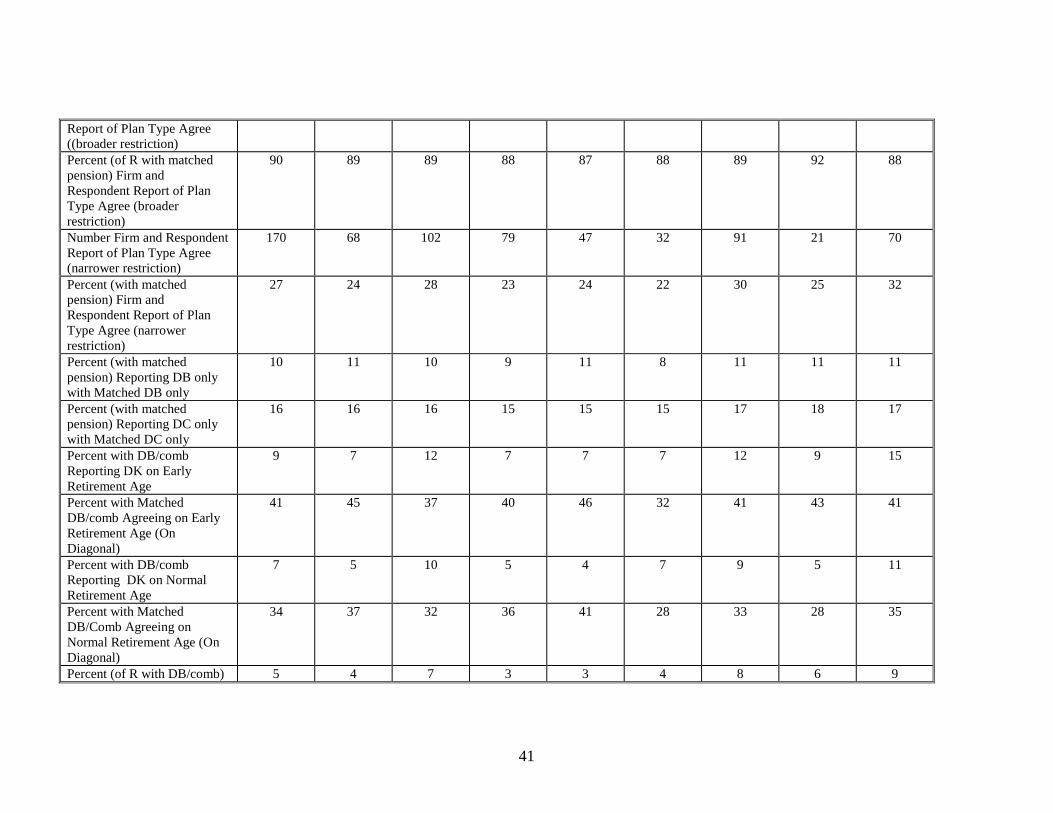
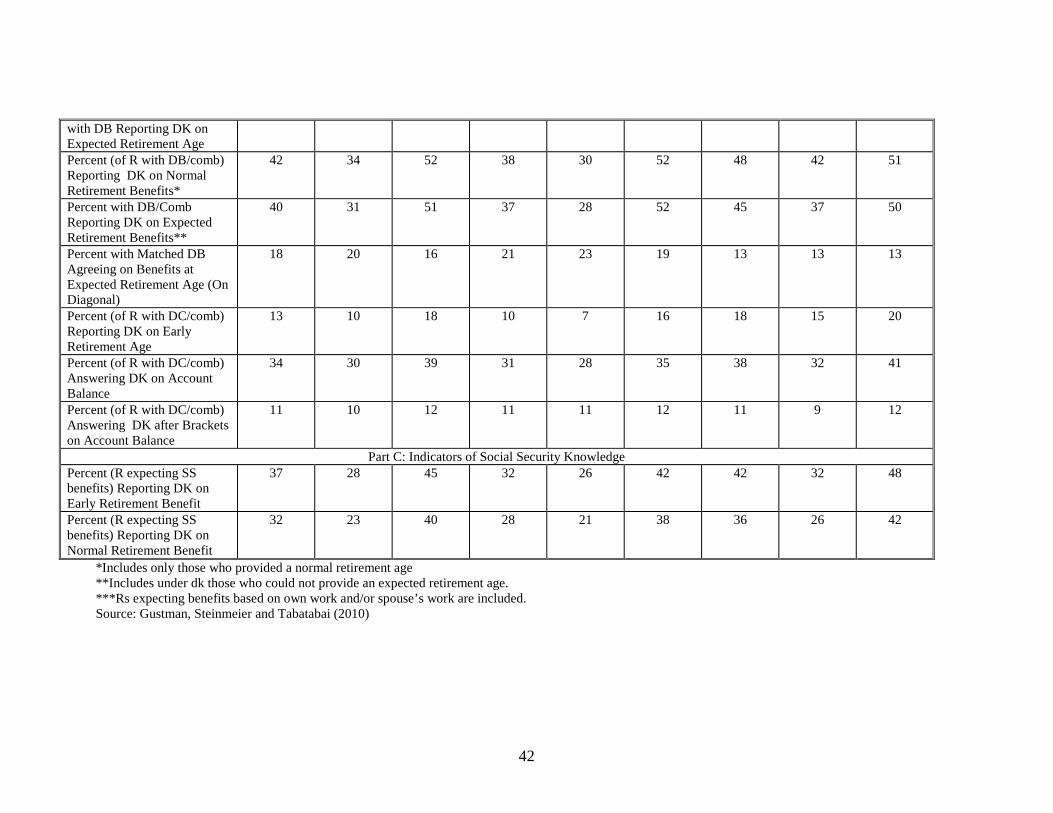
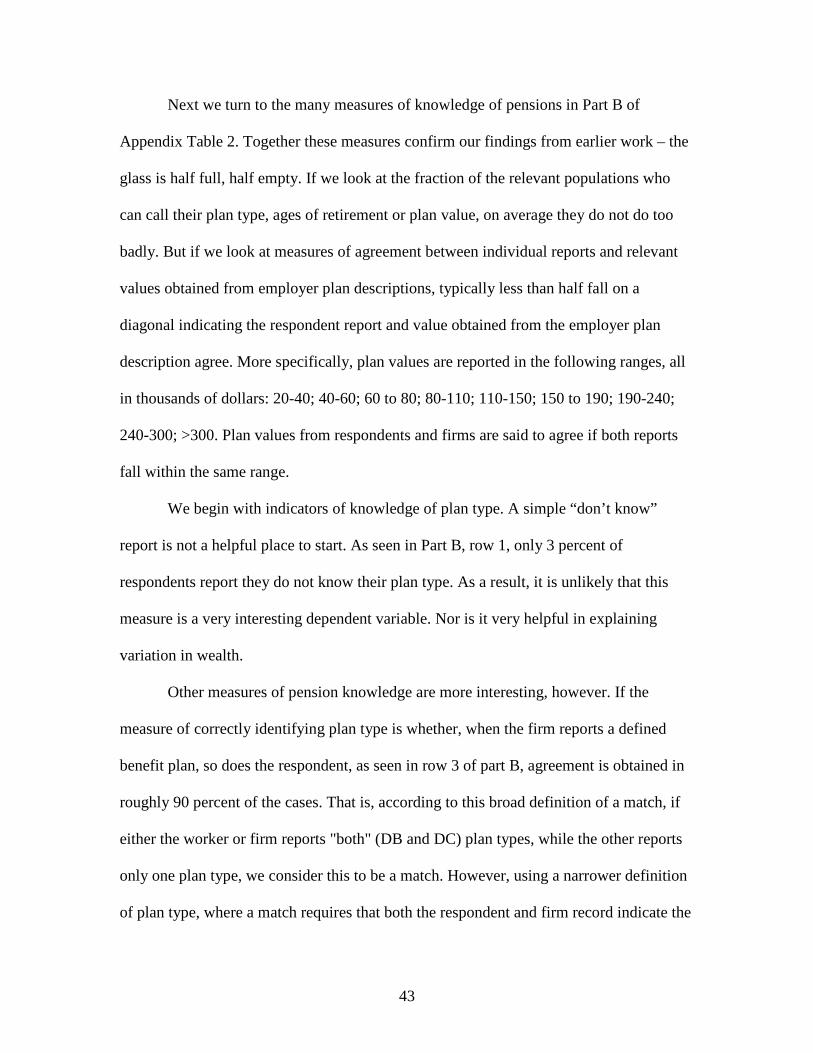
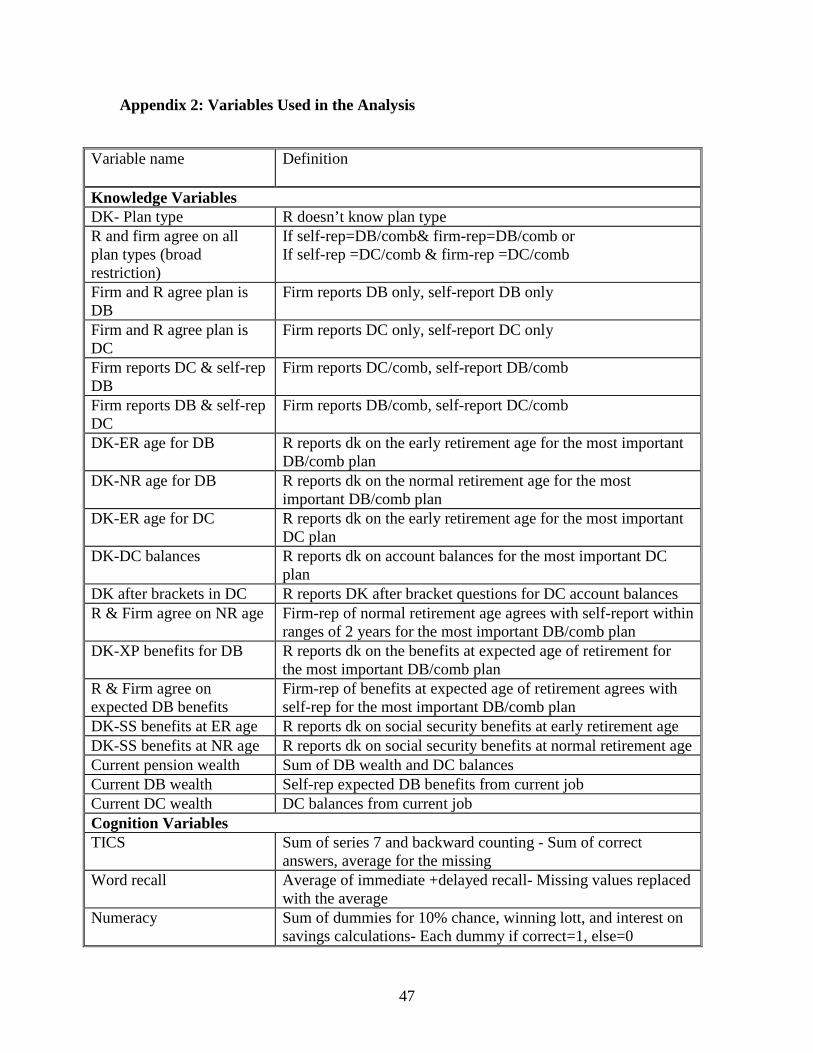
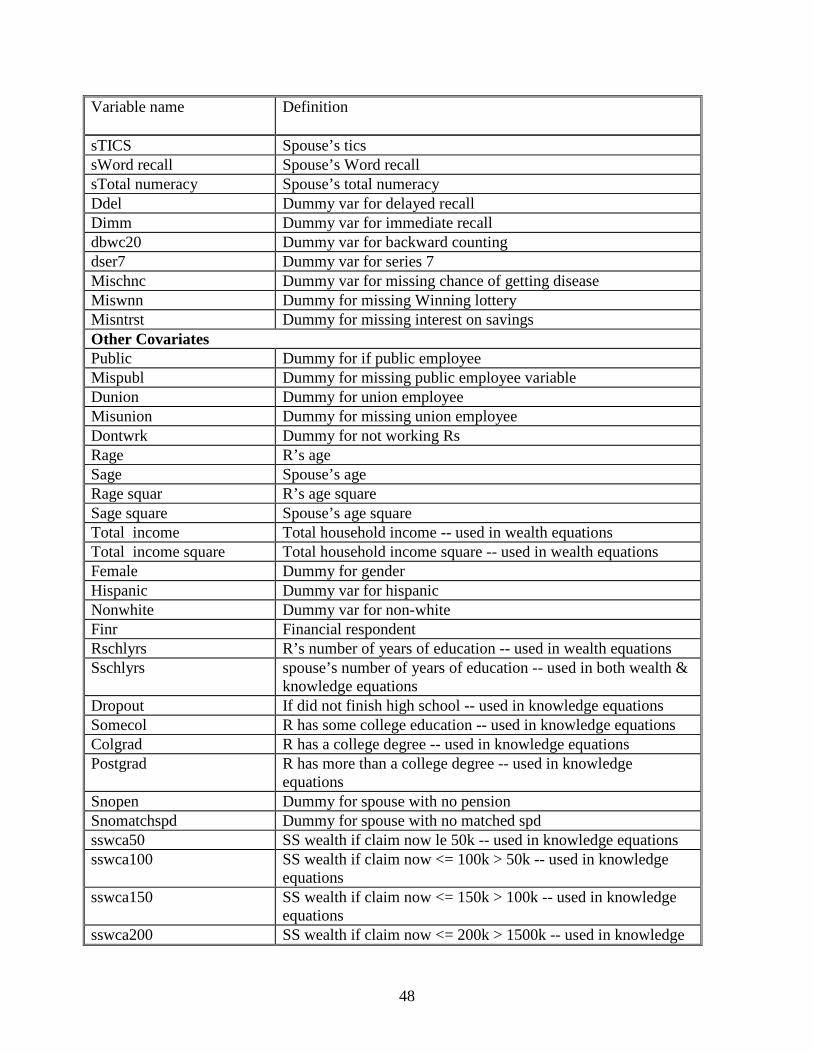
Variable name Definition
equations sswca201 SS wealth if claim now gt 200k -- used in knowledge equations dmsswca Dummy var for missing ss wealth at claim now age -- used in
knowledge equations
49