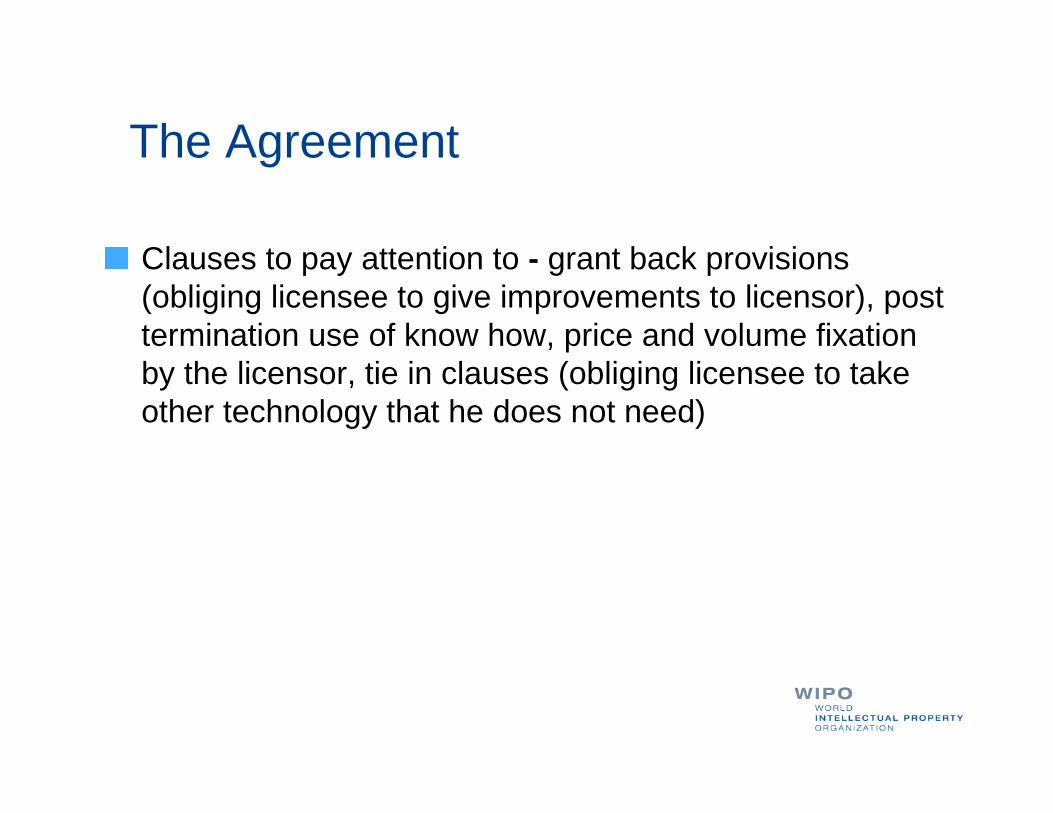
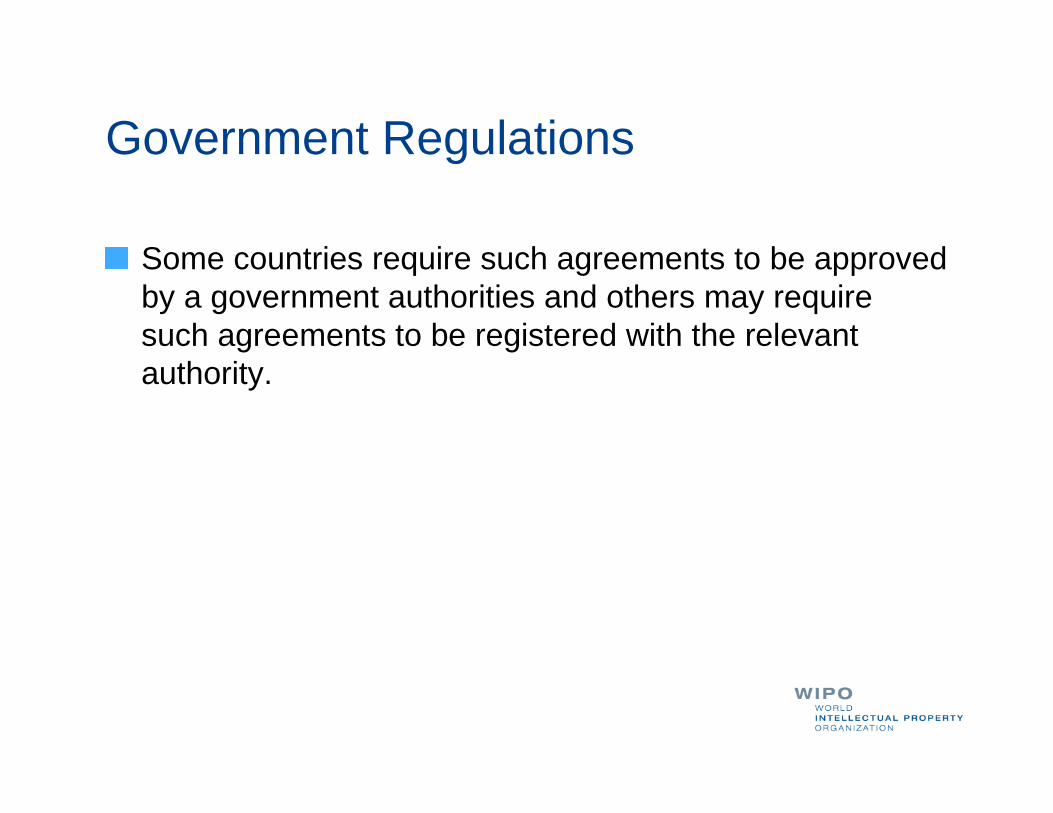
Embed Size (px)
Citation preview
University of Alaska Anchorage
College of Arts & Sciences
Computer Science, Mathematical Sciences
Android System Display for Sensor and Automation
by
Brent Gonzales
Supervisor:
Prof. Cavalcanti, PhD
A CAPSTONE PROJECT SUBMITTED TO THE DEPARTMENT OF COMPUTER
SCIENCE, MATHEMATICAL SCIENCES, AT UNIVERSITY OF ALASKA
ANCHORAGE, FOR THE DEGREE OF COMPUTER SCIENCE.
Anchorage AK, May 2015.
Abstract
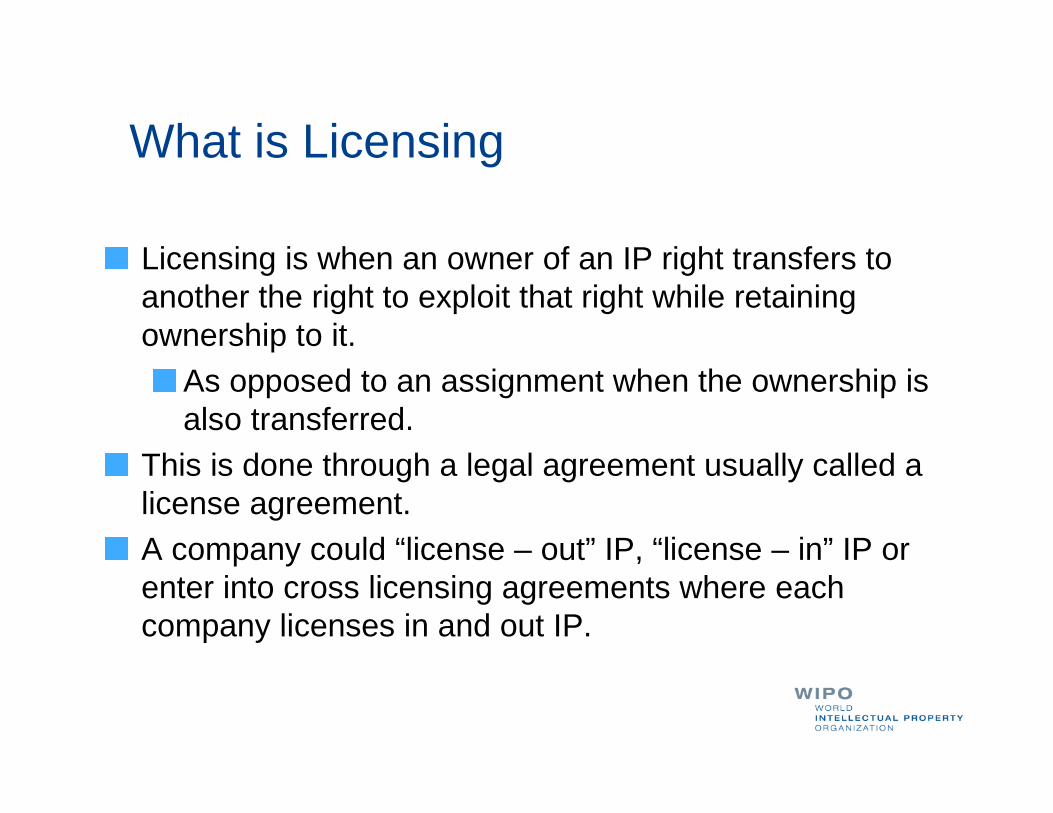
The purpose of this document is to describe, explain, and present the capstone project finished by
Brian Kapala, Sukjin Yooh, Nailya Galimzyanova, and Brent Gonzales. The capstone project is
titled Android System Display for Sensor and Automation. The purpose of this project is to
display engineering data and relevant announcements from UAA around the UAA campus,
specifically the Engineering and Industry Building. Also, the project will be available for website
and Android device access to all users.
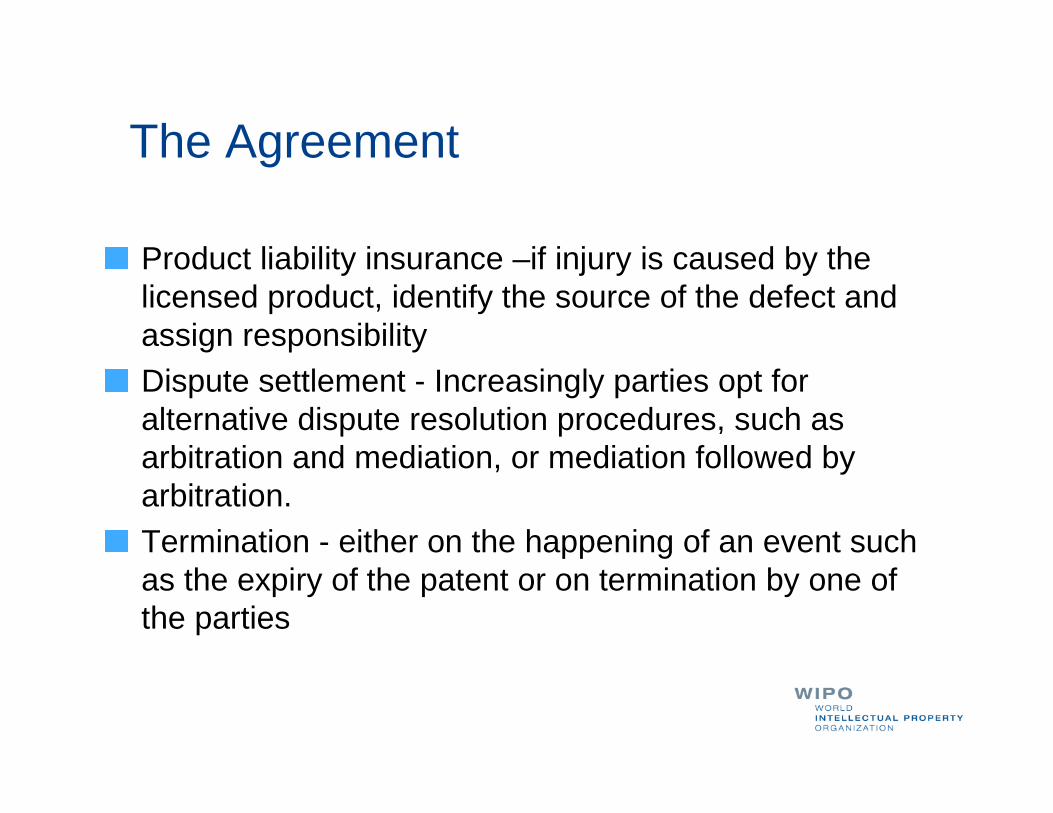
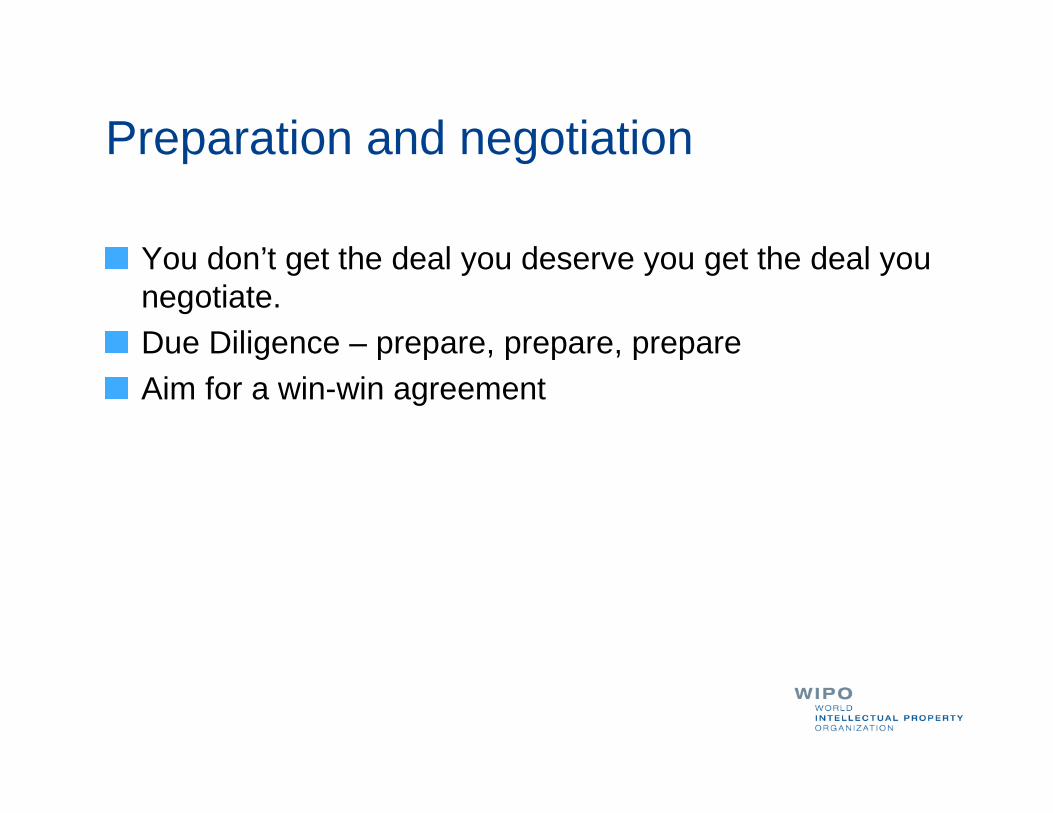
The project includes five main sections: introduction, gas, electricity, temperature, and
announcements. The introduction section displays a warm welcome to the user explaining what
the application is. Gas, electricity, and the temperature section display graphs relevant to the
selected building. The announcement section displays relevant news or awards about UAA. The
user interface of the application functions in two ways. A user is able to interact with the
application at any time. If there are no users interacting with the application after a certain
amount of time, the application will change state into a slideshow-like manner, shifting between
tabs, graphs, and pictures under a specified time frame.
The project was developed in two ways: through a website and through Android. The reason why
we chose to split the project in two is because we were donated touch screen monitors by
Siemens. We concluded that the best way to present the project on these monitors is using an
Android operating system. A website on touch screen monitors would be somewhat messy due to
the nature of webpages being designed from mouse and keyboard use rather than Android device
usage. However, it was still desirable to have a website due to the request to have all devices able
to use the application.
The website uses the technologies HTML, JavaScript, jQuery, PHP, and C#. The Android uses a
Java based framework and the Android API. To develop, the Android software developers had a
choice to use Eclipse or Android Studio as an IDE. We chose Android Studio due to the Android
development community moving from Eclipse to Android Studio as their main IDE. Android
Studio is heavily more dedicated from Android development compared to Eclipse.
Our software development team used the Agile Methodology to develop the system. It was
unclear what the requirements were for the project, so we were unable to choose the Waterfall
Methodology. We needed to pick a methodology that responded well to change and Agile fit that
description. Professor Cavalcanti acted as the client in the project. The software developers
presented iterations to the customer on a weekly basis. Also, the software developers met weekly
providing a great team environment, which further help justify why Agile was a good idea.
ACKNOWLEDGEMENTS
The completion of this capstone project was the result of the hard work and support of many
different people. I would like acknowledge all of their help throughout the project.
Firstly, I would like to thank Professor Cavalcanti, the supervisor of the project. He had brought
the project to the group’s attention, and worked through various meetings and discussions in
order to move the project along.
Next, I would like to thank all of my of my group members, Brian Kapala, Sukjin Yooh, and
Nailya Galimzyanova for all of their hard work and determination to work together, meet
frequently, and develop a high quality piece of software.
I would also like to thank UAA for the opportunity to create software that is worthwhile.
I thank Siemens who was very patient and willing to collaborate with us through meetings and
allowing us to connect to their database.
Lastly, I would like to thank my family and friends who supported and encouraged me
throughout my capstone project.
Table of Contents 1 Introduction ................................................................................................................................5
1.1 Introduction ............................................................................................................................5
1.2 Application ............................................................................................................................7
1.3 Motivation ..............................................................................................................................9
1.4 Recent Developments ...........................................................................................................10
2 System Integration and Modeling ..........................................................................................11
2.1 Technology Used for Implementation ..................................................................................12
2.2 Design View of System Architecture ...................................................................................13
2.3 Components Used in Project Development .........................................................................16
2.4 Coding Methodology ............................................................................................................17
3 Design and Testing / User Interface .......................................................................................19
3.1 Project Management .............................................................................................................19
3.2 Test Cases .............................................................................................................................22
3.3 User Interface .......................................................................................................................23
List of Figures 1.1 A simulation of the finished UAA Engineering & Industry Building ...................................6
1.2 Lucid Design Group’s software that displays similar data to what the project entails for
University of Alaska Fairbanks. ..................................................................................................7
1.3 The touch screen monitor supplied by Siemens to be displayed in the UAA Engineering &
Industry Building. .........................................................................................................................9
1.4 The logo for Github, the Git repository hosting service the developers chose to use for the
project ...........................................................................................................................................9
1.5 The HTC Dream, the first commercially released Android device.. ....................................10
2.1 The logo for Android Studio, the integrated development environment chosen for
developing the ASDSA system. .................................................................................................12
2.2 A picture laying out the organization of the structure of Android applications ...................13
2.3 The prototype of ASDSA after a few weeks of development ..............................................14
2.4 A visual representation of the activity stack in an Android application. .............................16
2.5 The Nexus 7, the Android development machine mainly used for development. ...............17
2.6 The Gantt chart for project development .............................................................................19
3.1 A study was done to compare both the waterfall and agile methodologies based on
completion rate ...........................................................................................................................20
3.2 A diagram showing the flaws of the waterfall model.. ........................................................21
3.3 The Agile Roadmap to Value from Agile Project Management For Dummies by Mark C.
Layton .........................................................................................................................................22
3.4 An example of the testing framework for Android development ........................................24
3.5 Picture of the user interface half way through development. ...............................................25
Chapter 1
Introduction
1.1 Introduction
Android System Display for Sensor and Automation (ASDSA) is an application created for the
purposes of displaying engineering information on television sized monitors located in the
Engineering & Industry Building at the University of Alaska Anchorage (UAA). A webpage and
Android based version of the application has been developed mainly by five computer science
students at UAA. An interface for administrators has been developed for the purpose of
populating useful information to the application when necessary.
ASDSA has a variety of features. Its main purpose is to display engineering information for
public display in a screensaver-like technique. It also displays relevant information about UAA,
such as recent accomplishments or recent events. The secondary features include an indoor
navigation system and an administrative interface.
Figure 1.1: A simulation of the finished UAA Engineering & Industry Building.
T. Bartlett Quimby, the dean of the College of Engineering at UAA, is one of the main driving
forces behind the project. The Engineering & Industry Building is currently under construction
and is set to be displayed on July 1, 2015. It is his vision to have the ASDSA application
available for display before the building opens to the public. The utilization of the application for
the engineering building’s opening day will allow the building to look more professional,
creative, and impressive to the visitors.
Figure 1.2: Lucid Design Group’s software that displays similar data to what the project entails
for University of Alaska Fairbanks.
The application displays electricity, water, and heating used during specific times. The
information is particularly useful to engineering professors, researchers, and students at UAA.
They are able to receive the information in real time from a variety of devices: the television
sized monitors in the Engineering & Industry Building, an Android device, or a webpage that can
be accessed by any device.
As stated before, the project is developed mainly by five computer science students: Brent
Gonzales, Brian Kapala, Sukjin Yooh, and Nailya Galimzyanova. The project was supervised by
Professor Adriano Cavalcanti, who also offered assistance during development. Other than
development, there are other groups who have assisted us with the project. Siemens, an
engineering company working on the building of the new engineering building at UAA, has
sensors placed inside the building to collect data for use in the application. UAA Facilities
provided us with data at the start of development with the purpose of creating a prototype that
later on was converted to work with the sensors of the new engineering building. The UAA IT
department provided a server where we can store the data received from Siemens.
The webpage application is developed using HTML, Javascript, jQuery, PHP, and C#. The
Android application is developed using the Java and Android API. The student developers
divided into two groups. The web developer is Nailya Galimzyanova. The Android developers
are Brent Gonzales and Sukjin Yooh. Brian Kapala was responsible for the backend database for
both versions of the application.
1.2 Application
As stated previously, two versions of the project were created: one accessible from a webpage
and one available on Android devices. At the start of development, a meeting was held between
the student developers, the supervisor, UAA Engineering, and Siemens. It was stated that the
monitors being supplied are Windows 8 computers. At first, the assumption was to create a
webpage to be displayed on the monitors. Following through with that plan would provide
application access to the monitors and users of any device. However, the developers determined
that it would be desirable for the monitors to have an Android interface, due to Android’s look
and feel being more suitable for a large touchscreen monitor compared to a webpage. Therefore,
the developers formed two separate groups to tackle a webpage version and an Android version
of the project.
Figure 1.3: The touch screen monitor supplied by Siemens to be displayed in the UAA
Engineering & Industry Building.
Both versions of the application run similarly. The application’s state depends on whether or not
it is being interacted with or not. If there is no user interaction, the application goes into
slideshow mode. Slideshow mode displays the engineering data and other relevant data about
UAA. This data is provided by the UAA Administration through the use of an administrative
interface. The administrative interface is linked to the application to allow updating in real time.
If there is user interaction within the application, the user may manually move been slides in the
slideshow or pick which type of engineering data they would like displayed. They are able to
access a variety of secondary features as well. After a period of time of interaction from the user,
the application defaults back to slideshow mode.
In slideshow mode, animations are used frequently. They are used specifically when the
slideshow automatically changes to another slide. Text and pictures fade in and move to a
position as opposed to being immediately displayed on the screen. This is to make the
application look fluid, professional, and unique. Custom sounds that function based off user
interaction have been integrated as well for the same reason. The sounds that have been added
are minimal; they are not to distract the user, but to enhance the feeling of pressing a button or
swiping a screen.
Figure 1.3: The logo for Github, the Git repository hosting service the developers chose to use
for the project.
The student developers and the supervisor used Github as our Git repository hosting service.
This provided us with distributed revision control and source code management functionality. In
other words, with a total of five people developing on the same project, Github allowed us to
structure the code in an organized way. A student developer would work on a portion of the code
and request a patch be made to the project. Then, the supervisor would review the patch and
either accept it or deny it. Also, GitHub is version control software, meaning that if two
developers worked on the same code at the same time, GitHub would have the tools necessary to
combine the code together (“GitHub For Beginners: Don’t Get Scared, Get Started,” 2013).
We chose to place the BSD license on the project. The BSD is a permissive and simple software
license that allows other software developers to freely use the software, but is not responsible for
how it is used. This was decided to be the best course of action because the project is academic
based; the goal is not revenue. The BSD license protects the student software developers and
UAA, the eventual owners of the software.
1.3 Motivation
Webpage development has come a long way than what it used to be. The World Wide Web was
invented about 25 years ago by Tim Berners-Lee, a software engineering who worked at a large
particle physics laboratory. He desired to have a set of technologies that would allow the Internet
to become useful and accessible to the average person. Around the end of 1990, he was
successful and the first Web page was created (“History of the Web,” n.d.).
After the World Wide Web was created, the importance of web development increased further. It
became inconvenient for users to always have to use software on their operating system. This
was also an inconvenience for software developers because they have to create multiple versions
of the software to function correctly on multiple devices. This pushed towards a movement to
create websites with the sole purpose of running software. This allowed for a development team
to create only one version of the project to be applicable for everyone with a browser (“A really
brief history of web development,” n.d.).
The web development part of this project can be thought of simply as software built into a
browser. The main purpose for creating the software into the web is to allow most computing
device with internet access to use the software. This will maximize the amount of people who
use the software.
UAA is in the process of reforming the technologies it is using. Currently, it is using ColdFusion
but will eventually switch over to .NET/C# technologies. Because of this, the web development
portion of the project will be programmed in C#. As of yet, it has not been currently decided who
will maintain the software of ASDSA. However, it is preferable to use more updated technology
on the chance UAA will maintain the software.
Figure 1.5: The HTC Dream, the first commercially released Android device.
In 2003, Andy Rubin, the co-founder of Android Inc, stated that there is “tremendous potential in
developing smarter mobile devices that are more aware of its owner’s location and preferences”
(“A complete history of Android,” 2008). In 2005, Google purchased Android Inc.
Android devices are used frequently enough around the UAA campus that UAA has created the
app “UAA Mobile,” an app that allows users stay connected with UAA, find out how to get
around campus, and look up course schedules. Students and facility at UAA are likely to be
familiar with an interface that has an Android look and feel. Because of this, the touch screen
monitors displaying our application was implemented in Android. The software development
team feels that a touch screen monitor should be implemented using a framework that is
designed for touch and swiping gestures.
The UAA Engineering & Industry Building is opening July 2014, before the ASDSA software
was developed. It is unlikely that many people know the layout of the building. It would prove
useful to have indoor navigation available for confused students and facility.
1.4 Recent Developments
According to a study by The Nielsen Company in 2014, in the United States, about 52% of
mobile users are using an Android device and about 43% of mobile users are using an Apple
device (“By the Numbers: iPhone vs. Android,” 2014). This wasn’t always the case in the past.
Chapter 2
System Integration and Modeling
2.1 Technology Used for Implementation
For a software development project, it is helpful to make use of an IDE, or an integrated
development environment. An integrated development environment is a “set of programming
tools for writing applications (source code editor, compiler, debugger, etc.), all activated from a
common user interface and menus.” (“IDE Definition from PC Magazine Encyclopedia,” n.d.).
Essentially, we believe that an IDE is a required tool for efficient software development. The
main developers had a couple choices for the main IDE to use for software development. The
choices considered were Eclipse and Android Studio.
Eclipse is available for development in multiple different languages, with Java being its main
focus. Android offers a plugin for Eclipse, called Android Development Tools. Eclipse has been
a successful IDE for over 10 years. Most of our developers regularly use Eclipse for
development for most purposes.
Figure 2.1: The logo for Android Studio, the integrated development environment chosen for
developing the ASDSA system.
Android Studio was created only for the purpose of Android development. The first stable
version was released in December 2014. None of our developers had used Android Studio
before.
We were hesitant to choose Android Studio because of how new it was and due to the fact we
were all used to Eclipse. However, a software development team must adapt to the most useful
and efficient technology available. Android Studio is now considered in many circles as the
official IDE for Android development. Because the application is much newer and optimized for
just Android development, it runs considerably faster than Eclipse. The interface is tailored
completely to the idea of Android development; the project files hold no clutter unlike the
Eclipse counterpart. Also, Android Studio allowed for real time simulation of what the Android
application would look like on the device through the use of a convenient preview screen.
While the computer monitors donated by Siemens originally had the Windows 8 operating
system on it, we found it necessary to tailor the application with more of a tablet look and feel
instead of a computer look and feel. The reason for this is because the monitors are touch screen
and interactive through the use of swiping. These types of interactive capabilities are not usually
intuitive when you have access to a mouse.
We have decided to dual partition the monitors with an operating system which are targeting
tablets. The main operating systems for tablets are Android OS and iOS. All of the developers
agree that Android OS is the best decision for the project. There is a lot of support for dual
partitioning a computer with Android OS, whereas the support for iOS is nonexistent. Also, all of
the developers are well versed in Java, the language mainly used for Android programming. iOS
uses Objective-C and Swift, languages that nobody has been familiarized with.
2.2 Design View of System Architecture
Android programs based in Java have a common structure to them. This includes a manifest file,
resource files, an automatically generated R file, activity files, and miscellaneous files.
Figure 2.2: A picture laying out the organization of the structure of Android applications.
As stated on Android’s Developers website, “every application must have an
AndroidManifest.xml file (with precisely that name) in its room directory. The manifest file
presents essential information about your app to the Android system, information the system
must have before it can run any of the app’s code.” (“Android Manifest,” n.d.). Particularly for
this project, the manifest file has many uses. Firstly, it provides an access point to the first screen
when the application is started up. It also acts as a container for reference points for all other
possible screens (or activities) the application may use. Lastly, the application is only to be used
in a landscape mode. The reason why we chose this design choose is because the application will
be displayed on touch screen monitors that are mounted to the wall. These devices will not have
the capability to rotate. Consequently, to be consistent, we have required all devices to force
landscape mode when using our application. This functionality is acquired by listing the
restriction inside the manifest file.
Resource files provide layout functionality, picture functionality, and customization for the
application. For an Android application to function correctly in multiple screen settings, layouts
must be utilized (“Resources Overview”, n.d.). Without layouts, Android programmers would
have to create interfaces using a pixel system. Using pixels to display widgets on the screen is
not recommended due to the various screen sizes that are possible for Android devices. There are
multiple different types of layout managers in Android. The layout manager that will be utilized
the most is relative layout. Relative layout lets you position widgets relative to either the parent
widgets or sibling widgets.
Figure 2.3: The prototype of ASDSA after a few weeks of development.
To provide pictures at run time for Android, they can be stored inside the application using
resource files. ASDSA’s prototype used many images in resource files. This prototype allowed
the testing of the announcement tab found at the bottom right of the screen. The announcement
tab is designed to provide large pictures that look similarly to brochures. Eventually however, the
main goal is to allow the administrators of University of Alaska Anchorage to post various types
of announcements onto the ASDSA application announcements tab. When this is officially
implemented, there will no longer be a strong use for stored resource files. The reason is because
stored resource files act as an offline tool for the Android application. This type of approach
would not be feasible in an application that needs to be updated in real life. The administrators
would have to implement an update themselves and require all of their users to update as well.
Alternatively, instead of resource files, we are using a database that the administrators will
connect to. The application will check a certain location of the database on a server to see if
there are any updates from the administration. If there are, the application will update on all
devices simultaneously as long as each device as an internet connect.
Picture resources have another place in the ASDSA application besides prototypes. Our icon is
considered an important picture resource because it gives the user prior information on what our
application is going to look like and react when opened. There are also some customization
features in the ASDSA application. The interface is designed to be colored similarly to the colors
of the University of Alaska Anchorage, which is green and gold. To increase the look and feel,
gradients are used so the application looks more interesting, as opposed to a pure color. When a
tab is pressed, the pressed tab has a lighter shade of green and all of the other tabs have a darker
shade of green. This is done also by using picture resources.
Resource files are mostly used during run time, or in other words, when the program begins
execution. For example, when the ASDSA application begins, Android reads the layout resource
files and determines where to place all of buttons and other widgets. However, there are times
where it is necessary to manipulate widgets or other types of resources in a dynamic sense, or in
other words, after run time. This is done in the actual programming code execution. For the Java
code to reference the resource files, under the covers Android Studio automatically creates what
is known as the R.java file. This file is responsible for linking the resource files to the code. It
works by generating an identification number for each resource or widget. Inside the code, there
is a convenience method accessible by Android Activity Classes called findViewById which can
utilize the R.java file to obtain the resource or widget. It is also worth noting that the R.java file
is not designed to be changed by the programmer.
An activity can be thought of as the screen that is displayed to the user on an Android device.
This activity file usually has a corresponding layout resource file attached to it in order to
provide an interface. When the user interacts with the screen of the Android device, the user is
technically interacting with the activity file. Depending on the context of the Android
application, there will either be only one activity or many activities. It is in a rare circumstance
that an Android application will not have any activities.
Figure 2.4: A visual representation of the activity stack in an Android application.
For ASDSA, we considered the design choices of using one activity compared to using multiple
activities for the entire application. If only one activity is used throughout the application, the
interface design may look cleaner. However, the programming code and layout resources are all
centralized into one area, which may result into cluttered code. If multiple activities are used
throughout the application, code will ultimately be cleaner. Certain functionalities of the
application can be split into their own respective files. However, this comes with the cost of a
fluid looking interface. In order to change activities, Android has to close the previous activity
and open a new one, which may result in a user interface transition that does not look as fluid as
it could. There is another advantageous quality to include multiple different activities. As
activities are created, the previous activity is not necessarily destroyed. The previous activity is
stored on what is called the activity stack. The activity stack can be thought of as a location for
previous activities to be stored in a stack. A stack is an abstract data type that allows elements of
the stack to be stored in a last-in first-out idea. In other words, the most recent element that
enters the stack is the first to be removed from the stack. In Android, if an activity exists and a
new activity is going to be created, the existing activity is stored on the top of the activity stack.
This is important for Android to know because of the back button. By default, when the back
button is pressed, it looks at the top of the activity stack and reloads that activity. The obvious
problem that comes with only having one activity there is no predefined behavior for the back
button (besides exiting the entire application). If an application is created with only one activity,
and the back button is utilized is some way, the developers have to manually create functionality
for the back button. This further clutters the code because it is a job normally suited for the
Android API.
After balancing the pros and cons of using multiple activities compared to one activity, we
decided it would be best for our application to only use one activity. ASDSA is an application
designed to look aesthetically pleasing. It is a priority for the application to look fluid,
professional, and have expected behavior. While cleaner code is important, we predict that it is
unlikely that this software will be updated or improved much later in the future, lowering the
importance of good code design. However, we will still make the attempt to have the centralized
code well documented and logically and cleanly ordered. As stated before, the application will
mainly be displayed on public view using large touch screen monitors. When a user opens an
application, usually they have access to the application itself and the navigation bar. This is
functionality we do not want to give users of the large touch screen monitors. Through some
tweaks of the Android operating system, we were able to display an app and make it not possible
for a user to close. By doing this, we have effectively removed the back button from the
application. Because of this, the importance of the default behavior of the back button had does
not carry any weight for this particular application.
2.3 Components Used in Project Development
For our application, we chose to develop with a Nexus 7. The reason is because in the Computer
Science and Engineering department at UAA, one of the professors has extra tablets available for
development usage.
Figure 2.5: The Nexus 7, the Android development machine mainly used for development.
The Nexus 7 we used was released July 2013. The number seven in the Nexus 7 name designates
the screen size in inches. The resolution is 1200 x 1920 pixels, with around 232 pixels per inch
pixel density. The operating system used is Android OS. Nexus 7’s are also equipped with a
GPS, a 5 megapixel camera, 16 GBs of space, 2 GB of RAM, and a 1.5 GHz CPU (“Asus
Google Nexus 7 (2013)”, n.d.).
Our application will be designed to work on all screen sizes, so the fact that it is a nexus 7 is not
of particular importance. We would be able to use nearly any Android device for project
development.
The main purpose of the ASDSA application is to be displayed on the large touch screen
monitors located at the Engineering & Industry Building at the University of Alaska Anchorage.
This monitor is equipped with a built in computer includes a Windows 8.1 64-bit operating
system, an optical disc drive, an Intel 4th Generation Core i5 processor, a screen resolution of
2560 x 1440, and a screen size of 27 inches.
Even though the touch screen monitor came with Windows 8.1, we have set up a dual partition
on the computer for the Android operating system. The reason is because our software
development team has mainly experience with Android programming. Secondly, the only
feasible alternative on a Windows 8.1 operating system was to create a webpage. Our software
development team does not have much experience with web development. Also, we concluded
that users generally do not find websites to be intuitive when it comes to a touch screen monitor.
2.4 Coding Methodology
We have decided as a group to use the Agile methodology approach. Simply put, the Agile
methodology is a set of rules to follow for development. It includes but is not limited to: “close
interaction between the development team with a customer; the development team is accountable
for saying how long things will take; short development cycles, and frequent releases; fast
response to feedback and new information; planning and design are de-emphasized.” (“What is
an agile software development methodology, in layman’s term?,” n.d.).
Specifically for our development team, we are delivering chapters of a capstone paper and
features of the ASDSA software. Personally, I am responsible with my other software
development team member for the graphical user interface and the possible interactions that the
ASDSA application has. For the first deliverable, I have delivered a prototype which includes a
simple interface which bottom tabs that matched the University of Alaska Anchorage’s color
scheme. The buttons are designed as radio buttons, meaning only one button can be pressed at
the time. At that time in development, the buttons held no functionality, besides changing to a
color shade of green when selected. For the second deliverable, I have delivered additional
functionality to the earlier prototype. Combined with my teammates help, we integrated a picture
swiping and zooming functionality to the application for the purpose of the announcement tab.
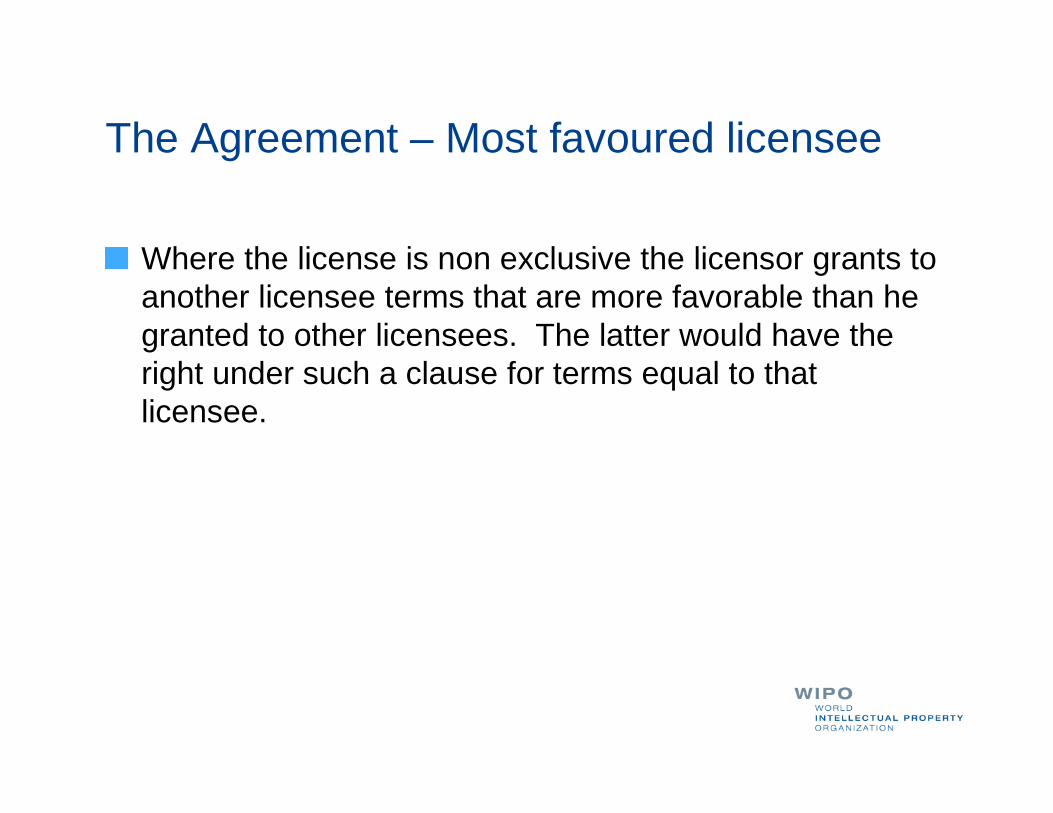
Figure 2.6: The Gantt chart for project development.
2-Feb 12-Feb 22-Feb 4-Mar 14-Mar24-Mar 3-Apr
Create Clickable Tabs
Swipe and Zoom Functionality
Graph Implementation
Connect Application to Database
Automatic Running of Application
Chapter 3
Design and Testing / User Interface
3.1 Project Management
In software development methodologies, we can think of them as split into two parts. There is
the coding methodology portion and the project management portion. In the previous chapter, it
was stated that the Agile methodology was chosen for this project, and the coding methodology
was explained. In this chapter, we will explain the other portion of Agile, the project
management methodology, and compare it to the Waterfall methodology.
Figure 3.1: A study was done to compare both the waterfall and agile methodologies based on
completion rate.
Waterfall is a very linear methodology for software development. The sequence of events
according to Segue Technologies (“Waterfall vs. Agile: Which is the Right Development
Methodology for Your Project?”, July 5th, 2013):
1. Gather and document requirements
2. Design
3. Code and unit test
4. Perform system testing
5. Perform user acceptance testing (UAT)
6. Fix any issues
7. Deliver the finished product
Waterfall has its pros and cons. Because it’s a linear process, team members are able to focus on
one portion at a time. High customer presence is not required as all requirements for the software
is decided at the beginning. Lastly, progress of the team is easily measured.
Using a waterfall approach definitely has some downfalls. Requirements are set at the very
beginning. It frequently happens that a customer requests a feature to be done, but may change
their mind about it midway through development. Also, a customer may not be able to accurately
describe what feature he or she really wants. It is difficult and expensive to go backwards in a
linear software methodology.
Figure 3.2: A diagram showing the flaws of the waterfall model.
The Agile methodology is called an iterative software development methodology. It focuses on a
team-based, high customer involvement environment. As stated by the Agile Project
Management for Dummies, the 12 Agile Principles are (“Agile Project Management For
Dummies,” n.d.):
1. Our highest priority is to satisfy the customer through early and continuous delivery
of valuable software.
2. Welcome changing requirements, even late in development. Agile processes harness
change for the customer's competitive advantage.
3. Deliver working software frequently, from a couple of weeks to a couple of months,
with a preference to the shorter timescale.
4. Business people and developers must work together daily throughout the project.
5. Build projects around motivated individuals. Give them the environment and support
they need, and trust them to get the job done.
6. The most efficient and effective method of conveying information to and within a
development team is face-to-face conversation.
7. Working software is the primary measure of progress.
8. Agile processes promote sustainable development. The sponsors, developers, and
users should be able to maintain a constant pace indefinitely.
9. Continuous attention to technical excellence and good design enhances agility.
10. Simplicity — the art of maximizing the amount of work not done — is essential.
11. The best architectures, requirements, and designs emerge from self-organizing teams.
12. At regular intervals, the team reflects on how to become more effective, then tunes
and adjusts its behavior accordingly.
Figure 3.3: The Agile Roadmap to Value from Agile Project Management For Dummies by
Mark C. Layton.
By using the agile methodology, a software development team can solve most of waterfall’s
problems. Requirements are not set in stone at the beginning and they are subject to change at
any time. It is a common problem that a customer does not know exactly what they want for their
software. An agile-like solution is to create a prototype of the application. The prototype itself
should not take significant time to create, but rather help form an idea from the customer’s
requirements. From there, the customer can decide on whether or not to pursue further into the
direction of the prototype or to change directions. Because agile is an iterative process, software
developers are required to provide what are called iterations. An iteration is a single development
cycle commonly used in the agile software development methodology (“What is Iteration?, n.d.).
Iterations can last between one week or two weeks, depending on how often the customer wants
to meet and depending on how long the software developers estimated to work on the project.
Of course, there are disadvantages with the agile approach. The level of customer involvement
has to be very high in order for the iterative process. This takes time and dedication from the
customer. Because of this, it is difficult or impossible with a customer who is uncooperative or
unavailable to meet regularly to use the agile methodology. Also, because of the iterative nature
of Agile, the code itself will suffer because less time was allotted to it due to the strong emphasis
of customer involvement.
Specifically in our project, we chose to use the Agile Methodology as listed in the previous
chapter. The nature of our project did not provide an obvious way to receive large amounts of
system requirements. It was somewhat vague what the client wanted, and we had a large amount
of creative freedom regarding designing the application. Because of this, the waterfall
methodology was not applicable for the project.
Using the Agile Methodology was a good idea because the supervisor, Professor Cavalcanti, also
acted as the customer for the project. Every week on Wednesday we met up to review the
progress that we have made. Also, the software developers met up on Friday of every week to
develop in a team based environment, which the Agile Methodology recommends.
3.2 Test Cases
Testing is important because programs are written by humans. Humans are bound to make
mistakes. Testing is a form of checking our work (“Why is software testing necessary?”, n.d.).
The more complicated a program gets, the more likely it is to have errors. Since the capstone
project is large in size, involves a team of developers, and is highly expected to produce a quality
product, it is necessary to use a testing framework.
To test the project, we have decided to use the JUnit framework. By using the JUnit framework,
we created test cases classes, mock objects, and mock methods. Also, you are able to control the
lifecycle of an Android application by using instrumentation. Certain functions are called by
exiting, destroying, pausing, or starting an application. Normally, a programmer would not be
able to have direct access to this, but by using instrumentation, it is possible. For example, the
programmer would be able to assert whether or not the activity of an application correctly
restores its data when the activity is destroyed or paused (“Testing Fundamentals,” n.d.).
Our test cases are as follows:
1. Project should respond to click events. Buttons should click and enable as required,
and disable as required. Images should be swipeable and zoomable.
2. Project should display announcements when the announcement button is enabled.
3. Project should display graphs of corresponding engineering data when the correct
button is enabled.
4. Project should automatically start a slide show if there are no interactions after 10
seconds.
5. Project should stop slide show if there was an interaction in the last 10 seconds.
6. Project should update engineering data every 15 minutes from the database correctly.
7. Project should not crash over long periods of time.
Figure 3.4: An example of the testing framework for Android development.
3.3 User Interface
The user interface includes buttons, pictures, and graphs. The bottom half of the application
includes the tabs (or buttons) designed to change the interface. For example, clicking the
announcement tab will display UAA related announcements such as news and events. Clicking
the electricity, water, or gas tabs will display engineering related information in the form of
graphs. If the application is not being interacted with, the application will go into a slideshow-
like manner and run through the tabs itself, displaying appropriate data depending on the selected
tab.
Figure 3.5: Picture of the user interface half way through development.
Chapter 4
Results and Discussion
4.1 Introduction to Results and Discussion
As stated in previous chapters, the purpose of the project is to display engineering related
information in the form of graphs and to display various types of information from UAA such as
announcements or awards. The project displays all this information using large touch screen
monitors donated by Siemens. In addition to the monitors, users can view the application through
a webpage accessible through all possible devices with an internet connection as well as an
Android app available through Google Play.
It would be interesting to empirically record the results of user interactions of the application in a
real world scenario. Depending on the results, developers could make adjustments to the project
to enhance user experience, repair bugs or crashes, add functionality, or make the design more
aesthetically pleasing. Unfortunately, in this project, we have run into time constraints, and were
unable to test out the application in a real world environment before the capstone project paper
was documented. Instead, this chapter will be formatted by first stating what the results are of
completing the application. Secondly, there will be a discussion about how these results will be
utilized.
Figure 4.1: Picture of one of the smaller versions of the touch screen monitor (20 inch) in
person.
4.2 Results
After finishing the app, it is finally time record the results found by the application.
The application is mainly used for displaying information. There are five tabs that provide
different functionality. The introduction tap displays a helpful and friendly message to the user
explaining what the application is about. The electricity, water, temperature, and gas tabs display
graphs to the user. The announcements tab displays events, accomplishments, and other useful
information about UAA. The main interface includes no action bar (menu bar found on the app
of numerous Android applications). The tabs are given a UAA color scheme. Unselected tabs are
colored with a background of dark green with a text color of gold. Selected tabs are colored with
a background of gold with a text color of dark green. The dark green and gold colors picked are
picked with specific color values as found in the UAA Branding Book. The background of the
application is black.
4.3 Discussion
As developers, we are responsible for the design choices we make in our application. The
specific design choices we have as made with the intent to enhance the user experience for the
app.
As stated before in previous chapters, the driving force behind this project is UAA. Therefore, it
makes sense for the developers formulate the design choices to match UAA’s expectations. Plus,
the application would be displayed in a UAA building (the College of Engineering & Industry
building). We decided to use a dark green and gold theme based off UAA’s Branding Book.
Specifically, the dark green value is #00583D and the gold value is #FEE300. The tabs found on
the bottom are given these colors. When a button is unselected, the unselected tab displays a dark
green background with yellow font. When a button is selected, the selected tab displays a yellow
background with dark green font. In other words, the colors flip to represent the currently
selected radio button.
Figure 4.2: A page from the UAA Branding Book, showing the specific colors UAA uses from
official documents or products.
One of the first decisions the developers made was to remove the concept of the action bar. The
reason is because there is not purpose to display the title of the app. The reason behind this is that
the title of the project is already displayed in the introductions tab. A second title would
redundant. Secondly, the menu items such as about and text size are unnecessarily for this type
of application. If secondary buttons need to be added, they can be added without the action bar.
Lastly, by removing the action bar, there is other room for other components. This is especially
important when the application is run on a mobile device.
Figure 4.3: Side by side comparison showing how much space is saved by removing the action
bar.
UAA’s branding colors are found to be very darkly colored. That is why the developers decided
that the common background should be black. Using a matching color scheme is preferable for
the user, as it would be unpleasant for a user having to view a program which has poor design
choice. A black background matches well with the UAA colors of dark green and gold. It helps
brings the attention of the all other components of the application such as the tabs, the graphs,
and the announcements.
The announcement tab is meant to give a warm welcome to the user. As soon as the user starts
the application, the announcement tab is displayed. It gives the application its title, gives credit to
the developers and UAA for allowing this project to take off, and explains what the project’s
goal is.
The electricity graph is colored yellow-green to logically represent physical lightning. It is in
units of kilowatt hour (kWh). The electricity graph is the most unique. The reason behind this is
because the user is able to view electricity usage as well as electricity demand. Electricity
demand does not depend on sensors in the building. It is gathered from the Siemen’s database
which determined the current cost of electricity so that the software developers could parse it
into a graph form.
The water graph is colored white and blue, similarly to the color of the ocean. It is in units of
gallons per hour. The temperature is yellow and red, signifying a hot temperature. It is in units of
Fahrenheit and Celsius. The gas graph is colored magenta and black, similarly to a type of gas.
Libraries are one form of integrating open source code into one’s existing project. The reason
why libraries exist is because developers believe that one another should not have to reinvent the
wheel once a task is completed. The graphs used inside the project was not created by the
developers of the project. We made used of a library called A Simple XY Plot. Using this open
source library allowed our developers to reuse code and to save time to focus on other parts of
the project.
At the technical level, A Simple XY Plot defines an XYPlot View using XML, and assigns a
single XYSeries to it. XYPlot acts as the container image to be displayed in the application, and
XYSeries is an object created programmatically with the graph values implemented into it.
Figure 4.4: An example of the usage of the library A Simple XY Plot.
Chapter 5
Summary and Conclusion
5.1 Summary
We have completed an important and worthwhile project. Engineering on Display will be used
throughout campus to display engineering related data and UAA news. With four exceptional
members, we have created two versions of the application: the website and the Android app. The
Android app will allow efficient usage of the touch screen monitors while the website will allow
all types of applications to access the app. Using this approach, we have succeeded in using the
touch screen monitors in an aesthetically pleasing way without limiting users to one type of
device.
5.2 Implications
As of today, Android applications are still in the early stages comparatively to other types of
platforms. We predict that Android will continue to grow in popularity as more uses and
functions from the Android operating system come to light, as for example the Engineering on
Display project. As a team, we are assisting in the advancement of the future. Students and
faculty will see the progress we have made, from using our project for real-world issues. The
project will be physically displayed for many people to view and learn from.
As stated before, the Engineering on Display project was heavily influenced by the Dean of the
College of Engineering. University of Alaska Fairbanks contracted Lucid Design Group to
develop software similar to the one in this project. Stemming from this idea, he thought it would
be a great idea to create a similar system from the students of University of Alaska Anchorage.
Clearly, there are many positive outcomes to this approach in creating a system. The software
developer students received no pay for the project, thus saving UAA a significant amount of
money compared to UAF. The student developers also got the opportunity to work on a project
that was interesting, worthwhile, and held in a professional real-world setting especially seen
between the meetings of the student software developers and Siemens and the UAA IT
department.
5.3 Recommendations for Future Development
The software development team agrees that it is a healthy trait to be overly ambitious.
Nevertheless, we find it unfortunate to conclude that there are features yet to be done. At the start
of the project, it was desired to have an indoor navigation system implemented in the new
Engineering & Industry building. Due to time constraints, we were unable to commit to that level
of work load of software development. Fortunately, because this is a capstone project and not
paid contract work, any desired work could be finished next year during the next capstone
project.
A common idea for future development is to allow students to work on development the app for
even more sensors or more buildings. This idea is likely to be implemented due to the various
parties suggestion this idea. For example, both the Dean and Siemens would like to see this
project take off in later semesters.
Figure 4.2: How indoor navigation works.
5.4 Conclusion
When starting the project, it quickly came to the team’s realization that a project like this will
provide many challenges. The project definitely proved to be harder than expected. Nevertheless,
the team pushed forward, overcoming the obstacles such as database configuration and graphical
user interface manipulation with timers. With persistence, even the difficult projects will end up
with success.
Appendix A - UML
Appendix B – Source Code
Repository: https://github.com/ravvytheprogrammer/EOD
MainActivity.java
package ASDSA.uaa.ASDSA;
import android.content.Context;
import android.graphics.Bitmap;
import android.graphics.BitmapFactory;
import android.os.Build;
import android.support.v7.app.ActionBarActivity;
import android.os.Bundle;
import android.view.GestureDetector;
import android.view.LayoutInflater;
import android.view.Menu;
import android.view.MenuItem;
import android.view.MotionEvent;
import android.view.View;
import android.view.animation.Animation;
import android.widget.ImageView;
import android.widget.RadioButton;
import android.widget.TabHost;
import android.widget.TabWidget;
import android.widget.ViewFlipper;
import java.io.InputStream;
import ASDSA.uaa.announcements.SwipeGestureDetector;
import ASDSA.uaa.announcements.ScaleImageView;
public class MainActivity extends ActionBarActivity {
private static final int SWIPE_MIN_DISTANCE = 120;
private static final int SWIPE_THRESHOLD_VELOCITY = 200;
@SuppressWarnings("deprecation")
private ViewFlipper mViewFlipper;
private ScaleImageView previous;
private ScaleImageView current;
private ScaleImageView next;
private RadioButton btnIntroduction;
private RadioButton btnElectricity;
private RadioButton btnWater;
private RadioButton btnGas;
private RadioButton btnAnnouncements;
@Override
protected void onCreate(Bundle savedInstanceState) {
super.onCreate(savedInstanceState);
setContentView(R.layout.activity_main);
Animation.AnimationListener mAnimationListener = new Animation.AnimationListener(){
public void onAnimationStart(Animation animation){
}
public void onAnimationRepeat(Animation animation){
}
public void onAnimationEnd(Animation animation){
}
};
mViewFlipper = (ViewFlipper) this.findViewById(R.id.view_flipper);
SwipeGestureDetector swipeGestureDetector = new SwipeGestureDetector(this,
mAnimationListener, mViewFlipper);
final GestureDetector detector = new GestureDetector(swipeGestureDetector);
mViewFlipper.setOnTouchListener(new View.OnTouchListener() {
@Override
public boolean onTouch(final View view, final MotionEvent event){
detector.onTouchEvent (event);
return true;
}
});
// previous = (ScaleImageView) findViewById(R.id.previous);
// previous.setImageDrawable(getResources().getDrawable(R.drawable.one));
//

// current = (ScaleImageView) findViewById(R.id.current);
// current.setImageDrawable(getResources().getDrawable(R.drawable.two));
//
// next = (ScaleImageView) findViewById(R.id.next);
// next.setImageDrawable(getResources().getDrawable(R.drawable.three));
previous = (ScaleImageView) findViewById(R.id.previous);
InputStream is = getResources().openRawResource(R.raw.one);
Bitmap bitmap = BitmapFactory.decodeStream(is);
previous.setImageBitmap(bitmap);
previous.setGestureDetector(swipeGestureDetector);
current = (ScaleImageView) findViewById(R.id.current);
is = getResources().openRawResource(R.raw.two);
bitmap = BitmapFactory.decodeStream(is);
current.setImageBitmap(bitmap);
current.setGestureDetector(swipeGestureDetector);
next = (ScaleImageView) findViewById(R.id.next);
is = getResources().openRawResource(R.raw.three );
bitmap = BitmapFactory.decodeStream(is);
next.setImageBitmap(bitmap);
next.setGestureDetector(swipeGestureDetector);
// // show tab dividers -- has to be done programmatically
// LayoutInflater inflater = this.getLayoutInflater();
// View view = inflater.inflate(R.layout.activity_main, null);
// TabHost tabHost = (TabHost) view.findViewById(R.id.tabhost);
//// tabHost.getTabWidget().setDividerDrawable(R.drawable.example1);
//// if(Build.VERSION.SDK_INT >= 11)
//
((TabHost)view).getTabWidget().setShowDividers(TabWidget.SHOW_DIVIDER_MIDDLE);
//
}
@Override
public boolean onCreateOptionsMenu(Menu menu) {
// Inflate the menu; this adds items to the action bar if it is present.
getMenuInflater().inflate(R.menu.menu_main, menu);
return true;
}
@Override
public boolean onOptionsItemSelected(MenuItem item) {
// Handle action bar item clicks here. The action bar will
// automatically handle clicks on the Home/Up button, so long
// as you specify a parent activity in AndroidManifest.xml.
int id = item.getItemId();
//noinspection SimplifiableIfStatement
if (id == R.id.action_settings) {
return true;
}
return super.onOptionsItemSelected(item);
}
}
References
Orsini, L. (2013, September 30). GitHub For Beginners: Don’t Get Scared, Get Started.
Retrieved February 9, 2015, from http://readwrite.com/2013/09/30/understanding-
github-a-journey-for-beginners-part-1
History of the Web. (n.d.). Retrieved February 9, 2015, from
http://webfoundation.org/about/vision/history-of-the-web/
A Brief History of Web Development. (n.d.). Retrieved February 9, 2015, from
http://www.techumbrellagroup.com/web-development-history.html
A complete history of Android. (n.d). Retrieved February 9, 2015, from
http://www.techradar.com/us/news/phone-and-communications/mobile-phones/
a-complete-history-of-android-470327
By the Numbers: IPhone vs. Android. (n.d.). Retrieved February 9, 2015, from
https://www.yahoo.com/tech/by-the-numbers-iphone-vs-android-97842025474.html
IDE Definition from PC Magazine Encyclopedia. (n.d.). Retrieved February 24, 2015, from
http://www.pcmag.com/encyclopedia/term/44707/ide
App Manifest. (n.d.). Retrieved February 28, 2015, from
http://developer.android.com/guide/topics/manifest/manifest-intro.html
Resources Overview. (n.d.). Retrieved February 28, 2015, from
http://developer.android.com/guide/topics/resources/overview.html
Asus Google Nexus 7 (2013). (n.d.). Retrieved February 28, 2015 from
http://www.gsmarena.com/asus_google_nexus_7_(2013)-5600.php
Kinahan, S. (n.d.). Quora. Retrieved March 2, 2015, from http:///www.quora.com/What-is-an-
agile-software-development-methodology-in-laymans-term
Chan, K. (2013, January 31). Waterfall vs. Agile. Retrieved March 18, 2015, from
http://www.onedesk.com/2013/01/waterfall-vs-agile/
Layton, M. (n.d.). Agile Project Management For Dummies. Retrieved March 18, 2015, from
http://www.dummies.com/how-to/content/agile-project-management-for-dummies
-cheat-sheet.html
Rouse, M. (n.d.) What is iteration? –Definition from WhatIs.com. Retrieved March 18, from
http://searchsoftwarequality.techtarget.com/definition/iteration
Why is software testing necessary? (n.d.). Retrieved March 18, 2015, from
http://istqbexamcertification.com/why-is-testing-necessary/
Testing Fundamentals. (n.d.). Retrieved March 18, 2015, from
http://developer.android.com/tools/testing/testing_android.html