Embed Size (px)
Citation preview
University of Alberta
Extrusion Cooking of Barley FIour with and without Thermostable a-Amylase
Judy Sze-Mun Yeung {@
A thesis submined to the Fac* of Graduate Studies and Research in partial fùlfillment of the requirements for the degree of Master of Science
in
Food Science and Technology
Department of Agricultural, Food and Nutritional Science
Edmonton, Alberta
Spring, 2001
National Library 1*1 of Canada Bibliothèque nationale du Canada
Acquisitions and Acquisitions et Bibliographie Services services bibliographiques
395 Wellington Street 395. me Wellington Ottawa ON K1A ON4 Ottawa ON KI A ON4 Canada Canada
Your file Votre référence
Our file Noire rdfdrence
The author has granted a non- exclusive licence allowing the National Library of Canada to reproduce, loan, distribute or sell copies of this thesis in microfom, paper or electronic formats.
The author retains ownership of the copyright in this thesis. Neither the thesis nor substantial extracts fkom it may be printed or otheMise reproduced without the author's permission.
L'auteur a accordé une licence non exclusive permettant à la Bibliothèque nationale du Canada de reproduire, prêter, distribuer ou vendre des copies de cette thèse sous la forme de microfiche/f%q de reproduction sur papier ou sur format électronique.
L'auteur conserve la propriété du droit d'auteur qui protège cette thèse. Ni la thèse ni des extraits substantiels de celle-ci ne doivent être imprimés ou autrement reproduits sans son autorisation.

To my beloved Dad, Mom,
my sister, Sylvia and my bmther, Samson.
Their love, dedication and insight enable me to succeed.
Abstract
Barley grains (waxy and regular) were pearled to different extents. The
composition of pearling products (PF and PG) and the gel color of PG-flou were
investigated. The PG-flour was then subjected to extrusion studied with and without a-
amylase. Effects of extrusion conditions and a-amylase concentration on the degree of
hydrolysis and dextrose equivalent, oligosaccharide composition, IDF, SDF and TDF of
the extruded flours were studied. The study indicated that 32% of pearling is required to
ensure the bright color of barley-based foods- Extrusion of barfey fiour with 4% a-
amylase at 100°C and 50% moisture levei lead to the maximum degree of hydrolysis. At
each temperature and enzyme concentration, the saccharide composition @P 1 -7),
folIowed the order: DP2>DP6>DP3>DPS>DP7>DP4>DP 1. Extrusion cooking increased
the TDF and SDF contents of barley flours while IDF was decreased in CDC-Candle but
increased in Phoenix. OveraIl, it was demonstrated that the dextrinized barley f lou with
different oligosaccharides and dietary fiber profile could be produced by extrusion
processing.
Acknowledgements
The author would iïke to express her most sincere thanks to her supervisor, Dr.
Thava Vasanthaa, for valuable support and guidance: given at ail stages in this study. The
author would also like to express her gratitude to the other members of the commatee.
Sincere thank to Dr. Feral Temeili for her insightful detail in clarifjring the thesis. The
author appreciates the helpfulness of Dr. Ambikaipakan Senthilselvan for his suggestions
in data analysis and refomÿitting statistical data, making it easier to understand. nianks
to Dr. Feral Temelli and Dr. Arnbikaipakan Senthilsolvan for making t h e to serve on the
cornmittee and all their good advice.
An excellent technical support of Mira Franiel, Gao Song Jiang and Jihong Lee
are highly appreciated. Appreciation is expressed t o Gary Sedgwick of the University of
Alberta for hk assistance in HPLC analysis.
The author is grateful to the Alberta Barley Commission (Calgary, Aiberta,
Canada), Aiberta Agricultural Research Institute (AARI) (Edmonton, Alberta, Canada),
and Nahiral Sciences and Engineering Research Ccmncil (NSERC) (Canada) for financial
assistance.
The author wodd also like to thank ail the professors and staff of the department
of Agricultural, Food and Nutritional Science and the rest of the University of Aiberta.
Thanks to all the staff in Food Processing Development Centre.
Special thanks to Pat Chan, Kay Ng and ot7ier &ends who have generously given
their tirne and support throughout the study.
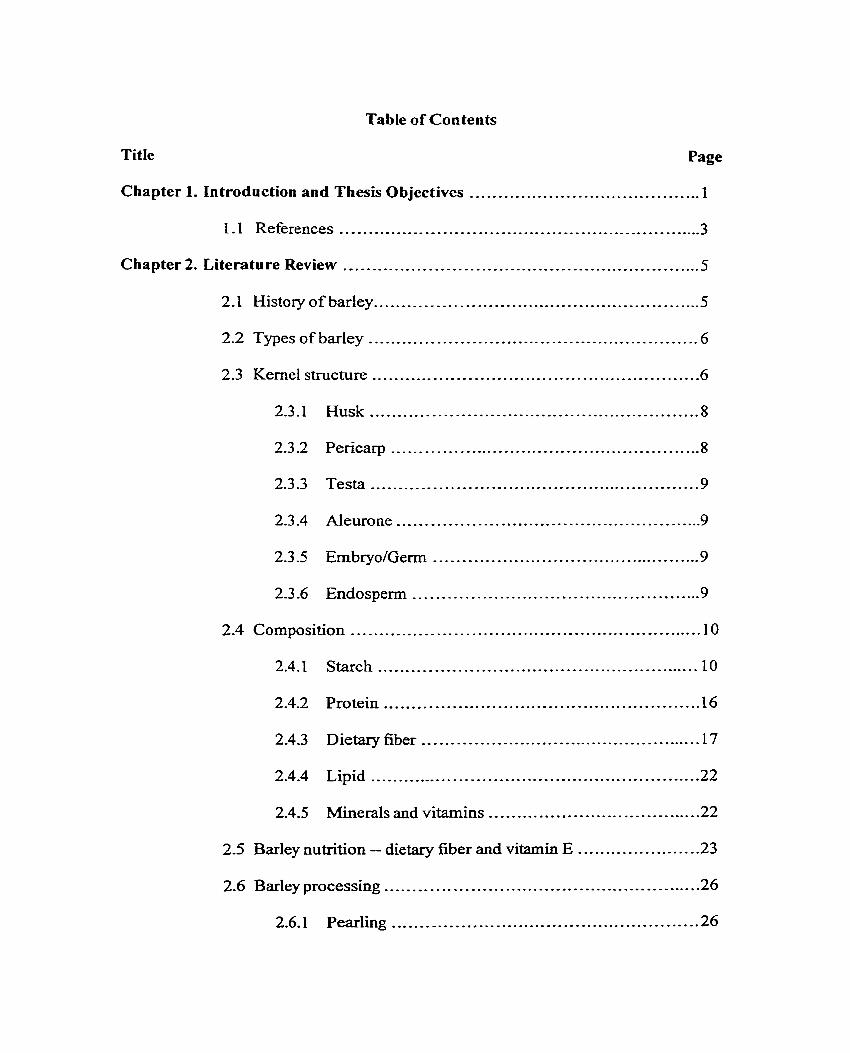
Table of Contents
TitIe Page
Chapter 1 . Introduction and Thesis Objectives ....... ............. ..................... 1
............................................................... 1 . I References .3
............................................................... . Chapter 2 Literature Review 5
2.1 History of barley .......................................................... 5
.......................................................... 2.2 Types of barley 6
2.3 Kernel structure ......................................................... -6
.......................................................... 2.3.1 Husk 8
..................................................... 2.3 -2 Pericarp ..8
2.3.3 Testa ................................. .. 9 ..................
2.3.4 Neurone ...................................................... 9
................................................ 2.3 -5 EmbryolGerm 9
................................................... 2.3 -6 Endosperm 9
............................................................. 2.4 Composition 10
2.4.1 Starch ......................................................... IO
........................................................ 2.4.2 Protein 16
.................................................. 2.4.3 Dietary fiber 17
........................................................... 2.4.4 Lipid 22
...................................... 2.4.5 Minerals and vitarnins 22
..................... 2.5 Barley nutrition -- dietary fiber and vitamin E -23
....................................................... 2.6 Barley processing -26
...................................................... 2.6.1 Pearling 26
.................................................... 2.6.2 Extrusion -28
2-7 References ......................................... .. .......... 40
Chapter 3 . Pearling of Hull-las Barley: Product Composition and Gel-eolor
of Pearled Barley Flou rs as Affected by the Degree of Pearling ,. .... 46
............................................................. 3.1 Introduction -46
................................................ 3.2 Materials and Methods -48
................................................. 3 -3 Results and Discussion 50
3.3.1 WhoteGrain ................................................. 50
.......................... 3.3.2 Pearled Grain (PG) Composition 50
......*......- . ... . 3.3.3 Pexliag Flour (PF) Composition ... .. .. 54
3.3.4 GeIColor ..................................................... 55
............................................................. 3.4 Conclusions 57
............................................................... 3.5 References 59
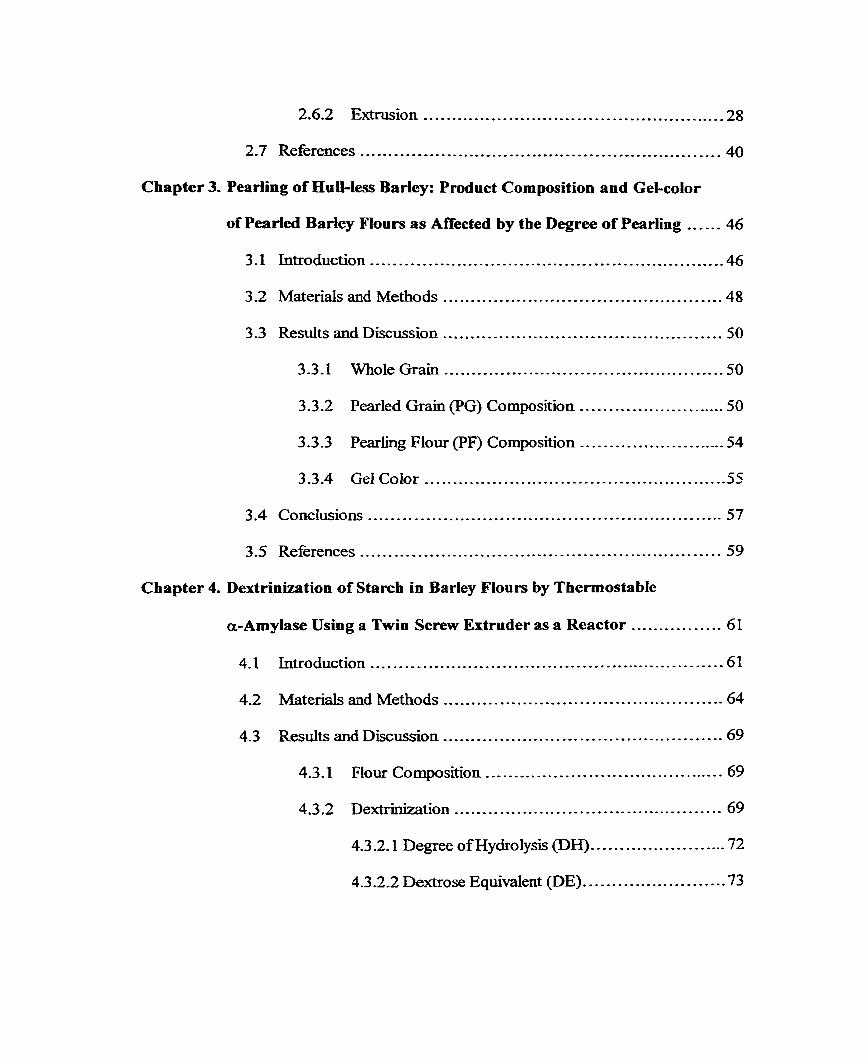
Chapter 4 . Dextrinization of Starcb in Barley Fiours by Thermostable
................ a-Amylase Using a Twia Screw Efiruder as a Reactor 61
.............................................................. 4.1 Introduction 61
................................................. 4.2 Materials and Methods 64
................................................. 4.3 Results and Discussion 69
.......................................... 4.3.1 Flow Composition 69
4.3.2 Dextrinization .............................................. 69
....................... 4.3 .2.1 Degree of Hydrolysis (DH) -72
4 -3 -2 -2 Dextrose Equivalent (DE) ......................... 73
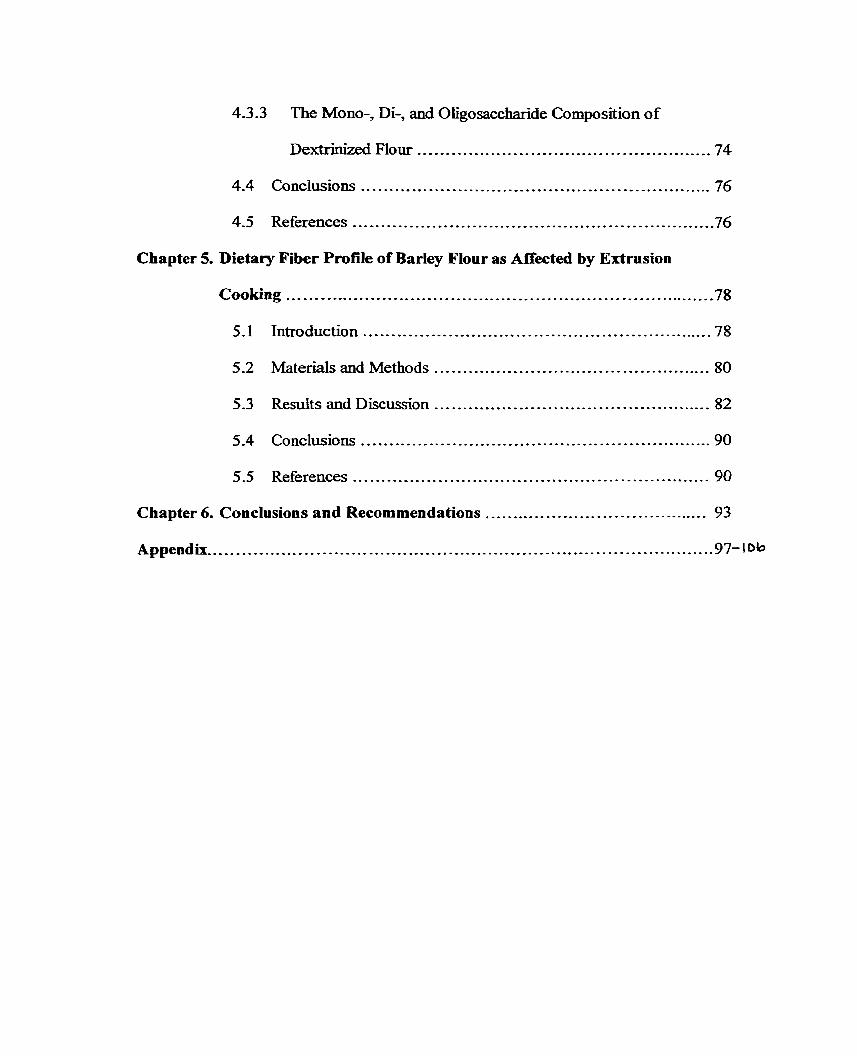
4.3.3 The Mono.. Di.. and Oligosacchande Composition of
.................................................. Dextrinized Flour 7 4
4.4 Conclusions ....................... ... .................................. 76
............................................................... 4.5 References -76
Chapter 5 . Dietary Fiber Profile of Barley Flour as Aftected by Extrusion
........................................................................... Cooking -78
.............................................................. 5.1 Introduction 78
................................................. 5.2 Materials and Methods 80
........................... ................... 5 -3 Results and Discussion .. 82
................... 5.4 Conclusions .... .................................. 90
............................................................... 5.5 References 90
.............*..... .................. Chapter 6 . Conclusions and Recommendations .... 93
......................................................................................... Appendix 97- 1 D b
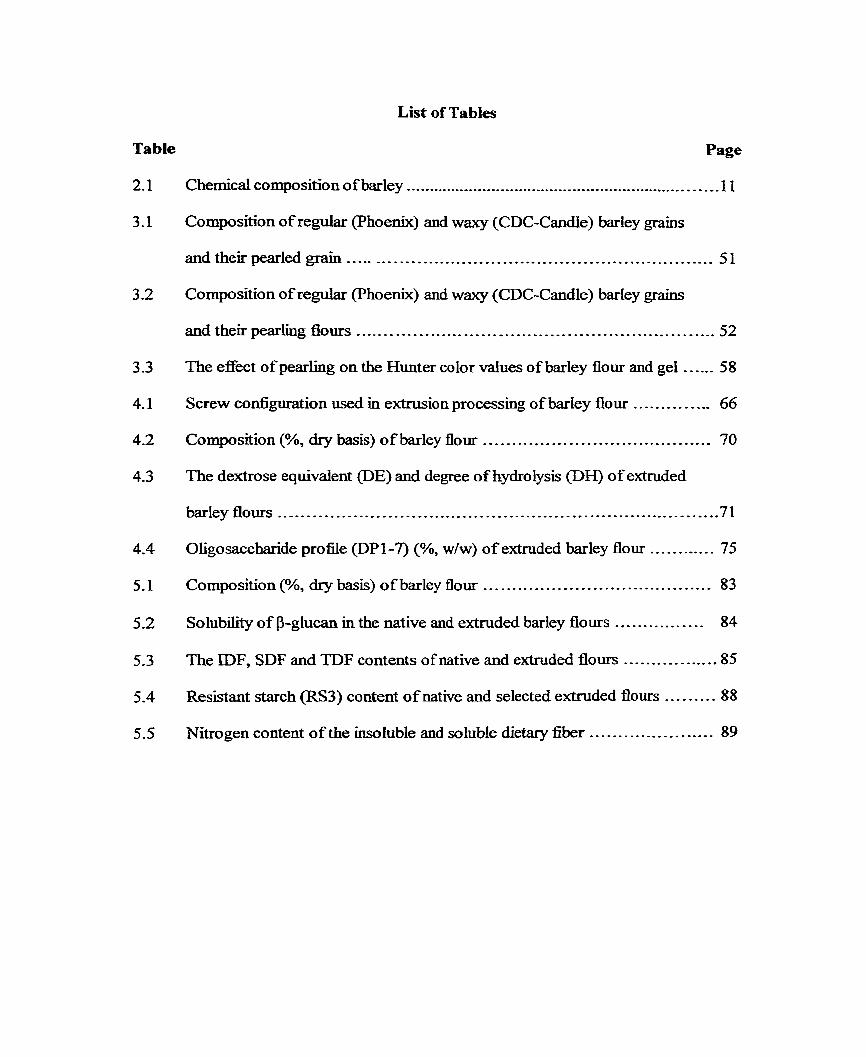
List of Tables
Table
2.1
3.1
Page
.................................................................... Chernical composition of barley 11
Composition of regular (Phoenix) and waxy (CDC-Candie) barley grains
................................................................ and their pearled grain 51
Composition of regular (Phoenix) and waxy (CDC-Candle) barley grains
............................................................... and their pearhg flours 52
...... The effect of pearling on the Hunter color values of barley flour and gel 58
.............. Screw configuration used in extrusion processing of barley flour 66
........................................ Composition (%, dry b i s ) of barley flour 70
The dextrose equivalent (DE) and degree of hydrolysis (DH) of extruded
............................................................................. barley flours 71
............ Oligosaccharide pronle (DP 1-7) (%, w/w) of extruded barley flour 75
........................................ Composition (%, dry basis) of barley flour 83
................ Solubility of B-giucan in the native and extmded barley flous 84
................. The IDF, SDF and TDF contents of native and extnided flours 85
......... Resistant starch (RS3) content of native and selected extruded flours 88
...................... Nitrogen content of the insoluble and soluble dietary fiber 89
List of Figures
Figure Page
Diagram representing a longitudmat section cut of a barley caryopsis ......... 7
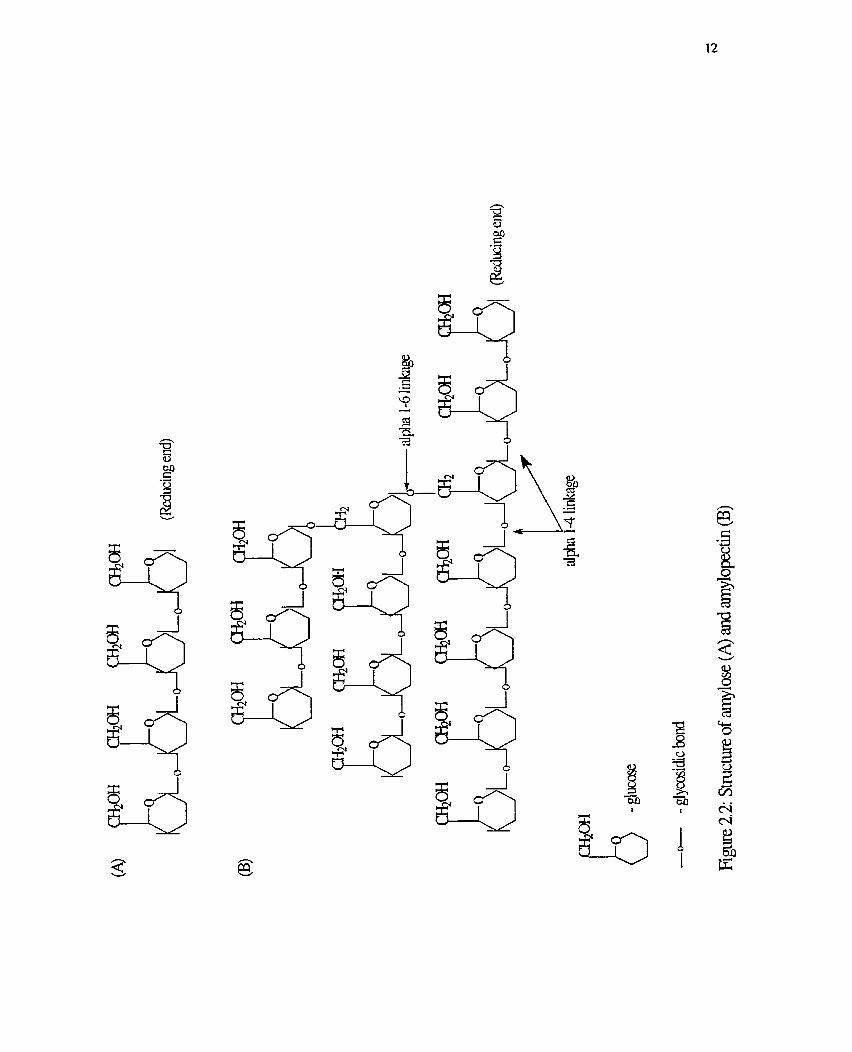
Structure of amylose (A) and amylopectin (B) ..................................... 12
.......................................................... Diagram of a starch granule 14
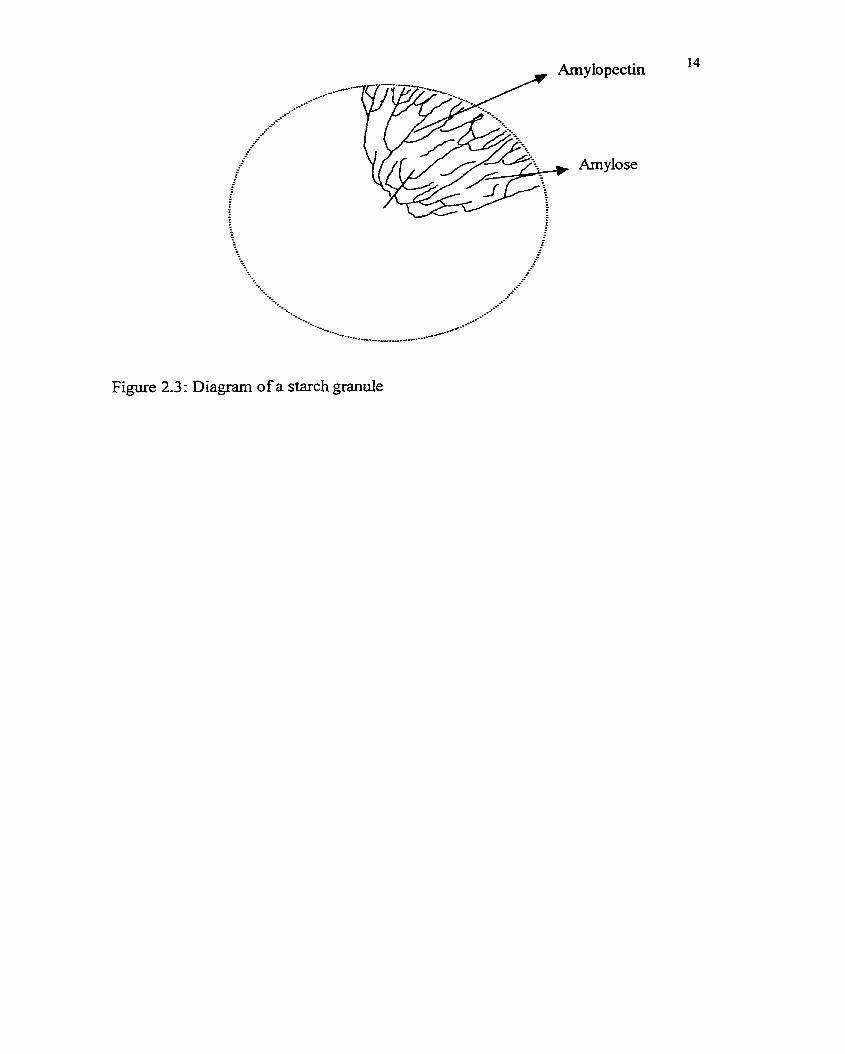
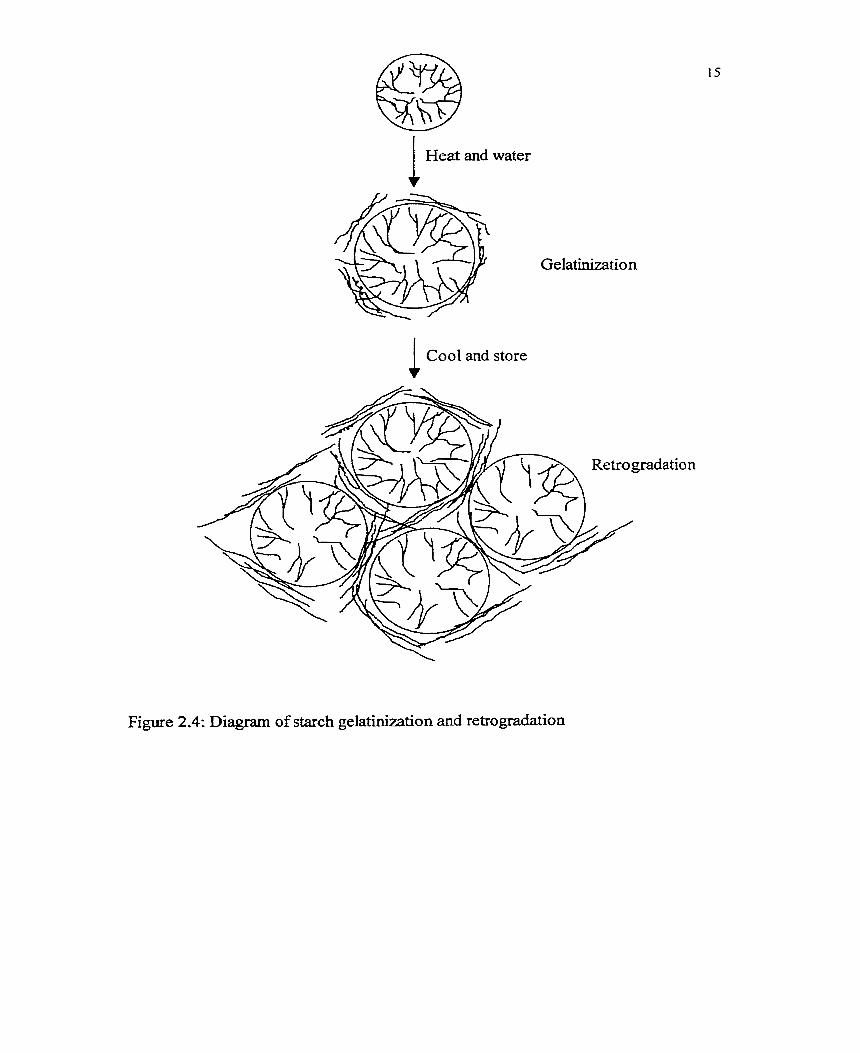
Diagram of starch gelatinization and retrogradation .............................. 15
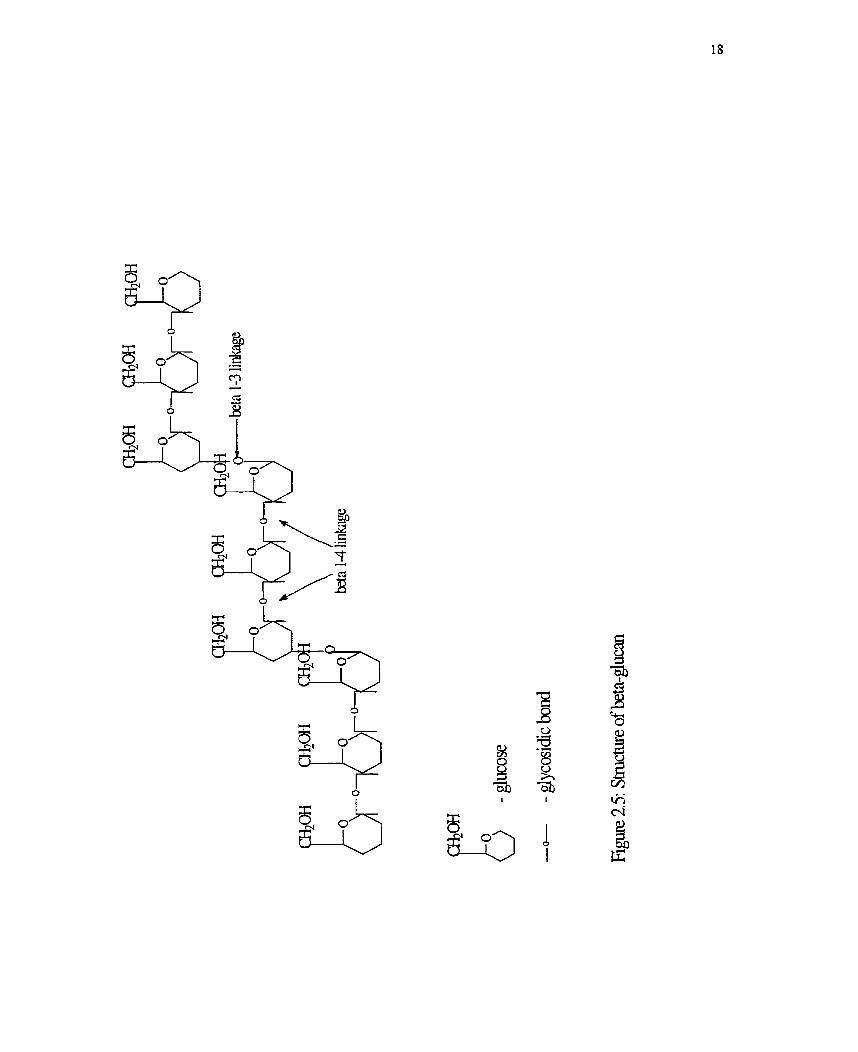
.................................................................. Structure of B-glucan 18
A schematic illustration of P-glucan linear segment aggregation ............... 19
.............................................................. Structure of arabinoxylan 21
.................................... Flow chart showing pearling process of barley 27
................................... ................... Cross-section of an extruder ... 29
........................................................ Diagram of a convey element 31
...................................................... Diagram of a kneading elernent 32
......... Cross-section of twin screws with different degrees of intermeshing 33
.......................................................... Diagram of a preconditioner 35
The starch, protein, P.gluca.n, Lipid and ash contents of the pearling
products fiom CDC-Candle (C) and Phoenix (P) barley grains as
......................................................... affected by degree of pearling 53
Color features of gels prepared with barley flours d e d eom whole and
.................................................................... pearled grains (PG) 56
List of Abbreviations
DE
DH
DMH
DMSO
DP
F
FAS
HDL
HMG-COA
HPLC
HTST
IDF
KB
KB/R
LDL
LH
PF
PG
PUFA
R
RH
RS
SCFA
SDF
SK
SK-N
TDF
Dexîrose equivalent
Degree of hydrolysis
Dirnethyl hydrazine
Dirnethyl sulfoxide
Degree of polymerization
Forward elernent
Fatty- acid synthetase
High-density lipoprotein
3-Hydroxy-3 -rnethylglut;irvl coenzyme A
High performance liquid chromatography
High temperanire short tirne
Insoluble dietary fiber
Kneading bloc k
Reverse kneading block
Low-density lipoprotein
Left hand
Pearling f lou
Pearled grain
Poly-unsaturated fatty acids
Reverse element
Right hand
Resistant starch
Short chah fatty acids
Soluble dietary fiber
Undercut elernent
Transition element f iom undercut to others
Total dietary fiber
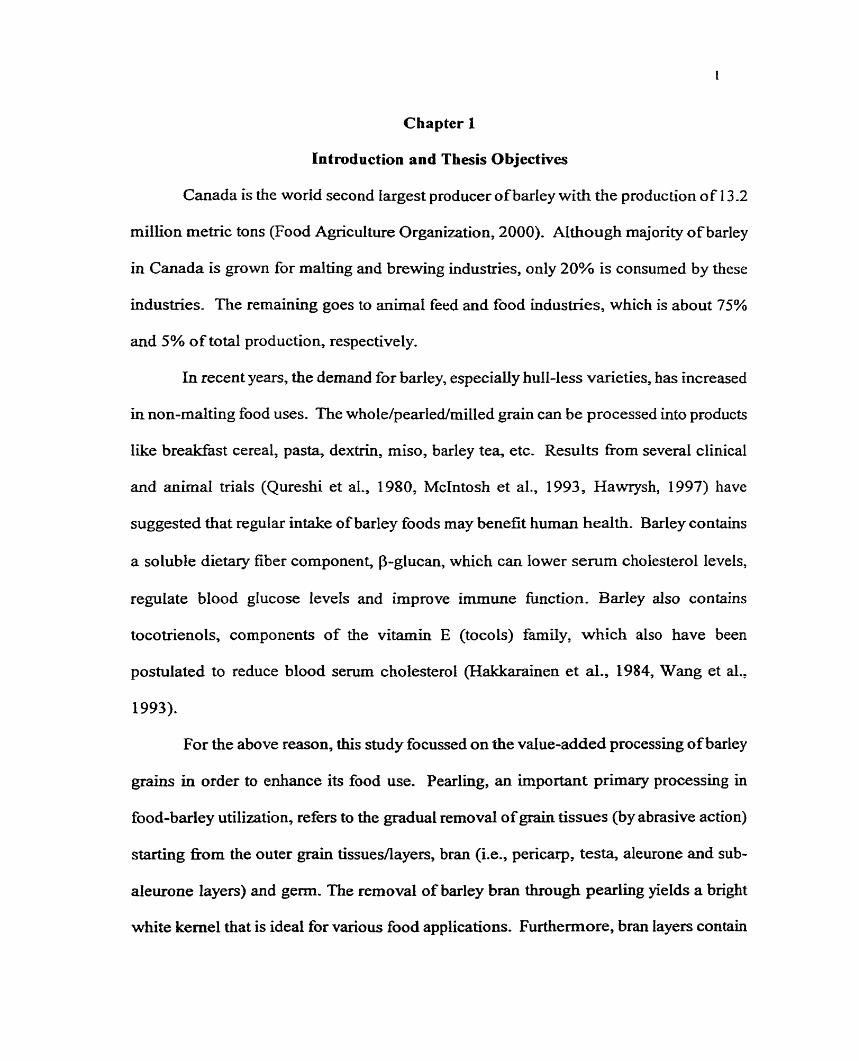
Chapter 1
Introduction and Thesis Objectives
Canada is the worid second Iargest producer of barley with the production of 13.2
million metric tons (Food Agriculture Organization, 2000). Although majority of barley
in Canada is grown for malting and brewing industries, only 20% is consurned by these
industries. The rernaining goes to animal feed and food industries, which is about 75%
and 5% of total production, respectively.
In recent years, the demand for barley, especiaily hull-less varieties, has increased
in non-malting food uses. The whole/pearIed/milled grain can be processed into products
like breakfast cereal, pasta, dextrin, miso, barley tea, etc. Results l%om several clinical
and animal trials (Qureshi et al., 1980, McIntosh et al., 1993, Hawrysh, 1997) have
suggested that regular intake of barley foods may benefit human health. Barfey contains
a soluble dietary fiber component, P-glucan, which c m lower serum choiesterol levels,
regulate blood glucose levels and improve immune function. Barley also contains
tocotrienols, components of the vitamin E (tocols) family, which also have been
postulated to reduce blood serum cholesterol (Hakkarainen et al., 1984, Wang et al.,
1993).
For the above reason, this study focussed on the value-added processing of barley
grains in order to enhance its food use. Pearling, an important primary processing in
food-barley utilizatio n, refers to the gradua1 removal of grain tissues (by abrasive action)
staaing f?om the outer grain tissues/layers, bran (i.e., pencarp, testa, aleurone and sub-
aieurone layers) and gem. The removal of barley bran through pearhg yields a bright
white kemel that is ideal for various food applications. Furthemore, bran layers contain
the majority of barley lipids, which are composed of high amounts of unsaturated fatty
acids (oleic, 18:l and holeic, 18:2 acid), and are highly prone to autooxidation and
subsequent rancid odor development. Therefore, the storage stabilîty and overall quality
of pearled barley wiiI be improved by rernovùig of outer layers of the grain. Another
important benefit of pearhg is the removal of a variety of barley phenolic cornpounds
and enzymes, such as polyphenoloxidase and peroxidase, along with the outer grain
layers. This virtually elhinates the enzyme driven darkening of barley products-
Dextrinization is a process used to hydrolyze starch by acid or enzyme. The
product is a mixture of mono-, di-, oligo- and polysaccharides, which is called dextrin.
Dextrin c m be used as a fat replacer, bulking agent, flavor and color encapsulatïng agent,
etc.
High temperature short time (HTST) extrusion cooking has become one of the
most popular new processes in food and feed industries. It is used extensively Po produce
products, such as snack foods, cereals, pasta, and pet foods. Due to many industrial
advantages (ease of handling, low water use, low cost, etc), dextrllùzation by extrusion
has been of interest to maoy researchers. Extrusion conditions, such as temperature,
moisture and pressurelshear may change the content as well as the physicochemical and
nutritionaVphysiological properties of barley flou components, including dietary fiber.
However, little research has been done on dextrinization of barley flour by extrusion
cooking.
The objectives of this thesis are:
1. To investigate the distribution of major grain components (Le. starch,
protein, lipid, P-glucan and ash) in a waxy (CDC-Candle) and a regular
(Phoenix) barley through a pearling study and to investigate the eEect
of varying degrees of grain pearling on the color characteristics of
uncooked and cooked (gel) flour milled fiom pearled grain,
- - to study extrusion dextrrnization of barley flour in order to investigate
the effects of e-e (a-amylase) addition level and extrusion
conditions such as temperature and flour-moisture level on the
hydrolysis of starch in barley n o m by determining the "degree of
starch hydrolysis (DH)", "dextrose equivalent (DE)" and mono-, di-,
and oligosaccharide composition, and
to study the effect of extrusion cooking of native barley flou under
various temperature/moisture combinations on the total, insoluble and
soluble dietary fiber, P-glucan and resistant starch contents of barley
flour.
1.1 References
Food Agriculture Organization, 2000: @ttp://apps.fao.org/cgi-bidnph- db.pl?subse~agricultureJ
Hakkarainea, R. V. L, Tyopponen, J. T., Hassan, S., Bengtsson, G., Lennart J. S. R. and Lindberg, P. 0. 1984. Biopotency of vitamin E in barley. Br J. Nup. 52:335-349.
Hawrysh, 2. 1997. Barley food products intervention trail for non-bsulin-dependent (NIDDM) diabetic subjects. The Alberta Agricultural Research Institute, Edmonton, Alberta.
McIntosh, G. H., Jorgensen, L., Royle, P. 1993. The potential of an insoluble dietary fiber-rich source from barley to protect from DMH-induced intestinal tumors in rats. Nuh. Cancer. 19: 213-221.
Qureshi A. A., Burger, W. C., Prentice, N., Bird, H. R and Sunde, M. L. 1980. Regulation of lipid metabolism in chicken liver by dietary cereals. J. Nutr- 1 10: 388- 393.

Wang, L., Newman, R. K, Newman, C. W., Jacbn, L. L., and Hofer, P. J. 1993. Tocotnenol and fatty acid composition of barley oïl and their effects on lipid metabolism. P h i Fuods H m N i 43: 9-1 7,
Chapter 2
Literature Review
2.1 History of barley
Barley (Hordeurn vulgare) is one of the major crops in the world. It is also one of
the first ever cuttivated grains, in fact, it was used as a form of currency in bibIica1 tirnes.
The original area of cultivation has been reported (Nilan and Ullrich, 1996) to be in the
fertile lands of Middle East. Archeological studies have found that barley was cultivated
by about 8000 BC in Iran. Others found that barley in essentially the forrn that exists
today was used at least 17,000 years ago in the Nile River Valley of Egypt It is believed
that barley was used in porridge, flat bread and fermented beverages as early as 6750 BC
(Matz, 1991).
With the modem technologies, the total annual cereal production in the world has
increased to about 2,062 million metnc tons (Food and Agriculture Organization, 2000)-
Canada is the world's second largest producer of barley with the production of 13.2
million rnetric tons, which ranked afker Germany, producing 13.3 million metric tons
amually (Food and Agriculture Organization, 2000). Barley c m be processed into
products like breakfast cereals, barley tea, pasta, dextrin, miso, etc. However, in Canada,
the use of barley as a food source for hurnans is limited (up to 5%), while up to 75% of
the total barley production is used as feed for animals (cattle, pig, chicken, horse, etc) and
20% is used in the maltkg and brewing industry (Alberta Barley Commission, Calgary,
AB, personal communication, 2000).
2.2 Types of barley
Barley is a diploid with seven pairs of chromosomes. Similar to any other grain7
the chernical composition and the morp hological characteristics of barley grain are
determined by genotype and gro wing conditions. These characteristics directly influence
the nutritional quality and hctionality of this grain and its cornponents.
BarIey has three spikelets at each rachis node. ALI three spikelets are fertile for
six-rowed barley but only the central spikelet is fertile fur two-rowed barley (Duflùs and
Cochrane, 2996). Two-rowed barley is usually plump and has a greater uniformity of
kernel size; thus it is more preferable for rnaitinghrewing and other food processing ( e -g .
milling and rolling) purpose.
BarIey grain can be h u k d or hd-less. In the early 1970s, University of
Saskatchewan researchers brought back the importance of hull-less strain when they were
studying the nutritional quaiity of badey germ plasma (Bhatty et al., 1975). Western
Canada, includmg British Columbia, Alberta, Manitoba and Saskatchewan, is the largest
producer of hull-less two-rowed and six-rowed barley with approximately 13 8,620 ha and
92,280 ha, respectively, in 1999 (B. Fedak, personal communication, 2000). Alberta
produced approximately 22,000 and 25,000 ha of hd-less two-rowed and six-rowed
barley, respectively. Hull-less barley contains more protein, starch, total and soluble P-
giucan compared to hulled barley (Bhatty, 1999).
2.3 Kernel structure
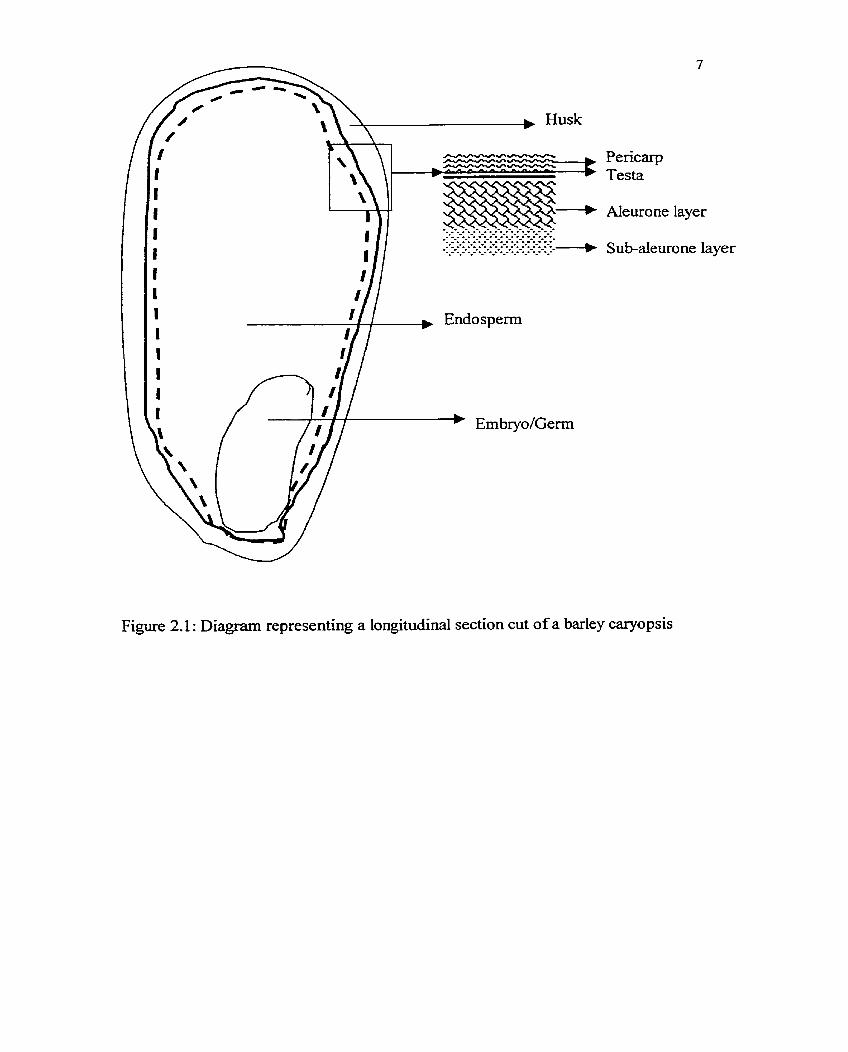
The cereal grain is one-seeded f?uit d e d a caryopsis, in which the f i t coat is
adherent to the seed (Fig. 2.1). Husk, perkap, testa, aleurone layer, embryo/germ and
Husk
Pericarp Testa
Aleurone layer
S ub-aleurone layer
Figure 2.1 : Diagram representing a longitudinal section cut of a barley caryopsis
endosperm are the major tissues of barley grain. Pearling/miIling involves removing the
bran Iayers @ericap, seed coat, aleurone layer and some sub-aleurone layer) and the gem
from the seed, which can reduce the minera1 and vitamin contents of the final prarled
product,
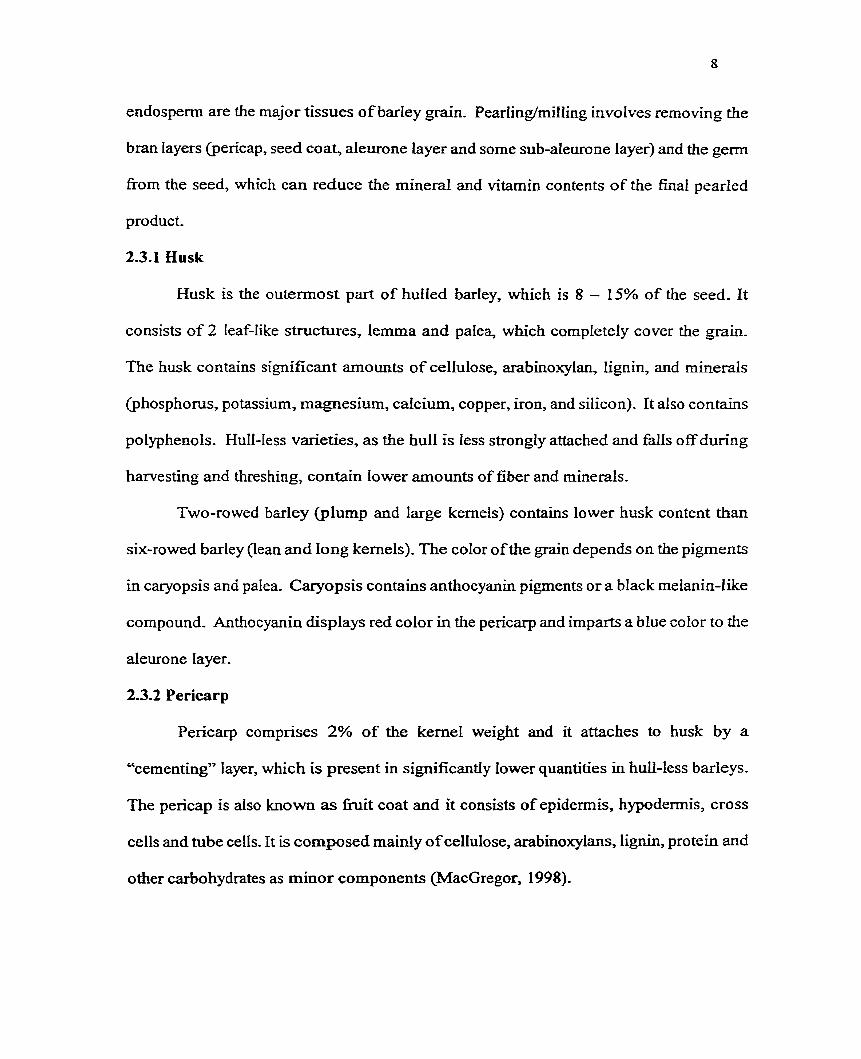
2.3.1 Husk
Husk is the outermost part of hulied barley, which is 8 - 15% of the seed- It
consists of 2 leaf-Iike structures, lemma and palea, which completely cover the grain.
The husk contains significant amounts of cellulose, arabinoxylan, iïgnin, and rninerals
@hosphorus, potassium, magnesium, calcium, copper, iron, and silicon). It also contains
poiyphenols. Hull-iess varieties, as the hull is less strongly attached and falls off du&g
harvesting and threshing, contain lower axnounts of fiber and rninerals.
Two-rowed bzrley (plump and large kerneis) contains lower husk content than
six-rowed barley (Iean and long kernels). The color of the grain depends on the pigments
in caryopsis and pafea. Caryopsis contains anthocyanin pigments or a bIack inelanin-like
compound- Anthcyanin displays red color in the pericarp and imparts a blue color to the
aIeurone Iayer.
2.3.2 Pericarp
Pericarp comprises 2% of the kernel weight and it attaches to husk by a
"cementing" layer, which is present in significantly lower quantities in hull-less barleys.
The pericap is also known as h i t coat and it consists of epiderrnis, hypoderrnis, cross
cells and tube cells. It is composed mainly of cellulose, arabinoxylans, lignh, protein and
other carbohydrates as minor components (MacGregor, 1998).
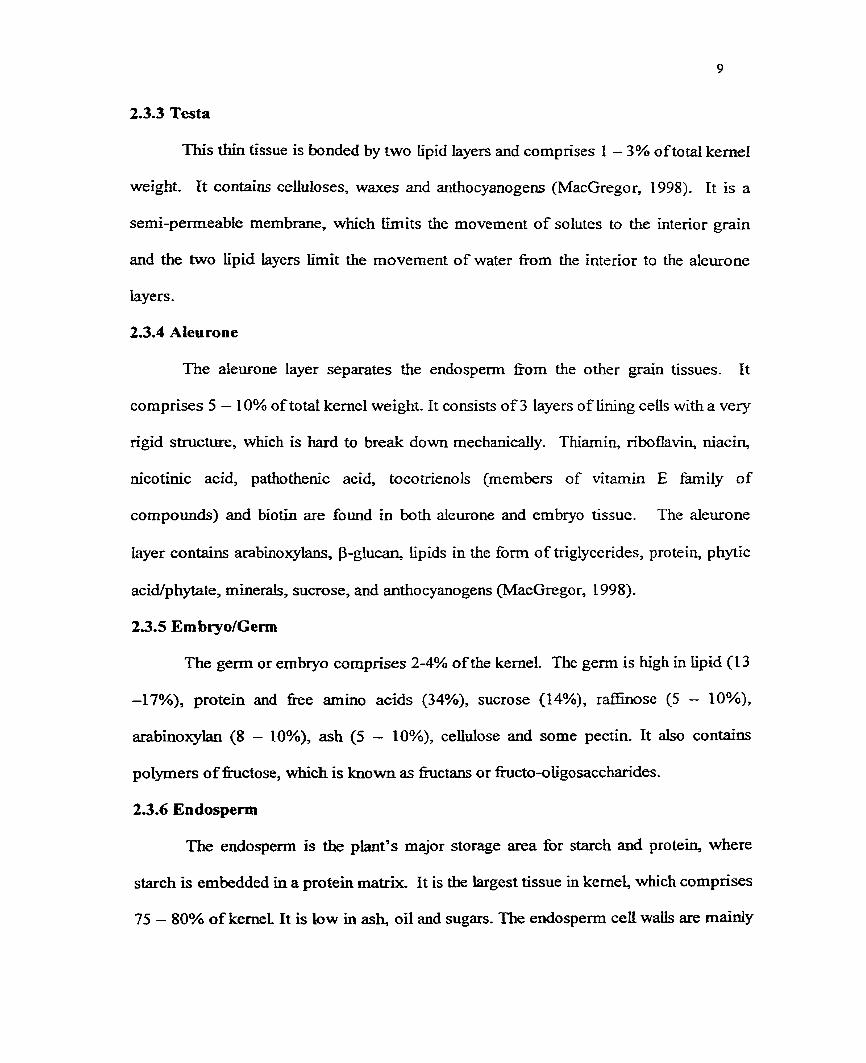
2.3.3 Testa
This thin tissue is bonded by two Lipid layers and comprises 1 - 3% of total kemel
weight. It contains celluloses, waxes and anthocyanogens (MacGregor, 1998). It is a
semi-permeable membrane, which Limits the movement of solutes to the interior grain
and the two lipid layers limit the movement of water f?om the interior to the aleuone
laye rs .
2.3.4 Ateu rone
The aleurone layer separates the endosperm fiom the other grain tissues. It
comprises 5 - 10% of total kernel weight. It consists of 3 layers of lining cells with a very
rigid structure, which is hard to break down mechanicdy. Thiarnin, rihflavin, niacin,
nicotinic acid, pathothenic acid, tocotrienols (members of vitamin E family of
compounds) and biotin are found in b t h aleurone and embryo tissue. The aleurone
Iayer contains arabinoxyh, P-glucan, lipids in the form of triglycerides, protein, phytic
acid/phytate, miner&, sucrose, and anthocyanogens (MacGregor, 1 998).
2.3.5 ErnbryoIGerm
The germ or embryo comprises 2-4% of the kemel. The germ is high in hpid (13
-17%), protein and fiee amino acids (34%), sucrose (14%), r a f i o s e (5 - IO%),
arabinoxykn (8 - 10%), ash (5 - IO%), cellulose and some pectin. It also contains
poiymers of hctose, which is known as hctans or f?ucto-oligosaccharîdes.
2.3.6 Endospem
The endospem is the plant's major storage area for starch and protein, where
starch is embedded in a protein matrix. It is the largest tissue in kernel, which comprises
75 - 80% of kernel. It is low in ash, oil and sugars. The endosperm cell walls are mainly
composed of P-glucan (70%) and the remainder is arabinoqdans, glucomannans,
celluloses, proteins and phenolic constituents (Jadhav et ai., 1998).
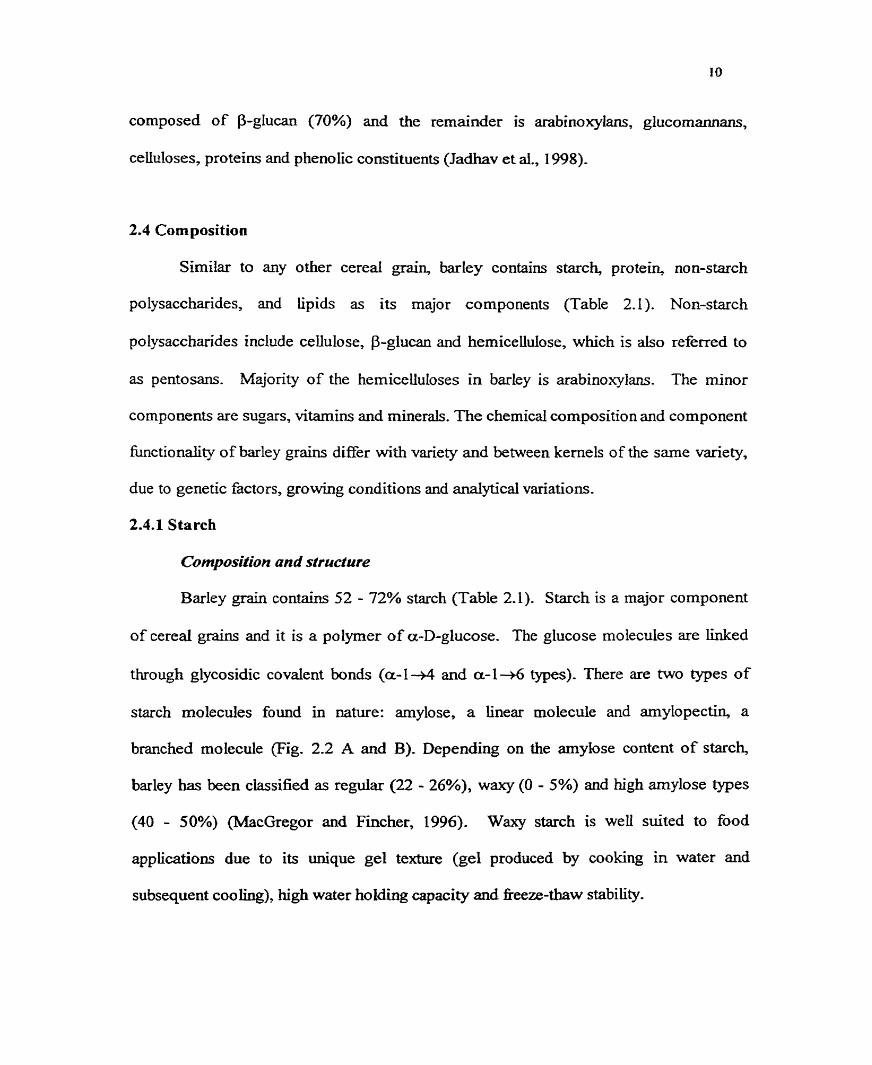
2.4 Composition
Simiiar to any other cereal grain, barley contains starch, protein, non-starch
polysaccharides, and lipids as its major components (Tabie 2.1). Non-starch
polysaccharides include cellulose, P-glucan and hemice LluIose, which is also referred to
as pentosans. Majority of the hemicellu1oses in barley is arabinoxylans. The minor
components are sugars, vitamins and mine&. The chernical composition and component
functionality of barley grains differ with variety and between kemels of the same varïety,
due to genetic factors, growing conditions and analytical variations.
2.4.1 Starch
Composition and structure
Barley grain contains 52 - 72% starch (Table 2.1). Starch is a major component
of cereal grains and it is a poiymer of a-D-glucose. The glucose molecules are linked
through glycosidic covalent bonds (a4 +4 and a-1 +6 types). There are two types of
starch molecules found in nature: amylose, a linear molecule and amylopectin, a
branched molecule (Fig. 2.2 A and B). Depending on the amylose content of starch,
barley has been classifïed as regular (22 - 26%), waxy (O - 5%) and high amylose Spes
(40 - 50%) (MacGregor and Fincher, 1996). Waxy starch is well suited to food
applications due to its unique gel texture (gel produced by cooking in water and
subsequent coo h g ) , high water holding capacity and fieeze-thaw stability.
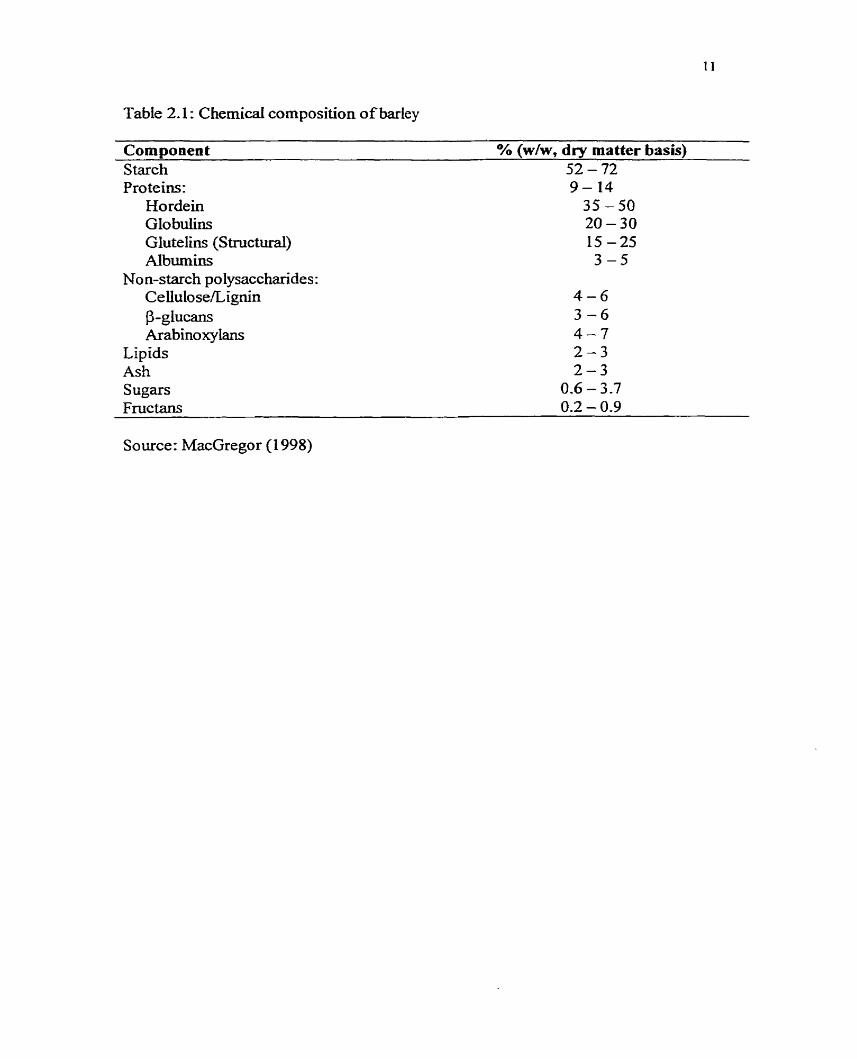
Table 2.1 : Chemicai composition o f barley
Component % (w/w, dry matter basis) Starch 52 - 72 Pro teins:
Hordein Globuiins Glutelins (Structural) Nbumins
No n-starch polysaccharides : Ceilulose/Lignin p-glucans Arabinoxylans
Lipids Ash Sugars
Source: MacGregor (1 998)
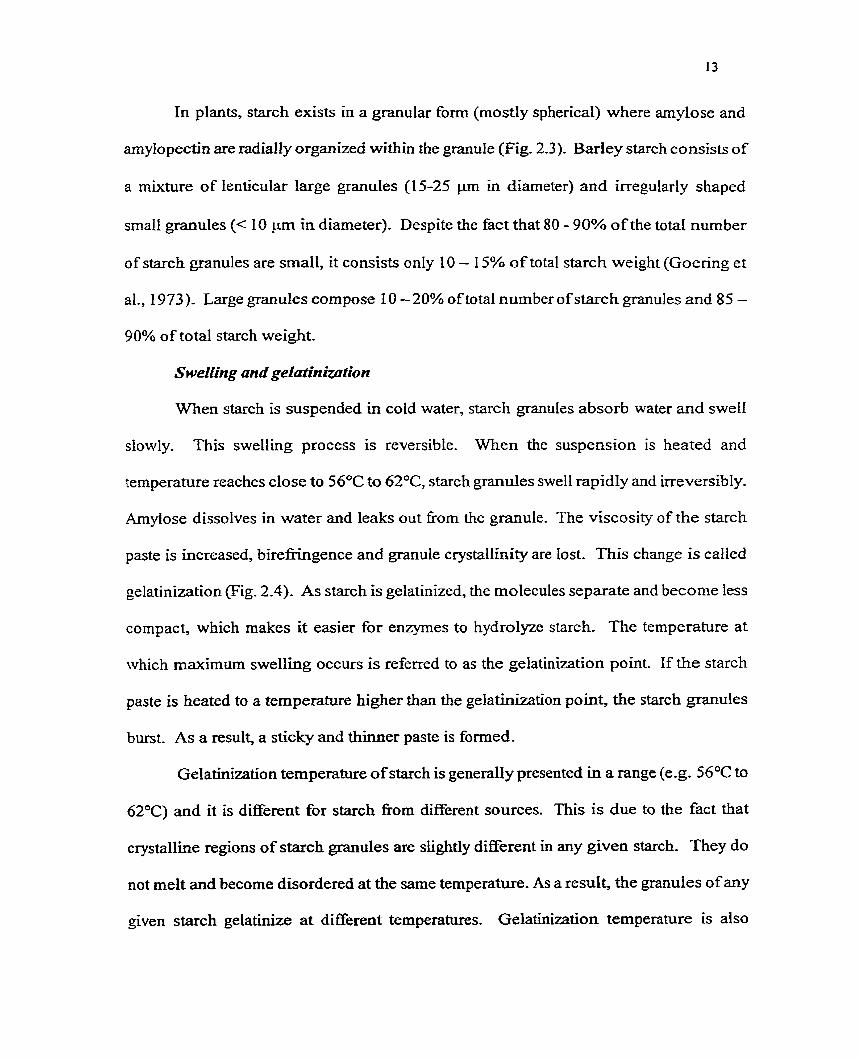
In plants, starch exists in a granular form (mostly spherical) where amylose and
amylopectin are radiaily organized within the granule (Fig. 2.3)- Barley starch consists of
a mixture of tenticular large granules (15-25 pm in diameter) and irregularly shaped
srna11 granules (< IO p m in diameter). Despite the fact that 80 - 90% ofthe total number
of starch granules are small, it consists only 10 - 15% of total starch weight (Goering et
al., 1973). Large granules compose 10 - 20% of total number of starch granules and 85 -
90% of total starch weight-
Sweifing and gefutinizafion
When starch is suspended in cold water, starch granules absorb water and swell
slowly. This swelling process is reversible. When the suspension is heated and
temperature reaches close to 56°C to 62OC, starch granules swell rapidly and irreversibly.
Amylose dissolves in water and leaks out fiom the granule. The viscosity of the starch
paste is increased, birefigence and granule ciystallinity are lost. This change is called
gelatinization (Fig. 2.4). As starch is gelatinized, the molecules separate and become less
compact, which makes it easier for enzymes to hydrolyze starch. The temperature at
which maximum swelling occurs is referred to as the gelatinization point. If the starch
paste is heated to a temperature higher than the gelatinization point, the starch granules
burst. As a result, a sticky and thinner paste is formed.
Gelatinization temperature of starch is generally presented in a range (e.g. S6OC to
62°C) and it is different for starch fiom diEerent sources. This is due to the fact that
crystalline regions of starch granules are slightly different in any given starch. They do
not melt and become disordered at the sarne temperature. As a result, the granules of any
given starch gelatinize at di fferent temperatures. Gelatinization temperature is also
Arnylopectin
+ Amylose
Figure 2.3 : Diagram of a starch granule
l Heat and water
1 Cool and store
Figure 2.4: Diagram of starch gelatinization and retrogradation
infiuenced by the nature of the starch. High amylose and lipid content of starch seem to
reseict sweEng. High amylose and waxy starch have higher gelatinization temperature
than regular starch (MacGregor and Fincher, 1996). S m d granules gelatinize at a higher
temperature than big granules,
Retrogradafion
During cooling of the hot starch paste, amylose and the linear portions of
amylopectin re-associate by hydrogen bonding to fonn a three-dimensional network,
which traps water in a rigid structure (Fig. 2.4). This process is referred to as
retro gradation,
Retrogradation rnaidy depends on the nature and percentage of amylose. A
longer chah and higher amylose content result in a fimer gel structure. Re-association of
amyiose and linear portion of arnybpectin is not likely to occur in waxy starch, because it
contains up to 100% amyiopectin and minimum amount of amylose. Thus, waxy starch
paste rernains as a thick paste during cooiing- The opaqueness of the gel is also directly
related to the amylose content.
2.4.2 Protein
Barley contains 9- 14% of protein (Table 2.1 ). It is concentrated at the endosperm
(especially at the penphery) and the aleurone layer of the seed. AU four major classes of
protein [alburnins (water - soluble proteins), globuluis (salt - soluble proteins), pro lamins
(alcohol - soluble proteins) and glutelins (acid and alkali soluble proteins)] are present in
barley gr-, where prolamins make up the largest portion (Table 2.1). Prolarnins are
named differently in cereal grains. It is cded hordein in barley, gliadin in wheaf and
avenin in oats, etc. The nutritional and functional qualities of barley proteins are
relatively poor. Breeding research is underway to address this concem.
2.4.3 Dietary fiber
Barley is a good source of dietary fiber. Diebry fiber has two major classes,
soluble and insoluble. Soluble dietary fiber includes P-glucan, arabinoxylans, hctans,
etc. P-Glucan contains both P (1+4) and P (1+3) glycosidic Iinkages (Fig. 2.5) and it is
the major structural component in the ce11 walls of barley grain endosperm- It forms a
viscous and sticky solution when rnixed with water (Dais and Perlin, 1982). Depending
on the cultivar and production location/environrnent, P-glucan content in barley grain
varies fiom 3 - 6% (w/w) (Table 2-1). The structure, physiochemical properties, method
of extraction and purification of P-glucan have been investigated (Woodward et ai., 1983;
Klopfenstein and Hoseney, 2987; Woodward et al., 1988; Bhatty, 1992; Bhatty, 1993;
Vasanthan and Bhatty, 1995; Yoon et al., 1995). Primary structural features of p-glucan
are mainly composed of the glycosidic linkage sequence, the degree of potymerization
(DP) of linear p (1+4) linked cellulose like segments (Fig. 2.6), and the glycosidic
Iinkage profile. Glycosidic iinkage profile refers to the percentage ratio between P
( 1 4 ) and B (1 +3) linked glucosyl units, which is found to be 70% to 30% (Woodward
et al., 1983). n i e physicochemical properties (Le. viscosity, solubility, shear stability) of
barley P-glucan mainly depend on the small differences in its primary structural features,
instead of its degree of polymerization or overall asymmetncaI conformation. Shuctural
differences influence the ability of the f3-glucan molecules to align into relatively stable
molecular aggregates (Woodward et al., 1988; Gomez et al., 1997 a, b, c). Woodward
and CO-workers (1983) reported that the overall irregular conformation of P-glucm
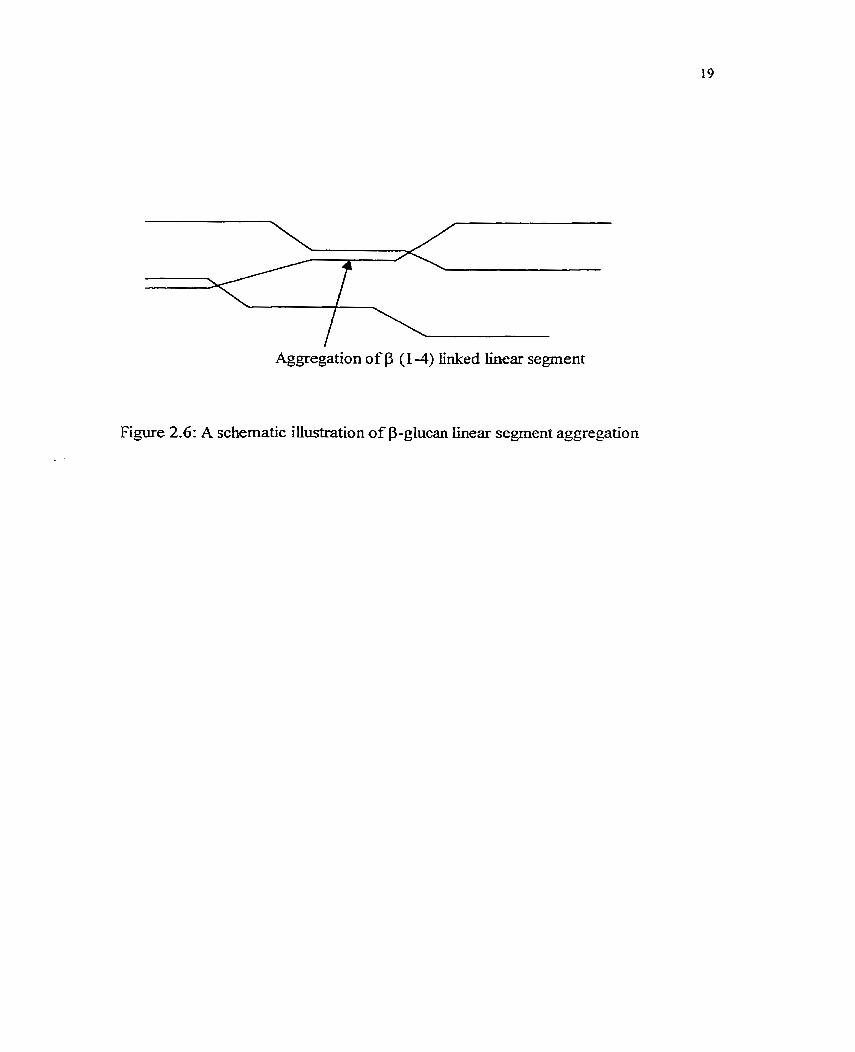
Aggregation of P (1 -4) tinked hear segment
Figure 2.6: A schematic illustration of P-glucan hear segment aggregation
depends on the different spacing of B (1 +3) linkages ofthe polymer. The authors further
indicated that, higher percentages of B (I+3) linked P-glucosyl residues (high
irregularity) in badey P-glucan chains reduce its tendency to aggregate, which in tum,
enhances its solubiiity. High temperature is found to increase the aggregation potential of
barley P-glucan and decrease its solubility (GOmez et al., 1997a). Study also showed that
aggregation exits in both low- and high molecular weight f3-glucan that relaxes upon
shearing (G6mez et al., 1997~).
Arabinoxylans content in baley grain range fiom 4 - 7% (Table 2.1). It consists
a Q (14)-xylose polyrner as a backbone, while some xylose units are substituted with
arabinose residues (mono, di, or oligo) (Fig. 2.7). The degree and pattern of substitution
determine the solubility and fünctionality of arabinoxylans. Arabinoxylan chains can be
cross linked by phenolic acid, such as ferulic acid ((MacGregor, 1998). Degree of
linkage also affects the solubility and solution properties of arabinoxylans. It is a minor
cornponent in endosperm ce11 walls but a major component in the ceil walls of the
aleurone and outer layers (seed coat, pericarp, etc) of the kernel. Sirnilar to P-glucan, it
can forrn a viscous solution in water.
Insoluble fiber fiaction is composed of lignin, cellulose and resistant starch.
Lignin cannot be digested by the hurnan digestive system and is therefore classified as
dietary fiber. Cellulose is a linear /3 (1 4)-D-plucan polyrner, which is concentrated in
the outer layer of barïey grain. As a dietary fiber componen?., resistant starch c m o t be
digested in small intestine but it is fermented by microflora in colon. There are three
types of resistant starch: physically inaccessible starch (RS l), resistant starch granules
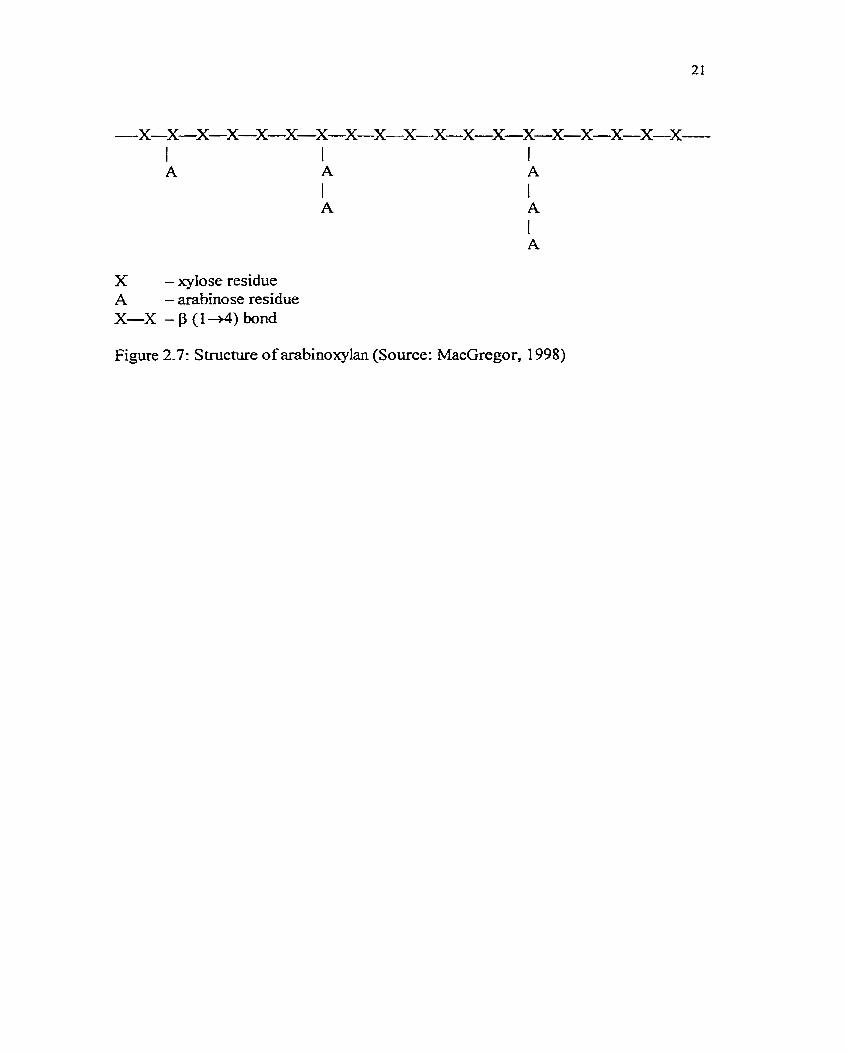
X - xylose residue A - arabinose residue x-x - p ( 1 4 ) bond
Figure 2.7: S tmcture of arabinoqlan (Source: MacGregor, 1 998)
(RS2) and retrograded starch (RS3). Processing raw food materials can destroy RSZ and
RS2, but may develop RS3 by retrogradation.
2.4.4 Lipid
Lipid content of barley ranges between 2-3% (Table 2.1). Fatty acids in cereals
occur in neutral Lipids, glycolipids, and phospholipids. The predominant fatty acids are
linoleic (55%), palmitic (21%), oleic (18%) and a-linolenic (6%) acids. The lipid is
mainly distributed in the aleurone and germ. Lipid exits in either fiee or bound f o m in
cereal grains. Bound lipid foms a complex with amylose (h4omson et al., 1993).
2.4.5 Minerals and vitamins
Ash content of barley ranges between 2 - 3% (Table 2.1). The predominant
minerals are phosphorus, potassium, calcium and a small amount of magnesium, sulfur,
sodium and other trace elements is present. Up to 85% of phosphorous in cereals and
legumes occurs as phytic acid (Tsao et al., 1997). Phytate (salt of phytic acid) has the
ability to bind minerals, such as iron, zinc, magnesium and calcium, which leads to
unavailability of these minerals for utilization in the body. Ironically, its minera1 binding
ability has been investigated for antitumour and antiulcerogenic propeaies (Mchtosh and
Russell, 1988)-
Barley contains al1 isomers (a, f3, y, and 6) of tocotrienols and tocopherols, which
act as antioxidants and have cholesterol lowering effect (especially tocotnenols)
(McIntosh and Russell, 1988; Wang et al., 1993a). Barley is also a source of B-complex
vitamins, especially thiamine, pyridoxine, nboflavin and pantothenic acid. Barley also
contains a significant amount of niacin. However, a part of the niacin is bound to protek
which makes it biologically unavailable.
2.5 Barley nutrition - dietary fiber and vitamin E
Research has indicated that reguIar consumption of barley products wodd benefit
human health. Barley has been reported to have hypocholesterolemic effect in both
animal and human studies (Newman et a . , 1989, Martinez et al., 1992). High s e m
cholesterol has k e n recognized as one of the nsk factors for coronary heart disease.
Studies have also shown that bariey consumption would improve the glycemic response
in diabetic subjects ( H a . s h , 1997; Yokoyama et al., 1997; and Bourdon et al-, 1999).
A brief surnmary of some nutritionai studies is presented below.
In a 28-days study (Newman et al,, 1989), 14 men were put on barley and wheat
diet. The results indicated that the barley diet did not show any significant cholesterol
lowing effects on subjects with average or low cholesterol levels, but subjects with a high
choksterol Ievei experienced a reduction in both total and low-density lipoprotein &DI;)-
cholesterol levels. In an animal study (Wang et al., 1992), 96 male broiler chicks were
fed with corn-soybean, barley or barley diet with B-glucanase, It was reported that barley
P-glucan caused high viscosity in chick's small intestine and thereby interferhg with the
digestion of other nutrients, thus reduced plasma cholesterol and final body weights of
chicks. The authors suggested that P-glucan could also decrease cholesterol by binding
to bile acids. Glore et al. (1994) reviewed this subject and brought up several other
mechanisms on how the soluble fiber could decrease cholesterol level. They reported
that soluble fiber is fermented into short chain fatty acids (SCFA) (for exampie, acetate,
propionate, and butyrate) by colonic bacteria and these SCFA inhibited hepatic
cholesterol synthesis. Soluble fiber couid also bind to et and lead to its excretion. Such
excretion would suppress the absorption of fat solubIe vitamins and some miner&
(calcium, zinc and iron) (Toma and Curtis, 1 986, Kiopfenstein, 1 988).
In a human study (Lupton et al., 1993), 44 men and women consumed ceiIulose
or barley bran flour diet Results showed that barley bran flour Iowered senun
cholesterol level as weli as decreased gastrointestind transit time by 8.02 h and increased
daily fecal weight by 48.6 g in subjects. It was suggested that insoluble fiber diluted
carcinogens in fecal buk and shortened transit time in colon, thus it protected against
colon cancer.
Beside dietary fiber, a-tocotrienol in barley, is believed to have
hypocholesterolemic effect. Total concentration of vitamin E in barley varies fkom 55-65
mgkg (db) up to 95 to 1 00 mg/kg (db) at harvest time (Hakkarainen et al., 1984)- In an
animal study (Wang et al., 1993a), 24 male broiler chicks were fed with barley oil, corn
oïl or margarine. Results showed that barley oil had a greater hypocholesterolemic effect
than corn o ï l while b t h a-tocotrienol and polyunsaturaed fatty acids (PUFA) of barley
might be responsible for the suppression of plasma total cholesterol and LDL
concentration
In another animal study (Qureshi et al., 1980), 20 white leghorn chicks were fed
with corn, wheat, barley, oats or rye. Chicks on a barley diet showed a higher increase in
enzyrnatic activities of acetyl-CoA carboxylase and fatty acid synthetase (FAS) and a
greater decrease in the activity of 3 -hydroxy-3-methyIgIutary1 coenzyme A (HMG-Co A)
reductase (a rate-limiting enzyme in cholesterol and bile acid synthesis in Iiver). Since
both biosynthesis pathways of cholesterol and fatty acid require acetyl-CoA as a common
precursor, results uidicated that acetyl-CoA was utilized to a greater extent by FAS
synthesis pathway, thereby limited its utilization in HMG-CoA reductase pathway. Thus,
the cholesterol synthesis was being controlled and resulted in a reduction of serum
cholesterol.
Barley diet may retard or even reverse the negative hedth condition of people
who are suffering ikom diabetes. In a human study, 56 non-insulin-dependent diabetic
subjects were involved in a 6 months dietary study (Ha-sh, 1997). There was a
significant decrease in grycated hemoglobin values for the femaie subjects during the
study. Male subjects experienced 24% and 23% decrease in mean fasting insulin d u e s at
3 and 6 months, respectively- Results showed that 5 out of 33 oral hypog~ycernics
dependent subjects were able to decrease their dosage. Hawrysh ( I 997) aiso reported that
the barley diet could increase high-density lipoprotein (HDL) levels while decreasing
LDL/KDL ratio by 8.6% and 7.1 % at 3 months and 6 months respectively compared to
the initial level. In another human study, 5 volunteers, male and femaie subjects, were
involved in a 3-weeks study period (Yokoyarna et al., 1997). The subjects were required
to consume barley and wheat pasta in order to test their blood glucose and blood insulin
responses. The results indicated that barley pasta lowered the plasma insulin response,
thus barley could have hypoglycemic effects. This conclusion agreed with that of
Bourdon et al. (1 999), who carried out a study with 11 healthy men and fed them P-
glucan e ~ c h e d pasta. Results suggested that carbohydrate was absorbed slower fkorn
the high fiber meal containhg P-glucan with a slower response of insulin.
Barley also has anticarcinogenic effects. In an animal study, 5 5 Sprague-Dawley
rats were fed cellulose, barley bran, wheat bran and spent barley grain (Mchtosh et al.,
1993). Results showed that spent barley grain was the most effective in lowering the
incidence of dimethyl hyd-ne (Dm) induced m o r s in rats- Insolubility of dietary
fiber fiom barley could be the factor against intestinal cancer in rats, In another animal
study (McIntosh et aI-, 1996), commercial barIey bran mainly from the aIeurone/sub-
deurone layer (23% dietary fiber), outer layer barley bran including the germ (25.5%
dietary fiber) and spent barIey grain bran (47.7% dietary fiber) were compared with
wheat bran (44% dietary fiber) and ceUuiose (control, 98% dietary fiber). Results
indicated that commercial barley and wheat bran were more effective than outer layer
barley bran and spent barley grain bran in protection against DMH induced intestinal
hunors in rats,
2.6 Barley processing
2.6.1 Peariing
Pearling is usudy the initial step in barley Baur miiling. The process involves
gradua1 removal of grain tissue starting fi-orn the outer Iayers (Le. pericarp, seed coat,
aleurone layers, sub-aleurone layer) and germ of grain by abrasive action. A pearler is
generally composed of 6 - 8 abrasive carborundum or emery coated disks, which revolve
at high speed (about 450 rpm) within a perforated cylinder or closed chamber (Leonard
and Martin, 1963). It is usualiy a batch process, which is designed to obtain uniform
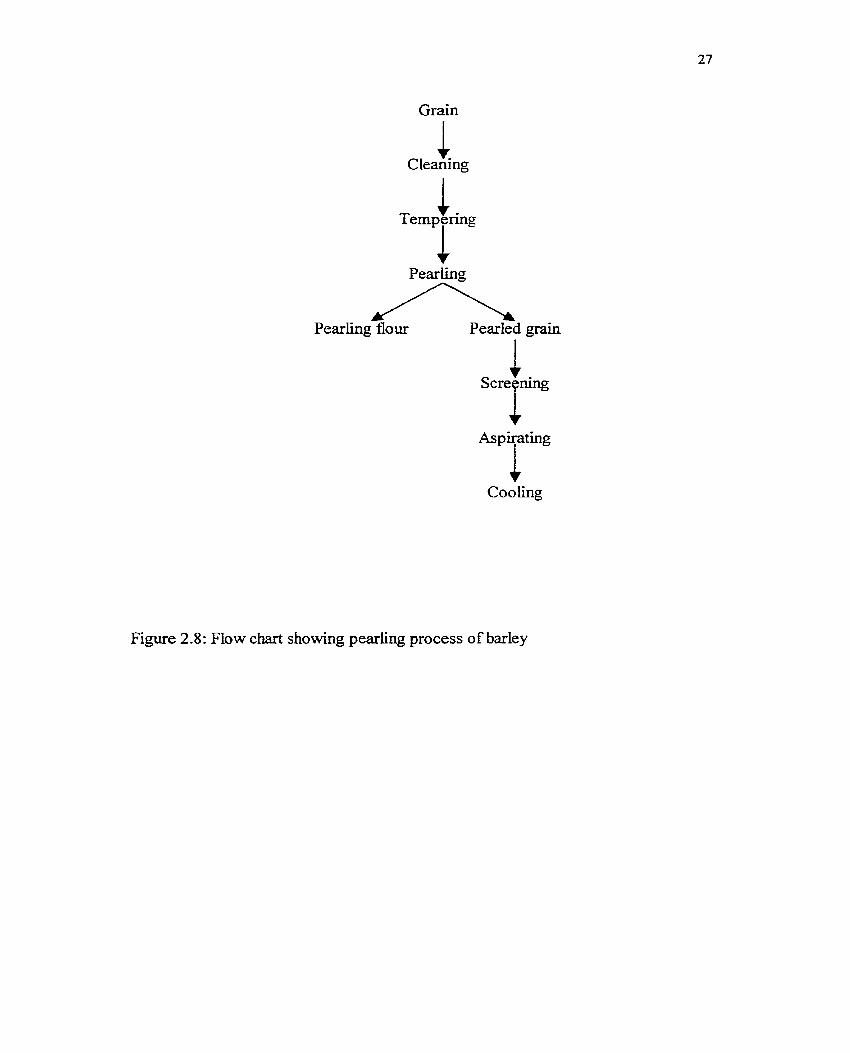
removal of the grain outer layers. The process of pearling involves grain cleaRUlg7
conditioning/ternpering (to about 1 5% moisture), pearling, screening/siftimg, aspirathg
(to remove the bran particle/spacs) and cooling (Fig. 2.8). Depending on the degree of
pearling, products range fkom dehdled barley, pot barley (up to 15% pearl) and pearled
barley ( H 5 % pearl). The removed grain outer layers, called pearling flour (Fig. 2 . Q is
Grain
Pearling
Pearling flour Pearled grain
+' Cooling
Figure 2.8: Flow chart showing pearling process of barley
usually sold as feed. Fiber content of these products differs. The insoluble fiber content
of pearled grain gradually decreases upon pearling, while soluble fiber and B-glucan
contents are somewhat increased (Pedersen et al., 1989). Research has shown that 30-
40% pearling is the rnost desirable based on the balance between nutritional and physical
properties (Marconi et al-, 2000). The "degree of pearling" is a terminology, which needs
some clarification as it's meaning differs with region. For instance, in North America,
"30% pearled" means 30% pearling flour and 70% pearled grain. In Japan, where
significant amounts of pearled barley is used in food products Iike rice extender, miso,
etc, "70% pearled" rneans 70% pearled grain and 30% pearling flour.
2.6.2 Extrusion
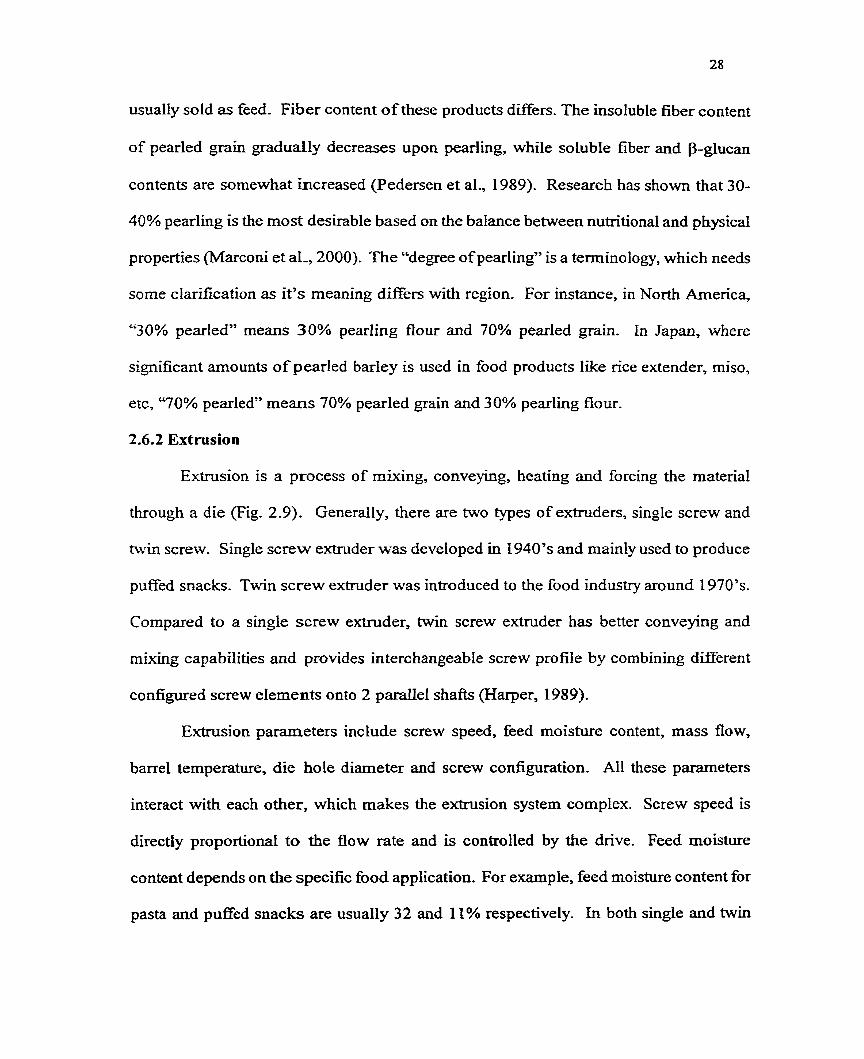
Extrusion is a process of rnixing, conveying, heating and forcing the material
through a die (Fig. 2.9)- GeneralIy, there are two types of extruders, single screw and
twin screw. Single screw extruder was developed in 1940's and mainly used to produce
puffed snacks. Twin screw extruder was introduced to the food industry around 1970's.
Compared to a single screw extruder, twin screw extruder has better conveying and
mixing capabilities and provides interchangeable screw profile by combining different
configured screw elements onto 2 paralle1 s h a h (Karper, 1989).
Extrusion parameters include screw speed, feed moisture content, mass flow,
barre1 temperature, die hole diameter and screw configuration. Al1 these parameters
interact with each other, which makes the extrusion system complex. Screw speed is
directly proportional to the flow rate and is controlled by the drive. Feed moishire
content depends on the specific food application. For example, feed moisture content for
pasta and puffed snacks are usually 32 and 11% respectively. In both single and twin
Drive
Feed happer , T h e r m ~ o u p b s ~ Press ducer
Figure 2.9: Cross-section of an extruder
screw extniders, the mass flow is not ody influenced by screw speed, but also iduenced
by "drag" flow. The flow of material in the barre1 instead of tunung with the screw is
caJied "drag", which is directly proportional to the screw speed (Harper, 1989). Bamel
temperature is another important extrusion parameter, which is controlied by the heating
device (heating/cooling jacket) and medium (electnc, steam or oïl). In order to extrude
products with different shape, die hole design must be specified. Smaller die diameter
induces pressure in the extruder barre1 and the die design detemines the shape of the
product, Furthemore, screw coniiguration is designed for transferring, mixing and back
flowing purposes. This concept mostly applies to twin screw extruder, where the
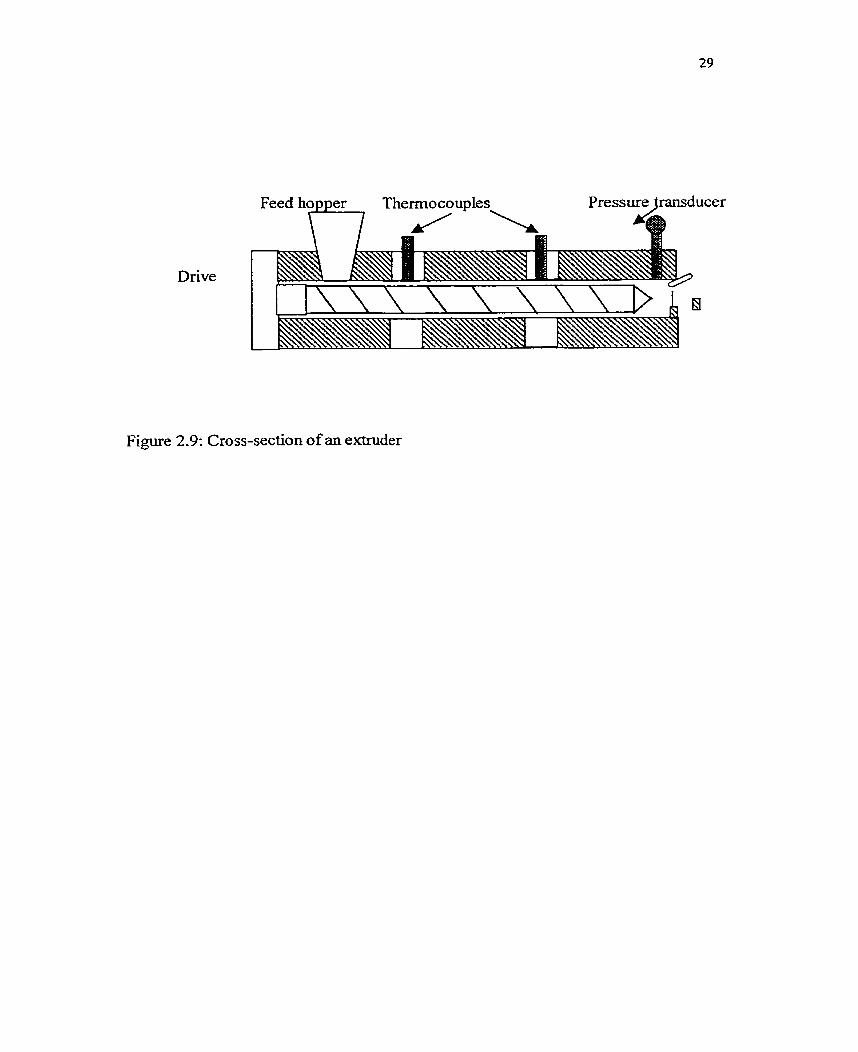
configuration is built by cornbùung different screw elements together. Convey elements
(right h d screw) transfer material towards the die, which is expressed as pitch
(mm)/length (mm) (e .g. 3 W6O) (Fig. 2- 10). Kneading elements improve mixing, which is
expressed as offset angle (")/nuber of discfiength (mm) (e.g.45/5/30) (Fig. 2-1 1).
Reverse eIernents (lefi hand screw) convey material away fiom the die and increase the
pressure in the specific section and it is expressed as pitch (mm)/length (mm) (e.g.30/60
LH) -
QW or Single screw extruder can either consist of one continuous piece of scr-
seved pieces with various configured pieces combined together. The latter provides
more flexibility and reduces the cost of repiacing a worn section. Twin screw extruder is
composed of two shafts of identical screw configuration and they rotate in either the same
direction (CO rotation) or different direction (counter rotation). Screw sections c m a h
be non, partidly, or M y intermeshg (Fig. 2.12). Intermeshing promotes drag flow.
Intermeshing CO-rotahg twin screw extruder also provides self-wiping feature, which
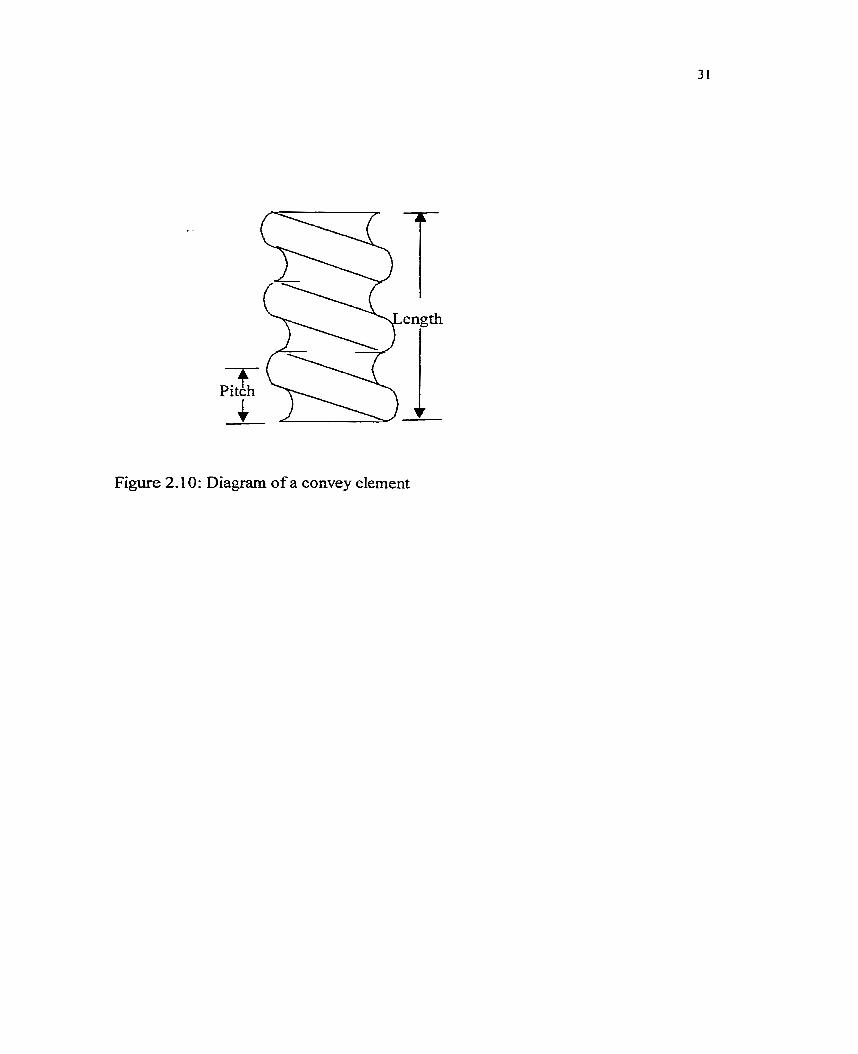
Figure 2.1 0: Diagram of a convey element
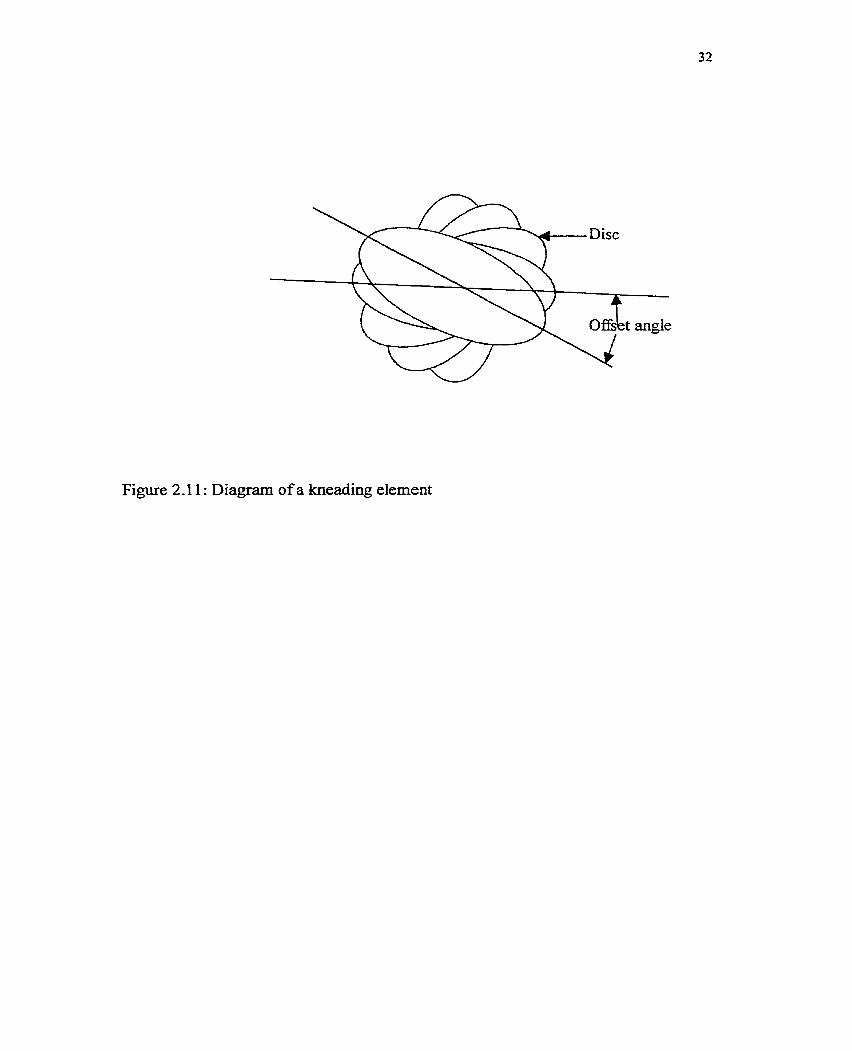
Figure 2-1 1 : Diagram of a kneading element
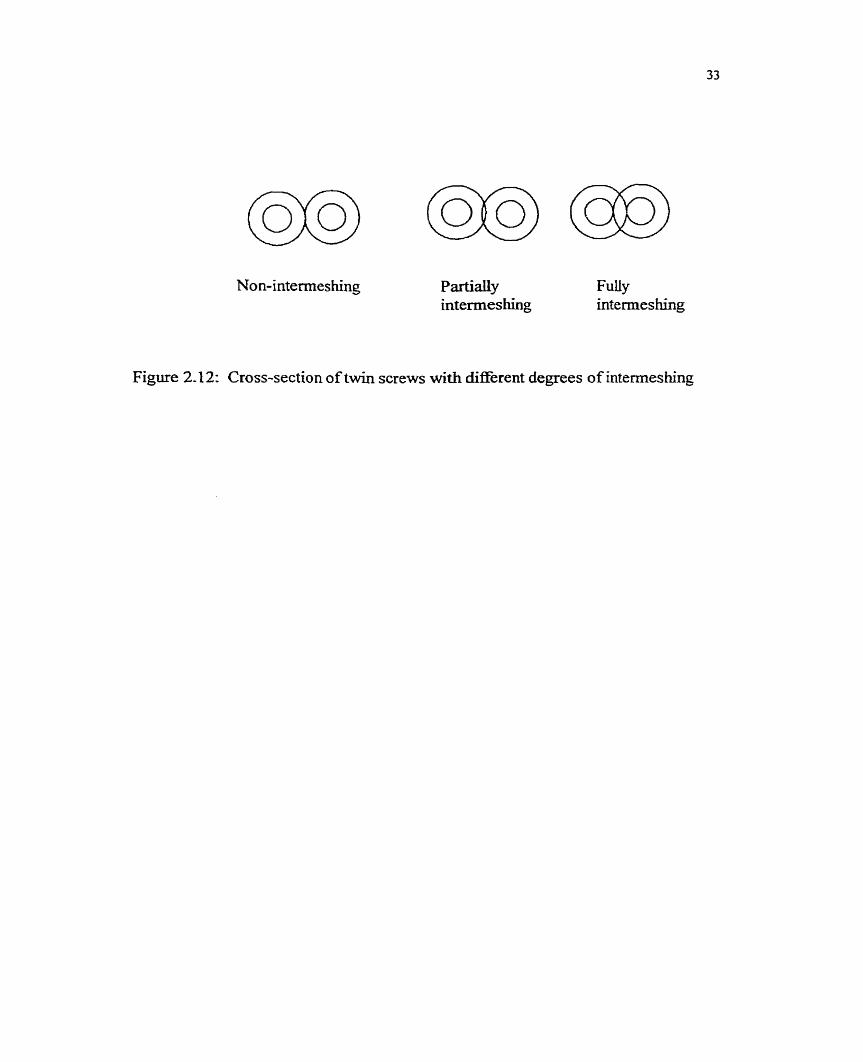
m Non-intermes hing PartîaUy Futiy
interrnes hing interrnes hing
Figure 2.12: Cross-section of twin screws with different degrees of intermeshing
prevents buildup of material in the barrel. Twin screw extruder is designed with a
sequence of unit operationsr feeding. conveying, rnixÏng, cooking, venting, cooling and
pumping.
Feeding devices c m be classified as volumetric feeduig or gravimetric feeding
(Harper, 1989). Volumetric feeding controls feed rate by volume and it is affected by
the density of matenal. Gravirnetric feeding controfs feed rate by mass instead of
volume. It is innuenced by the amount of material in the hopper. Larger amount of
materid in the hopper may result in a higher feed rate.
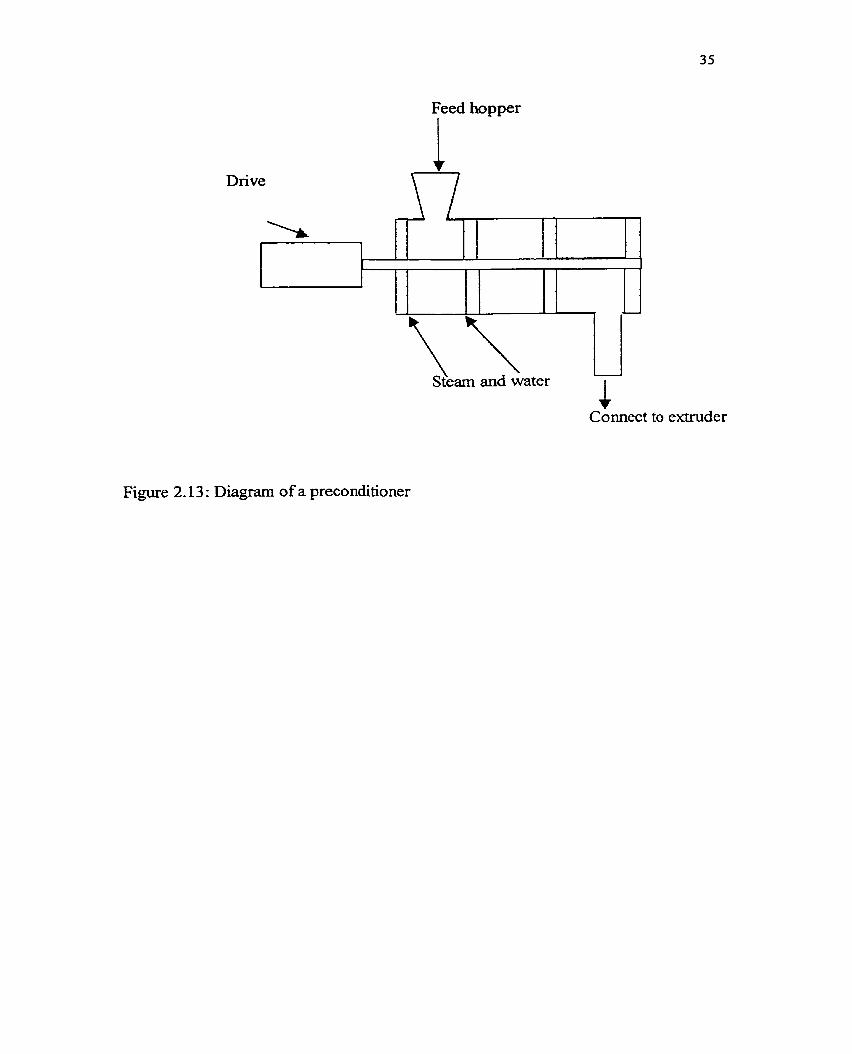
Sornetimes a preconditioner is attached to the extruder (Fig. 2.13)- It is used to
increase capacity, increase residence time and reduce mechanical po wer consumption for
the extruder. I t is an atmospheric or pressurized chamber, which acts as a pre-
rnixing/pre-heater by injecting water or live s t e m .
Extnision has k e n introduced to the food industry over 50 years ago warper,
1989). Hûwever, applications are limited to production of snacks, pasta, breakfast
cereals, pet foods, confectionery products etc. Researchers reported that high
temperature extrusion cooking could inactivate native enzymes, such as a-amylase,
lipase, Lipoxygenase, peroxidase and urease, which caused food deterioration during
storage (Linko et d., 198 1). The inactivation of a-amylase and other enzymes aiiows
products to retain their original desired quality and have longer shelf-life. Ironicdy, it
was the observation that extrusion may not totally inactivate a-amylase that lead to the
concept of using an extruder as a reactor for enzymatic liquefaction (Linko, 1989).
Extrusion cooking is tirne efficient because it can be carried out in a contùiuous manner
Feed hopper i
Figure 2.13 : Diagram of a preconditioner
instead of conventional batch processing. The extruder also shows a good heat transfer
with 95% efficiency, which made the process possible even in a short retention tirne..
Due to its îlexibility, twin screw extruder is more cornmonly used for enzymatic
liquefaction of starch (Harper, 1989). It has a higher conveying capability compared to a
single screw extruder. It can also process a wider range of raw materials in terms oftheir
particle size, moisture content, fat content etc- It can be configured for high or low shear
applications with diEerent modular designs, segmenteci screws and number of barrels.
Continuorrs enzymatic liquefacfion of starch rcsing extruder as a reactor
In an extruder, enzyrnatic liquefaction is carried out with thermal and mechanical
energy- Under properly controlled operating conditions, pure starch or starch in flour can
be hydrolyzed to diEerent extents. The degree of hydrolysis can be calculated by the
amount of sugar released (Le. a-amylase releases maltose; glucoamylase releases
glucose), and it c m also expressed in terms of dextrose equivalent (DE), which represents
the amount of reducing end. At high temperatures, the regular type of amylase (enzymes
are proteins) are denatured and they lose their activity. However, the discovery of
thermally stable a-amylase opened up more oppominities for high temperature extrusion
liquefaction of starch. The operating conditions have to be optimized to ensure minimal
entyme inactivation and that the starch granules are gelatinized for enzyme susceptibility.
Extrusion dextrinization of pre-gelatïnized starch with thermally stable amylase can
produce dextrins with up to DE 20 (Chouvel et al., 1983).
Higher degree of sîarch hydrolysis in an extruder is possible with glucoamylase.
Unforhmately, it is difficult to carry out both liquefaction and saccharification parallelly,
because the temperature of gelatinization would be too high and would inactivate
glucoamylase. The retention time is too short in an extruder. As temperatures for
Iiquefaction and saccharification are different, it is hard to change the temperature corn
high (requixed for liquefaction) to low (reqcired for saccharification). Thus,
saccharification should be carried out as a separate unit operation as demonstrated by
Linko et al. (1 983 a). The authors saccharified the liquefied extrudates with a shaker in an
oven at 60°C with glucoarnylase but without Inactivating the thermostable a-amylase
used during liquefaction. They obtained products with DE 94-95 in 24 h Other research
suggested that success£ÜI conversion couid be obtained by introducing glucoamylase just
before the die element, a4er the mass temperature had been decreased to 60 O C (Hakulin
et ai., 1983). This method would minunize cooling of d e e z e d product and subsequent
starch retrogradation before saccharification. The conversion was continued at 60 O C for
1 or 5 h and resulted in DE 75 and 94 products, respectiveIy.
Hakulin et al. (1983) suggested that an increase in moisture content coupled with
high temperature could result in complete starch gelatinization, thus a higher degree of
starch hydrolysis. This is consistent with the study of Linko et al. (1983a), which
demonstrated that higher DE could be obtained with increased water content Usually, a
minimum of 31% moisture level is required for starch gelatinization. However, under
high temperature and high pressure extrusion cooking, starch gelatinizatioa could occur
at 20% moisture level (Linko et aL, 1983b)- This concept is similar to what was reported
by Roussel et al. (1991). Their study suggested tbat extrusion at a low moisture content
(30%) imparted higher shear stress and increased heat generation, which enhanced
mechanical disruption of starch granules. The same study M e r suggested thaî a low
feed rate woukl Iead to Iow filling of screw channels, thereby reducing the effectiveness
of heaî transfer.
Both starch gelatinization and enzyme activity are dependent on temperature and
mo ishire. Starch gelatinization at 24-2796 mois ture increased rapidly with increasing
temperature, but increased moderately under 18-2 1 % moisture content (Chiang and
Johnson, 1977). Research also indicated that an increase in temperature led to an
increase in starch hgmentation (Theander and Westedund, 1987). Such kagrnentation
would be preferable as it would enhance enzyme hydrolysis. However, if the extrusion
temperature is higher than the optimal range for enzyme activity, the degree of hydrolysis
wiii be decreased due to enzyme inactivation. Chouvel and CO-workers (1 983) showed
that as temperature increased fiom 1 00 to 145 OC, DE decreased from 19.5 to 16.5.
In addition to temperature and moisture levels, pH, enzyme concentration, and die
nozzle size are &O important. Neutrai pH has k e n shown to be more suitable as
compared to acid or &di conditions (Chouvel et al., 1983). Also equally important is
the enzyme concentration, which should be proportional to the starch concentration The
higher the enzyme concentration, the higher the degree of hydrolysis until it reaches an
optimum point. Increase in scre w speed could cause incomplete starch gelatinization due
to short retention time (Chiang and Johnson, 1977). Increased die nozzIe size codd
decrease starch geIatuiization due to a decrease in pressure and surface shear (Chiang and
Joiinson, 1977).
It is important that the enzyme used should be inactivated after hydrolysis in order
to obtain a specific DE value. Linko et ai. (1 983 b) studied the effect of 1 % mercuric
chloride and liquid nitrogen freezing on enzyme inactivation. The authors found both
treatments to be not effective. The liquid nitrogen was not effective because of
incomplete eeezing of extrudes. In addition, the active enzyme could be present
interndy and its activity codd be restored f i e r reconstituting dried extnidates in water.
Studies have shown that thermostabie a-amylase can be inactivated by using 0.2 M
acetate buf5er (pH 3.5) (Reinikainen e t al., 1986) and by heating to above 155 OC (Linko,
1989)-
Effects of extrmiofl on hyocholesterolemrC acfivity and dietaryfiber
Research showed that extrusion cooking did not alter the hy-pocholesterolemic
effect of nce, oat and corn bran (Kahlon et al., 1998). The sarne research suggested that
extrusion could improve the hypocholesterolernic activity of wheat bran. This concept
was in agreement with Ralet et al. (1 WO), who iiiustrated that those mild extrusion
conditions of wheat bran could increase arabinoxylan and P-glucan contents, decrease
protein solubility and increase water absorption capacity. Wang and Klopfenstein (1 993)
reported that rats fed with exû-uded wheat, oat and barley had lower senun and Liver
cholesterol level compared to those fed with raw materials. Rats fed with extnided barley
had the lowest cholesterol ievel.
K a o n et al. (1998) found that extrusion under Iow energy decreased the total
dietary fiber in rice, corn and wheat. However, under high energy, total dietary fiber of
corn and wheat decreased, but increased in oat. There was no major change in the ratio
of soluble to insoluble fiber for aii varieties. Wang et al. (1993b) showed a decrease in
total dietary fiber upon extrusioa 0stergird et al. (1 989) reported a slight increase in
dietary fiber after elctnidiing whole barley meal. Similar results were found by Bjôrck et
al. (1984). Nevertheless, other research showed no change in total dietary fiber upon
extrusion (Siljestrom et al., 1 986)- b l e t et al, (1 990) found no difference in total die-
fiber except under severe extrusion conditions. Previous studies found that extrusion
cooking of various cereal grains and fiactions could increase soluble dietary fiber (Bjorck
et al., 1984, Siljestr6rn et al-, 1986, Shinnick et ai., 1988, Aoe et al,, 1989, Ralet et al.,
1990, Wang et al., 1993b). Signifiant increases in glucose, maltose, maltotriose aqd
mdtotetraose were reported during extrusion cooking of wheat in a single screw exîruder
(Chiang and Johnson, 1977)-
Aoe, S., Nakaoka, M., Ido, IL, Tamai, Y., Ohta, F., and Ayano, Y. 1989. Avaiiability of dietary fiber in extruded wheat bran and apparent digestibility in rats of coexisting nutrients. CereaZ Chem. 66: 252-256.
Bhatty, R. S. 1992. P-Glucan content and viscosities of barleys and their rouer-rnilled flour and b m products. Cered chern. 69(S): 469-47 1.
Bhatty, R. S. 1993. Extraction and enrichrnent of (1 -3), (1 -4)-P-glucan fkom barley and oat brans. Cereal Chem. 70(1): 73-77,
Bhatty, R S. 1999. The potential of hull-less barley. CereaZ Chern. 76(5): 589-599.
Bhatty, R S., Berdahl, J. D., and Christison, G. 1. 1975. Chernical composition and digestible energy of barley. Can. J. Animal Sci 3 5: 759-764.
Bjorck, I., Nyman, M., and Asp, N. G. 1984. Extrusion cooking and dietary fiber: Effects on dietary fiber content and on degradation in the rat intestinal tract. Cereal Chem. 61: 174-179.
Bourdon, I., Yokoyama, W., Davis, P., Hudson, C., Backus, R., Richter, D., Knuckies, B., Schneeman, B. 0. 1999. Postprandial lipid, glucose, insulin, and cholecystokinin responses in men fed barley pasta enriched with P-glucan. Am. J: Clin. Nu&. 6955- 63.
Chimg, B. Y. and Johnson, J- A. 1977. Gelatinization of starch in extmded producîs. CereaZ Chern. 54(3): 43 6-443 -
Chouvei, H., Chay, P. B., and Cheftel, J- C . 1983. Enzymatic hydrolysis of starch and cereal flours at intermediate moisture contents in contXnuous extrusion reactor. Lebensm. Wiss-u. Technol, 1 6: 346-3 53,
Dais, P. and Perlin, A. S. 1982. High-field C'~NMR spectroscopy of beta-D-glucans, amylopectin, and glucogen. Carbohyd- Res. 1 00: 1 O3 - 1 1 6 .
Du&, C. M. and Cochrane, M. P- 1 996- Formation of the barley grain - morphology, physiology, and biochemistry, in Bariey Chernistry and Technology, A. W. MacGregor and R S . Bhatty, (Ed.), pp. 31-72, Amencan Association of Cereal Chemists, S t . Paul, MN.
Food and Agriculture Organization, 2000 : [http://apps. fao .org/cgi-bidnp h- db.p ~?subset=agrïculture]
Glore, S. R., Van Treeck, D., Knehans, A. W., and Guild, M. 1994. Soluble fiber and senun lipids: A fiterature review. L Am. Diet. Assoc. 94: 425-436.
Goering, K. J., Fritts, D. H., and Eslick, R. F. 1973. A study of starch granule size and distribution in 29 barley varieties. Srarch. 25:297-302.
Gomez, C., Navarro, A., Manzanares, A., Horta, A., and Carbonell, J. V. 1997a. Physical and sîructural properties of barley (1 -31, (1 -4)-beta-D-glucan Part 1. Determination of molecular weight and macromolecular radius by Light scattering. Carbohyd. Polym. 32:7-15.
Gomez, C., Navarro, A., Manzanares, A., Horta, A., and Carbonell, J. V. 1997b. Physical and structural properties of barfey (1 -31, (1 -4)-beta-D-glucan Part II. Viscosity, chain s t f i e s s and macromolecular dimensions. Carbohyd. Polym. 3 2: 1 7-22.
Gornez, C., Navarro, A, Manzanares, A, Horta, A., and Carbonell, J. V. 1997c. Physical and structural properties of barley (1-31, (14)-beta-D-glucan Part ILI. Formation of aggregates and analysed tbrough its viscoelastic and flow behaviour. Carbohyd. Polym. 32:141-148.
Hakkarainen, R V. J., Tyopponen, J. T., Hassan, S., Bengtsson, G., Lennart, J. S. EL and Lindberg, P. 0. 1984. Biopotency of vitamin E in barley. Br. JNutr. 52:335-349.
Hakulin, S., Linko, Y. Y., Linko, P., Seiler, K.., and Seibel, W. 1983. Enzymatic conversion of starch in twin-screw HTST-extruder. Starch, 3 5: 4 1 1-41 4.
Harper, J. M. 1989. Food extrudes and their applications, in Extmsion Cooking, C. Mercier, P. Linko and J. M. Harper, (Ed.), pp. 1 -1 5, Amencan Association of Cereal Chemists, St. Paul, MN.
Hawysh, 2. 1997. Barley food products intervention trial for non-insulin-dependent W D M ) diabetic subjects. The Alberta Agricultural Research Institute, Edmonton, Alberta.
Jadhav, S. J., Lutz, S. E., Ghorpade, V. M. and Saiunkhe, D. K. 1998. Barley: Chemistry and value -added processing. Crit, Rev. Food Sei. 3 8: 123-1 7 1.
Kahlon, T- S., Edwards, R. K., and Chow, F. 1. 1998. Effect of extrusion on hypocholesterolemic properties of rice, oat, corn and wheat bran die& in hamsters. Cereal Chem. 75(6): 897-903.
Klopfenstein, C. F. 1988. The role of cereal beta-glucans in nutrition and health. Cereal Foods World. 3 3 : 865-869.
Klopfenstein, C . F . and Koseney, R. C. 1987. CholesteroI-Iowing efTect of beîa-glucan- enriched bread. Nutr. Rep. Int., 36: 109 1-1 098.
Leonard, W. H. and Martin, J. K. 1963. Barley, in Cereal Crops, pp. 478-543, The Macmillan Company, New York.
Linko, P. 1989. Extrusion cooking and bioconversions, in Extrusion Cooking, C. Mercier, P. Linko and J. M. Harper, (Ed.), pp. 235-245, American Association of Cereal Chemists, St- Paul, MN.
Linko, f ., Colonna, P., and Mercier, C . 1981. High temperature short-the extrusion cooking, in Ahances in Cereal Science und Technology, Y. Pomeranz, (Ed.), vol. 4, pp. 145-235, American Association of Cereal Chemists, St, Paul, MN.
Linko, P., Hakulin, S., and Linko, Y. Y. 1983a. Extrusion cooking of barley starch for the production of glucose symp ethanol. J . Cereal Sci. 1: 275-284.
Linko, P., Linko, Y. Y ., and Olkku, J. 1983 b. Extrusion cooking and bioconversions. J. Food Eng. 2: 243-257.
Lupton, J. R., Morin, J. L., and Robinson, M. C. 1993. Barley bran flour accelerates gastrointestinal transit tirne. J. Am. Diet- Assoc, 93 : 88 1-885.
MacGregor, S. 1998. Composition of barley related to food uses. Presented at International Food Barley Program, Canadian hternational Grains Instihite in Winnipeg, Manitoba, Canada. October 19 to 22.
MacGregor A. W. and Fincher, G. B. 1996. Carbohydrates of the barley grain, in Barley Chemistry and Technology, A. W. MacGregor and R. S. Bhaîty, (Ed.), pp. 73-130, American Association of Cereal Chemists, St Paul, MN.
Marconi, E., Grazïano, M., and Cubadda, R. 2000. Composition and utilization of barley pearling by-products for making functional pastas nch in dietary fiber and B-glucans. Cereal Chern- 77(2): 133-139,
Martinez, V. M., Newman, R. K., and Newman, C . W. 1992. Barley diets with different fat sources have hypocholesterolernic effects in chicks. J. Nutr- 122: 1070-1076.
Matz, S. 1991. The Chemistty & Technotogy of Cereals os Food and Feed. 2* ed, pp. 135-136, Van Nostrand Reinhold/AVI, New York, NY-
McIntosb, G. K., Jorgensen, L., Royle, P. 1993. The potential of an insolubIe dietary fiber-rich source from barley to protect fkom DMH-induced intestinal tumors in rats. Nutr. Cancer. 19: 213-221.
McIntosh, G. H., Le-Leu, R. K., Royle, P. J., Young, G. P. 1996. A comparative study of the influence of d i f f e ~ g barley brans on DMH-induced intestinal turnors in male Sprague-Dawley rats. J. Gastronenter Hepatol. 1 1 : 1 1 3- 1 19.
McIntosh, G. H. and Russell, G- R. 1988. The role of barley in human nutrition, in A l t e d i v e End Uses of Barky, D. H. B. Sparrow, R. C. M. Lance and R- J. Henry, (Ed.), pp. 49-54, Royal Australian Chemical Institute, Parkvilte.
Momson, W. R, Tester, R. F., Snape, C. E., Law, R., and Gidley, M* J. 1993. Swelling and geiatinization of cereal starches. IV. Some effects of lipid-complexed amylose and fiee amylose in waxy and normal barley starches. Cereal Chern. 7O:3 85-39 1.
Newman, R. K., Lewis, S. E., Newman, C , W., Boik, R. J., and Ramage, R. T. 1989- Hypocholesterolemic effect of barIey foods on healthy men. Nuf i Rep. Inr. 39: 749- 759.
Nilan, R. A. and Ulùich, S. E. 1996. Barley: Taxonomy, origin, distribution, production, genetics, and breeding, in Barley Chemistry and Technology, A. W. MacGregor and R. S. Bhatty, (Ed.), pp. 1-29, American Association of Cereal Chemists, S t Paul, MN.
Bsterghd, K., Bjorck, I., and Vainionpi%& J. 1989. Effects of extrusion cooking on starch and dietary fibre in barley. Food Chem. 34: 2 1 5-227.
Pedersen, B., Bach Knudsen, K. E., and Eggum, B. 0. 1989. Nutritive value of cereal products wiîh emphasis on the effect of milling. Wodd Rev. Nurr. Diet. 60: 1-91.
Qureshi, A. A., Burger, W. C., Prentice, N., Bird, H. R., and Sunde, M. L.1980. Regdation of Lipid metabolism in chicken liver by dietary cereals. J. Nutr. 1 1 0: 3 88- 393.
Met, M. C., Thibault, J. F., and Della Valle, G. 1990. Influence of extrusion-cooking on the physico-chernical properties of wheat bran. J Cereal Sci. 1 1 : 249-259.
Reinikainen, P., S u o ~ i , T., OUcku, J., Ma&, Y., and Linko, P. 1986. Extrusion cooking in enzymatic liquefaction of wheat starch. Starch. 38: 20-26.
Roussel, L., Vieille, A., Billet, I., and Cheftel, J. C - 1991. Sequential heat gelatinization and enqmatic hydrolysis of corn starch in an extrusion reactor optimization for a maximum dextrose equivdent- Lebensm. Wiss-u TechnoL 24: 449-458.
Shinnick, F. L., Longacre, M. J., lnk, S. L., and Marlett, J. A. 1988. Oat fiber: Composition versus physiological function in rats. J. Nutr- 1 1 8: 144-1 5 1 .
Siijestrom, M., Westerlunds, E,, Bjôrck, I., Holm, J., Asp, N. G., and Theander, 0. 1986. The effects of various thermal processes on dietary fibre and starch content of whoIe grain wheat and white flour. J- Cereal Sci. 4: 3 15-323.
Theander, 0, and Westerlund, E. 1987. Studies on chernical modifications in heat- processed starch and wheat flow. Starch. 39: 88-93-
Tom% R. B. and Cwtis, D. J. 1986. Dietary fiberr Effect on mineral availability. Food Techol, 40(2): 1 1 1 - 1 1 6 ,
Tsao, G. T., Zheng, Y., Lu, J., Gong, C . S. 1997. Adsorption of heavy metal ions by immobilized phytic acid. Appl. Biochem. Biotechnol. 63-65 :73 1 -741.
Vasanthan, T. and Bhaîty, R S. 1995. Starch purification after pin-mihg and air- classification of waxy,waxy, normal and high amylose barleys. Cereal Chem. 72:3 79-3 84.
Wang, L., Newman, R. K, Newman, C . W., and Hofer, P. J. 1992. Barley (3-glucans alter intestinal viscosity and reduce p Iasma cho lester01 concentrations in clicks. J. Nutr- 122: 2292-2287.
Wang, W. M. and Klopfenstein, C. F. 1993. Effect of twin-screw extrusion on the nuiritional quality of wheat, barley, and oats. Cereal Chem. 70(6): 7 12-7 15.
Wang, L., Newman, R. K, Newman, C. W., Jackson, L. L., and Hofer, P. J. 1993a Tocotrienol and fàtty acid composition of barley oil and their eEects on Lipid metabolism. Plant Foods Hum. Nup. 43: 9-1 7.
Wang, W. M., Klopfenstein, C. F., and Ponte, J. G., Jr. 1993b. Effects of twin-screw extrusion on the physical properties of dietary fiber and other components of whole wheat and wheat bran and on the baking qualïty of the wheat bran Cereal Chem. 70(6): 707-71 1.
Woodward, J, R, Ficher, G. B. and Stone, B. k 1983. Water-soIuble (1-3), (1-4)-P-D- gIucans h m bar1ey (hordeum vdgare) endosperm. II. Fine structure. Carbohyd- PoCym. 3 :207-225-
Woodward, .J. R, Phillips, D. R. and Ficher, G- B- 1988. Water-soluble (1 -3), (1 -4)-P-D- glucans fiom barley (hordeum &gare) endosperm. IV- Cornparison of 40°C and 65°C soluble hctions. Carbohyd Polym. 8:85-97.
Yokoyama, W. H., Hudson, C . A., Knuckles, B. E., Chiy M. M., Sayre, R N., Turdund, J. R, Schneeman, B. 0. 1997. Effect ofbarley P-glucans in dunun wheat pasta on hurnan glycemic response. Cereal Chern. 74: 293 -296.
Yoon, S. H., BergIund, P. T. and Fastnaughî, C. E. 1995. Evaluation of selected barley cultivars and their fÎactions fùr P-gIucan e ~ c h r n e n t and viscosity. Cereal Chern. 72: 1 87- 190.
Chapter 3
Pearling of Hull-less Barley: Pmdoct Composition and Gel-color of Pearted Barley
Flours as Affected by the Degree of pearlingl
3.1 Introduction
k h g , an important prïmary processing in food-barley u t h t i o n , refers to the
gradua1 removal of grain tissues @y abrasive action) starting fkom the outer grain
tissuesRayers, bran (i-e-, pericarp, testa, aleurone and subaleurone layers), and g e m The
removal of barIey bran through pearling yields a bnght white kemel that is ideal for various
food applications. The removed grain layers are cded pearling flour (PF) and the remainder is
c d e d pearled grain (PG). The PF is usudy sold as animal feed. Nevextheless, its use for
producing vario us innovative food products such as high fiber (P - glucan nch) hctional pasta
has been studied (Marconi et al., 2000).
In barley, the starch and most of the storage proteins are generaliy confined to the
endospem ceh, but several other storage and functional proteins (Le., enzymes) exist in
aleurone, sub-aleurone and germ tissues. The P-glucan is present mostly in the cell walls of
endosperm, but small amounts exist in the cell walls of aleurone and sub-aleurone layers. P-
Glucan in barley is more evenly distributed than in oat, where it is predominantly found in the
sub-aleurone layers.
The type of component distribution pattern ( d o m or gradient) in barley grah
would iduence the composition and functionality of the pearling products. Zheng et al-
(2000) reported that the distribution of B-glucan withi. the grain of huli-les barley varies
depending upon the varïety. Gohl et al. (1977 and 1978) studied the distribution of
' A version of this study has b e n subrnitted for publication in Journal of Agricultural and Food Chernishy.
47
carbohydrates in barley grains harvested at early and late stages of rnahinty and reported
that xylose, fnictose and glucitol were found mostly in the outer layers. Trace arnount of
myoinositol was detected in al1 abrasive milling hctions. Sucrose was found in all
abrasive milling fractions except in the bran. Stachyose and raffinose were concentrated in
the center of the kemel. GIucose was found in alI layers in increasing amounts towards the
center of the kernei. The authors (Gohl et a[., 1977 and 1978) further reported that protein
was concentrated in the intermediate iayers for early harvested barley grains and in 15-
45% abrasion for Iate stage of rnatunty Ash was found in the outer Iayers ofkernel. Also,
the lipid content of PF reached its highest concentrations in 10-25% and 15% of the
abraded barley grains in early harvested and Iate harvested, respectively. Klamczynski et
al. (1998) reported a significant increase in starch and total P-glucan contents in PG with
progressive pearling. Bhatty (1 997) demonstrated that the PF obtained by 30% pearling of
barley grain constitutes the bran (perkap, testa, aleurone and sub-aleurone layers). Most of
the lipids, protein and minerals (ash) are concentrated in the g e m and bran. Bhatty and
Rosçnagel(1998) cornpared Canadian and Japanese barleys and reported that pearling to
55% decreased P-glucan, total die- fiber, ash, and protein contents, but increased starch
and soluble fiber contents. Klamczynski et al. (1998) reported that substantial amounts of
barIey grain protein and minerals (ah) are concentrated in PF.
Barley lipids contain relatively high amounts of unsaturated fatty acids, oleic (1 8: 1)
and linoleic (1 8:2) acids (Morrison, 1993), which are highly prone to autooxidation end
subsequent rancid odor development Therefore, the storage stability and overall qualiw of
pearled barley will be improved by rernoving the outer layers of the grain. Another
important benefit of pearling is the removal of a variety of barley phenolic compounds and
48
enzymes, such as polyphenoloxidase and peroxidase, aIong with the outer grain layers.
This virtually eliminates the enzyme driven darkening of barley products. However, in
terms of nutritional quality of pearled barley, the loss of tocols (vitamin E, a fat soluble
component), protein, and valuable minerals along with the bran and germ is a negative
effect brought about by pearling. Research showed that 20% PF contains high amounts of
total tocols, a-tocopherol and a-tocotrienol (Wang et al,, 1993; Peterson, 1994)- It is
clear fiorn the iiteratures that there is a need to study the effect of pearling on flour gel
color and also to study the grain components in the particular barley vzrïeties in this study.
The objectives of the present study are: a) to determine the distribution of major
components (Le. starch, protein, lipid, 9-glucan and ash) in waxy (CDC-Candle) and a
regular (Phoenix) hulf-less barley grains by a gradua1 layer-by-layer pearling of up to 80%
(w/w) of the grain tissues and compositional analysis of pearling products namely PG and
PF, and b) to study the effect of V ~ ~ O U S degrees of grain pearling on the color
characteristics of uncooked and cooked (gel) fiour milled fiorn PG-
3.2 Materials and Methods
Materials
Waxy barley grains (CDC-Candle) were provided by Mr. Jim Gray, Agricore,
Calgary, AB. Regular barley grains (Phoenix) were obtained fiom Nakonechney Farnily
Farms, Millet, AB- The analyticd kits for starch and P-glucan determination were
purchased fiom Megayme International Ireland Ltd., Wicklow, Ireland. Other chernicals
were obtained fiom Sigma Chernical Co., St, Louis, Missouri, USA.
49
Pearling and Milling
Barley grains were pearied at the University of Saskatchewan (Saskatoon, SK)
using a "Satake" testing mi11 (model-TMOS, Satake, Tobo, Japan) (fitted with an abrasive
rolIer and 1 mm screen), Grains (200 g) were pearled to varying degrees (10-80%, wet
basis) (pearling time ranged fiom 13-56 min)- At each degree of pearling, the PF and PG
were collected. The PG were ground to flour in a Udy mil1 (OS mm screen).
Compositional Analysis
The protein, Iipid, and ash contents of sarnples were determined according to the
AOAC (1990) methods 979-09,920.39, and 923.03, respectively.
Gel Preparation
Ten grams of flour (milled fkom PG) were mixed with 100 m1 of water and then
heated for 30 min in a water bath set at 96-100° C . The resulting paste was transferred
into a Petri dish and stored for 1 and 72 h, at 4OC for it to set into a gel.
Color Measuremen ts
A HunterLab Color Difference meter (mode1 D52-2, Hunter Assoc. Laboratory,
Fairfax, Virginia) was used to measure the Hunter L, a and b values ofthe f lous and gels.
Statistical Analysis
All experiments were carried out in triplicates. Analysis of variance of the results
was performed using General Linear Mode1 procedure of SAS Statistical Software,
Version 6 (SAS Institute, 1989). Multiple cornparison of the means was performed by
Ieast significant difference (LSD) test at a=0.05 level.
3.3 Resuits and Discussion
The compositions of whole bariey grain and pearling products namely, PG and PF are
given in Table 3.1, Table 3 -2 and Figure 3.1.
3-3.2 W4ole Grain
The starch content of regular (Phoenix) barley (63.62%, wh) was -5% higher t han
that of waxy (CDC-Candie) barley (58.50%, w/w). The P-glucan content of CDC-Candle
barley (5.94%, w/w) was -2% higher than that of Phoenix (3.83%, w/w). The dserences in
the contents of protein, fat, and ash between barley varieties were s m d (ranged fiom O. 1 -
1 -2%).
3.3.2 Pearïed Grah (PG) Composifion
Regardless of the degree of pearling, PG from both Phoenix and CDC-Candle had
high starch contents (-69-8 1 % and -64-79% for Phoenix and CDC-CandIe, respectively)
compareci to the relatively lower starch contents in the correspondhg whole grains ( 4 4 and
-58% for Phoenix and CDC-Candie, respectively; Table 3.1 and Figure 3. la). The starch
content in PG fkom both varieties increased rapidly as the degree of pearling increased fiom
10 to 25% and gradually reached a plateau thereafter. This suggests that the tissue layers
stxipped uiitially due to pearling were cornposed d y of non-starch materials and that starch
is confïned to the h e r cure of the grains. Furthemore, as the degree of pearhg increases, a
gradua1 decrease in the protein reserves of the grains was evident for bo th Phoenix and CDC-
Candie (Table 3.1 and Figure 3.1 b). This was indicative of a decreasing concentration
gradient (fiorn outer to inner tissue layers) for proteins across the grain.
The f3-glucan content of pearled Phoenix grains (P-PG) ranged fiom -3 -7 to 4S%,
whereas that of the pearled CDC-Candie graias (C-PG) ranged fiom -6.3 to 7.3% (Table 3.1
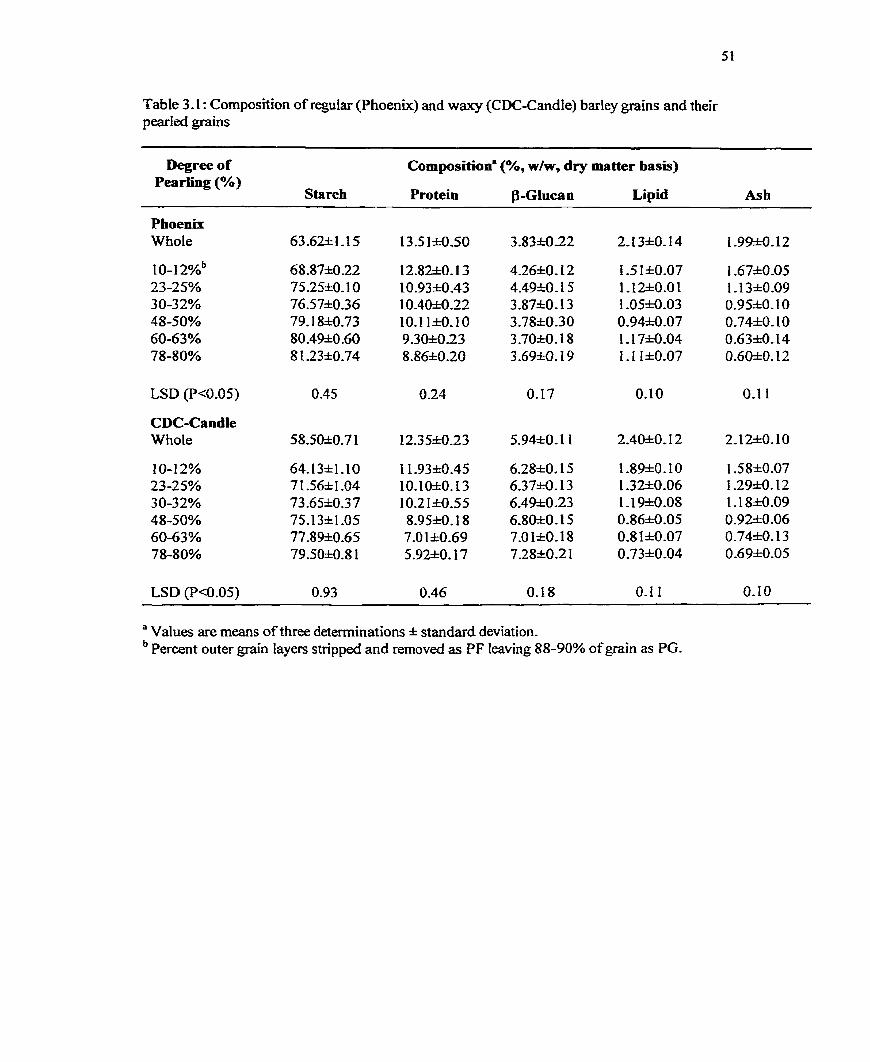
Table 3.1 : Composition of regular (Phoenix) and waxy (CDC-Candle) barley grains and their pearled grains
Degree of Pearling (%)
Starch
Compositiona (%, w/w, dry matter basis)
Protein f3-Gluca n Lipid
Phoenix Whole
LSD (P4.05)
CDC-Caadle Whole
LSD (P<0,05)
" Values are means of three determinations k standard deviation. Percent outer grain layers stripped and removed as PF Ieaving 88-90% of grain as PG.
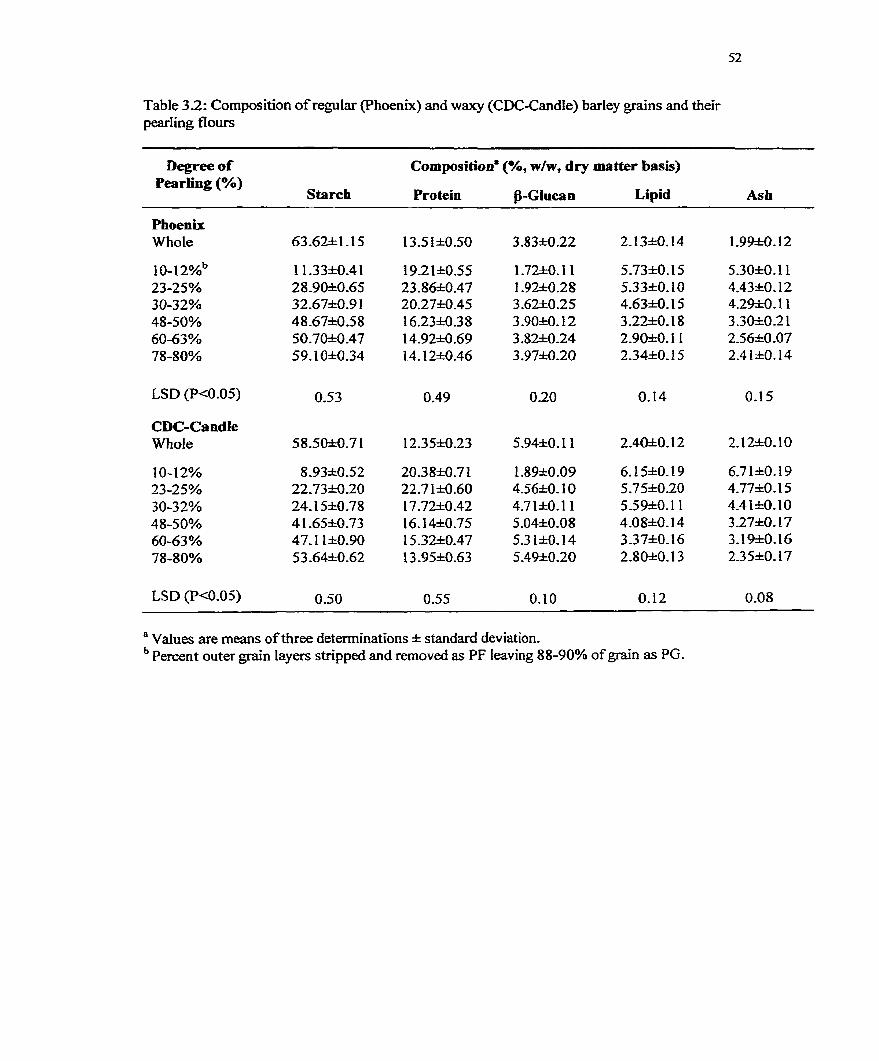
Table 3-2: Composition of regular (Phoenix) and waxy (CDC-Candle) barIey p i n s and their pearting flours
Degree of Composition' (%, w/w, dry matter basis) Pear ling (%)
Starch Pro tein j3-Glucan Lipid Ash
Phoenix Whole
LSD (Pc0.05)
LSD (P4.05)
" Values are means of three determinations * standard deviation. Percent outer grain layen stripped and rernoved as PF leaving 88-90% of grain as PG.
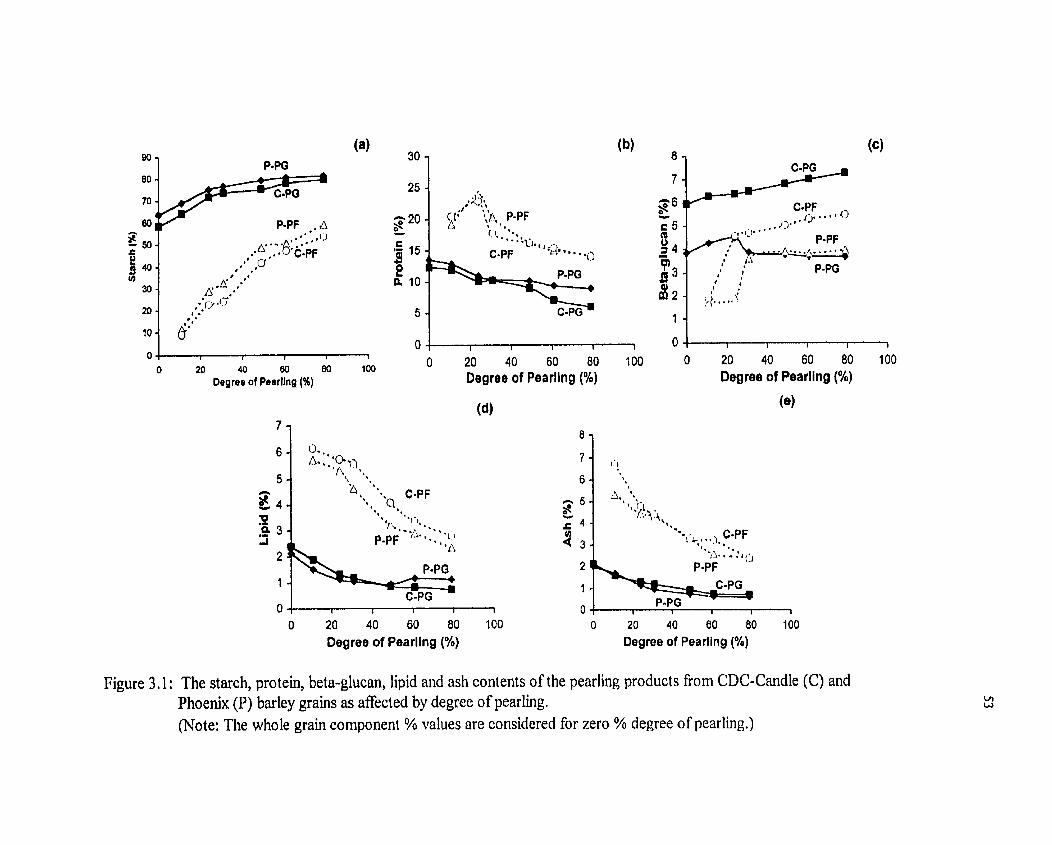
O + I 1 I 1 1
O 20 40 60 80 100 Degree of Paarhg (%)
O 20 40 60 80 100 Degree of Pearllng (%)
O 20 40 60 80 100 Degree of Pearling (%)
O 20 40 60 80 100 Degree of Pearllng (%)
O 20 40 60 80 100 Degree of Pearling (%)
Figure 3.1 : The starch, protein, beta-glucan, lipid and ash contents of the pearling products fiom CDC-Candle (C) and Phoenix (P) barley grains as affected by degree of pearling. (Note: Tlie whole grain component % values are considered for zero % degree of pearling.)
and Figure 3. lc). A sharp increase in the P-glucan content in P-PG up to a 25% of pearling
foilowed by a gradual decrease suggests a concentration of B-glucan in the b e r grain tissue
layers, perhaps immediately beneath the sub-aleurone tissues. In contrast, there was a gradual
increase in the P-glucan content of C-PG, indicating a positive concentration gradient towards
the grain core. Zheng et al. (2000) &O reported a siniilar trend for P-glucan in "low-P-
glucan huil-less barley" (regular starch barleys) and concluded that the bulk of p-glucan was
concentrated in the sub-aleurone layer and the endosperm located imrnediately beneath it. P-
Glucan m ''high-P-glucan hd-less bar1ey" (waxy starch barleys) was reported to be localized
at the b e r endosperm (Zheng et al., 2000).
There were no substantial ciifference between the lipid contents of whole Phoenix and
CDC-Candle grains, This resulted in sunilar lipid contents in PG of both varieties at the same
degree of pearling. For both varieties, a continuous decrease in lipid content of PG as the
degree of pearluig uicreased suggests the existence of a negative concentration gradient
towards the grain core (Table 3-1 and Figure 3,ld). Similar trends were observed for ash
contents of PG fiom both barley varieties (Table 3.1 and Figure 3.1 e). These fkdings are in
agreement with those reported by Surnmer et al. (1985), Bhatty and Rossnagel (1998),
Klamczynski et al. (1998) and Marconi et al. (2000).
3.3.3 Peariing Flow (PF) composition
For both varieties starch and P-glucan contents of PF initially decreased with pearling
of up to 1 0- 1 2% (degree of pearling) and then increased through pearling of up to 78-80%
(Table 3.2, Figure 3.1 a, c). This was due to the confinement of starch and P-glucm in the
inner tissues of barley grain Increase in the starch content of the PF afker 10- 1 2% of pearling
was not graciual (Figure 3.la). The increase occurred at two disthct stages, perhaps due to
the non-uniform distniution of starch in the aleurone Iayer and the endosperm However, the
pattern of increase in P-glucan content (Figure 3 . 1 ~ ) d e r 10-12% of pearIing was found to
be variety dependent- In CDC-Candle, a rapid increase up to 25% pearhg and a gradual
increase t h e r d e r were observed, For Phoenix, a srnall increase existed up to 23% pearling, .
followed by a rapid increase up to 32% and a graduai, but small increase thereafter, This
c k l y indicates a nonuniform distri'bution of P - g l u a across the endosperm and the possible
concentration of P-glucan in the grain layers.
For both barleys, the protein content of PF (Figure 3.1 b) initSy increased up to 25%
of pearling and decreased thereafter, suggesting high protein concentration in those layers.
After 25% of pearling, the gradual decrease of protein content of Phoenix PF suggests that
the protein distribution is uniform across the endosperm. Ho wever, in CDC-Candle, a sudden
drop in protein content up to the degree of pearling 32% and a gradud decrease thereafter
was observed. This suggests that the loss of protein dong with the grain layers removed
durulg 25-32% pearling, was minunal.
Both lipid and ash contents of barley PF investigated, increased up to 10-12Y0 pearlnig
and decreased thereafter, suggesting the concentration of these components in the outer layer
mipped by 23-25% pearling. It is noteworthy to indicate the existence of a gradd, but a
two-stage decrease in ash content after 12% pearling.
3.3.4 Cet Color
The gels were prepared fiom PG-fiour of both varieties and photographed after
refiigerated (4OC) storage for 1 h as well as 3 days. However, only the photogmphs for C E -
Candle gels are presented in Figure 3.2 since only a slight difference in the gel color between
barley varieties was observed visually. The color of the gels prepared with whole grain flou
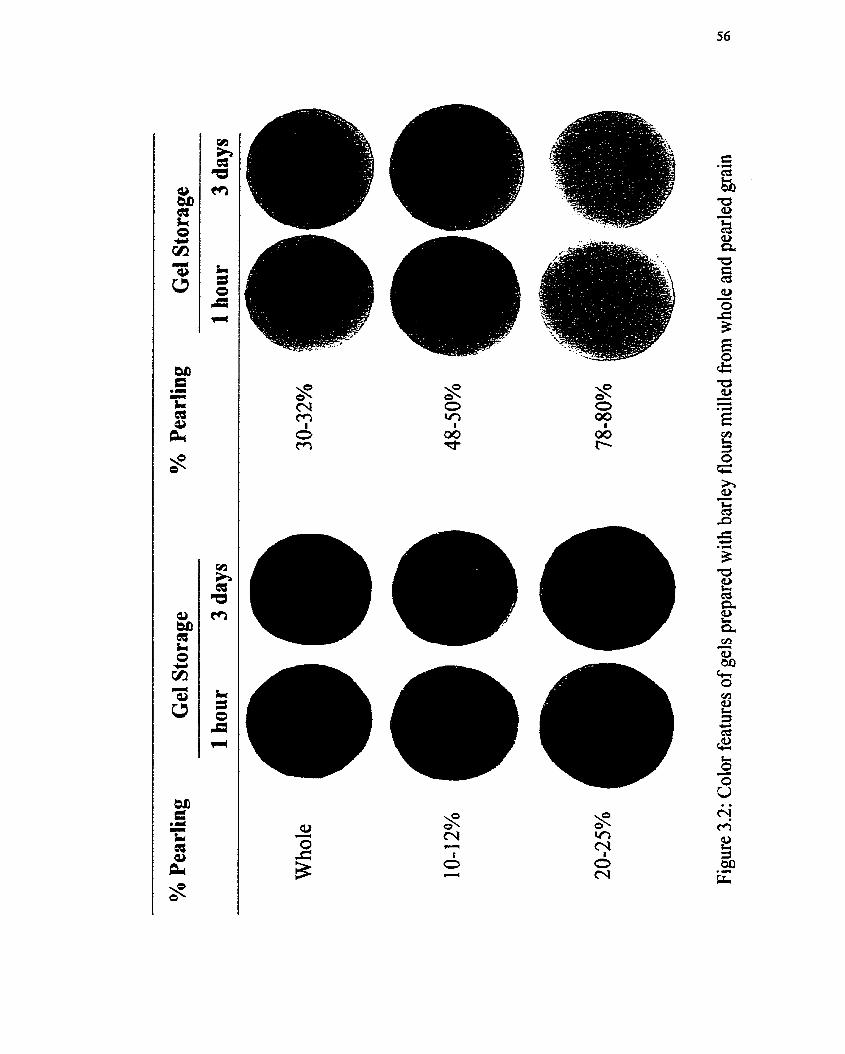
was darker (dark brownhlack) than that of the flour d e d fiom PG. The brightness of the
PG-gels increased as the degree of pearling increased up to 32% and reached a plateau
thereafter. Furthemore, it was evident that the stability of gel color was influenced by degree
of pearling. The intensity of dark brown/black color of the gels prepared Eom whole grain
flour increased during the 3 days storage based on personai subjective evaluation. Similar
trends in the color intensities were o bserved for gels prepared with flou fiom 1 0- 1 2% and
23-25% PG. However, the gel color was observed to be stable at a degree of 30-32%
pearfing and higher.
The color parameters (Hunter L, a and 6) of the fiours and gels are given in Table 3.3.
Hunter L, a and b values of samples represent their brightness, redness and yeliowness,
respectively. The flours f?om both barley varïeties had smaU dzerences in their color values.
For a given variety, PG flours had a higher L and lower a and b vafues than those of the
whole grain flours. Ho wever, there was a substantial dserence between the color of flou and
that of the gel. The L value of flour was higher and the a and b values were lower than those
of corresponding gels. The brightness of the PG gels increased as the degree of pearling
increased, while a srnall change was observed in a and b values. The L value of the gels
prepared with flou fiom whole and PG (10-12% and 23-25%) decreased duMg the 3-day
storage. A very small change in the L value of gels prepared with flou £?om PG, pearled to
30-32% or more, was observed.
3.4 Conclusions
Although the barley grain components, such as starch, protein, P-glucan, Iipids, and
ash, are distriiuted in various tissues (ie., aleurone, germ, and endosperm) of grain, the
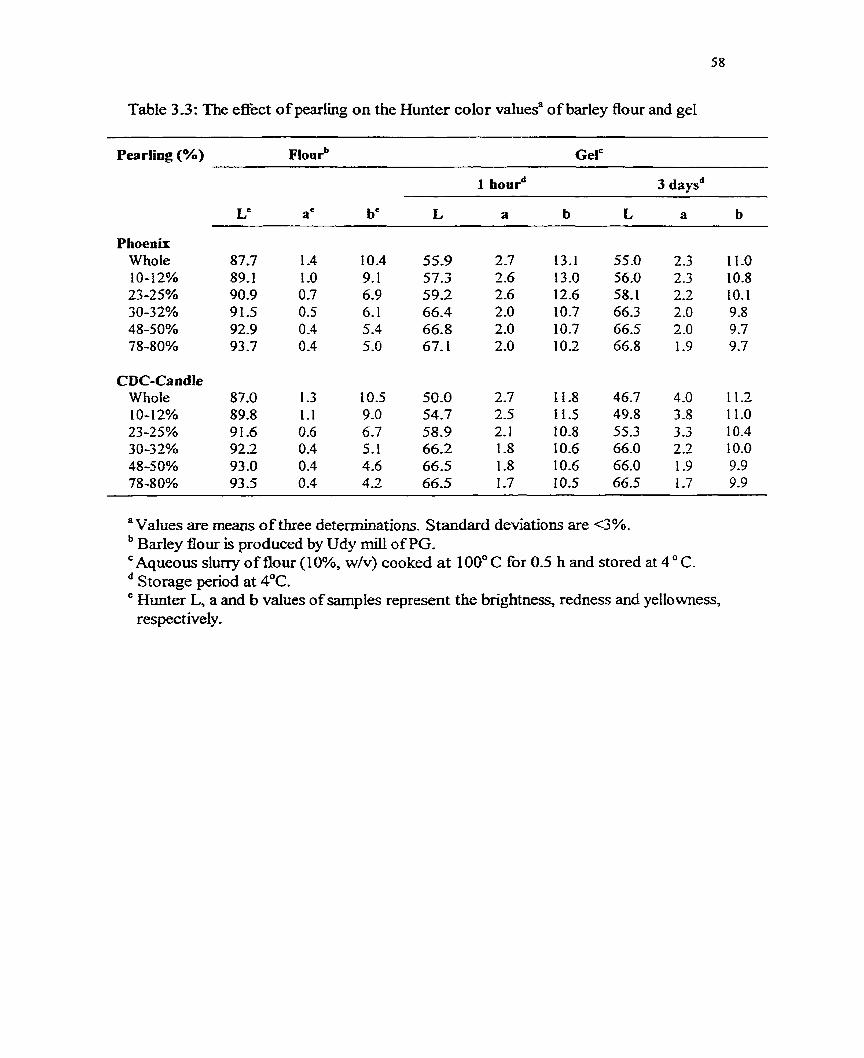
Table 3.3: The effect of pearling on the Hunter color valuesa of barley flour and gel
Pearling (%) ~ l o u r ~ Gelc
Phoenix Who le 10-12% 23-25% 30-32% 48-50% 78-80%
a Values are means of three determinations. Standard deviations are 4%. Barley flour is produced by Udy mil1 of PG. Aqueous slurry of flou (IO%, w/v) cooked at 100° C for 0.5 h and stored at 4' C . Storage peiod at 4OC. Hunter L, a and b vaIues of sarnpies represent the brightness, redness and yellowness, respectively.
patterns of distribution of these components within a tissue dzer widely depending upon the
barley variety. Understanding this pattern of di ibution through a gradual layer-by-layer
grain pearhg process wiii be usehl in strategic selection of flou (PF) characteristics for
industrial pearhg operations This rnay enable the production of barley flours rich in a
particular grain component and &O the optimization of flour fùnctionality for different
foodhdustrial applications. The visual and instrumental evahation of the culor ofbarley flour
gels uidicated that pearling of barley at l es t to a degree of 32% is required to ensure its
bright color and stability in barley-based foods.
3.5 References
AOAC. 1990. Official Methods ofAnaIysis, 15th Ed., (methods 979.09,920.39 and 923.03). Association of Official Analytical C hemists, Washington, D. C.
Bhatty, R. S. 1997. Milling of regular and waxy starch huli-less barleys for the production of bran and flour. Cereal Chem. 74: 693-699.
Bhatty, R S. and Rossnagel, B. G. 1998. Comparkon of pearled and unpearled Canadian and Japanese barleys. Cereal Chem. 7 5 : 1 5 -2 1.
Gohl, B., Larsson, K., Nilsçon, M., Theander, 0. znd Thomke, S. 1977. Distribution of carbohydrates in early harvested barley grain. Cereal Chem. 54: 690-698.
Gohl, B., Niisson, M. and Thomke, S. 1978. Distribution of soluble carbohydrates in barley grain at late stage of rnaturity and relation to viscosity. Cereal Chem. 55 : 341 -347.
Klarnczynski, A., Baik, B. K. and Czuchajowska, 2. 1998. Composition, microstructure, water imbibition, and thermal properties of abraded barley. Cereal Chem. 75: 677-685.
Leonard, W. H. and Martin, J. H. 1963. Barley. In Cered Crops; pp. 478-543, The Macrnilian Company, New York, NY.
Marconi, E., Graziano, M. and Cubadda, R 2000. Composition and utilization of barley pearling by-products for making hinctional pastas rich in dietaitiy fiber and P-glucans. Ce& Chern. 77: 133-139.
Morrïson, W. R 1 993. Cereal starch granule development and composition, in Seed Storage Compounds: Biogmtlhesis, I.eraciions and Manipulation. P . R Shewry and A. K. Stobart, (Ed.), pp. 175-190, Odord Univ- Press, Oxford, UK_
Peterson, D- M. 1994. Barley tocols: Effects of rnilling, making and rnashing. Cereal Chem. 71: 42-44.
SAS Institute Lnc. f 989. SAS/STAT User's Guide, Version 6, Forth Edition Vol- 2, Cary, NC.
Summer, A. K., Gebre-Egziabher, A., Tyler, R T. and Rossnagel B. G. 1885. Composition and properties of pearled and fines fiactions fiom hulled and hull-less barley. Cereal Chem. 62: 112-1 16.
Wang, L., Xue, Q., Newman, R. K. and Newman, C . W. 1 993. Enrichment of tocophero Is, tocotrienols and oil in barley fiactions by milling and pearling. Cereal Chem. 70: 499-50 1.
Zheng, G. H., Rossnagel, B. G., Tyler, R T. and Bhatty, R. S. 2000. Distn'bution of B-glucan in the grain of huii-les barley. Cereal Chem. 77: 140- 144.
Chapter 4
Dextrinization of Starch in Bartey Flours by Thermostable a-Amylase Using a Twin
Screw Extruder as a ~eactor'
4.1 Introduction
Twin screw extmders have been used as reactors for enzymatic liquefaction of
starch, using thermal and mechanical energy, under precisely controlled operating
conditions (Linko et al., 1983a; Linko et al., l983b; Hakulin et al., 1983). The operating
conditions have to be optimized for adequate starch gelatinization and for minimal
enzyme inactivation during extrusion. Pure starch or flour can be hydrolyzed to different
extents to produce a variety of dextrins that vary in their composition, physicochemical
properties and fùnctionality. The "degree of hydrolysis" P H ) is usually expressed in
t ems of dextrose equivalent (DE) of the product. Extrusion dextrinization of pre-
gelatinized starch with thermally stable amylase has been shown to result in the formation
of dextnns with DE of up to 20 (Chouvel et al., 1983). Higher degree of starch hydrolysis
(DE 94-95) can be achieved in an extruder with subsequent saccharification using
glucoamylase (Linko et al., 1983a).
The degree of starch gelathkation and enzyme activity during extrusion are
influenced by rnoisture content, temperature, pH, enzyme concentration, screw speed and
die nozzle size. The minimum moisture Ievel requïred for starch geiatinization is about
3 1%. However, under high temperature and hi& pressure extrusion cooking, starch
gelatinization could occur even at a moisture level of 20% (Linko et al., 1983b; Roussei et
' A version of this study hsts been submitted for publication in Starch.
d., 1991). High and moderate increases in gelatinization have been shown to occur when
moisture levels durhg extrusion are within the range 24-27% and 18-2 1 %, respectively
(Chiang and Johnson, 1977). Roussel and CO-workers (199 1) showed that during extrusion
of corn starch at 150°C and i 00 rpm, water soluble dry solids reached 50% for a water
ccntent of 30%, but only 10% at 40% water. The above authors (Roussel et al., 1991)
postulated that extrusion at a lower water content enhances starch gelatinization because
higher shear stress in the reverse screw elements increases both heat generation and
mechanical disruption of granules. Corn starch samples extnrded with 20% water was
s h o w to display a maximum in vitro digestibility (DE) of 21 -22 at al1 barrel temperatures
and screw speeds (1 50°C/1 75 rprn, 175*C/125 rpm, 200°C/150 rpm). This suggests that
water content during extrusion exerts a predominant effect on the in vitro digestibility of
gelatinized starch. The above authors (Roussel et al,, 1991) also obtained DE of2 1-22 at
3 0% moisture during extrusion. However, starch sarnples extnided at a lower screw speed
(50 rpm) at low temperatures (100 and 125°C) did not display a DE of 21 -22. Several
authors (Davidson et al., 1984; Lawton et al., 1 972; Roussel et al., 199 1) have postulated
that an increase in barrel temperature or screw speed c m compensate for the lower fiction
developed at a higher water content.
Corn starch extruded with a-amylase at pH 5 to 7 was shown to display a
substantial degree of hydrolysis (DE 19-22)- However, samples extruded at pH 3 or 9
showed only marginal hydrolysis (Chouvel et al., 1983). The influence of
enzyme/substrate ratio during liquifaction of corn starch with a-amylase sho wed a linear
response between the extent of hydrolysis and the level of a-amylase. However, solub3ity
of the fieeze-dried extrudates did not increase linearly with enzyme/substrate ratio
(Chouvet et al., 1983). Kigh screw speeds and large die nozzle size were shown to
decrease sbrch gelatinization due to a decrease in residence tïme and to a decrease in
pressure and surface shear, respectively (Chiang and Johnson, 1977)- Roussel and co-
workers (1 991) showed that a high screw speed should be applied for high water content
extrusion and a 1ow screw speed for low water content. The heat generated during
extrusion should be sufficient for gelatinization and then liquifaction, but should not cause
thermal inactivation of a-amylase.
Inactivation of a-amylase at the end of liquifaction is of paramount importance in
order to ensure a specific DE. Thermostable or-amylase has been shown to be readily
inactivated by boiling in 0.2 M acetate buffer at pH 3.5 (Linko et al-? 1983a; Reinikainen
et al., 1986).
Little research has been done on dextrinized barley f lou by extrusion. The
objective of the present study was to investigate the effect of a-amylase concentration (0-
4%, starch dry weight basis), extrusion temperature (90-140°C) and flour-moisture level
(20-50%, flour dry wt basis) on the degree of starch hydrolysis (DH), dextrose equivalent
(DE) and rnono/di/oiigo saccharide composition of dexhinized flours fiom two barley
varïeties phoenix and CDC-Candle). A preliminary study carrïed out in our laboratory
indicated that the use of a-amylase at concentrations greater than 5% imparted an
unacceptable dark brown color to the final product (dextrinized flour). Furthemore, the
efficiency of enzyme action was found to decrease at temperatures below 80 O C (due to a
low energy of activation) and beyond 150 OC (due to enzyme denaturation). ~djustment of
the flour moisture content to leveis greater than 60%, result in a liquid product
(dextrinized flour) that led to handling and processing problems. Thus, due to these
limitations, the study had to be carried out within a narrow window of processing
conditions given above,
4.2 Materials and Methods
Materials
CDC-Candle and Phoenix barley grains were O btained fiorn Agrhre, Calgary, AB
and Nakonechney Farnily Farms, Millet, AB. The grains were pearled to remove 32% of
outer grain layers using a "Satake" pearler (Model-TMOS, SatakeJokyo, Japan). The
pearled grains (68% dry weight) were then pin-milled (Alpine Contraplex wide charnber
mil1 Type A 250, Hosokawa Micron Systems, Sumrnit, N.J) at the POS Pilot Plant
(Saskatoon, SK) to obtain barley flour. Thermostable a-amylase (Terrnamyl 120L, Type
S) Eom B a c i l h lichenifomis was obtained from Novo Nordisk Biochem. North
Amencan Inc. (Franklinton, NC, USA). The optimal conditions for this enzyme was pH 5-
6, 90-100°C and 50-70 mg cazt/kg. Standard solutions of glucose, fintctose, sucrose,
maltose and maltotriose were obtained fÎom Sigma Chemical Co., St. Louis, MO, USA.
Oligosaccharide standards (DP3 to DP7) were obtained fkom Supelco Bellefonte, PA,
USA.
Chernical Composition
Moisture, protein, lipid and ash contents were determined by AOAC methods
(1 997). Total starch, P-glucan, soluble and insoluble dietary fiber content of barley flours
were determined using enzyrnatic assay kits and procedures outlined by Megazyrne
(Megazyme International Ireland Ltd., Wicklow, Ireland)- Amylose content was
determined by the method of Chrastil(1987).
Extrusion Processing
Barley flours were extruded at the Food Processing Development Centre, Alberta
Agriculture, Food and Rural Development (AAFRD), Leduc, AB using a twin screw
extruder (Werner and Pfleiderer ZSK 57W 50P, Stuttgart, Germany). The screw
configuration (Table 4.1) and pasta die were kept constant throughout the processing. The
feed rate, screw speed, and length-to-diameter (Lm) ratio of die nozzle were fixed at
5Qlb/h, 50 rpm and 20: 1, respectively. The barre1 temperature was varied kom 90 to
140°C (90, 100, 120, and 140°C). The extrusion moisture levels were adjusted to 20,35
and 50%. The a-amylase concentration was varied fiorn O%, 2% to 4% (starch dry weight
basis). ARer extrusion, a-amylase activity in the dextrinized samples was inhibited by pH
adjustment (<4.0) and heating to 95-100 O C for 6 minutes. Dextrinized samples were then
kept on a tray at 75OC until dry. The dried samples were ground and screened through 60
mesh Tyler screen (Fisher Scientific Ltd., Nepean, ON).
Dextrose Equivalent (DE)
DE of dextrinized samples was determined using the method of Novo Nodisk
Biochem North Amencan Inc. (Franklinton, NC, USA). DE was calculated by the
fol10 wing equation:
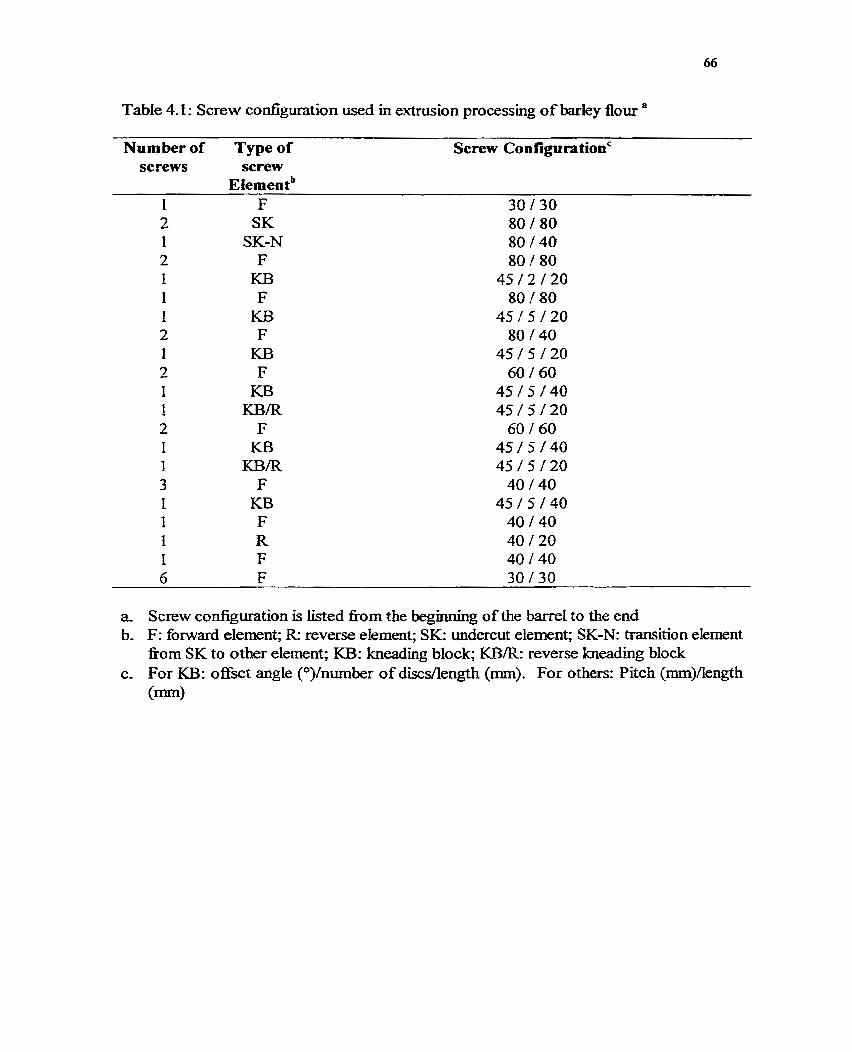
Table 4.1: Screw configuration used in extrusion processing of barley flour
Number of Type of Screw Configurationc screws screw
2 S K 80 / 80 I SK-N 80 / 40 2 F 80 / 80 1 KB 4 5 / 2 / 2 0 1 F 80 / 80 I KB 4 5 / 5 / 2 0 2 F 80 / 40 1 KB 45 / 5 / 20 2 F 60 / 60 1 KB 4 5 / 5 / 4 0 I KB/R 4 5 / 5 / 2 0 2 F 60 / 60 1 KB 4 5 / 5 / 4 0 1 K B R 4 5 / 5 / 2 0 3 F 40 / 40 1 EU3 4 5 / 5 / 4 0 1 F 40 / 40 1 R 40 / 20 1 F 40 / 40 6 F 30 / 30
a. Screw configuration is iisted fiom the begmning of the barre1 to the end b. F: forward element; R: reverse element; SK: undercut element; SK-N: transition element
fiom SK to other element; KB: kneading block; KBR: reverse kneading block c. For KB: o&t angle (O)/number ofdiscsllength (mm). For others: Pitch (mm)Aength
(mm)
T Titre of water blank (ml)
T,: Titre of sample (ml)
Tacx: Titre of standard dextrose solution (ml)
W: Weight of sample (g)
%DS: Percentage of dry solid in sample
Degree of Hydrotysis (DEI)
High Performance Liquid Chromatography (HPLC) Operating Paramefers
DH of dextrinized sample was determined in triplicate by HPLC equipped with a
S himadzu Ezchrom Chromatography data processing system and a Supe lcosil LC-NH2-5
jm column (Supelco, Bellefonte, PA, USA) of 25 cm length and 4.6 mm diameter. Eluent
"A" was distilled water and eluent "B" was acetonitrile. The total run tirne was 40 minutes
for eac h sample. The elution gradient was as follows: 1) A 1 0% and B 90% at the start; 2)
A 35% and B 65% at 35 minutes; and 3) A 10% and B 90% at 3 7 minutes. A flow rate of
1 .O ml/min was rnaintained by a Varian 901 0 Solvent Delivery System (Sunnyvale, CA,
USA). A 500 ELSD (Evaporative Light-Scattering Detector) (Alltech, Mandel Scientific
Co. Ltd., Guelph, ON), which evaporated solvent at 125OC was used for detecting
maltose.
Sample Prepration for HPLC Analpis
Dextrinized sarnple (0.1 g) was extracted with 80% aqueous ethanol ( l .O ml) for
15h at 40°C. The extract was centrifuged at 5000 rpm for 10 minutes. A 50.0 pl aliquot
of the supernatant was injected using a Hewlett Packard Series 1050 autosampler (Hewlett
Packard, Mississauga, ON). Peak identification was achieved by using extemal standard
solutions of hctose, glucose, sucrose, maltose and maltotriose. Ca l ibdon curves were
used to calculate the maltose concentration.
Generally, maltose is one of the main products of a-amylase hydrolysis. Therefore,
DH was calculated by the following equation:
DH = waltose concentration in aliquot (mg/ml) x injection volume (ml) x volume adjustment factor (mvml)] / Weight of sample (mg)
Determination of Oligosaecharide Composition
HPLC Operating Parameten
The oligosaccharide profile of dextrinized samples was determined in tripkate by
HPLC, using a Jordi Gel DVB Polyamine coIurnn (Bellingham, MA) of 250 mm length
and 4.6 mm diameter. Eluent "A" was distilled water and eluent "B" was acetonitrile, The
total run tirne was 30 minutes for each sample. The elution gradient was as follows: 1) A
10% and B 90% at the start; 2) A 40% and B 60% at 25 minutes; 3) A 0% and B 100% at
26 minutes; and 4) A 10% and B 90% at 30 minutes. A flow rate of 1.0 m h i n was
maintained by a Varian 90 10 Solvent Delivery System (Sumyvale, CA, USA).
Sample Prepuraîwn for HPLC Analysk
Dexhinized sample (0.1 g) was extracted with 80% aqueous ethanol(1 .O ml) for
15h at 40°C. The solution was centrifiged at 5000 rpm for 10 minutes. A 10.0 pl aliquot
of the supernatant was used for injection ioto the HPLC. Oligosaccharides were detected
by using 500 ELSD (detector described above), which evaporated solvent at 125°C. Peak
identification was achieved by using external standard solutiom of glucose, maltose,
maltotriose (DP3), maltotetraose (DP4), maltopentaose (DPS), maltohexaose @P6) and
maltoheptaose (DP7). Calibration was perfomed for each oligosaccharide standard.
Statistical Analysis
Al1 expenments were carrïed out in triplicates. Analysis of variance of the results
was perfomed using General Linear Mode1 procedure of SAS Statistical Software,
Version 6 (SAS Institute, 1989). The significance (px0.05) of differences, observed
arnong treatment means, was established using Tukey's Studentized range test.
4.3 Results and Discussion
4.3.1 Flow composition
The proximate composition of native barley flours (Phoenix and CDC-Candle) is
shown in Table 4.2. There were minor differences in protein, lipid and ash contents of
CDC-Candle and Phoenix flours. However, starch, insoluble dietary fiber (IDF), soluble
dietary fiber (SDF) and P-glucan contents were considerably different Compared to CDC-
Candle, Phoenix had a higher starch and IDF, but lower P-glucan and SDF contents.
Furthemore, B-glucan contents of CDC-Candle and Phoenix (6.5 and 3.9%, respectively)
were higher than their SDF content (5.6 and 2.4%, respectively). This suggests that barley
B-glucan consists of water-soluble and water-insoluble hctions.
4.3.2 Dextrinizafion
The degree of hydrolysis (DH) and dextrose equivalent (DE) of dextrinized
barley flours under different combinations of processing conditions are presented in
Table 4.3.
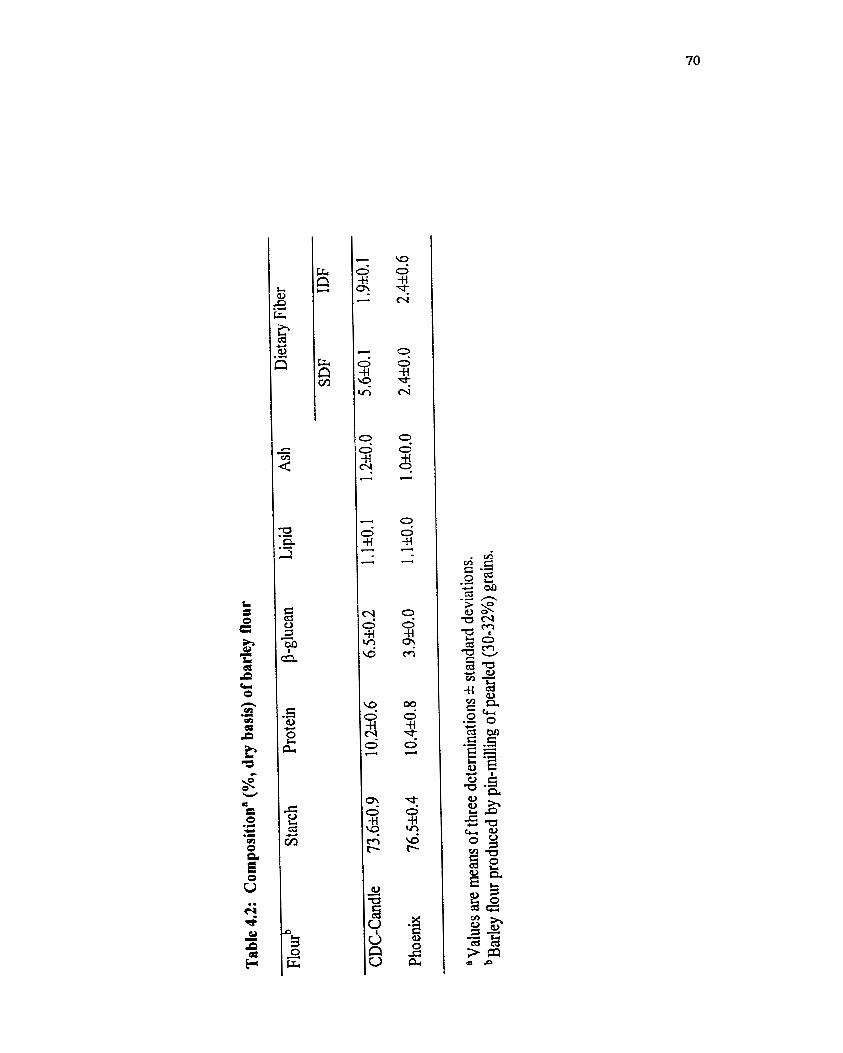
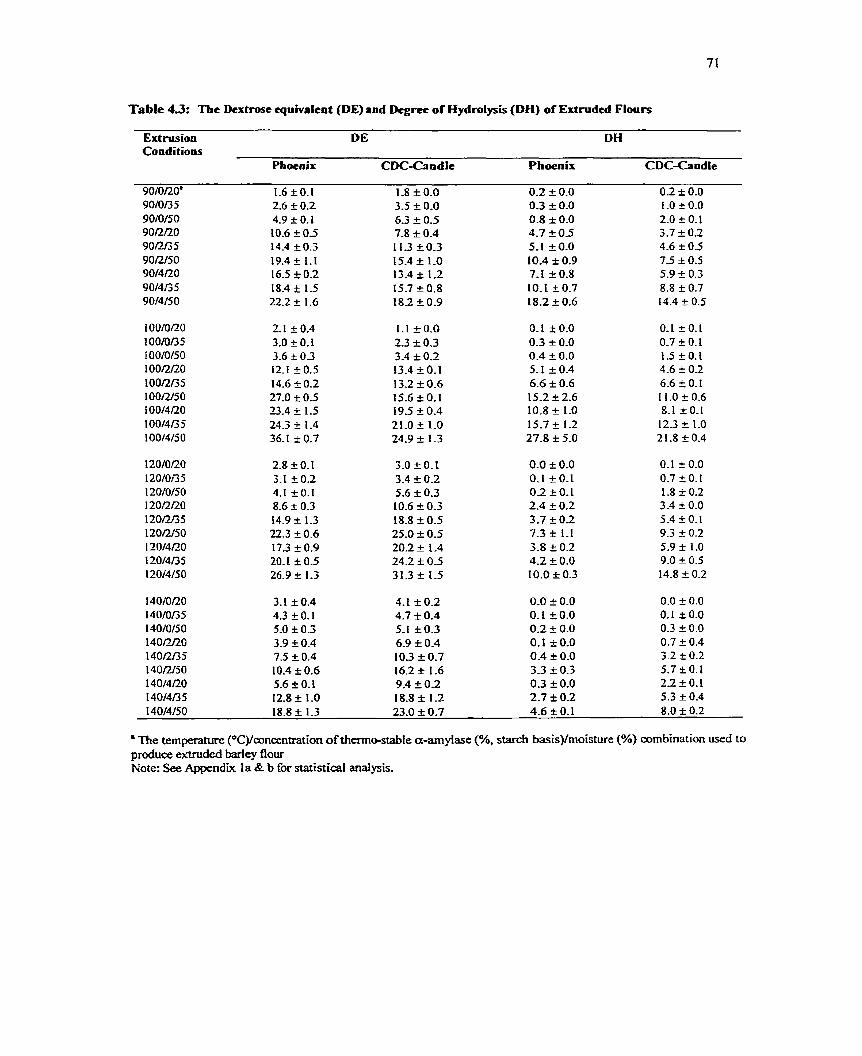
Table 43: The Dextrose cquivalent (DE) and Dcgree of Hydrolpis (DH) of Extraded Flours
Extrusion DE DH Conditions
Phoenix CDC-Candlc Phoenix CDC-CandIe
n e temperature (*C)/mncentration of thermo-stable a-amylase (%, starch basis)/moisture (%) combination used to produce extnided barley flour Note: See Appendix la & b for statistical analysis.
4.3.2.41 Degree of Hydrolysîk (DH)
Maltose was present in trace quantities (<0.005%) in native barley flours.
However, native barley flours (Phoenix and CDC-CandIe) extrusion processed (90°C and
20-50% moisture) without a-amylase addition, showed DH values in the range of 0.2-
0.8% (w/w) and 0-2-2.0% (w/w), respectively (Table 4.3). At each extrusion temperature
(90°C-140"C), DH hcreased with an increase in moisture content (2040%) (Table 4.3).
The decrease in DH values at temperatures exceeding 90°C, reflects inactivation of
endogenous heat liable a- and P-amylase (Table 4.3), which are present, in trace quantitïes
in Phoenix and CDC-Candle barley flours-
At a constant moisture Ievel(20,35,50%) and a-amylase concentration (2 or4%),
the DH increased with an increase in temperature up to 100°C. Thereafter, hydrolysis
decreased in both CDC-Candle and Phoenix barley flours. This suggests that the optimum
temperature for processing is about 100°C. The extent of decrease in DH (>lOO°C) was
higher in Phoenix. The decrease in DH at temperatures exceeding 100°C, suggests
thermaI inactivation of the added a-amylase.
At low extrusion temperatures (90 and 100°C), Phoenix was hydroiyzed to a
greater extent than CDC-Candle. However, the above order was reversed at higher
extrusion temperatures (1 20- 140°C). This reversa1 in hydrolysis could be eqlained on the
basis of differences in P-glucan content and starch swelling power (Table 4.2). Soluble P-
glucan has been shown to have the capacity to form very viscous solutions. Furthemore,
viscosity of barley flou slun-ies have been shown to be influenced by the content of
soluble B-glucan, P-glucanase activity, and rnolecular weight of P-glucan CIzydorczyk et
ai., 2000). Friction between swollen starch granules has also been shown to contribute to
starch viscosity (Hoover and Vasanthan, 1994). This suggests that the viscosity of the
CDC-Candle barley flour sluny could be higher than that of Phoenix. due to its higher e- glucan content and greater starch swelling power due to its low amylose content.
Consequently, the rate of difision of a-amylase to the starch surface of granule would be
greater in Phoenix due to the low viscosity of the flour slurry. This would then explain the
dBerence in DH between CDC-Candie and Phoenix at low extrusion temperatures (Table
4.3). The difference in granular swelling between CDC-Candle and Phoenix would render
starch granules of CDC-Candle more susceptible to shear at high e m s i o n temperatures
Consequently, granule fkgmentation would be more pronounced in CDC-Candle.
Fragmentation would render the starch contents more accessible to a-amylase hydrolysis.
Furthemore, P-glucan hgmentation has also been shown to occur at high extrusion
temperatures (Jiang and Vasanthan, 2000). The impact of p-glucan hgrnentation on the
extent of decrease in viscosity would be more pronounced in CDC-Candle due to its
higher P-glucan content. Thus, both starch granule and P-glucan fragmentation contribute
to the difference in DH between Phoenix and CDC-Candle at 120 and 140°C (Table 4.3).
4.3.2.2 Dextrose EqucUCvalent (DE)
Phoenix and CDC-Candle flours extruded in the absence of a-amylase showed
progressive increases in DE (Table 4.3) with an increase in rnoisture content (20-50%)
and temperature (90-140°C). This reflects an increase in the number of reducing ends,
resulting fiom hgmentation of starch and P-glucan chahs due to mechanical shear. In
the presence of a-amylase and at constant temperature, DE increased with an increase in
moisture content (Table 4.3). At constant moisture content, the maximum and minimum
values of DE were obtained at 1 00°C and 1 40°C, respectively. Starch gelatinization has
been s h o w to increase with an increase in moisture content. Furthemore, gelatinization
increases accessibiiity of glycosidic Linkages to hydro iysis by a-amylase. This would then
explain the higher values of DE at 50% moisture. Partial inactivation of a-amylase at 120
and 140°C may have been the cause of the low DE values at these temperatures.
4.3.3 The mono-, di- and oIigosaccharide composition of dextrinizedflours
The influence of extrusion parameters on relative proportions of DP1 to DP7
oligosaccharides are presented in Table 4-4. At each temperature and enzyme
concentration, the proportion of DPl to DP7 at ail moisture contents (20-50%), followed
the order: DP2>DFd>DP3>DPS>DP7>DP4>DP 1. At each temperature and moisture
content, the proportion of DPl to DP7 increased with enzyme concentration- At each
enzyme concentration and moisture content, an increase in temperature fiom 90 to 100°C
increased the proportion of DP 1 to DP7. However, at 120 and 1 40°C, the proportion of
DP1 to DP7, were much lower than that at 90°C (Table 4.4). At 90 and 100°C, the
predominant oligosaccharide species were DP2, DP6 and DP3, whereas, at 120 and
140°C, these were DP2, DP6, DP5 and DP6, DP3, DP2, respectively. Roussel et al.
(1 991) showed that twin screw extrusion of raw corn starch at a high dry solids content
and at a high thermostable a-amyiase/starch ratio resulted in a hi& proportion of
rnaltoûiose, maltopentaose and maltohexaose (about 20% each) and a srnalier proportion
(about 1 0% each) of maltose, maltotetraose and maltoheptaose. Similar fhdings were
also reporteci by Linko and CO-workers (1980) and Chouvel and CO-workers (1983) on raw
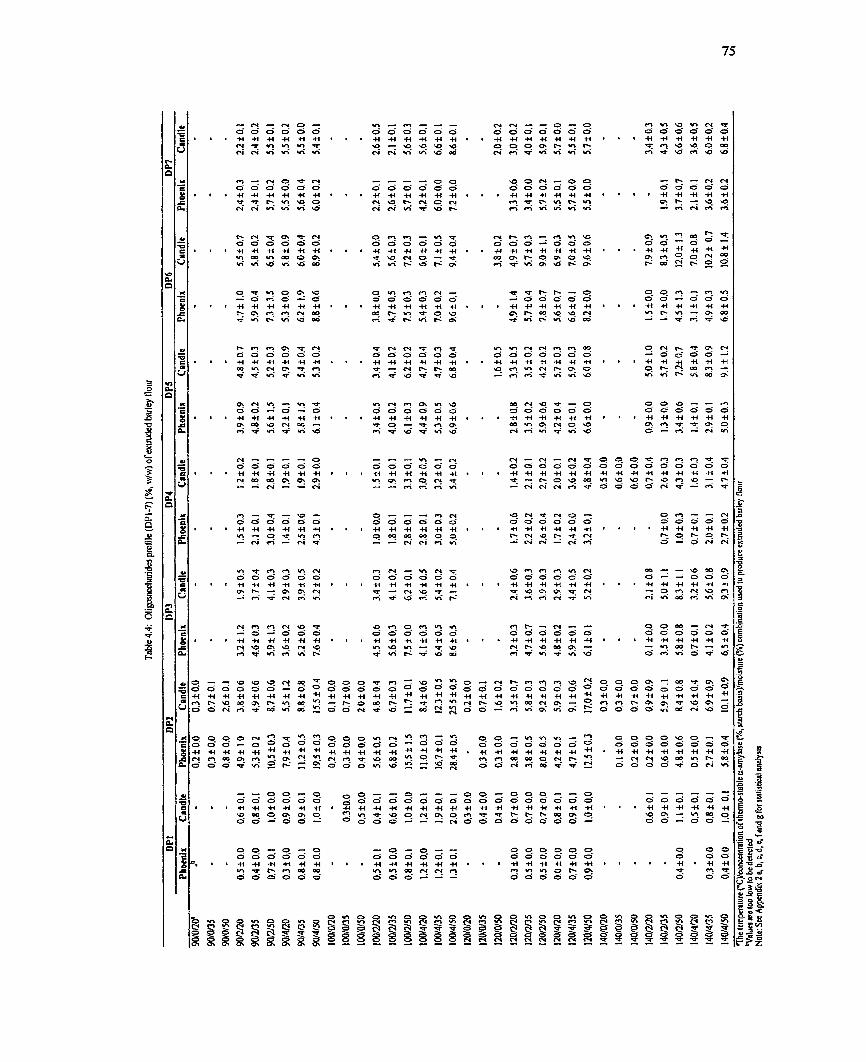
barley starch and pregelatinized corn starch, respectively.
4.4 Conclusions
The semi-dry extrusion dextrinization may be successfuIly used to produce malto-
dextrin fiom barley flour with dBerent dextrose equivalents and composition. The change
in dextrose equivaient can be caused by enzyme hydroIysis or molecular(i.e- 0-glucan and
starch) hgmentation. The residence time can be increased by increasing the extruder
barre1 length, which will in turn increase the DH and DE of the final product.
4.5 References
AOAC. 1997. Officia1 Methods of Analysis (method 925.10). Association of Official Analytical Chemists, Washington, DC.
Chiang, B. Y. and Johnson, J. A. 1977. Gelatinization of starch in extnided products. Cereal Chem. 54(3): 436-443.
Chouvel, H., Chay, P. B., and Cheftel, J. C. 1983. Enzymatic hydrolysis of starch and cereal flours at intermediate moisture contents in contlnuous extrusion reactor. Lebensm. WISs u. Technol. 16: 346-353,
Chrastil, J. 1987. Improved coiorïmetric determination of amylose in starches or flours, Carbohydr. Res. 159: 154-1 58.
Davidson, V. J., Paton, D., Diosady, L. L. and Rubin, L. J., 1984. A mode1 for mechanical degradation of wheat starch in a single-screw extruder. J Food Sci. 49: 1 154-1 1 57.
Hakulin, S., Linko, Y. Y., Linko, P., Seiler, K., and Seibel, W. 2983. Enzymatic conversion of starch in twui-screw HTST-extruder. Starch- 3 5 : 4 1 1-4 14.
Hoover, R and Vasanthan, T. 1994. The flow propeaies of native, heat-moisture treated and annealed starches fiom wheat, oat, potato and lentil. J. FoodBiochern. 18: 67-82.
Izydorczyk, M. S., Storsley, J., Labossiere, O., MacGregor, A- W., and Rossnagel, B. G. 2000. Variation in total and soluble B-glucan content in hullless barley: Effects of thermal, physical, and enzymic treatments. J A S Food Chem. 48: 982-989.
Jiang, G. and Vasanthan, T. 2000. Effect of extrusion cooking o n the p n m q structure and water solubility of P-glucans from regular and waxy barley. Cereal Chem. 77(3): 396-400.
Lawton, B. T., Henderson, G. A, and Derlatka, E. J. 1972- T h e effects of extruder variables on the gelatinisation of corn starch. Cm J. Chern. Eng. 50:168-172.
Linko, P., Hahxlin, S., and Linko, Y. Y. 1983a. Extrusion cooking of barley starch for the production of glucose syrup ethanol. J. Cereal Sci. 1 : 275-284.
Linko: P., Linko, Y- Y., and Olkku, J. I983b- Extrusion cooking and bioconversions. J. Food Eng. 2: 243-257.
Linko, Y. Y., Vuorinen, H., Olkku, J, and Linko, P. 1980, Enzyme Engineering in Food Processing, in Food Process Engineering. P . Linko, and J. Larinkari, (Ed.), pp. 2 1 O- 223, Appfied Sci. Pub., London.
Reinikainen, P., Suortti, T., Olkku, J., Malkki, Y., and Linko, P. 1986. Extrusion cooking in enzyrnatic liquefaction of wheat starch. Starch. 38: 20-26,
Roussel, L., Vieille, A., Billet, I., and Cheftel, J. C . 199 1. Sequential heat gelatinization and e q m a t i c hydrolysis of corn starch in an extnision reactor optimization for a maximum dextrose equivalent, Lebensm, Wiss-u. Technol. 24: 449-458.
SAS Institute Inc. 1989. SAS/STAT User's Guide, Version 6, Forth Edition Vol. 2, C q , NC.
Chapter 5
Dietary Fiber Profile of Bariey Flour as AIfected by Extrusion ~ o o k i n ~ '
5.1 Introduction
Tradit ionally, the non-digestible (resistant to digestiodhydroIysis by the
alimentary enzymes of humans) constituents of plant cell waUs, which wnsist of
polysaccharides (cellulose, hemi-ceilulose, mucilage, oligosaccharides, pectins), lignin
and associated substances, such as waxes, cutin and suberb, have been termed as dietary
£&er (Denies et al., 2999). According to the soiubility in water, to ta1 dietary fiber (TDF)
c m be categorized into two groups, namely soluble (SDF) and insoluble (IDF) dietary
fiber. SDF and D F have ken known to play different physiological roles in human
heaith. The enzymatic-gravimetri methods have k e n commonly employed in the
determination of TDF, SDF and IDF in foods (Caldwell and Nelson, 1999). The present
study uses the procedure dehed by Megszyme International Ireland Ltd., Wicklow,
Ireland to detennine the content of various dietary fiber fiactions in extrusion cooked
bariey flou- This procedure, essentidy, uses the protocols explained in AACC method
32-07 (1995) and AOAC method 991 -43 (1995).
The cell wall or structural polysaccharides of barley endosperm consist primanly
of P-glucan, arabinoxyh and cellulose. The celi walls of barley endospem contain
about 75% 9-glucan and 20% arabinoxyh, whereas the aleurone ceU walls contain 26%
P-glucan and 71% arabhxylan (Jadhav et al., 1998). The minor components are
celiulose, glucomannan, and (1+3)-P-glucan (Jadhav et al., 1998). During the past two
decades, barley fi-glucan has received considerable research attention due to its heahh
' A version of this study has been subrnitted for publication in Cereal ChemrShy-
benefits. Several studies have shown that barley P-glucan has significant b bod
cholesterol lowerïng effects (McIntosh et al., 1991; Martinez et al., 1992). P-Glucan in
barley has aIso been known to increase the viscosity of intestinal fluid and thereby reduce
the rate of sugadstarch absorption (Anderson et al., 19901, which is beneficial in the
management of diabetes (Klopfensteui, 1 988; Pick, 1994; Gosain, 1996).
Extrusion cooking is a popular food processing technique, especially for the
production of fiber-rich products such as breakfast cereals, flat breads, dextrinized or
cooked flour, etc. Due to its high content of TDF and a high proportion of SDF, an
investigation into the use of barley flour in a variety of extruded products is of high
importance from a nutritional point of view. Extrusion conditions, such as temperature,
mo isture and pressure/shear, rnay change the content as welI as the physicochemical and
nutntionaVphysiologica1 properties of barley flour components, including dietary fiber.
Little research has been done towards understanding the impact of extrusion cooking on
the dietary fiber of barley flour. Ostergard et al- (1 989) reported that dietary fiber content
of barley increased upon extrusion cooking, accompanied by a decrease in total starch
content. This is probably due to the formation of indigestible starch fiagments. However,
the increase in SDF did not account for the total decrease in starch. This is probably due
to the newly formed indigestible starch fiagments, which are too srnall to precipitate with
80% ethanol employed in the dietary fiber assay (Ostergard et al., 1989).
The objectives of the present sîudy are to investigate the effect of extrusion
cooking of barley flour (waxy and regular starch types) under different
temperature/mo isture combinat ions on the TDF, IDF, SDF, P-glucan and resistant starch
contents of barley flou. Furthemore, an attempt will be made to rationalize the changes
in various dietary fiber fiactions during extrusion cooküig.
5.2 Materials and Methods
Materials
W a x - barley grains (CDC-Candle) were obtained 6om Agricore, Calgary, AB.
Regular barley grains (Phoenix) were obtained f?om Nakonechney Family Fums, Millet?
AB. The analytical kits for dietary fiber and P-giucan were purchased fiom Megazyme
International Ireland Ltd-, Wicklo w, Ireland-
Pearling and Milling of Barley Grains and Extrusion Processing of Barley
Flou r
Pearling and milling of barley grains were carried out at the POS pilot plant,
Saskatoon, SK. Grains were pearled to 30-32% in a "Satake" d l (Model-TMOS, Satake,
Toyko, Japan). The pearled grains were pin-milled (Alpine Contraplex wide chamber
mil1 Type A 250, Hosokawa Micron Systems, SumMt, NJ) hto flou at 6,000 rpm and a
feed rate of 150 kgh. The flou was extntded in a twin screw extruder (Werner and
Pfleiderer ZSK 57W 50P, Stuttgart, Germany). The barre1 temperatures used in this study
were 90°C, 100°C, 120°C and 140°C, while the moisture contents of 20, 35 and 50%
(w/w, dry basis) were employed. The feed rate, screw speed and LID ratio of die nozzle
were set at 50 lb./hour, 50 rpm and 20: 1, respectively. Extruded samples were dr ied for a
week in a dmfi oven at 7S°C, ground and screened (60 me&). The extruder screw
arrangement was accordmg to an orthogonal design.
Chernical Analysis
The content of TDF, SDF and IDF in the native and extruded barley f lou was
measured by using the Megazyme total dietary fiber analysis kit (Megazyme
International Ireland Ltd, Wicklow, Ireland). The contents of mixed linkage P-glucan in
native and extmded barley flou were determined by using the Megazyme mixed-linkage
P-glucan analysis kit. The resistant starch content was also analyzed according to the
Megazyme procedure that involves a treatment step with dirnethyl sulfoxide (DMSO).
Kjeldhal procedure (AOAC, 1990, method 979.09) was employed to determine the total
nitrogen content of the SDF, IDF and TDF.
The solubility of j3-glucan in the native (at 100°C and 25OC) and extnided flours
(at 2S°C) was deterrnined as follows. Flour (100 mg) was mixed with 10 ml of distilled
water and subjected to continuous shaking for 2 h in a water bath maintained at 1 OO°C or
2SoC, followed by the centrifugation at 10,000 rpm for 5 min. P-Glucan content in a 0.1
ml aliquot of the supernatant was determined. The solubility was calculated as % of the
total P-glucan content in the flour.
Statistical Analysis
Al1 experiments were carrïed out in tripkates. Analysis of variance of the results
was perfomed using General Linear Mode1 procedure of SAS Statistical Software,
Version 6 (SAS Institute, 1989). Multiple cornparison of the means was perfomed by
least significant difference (LSD) test at a=005 level.
82
5.3 Results and Discussion
The proximate composition of native barley flours is shown in Table 5.1. There
were minor dinerences in protein, iipid and ash contents of CDC-Candie and Phoenix
flours, whereas their starch, IDF, SDF and P-glucan contents were considerably difEèrent.
Compared to CDC-Candle, Phoenix had higher starch and IDF but lower P-glucan and
SDF contents. Furthemore, the P-glucan content ofCDC-CandIe and Phoenix (6-5 and
3.9%, respectively) were higher than SDF content (5-6 and 2.4%: respectively). This
suggests that barley f3-glucan containecl water soluble as well as insoluble hctions. The
water solubiIity of P-glucan in the native and extruded flours is given in Table 5.2. The
solubility (detemiined at 100°C) of native P-glucan was 79% for CDC-Candle and 57%
for Phoenix, which suggests that the SDF of native flour might contain a large amount of
P-glucan (91% in CDC-Candle and 93% in Phoenix). The P-glucan in extmded flours
had higher solubility (determined at 25OC) t h that of its native counterparts (Table 5.2),
where at each extrusion temperature, the solubdhy increased with an increase in the
extrusion-moisture level. The solubility daerences between native CDC-Candle a d
Phoenix P-giucans may be attniuted to the vaniety-dependent molecular variations, white
the enhanced solubility of extruded P-glucans may be attributed to the extrusion-induced
rno iecdar alterat ions ( S i and Vasanthan, 2000).
The dietary £%er (DF, SDF and TDF) contents of the native and extruded barley
flours are shown in Table 5.3. In generd, the content of SDF and TDF increased upon
extrusion cooking of both types of barky flours. The changes in the IDF content were
found to be variety dependent. A minor decrease (compared to native flour) in IDF
content of CDC-Candle barley was evident at ail extrusion temperatures (Table 5.3). This
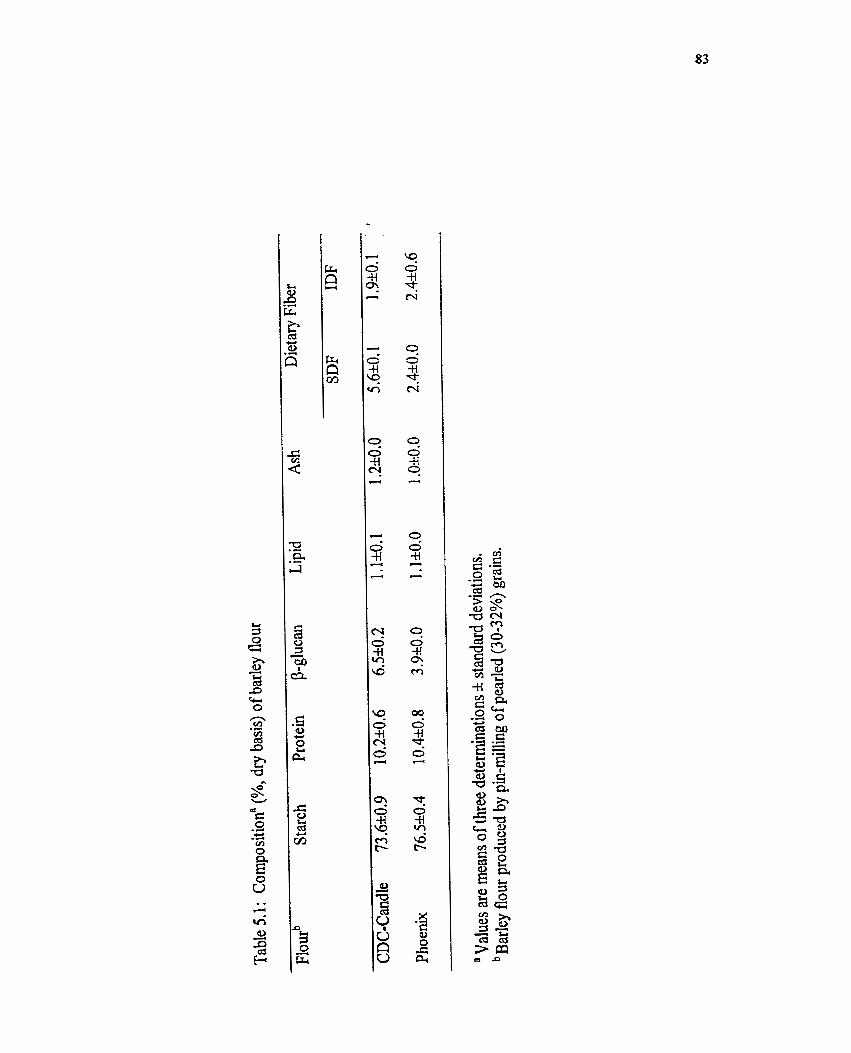
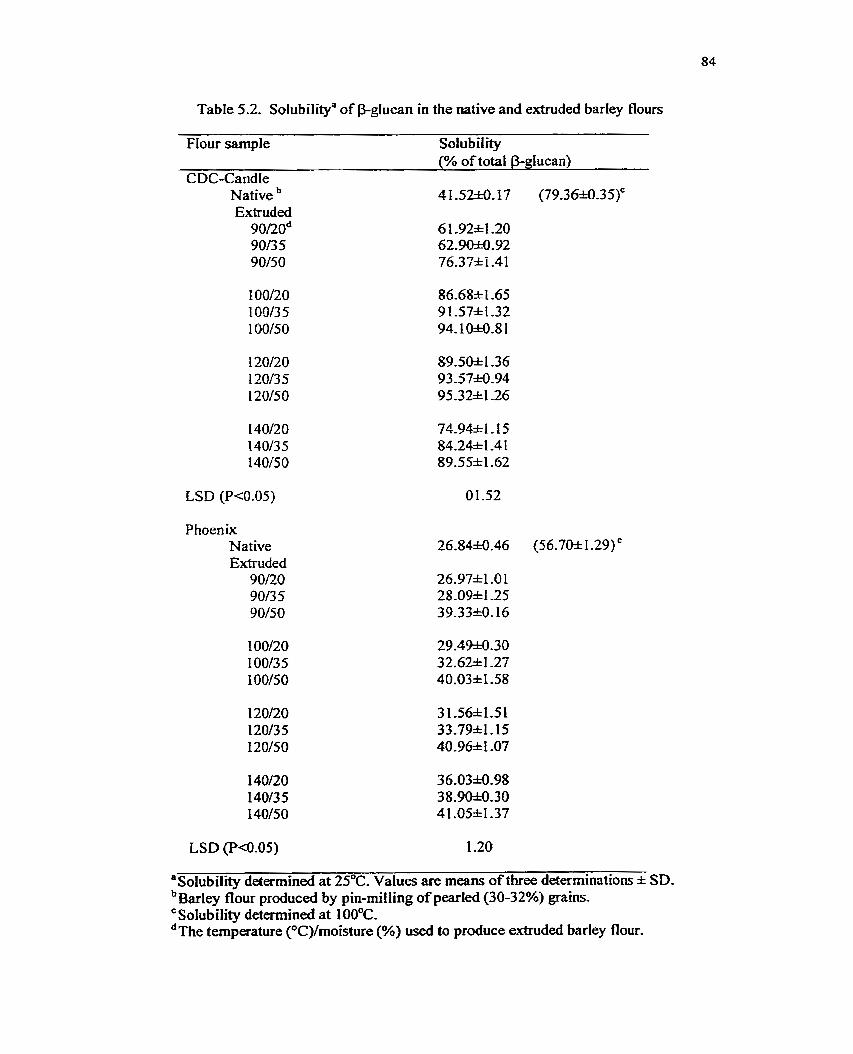
Table 5.2. Solubilitf of Pglucan in the native and extruded barley flours
Fiour sample Solubility (% of total kglucan)
CDC-Candle Native 4 I Sm. 17 (79.36-10-35)' Extruded 90/20d 6 1.9B1,20 9013 5 62.9M-92 90/50 76.37d=i -41
LSD (P<O-05) O 1 .52
Phoenix Native Extruded
90/20 9013 5 90/50
LSD (P<0.05) 1.20
aSolubility detamined at 25°C. Values are means of three determinations * SD. b ~ a r l e y flour produced by pin-rnilling of pearïed (30-32%) grains. c~olubility dekrmined at 100°C. * ~ h e temperature (OC)/moisture (%) used to produce extruded barley flour.
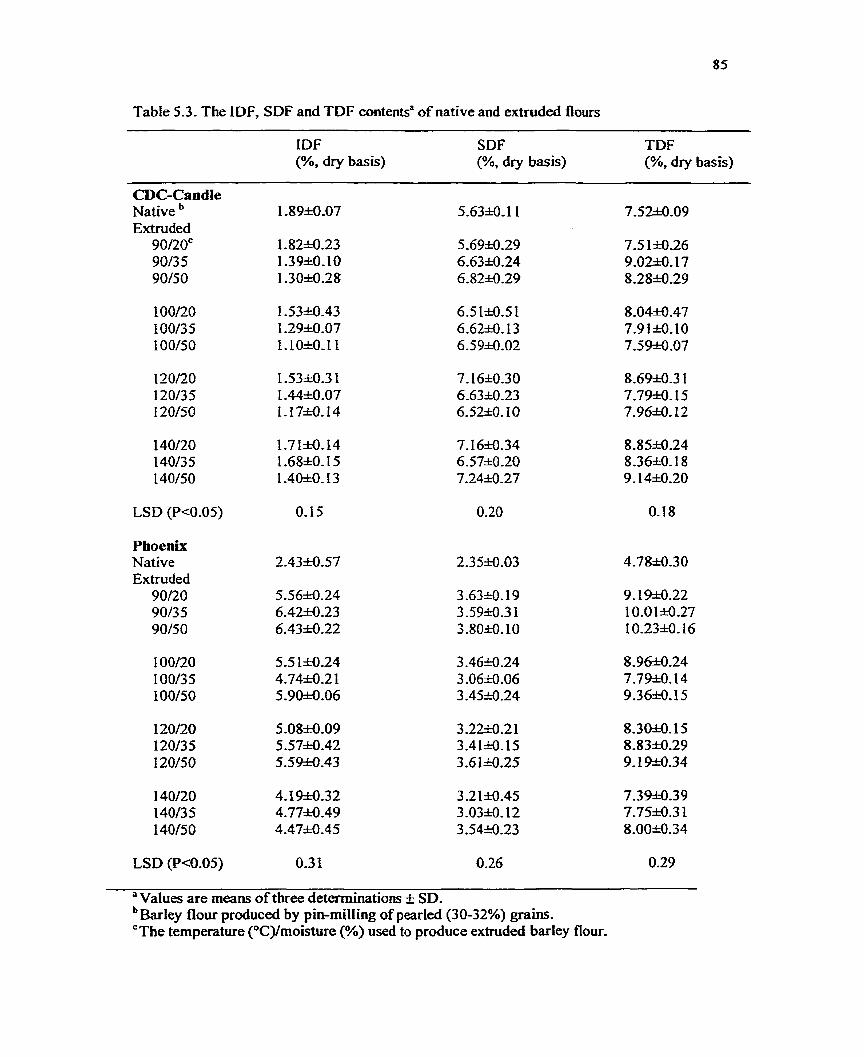
Table 5.3. The IDF, SDF and TDF contents" of native and extruded flours - - ~ - - -- - -
IDF SDF TDF (%, dry basis) (%, dry basis) (%, dry basls)
CDC-CandJe Native Extruded
9O/2Oc 9O/3 5 90/50
100/20 1 OO/X 100/50
120/20 120/35 1 20/50
l4O/ZO l4O/3 5 l4O/SO
LSD (P<0.05)
Phoenix Native Extruded
90120 9O/3 5 90/50
100/20 1 OO/3 5 I OO/5O
120/20 1 2O/3 5 1 2O/5O
140/20 1 4O/3 5 140/50
LSD (P<0.05)
"Values are means of three determinations f SD. b~arley flour produced by pin-rnilling of pearled (30-32%) grains. "The temperature (OC)/moisture (%) used to produce extruded barley flour-
suggests that the increase in TDF of CDC-Candle flou upon extrusion cookuig was
primariIy due to the increase in SDF. This increase in SDF codd be partidy due to the
transformation of some IDF into SDF during extrusion. In a study involvïng white anci
whole-meal wheat flou. Bjorck et al. (1 984) have reported a slight increase in TDF with
a substantial shfi eom D F to SDF ùi the extnided white wheat flour. In the present
study, the % increase in SDF in extrusion cooked CDC-Candle flour was considerably
higher than the decrease observed in IDF (Table 5.3), suggesting the formation of
additional SDF h m non-dietary fiber components (ie. starch) of native flour. Theander
and Westerlund (1 987) reported that highly react ive anhydro-compounds (i.e. 1,6-
anhydrosaccharides) were generated during extrusion cooking and these compounds
would react with starch or hgmented starch through trans-glycosidation reactions to
form new branched glucans, which were resistant to amylase hydrolysis. In the present
study, the formation of ccndigestible glucans" might have contributed to the hcrease in
SDF content of CDC-Candle flour.
Conversely, both IDF and SDF contributed to the increase in TDF content in
exmion cooked Phoenix flour wÏth the contriibution by IDF k ing prominent (Table
5-3). The substantial increase in IDF of the extruded Phoenix fiour was unexpected. A
number of rnechanisms, have k e n suggested to explain the changes in dietary fiber
profile (DF, SDF and TDF) of processed grain ffourç. Fornalm et al. (1987) reported a
decrease in the content of cellulose and Lignin in extnided flours from barley and
buckwheat. The occurrence of resistant starch (RS3, retro graded amylose) in thermaliy
processed grains was reported by Englyst et al. (1983). Englyst and Cummings (1984),
Ranhotra et al. (1989), and Englyst et al. (1992). Englyst et al. (1983, 1984) reported thai
the resistant starch was insoluble in water and had properties s d a r to those of insoluble
dietary nber, but could be solubilized in 2M KOH or dimethyl sulphoxide (DMSO).
Megazyme has developed a method to quant@ RS3 in food sarnples and this
methodoIogy uses the dzerence in starch content before and d e r DMSO treatment to
account for RS3. This protocol was used in this study to quanti@ RS3. Aithough there are
contradictory reports on the presence of RS3 in TDF of extruded wheat f l ou (Bjorck et
al., 1986; Siljestfim et al., 1986), the data given in Table 5-4 suggests that the formation
of RS3 might have been responsibie for the increased content of IDF and TDF in
extruded Phoenix flour- Regardless of the extrusion-rnoisture levels (Le. 20% and 50%)
the RS3 content of extruded Phoenix flou increased up to an extrusion temperature of
120°C and then showed a decrease at 140°C. For ali temperatures employed, the RS3
formation was okrved to be higher at 50% than at 20% moisture level. The RS3 content
of both native and extnided CDC-Candle flour was little.
Forrest and Wainwright (1977) were able tu extract a substance, which had a
covalent association between a nitrogenous material and B-glucan fkom heated (6S°C)
barley endosperm cell walls. The cmde Ntrogen content of the IDF and SDF hctions
(Eom the dietary fiber determination procedure) of native and extruded flour is shown in
Table 5.5. The nitrogen content of both IDF and SDF fkctions iÏom extruded flous was
generally higher than that of native flours. This suggests that the extrusion cookhg has
induced interactions between the nitrogenous compounds (i.e. protein) in barley flou and
fiber. Data presented in Table 5.5 M e r suggest tbat IDF participated more in these
interactions, especially at 1 ûû°C. Ho wever, no de finite correlation was established
between the Ntrogen content of the fiber and extrusion conditions. It should be noted that
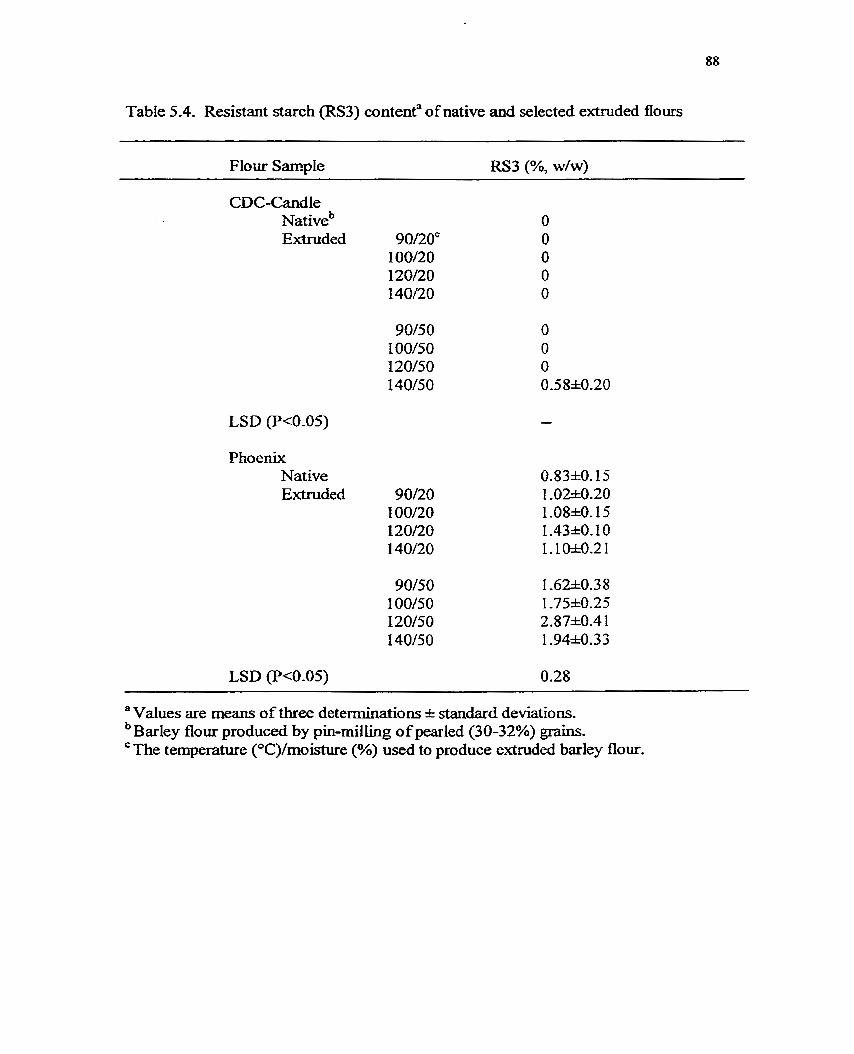
88
Table 5.4. Resistant starch (RS3) contenta of native and selected extnided flours
Flow Sample RS3 (Oh, w/w)
LSD (PeO-05) -
Phoenix Nat ive Extruded 90/20
1 O0120 120/20 140/20
LSD (P4-05) 0.28
" Values are means of three determinations + standard deviations. ~ a r l e ~ flour produced by pin-milhg of pearled (30-32%) grains. The temperature (OC)/moisture (%) m d to produce extruded barley flour.
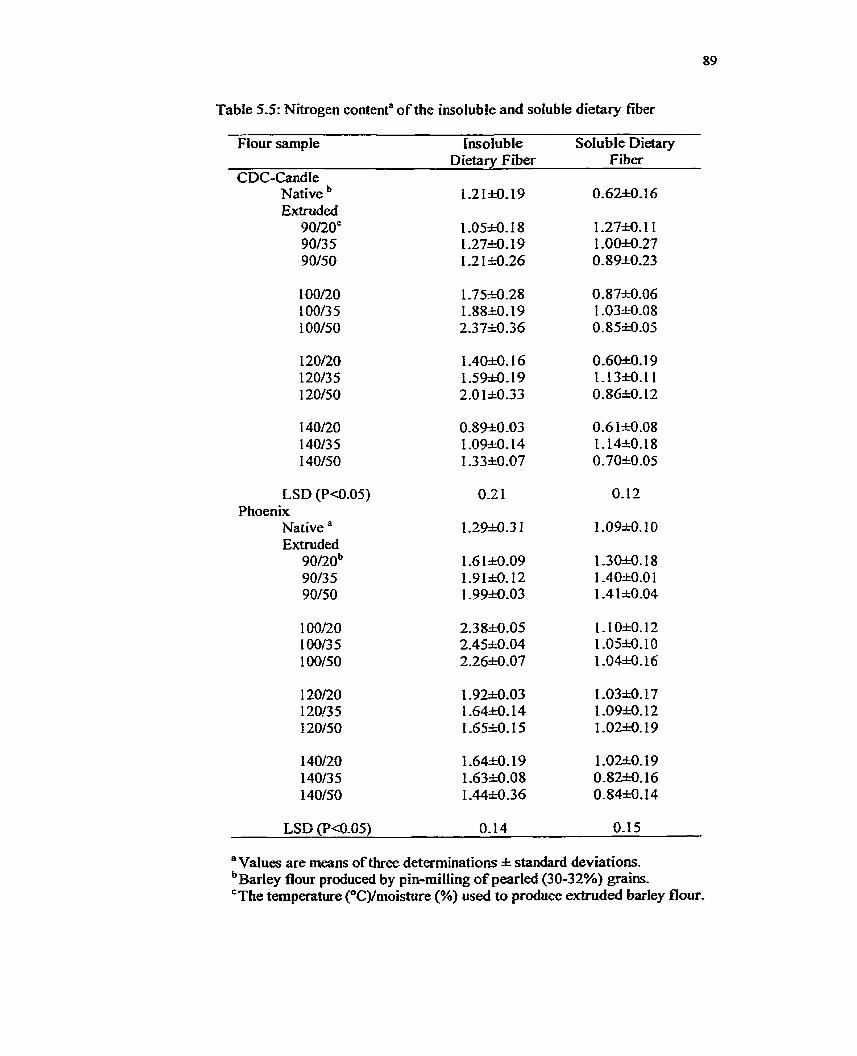
Table 5-5: Nitrogen contenta o f the insoluble and soluble dietary fiber
Flour sample insoluble Soluble Dietary Dietarv Fiber Fiber
CDC-Candle Nat ive Extruded
90120" 9O/3 5 90150
LSD (W0.05) Phoenix
Native " Extruded
90/20b 90/35 90/50
LSD (Pa-05) 0.14 0.15
"Values are means of three determinations 5t standard deviations. b~arley flour produced by pin-milling of pearled (30-32%) grains. 'The temperature ("C)/moistute (%) used to produce exttuded barley flour-
such protein-fiber interactions would no t have contributed to increased dietary fiber
content of the flour (Table 5.3) because appropriate deductions were made for protein
content (calculated fiom the cmde nitrogen content during the quantiiication of IDF and
SDF). However, the fiber-protein complexes present in extruded bariey may resist
digestion by enzymes in the hurnan intestine and p a s on to colon dong with dietary
fiber. The fate of this protein-fiber cornplex m the colon or its benefit to human health is
yet to be detennined.
5.4 Conclusions
Extrusion cooking increased the TDF of barley flours. The TDF increase in waxy-
CDC-Candle barley was aainly due to an increase ùi SDF. For Phoenix, the increase in
both IDF and SDF contributed to the increased TDF content. The change in dietary fiber
profile during extrusion of barley flou may be attributed primarily to a s h i . fiom IDE to
SDF, as weU as the formation of RS3 and ""enzyme resistant indigestible glucans" formed
5.5 References
AACC. 1995. Approved Methods of the Amencan Association of Cereal Chemists (method 32-07). American Association of C e r d Chemists, Inc., St. Paul, MN.
AOAC. 1990. Official Methods of Adysis , 1 5 ~ Ed (method 979.09). Association of Offical Analflical Chernists, Washington, D.C.
AOAC. 1995. Officid Methods of Analysis, 16" Ed (method 991.43). Association of Officai Analyticd Chemists, Washington, D.C.
Andermn, J. W., Deakins, D. A., Floore, T. L., Smith, B. M. and Whites, S. E. 1990. Dietary fiber and coronary heart disease. C&. Rev. Food Sci Nwr., 29: 96-147.
Bjorck, 1, Nyman, M. and Asp, N. G. 1984. Extrusion cooking and dietaiy fiber: effects on dietary sber content and on degradation in the rat intestinal tract. Cereal C h . 61:174-179.
Bjorck, 1, Nyman, M., Pirkhed, D., SiljestrGm, M., Asp, N. G and Eggum, B. 0. 1986. On the digestibilty of starch in wheat bread. J. Cereal Sci. 4: 1-1 1.
Caldwell, E. F. and Nelsen, J. C. 1999. Development of an analytical reference standard for total, insoluble, and soluble dietary fiber. Cereal Foods World- 44: 360-362.
Devries, J. W., Prosky, L., Li, B. and Cho, S. 1999. A histoicd perspective on dietary fiber. CereaZ Foods WorZd- 44: 367-3 69.
Englyst, H. and Cummuigs, J. 1984. Simplified method for the measurement of total non- starch polysaccharides by gas-liquid chrornatography of constituent sugars as aidito1 acetates- Analyst 109: 937-942.
Englyst, H. N., Kin- S. M., and Cummings, J. H. 1992. Classification and measurement of nutrïtionally important starch hctions. Ew. J. Clin. Nutr. 46(suppl.) S33.
Englyst, K, Anderson, V. and Cummings, 1. 1983. S tarch and non-starch po lysaccharïdes in some cereal foods. J. Sci Food Agric. 341 : 1434-1440.
Fomalm, L. Soral-Srnietana, M., Srnietana, 2. and Szpeniowski, J. 1987. Chernical characteristics and physico-chemical properties of the extruded mixtures of cereal starches. StarcWStürke 3 9: 7 5-7 8.
Forrest, 1. S. and Wainwright, T- 1977. The mode of binding of P-glucans and pentosans in barley endosperm ceil walls. J. Insr. Brew. 83 : 279-286.
Gosain, K. 1996. Long-tem effects of barley bread products on metabolic control of non- insulin dependent diabets mellitus. MSc thesis, University of Alberta, Edmonton, Canada.
ladhav, S. J., Lutz, S. E., Ghorpade, V. M. and Salunkhe, D. K 1998. Barley: Chemistry and value-added processing. Crir. Rev. Food Sci. 38: 123-1 71.
Jiang, G. S. and Vasanthan, T. 2000. Effect of extrusion cooking on the primary structure and water solubility of fbglucans fiom regular and waxy barley. Cereal Chern. 77: 3 96-400.
Klopfenstein, C. F. 1988. The role of cereal beta-glucans in nutrition and health. Cereal Foods WorZd. 33(10): 865-869.
0sterg%d, K, Bjorck, 1. and Vainionpi@ J- 1989. Effects of extrusion cooking on starch and dietary fiber in bariey. Food Chem. 34: 2 15-227-
Martïnez, V. M., Newman, R K., and Newman, CI K- 1992. Barley diets with d8erent fàt sources have hypocholesteroIemic effects in chickens- J. Nutr, 122: 1070- 1076.
Mchtosh, G. H., Whyte, J., McArthur, R and Nestel, P. J. 1991. Barley and wheat foods: Innuence on plasma cholesterol concnetrations in hypercholestero kmic men Am. J . Clin. Nutr. 53: 1205-1209.
Pick, M. 1994. Oat bran centration bread products: long-term effects on diabetic control, MSc Thesis, University of Alberta, Edmonton, Canada.
Ranhotra, G. S., Gelroth, J. A., and Leinen, S. D. 1999- Resistant starch in selected grain- based foods. Cereal Fou& World. 5: 357-359.
SAS Institute Inc. 1989. SAS/STAT User's Guide, Version 6, Forth Edition Vol. 2, Cary, NC.
Siljestr&n, M., Westerlund, E., Bjorck, 1, HoIm, J., Asp, N. G. and Theander, 0. 1986. The effects of variow themial processes on dietary fiber and starch content of the whole grain wbeat and white flour. J. Cereal Sci 4: 3 15-323.
Theander, 0. and Westerlund, E. 1987. Studies on chernical modifications in heat- processed starch and wheat flour. Slarch/Sf&rke 39: 88-93.
Chapter 6
Conclusions and Recommendations
The pearhg study uidicated that the distriiution of starch, protein, P-glucan,
lipids, and ash within a barley grain m e r widely with the variety. In both barley
varieties (Phoenix and CDC-Candle), starch was conked to the inner core (ie.
endosperm) of the gains and 1025% of pearing flour (PF) contained the highest
concentration of protein The f3-glucan content of whole CDC-Candle barley grain was
4% higher than that of Phoenix. Results showed that B-glucan in Phoenix was relatively
higher in the inner grain Iayers, perhaps beneath the sub-aleurone tissues. In contrast, a
positive concentration gradient of P-glucan towards the grain core was observed in CDC-
Candle grain. In both types of barley, there was no substantial dif5erence between their
contents of lipid and ash, which were mostly concentrated in the outer layers of the
grains. Understanding the grain component distribution through a gradua1 layer-by-layer
grain pearlùig process will be useful in the production of barley flours with different
characteristics for industrial uses.
The color of the gels prepared with whole grain flour was darker (dark
browdblack) than that of the flour d e d from pearled grain (PG). The brightness of the
PG-gels increased as the degree of pearlùig increased up to 32% and rernained unaffëcted
thereafter. The visual and objective evaluations of the color of barley flour gels hdicated
that pearling of barley at least to a degree of 32% was required to ensure its bnght color
and stability in barley-based foods.
In the dextrinization study with PG-flour, at each extrusion temperature (90-
140°C), degree of hydrolysis @H) increased with moisture content fiom 20% to 50%.
At a constant moisture level, Phoenix and CDC-Candle flours extruded without
thermostable a-amylase showed decrease in DK values at temperatures exceedmg 90°C.
This could be attn'buted to inactivation of starch hydroipïng enzymes that are naturdy
present in barley flours, at higher extrusion temperatures However, fIow extnided in the
presence of thermostable a-amylase (2 or 4%}, the DH increased with an increase in
temperature up to 100°C; thereafter, hydrolysis decreased in both CDC-Candle and
Phoenix badey flours, which may be attributed to thermal inactivation of the added
thermostable a-amylase. This suggests that 100°C is the optimum temperature for
extrusion in the presence of thermostable a-amylase. Also, it was observed that at low
extrusion temperatures (90 and 1 OO°C), Phoenix was hydroiyzed to a greater extent than
CDC-Candle. However, the above order was reversed at higher extrusion temperatures
(120 and 140°C).
Phoenix and CDC-Candle flours when extnided without thermostable a-amylase
showed progressive increases in dextrose equivalent (DE) with an increase in moisture
content (2040%) and temperature (90440°C). This reflects an increase in the nurnber of
reducing ends, perhaps resdting fiom m n t a t i o n of starch and f3-glucan chains due to
mechanicd shear. In the presence of thermostable a-amylase, at constant extrusion
temperature, DE increased (due tu hydrolysis of starch) with an increase in moisture
content. At each rnoisture ievel, the maximum and minimum values of DE were obtained
at 100°C and 140°C, respectively.
At each temperature and enzyme concentration, the proportion of DPl to DP7 at
all moishire contents, foiiowed the order: DP2>DP6>DP3>DP5>DP7>DP4>DP 1. At
each temperature and moisture content, the proportion of DPI to DP7 increased with
enzyme conceniration, At each enzyme concentration and moisture content, an increase
m temperature fkom 90 to 100°C increased the proportion of DPl to DP7. However, at
120 and 140°C, the proportion of DPl to DP7, were much lower than that at 90°C. At 90
and 100°C, the predominant oligosaccharide species were DP2, DP6 and DP3, whereas,
at 120 and 140°C, these were DP2, DP6, DP5 and DP6, DP3, DP2, respectively. The
data fiom this research indicated that dextrinized barley flours with different saccharide
composition can be produced by extrusion technology. This process could be used as
another avenue to alter barley flou fiuictionality for dif5erent foodhdustriaI
applications.
The contents of soluble dietary liber (SDF) and total dietaq fiber (TDF) increased
upon extrusion cooking of both types of barley flours. The changes in the insoluble
dietary fiber (LDF) content were found to be variety dependent. A minor deaease in IDF
content of CDC-Candle barley was found, but an increase in IDF content of Phoenix was
observed at ali extrusion temperature. The increase in SDF in both barleys could be due
to the transformation of some IDF into SDF during extrusion and the formation of
additional SDF by tram-glycosidation. The increase in IDF in Phoenix flour could be
due to the formation of retrograded amylose [resistant starch (RS3)] during extrusion
cooking and subsequent cooling. For di temperatures employed, the RS3 formation was
observed to be higher at 50% than at 20% moisture level.
Extrusion conditions, such as temperature, moisture, pressurefshear and their
interactions may change the molecular structure as weil as nutritional properiies of barley
flour components. Further research is warranted to understand the effect of extrusion
processing of barley flours, and its health implications. A b , research is required to
understand the rehtionship between the properties of extruded and dextnnized barley
flour products and their functiodity/suÏtabZty for different food/industnal applications.
These researches will m e r add value to barley flou. and widen its usage-
Appendix
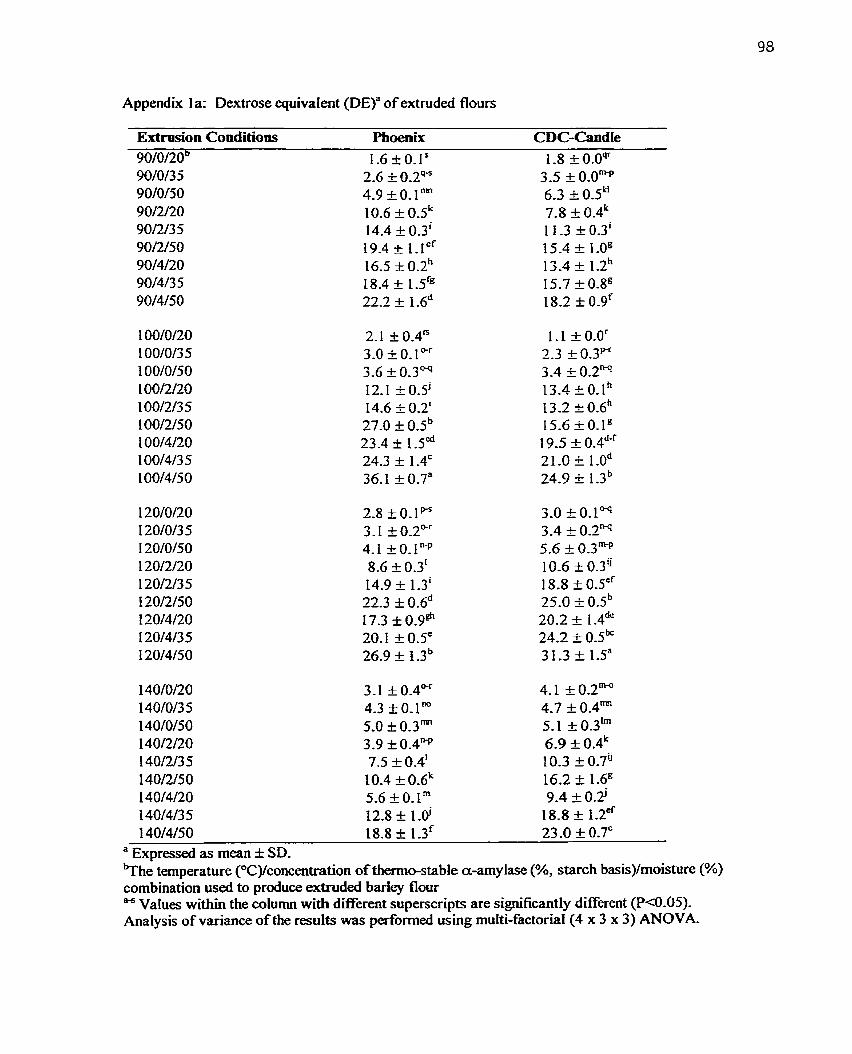
Appendix 1 a: Dextrose equivalent (DE)" of extrudai flours
Extrusion Conditions Phoenix CDC-Candie
1 40/4/5 0 18.8 f 1 . 3 ~ 23.0 t 0.7" " Expressed as mean + SD. bT he temperature (°C)/concentration of themo-s table a-amy lase (%, starc h basis)/moisture (%) combination used to produce extrudeci barley flour " Values within the column with different superscripts are significantly different (P~0.05). Analysis of variance of the results was performed using multi-factorial(4 x 3 x 3) ANOVA.
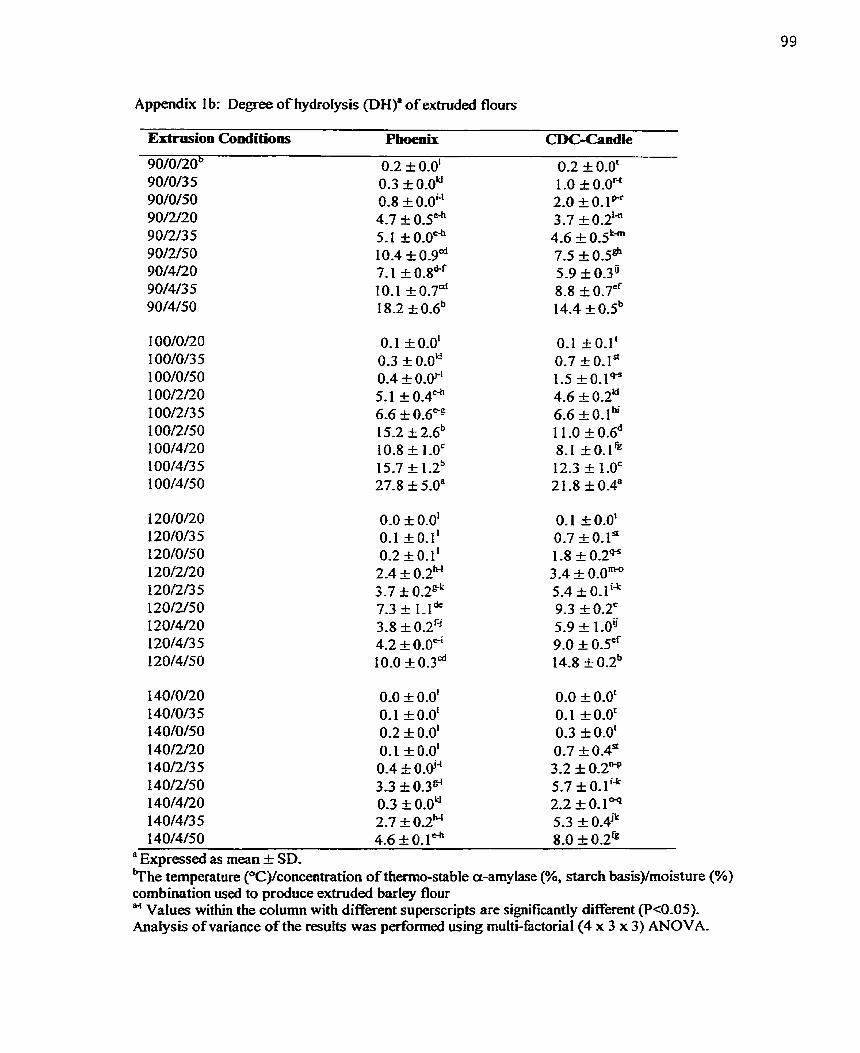
Appendix 1 b: Degree of hydrolysis @Hla of extruded flours
Extrusion Conditions Phoenix CDC-Candie
140/0/20 0-0 + 0.0' 0.0 _+ 0.0' 140/0/3 5 O. 1 & 0.0' O. 1 + 0.0' I40/0/50 0.2 + 0.0' 0.3 t 0.0' 140/220 0.1 f 0.0' 0.7 f 0.4" 1 40/2/3 5 0.4 & 0.0'' 3.2 I 0-2"P 140/2/50 3.3 & 0 . 3 ~ 5.7 t 0 . P 1 40/4/20 0.3 + 0.0' 2.2 t 0-1- 1 4 0 ~ 3 5 2.7 * O - s ~ ~ 5.3 + O-4jk 1 40/4/5 O 4.6 + 0 . 1 ~ 8.0 f 0 . 2 ~
" Expressed as mean + SD. 9 he temperature (OC)/concentration of themio-stable a-amy lase (%, starch basis)/moisture (%) combination used to produce extruded barley flour " Values within the coiumn with different superscripts are significantly different (P<0.05). Analysis of variance of the results was perfomed using multi-factorial(4 x 3 x 3) ANOVA-
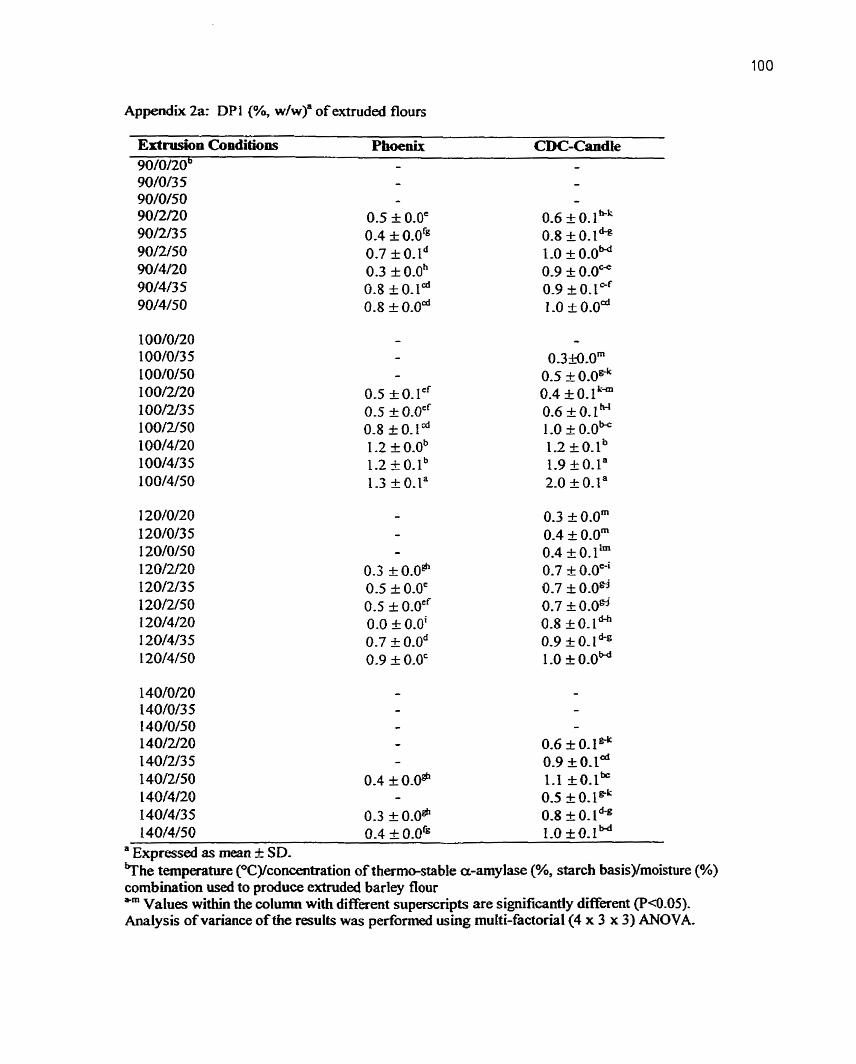
Appendix 2a: DP 1 (%, w/w)" o f extruded flours
Extrusion Conditions Phoenix CDC-Candle 90/0/20b -
vhe temperature (OC)/concentration of thermo-stable a-amylase (%, starch basis)/moisture (%) combination used to produce extruded barley flour *m Values withïn the column with diffient superscripts are significantly different (P4.05). AnaIysis of variance o f the results was perfiomed using muki-factorial(4 x 3 x 3) ANOVA-
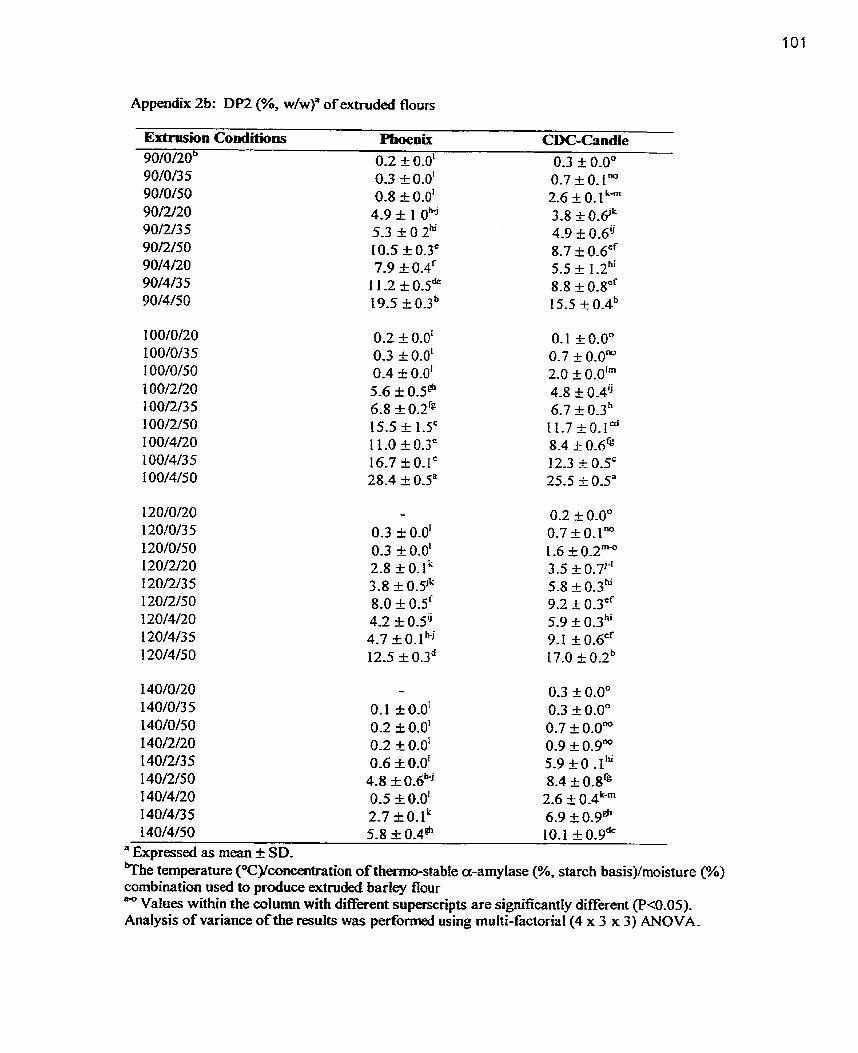
Appendix 2b: DP2 (%, w/w)" of extruded flours
Extrusion Conditions Pboenix CDC-Candie 90/0/20~ 0-2 $1 0.0' 0.3 + 0-0" 9 O/O/3 5 0-3 + 0.0' 0-7 + O, l m 90/0/50 0.8 $10.0' 2.6 +O, lL;" 90/2/20 4-9 t 1 O"-' 3.8 t 0.6'" 90/2/3 5 5.3 t O 2k 4-9 t 0-6! 90/2/50 1 0-5 t 0.3' 8.7 k 0_6" 90/4/20 7.9 t 0-4f 5.5 t 1 - 2 ~ 90/4/3 5 1 1-2 + 0.5~ 8.8 t 0.8"' 90/4/50 19.5 t 0.3b 15.5 f: 0.4~
bîhe temperature (OC yconcentration of themstable a-amy lase (%, starc h bas is)/moisture (%) combination used to produce extruded barley flour bO Values within the column with different superscripts are significantly different (P<0.05). Analysis of variance of the results was performed using multi-factorial(4 x 3 x 3) MOVA-
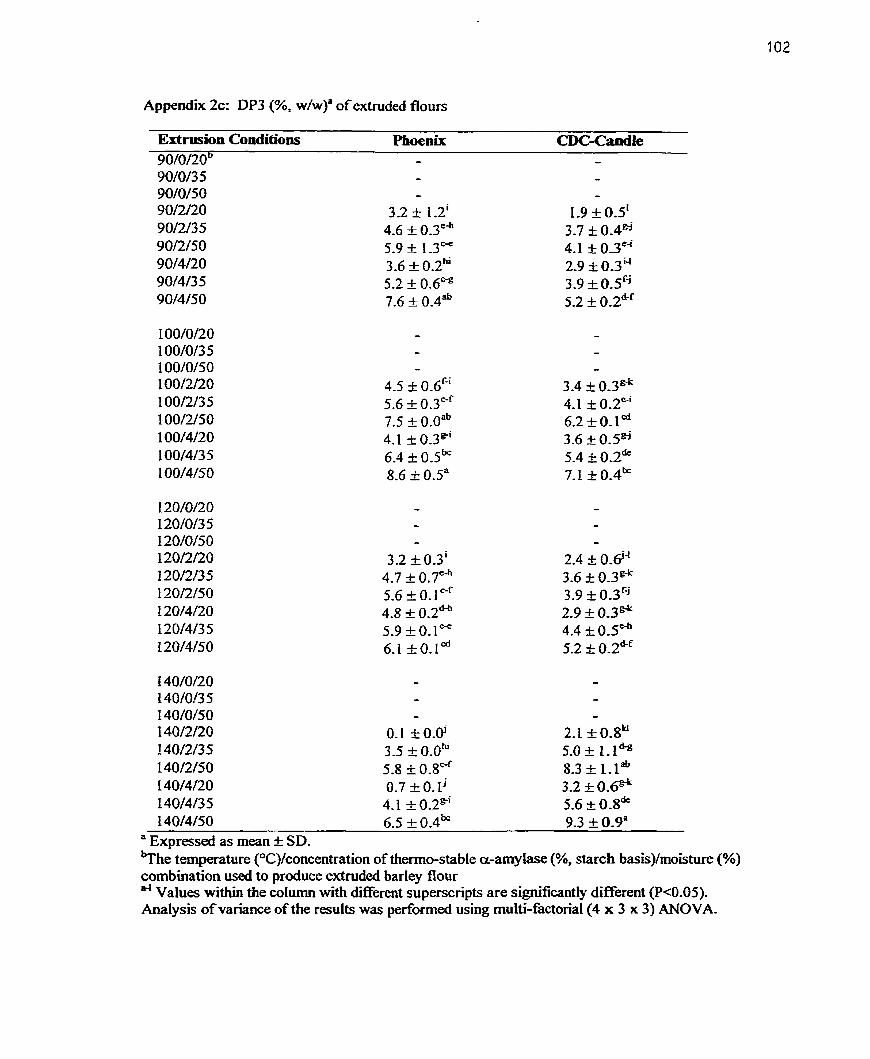
Appendix 2c: DP3 (%, w/w)" of extrude- flours
Extrusion Conditions Phoenix
I40/0/20 - - 140/0/3 5 .. - 140/0/50 - - 140/2/20 0.1 Ç 0.0' 2.1 t 0-8'd 140/2/35 3.5 + 0.0~ 5.0 k 1-l* 140/2/50 5.8 + 0.8"' 8.3 k 1-l* 140/4/20 0.7 k O. 1' 3.2 f 0 . 6 ~ 140/4/3 5 4.1 -t- 0.2%' 5.6 t O-8& 140/4/50 6.5 t 0 . 4 ~ ~ 9.3 + 0.9"
" Expressed as rnean -t: SD. v h e temperature (OC)/concentration of thenno-stable a-amy lase (%, starch basis)/moisture (%) combination used to produce extruded barley flour * Values within the coiumn with different superscripts are significantly different (P<0.05). Analysis of variance of the results was performed using multi-factorial(4 x 3 x 3) ANOVA.
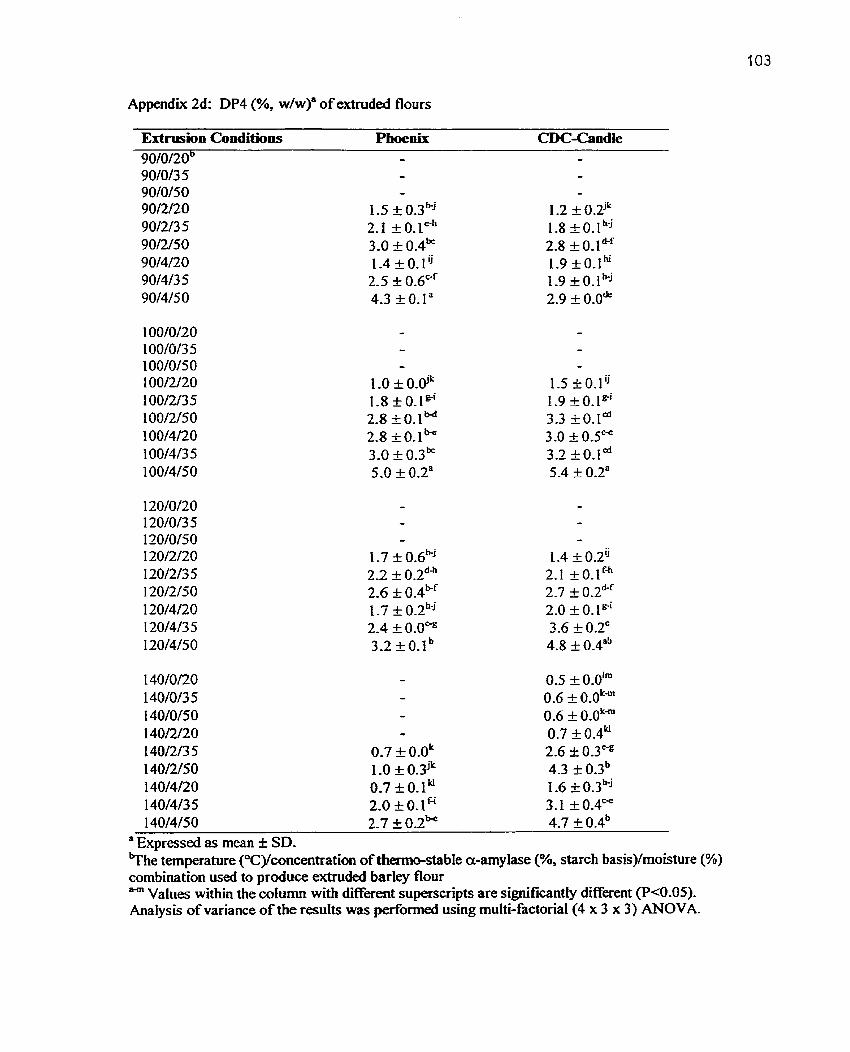
Appendix 2d: DP4 (%, w/w)" o f extruded flours
Extrusion Conditions Phoenix CDC-Candie 90/0/20b - - 9 0/0/3 5 - - 90/0/50 - - 90/2/20 1.5 k 0 . 3 ~ j 1.2 i 0.2'" 90/2/3 5 2.1 f O. le" 1.8 +0.lh:' 90/2/50 3-0 zk 0 . 4 ~ 2.8 f 0 . 1 * ~ 90/4/20 1.4 f 0.1" 1.9 10.1" 90/4/3 5 2.5 + 0.6"' 1-9 iO.lh-' 90/4/50 4.3 2 O. 1" 2.9 i 0 . 0 ~
140/4/50 2-7 + 0.2~ 4.7 + 0 .4~ " Expressecl as mean t SD. ?hi temperature (T)/concentration of thermo-stable a-amylase (%, starch basis)/moisture (%) combination used to produce extnided barley flour " Values within the cotumn with different superscripts are significantly different (P<0.05). Analysis of variance of the results was performed using multi-factorial(4 x 3 x 3) ANOVA.
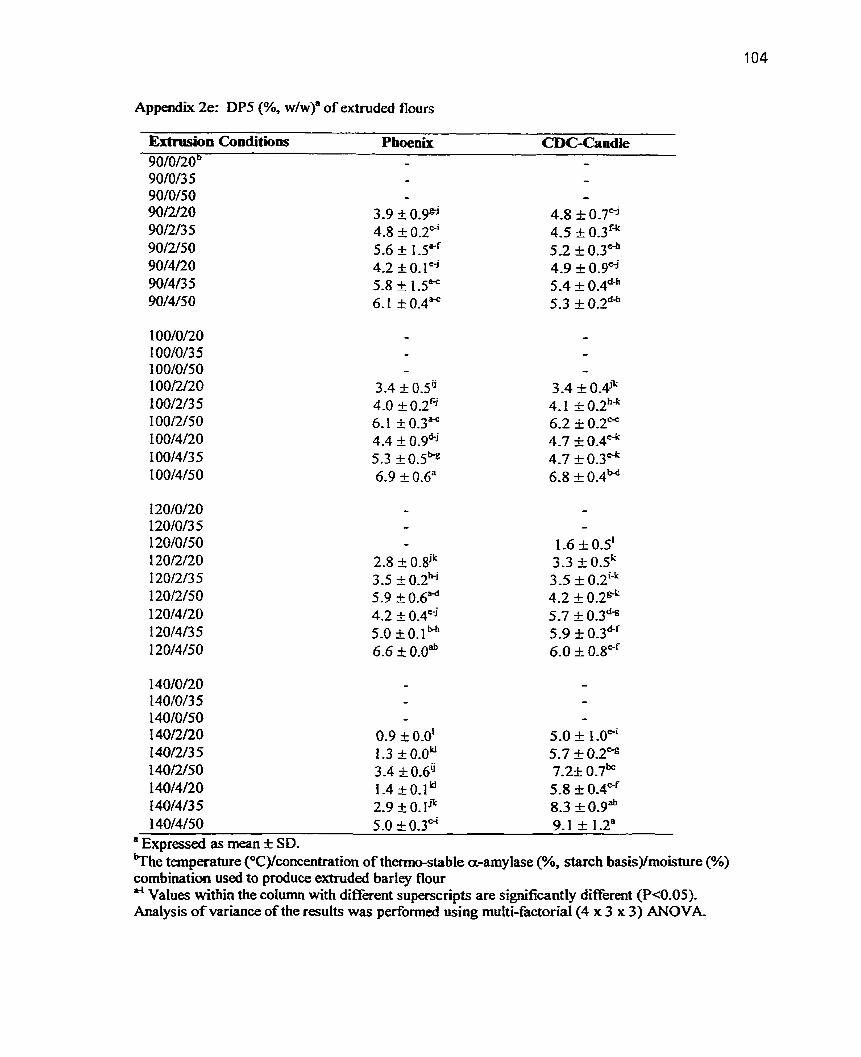
Appendix 2e: DPS (%, w/w)" of extruded flours
Extrusion Conditions Phoenix CDC-Candle
140/0/20 - - 1 40/0/3 5 - - 140/0/50 - - 1 40/2/20 0.9 k 0-0' 5.0 + I .O*' 140/2/3 5 1.3 f 0.0~ 5.7 +- 0.2w 1 40/2/50 3.4 t 0.6~ 7.2f 0.7~ 140/4/20 1.4 -t 0.1' 5.8 i 0-4''' I40/4/3 5 2.9 zk O. lJk 8.3 k 0.9~ 1 40/4/5O 5.0 & 0.3"' 9.1 + 1.2"
" Expressed as mean f SD. q h e temperature (OC)/concentration of thermo-stable a-amylase (%, starch basis)hoisture (%) combination used to produce extruded barley flour
Values within the colurnn with different superscripts are significantly different (P<O.OS). Analysis of variance of the results was performed using multi-factorial(4 x 3 x 3) ANOVA-
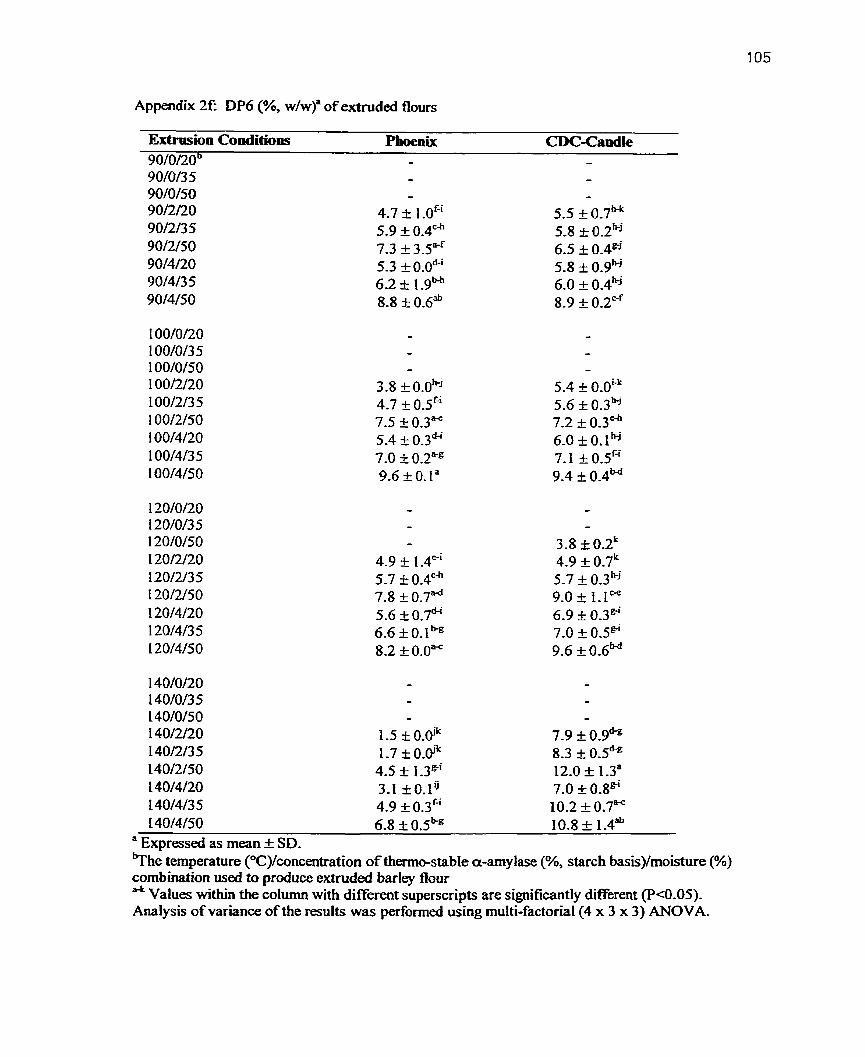
Appendix 2f: DP6 (%, w/w)" o f extnided flours
Extrusion Conditions Phoenix CDC-Candle 90/0/20 - - 90/0/3 5 - - 90/0/50 - - 90/2/20 4-7 t 1 .oGi 5.5 t 0-7hk 90/2/3 5 5-9 _t 0.4'~ 5-8 ~t 0 - 2 ~ j 90/2/50 7-3 k 3.T' 6-5 + 0.4" 90/4/20 5-3 t 0.0~-' 5.8 t 0 . 9 ~ 90/4/3 5 6.2 t 1 .gM 6.0 + 0 - 4 ~ j 90/4/50 8.8 rt 0 . 6 ~ 8.9 + 0.2"~
140/4/50 6.8 I 0 . 5 ~ 10-8 + 1.4* " Expressed as m a n f SD. q h e temperature ("C)/concentration of th-stable a-amylase (%, starch basis)/moisture (%) combination used to produce extrudai barley flour a-k Values within the column with different superscripts are significantly different (P<0.05). Analysis of variance of the results was performed using multi-factorial(4 x 3 x 3) ANOVA.
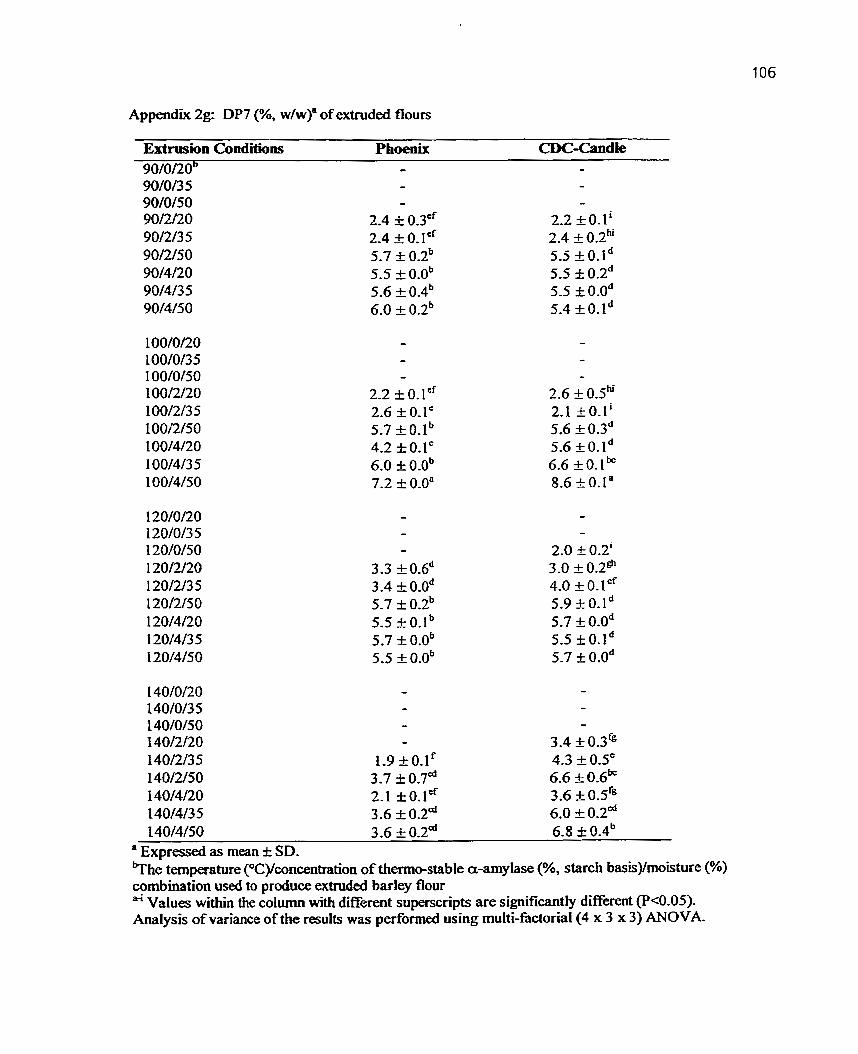
Extrusion Conditions Phoenix CDC-Candk 90/0/2Ob - - 90/0/3 5 - - 90/0/50 - - 901U20 2.4 f 0.3" 2-2 f O.li 901213 5 2.4 t O. lCf 2.4 f 0 . 2 ~ 9OlU50 5.7 f: 0.2~ 5.5 f O* ld 9014120 5.5 t 0.ob 5.5 + 0 .2~ 901413 5 5.6 4 0.4~ 5.5 f 0.0~ 90/4/50 6.0 1 0 . 2 ~ 5-4 + O . l d
1 4010120 - - 1401013 5 - - 1 401015 O - - 14012120 - 3.4 4 0.3'~ 1 401213 5 1-9 k O.lf 4.3 + O.Se 140lUSO 3.7 f 0 . 7 ~ 6.6 k 0-6b" 140/4/20 2.1 f o.let 3.6 a 0.5'~ 1 401413 5 3.6 I 0 . 2 ~ 6.0 1 0 . 2 ~ 1 4014/50 3 -6 & 0.2~ 6.8 k 0-4b
" Exprssed as mean f SD. bThe temperature (OC)/concentration of thennestable a-amylase (%, starch basis)lmoisture (%) combination used to produce extruded barley fiour a4 Values within the column with different superscripts are significantly different (P<0.05). Analysis of variance of the results was perfonned using multi-factorial(4 x 3 x 3) ANOVA.