Embed Size (px)
Citation preview
UNIVERSITY OF ALBERTA FINANCIAL STATEMENTS
for the Year Ended March 31, 2008
FINANCIAL SERVICES
3rd Floor Administration Building • University of Alberta • Edmonton • Canada • T6G 2M7 Telephone: (780) 492-3000 • Fax: (780) 492-2846
Website: www.financial.ualberta.ca E-mail: [email protected]
TABLE OF CONTENTS Financial Analysis 3 Statement of Administrative Responsibility for Financial Reporting 16 Auditor's Report 17 Statement of Financial Position 18 Statement of Operations 19 Statement of Changes in Net Assets 20 Statement of Cash Flows 21 Notes to the Financial Statements 22
3
University of Alberta Financial Analysis For the year ended March 31, 2008
Executive Summary The University of Alberta has reported a $50.3 million deficiency of revenue over expense for the year ended March 31, 2008 compared to a $65.8 million excess reported last year. The year end unrestricted net assets position is $51.8 million as compared to last year’s $40.9 million. The 2008 deficiency is mainly due to net investment losses. The University holds $169.7 million of asset-backed commercial paper (“ABCP”) in its Non Endowed Investment Pool. The year end results include a write-down of $41 million related to ABCP holdings; representing 24 per cent of the total value. Partially offsetting this loss is an $11.8 million unrealized gain on shares held in a publicly traded spin-off company. The Unitized Endowment Pool had a loss of 6 per cent; therefore the University was required to transfer $27.2 million from endowments (cumulative capitalized earnings) to fund the endowment spending allocation. The Canadian market for ABCP suffered a liquidity disruption in August 2007. Shortly thereafter, a group of financial institutions and other parties agreed to a standstill period under the Montreal Accord, and a Pan-Canadian Investors Committee was formed to oversee the orderly restructuring of these investments during the standstill period. The University is a member of the Investors Committee. On April 24, 2008, nearly 96 per cent of the 1,932 ABCP note holders voted in favor of the restructuring plan devised by the Investors Committee. Current expectations are that the plan will be finalized in the coming months. In the absence of an active market for third-party ABCP, the University has estimated the fair value of these assets using an internal valuation model. The valuation model incorporates administration’s best estimates; however the ongoing nature of the restructuring negotiations contributes to significant measurement uncertainty. Due to this uncertainty, it is possible that the ultimate fair value of these assets may vary significantly from administration’s current best estimate and the magnitude of any such difference could be material to the financial results. At the dates the University acquired these investments they were rated R1 (high), the highest credit rating issued for commercial paper, as required by the University’s investment policy. A comprehensive long-term cash flow forecast has been prepared and administration is confident that the exposure to ABCP does not represent a liquidity issue for the University and all obligations and commitments will continue to be met. The endowment investments had no exposure to ABCP investments. Financial highlights for 2008: The provincial government base operating grant increased by six percent and the Province’s three-year forecast identifies
continuing six percent increases through to fiscal 2009-10. The University received a number of new grants for academic program expansion, and in addition the Province provided a one-time grant to compensate the University for the 2004-05 tuition freeze impact.
Research revenue (before deferrals) was $471.6 million in 2008, as compared to $461.4 million in 2007. The University
is among the top five institutions in Canada in attracting research support from the whole range of Canadian and international sponsors.
The University’s fundraising activities also produced significant increases. New endowment contributions totaled $46.1
million and includes the final matching grant installment of $12.8 million for the China Institute. Expendable donations totaled $29.4 million and the University also received a $17.4 million in-kind contribution of land.
In support of the University’s capital plan, the Province provided $412.3 million in funding for several key capital
priorities. Some of the larger projects that received funding included: Centennial Centre for Interdisciplinary Science ($165.4 million); Health Research Innovation Facility ($91.4 million); Utilities expansion ($59 million); The Edmonton Clinic North ($25 million) and the Augustana Campus Library and Forum ($20 million).
4
Areas of significant financial risk:
unfunded pension liabilities, particularly with respect to the Universities Academic Pension Plan (UAPP), where the University of Alberta’s active membership represents almost half of the total. The University’s estimated share of the UAPP unfunded pension liability is approximately $175 million. Although generally accepted accounting principles do not currently require that this obligation be recorded, the University has disclosed this amount in the notes to the financial statements (refer to later section in the financial analysis);
deferred maintenance, which now exceeds an estimated $870 million and place programs and initiatives at some risk (refer to later section in the financial analysis);
uncertainty about utility costs due to the volatile energy market; inflationary pressures, particularly related to construction costs and contracted services; and the salary negotiations currently in progress for the academic staff. Investment income, too, can fluctuate significantly due to market performance.
The University is wholly committed to addressing these obligations and will work closely with the provincial government on a long-term strategy that minimizes the University’s exposure while maintaining its unprecedented forward momentum. At the same time, administration will continue to plan with the assumption that, in a booming province with multiple competing priorities, there is no guarantee that operating grant increases of six percent will continue indefinitely.
The Financial Analysis is intended to provide the reader with the financial highlights for the 2008 year and should be read in conjunction with the March 31, 2008 audited Financial Statements.
• click on Annual Financial Statements
Other documents the reader can refer to for a more in-depth discussion and analysis of the University’s goals and objectives are as follows:
• click on Key Strategic Planning Documents:
2007 – 2011 University Plan (update 2008)
2007 – 2011 Capital Plan (update 2008)
Annual Report (most recent fiscal year)
Other information the reader may find useful:
• click on Investment Reports (most recent fiscal year)
website link: http://www.financial.ualberta.ca
5
Introduction To reflect the nature and restrictions placed on its revenue sources, the University classifies its revenues into separate categories. The major classification distinction is whether the revenues represent unrestricted or restricted contributions. Unrestricted contributions are flexible in that they are available to the University’s Board of Governors to allocate for spending, as it deems appropriate. Such contributions are recognized as revenue immediately. The University, on the other hand, can only expend restricted contributions for the specific purposes defined by the external sponsor or donor. Such contributions are deferred and recognized as revenue when conditions of the contributions are met. The term “deferrals” is used to describe the deferred component. The University segregates its financial activity into the following separate funds to further enhance accountability, budgetary control and stewardship of resources:
Unrestricted funds:
• General Operating - this fund includes the provincial government operating grant, tuition fee revenue, investment income available for general spending and any new revenues generated by faculties and administrative units.
• Ancillary Services - these University business enterprises provide goods and services to the University community and to individuals, companies and organizations external to the University. These units are expected to operate on either a break-even basis, covering their full operating and capital costs, or on a profit basis.
• Enrolment Planning Envelope (EPE) - funded by the provincial government for the purposes of implementing specific new programs or expanding existing programs. Viable programs may become part of the operating grant in subsequent years.
• Internally Restricted (Research and Special Purpose) – these funds include the internally restricted endowment spending allocation as well as other funds available for spending that do not have any external restrictions.
Restricted funds:
• Research - funded by grants and contracts from external sponsors, donations and endowment investment income available for spending.
• Special Purpose - funded by grants and contracts from external sponsors, donations and endowment investment income available for spending. Expenditures include scholarships and bursaries, and other special projects involving teaching and community service.
• Capital - funded by provincial, federal and other government grants and donations. Funds are primarily designated for the acquisition of buildings, equipment and furnishings, including major renovations.
For financial statement reporting purposes, the Statement of Financial Position, Statement of Operations, and Statement of Changes in Net Assets combine the assets, liabilities, equity and revenues and expenses of all funds.
6
Excess (Deficiency) of Revenue over Expense
The University ended the 2008 year with a $50.3 million deficiency of revenue over expense (2007: $65.8 excess) and $51.8 million in unrestricted net assets (2007: $40.9).
The decrease of $116.1 million, from an excess of revenue over expense to a deficiency, is due to a number of factors. A significant factor is the $65.4 million decrease in investment income, which is mainly attributable to the 2.8% loss for the Non Endowed Investment Pool (“NEIP”) (2007: 5.6% return) and the 6% loss for the Unitized Endowment Pool (“UEP”) (2007: 10.7% return). The endowment spending allocation ($27.2 million) has therefore been funded by a transfer from endowment net assets (cumulative capitalized earnings) as per the authority provided under the Post-Secondary Learning Act. The NEIP return also reflects the $41 million write-down in unrealized investment losses related to holdings in ABCP. Partially offsetting the NEIP loss is an $11.8 million unrealized gain on shares held in a publicly traded spin-off company.
Other significant factors include: • In the prior year the University reported that spending lags had contributed to the excess, due to the operating grant
increase and the significant increases to the enrolment planning envelope grants. In 2008, expenditures have been incurred against this 2007 increase in funding.
• In the prior year the University reduced the vacation pay liability due to a change in estimation. There are no such adjustments in the current year, therefore the impact is an increase in expense over last year of approximately $8.8 million.
• The University has increased it’s provision for a site remediation project by $7.2 million.
Revenues from the Province of Alberta increased due to a 6% increase in the operating grant and the University also received new enrolment planning envelope grants.
Revenues
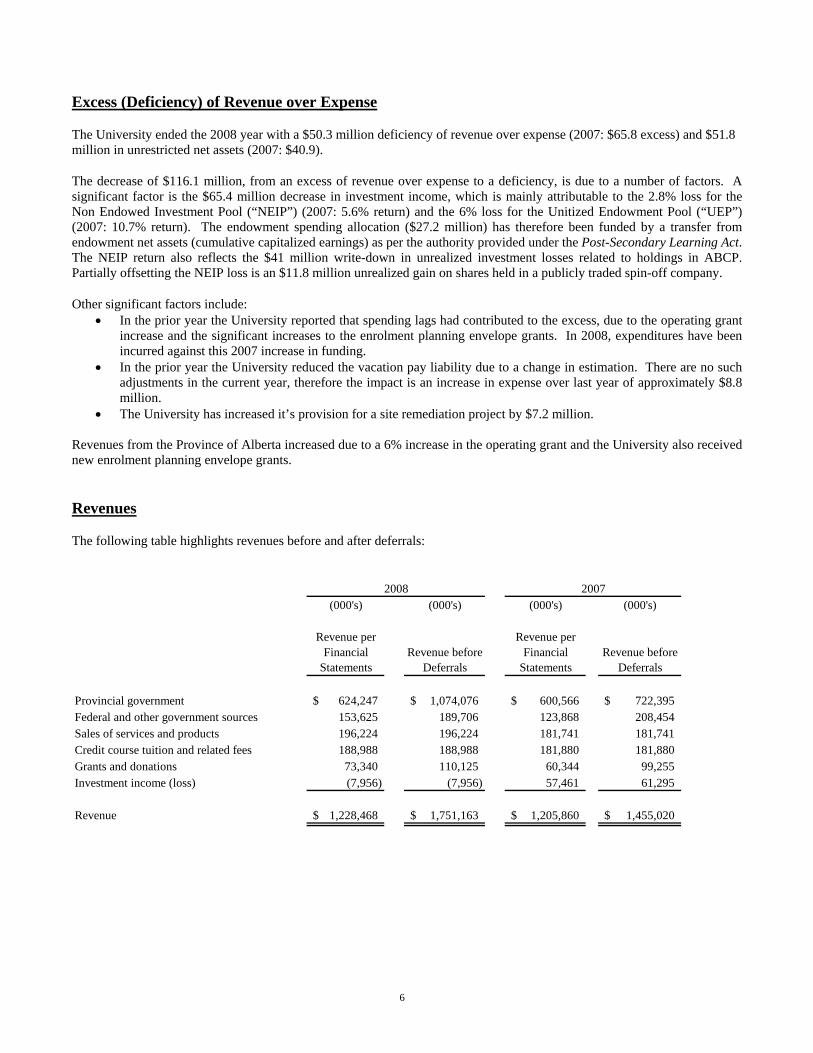
The following table highlights revenues before and after deferrals:
(000's) (000's) (000's) (000's)
Revenue per Financial
StatementsRevenue before
Deferrals
Revenue per Financial
StatementsRevenue before
Deferrals
Provincial government 624,247$ 1,074,076$ 600,566$ 722,395$ Federal and other government sources 153,625 189,706 123,868 208,454 Sales of services and products 196,224 196,224 181,741 181,741 Credit course tuition and related fees 188,988 188,988 181,880 181,880 Grants and donations 73,340 110,125 60,344 99,255 Investment income (loss) (7,956) (7,956) 57,461 61,295
Revenue 1,228,468$ 1,751,163$ 1,205,860$ 1,455,020$
2008 2007
7
Revenue ComparativeFor the year ended March 31
(in millions of dollars)
0
50
100
150
200
250
300
350
400
450
500
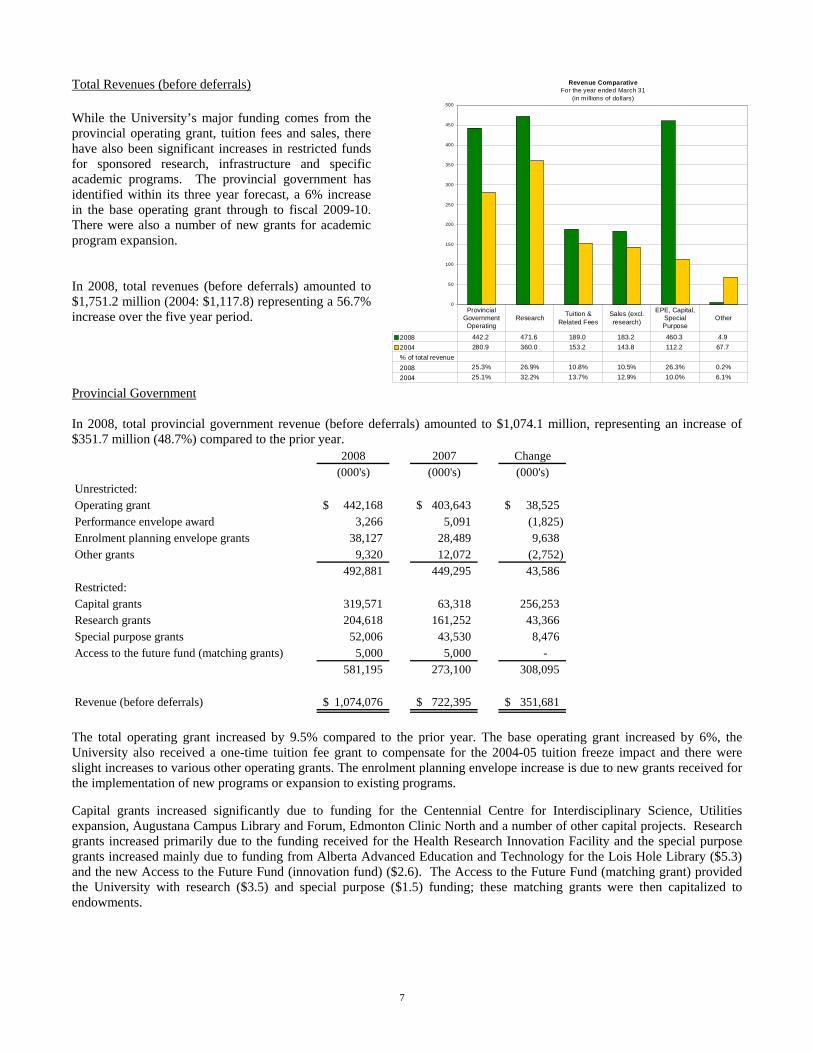
2008 442.2 471.6 189.0 183.2 460.3 4.9 2004 280.9 360.0 153.2 143.8 112.2 67.7 % of total revenue2008 25.3% 26.9% 10.8% 10.5% 26.3% 0.2%2004 25.1% 32.2% 13.7% 12.9% 10.0% 6.1%
Provincial Government Operating
Research Tuition & Related Fees
Sales (excl. research)
EPE, Capital, Special Purpose
Other
Total Revenues (before deferrals) While the University’s major funding comes from the provincial operating grant, tuition fees and sales, there have also been significant increases in restricted funds for sponsored research, infrastructure and specific academic programs. The provincial government has identified within its three year forecast, a 6% increase in the base operating grant through to fiscal 2009-10. There were also a number of new grants for academic program expansion. In 2008, total revenues (before deferrals) amounted to $1,751.2 million (2004: $1,117.8) representing a 56.7% increase over the five year period. Provincial Government In 2008, total provincial government revenue (before deferrals) amounted to $1,074.1 million, representing an increase of $351.7 million (48.7%) compared to the prior year.
2008 2007 Change(000's) (000's) (000's)
Unrestricted:Operating grant 442,168$ 403,643$ 38,525$ Performance envelope award 3,266 5,091 (1,825) Enrolment planning envelope grants 38,127 28,489 9,638 Other grants 9,320 12,072 (2,752)
492,881 449,295 43,586 Restricted:Capital grants 319,571 63,318 256,253 Research grants 204,618 161,252 43,366 Special purpose grants 52,006 43,530 8,476 Access to the future fund (matching grants) 5,000 5,000 -
581,195 273,100 308,095
Revenue (before deferrals) 1,074,076$ 722,395$ 351,681$
The total operating grant increased by 9.5% compared to the prior year. The base operating grant increased by 6%, the University also received a one-time tuition fee grant to compensate for the 2004-05 tuition freeze impact and there were slight increases to various other operating grants. The enrolment planning envelope increase is due to new grants received for the implementation of new programs or expansion to existing programs. Capital grants increased significantly due to funding for the Centennial Centre for Interdisciplinary Science, Utilities expansion, Augustana Campus Library and Forum, Edmonton Clinic North and a number of other capital projects. Research grants increased primarily due to the funding received for the Health Research Innovation Facility and the special purpose grants increased mainly due to funding from Alberta Advanced Education and Technology for the Lois Hole Library ($5.3) and the new Access to the Future Fund (innovation fund) ($2.6). The Access to the Future Fund (matching grant) provided the University with research ($3.5) and special purpose ($1.5) funding; these matching grants were then capitalized to endowments.
8
The Province also provided a grant for the China Institute Endowment of $12.8 million (2007: $24.5), which is recorded as an endowment contribution. This now completes the province’s commitment to match the original in-kind contribution of $37.3 million. Research Research revenue (before deferrals) amounted to $471.6 million, representing an increase of $10.2 million (2.2%) compared to the prior year.
2008 2007 Change(000's) (000's) (000's)
Research revenue by type:Provincial government 208,082$ 166,817$ 41,265$ Federal and other government 175,796 187,683 (11,887) Grants and donations 69,575 72,789 (3,214) Investment income 5,913 23,560 (17,647) Sales of services and products 12,204 10,548 1,656
Research revenue (before deferrals) 471,570$ 461,397$ 10,173$
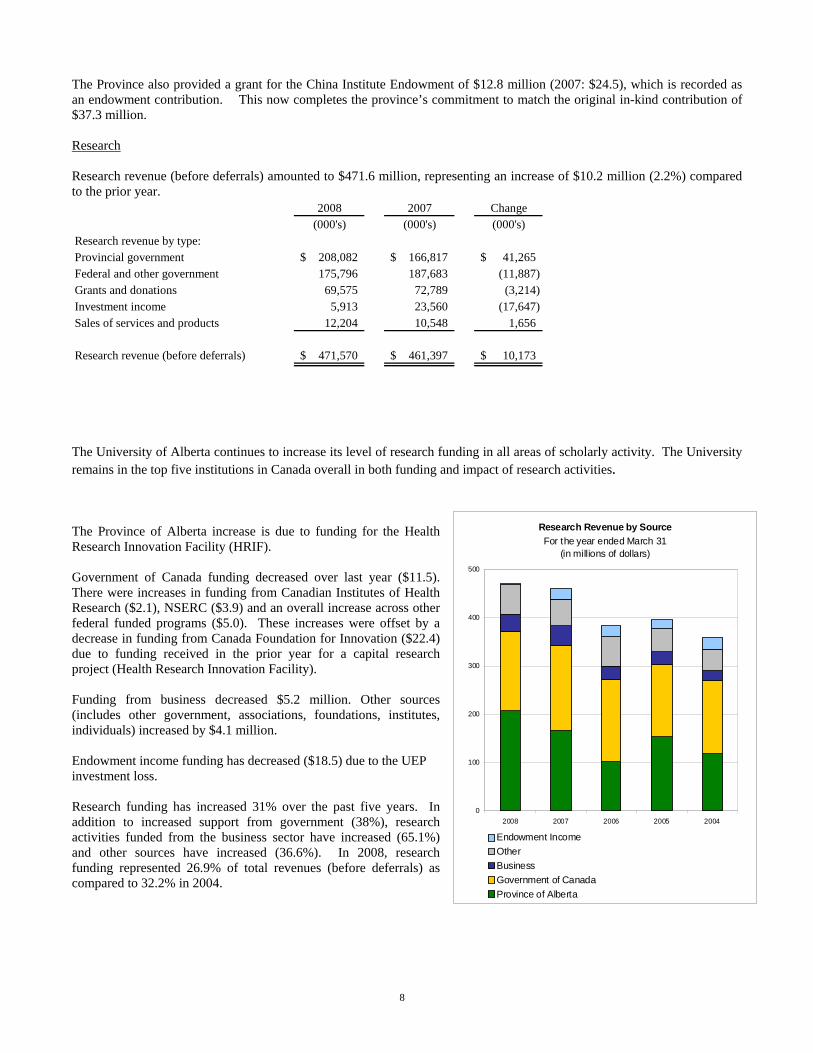
The University of Alberta continues to increase its level of research funding in all areas of scholarly activity. The University remains in the top five institutions in Canada overall in both funding and impact of research activities. The Province of Alberta increase is due to funding for the Health Research Innovation Facility (HRIF). Government of Canada funding decreased over last year ($11.5). There were increases in funding from Canadian Institutes of Health Research ($2.1), NSERC ($3.9) and an overall increase across other federal funded programs ($5.0). These increases were offset by a decrease in funding from Canada Foundation for Innovation ($22.4) due to funding received in the prior year for a capital research project (Health Research Innovation Facility). Funding from business decreased $5.2 million. Other sources (includes other government, associations, foundations, institutes, individuals) increased by $4.1 million. Endowment income funding has decreased ($18.5) due to the UEP investment loss. Research funding has increased 31% over the past five years. In addition to increased support from government (38%), research activities funded from the business sector have increased (65.1%) and other sources have increased (36.6%). In 2008, research funding represented 26.9% of total revenues (before deferrals) as compared to 32.2% in 2004.
Research Revenue by SourceFor the year ended March 31
(in millions of dollars)
0
100
200
300
400
500
2008 2007 2006 2005 2004
Endowment IncomeOtherBusinessGovernment of CanadaProvince of Alberta
9
Tuition and Related Fees Tuition and related fees amounted to $189.0 million (2007: $181.9). This increase is primarily attributable to a 3.3% increase in tuition fees coupled with a 1.1% enrolment increase. In 2006, the provincial government announced a comprehensive framework to make post-secondary studies more affordable for students. A key component of the framework was a new tuition fee policy, starting in fall 2007. The tuition fee policy limits tuition increases to changes in the annual Consumer Price Index (CPI). Along with the announcement of the new tuition policy, the provincial government increased its grants to post-secondary institutions for the three years starting 2007-08 to offset the difference between maximum annual tuition increase under the old policy and the new policy. The tuition fees (instructional fees only) for an Arts or Science student with a full time course load in 2008 were $4,686 as compared to $4,537 in 2007. Sales of Services and Products Ancillary services units and academic and administrative units generate revenues through the sale of services and products to individuals, companies and organizations external to the University. Also included in sales are miscellaneous types of revenues received by the University. Sales of services and products amounted to $196.2 million (2007: $181.7). The ancillary services units generated sales of $85.1 million for 2008 (2007: $82.3). The units with the largest sales are: Bookstore ($25.5), Housing and Food Services ($23.3), Utilities ($16.9) and Parking Services ($11.5). Academic and administrative units generated sales of $111.1 million (2007: $99.4), with the most significant activity as follows: Faculty of Medicine and Dentistry ($55.5) which is mainly revenue from Capital Health and the Practice Plans in support of positions that provide an interaction between the academic environment and the clinical services environment; non credit tuition and related fees generated by the Faculty of Extension ($10.4); Physical Education and Recreation revenue generated by athletic teams, sport camps and rentals of facilities ($8.7); Faculty of Business professional and executive development programs ($7.0) and Faculty of Agriculture, Life and Environmental Sciences ($5.8) which is mainly from the sale of animal, plant and related products. The $111.1 million in academic and administrative unit sales represents an $11.7 million increase which is due to increased activity or new sales activity primarily in the following areas: Faculty of Medicine ($7.3), Faculty of Extension ($1.3 in non-credit tuition fees due to an increase in enrolment) and a net overall increase across all other units ($3.1). Investment Income (Loss) The loss from investments for the year was $8.0 million compared to $57.5 million in income recorded in the prior year. Investments primarily fall into two categories, the Unitized Endowment Pool (“UEP”) and the Non Endowed Investment Pool (“NEIP”). The UEP had a loss of 6% (2007: 10.7% return). Although this loss resulted in erosion in the real value of the UEP assets, the primary objective of earning the spending allocation plus fees plus inflation over the long-term continues to be met as the aggregate market value exceeds the cumulative endowed contributions indexed for inflation. The US sub-prime mortgage crisis resulted in a contraction of credit and liquidity in the global financial sector. Central banks responded in a coordinated fashion by injecting liquidity on numerous occasions. The prospect of a US housing sector led recession coupled with commodity driven inflation led to fears of stagflation. Investors became concerned that a major slow down in the US economy would have a significant negative impact on the global economy. These concerns together with increased risk aversion resulted in losses for equities in most developed economies. The Morgan Stanley Capital International World Index posted a loss of 13.5% (2007: 14.7% return). This had a negative impact on performance given the UEP’s 50.7% allocation to foreign equities as at March 31, 2008. Collectively the UEP’s managers detracted 1.8% from performance as the UEP’s benchmark posted a loss of 4.2% (2007: 9.9% return). At March 31, 2008 the benchmark was comprised of the following: 20% DEX Bond Universe Index, 10% DEX Real Return Bond Index, 15% S&P/TSX Composite Index and 55% Morgan Stanley Capital International World Index 50% hedged to the Canadian Dollar. The NEIP, comprised of 3 distinct strategies (short-term, mid-term and long-term), recorded an overall loss of 2.8% for the year (2007: 5.6% return). The short-term money market investments had a loss of 3.2% (2007: 4.4% return); this compares unfavorably with the benchmark DEX 91 Day Treasury Bill return of 4.6% (2007: 4.2%) and is primarily attributable to the University’s exposure to third-party asset-backed commercial paper (“ABCP”). In August of 2007 a liquidity crisis for
10
third-party ABCP unfolded. This previously robust market collapsed with almost no warning due to investor concerns about the underlying exposure to US sub-prime mortgage assets in the affected 22 trusts with a value of $32 billion. At the time, the University’s exposure to the affected ABCP was $171.2 million. In addition to this, the University held $38.8 million in bank-sponsored ABCP. All ABCP holdings at the time of acquisition were rated R1 (high), as required by the University’s investment policy. As of March 31, 2008 the University’s holdings of ABCP amounted to $169.7 million. Of this amount, $161.9 million is subject to restructuring under the Montreal Accord, of which $159 million falls under the information statement in respect of the plan of compromise and arrangement (the “Plan”) dated March 20, 2008. The remaining $7.8 million is related to bank-sponsored ABCP, which is subject to separate restructuring negotiations. The Plan will result in the issuance of long-term floating rate notes that match the duration of the underlying assets. Note holders in trusts that are comprised of exclusively traditional assets will receive traditional asset tracking notes. Trusts whose assets are comprised of both synthetic and traditional assets will be consolidated into a master asset vehicle, cross collateralized and supported by a margin funding facility. The master asset vehicle will issue a series of long-term floating rate notes. US sub-prime assets will be excluded from the aforementioned restructuring and ineligible tracking notes will be issued. With the exception of the exposure to US residential mortgages in the ineligible tracking notes, the remaining underlying assets are of high quality and should receive a strong investment grade credit rating. The University has used a discounted cash flow model supplemented by valuation information to arrive at a write-down of $41 million representing 24% of the total value. Of this write-down $22.5 million reflects the fact that a substantial portion of the restructured notes are anticipated to have an interest rate yield that is significantly below that of securities of comparable risk and duration. $4.5 million of the write-down reflects the degree of uncertainty associated with the restructuring process as at March 31, 2008. The remaining write-down of $14 million relates to an impairment of value on the University’s underlying exposure to US residential mortgages of $20.4 million. After the restructuring is complete the long-term floating rate notes will be held in the University’s mid-term bond portfolio. The majority of these notes are anticipated to have a maturity date of December 20, 2016. Although it is expected that an active market for the restructured notes will evolve over time, it is possible that the restructured notes will be held to maturity. A comprehensive long-term cash flow forecast has been prepared and administration is confident that the exposure to ABCP does not represent a liquidity issue for the University and all obligations and commitments will continue to be met. The UEP investments had no exposure to ABCP investments. On April 1, 2007 the University retained the services of an external money market manager to assist with the NEIP’s short-term investment program. This external mandate did not have any exposure to the affected third-party ABCP. As at March 31, 2008 this mandate had been fully implemented. On November 2, 2007, the Board of Governors approved a revised University Funds Investment Policy, in which the credit standards for internally managed short and mid-term funds were significantly enhanced. The high quality mid-term bond portfolio had a return of 6% (2007: 4.5%); this trailed the benchmark DEX Short Term Bond Index return of 6.4% (2007: 4.6%). The long-term portion of the NEIP, which is invested in the UEP, detracted from performance with a loss of 6% (2007: 10.7% return). The University holds a significant equity position in a publicly traded spin-off company (BioMS Medical Corp.), pursuant to a licensing transaction that was completed on December 14, 2000. On January 23, 2008 BioMS announced the successful completion of an exclusive worldwide sub-license agreement with Eli Lilly and Company. As a result of this transaction all remaining contractual restrictions on the University’s equity holdings were removed. The University’s entire equity holding in BioMS Medical Corp. are now recorded at market value. An unrealized capital gain of $11.8 million related to this one time transaction is reflected in investment income. Given the nature of this unrealized gain it has not been included in the calculation of the 2.8% loss for the NEIP.
11
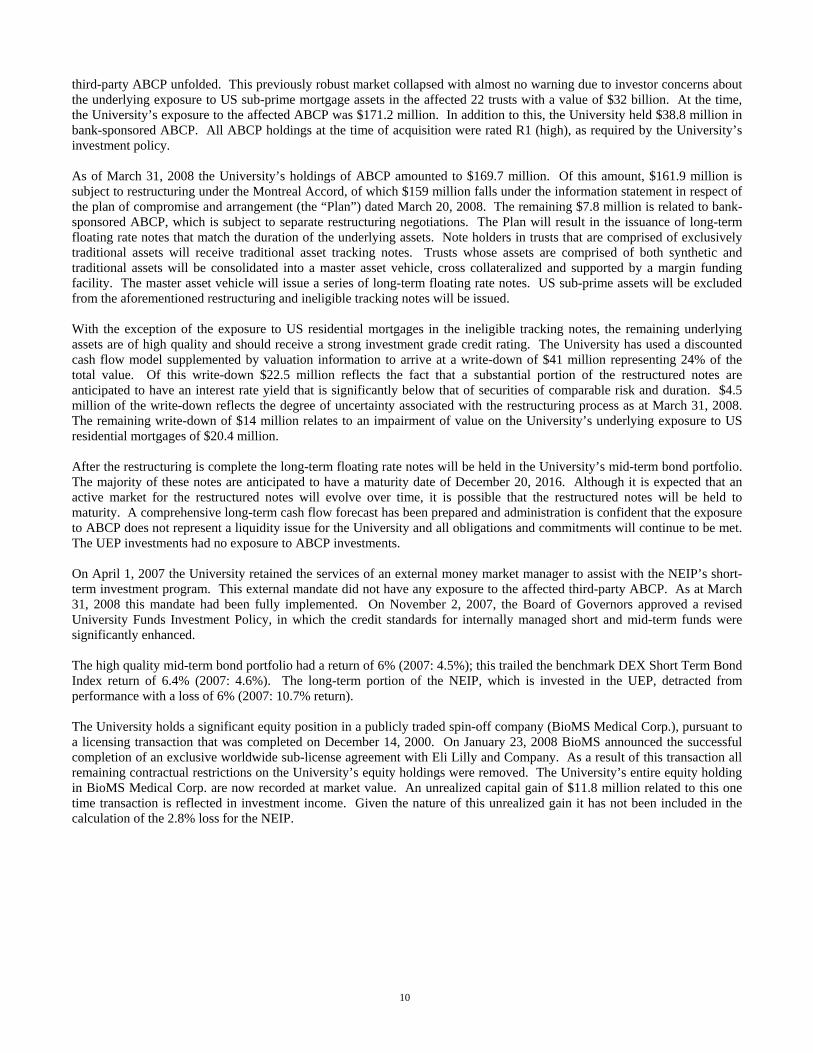
Expense ComparativeFor the year ended March 31
(in millions of dollars)
0
100
200
300
400
500
600
700
800
900
2008 785.7 339.0 73.2 35.0 102.9 2004 574.5 198.9 56.7 32.8 81.2 % of total expense2008 58.8% 25.4% 5.5% 2.6% 7.7%2004 60.9% 21.1% 6.0% 3.5% 8.5%
Salaries & benefits Materials, supplies & maintenance
Scholarships & bursaries Utilities Amortization of
capital assets
Expenses Expenses for 2008 increased by $143.9 million (12.1%) from $1,191.9 million in 2007 to $1,335.8 million in 2008. The main components of this increase are: Salaries expense increased by $66.9 million (11.2%). The collective bargaining process resulted in negotiated salary increases for academic (3.9%) and support (3.9%) staff and, in addition, staff received merit increases. There were also increases in new hires (approximately 650) relating to the increased level of activity. (2008: approx. 10,350 staff, 2007: approx. 9,700 staff). Included in the above staff counts are approximately 1,313 academic staff granted tenure. There were salary expense increases of $40.7 million in the general operating fund, $9.1 million in the research fund and an overall increase of $17.1 million in the remaining funds. The increase in the remaining funds includes an increase due to a change in estimation for the academic staff vacation pay liability in the prior year (the impact was an approximate $8.8 decrease to salary expense in the 2007 year). Benefits expense increased by $17.1 million (16.4%). The increase is primarily due to increased salary costs and staff numbers. There were increases of $11.4 million in the general operating fund, $0.7 million in the research fund and an overall increase of $5.0 million in the remaining funds. The increase in the remaining funds is mainly due to a change in estimation for the academic staff vacation pay liability in the prior year. Materials, supplies and services expense increased by $33.5 million (14.0%) due to increased activity in the operating fund ($12.3), increased research activity ($20.5) and a net increase across all other funds ($0.7). Utilities expense decreased by $0.8 million (2.4%) as a result of lower power and chilled water costs. The University has managed some of its exposure to volatility in the electrical industry by entering into contracts to fix a portion of its electrical costs. Maintenance expense increased by $16.8 million (42.3%). The increase is mainly in the operating fund and is due to increased operating activity and an increase in the provision for a site restoration project ($7.2). Scholarships and bursaries expense increased by $3.5 million (5.1%). This increase was spread throughout a number of initiatives and programs. A variety of scholarship programs received a $1.9 million increase in support from the general operating fund. The remaining $1.6 million increase is primarily due to an increase in research funded scholarships and bursaries. All other areas of expense were comparable to the prior year.
12
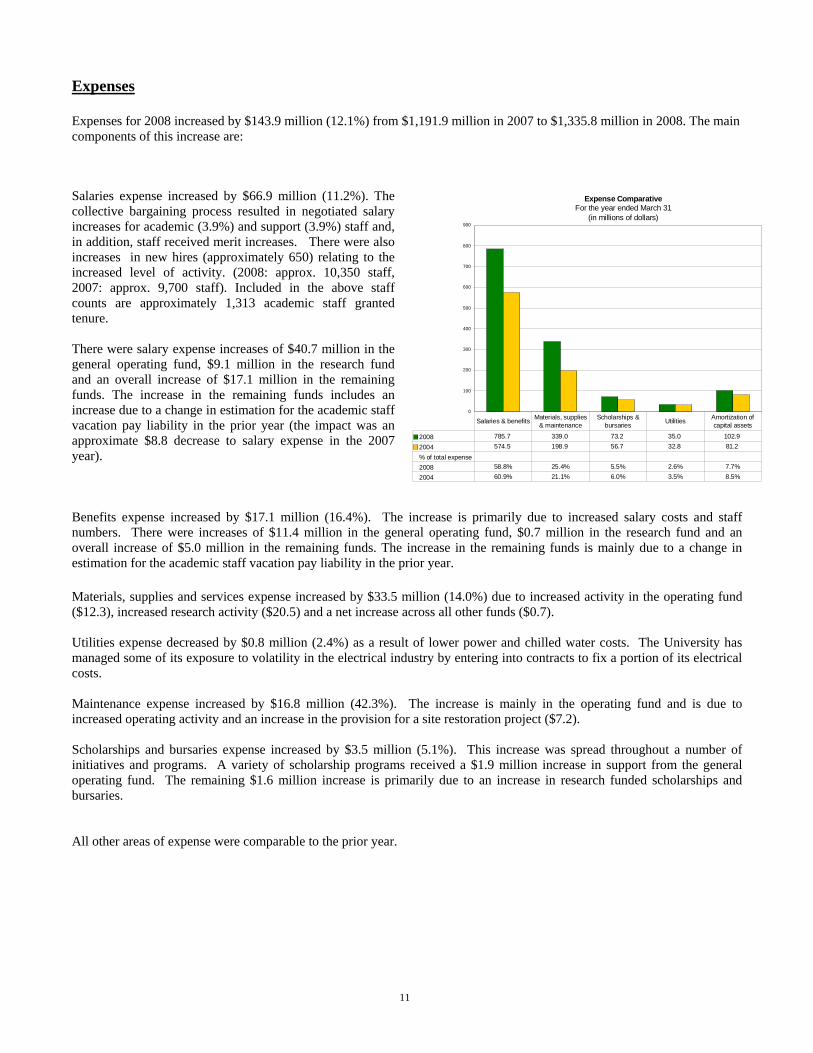
Donations Donations (before deferrals) received in the year totaled $89.3 million as compared to $54.5 million in 2007 and are comprised of: • $29.4 million (2007: $27.3) in expendable donations. • $25.3 million (2007: $23.2) in endowed donations. • $34.6 million (2007: $4.0) in in-kind donations. In-kind
donations include a land donation ($17.4) and a donation of software ($14.0).
In 2008, the University received $5.0 million from the Access to the Future Fund (provincial government matching grant program). The Province also provided $12.8 million in matching funds for the China Institute Endowment, which is recorded as an endowment contribution. These provincial government grants are not included in the $89.3 million of donation funding. Donor pledges outstanding at March 31, 2008 are $89.2 million (2007: $79.4) and are not reflected in the University’s financial statements. These pledges are expected to be honoured over the next several years.
Donations ReceivedFor the year ended March 31
(in millions of dollars)
0
10
20
30
40
50
60
70
80
90
100
2008 2007 2006 2005 2004
In-kind Capital DonationsEndow ed DonationsExpendable Donations
13
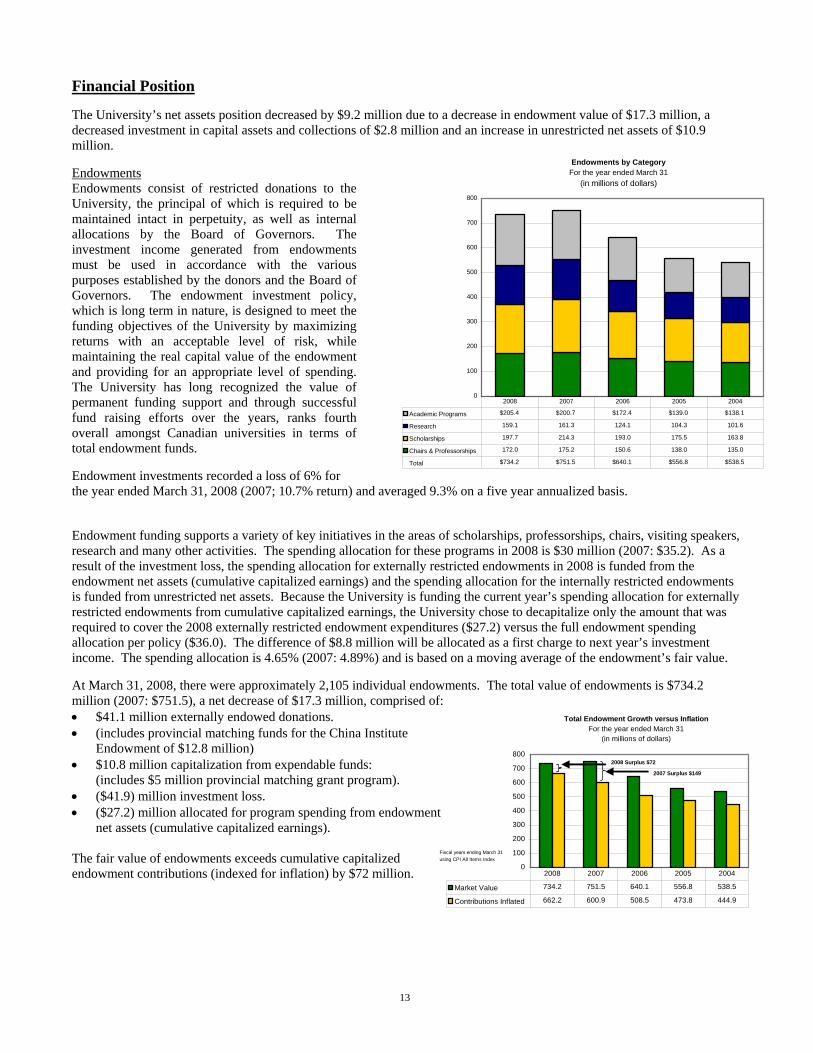
Total Endowment Growth versus InflationFor the year ended March 31
(in millions of dollars)
0
100
200
300
400
500
600
700
800
Market Value 734.2 751.5 640.1 556.8 538.5
Contributions Inflated 662.2 600.9 508.5 473.8 444.9
2008 2007 2006 2005 2004
2008 Surplus $72
2007 Surplus $149
Fiscal years ending March 31 using CPI All Items Index
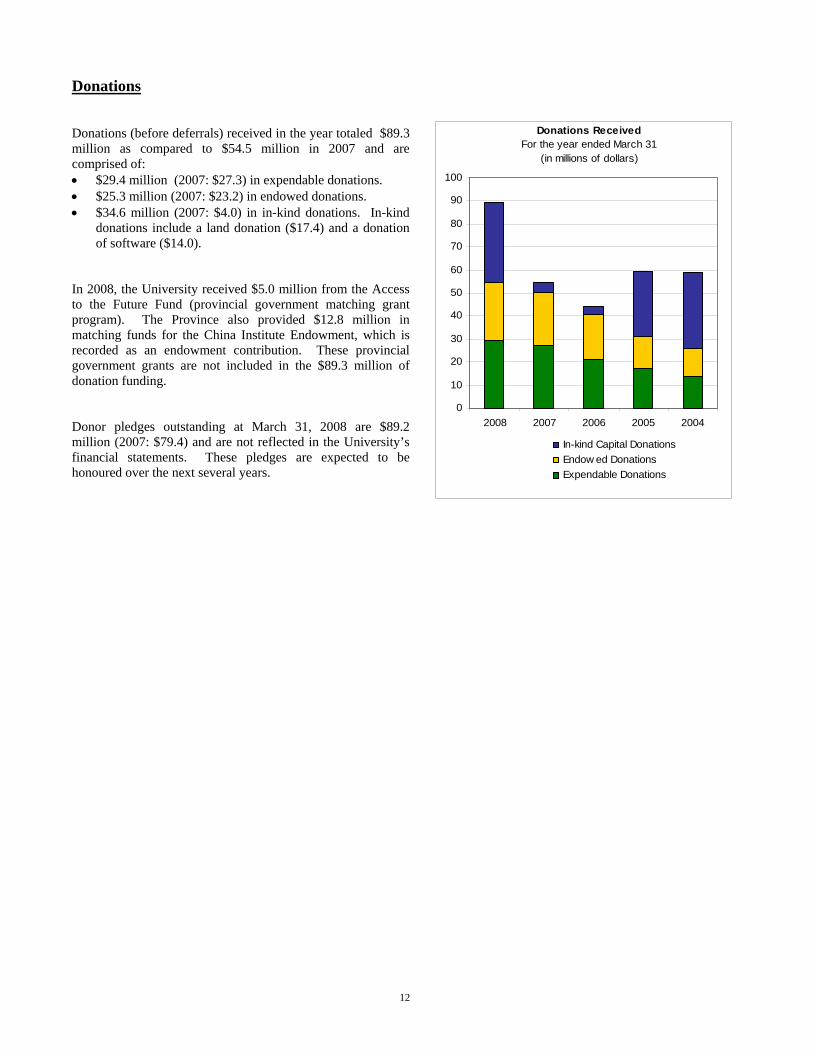
Financial Position The University’s net assets position decreased by $9.2 million due to a decrease in endowment value of $17.3 million, a decreased investment in capital assets and collections of $2.8 million and an increase in unrestricted net assets of $10.9 million. Endowments Endowments consist of restricted donations to the University, the principal of which is required to be maintained intact in perpetuity, as well as internal allocations by the Board of Governors. The investment income generated from endowments must be used in accordance with the various purposes established by the donors and the Board of Governors. The endowment investment policy, which is long term in nature, is designed to meet the funding objectives of the University by maximizing returns with an acceptable level of risk, while maintaining the real capital value of the endowment and providing for an appropriate level of spending. The University has long recognized the value of permanent funding support and through successful fund raising efforts over the years, ranks fourth overall amongst Canadian universities in terms of total endowment funds. Endowment investments recorded a loss of 6% for the year ended March 31, 2008 (2007; 10.7% return) and averaged 9.3% on a five year annualized basis. Endowment funding supports a variety of key initiatives in the areas of scholarships, professorships, chairs, visiting speakers, research and many other activities. The spending allocation for these programs in 2008 is $30 million (2007: $35.2). As a result of the investment loss, the spending allocation for externally restricted endowments in 2008 is funded from the endowment net assets (cumulative capitalized earnings) and the spending allocation for the internally restricted endowments is funded from unrestricted net assets. Because the University is funding the current year’s spending allocation for externally restricted endowments from cumulative capitalized earnings, the University chose to decapitalize only the amount that was required to cover the 2008 externally restricted endowment expenditures ($27.2) versus the full endowment spending allocation per policy ($36.0). The difference of $8.8 million will be allocated as a first charge to next year’s investment income. The spending allocation is 4.65% (2007: 4.89%) and is based on a moving average of the endowment’s fair value. At March 31, 2008, there were approximately 2,105 individual endowments. The total value of endowments is $734.2 million (2007: $751.5), a net decrease of $17.3 million, comprised of: • $41.1 million externally endowed donations. • (includes provincial matching funds for the China Institute
Endowment of $12.8 million) • $10.8 million capitalization from expendable funds:
(includes $5 million provincial matching grant program). • ($41.9) million investment loss. • ($27.2) million allocated for program spending from endowment
net assets (cumulative capitalized earnings). The fair value of endowments exceeds cumulative capitalized endowment contributions (indexed for inflation) by $72 million.
Endowments by CategoryFor the year ended March 31
(in millions of dollars)
0
100
200
300
400
500
600
700
800
Academic Programs $205.4 $200.7 $172.4 $139.0 $138.1
Research 159.1 161.3 124.1 104.3 101.6
Scholarships 197.7 214.3 193.0 175.5 163.8
Chairs & Professorships 172.0 175.2 150.6 138.0 135.0
Total $734.2 $751.5 $640.1 $556.8 $538.5
2008 2007 2006 2005 2004
14
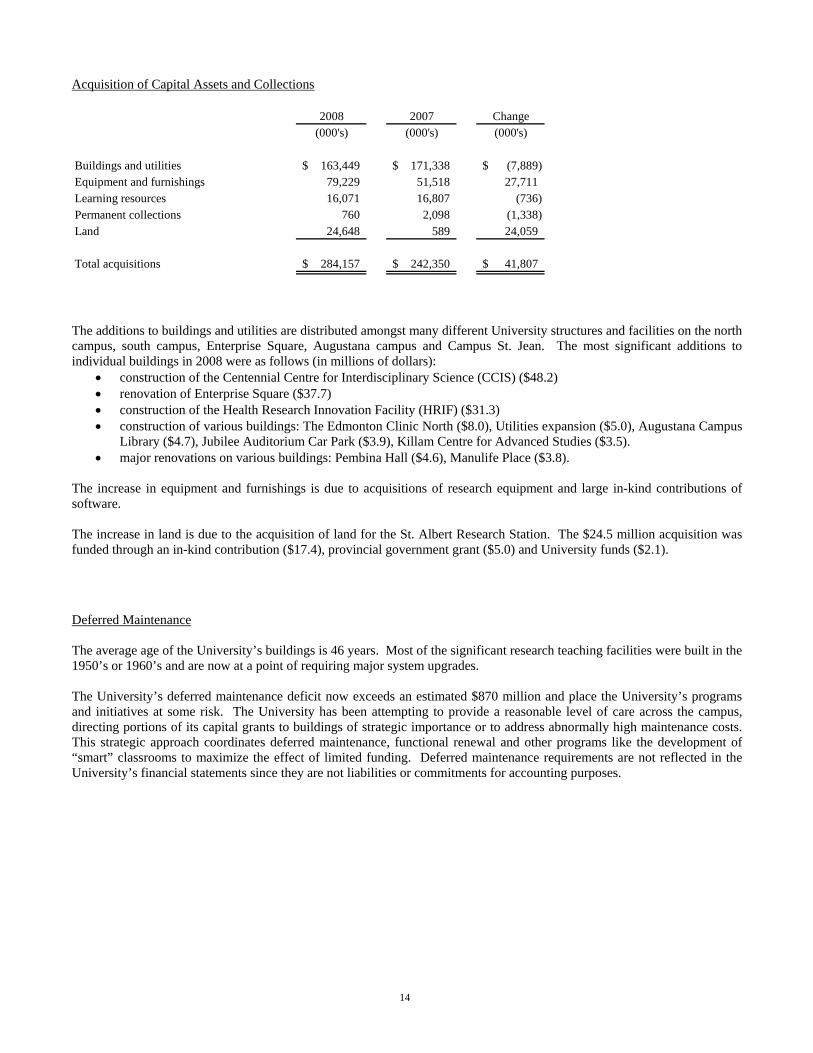
Acquisition of Capital Assets and Collections
2008 2007 Change(000's) (000's) (000's)
Buildings and utilities 163,449$ 171,338$ (7,889)$ Equipment and furnishings 79,229 51,518 27,711 Learning resources 16,071 16,807 (736) Permanent collections 760 2,098 (1,338) Land 24,648 589 24,059
Total acquisitions 284,157$ 242,350$ 41,807$
The additions to buildings and utilities are distributed amongst many different University structures and facilities on the north campus, south campus, Enterprise Square, Augustana campus and Campus St. Jean. The most significant additions to individual buildings in 2008 were as follows (in millions of dollars):
• construction of the Centennial Centre for Interdisciplinary Science (CCIS) ($48.2) • renovation of Enterprise Square ($37.7) • construction of the Health Research Innovation Facility (HRIF) ($31.3) • construction of various buildings: The Edmonton Clinic North ($8.0), Utilities expansion ($5.0), Augustana Campus
Library ($4.7), Jubilee Auditorium Car Park ($3.9), Killam Centre for Advanced Studies ($3.5). • major renovations on various buildings: Pembina Hall ($4.6), Manulife Place ($3.8).
The increase in equipment and furnishings is due to acquisitions of research equipment and large in-kind contributions of software. The increase in land is due to the acquisition of land for the St. Albert Research Station. The $24.5 million acquisition was funded through an in-kind contribution ($17.4), provincial government grant ($5.0) and University funds ($2.1). Deferred Maintenance The average age of the University’s buildings is 46 years. Most of the significant research teaching facilities were built in the 1950’s or 1960’s and are now at a point of requiring major system upgrades. The University’s deferred maintenance deficit now exceeds an estimated $870 million and place the University’s programs and initiatives at some risk. The University has been attempting to provide a reasonable level of care across the campus, directing portions of its capital grants to buildings of strategic importance or to address abnormally high maintenance costs. This strategic approach coordinates deferred maintenance, functional renewal and other programs like the development of “smart” classrooms to maximize the effect of limited funding. Deferred maintenance requirements are not reflected in the University’s financial statements since they are not liabilities or commitments for accounting purposes.
15
Unfunded pension liability The University participates with other employers in the Universities Academic Pension Plan (UAPP) to provide pensions for academic staff members. There is an acturial deficiency in the plan, and the University has estimated its share of the deficiency (under CICA 3461: Employee Future Benefits) by prorating the total employers’ share by the University’s percentage of the total payroll costs of the plan. The University’s estimated share of the unfunded UAPP deficiency, given significant measurement uncertainty in the methodology and assumptions used, is approximately $175 million.
The University has not recorded its share of the unfunded actuarial deficiency in its financial statements, as the Universities are still working toward an agreement on a reasonable basis to calculate each University’s share of the liability. In addition, proposed changes to the plan may significantly impact the UAPP liability. In the upcoming year, the University of Alberta will work with the other Universities and the Ministry of Advanced Education and Technology to determine the appropriate accounting treatment for recording the UAPP liability.
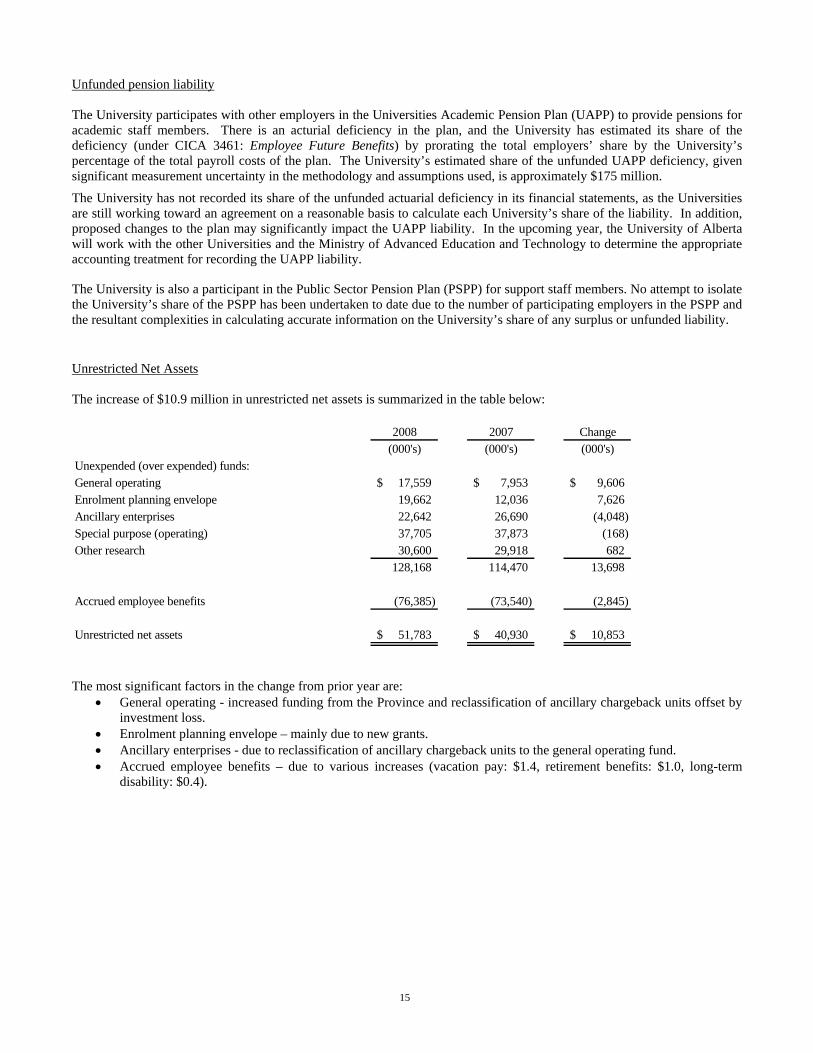
The University is also a participant in the Public Sector Pension Plan (PSPP) for support staff members. No attempt to isolate the University’s share of the PSPP has been undertaken to date due to the number of participating employers in the PSPP and the resultant complexities in calculating accurate information on the University’s share of any surplus or unfunded liability. Unrestricted Net Assets The increase of $10.9 million in unrestricted net assets is summarized in the table below:
2008 2007 Change(000's) (000's) (000's)
Unexpended (over expended) funds:General operating 17,559$ 7,953$ 9,606$ Enrolment planning envelope 19,662 12,036 7,626Ancillary enterprises 22,642 26,690 (4,048)Special purpose (operating) 37,705 37,873 (168)Other research 30,600 29,918 682
128,168 114,470 13,698
Accrued employee benefits (76,385) (73,540) (2,845)
Unrestricted net assets 51,783$ 40,930$ 10,853$
The most significant factors in the change from prior year are:
• General operating - increased funding from the Province and reclassification of ancillary chargeback units offset by investment loss.
• Enrolment planning envelope – mainly due to new grants. • Ancillary enterprises - due to reclassification of ancillary chargeback units to the general operating fund. • Accrued employee benefits – due to various increases (vacation pay: $1.4, retirement benefits: $1.0, long-term
disability: $0.4).
UNIVERSITY OF ALBERTA STATEMENT OF ADMINISTRATIVE RESPONSIBILITY
FOR FINANCIAL REPORTING
The administration of the University is responsible for the preparation and for the integrity and objectivity of the accompanying financial statements and the notes thereto. The administration believes that the financial statements present fairly the University's financial position as at March 31, 2008 and the results of its operations for the year then ended.
The financial statements have been prepared in accordance with generally accepted accounting principles. Where alternative accounting methods exist, those deemed most appropriate in the circumstances have been chosen. Financial statements are not precise, since they include certain amounts based on estimates and judgments. Such amounts have been determined on a reasonable basis in order to ensure that the financial statements are presented fairly in all material respects.
In fulfilling its responsibilities and recognizing the limits inherent in all systems, the administration has developed and maintains a system of internal control designed to provide reasonable assurance that University assets are safeguarded from loss and that the accounting records are a reliable basis for the preparation of financial statements. The integrity of internal controls is reviewed on an ongoing basis by the Internal Audit Department.
The Board of Governors carries out its responsibility for review of the financial statements principally through its Audit Committee. The majority of the members of the Committee are not officers or employees of the University. This committee meets regularly with administration and with external and internal auditors to discuss the results of audit examinations and financial reporting matters. The external and internal auditors have full access to the Board Audit Committee with and without the presence of the administration. The Board of Governors of the University of Alberta has approved the financial statements.
The financial statements for the year ended March 31, 2008 have been audited and reported on by the Auditor General for the Province of Alberta whose report outlines the scope of his audit and presents his opinion on the financial statements.
Original Signed by Indira Samarasekera Original Signed by Phyllis Clark
Indira V. Samarasekera, OC Phyllis Clark President Vice-President (Finance & Administration) and
Chief Financial Officer May 28, 2008
Auditor’s Report
To the Board of Governors of the University of Alberta
I have audited the statement of financial position of the University of Alberta as at March 31, 2008 and the statements of operations and change in unrestricted net assets, changes in net assets and cash flows for the year then ended. These financial statements are the responsibility of the University’s management. My responsibility is to express an opinion on these financial statements based on my audit.
I conducted my audit in accordance with Canadian generally accepted auditing standards. Those standards require that I plan and perform an audit to obtain reasonable assurance whether the financial statements are free of material misstatement. An audit includes examining, on a test basis, evidence supporting the amounts and disclosures in the financial statements. An audit also includes assessing the accounting principles used and significant estimates made by management, as well as evaluating the overall financial statement presentation.
In my opinion, these financial statements present fairly, in all material respects, the financial position of the University as at March 31, 2008 and the results of its operations and its cash flows for the year then ended in accordance with Canadian generally accepted accounting principles.
I draw your attention to Note 8 to the financial statements that describes the unfunded liability of the Universities Academic Pension Plan which may affect the University’s future financial statements. Our opinion is not qualified in respect of this matter.
“The official version of the Report of the Auditor General, and the information the Report covers, is in printed form.”
(Original Signed by Fred Dunn)
FCA Auditor General
Edmonton, Alberta May 28, 2008
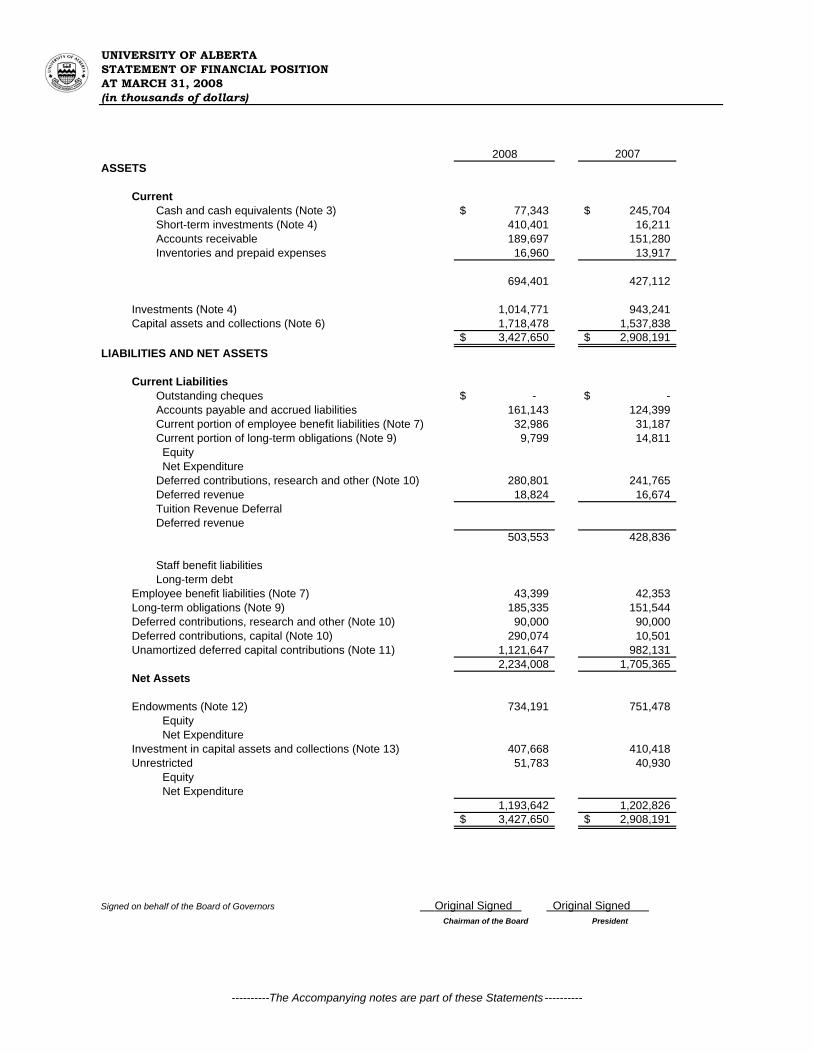
UNIVERSITY OF ALBERTASTATEMENT OF FINANCIAL POSITIONAT MARCH 31, 2008(in thousands of dollars)
2008 2007ASSETS
CurrentCash and cash equivalents (Note 3) 77,343$ 245,704$ Short-term investments (Note 4) 410,401 16,211 Accounts receivable 189,697 151,280 Inventories and prepaid expenses 16,960 13,917
694,401 427,112
Investments (Note 4) 1,014,771 943,241 Capital assets and collections (Note 6) 1,718,478 1,537,838
3,427,650$ 2,908,191$ LIABILITIES AND NET ASSETS
Current LiabilitiesOutstanding cheques -$ -$ Accounts payable and accrued liabilities 161,143 124,399 Current portion of employee benefit liabilities (Note 7) 32,986 31,187 Current portion of long-term obligations (Note 9) 9,799 14,811 Equity Net ExpenditureDeferred contributions, research and other (Note 10) 280,801 241,765 Deferred revenue 18,824 16,674 Tuition Revenue DeferralDeferred revenue
503,553 428,836
Staff benefit liabilitiesLong-term debt
Employee benefit liabilities (Note 7) 43,399 42,353 Long-term obligations (Note 9) 185,335 151,544 Deferred contributions, research and other (Note 10) 90,000 90,000 Deferred contributions, capital (Note 10) 290,074 10,501 Unamortized deferred capital contributions (Note 11) 1,121,647 982,131 2,234,008 1,705,365 Net Assets
Endowments (Note 12) 734,191 751,478 Equity Net Expenditure
Investment in capital assets and collections (Note 13) 407,668 410,418 Unrestricted 51,783 40,930
Equity Net Expenditure
1,193,642 1,202,826 3,427,650$ 2,908,191$
Signed on behalf of the Board of Governors Original Signed Original Signed Chairman of the Board President
----------The Accompanying notes are part of these Statements ----------
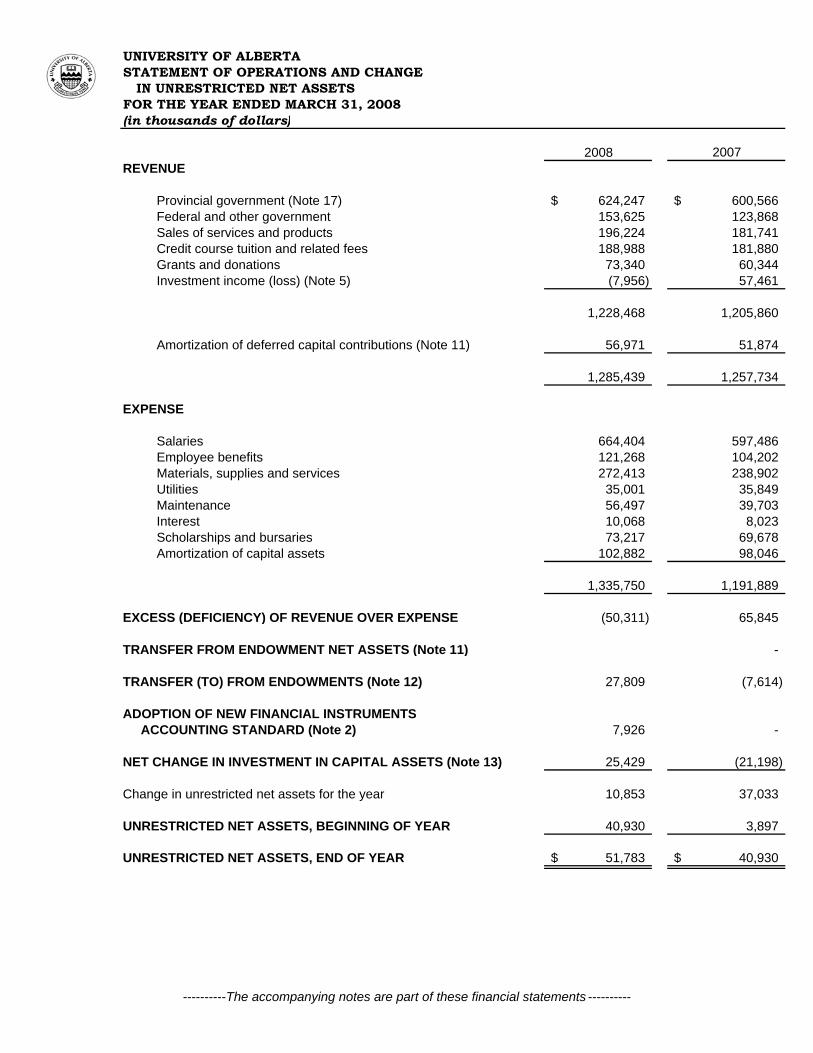
UNIVERSITY OF ALBERTASTATEMENT OF OPERATIONS AND CHANGE IN UNRESTRICTED NET ASSETSFOR THE YEAR ENDED MARCH 31, 2008(in thousands of dollars)
2008 2007REVENUE
Provincial government (Note 17) 624,247$ 600,566$ Federal and other government 153,625 123,868 Sales of services and products 196,224 181,741 Credit course tuition and related fees 188,988 181,880 Grants and donations 73,340 60,344 Investment income (loss) (Note 5) (7,956) 57,461
1,228,468 1,205,860
Amortization of deferred capital contributions (Note 11) 56,971 51,874
1,285,439 1,257,734
EXPENSE
Salaries 664,404 597,486 Employee benefits 121,268 104,202 Materials, supplies and services 272,413 238,902 Utilities 35,001 35,849 Maintenance 56,497 39,703 Interest 10,068 8,023 Scholarships and bursaries 73,217 69,678 Amortization of capital assets 102,882 98,046
1,335,750 1,191,889
EXCESS (DEFICIENCY) OF REVENUE OVER EXPENSE (50,311) 65,845
TRANSFER FROM ENDOWMENT NET ASSETS (Note 11) -
TRANSFER (TO) FROM ENDOWMENTS (Note 12) 27,809 (7,614)
ADOPTION OF NEW FINANCIAL INSTRUMENTS ACCOUNTING STANDARD (Note 2) 7,926 -
NET CHANGE IN INVESTMENT IN CAPITAL ASSETS (Note 13) 25,429 (21,198)
Change in unrestricted net assets for the year 10,853 37,033
UNRESTRICTED NET ASSETS, BEGINNING OF YEAR 40,930 3,897
UNRESTRICTED NET ASSETS, END OF YEAR 51,783$ 40,930$
----------The accompanying notes are part of these financial statements ----------
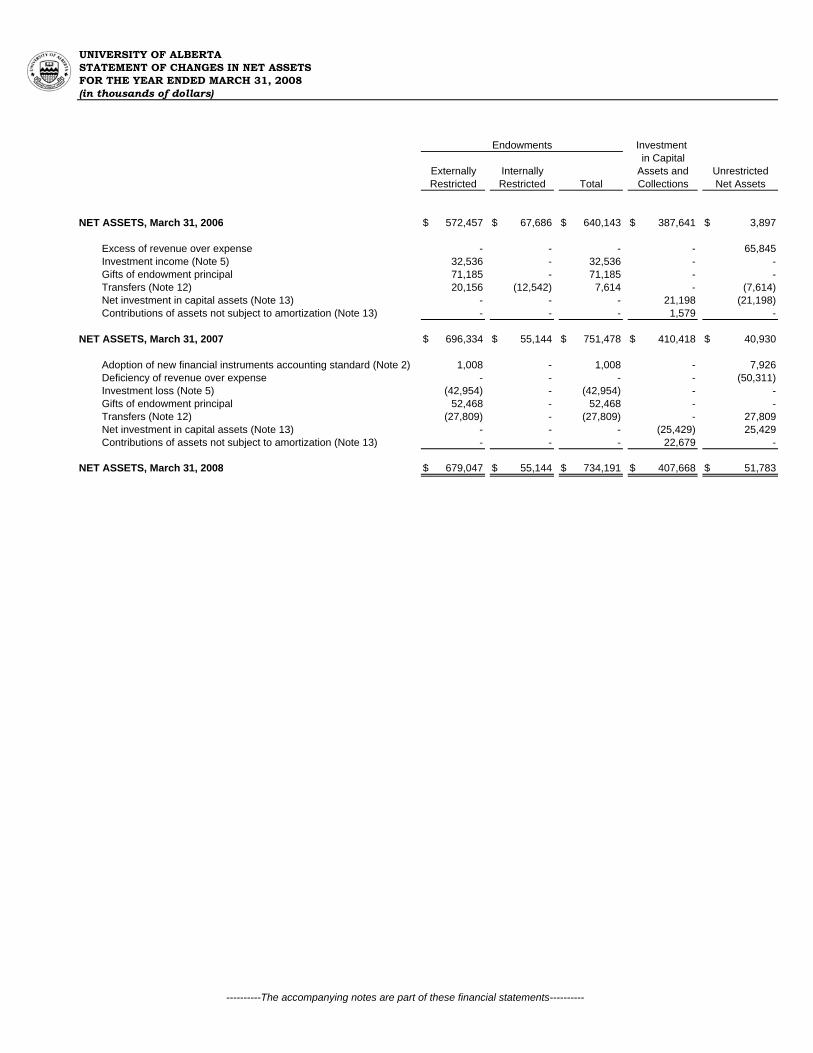
UNIVERSITY OF ALBERTASTATEMENT OF CHANGES IN NET ASSETSFOR THE YEAR ENDED MARCH 31, 2008(in thousands of dollars)
Endowments Investment in Capital
Externally Internally Assets and UnrestrictedRestricted Restricted Total Collections Net Assets
NET ASSETS, March 31, 2006 572,457$ 67,686$ 640,143$ 387,641$ 3,897$
Excess of revenue over expense - - - - 65,845Investment income (Note 5) 32,536 - 32,536 - - Gifts of endowment principal 71,185 - 71,185 - - Transfers (Note 12) 20,156 (12,542) 7,614 - (7,614)Net investment in capital assets (Note 13) - - - 21,198 (21,198)Contributions of assets not subject to amortization (Note 13) - - - 1,579 -
NET ASSETS, March 31, 2007 696,334$ 55,144$ 751,478$ 410,418$ 40,930$
Adoption of new financial instruments accounting standard (Note 2) 1,008 - 1,008 - 7,926Deficiency of revenue over expense - - - - (50,311)Investment loss (Note 5) (42,954) - (42,954) - - Gifts of endowment principal 52,468 - 52,468 - - Transfers (Note 12) (27,809) - (27,809) - 27,809Net investment in capital assets (Note 13) - - - (25,429) 25,429Contributions of assets not subject to amortization (Note 13) - - - 22,679 -
NET ASSETS, March 31, 2008 679,047$ 55,144$ 734,191$ 407,668$ 51,783$
----------The accompanying notes are part of these financial statements----------
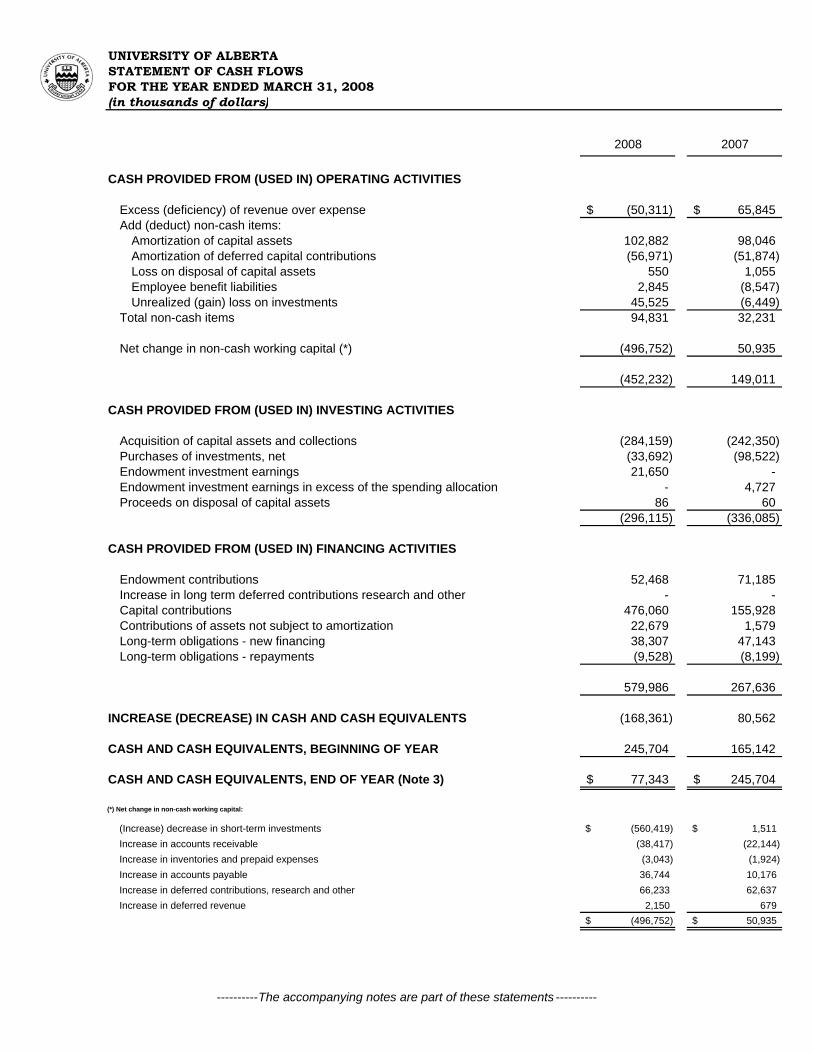
UNIVERSITY OF ALBERTASTATEMENT OF CASH FLOWS FOR THE YEAR ENDED MARCH 31, 2008(in thousands of dollars)
2008 2007
CASH PROVIDED FROM (USED IN) OPERATING ACTIVITIES
Excess (deficiency) of revenue over expense (50,311)$ 65,845$ Add (deduct) non-cash items:
Amortization of capital assets 102,882 98,046 Amortization of deferred capital contributions (56,971) (51,874) Loss on disposal of capital assets 550 1,055 Employee benefit liabilities 2,845 (8,547) Unrealized (gain) loss on investments 45,525 (6,449)
Total non-cash items 94,831 32,231
Net change in non-cash working capital (*) (496,752) 50,935
(452,232) 149,011
CASH PROVIDED FROM (USED IN) INVESTING ACTIVITIES
Acquisition of capital assets and collections (284,159) (242,350) Purchases of investments, net (33,692) (98,522) Endowment investment earnings 21,650 - Endowment investment earnings in excess of the spending allocation - 4,727 Proceeds on disposal of capital assets 86 60
(296,115) (336,085)
CASH PROVIDED FROM (USED IN) FINANCING ACTIVITIES
Endowment contributions 52,468 71,185 Increase in long term deferred contributions research and other - - Capital contributions 476,060 155,928 Contributions of assets not subject to amortization 22,679 1,579 Long-term obligations - new financing 38,307 47,143 Long-term obligations - repayments (9,528) (8,199)
579,986 267,636
INCREASE (DECREASE) IN CASH AND CASH EQUIVALENTS (168,361) 80,562
CASH AND CASH EQUIVALENTS, BEGINNING OF YEAR 245,704 165,142
CASH AND CASH EQUIVALENTS, END OF YEAR (Note 3) 77,343$ 245,704$
(*) Net change in non-cash working capital:
(Increase) decrease in short-term investments (560,419)$ 1,511$ Increase in accounts receivable (38,417) (22,144) Increase in inventories and prepaid expenses (3,043) (1,924) Increase in accounts payable 36,744 10,176 Increase in deferred contributions, research and other 66,233 62,637 Increase in deferred revenue 2,150 679
(496,752)$ 50,935$
----------The accompanying notes are part of these statements ----------
NOTES TO THE FINANCIAL STATEMENTS (in thousands of dollars) MARCH 31, 2008
22
1. Authority and purpose
The University of Alberta operates under the Post-Secondary Learning Act of the Province of Alberta to provide post-secondary and graduate education and to engage in research and public service. The University is a registered charity, and under section 149 of the Income Tax Act of Canada, is exempt from the payment of income tax.
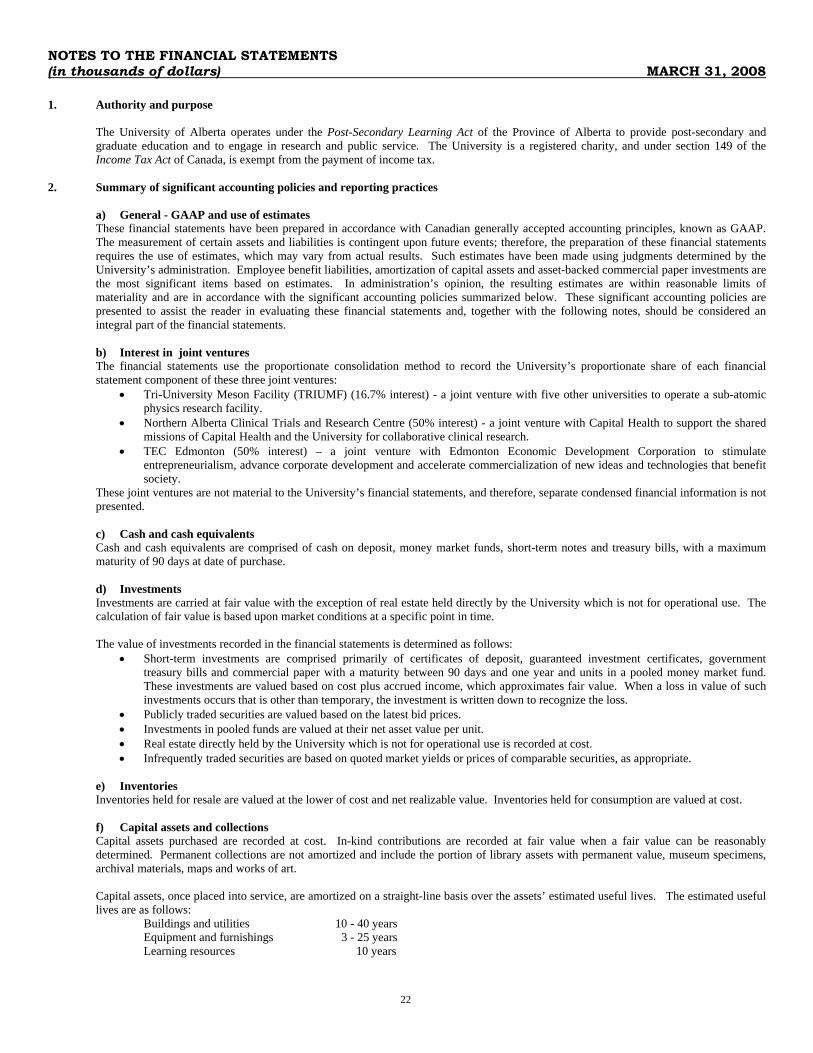
2. Summary of significant accounting policies and reporting practices
a) General - GAAP and use of estimates These financial statements have been prepared in accordance with Canadian generally accepted accounting principles, known as GAAP. The measurement of certain assets and liabilities is contingent upon future events; therefore, the preparation of these financial statements requires the use of estimates, which may vary from actual results. Such estimates have been made using judgments determined by the University’s administration. Employee benefit liabilities, amortization of capital assets and asset-backed commercial paper investments are the most significant items based on estimates. In administration’s opinion, the resulting estimates are within reasonable limits of materiality and are in accordance with the significant accounting policies summarized below. These significant accounting policies are presented to assist the reader in evaluating these financial statements and, together with the following notes, should be considered an integral part of the financial statements.
b) Interest in joint ventures The financial statements use the proportionate consolidation method to record the University’s proportionate share of each financial statement component of these three joint ventures:
• Tri-University Meson Facility (TRIUMF) (16.7% interest) - a joint venture with five other universities to operate a sub-atomic physics research facility.
• Northern Alberta Clinical Trials and Research Centre (50% interest) - a joint venture with Capital Health to support the shared missions of Capital Health and the University for collaborative clinical research.
• TEC Edmonton (50% interest) – a joint venture with Edmonton Economic Development Corporation to stimulate entrepreneurialism, advance corporate development and accelerate commercialization of new ideas and technologies that benefit society.
These joint ventures are not material to the University’s financial statements, and therefore, separate condensed financial information is not presented.
c) Cash and cash equivalents Cash and cash equivalents are comprised of cash on deposit, money market funds, short-term notes and treasury bills, with a maximum maturity of 90 days at date of purchase. d) Investments Investments are carried at fair value with the exception of real estate held directly by the University which is not for operational use. The calculation of fair value is based upon market conditions at a specific point in time. The value of investments recorded in the financial statements is determined as follows:
• Short-term investments are comprised primarily of certificates of deposit, guaranteed investment certificates, government treasury bills and commercial paper with a maturity between 90 days and one year and units in a pooled money market fund. These investments are valued based on cost plus accrued income, which approximates fair value. When a loss in value of such investments occurs that is other than temporary, the investment is written down to recognize the loss.
• Publicly traded securities are valued based on the latest bid prices. • Investments in pooled funds are valued at their net asset value per unit. • Real estate directly held by the University which is not for operational use is recorded at cost. • Infrequently traded securities are based on quoted market yields or prices of comparable securities, as appropriate.
e) Inventories
Inventories held for resale are valued at the lower of cost and net realizable value. Inventories held for consumption are valued at cost. f) Capital assets and collections
Capital assets purchased are recorded at cost. In-kind contributions are recorded at fair value when a fair value can be reasonably determined. Permanent collections are not amortized and include the portion of library assets with permanent value, museum specimens, archival materials, maps and works of art. Capital assets, once placed into service, are amortized on a straight-line basis over the assets’ estimated useful lives. The estimated useful lives are as follows: Buildings and utilities 10 - 40 years Equipment and furnishings 3 - 25 years Learning resources 10 years
NOTES TO THE FINANCIAL STATEMENTS (in thousands of dollars) MARCH 31, 2008
23
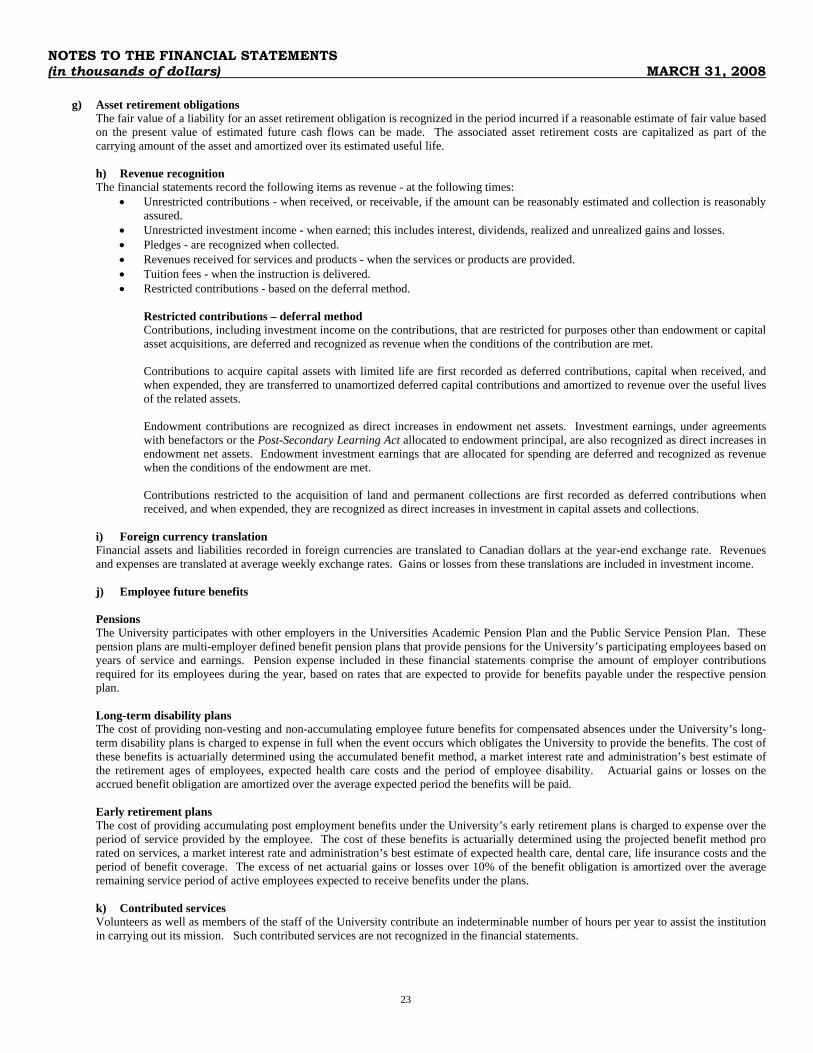
g) Asset retirement obligations The fair value of a liability for an asset retirement obligation is recognized in the period incurred if a reasonable estimate of fair value based on the present value of estimated future cash flows can be made. The associated asset retirement costs are capitalized as part of the carrying amount of the asset and amortized over its estimated useful life.
h) Revenue recognition The financial statements record the following items as revenue - at the following times:
• Unrestricted contributions - when received, or receivable, if the amount can be reasonably estimated and collection is reasonably assured.
• Unrestricted investment income - when earned; this includes interest, dividends, realized and unrealized gains and losses. • Pledges - are recognized when collected. • Revenues received for services and products - when the services or products are provided. • Tuition fees - when the instruction is delivered. • Restricted contributions - based on the deferral method.
Restricted contributions – deferral method Contributions, including investment income on the contributions, that are restricted for purposes other than endowment or capital asset acquisitions, are deferred and recognized as revenue when the conditions of the contribution are met. Contributions to acquire capital assets with limited life are first recorded as deferred contributions, capital when received, and when expended, they are transferred to unamortized deferred capital contributions and amortized to revenue over the useful lives of the related assets. Endowment contributions are recognized as direct increases in endowment net assets. Investment earnings, under agreements with benefactors or the Post-Secondary Learning Act allocated to endowment principal, are also recognized as direct increases in endowment net assets. Endowment investment earnings that are allocated for spending are deferred and recognized as revenue when the conditions of the endowment are met. Contributions restricted to the acquisition of land and permanent collections are first recorded as deferred contributions when received, and when expended, they are recognized as direct increases in investment in capital assets and collections.
i) Foreign currency translation Financial assets and liabilities recorded in foreign currencies are translated to Canadian dollars at the year-end exchange rate. Revenues and expenses are translated at average weekly exchange rates. Gains or losses from these translations are included in investment income. j) Employee future benefits Pensions The University participates with other employers in the Universities Academic Pension Plan and the Public Service Pension Plan. These pension plans are multi-employer defined benefit pension plans that provide pensions for the University’s participating employees based on years of service and earnings. Pension expense included in these financial statements comprise the amount of employer contributions required for its employees during the year, based on rates that are expected to provide for benefits payable under the respective pension plan. Long-term disability plans The cost of providing non-vesting and non-accumulating employee future benefits for compensated absences under the University’s long-term disability plans is charged to expense in full when the event occurs which obligates the University to provide the benefits. The cost of these benefits is actuarially determined using the accumulated benefit method, a market interest rate and administration’s best estimate of the retirement ages of employees, expected health care costs and the period of employee disability. Actuarial gains or losses on the accrued benefit obligation are amortized over the average expected period the benefits will be paid. Early retirement plans The cost of providing accumulating post employment benefits under the University’s early retirement plans is charged to expense over the period of service provided by the employee. The cost of these benefits is actuarially determined using the projected benefit method pro rated on services, a market interest rate and administration’s best estimate of expected health care, dental care, life insurance costs and the period of benefit coverage. The excess of net actuarial gains or losses over 10% of the benefit obligation is amortized over the average remaining service period of active employees expected to receive benefits under the plans. k) Contributed services Volunteers as well as members of the staff of the University contribute an indeterminable number of hours per year to assist the institution in carrying out its mission. Such contributed services are not recognized in the financial statements.
NOTES TO THE FINANCIAL STATEMENTS (in thousands of dollars) MARCH 31, 2008
24
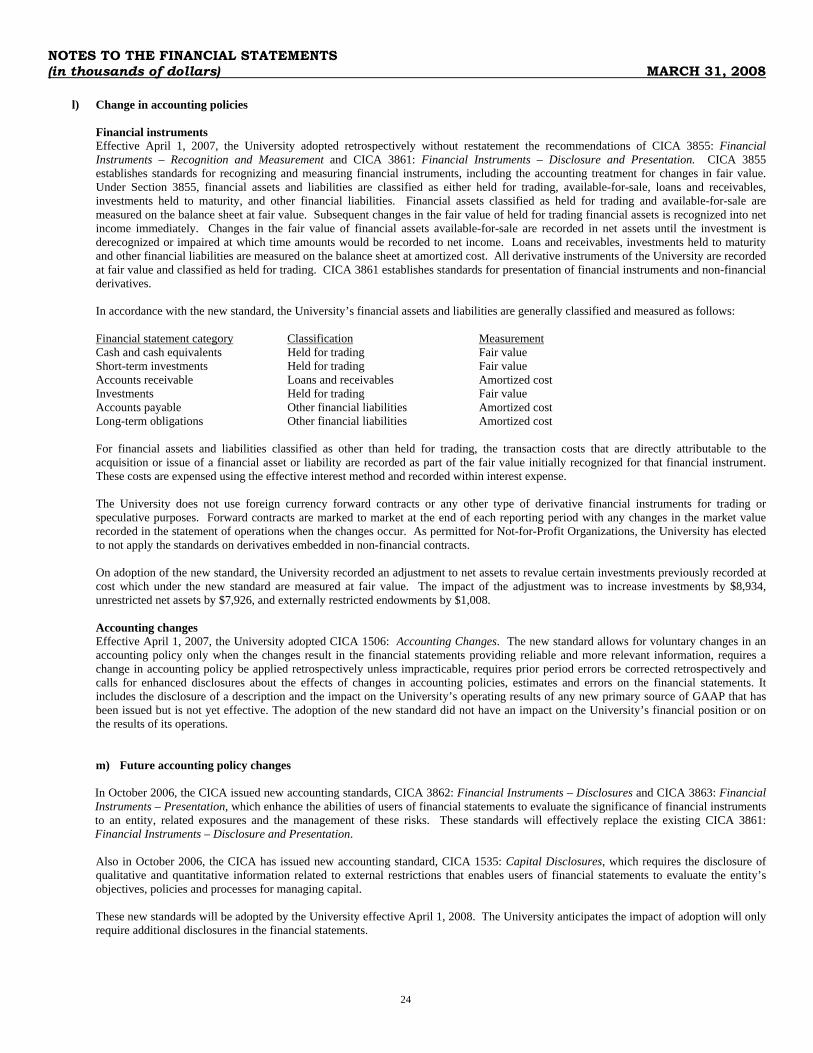
l) Change in accounting policies Financial instruments Effective April 1, 2007, the University adopted retrospectively without restatement the recommendations of CICA 3855: Financial Instruments – Recognition and Measurement and CICA 3861: Financial Instruments – Disclosure and Presentation. CICA 3855 establishes standards for recognizing and measuring financial instruments, including the accounting treatment for changes in fair value. Under Section 3855, financial assets and liabilities are classified as either held for trading, available-for-sale, loans and receivables, investments held to maturity, and other financial liabilities. Financial assets classified as held for trading and available-for-sale are measured on the balance sheet at fair value. Subsequent changes in the fair value of held for trading financial assets is recognized into net income immediately. Changes in the fair value of financial assets available-for-sale are recorded in net assets until the investment is derecognized or impaired at which time amounts would be recorded to net income. Loans and receivables, investments held to maturity and other financial liabilities are measured on the balance sheet at amortized cost. All derivative instruments of the University are recorded at fair value and classified as held for trading. CICA 3861 establishes standards for presentation of financial instruments and non-financial derivatives. In accordance with the new standard, the University’s financial assets and liabilities are generally classified and measured as follows: Financial statement category Classification Measurement Cash and cash equivalents Held for trading Fair value Short-term investments Held for trading Fair value Accounts receivable Loans and receivables Amortized cost Investments Held for trading Fair value Accounts payable Other financial liabilities Amortized cost Long-term obligations Other financial liabilities Amortized cost For financial assets and liabilities classified as other than held for trading, the transaction costs that are directly attributable to the acquisition or issue of a financial asset or liability are recorded as part of the fair value initially recognized for that financial instrument. These costs are expensed using the effective interest method and recorded within interest expense. The University does not use foreign currency forward contracts or any other type of derivative financial instruments for trading or speculative purposes. Forward contracts are marked to market at the end of each reporting period with any changes in the market value recorded in the statement of operations when the changes occur. As permitted for Not-for-Profit Organizations, the University has elected to not apply the standards on derivatives embedded in non-financial contracts. On adoption of the new standard, the University recorded an adjustment to net assets to revalue certain investments previously recorded at cost which under the new standard are measured at fair value. The impact of the adjustment was to increase investments by $8,934, unrestricted net assets by $7,926, and externally restricted endowments by $1,008. Accounting changes Effective April 1, 2007, the University adopted CICA 1506: Accounting Changes. The new standard allows for voluntary changes in an accounting policy only when the changes result in the financial statements providing reliable and more relevant information, requires a change in accounting policy be applied retrospectively unless impracticable, requires prior period errors be corrected retrospectively and calls for enhanced disclosures about the effects of changes in accounting policies, estimates and errors on the financial statements. It includes the disclosure of a description and the impact on the University’s operating results of any new primary source of GAAP that has been issued but is not yet effective. The adoption of the new standard did not have an impact on the University’s financial position or on the results of its operations. m) Future accounting policy changes In October 2006, the CICA issued new accounting standards, CICA 3862: Financial Instruments – Disclosures and CICA 3863: Financial Instruments – Presentation, which enhance the abilities of users of financial statements to evaluate the significance of financial instruments to an entity, related exposures and the management of these risks. These standards will effectively replace the existing CICA 3861: Financial Instruments – Disclosure and Presentation. Also in October 2006, the CICA has issued new accounting standard, CICA 1535: Capital Disclosures, which requires the disclosure of qualitative and quantitative information related to external restrictions that enables users of financial statements to evaluate the entity’s objectives, policies and processes for managing capital. These new standards will be adopted by the University effective April 1, 2008. The University anticipates the impact of adoption will only require additional disclosures in the financial statements.
NOTES TO THE FINANCIAL STATEMENTS (in thousands of dollars) MARCH 31, 2008
25
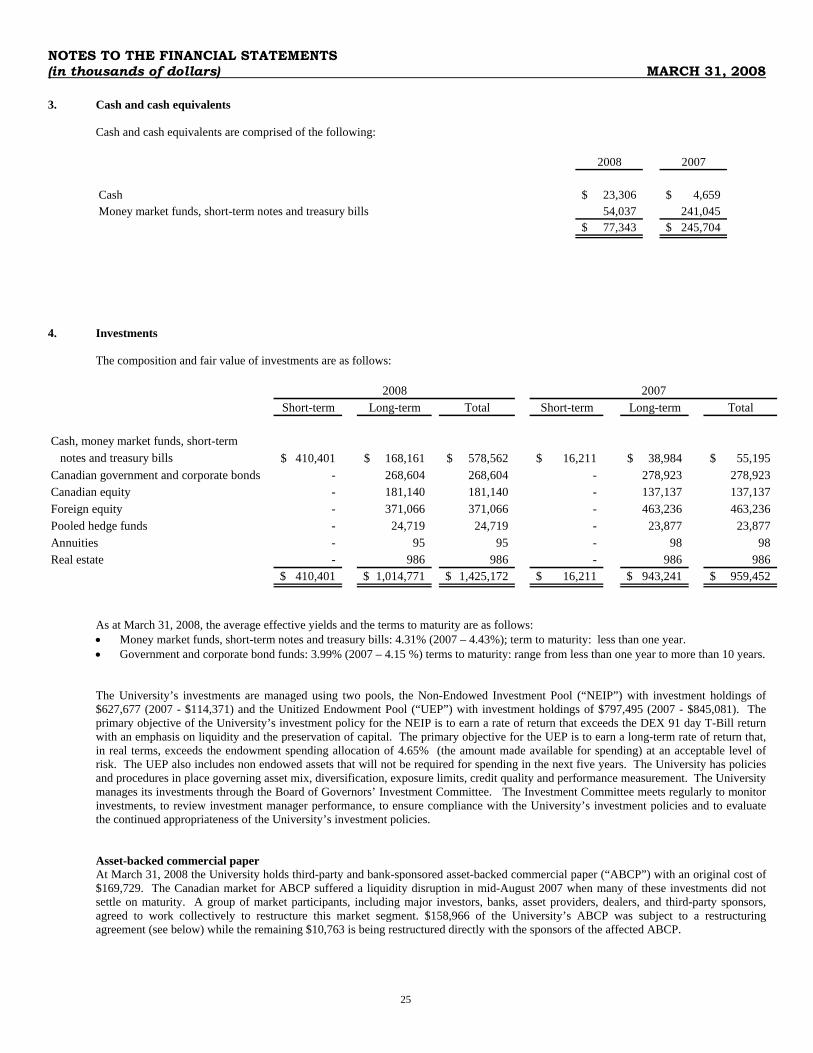
3. Cash and cash equivalents
Cash and cash equivalents are comprised of the following:
2008 2007
Cash 23,306$ 4,659$ Money market funds, short-term notes and treasury bills 54,037 241,045
77,343$ 245,704$
4. Investments
The composition and fair value of investments are as follows:
Short-term Long-term Total Short-term Long-term Total
Cash, money market funds, short-term notes and treasury bills 410,401$ 168,161$ 578,562$ 16,211$ 38,984$ 55,195$ Canadian government and corporate bonds - 268,604 268,604 - 278,923 278,923 Canadian equity - 181,140 181,140 - 137,137 137,137 Foreign equity - 371,066 371,066 - 463,236 463,236 Pooled hedge funds - 24,719 24,719 - 23,877 23,877 Annuities - 95 95 - 98 98 Real estate - 986 986 - 986 986
410,401$ 1,014,771$ 1,425,172$ 16,211$ 943,241$ 959,452$
2008 2007
As at March 31, 2008, the average effective yields and the terms to maturity are as follows: • Money market funds, short-term notes and treasury bills: 4.31% (2007 – 4.43%); term to maturity: less than one year. • Government and corporate bond funds: 3.99% (2007 – 4.15 %) terms to maturity: range from less than one year to more than 10 years. The University’s investments are managed using two pools, the Non-Endowed Investment Pool (“NEIP”) with investment holdings of $627,677 (2007 - $114,371) and the Unitized Endowment Pool (“UEP”) with investment holdings of $797,495 (2007 - $845,081). The primary objective of the University’s investment policy for the NEIP is to earn a rate of return that exceeds the DEX 91 day T-Bill return with an emphasis on liquidity and the preservation of capital. The primary objective for the UEP is to earn a long-term rate of return that, in real terms, exceeds the endowment spending allocation of 4.65% (the amount made available for spending) at an acceptable level of risk. The UEP also includes non endowed assets that will not be required for spending in the next five years. The University has policies and procedures in place governing asset mix, diversification, exposure limits, credit quality and performance measurement. The University manages its investments through the Board of Governors’ Investment Committee. The Investment Committee meets regularly to monitor investments, to review investment manager performance, to ensure compliance with the University’s investment policies and to evaluate the continued appropriateness of the University’s investment policies.
Asset-backed commercial paper At March 31, 2008 the University holds third-party and bank-sponsored asset-backed commercial paper (“ABCP”) with an original cost of $169,729. The Canadian market for ABCP suffered a liquidity disruption in mid-August 2007 when many of these investments did not settle on maturity. A group of market participants, including major investors, banks, asset providers, dealers, and third-party sponsors, agreed to work collectively to restructure this market segment. $158,966 of the University’s ABCP was subject to a restructuring agreement (see below) while the remaining $10,763 is being restructured directly with the sponsors of the affected ABCP.
NOTES TO THE FINANCIAL STATEMENTS (in thousands of dollars) MARCH 31, 2008
26
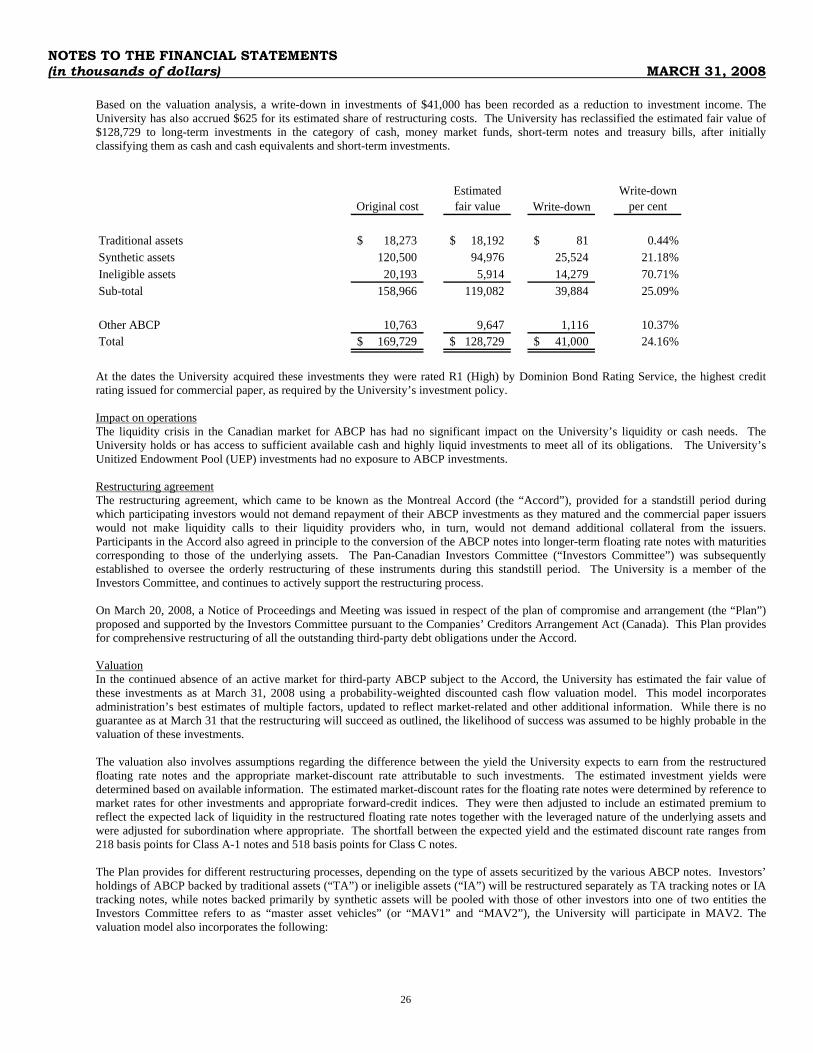
Based on the valuation analysis, a write-down in investments of $41,000 has been recorded as a reduction to investment income. The University has also accrued $625 for its estimated share of restructuring costs. The University has reclassified the estimated fair value of $128,729 to long-term investments in the category of cash, money market funds, short-term notes and treasury bills, after initially classifying them as cash and cash equivalents and short-term investments.
Original costEstimated fair value Write-down
Write-down per cent
Traditional assets 18,273$ 18,192$ 81$ 0.44%Synthetic assets 120,500 94,976 25,524 21.18%Ineligible assets 20,193 5,914 14,279 70.71%Sub-total 158,966 119,082 39,884 25.09%
Other ABCP 10,763 9,647 1,116 10.37%Total 169,729$ 128,729$ 41,000$ 24.16%
At the dates the University acquired these investments they were rated R1 (High) by Dominion Bond Rating Service, the highest credit rating issued for commercial paper, as required by the University’s investment policy. Impact on operations The liquidity crisis in the Canadian market for ABCP has had no significant impact on the University’s liquidity or cash needs. The University holds or has access to sufficient available cash and highly liquid investments to meet all of its obligations. The University’s Unitized Endowment Pool (UEP) investments had no exposure to ABCP investments. Restructuring agreement The restructuring agreement, which came to be known as the Montreal Accord (the “Accord”), provided for a standstill period during which participating investors would not demand repayment of their ABCP investments as they matured and the commercial paper issuers would not make liquidity calls to their liquidity providers who, in turn, would not demand additional collateral from the issuers. Participants in the Accord also agreed in principle to the conversion of the ABCP notes into longer-term floating rate notes with maturities corresponding to those of the underlying assets. The Pan-Canadian Investors Committee (“Investors Committee”) was subsequently established to oversee the orderly restructuring of these instruments during this standstill period. The University is a member of the Investors Committee, and continues to actively support the restructuring process. On March 20, 2008, a Notice of Proceedings and Meeting was issued in respect of the plan of compromise and arrangement (the “Plan”) proposed and supported by the Investors Committee pursuant to the Companies’ Creditors Arrangement Act (Canada). This Plan provides for comprehensive restructuring of all the outstanding third-party debt obligations under the Accord. Valuation In the continued absence of an active market for third-party ABCP subject to the Accord, the University has estimated the fair value of these investments as at March 31, 2008 using a probability-weighted discounted cash flow valuation model. This model incorporates administration’s best estimates of multiple factors, updated to reflect market-related and other additional information. While there is no guarantee as at March 31 that the restructuring will succeed as outlined, the likelihood of success was assumed to be highly probable in the valuation of these investments. The valuation also involves assumptions regarding the difference between the yield the University expects to earn from the restructured floating rate notes and the appropriate market-discount rate attributable to such investments. The estimated investment yields were determined based on available information. The estimated market-discount rates for the floating rate notes were determined by reference to market rates for other investments and appropriate forward-credit indices. They were then adjusted to include an estimated premium to reflect the expected lack of liquidity in the restructured floating rate notes together with the leveraged nature of the underlying assets and were adjusted for subordination where appropriate. The shortfall between the expected yield and the estimated discount rate ranges from 218 basis points for Class A-1 notes and 518 basis points for Class C notes. The Plan provides for different restructuring processes, depending on the type of assets securitized by the various ABCP notes. Investors’ holdings of ABCP backed by traditional assets (“TA”) or ineligible assets (“IA”) will be restructured separately as TA tracking notes or IA tracking notes, while notes backed primarily by synthetic assets will be pooled with those of other investors into one of two entities the Investors Committee refers to as “master asset vehicles” (or “MAV1” and “MAV2”), the University will participate in MAV2. The valuation model also incorporates the following:
NOTES TO THE FINANCIAL STATEMENTS (in thousands of dollars) MARCH 31, 2008
27
• Traditional assets represent primarily trade receivables, credit card receivables, personal lines of credit, auto and equipment loans, and residential and commercial mortgage backed securities. The University anticipates the restructured notes will include traditional securitized assets with a potential AAA rating and an expected average term to maturity of four years.
• Synthetic assets represent collateralized debt, traditional assets. The University anticipates the restructured synthetic notes will be comprised of Class A-1, Class A-2, Class B and Class C; with A-1 and A-2 receiving a potential AA rating, while B and C will be unrated. These pooled synthetic notes will be divided into senior and subordinated notes, the majority of which are expected to be ranked senior with a term to maturity of nine years.
• Ineligible assets represent primarily assets with exposure to the US sub-prime real estate market. The University anticipates receiving various long-term floating rate notes with a term to maturity between 6 to 29 years. There has been no indication whether these notes will be rated or not.
Other ABCP not covered by the Plan include: Devonshire Trust (third-party), Sitka Trust (bank-sponsored) and Superior Trust (bank- sponsored). The underlying assets in these trusts are represented by either exclusively collateralized debt obligations or a combination of collateralized debt obligations and traditional assets. It is not determinable whether the restructured floating rate notes will be rated. The expected term to maturity will be between six and nine years. In general, these restructuring plans are similar to the Accord in that the current investments will be restructured into long-term notes to match the maturity date of the underlying assets. In the absence of an active market for these investments, the University has estimated their fair value as at March 31, 2008, using a probability-weighted discounted cash flow model similar to the approach used for the Accord holdings. Interest is expected to be paid monthly over the term with principal repayment on maturity. The shortfall between the expected yield and the estimated discount rate ranges between 134 and 243 basis points. Measurement uncertainty The ongoing nature of the restructuring negotiations contributes to a lack of certainty regarding the outcome of the restructuring process. This lack of certainty, in turn, contributes to significant measurement uncertainty in administration’s best estimate of the fair value of the University’s current ABCP investments. Since the eventual timing and amount of future cash flows attributable to these assets may vary significantly from administration’s current best estimates, it is possible that the ultimate fair value of these assets may vary significantly from current estimates and that the magnitude of any such difference could be material to the financial results.
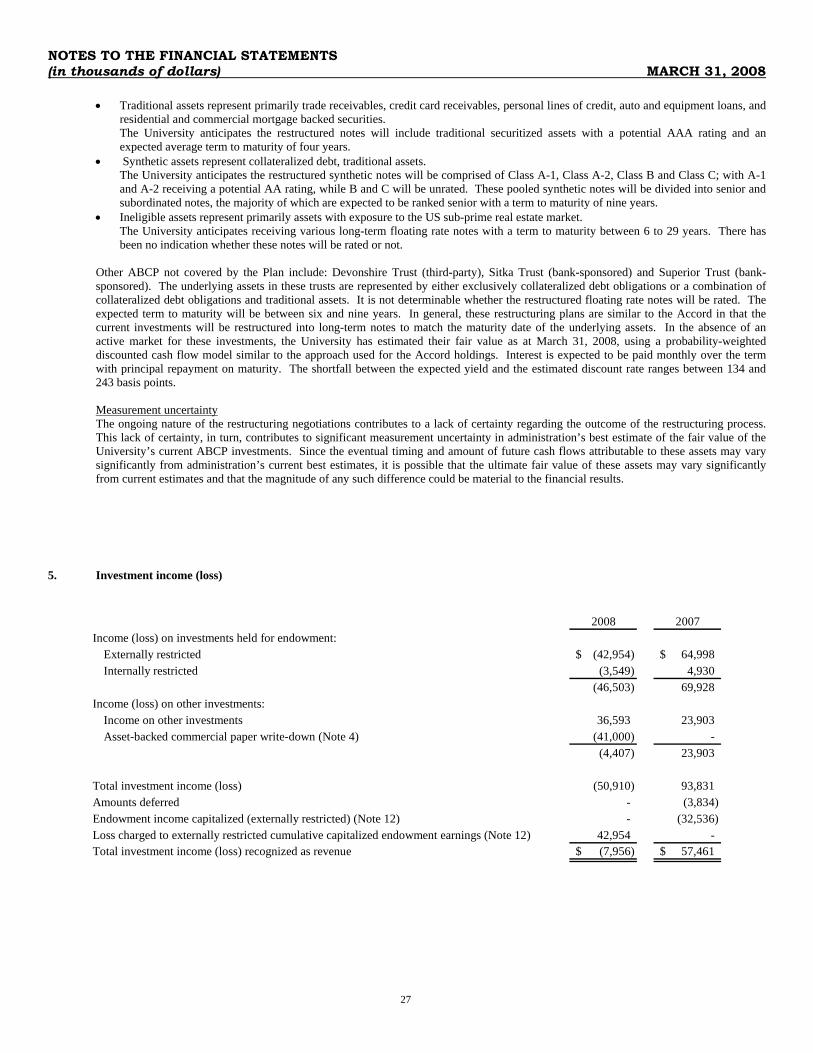
5. Investment income (loss)
2008 2007Income (loss) on investments held for endowment:
Externally restricted (42,954)$ 64,998$ Internally restricted (3,549) 4,930
(46,503) 69,928 Income (loss) on other investments:
Income on other investments 36,593 23,903 Asset-backed commercial paper write-down (Note 4) (41,000) -
(4,407) 23,903
Total investment income (loss) (50,910) 93,831 Amounts deferred - (3,834) Endowment income capitalized (externally restricted) (Note 12) - (32,536) Loss charged to externally restricted cumulative capitalized endowment earnings (Note 12) 42,954 - Total investment income (loss) recognized as revenue (7,956)$ 57,461$
NOTES TO THE FINANCIAL STATEMENTS (in thousands of dollars) MARCH 31, 2008
28
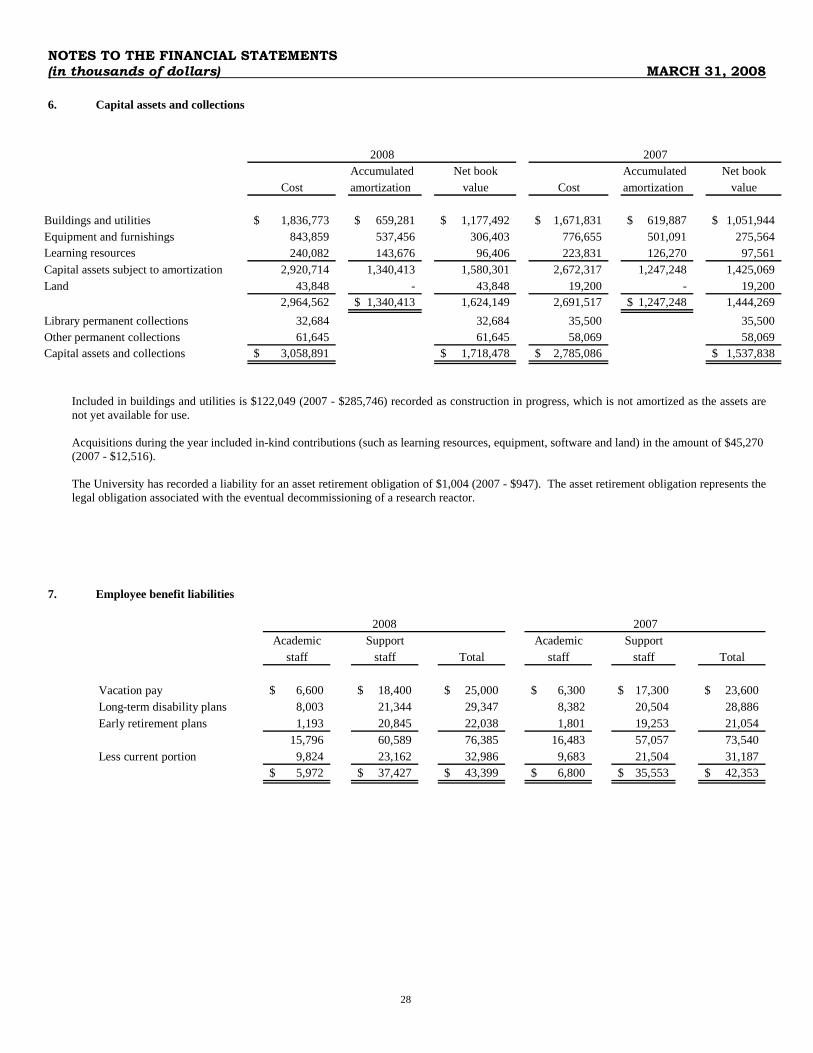
6. Capital assets and collections
Included in buildings and utilities is $122,049 (2007 - $285,746) recorded as construction in progress, which is not amortized as the assets are not yet available for use. Acquisitions during the year included in-kind contributions (such as learning resources, equipment, software and land) in the amount of $45,270 (2007 - $12,516). The University has recorded a liability for an asset retirement obligation of $1,004 (2007 - $947). The asset retirement obligation represents the legal obligation associated with the eventual decommissioning of a research reactor.
7. Employee benefit liabilities
Academic Support Academic Supportstaff staff Total staff staff Total
Vacation pay 6,600$ 18,400$ 25,000$ 6,300$ 17,300$ 23,600$ Long-term disability plans 8,003 21,344 29,347 8,382 20,504 28,886 Early retirement plans 1,193 20,845 22,038 1,801 19,253 21,054
15,796 60,589 76,385 16,483 57,057 73,540 Less current portion 9,824 23,162 32,986 9,683 21,504 31,187
5,972$ 37,427$ 43,399$ 6,800$ 35,553$ 42,353$
2008 2007
Accumulated Net book Accumulated Net bookCost amortization value Cost amortization value
Buildings and utilities 1,836,773$ 659,281$ 1,177,492$ 1,671,831$ 619,887$ 1,051,944$ Equipment and furnishings 843,859 537,456 306,403 776,655 501,091 275,564 Learning resources 240,082 143,676 96,406 223,831 126,270 97,561 Capital assets subject to amortization 2,920,714 1,340,413 1,580,301 2,672,317 1,247,248 1,425,069 Land 43,848 - 43,848 19,200 - 19,200 2,964,562 1,340,413$ 1,624,149 2,691,517 1,247,248$ 1,444,269 Library permanent collections 32,684 32,684 35,500 35,500 Other permanent collections 61,645 61,645 58,069 58,069 Capital assets and collections 3,058,891$ 1,718,478$ 2,785,086$ 1,537,838$
2008 2007
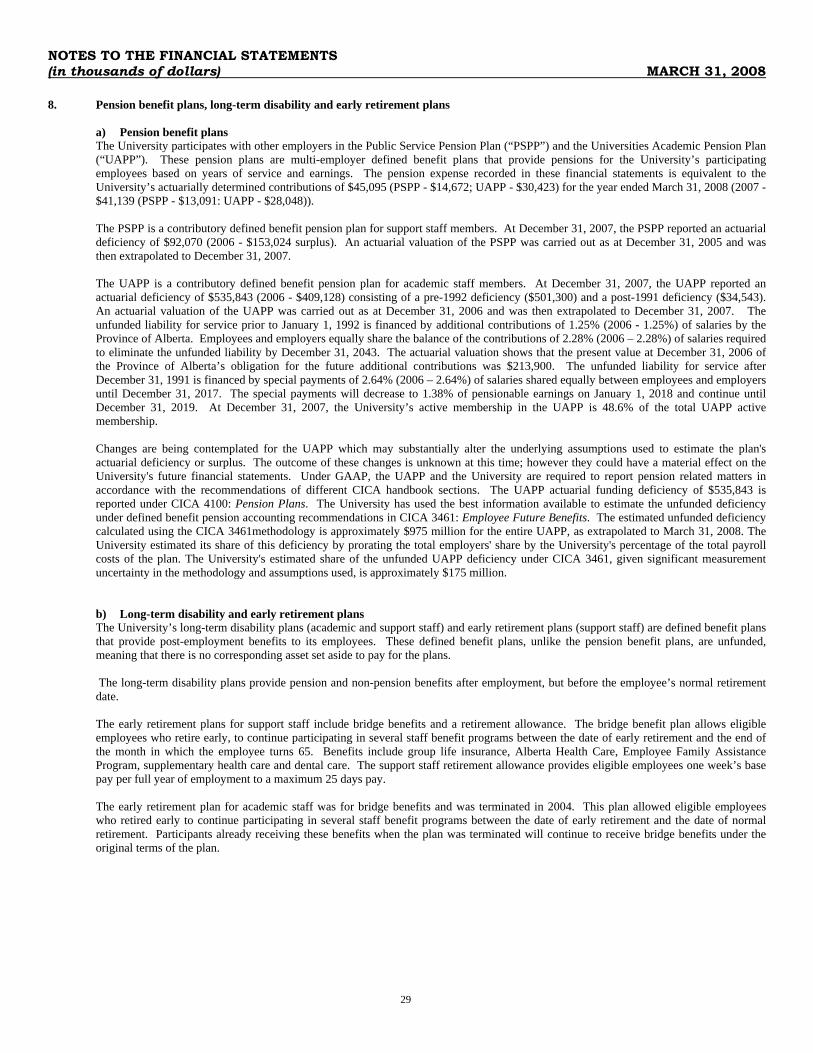
NOTES TO THE FINANCIAL STATEMENTS (in thousands of dollars) MARCH 31, 2008
29
8. Pension benefit plans, long-term disability and early retirement plans a) Pension benefit plans The University participates with other employers in the Public Service Pension Plan (“PSPP”) and the Universities Academic Pension Plan (“UAPP”). These pension plans are multi-employer defined benefit plans that provide pensions for the University’s participating employees based on years of service and earnings. The pension expense recorded in these financial statements is equivalent to the University’s actuarially determined contributions of $45,095 (PSPP - $14,672; UAPP - $30,423) for the year ended March 31, 2008 (2007 - $41,139 (PSPP - $13,091: UAPP - $28,048)). The PSPP is a contributory defined benefit pension plan for support staff members. At December 31, 2007, the PSPP reported an actuarial deficiency of $92,070 (2006 - $153,024 surplus). An actuarial valuation of the PSPP was carried out as at December 31, 2005 and was then extrapolated to December 31, 2007. The UAPP is a contributory defined benefit pension plan for academic staff members. At December 31, 2007, the UAPP reported an actuarial deficiency of $535,843 (2006 - $409,128) consisting of a pre-1992 deficiency ($501,300) and a post-1991 deficiency ($34,543). An actuarial valuation of the UAPP was carried out as at December 31, 2006 and was then extrapolated to December 31, 2007. The unfunded liability for service prior to January 1, 1992 is financed by additional contributions of 1.25% (2006 - 1.25%) of salaries by the Province of Alberta. Employees and employers equally share the balance of the contributions of 2.28% (2006 – 2.28%) of salaries required to eliminate the unfunded liability by December 31, 2043. The actuarial valuation shows that the present value at December 31, 2006 of the Province of Alberta’s obligation for the future additional contributions was $213,900. The unfunded liability for service after December 31, 1991 is financed by special payments of 2.64% (2006 – 2.64%) of salaries shared equally between employees and employers until December 31, 2017. The special payments will decrease to 1.38% of pensionable earnings on January 1, 2018 and continue until December 31, 2019. At December 31, 2007, the University’s active membership in the UAPP is 48.6% of the total UAPP active membership. Changes are being contemplated for the UAPP which may substantially alter the underlying assumptions used to estimate the plan's actuarial deficiency or surplus. The outcome of these changes is unknown at this time; however they could have a material effect on the University's future financial statements. Under GAAP, the UAPP and the University are required to report pension related matters in accordance with the recommendations of different CICA handbook sections. The UAPP actuarial funding deficiency of $535,843 is reported under CICA 4100: Pension Plans. The University has used the best information available to estimate the unfunded deficiency under defined benefit pension accounting recommendations in CICA 3461: Employee Future Benefits. The estimated unfunded deficiency calculated using the CICA 3461methodology is approximately $975 million for the entire UAPP, as extrapolated to March 31, 2008. The University estimated its share of this deficiency by prorating the total employers' share by the University's percentage of the total payroll costs of the plan. The University's estimated share of the unfunded UAPP deficiency under CICA 3461, given significant measurement uncertainty in the methodology and assumptions used, is approximately $175 million. b) Long-term disability and early retirement plans The University’s long-term disability plans (academic and support staff) and early retirement plans (support staff) are defined benefit plans that provide post-employment benefits to its employees. These defined benefit plans, unlike the pension benefit plans, are unfunded, meaning that there is no corresponding asset set aside to pay for the plans. The long-term disability plans provide pension and non-pension benefits after employment, but before the employee’s normal retirement date. The early retirement plans for support staff include bridge benefits and a retirement allowance. The bridge benefit plan allows eligible employees who retire early, to continue participating in several staff benefit programs between the date of early retirement and the end of the month in which the employee turns 65. Benefits include group life insurance, Alberta Health Care, Employee Family Assistance Program, supplementary health care and dental care. The support staff retirement allowance provides eligible employees one week’s base pay per full year of employment to a maximum 25 days pay. The early retirement plan for academic staff was for bridge benefits and was terminated in 2004. This plan allowed eligible employees who retired early to continue participating in several staff benefit programs between the date of early retirement and the date of normal retirement. Participants already receiving these benefits when the plan was terminated will continue to receive bridge benefits under the original terms of the plan.
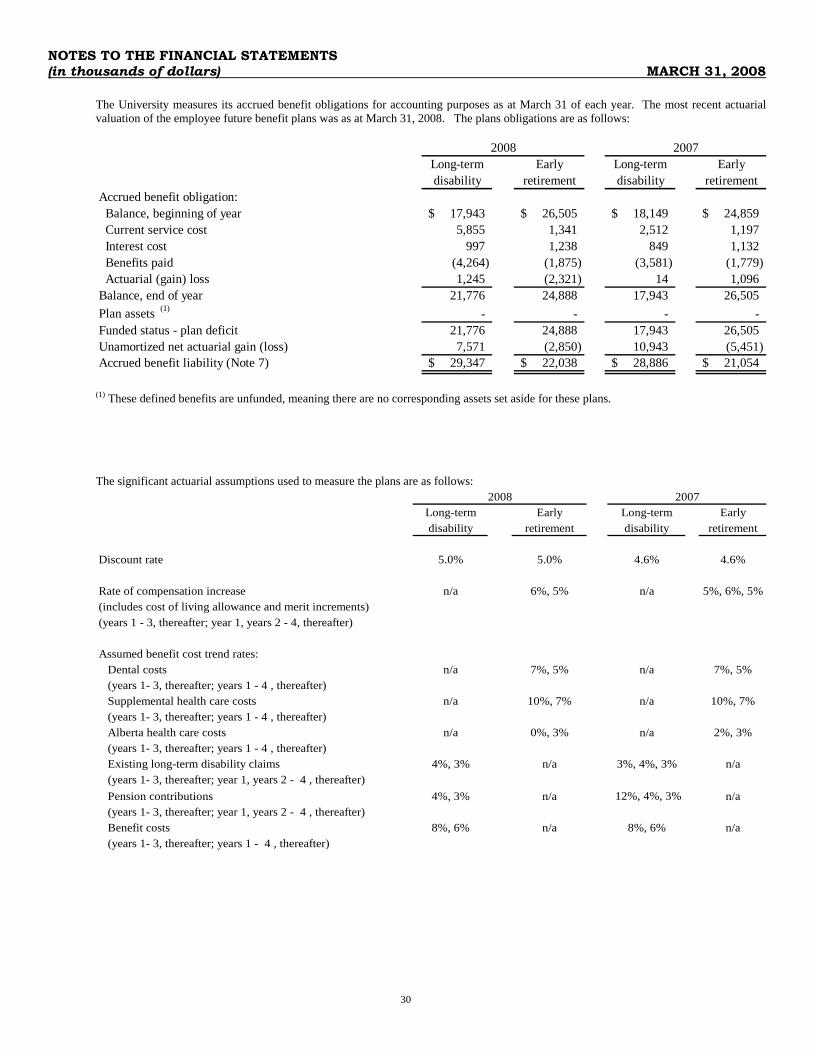
NOTES TO THE FINANCIAL STATEMENTS (in thousands of dollars) MARCH 31, 2008
30
The University measures its accrued benefit obligations for accounting purposes as at March 31 of each year. The most recent actuarial valuation of the employee future benefit plans was as at March 31, 2008. The plans obligations are as follows:
Long-term Early Long-term Earlydisability retirement disability retirement
Accrued benefit obligation: Balance, beginning of year 17,943$ 26,505$ 18,149$ 24,859$ Current service cost 5,855 1,341 2,512 1,197 Interest cost 997 1,238 849 1,132 Benefits paid (4,264) (1,875) (3,581) (1,779) Actuarial (gain) loss 1,245 (2,321) 14 1,096 Balance, end of year 21,776 24,888 17,943 26,505 Plan assets (1) - - - - Funded status - plan deficit 21,776 24,888 17,943 26,505 Unamortized net actuarial gain (loss) 7,571 (2,850) 10,943 (5,451) Accrued benefit liability (Note 7) 29,347$ 22,038$ 28,886$ 21,054$
20072008
(1) These defined benefits are unfunded, meaning there are no corresponding assets set aside for these plans. The significant actuarial assumptions used to measure the plans are as follows:
Long-term Early Long-term Earlydisability retirement disability retirement
Discount rate 5.0% 5.0% 4.6% 4.6%
Rate of compensation increase n/a 6%, 5% n/a 5%, 6%, 5%(includes cost of living allowance and merit increments)(years 1 - 3, thereafter; year 1, years 2 - 4, thereafter)
Assumed benefit cost trend rates: Dental costs n/a 7%, 5% n/a 7%, 5% (years 1- 3, thereafter; years 1 - 4 , thereafter) Supplemental health care costs n/a 10%, 7% n/a 10%, 7% (years 1- 3, thereafter; years 1 - 4 , thereafter) Alberta health care costs n/a 0%, 3% n/a 2%, 3% (years 1- 3, thereafter; years 1 - 4 , thereafter) Existing long-term disability claims 4%, 3% n/a 3%, 4%, 3% n/a (years 1- 3, thereafter; year 1, years 2 - 4 , thereafter) Pension contributions 4%, 3% n/a 12%, 4%, 3% n/a (years 1- 3, thereafter; year 1, years 2 - 4 , thereafter) Benefit costs 8%, 6% n/a 8%, 6% n/a (years 1- 3, thereafter; years 1 - 4 , thereafter)
2008 2007
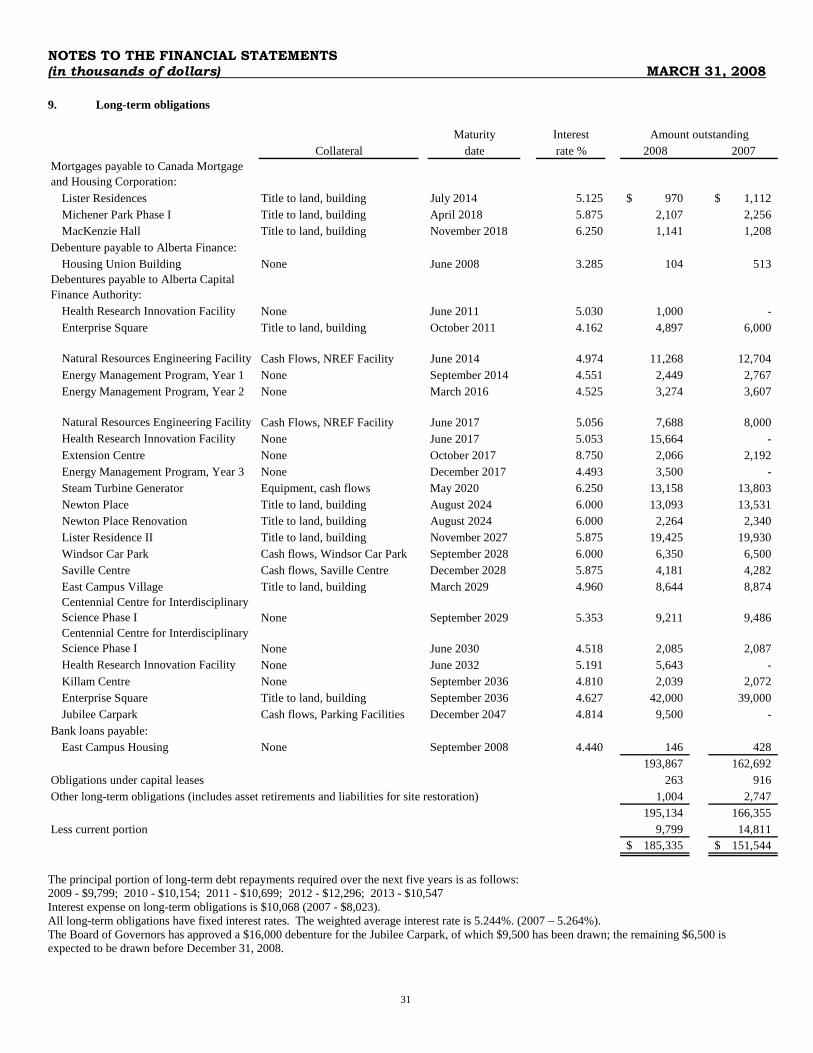
NOTES TO THE FINANCIAL STATEMENTS (in thousands of dollars) MARCH 31, 2008
31
9. Long-term obligations
Maturity InterestCollateral date rate % 2008 2007
Mortgages payable to Canada Mortgage and Housing Corporation:
Lister Residences Title to land, building July 2014 5.125 970$ 1,112$ Michener Park Phase I Title to land, building April 2018 5.875 2,107 2,256 MacKenzie Hall Title to land, building November 2018 6.250 1,141 1,208
Debenture payable to Alberta Finance:Housing Union Building None June 2008 3.285 104 513
Debentures payable to Alberta Capital Finance Authority:
Health Research Innovation Facility None June 2011 5.030 1,000 - Enterprise Square Title to land, building October 2011 4.162 4,897 6,000
Natural Resources Engineering Facility Cash Flows, NREF Facility June 2014 4.974 11,268 12,704 Energy Management Program, Year 1 None September 2014 4.551 2,449 2,767 Energy Management Program, Year 2 None March 2016 4.525 3,274 3,607
Natural Resources Engineering Facility Cash Flows, NREF Facility June 2017 5.056 7,688 8,000 Health Research Innovation Facility None June 2017 5.053 15,664 - Extension Centre None October 2017 8.750 2,066 2,192 Energy Management Program, Year 3 None December 2017 4.493 3,500 - Steam Turbine Generator Equipment, cash flows May 2020 6.250 13,158 13,803 Newton Place Title to land, building August 2024 6.000 13,093 13,531 Newton Place Renovation Title to land, building August 2024 6.000 2,264 2,340 Lister Residence II Title to land, building November 2027 5.875 19,425 19,930 Windsor Car Park Cash flows, Windsor Car Park September 2028 6.000 6,350 6,500 Saville Centre Cash flows, Saville Centre December 2028 5.875 4,181 4,282 East Campus Village Title to land, building March 2029 4.960 8,644 8,874 Centennial Centre for Interdisciplinary Science Phase I None September 2029 5.353 9,211 9,486 Centennial Centre for Interdisciplinary Science Phase I None June 2030 4.518 2,085 2,087 Health Research Innovation Facility None June 2032 5.191 5,643 - Killam Centre None September 2036 4.810 2,039 2,072 Enterprise Square Title to land, building September 2036 4.627 42,000 39,000 Jubilee Carpark Cash flows, Parking Facilities December 2047 4.814 9,500 -
Bank loans payable:East Campus Housing None September 2008 4.440 146 428
193,867 162,692 Obligations under capital leases 263 916 Other long-term obligations (includes asset retirements and liabilities for site restoration) 1,004 2,747
195,134 166,355 Less current portion 9,799 14,811
185,335$ 151,544$
Amount outstanding
The principal portion of long-term debt repayments required over the next five years is as follows: 2009 - $9,799; 2010 - $10,154; 2011 - $10,699; 2012 - $12,296; 2013 - $10,547 Interest expense on long-term obligations is $10,068 (2007 - $8,023). All long-term obligations have fixed interest rates. The weighted average interest rate is 5.244%. (2007 – 5.264%). The Board of Governors has approved a $16,000 debenture for the Jubilee Carpark, of which $9,500 has been drawn; the remaining $6,500 is expected to be drawn before December 31, 2008.
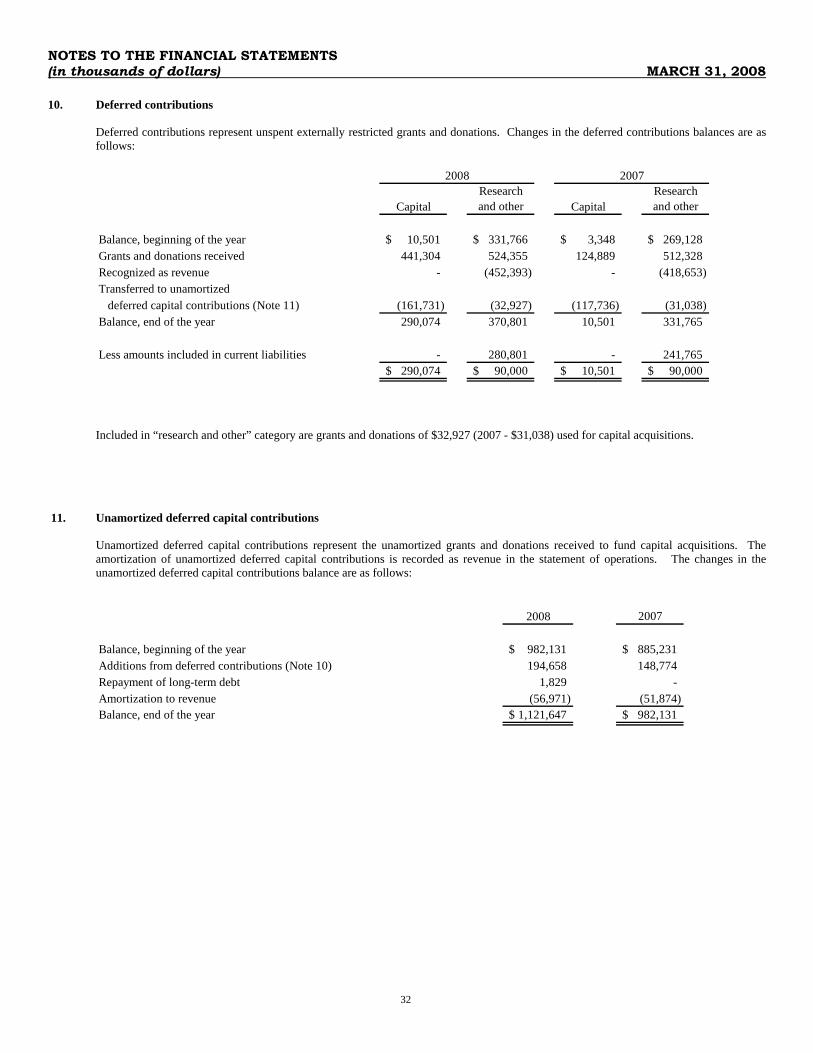
NOTES TO THE FINANCIAL STATEMENTS (in thousands of dollars) MARCH 31, 2008
32
10. Deferred contributions
Deferred contributions represent unspent externally restricted grants and donations. Changes in the deferred contributions balances are as follows:
CapitalResearch and other Capital
Research and other
Balance, beginning of the year 10,501$ 331,766$ 3,348$ 269,128$ Grants and donations received 441,304 524,355 124,889 512,328 Recognized as revenue - (452,393) - (418,653) Transferred to unamortized deferred capital contributions (Note 11) (161,731) (32,927) (117,736) (31,038) Balance, end of the year 290,074 370,801 10,501 331,765
Less amounts included in current liabilities - 280,801 - 241,765 290,074$ 90,000$ 10,501$ 90,000$
2008 2007
Included in “research and other” category are grants and donations of $32,927 (2007 - $31,038) used for capital acquisitions.
11. Unamortized deferred capital contributions
Unamortized deferred capital contributions represent the unamortized grants and donations received to fund capital acquisitions. The amortization of unamortized deferred capital contributions is recorded as revenue in the statement of operations. The changes in the unamortized deferred capital contributions balance are as follows:
2008 2007
Balance, beginning of the year 982,131$ 885,231$ Additions from deferred contributions (Note 10) 194,658 148,774 Repayment of long-term debt 1,829 - Amortization to revenue (56,971) (51,874) Balance, end of the year 1,121,647$ 982,131$
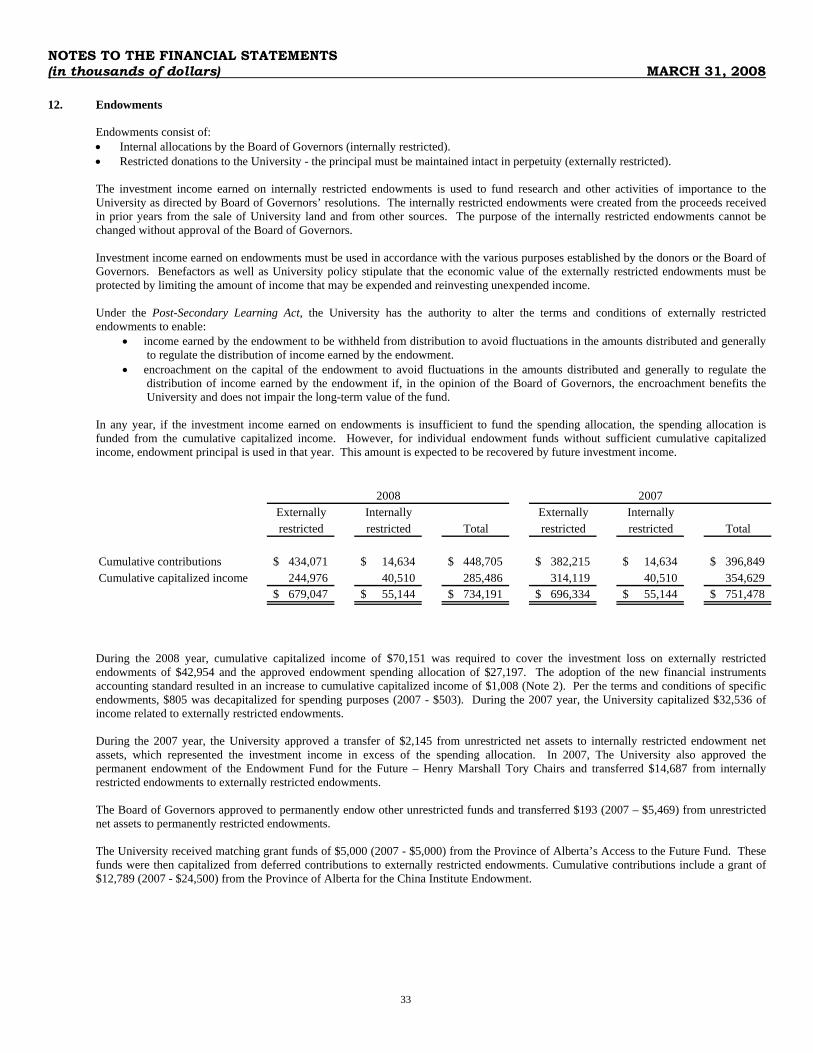
NOTES TO THE FINANCIAL STATEMENTS (in thousands of dollars) MARCH 31, 2008
33
12. Endowments
Endowments consist of: • Internal allocations by the Board of Governors (internally restricted). • Restricted donations to the University - the principal must be maintained intact in perpetuity (externally restricted). The investment income earned on internally restricted endowments is used to fund research and other activities of importance to the University as directed by Board of Governors’ resolutions. The internally restricted endowments were created from the proceeds received in prior years from the sale of University land and from other sources. The purpose of the internally restricted endowments cannot be changed without approval of the Board of Governors. Investment income earned on endowments must be used in accordance with the various purposes established by the donors or the Board of Governors. Benefactors as well as University policy stipulate that the economic value of the externally restricted endowments must be protected by limiting the amount of income that may be expended and reinvesting unexpended income. Under the Post-Secondary Learning Act, the University has the authority to alter the terms and conditions of externally restricted endowments to enable:
• income earned by the endowment to be withheld from distribution to avoid fluctuations in the amounts distributed and generally to regulate the distribution of income earned by the endowment.
• encroachment on the capital of the endowment to avoid fluctuations in the amounts distributed and generally to regulate the distribution of income earned by the endowment if, in the opinion of the Board of Governors, the encroachment benefits the University and does not impair the long-term value of the fund.
In any year, if the investment income earned on endowments is insufficient to fund the spending allocation, the spending allocation is funded from the cumulative capitalized income. However, for individual endowment funds without sufficient cumulative capitalized income, endowment principal is used in that year. This amount is expected to be recovered by future investment income.
Externally Internally Externally Internallyrestricted restricted Total restricted restricted Total
Cumulative contributions 434,071$ 14,634$ 448,705$ 382,215$ 14,634$ 396,849$ Cumulative capitalized income 244,976 40,510 285,486 314,119 40,510 354,629
679,047$ 55,144$ 734,191$ 696,334$ 55,144$ 751,478$
2008 2007
During the 2008 year, cumulative capitalized income of $70,151 was required to cover the investment loss on externally restricted endowments of $42,954 and the approved endowment spending allocation of $27,197. The adoption of the new financial instruments accounting standard resulted in an increase to cumulative capitalized income of $1,008 (Note 2). Per the terms and conditions of specific endowments, $805 was decapitalized for spending purposes (2007 - $503). During the 2007 year, the University capitalized $32,536 of income related to externally restricted endowments. During the 2007 year, the University approved a transfer of $2,145 from unrestricted net assets to internally restricted endowment net assets, which represented the investment income in excess of the spending allocation. In 2007, The University also approved the permanent endowment of the Endowment Fund for the Future – Henry Marshall Tory Chairs and transferred $14,687 from internally restricted endowments to externally restricted endowments. The Board of Governors approved to permanently endow other unrestricted funds and transferred $193 (2007 – $5,469) from unrestricted net assets to permanently restricted endowments. The University received matching grant funds of $5,000 (2007 - $5,000) from the Province of Alberta’s Access to the Future Fund. These funds were then capitalized from deferred contributions to externally restricted endowments. Cumulative contributions include a grant of $12,789 (2007 - $24,500) from the Province of Alberta for the China Institute Endowment.
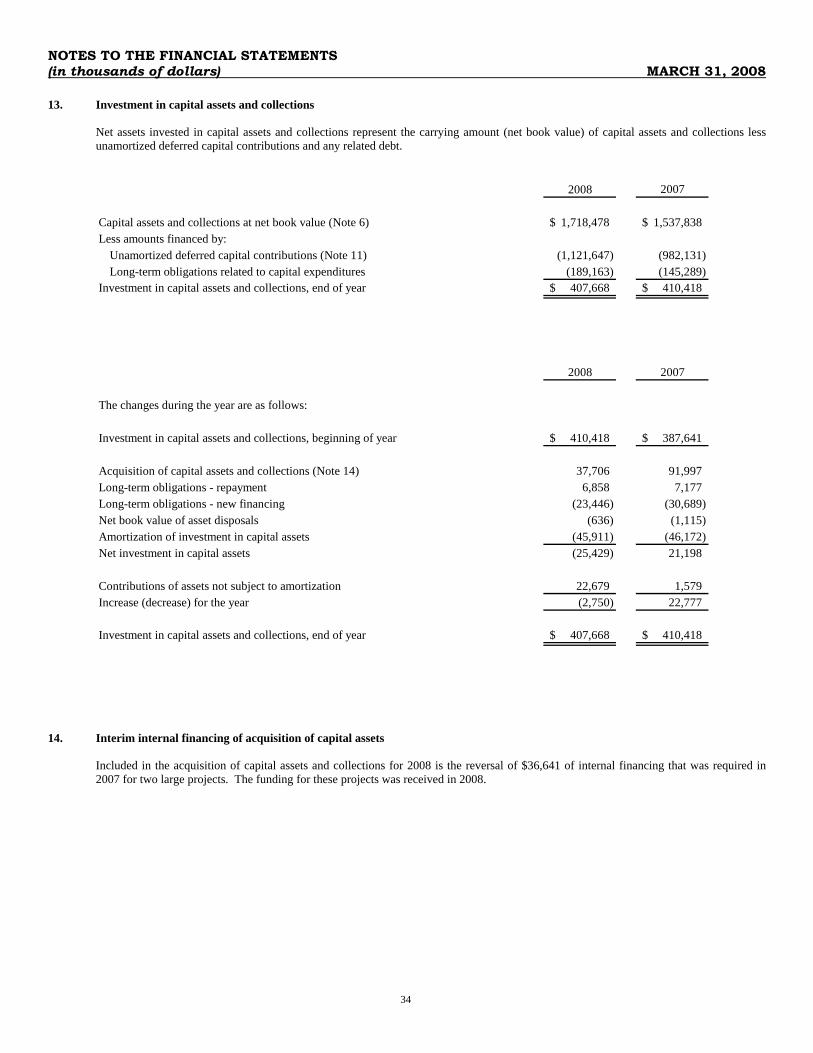
NOTES TO THE FINANCIAL STATEMENTS (in thousands of dollars) MARCH 31, 2008
34
13. Investment in capital assets and collections
Net assets invested in capital assets and collections represent the carrying amount (net book value) of capital assets and collections less unamortized deferred capital contributions and any related debt.
2008 2007
Capital assets and collections at net book value (Note 6) 1,718,478$ 1,537,838$ Less amounts financed by:
Unamortized deferred capital contributions (Note 11) (1,121,647) (982,131) Long-term obligations related to capital expenditures (189,163) (145,289)
Investment in capital assets and collections, end of year 407,668$ 410,418$
2008 2007
The changes during the year are as follows:
Investment in capital assets and collections, beginning of year 410,418$ 387,641$
Acquisition of capital assets and collections (Note 14) 37,706 91,997 Long-term obligations - repayment 6,858 7,177 Long-term obligations - new financing (23,446) (30,689) Net book value of asset disposals (636) (1,115) Amortization of investment in capital assets (45,911) (46,172) Net investment in capital assets (25,429) 21,198
Contributions of assets not subject to amortization 22,679 1,579 Increase (decrease) for the year (2,750) 22,777
Investment in capital assets and collections, end of year 407,668$ 410,418$
14. Interim internal financing of acquisition of capital assets
Included in the acquisition of capital assets and collections for 2008 is the reversal of $36,641 of internal financing that was required in 2007 for two large projects. The funding for these projects was received in 2008.
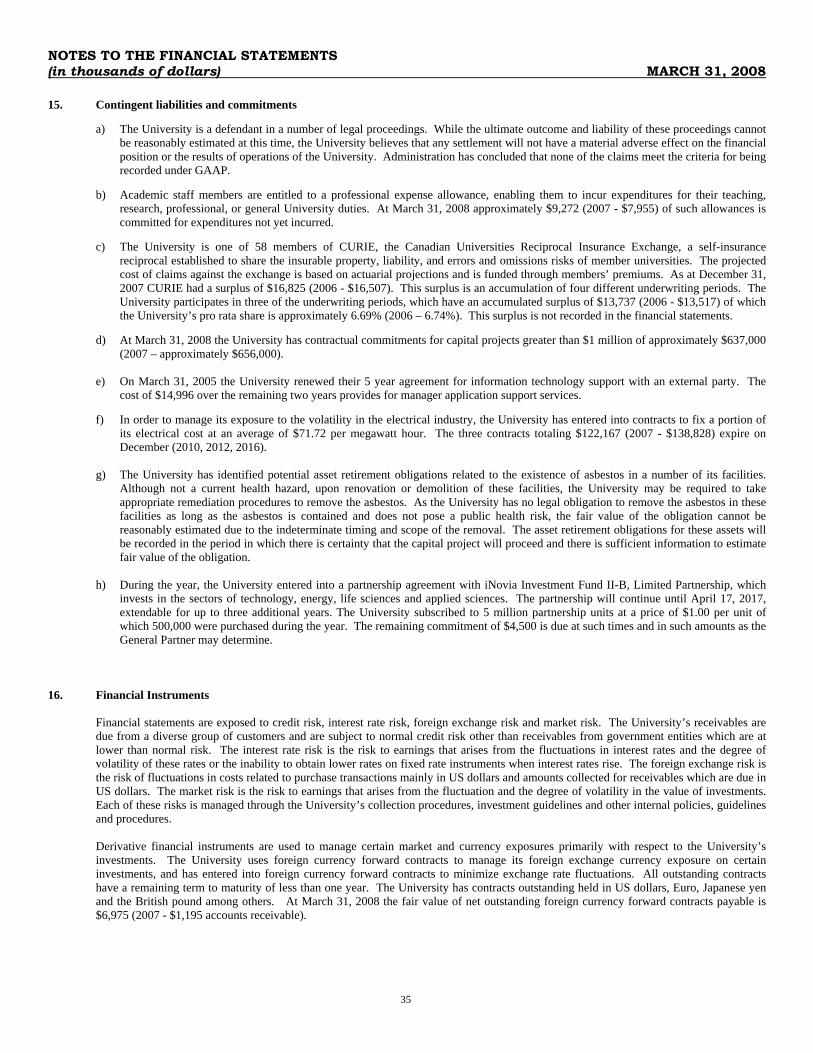
NOTES TO THE FINANCIAL STATEMENTS (in thousands of dollars) MARCH 31, 2008
35
15. Contingent liabilities and commitments
a) The University is a defendant in a number of legal proceedings. While the ultimate outcome and liability of these proceedings cannot be reasonably estimated at this time, the University believes that any settlement will not have a material adverse effect on the financial position or the results of operations of the University. Administration has concluded that none of the claims meet the criteria for being recorded under GAAP.
b) Academic staff members are entitled to a professional expense allowance, enabling them to incur expenditures for their teaching,
research, professional, or general University duties. At March 31, 2008 approximately $9,272 (2007 - $7,955) of such allowances is committed for expenditures not yet incurred.
c) The University is one of 58 members of CURIE, the Canadian Universities Reciprocal Insurance Exchange, a self-insurance
reciprocal established to share the insurable property, liability, and errors and omissions risks of member universities. The projected cost of claims against the exchange is based on actuarial projections and is funded through members’ premiums. As at December 31, 2007 CURIE had a surplus of $16,825 (2006 - $16,507). This surplus is an accumulation of four different underwriting periods. The University participates in three of the underwriting periods, which have an accumulated surplus of $13,737 (2006 - $13,517) of which the University’s pro rata share is approximately 6.69% (2006 – 6.74%). This surplus is not recorded in the financial statements.
d) At March 31, 2008 the University has contractual commitments for capital projects greater than $1 million of approximately $637,000
(2007 – approximately $656,000). e) On March 31, 2005 the University renewed their 5 year agreement for information technology support with an external party. The
cost of $14,996 over the remaining two years provides for manager application support services. f) In order to manage its exposure to the volatility in the electrical industry, the University has entered into contracts to fix a portion of
its electrical cost at an average of $71.72 per megawatt hour. The three contracts totaling $122,167 (2007 - $138,828) expire on December (2010, 2012, 2016).
g) The University has identified potential asset retirement obligations related to the existence of asbestos in a number of its facilities.
Although not a current health hazard, upon renovation or demolition of these facilities, the University may be required to take appropriate remediation procedures to remove the asbestos. As the University has no legal obligation to remove the asbestos in these facilities as long as the asbestos is contained and does not pose a public health risk, the fair value of the obligation cannot be reasonably estimated due to the indeterminate timing and scope of the removal. The asset retirement obligations for these assets will be recorded in the period in which there is certainty that the capital project will proceed and there is sufficient information to estimate fair value of the obligation.
h) During the year, the University entered into a partnership agreement with iNovia Investment Fund II-B, Limited Partnership, which
invests in the sectors of technology, energy, life sciences and applied sciences. The partnership will continue until April 17, 2017, extendable for up to three additional years. The University subscribed to 5 million partnership units at a price of $1.00 per unit of which 500,000 were purchased during the year. The remaining commitment of $4,500 is due at such times and in such amounts as the General Partner may determine.
16. Financial Instruments
Financial statements are exposed to credit risk, interest rate risk, foreign exchange risk and market risk. The University’s receivables are due from a diverse group of customers and are subject to normal credit risk other than receivables from government entities which are at lower than normal risk. The interest rate risk is the risk to earnings that arises from the fluctuations in interest rates and the degree of volatility of these rates or the inability to obtain lower rates on fixed rate instruments when interest rates rise. The foreign exchange risk is the risk of fluctuations in costs related to purchase transactions mainly in US dollars and amounts collected for receivables which are due in US dollars. The market risk is the risk to earnings that arises from the fluctuation and the degree of volatility in the value of investments. Each of these risks is managed through the University’s collection procedures, investment guidelines and other internal policies, guidelines and procedures. Derivative financial instruments are used to manage certain market and currency exposures primarily with respect to the University’s investments. The University uses foreign currency forward contracts to manage its foreign exchange currency exposure on certain investments, and has entered into foreign currency forward contracts to minimize exchange rate fluctuations. All outstanding contracts have a remaining term to maturity of less than one year. The University has contracts outstanding held in US dollars, Euro, Japanese yen and the British pound among others. At March 31, 2008 the fair value of net outstanding foreign currency forward contracts payable is $6,975 (2007 - $1,195 accounts receivable).
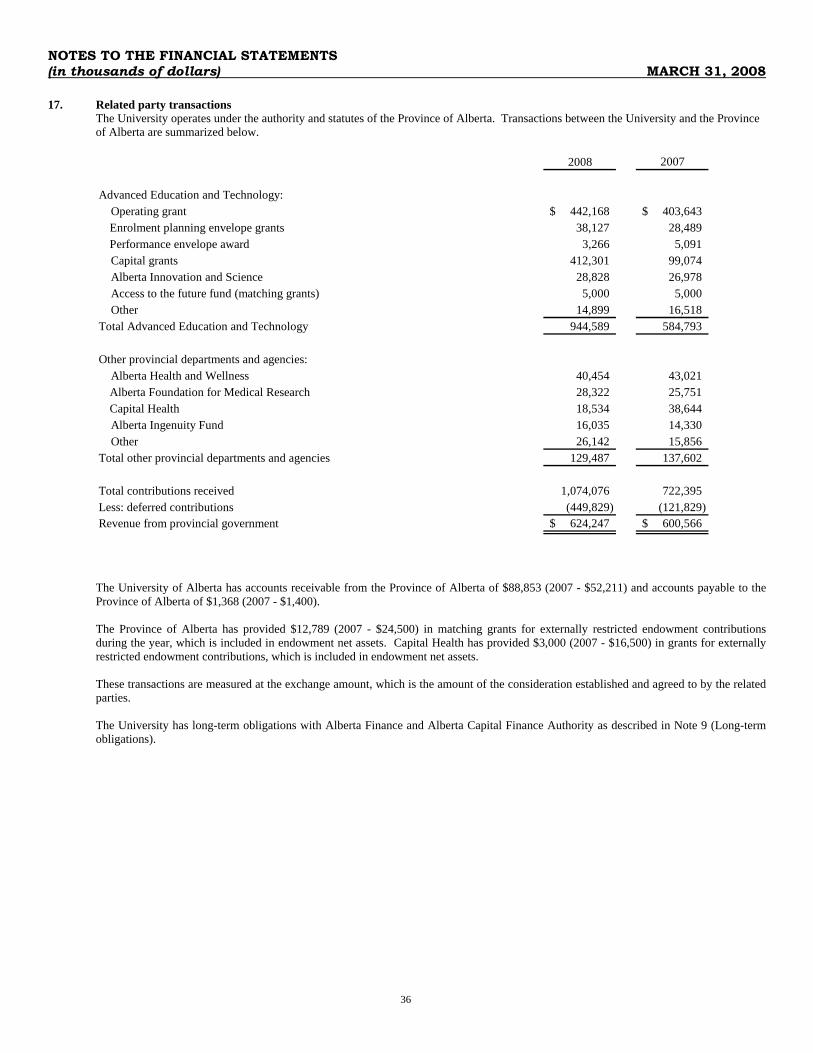
NOTES TO THE FINANCIAL STATEMENTS (in thousands of dollars) MARCH 31, 2008
36
17. Related party transactions The University operates under the authority and statutes of the Province of Alberta. Transactions between the University and the Province of Alberta are summarized below.
2008 2007
Advanced Education and Technology: Operating grant 442,168$ 403,643$
Enrolment planning envelope grants 38,127 28,489 Performance envelope award 3,266 5,091
Capital grants 412,301 99,074 Alberta Innovation and Science 28,828 26,978 Access to the future fund (matching grants) 5,000 5,000 Other 14,899 16,518 Total Advanced Education and Technology 944,589 584,793
Other provincial departments and agencies: Alberta Health and Wellness 40,454 43,021
Alberta Foundation for Medical Research 28,322 25,751 Capital Health 18,534 38,644
Alberta Ingenuity Fund 16,035 14,330 Other 26,142 15,856 Total other provincial departments and agencies 129,487 137,602 Total contributions received 1,074,076 722,395 Less: deferred contributions (449,829) (121,829) Revenue from provincial government 624,247$ 600,566$
The University of Alberta has accounts receivable from the Province of Alberta of $88,853 (2007 - $52,211) and accounts payable to the Province of Alberta of $1,368 (2007 - $1,400).
The Province of Alberta has provided $12,789 (2007 - $24,500) in matching grants for externally restricted endowment contributions
during the year, which is included in endowment net assets. Capital Health has provided $3,000 (2007 - $16,500) in grants for externally restricted endowment contributions, which is included in endowment net assets.
These transactions are measured at the exchange amount, which is the amount of the consideration established and agreed to by the related
parties. The University has long-term obligations with Alberta Finance and Alberta Capital Finance Authority as described in Note 9 (Long-term obligations).
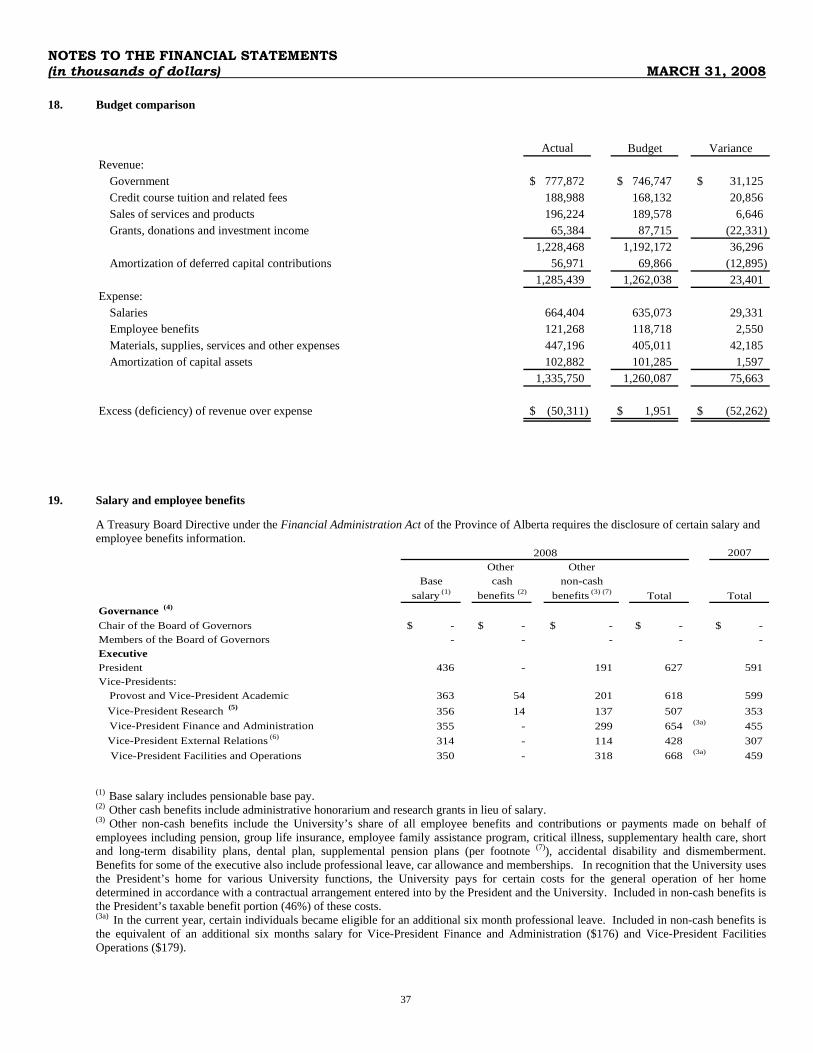
NOTES TO THE FINANCIAL STATEMENTS (in thousands of dollars) MARCH 31, 2008
37
18. Budget comparison
Actual Budget VarianceRevenue:
Government 777,872$ 746,747$ 31,125$ Credit course tuition and related fees 188,988 168,132 20,856 Sales of services and products 196,224 189,578 6,646 Grants, donations and investment income 65,384 87,715 (22,331)
1,228,468 1,192,172 36,296 Amortization of deferred capital contributions 56,971 69,866 (12,895)
1,285,439 1,262,038 23,401 Expense:
Salaries 664,404 635,073 29,331 Employee benefits 121,268 118,718 2,550 Materials, supplies, services and other expenses 447,196 405,011 42,185 Amortization of capital assets 102,882 101,285 1,597
1,335,750 1,260,087 75,663
Excess (deficiency) of revenue over expense (50,311)$ 1,951$ (52,262)$
19. Salary and employee benefits
A Treasury Board Directive under the Financial Administration Act of the Province of Alberta requires the disclosure of certain salary and employee benefits information.
2007Other Other
Base cash non-cashsalary (1) benefits (2) benefits (3) (7) Total Total
Governance (4) Chair of the Board of Governors -$ -$ -$ -$ -$ Members of the Board of Governors - - - - - ExecutivePresident 436 - 191 627 591 Vice-Presidents:
Provost and Vice-President Academic 363 54 201 618 599 Vice-President Research (5) 356 14 137 507 353
Vice-President Finance and Administration 355 - 299 654 (3a) 455 Vice-President External Relations (6) 314 - 114 428 307 Vice-President Facilities and Operations 350 - 318 668 (3a) 459
2008
(1) Base salary includes pensionable base pay. (2) Other cash benefits include administrative honorarium and research grants in lieu of salary. (3) Other non-cash benefits include the University’s share of all employee benefits and contributions or payments made on behalf of employees including pension, group life insurance, employee family assistance program, critical illness, supplementary health care, short and long-term disability plans, dental plan, supplemental pension plans (per footnote (7)), accidental disability and dismemberment. Benefits for some of the executive also include professional leave, car allowance and memberships. In recognition that the University uses the President’s home for various University functions, the University pays for certain costs for the general operation of her home determined in accordance with a contractual arrangement entered into by the President and the University. Included in non-cash benefits is the President’s taxable benefit portion (46%) of these costs. (3a) In the current year, certain individuals became eligible for an additional six month professional leave. Included in non-cash benefits is the equivalent of an additional six months salary for Vice-President Finance and Administration ($176) and Vice-President Facilities Operations ($179).
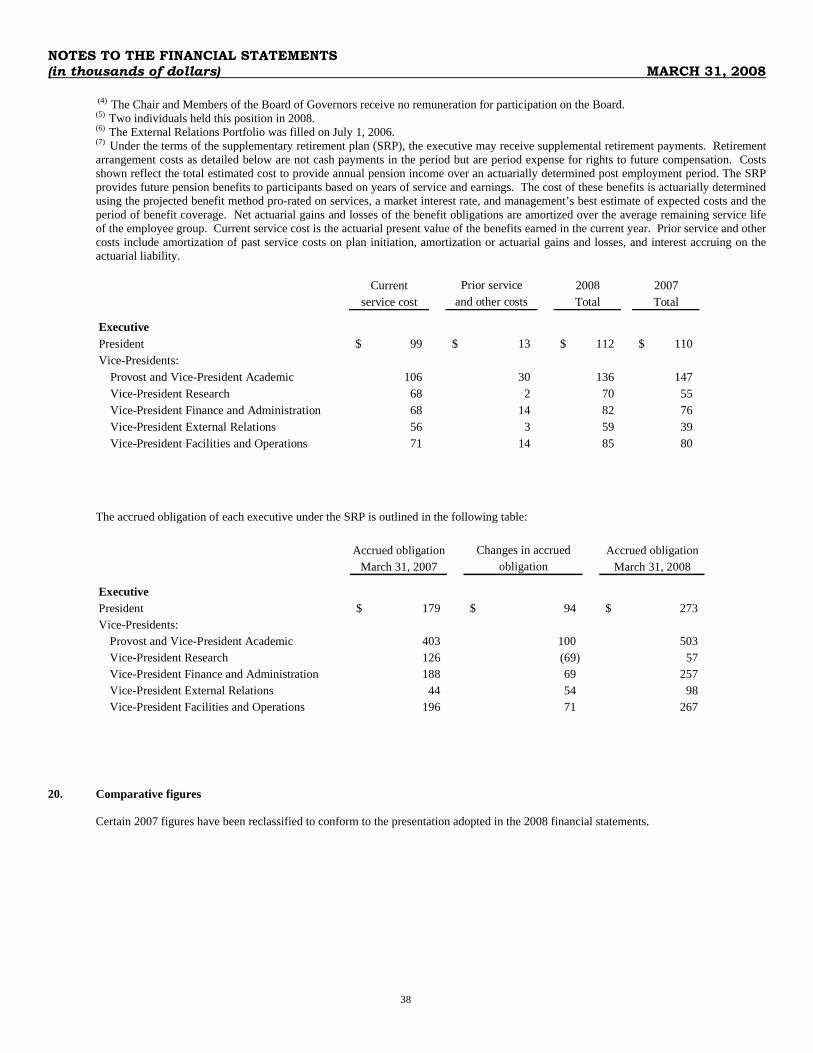
NOTES TO THE FINANCIAL STATEMENTS (in thousands of dollars) MARCH 31, 2008
38
(4) The Chair and Members of the Board of Governors receive no remuneration for participation on the Board. (5) Two individuals held this position in 2008. (6) The External Relations Portfolio was filled on July 1, 2006. (7) Under the terms of the supplementary retirement plan (SRP), the executive may receive supplemental retirement payments. Retirement arrangement costs as detailed below are not cash payments in the period but are period expense for rights to future compensation. Costs shown reflect the total estimated cost to provide annual pension income over an actuarially determined post employment period. The SRP provides future pension benefits to participants based on years of service and earnings. The cost of these benefits is actuarially determined using the projected benefit method pro-rated on services, a market interest rate, and management’s best estimate of expected costs and the period of benefit coverage. Net actuarial gains and losses of the benefit obligations are amortized over the average remaining service life of the employee group. Current service cost is the actuarial present value of the benefits earned in the current year. Prior service and other costs include amortization of past service costs on plan initiation, amortization or actuarial gains and losses, and interest accruing on the actuarial liability.
Current Prior service 2008 2007service cost and other costs Total Total
ExecutivePresident 99$ 13$ 112$ 110$ Vice-Presidents:
Provost and Vice-President Academic 106 30 136 147 Vice-President Research 68 2 70 55 Vice-President Finance and Administration 68 14 82 76 Vice-President External Relations 56 3 59 39 Vice-President Facilities and Operations 71 14 85 80
The accrued obligation of each executive under the SRP is outlined in the following table:
Accrued obligation Changes in accrued Accrued obligationMarch 31, 2007 obligation March 31, 2008
ExecutivePresident 179$ 94$ 273$ Vice-Presidents:
Provost and Vice-President Academic 403 100 503 Vice-President Research 126 (69) 57 Vice-President Finance and Administration 188 69 257 Vice-President External Relations 44 54 98 Vice-President Facilities and Operations 196 71 267
20. Comparative figures
Certain 2007 figures have been reclassified to conform to the presentation adopted in the 2008 financial statements.