Embed Size (px)
Citation preview
Citation for published version:Forte, B, Radicella, SM & Ezquer, RG 2002, 'A different approach to the analysis of GPS scintillation data',Annals of Geophysics, vol. 45, no. 3-4, pp. 551-561. https://doi.org/10.4401/ag-3522
DOI:10.4401/ag-3522
Publication date:2002
Document VersionPublisher's PDF, also known as Version of record
Link to publication
Publisher RightsCC BYThis work is licensed under a Creative Commons Attribution 3.0 License
University of Bath
General rightsCopyright and moral rights for the publications made accessible in the public portal are retained by the authors and/or other copyright ownersand it is a condition of accessing publications that users recognise and abide by the legal requirements associated with these rights.
Take down policyIf you believe that this document breaches copyright please contact us providing details, and we will remove access to the work immediatelyand investigate your claim.
Download date: 12. Oct. 2019
ANNALS OF GEOPHYSICS, VOL. 45, N. 3/4, June/August 2002
A different approach to the analysisof GPS scintillation data
Biagio Forte (1), Sandro M. Radicella (1) and Rodolfo G. Ezquer (2) (1) The Abdus Salam International Centre for Theoretical Physics, Trieste, Italy
(2) Laboratory of Ionosphere of National University of Tucuman - Tucuman Regional School of the National Technological University - CONICET - Argentina
Abstract Amplitude scintillation data from GPS were analyzed. The objective is to estimate the impact of ionospheric scintillations at Satellite Based Augmentation Systems Ranging and Integrity Monitoring Station (SBAS RIMS) level and at GPS user level. For this purpose, a new approach to the problem was considered. Data were studied from the point of view of the impact of scintillations on the calculation of VTEC at pierce points and ionospheric grid points. An ionospheric grid of 5°× 5° surface squares was assumed. From geometrical considerations and taking into account the basic principle to compute VTEC at grid points, with the data analyzed it is shown that scintillations very seldom affect the calculation of a grid point VTEC. Data from all the RIMS and for the entire GPS satellites network must be analyzed simultaneously to describe a realistic scenario for the impact of scintillations on SBAS. Finally, GPS scintillation data were analyzed at user level: service availability problems were encountered.
Key words ionospheric scintillations < GPS Irregularities producing scintillations are scintillation monitor < SBAS predominantly in the F layer, at altitudes ranging
from 200 to 1000 km with the primary disturbance region for high and equatorial latitude
1. Introduction irregularities between 250 and 400 km (Aarons, 1982). There are also times when E-layer ir-
A radio wave crossing the upper and lower regularities in the 90 to 100 km produce scinatmosphere of the Earth atmosphere suffers a tillation, particularly sporadic E and auroral E distortion of phase and amplitude. When it layers (Aarons, 1982). traverses drifting ionospheric irregularities, the Several techniques have been used to study radio wave experiences amplitude and phase irregularities giving rise to scintillations. These fluctuations which vary widely with its fre- include: ground, airborne and satellite based HF quency, but also with magnetic and solar activity, swept frequency vertical sounders studying time of day, season and location. These effects electron density structure and observing both are called amplitude and phase ionospheric bottomside and topside F-layer irregularities. scintillations. 1) In-situ measurements by rockets and
satellites of electron and ion density irregularities, electric fields, and electron and ion flux.
2) Coherent (VHF to microwave) radar backscatter.
Mailing address: Dr. Biagio Forte, Aeronomy and 3) Scintillation techniques which directlyRadiopropagation Laboratory, The Abdus Salam International Centre for Theoretical Physics, Strada Costiera 11, measure the perturbations of radio signal 34100 Trieste, Italy; e-mail: [email protected] traveling through the ionosphere (Aarons, 1982).
551
Biagio Forte, Sandro M. Radicella and Rodolfo G. Ezquer
2. Ionospheric scintillations phenomenology
For a wave propagating in an isotropic medium, all the points on the wave front have the same phase, whereas for a wave propagating in a non-isotropic medium the electron density irregularities act as antennas, in such a way that all the points on the wave front have different phase.
Scintillations are caused by scattering of radio waves by free electrons in the ionospheric plasma:scintillation may involve weak or strong scat-
than the Fresnel length, and diffractive scattering
representing the standard deviation of received power divided by the mean value and defined as (Briggs and Parkin, 1963)
¥¦
is assumed to involve irregularities having sizes near the Fresnel length.
<
In amplitude scintillation studies, two indices have been used: the first one is the index S4 ,
£¤
1 2/2 2I I (2.1)S =
4 I tering. The strongest scattering is observed in the equatorial and auroral regions, particularly in the where I is the field intensity. equatorial areas; scintillation tends to be weak The second index is SI, proposed as a con-at mid latitudes. The maximum scintillation venient approximate measure of scintillation and occurrence is at night. The geographical pattern defined byof occurrence is suggested in the well known P < P
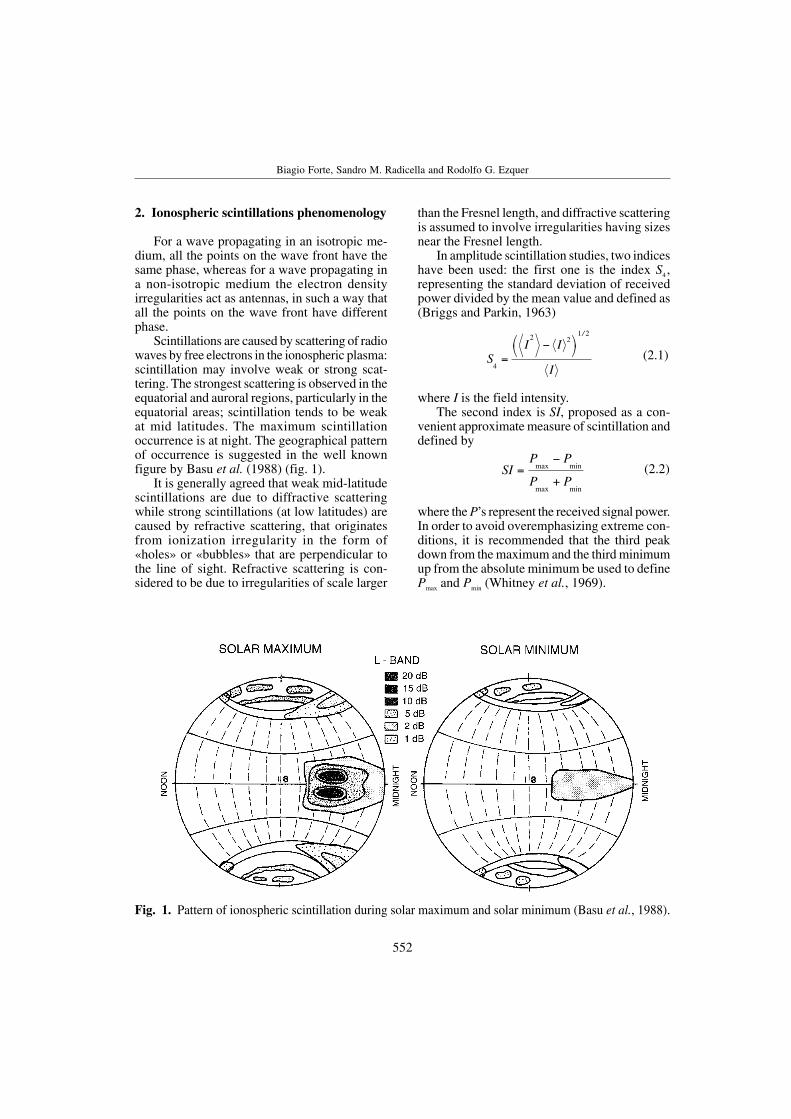
minfigure by Basu et al. (1988) (fig. 1). SI = max (2.2)It is generally agreed that weak mid-latitude
scintillations are due to diffractive scattering while strong scintillations (at low latitudes) are caused by refractive scattering, that originates from ionization irregularity in the form of «holes» or «bubbles» that are perpendicular to the line of sight. Refractive scattering is considered to be due to irregularities of scale larger
P + P max min
where the P’s represent the received signal power. In order to avoid overemphasizing extreme conditions, it is recommended that the third peak down from the maximum and the third minimum up from the absolute minimum be used to define P max and Pmin (Whitney et al., 1969).
Fig. 1. Pattern of ionospheric scintillation during solar maximum and solar minimum (Basu et al., 1988).
552
A different approach to the analysis of GPS scintillation data
Scintillation activity changes with geomagnetic latitude: it is higher in the region of geomagnetic equator and equatorial anomaly (low latitudes) and in the region of trough, plasma-pause and auroral oval (high latitudes), where irregularities appear more frequently.
The general behavior of scintillation activity is summarized in tables I, II and III where the main results of experimental observations are given. These observations correspond to fixed geometry conditions: only one station at a time looking at one geostationary satellite or localized in situ measurements and GPS signal observed from a single station.
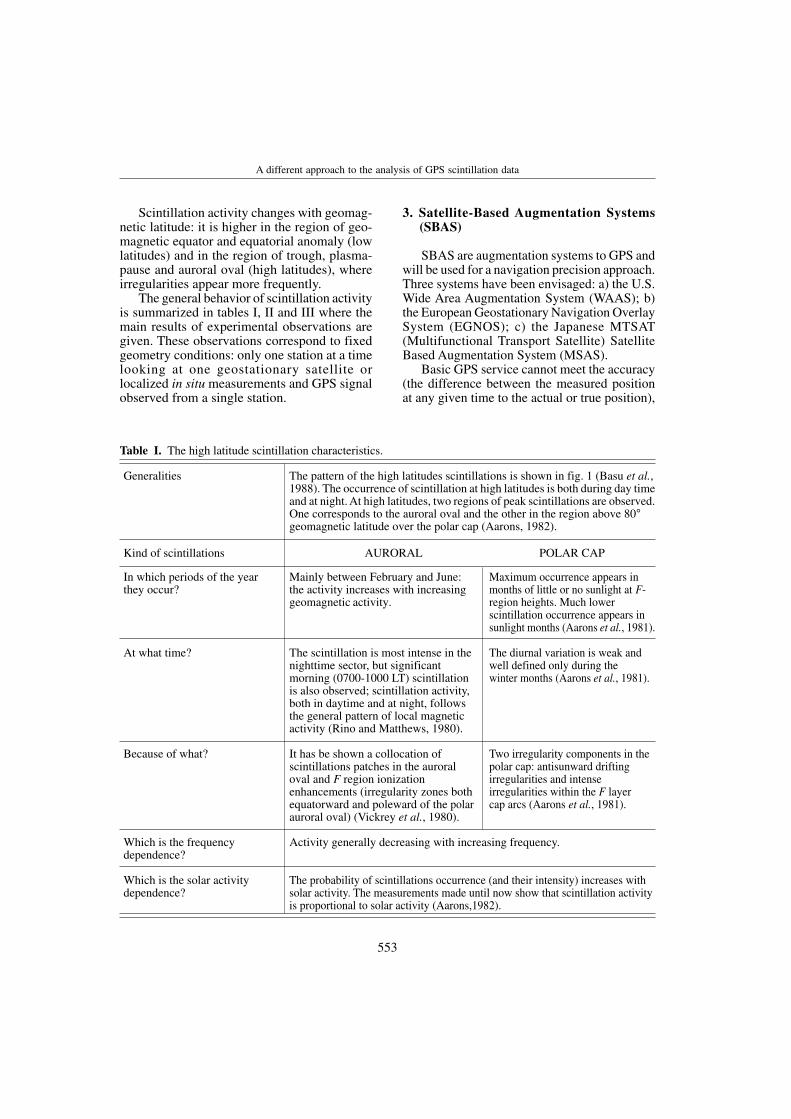
Table I. The high latitude scintillation characteristics.
3. Satellite-Based Augmentation Systems (SBAS)
SBAS are augmentation systems to GPS and will be used for a navigation precision approach. Three systems have been envisaged: a) the U.S. Wide Area Augmentation System (WAAS); b) the European Geostationary Navigation Overlay System (EGNOS); c) the Japanese MTSAT (Multifunctional Transport Satellite) Satellite Based Augmentation System (MSAS).
Basic GPS service cannot meet the accuracy (the difference between the measured position at any given time to the actual or true position),
Generalities The pattern of the high latitudes scintillations is shown in fig. 1 (Basu et al., 1988). The occurrence of scintillation at high latitudes is both during day time and at night. At high latitudes, two regions of peak scintillations are observed. One corresponds to the auroral oval and the other in the region above 80° geomagnetic latitude over the polar cap (Aarons, 1982).
Kind of scintillations AURORAL POLAR CAP
In which periods of the year they occur?
Mainly between February and June: the activity increases with increasing geomagnetic activity.
Maximum occurrence appears in months of little or no sunlight at F-region heights. Much lower scintillation occurrence appears in sunlight months (Aarons et al., 1981).
At what time? The scintillation is most intense in the nighttime sector, but significant morning (0700-1000 LT) scintillation is also observed; scintillation activity, both in daytime and at night, follows the general pattern of local magnetic activity (Rino and Matthews, 1980).
The diurnal variation is weak and well defined only during the winter months (Aarons et al., 1981).
Because of what? It has be shown a collocation of scintillations patches in the auroral oval and F region ionization enhancements (irregularity zones both equatorward and poleward of the polar auroral oval) (Vickrey et al., 1980).
Two irregularity components in the polar cap: antisunward drifting irregularities and intense irregularities within the F layer cap arcs (Aarons et al., 1981).
Which is the frequency dependence?
Activity generally decreasing with increasing frequency.
Which is the solar activity dependence?
The probability of scintillations occurrence (and their intensity) increases with solar activity. The measurements made until now show that scintillation activity is proportional to solar activity (Aarons,1982).
553
Biagio Forte, Sandro M. Radicella and Rodolfo G. Ezquer
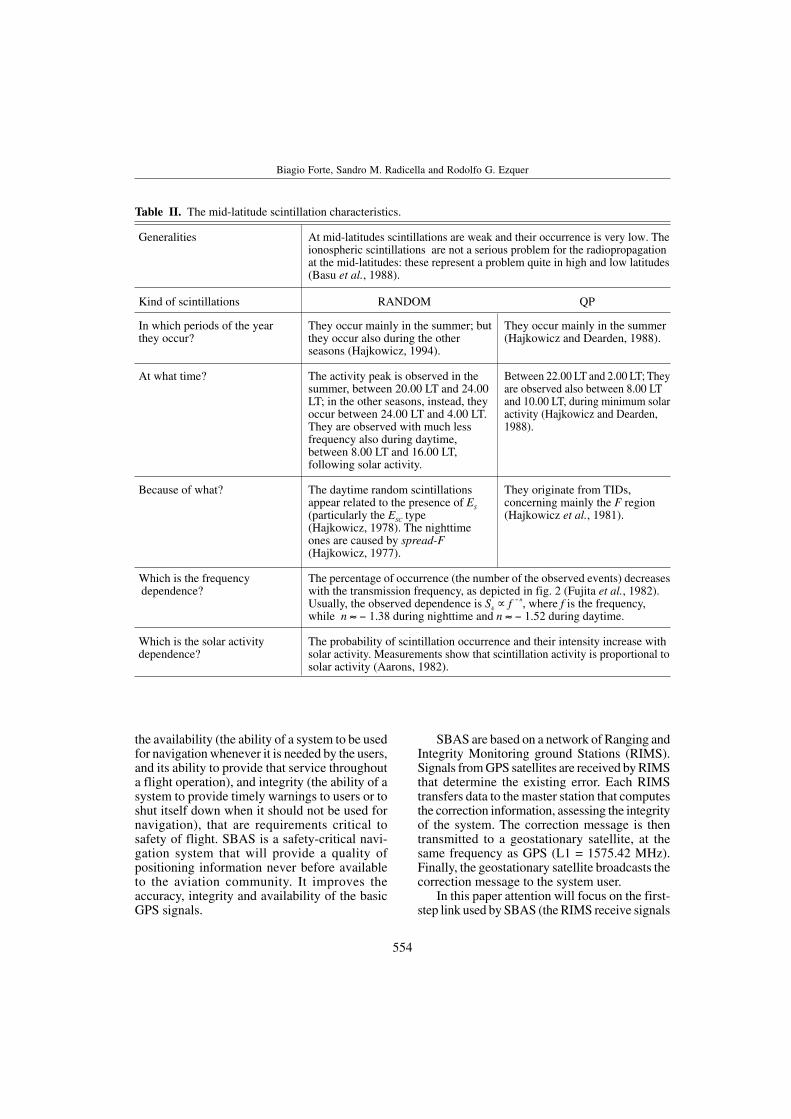
Table II. The mid-latitude scintillation characteristics.
Generalities At mid-latitudes scintillations are weak and their occurrence is very low. The ionospheric scintillations are not a serious problem for the radiopropagation at the mid-latitudes: these represent a problem quite in high and low latitudes (Basu et al., 1988).
Kind of scintillations RANDOM QP
In which periods of the year they occur?
They occur mainly in the summer; but they occur also during the other seasons (Hajkowicz, 1994).
They occur mainly in the summer (Hajkowicz and Dearden, 1988).
At what time? The activity peak is observed in the summer, between 20.00 LT and 24.00 LT; in the other seasons, instead, they occur between 24.00 LT and 4.00 LT. They are observed with much less frequency also during daytime, between 8.00 LT and 16.00 LT, following solar activity.
Between 22.00 LT and 2.00 LT; They are observed also between 8.00 LT and 10.00 LT, during minimum solar activity (Hajkowicz and Dearden, 1988).
Because of what? The daytime random scintillations appear related to the presence of ES
(particularly the ESC type (Hajkowicz, 1978). The nighttime ones are caused by spread-F (Hajkowicz, 1977).
They originate from TIDs, concerning mainly the F region (Hajkowicz et al., 1981).
Which is the frequency dependence?
The percentage of occurrence (the number of the observed events) decreases with the transmission frequency, as depicted in fig. 2 (Fujita et al., 1982). Usually, the observed dependence is S4 | f < n, where f is the frequency, while n 5 < 1.38 during nighttime and n 5 < 1.52 during daytime.
Which is the solar activity dependence?
The probability of scintillation occurrence and their intensity increase with solar activity. Measurements show that scintillation activity is proportional to solar activity (Aarons, 1982).
the availability (the ability of a system to be used for navigation whenever it is needed by the users, and its ability to provide that service throughout a flight operation), and integrity (the ability of a system to provide timely warnings to users or to shut itself down when it should not be used for navigation), that are requirements critical to safety of flight. SBAS is a safety-critical navigation system that will provide a quality of positioning information never before available to the aviation community. It improves the accuracy, integrity and availability of the basic GPS signals.
SBAS are based on a network of Ranging and Integrity Monitoring ground Stations (RIMS). Signals from GPS satellites are received by RIMS that determine the existing error. Each RIMS transfers data to the master station that computes the correction information, assessing the integrity of the system. The correction message is then transmitted to a geostationary satellite, at the same frequency as GPS (L1 = 1575.42 MHz). Finally, the geostationary satellite broadcasts the correction message to the system user.
In this paper attention will focus on the first-step link used by SBAS (the RIMS receive signals
554
A different approach to the analysis of GPS scintillation data
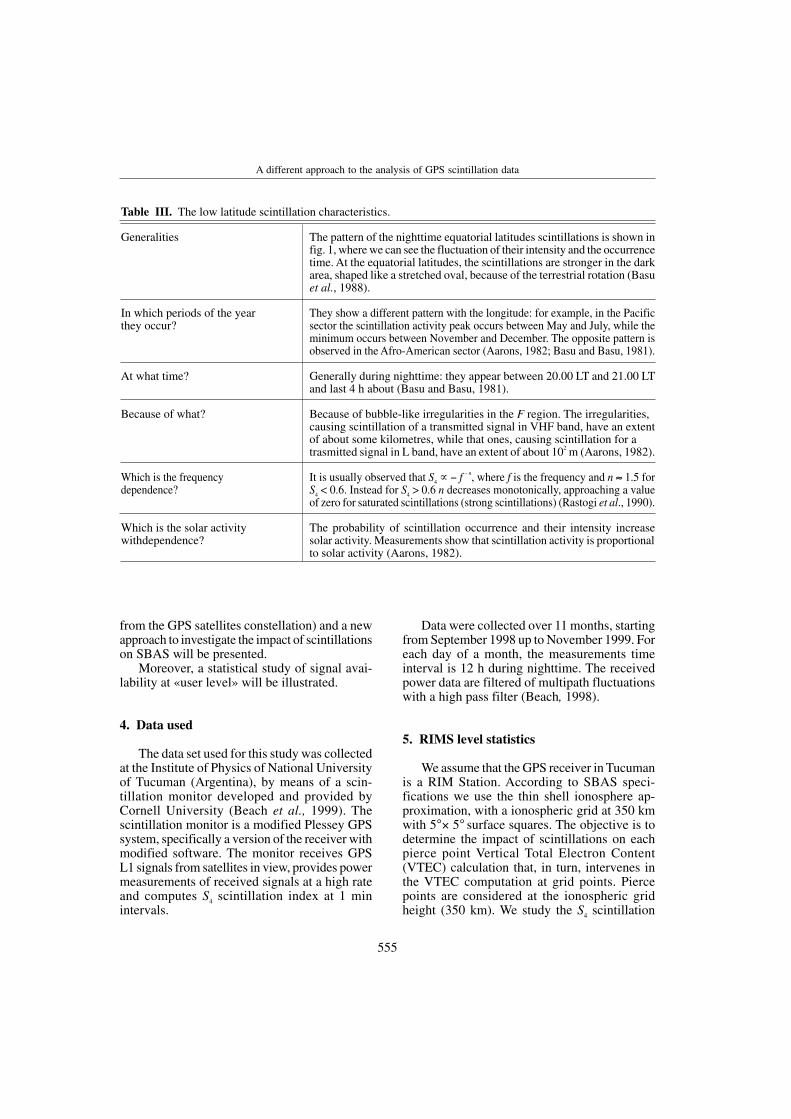
Table III. The low latitude scintillation characteristics.
Generalities
In which periods of the year they occur?
At what time?
Because of what?
Which is the frequency dependence?
Which is the solar activity withdependence?
The pattern of the nighttime equatorial latitudes scintillations is shown in fig. 1, where we can see the fluctuation of their intensity and the occurrence time. At the equatorial latitudes, the scintillations are stronger in the dark area, shaped like a stretched oval, because of the terrestrial rotation (Basu et al., 1988).
They show a different pattern with the longitude: for example, in the Pacific sector the scintillation activity peak occurs between May and July, while the minimum occurs between November and December. The opposite pattern is observed in the Afro-American sector (Aarons, 1982; Basu and Basu, 1981).
Generally during nighttime: they appear between 20.00 LT and 21.00 LT and last 4 h about (Basu and Basu, 1981).
Because of bubble-like irregularities in the F region. The irregularities, causing scintillation of a transmitted signal in VHF band, have an extent of about some kilometres, while that ones, causing scintillation for a trasmitted signal in L band, have an extent of about 102 m (Aarons, 1982).
It is usually observed that S4 | < f - n, where f is the frequency and n 5 1.5 for S4 < 0.6. Instead for S4 > 0.6 n decreases monotonically, approaching a value of zero for saturated scintillations (strong scintillations) (Rastogi et al., 1990).
The probability of scintillation occurrence and their intensity increase solar activity. Measurements show that scintillation activity is proportional to solar activity (Aarons, 1982).
from the GPS satellites constellation) and a new approach to investigate the impact of scintillations on SBAS will be presented.
Moreover, a statistical study of signal availability at «user level» will be illustrated.
4. Data used
The data set used for this study was collected at the Institute of Physics of National University of Tucuman (Argentina), by means of a scintillation monitor developed and provided by Cornell University (Beach et al., 1999). The scintillation monitor is a modified Plessey GPS system, specifically a version of the receiver with modified software. The monitor receives GPS L1 signals from satellites in view, provides power measurements of received signals at a high rate and computes S4 scintillation index at 1 min intervals.
Data were collected over 11 months, starting from September 1998 up to November 1999. For each day of a month, the measurements time interval is 12 h during nighttime. The received power data are filtered of multipath fluctuations with a high pass filter (Beach, 1998).
5. RIMS level statistics
We assume that the GPS receiver in Tucuman is a RIM Station. According to SBAS specifications we use the thin shell ionosphere approximation, with a ionospheric grid at 350 km with 5°× 5° surface squares. The objective is to determine the impact of scintillations on each pierce point Vertical Total Electron Content (VTEC) calculation that, in turn, intervenes in the VTEC computation at grid points. Pierce points are considered at the ionospheric grid height (350 km). We study the S4 scintillation
555
Biagio Forte, Sandro M. Radicella and Rodolfo G. Ezquer
index for every pierce point to determine the percentage of time where there is a «good» GPS signal to be used to compute VTEC. This defines the actual ionospheric conditions and computes the ionospheric error message for each ionospheric grid point to be sent to the users of the augmented GPS system.
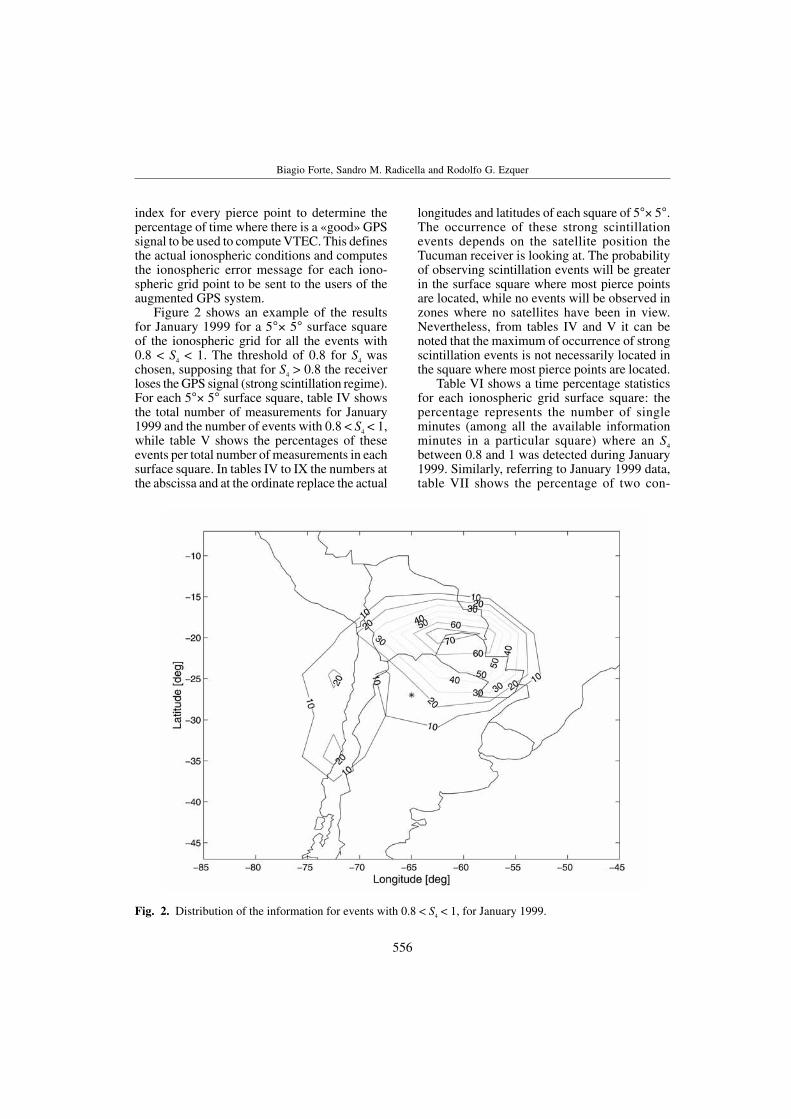
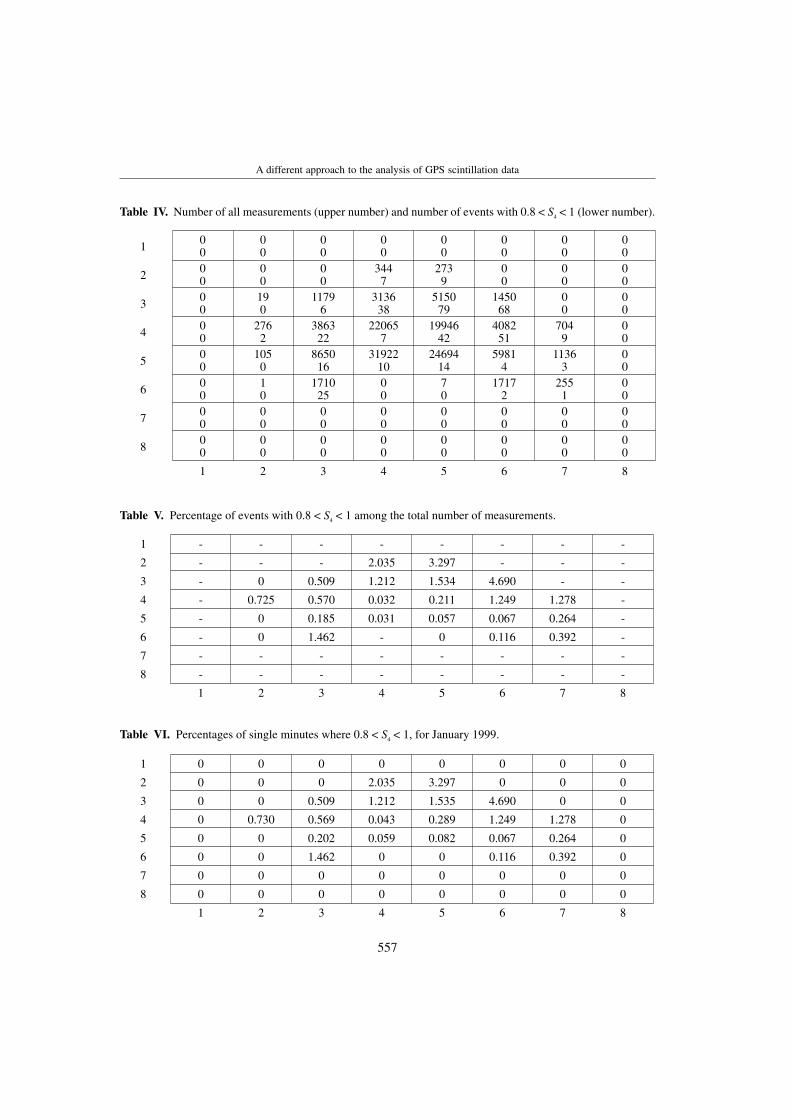
Figure 2 shows an example of the results for January 1999 for a 5°× 5° surface square of the ionospheric grid for all the events with 0.8 < S4 < 1. The threshold of 0.8 for S4 was chosen, supposing that for S4 > 0.8 the receiver loses the GPS signal (strong scintillation regime). For each 5°× 5° surface square, table IV shows the total number of measurements for January 1999 and the number of events with 0.8 < S4 < 1, while table V shows the percentages of these events per total number of measurements in each surface square. In tables IV to IX the numbers at the abscissa and at the ordinate replace the actual
longitudes and latitudes of each square of 5°× 5°. The occurrence of these strong scintillation events depends on the satellite position the Tucuman receiver is looking at. The probability of observing scintillation events will be greater in the surface square where most pierce points are located, while no events will be observed in zones where no satellites have been in view. Nevertheless, from tables IV and V it can be noted that the maximum of occurrence of strong scintillation events is not necessarily located in the square where most pierce points are located.
Table VI shows a time percentage statistics for each ionospheric grid surface square: the percentage represents the number of single minutes (among all the available information minutes in a particular square) where an S4
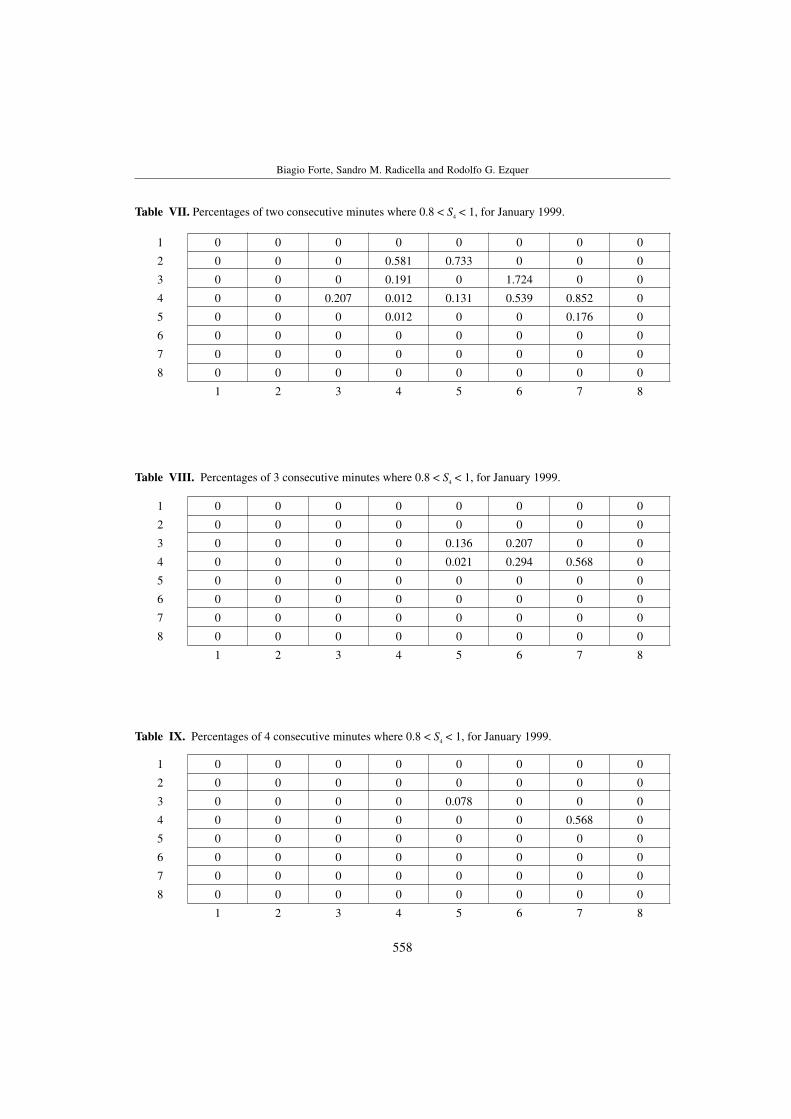
between 0.8 and 1 was detected during January 1999. Similarly, referring to January 1999 data, table VII shows the percentage of two con-
Fig. 2. Distribution of the information for events with 0.8 < S4 < 1, for January 1999.
556
A different approach to the analysis of GPS scintillation data
Table IV. Number of all measurements (upper number) and number of events with 0.8 < S4 < 1 (lower number).
1
2
3
4
5
6
7
8
0 0 0 0 0 0 0 0 0 0 0 0 0 0 0 0 0 0 0 344 273 0 0 0 0 0 0 7 9 0 0 0 0 19 1179 3136 5150 1450 0 0 0 0 6 38 79 68 0 0 0 276 3863 22065 19946 4082 704 0 0 2 22 7 42 51 9 0 0 105 8650 31922 24694 5981 1136 0 0 0 16 10 14 4 3 0 0 1 1710 0 7 1717 255 0 0 0 25 0 0 2 1 0 0 0 0 0 0 0 0 0 0 0 0 0 0 0 0 0 0 0 0 0 0 0 0 0 0 0 0 0 0 0 0 0
1 2 3 4 5 6 7 8
Table V. Percentage of events with 0.8 < S4 < 1 among the total number of measurements.
1
2
3
4
5
6
7
8
- - - - - - - -
- - - 2.035 3.297 - - -
- 0 0.509 1.212 1.534 4.690 - -
- 0.725 0.570 0.032 0.211 1.249 1.278 -
- 0 0.185 0.031 0.057 0.067 0.264 -
- 0 1.462 - 0 0.116 0.392 -
- - - - - - - -
- - - - - - - -
1 2 3 4 5 6 7 8
Table VI. Percentages of single minutes where 0.8 < S4 < 1, for January 1999.
1
2
3
4
5
6
7
8
0 0 0 0 0 0 0 0
0 0 0 2.035 3.297 0 0 0
0 0 0.509 1.212 1.535 4.690 0 0
0 0.730 0.569 0.043 0.289 1.249 1.278 0
0 0 0.202 0.059 0.082 0.067 0.264 0
0 0 1.462 0 0 0.116 0.392 0
0 0 0 0 0 0 0 0
0 0 0 0 0 0 0 0
1 2 3 4 5 6 7 8
557
1
2
3
4
5
6
7
8
Biagio Forte, Sandro M. Radicella and Rodolfo G. Ezquer
Table VII. Percentages of two consecutive minutes where 0.8 < S4 < 1, for January 1999.
1
2
3
4
5
6
7
8
0 0 0 0 0 0 0 0
0 0 0 0.581 0.733 0 0 0
0 0 0 0.191 0 1.724 0 0
0 0 0.207 0.012 0.131 0.539 0.852 0
0 0 0 0.012 0 0 0.176 0
0 0 0 0 0 0 0 0
0 0 0 0 0 0 0 0
0 0 0 0 0 0 0 0
1 2 3 4 5 6 7 8
Table VIII. Percentages of 3 consecutive minutes where 0.8 < S4 < 1, for January 1999.
1
2
3
4
5
6
7
8
0 0 0 0 0 0 0 0
0 0 0 0 0 0 0 0
0 0 0 0 0.136 0.207 0 0
0 0 0 0 0.021 0.294 0.568 0
0 0 0 0 0 0 0 0
0 0 0 0 0 0 0 0
0 0 0 0 0 0 0 0
0 0 0 0 0 0 0 0
1 2 3 4 5 6 7 8
Table IX. Percentages of 4 consecutive minutes where 0.8 < S4 < 1, for January 1999.
0 0 0 0 0 0 0 0
0 0 0 0 0 0 0 0
0 0 0 0 0.078 0 0 0
0 0 0 0 0 0 0.568 0
0 0 0 0 0 0 0 0
0 0 0 0 0 0 0 0
0 0 0 0 0 0 0 0
0 0 0 0 0 0 0 0
1 2 3 4 5 6 7 8
558
A different approach to the analysis of GPS scintillation data
secutive minutes for each square of the ionospheric grid. The same is for table VIII and IX corresponding to different cases of three and four consecutive minutes. There are some squares that are affected by scintillations events lasting several consecutive minutes. In these squares, no VTEC computation can be made for the given pierce points. Then, no calculation usable for the VTEC calculation at the grid points could be made for that square in the interval of time with consecutive minutes strong scintillations.
6. The geometry of the problem
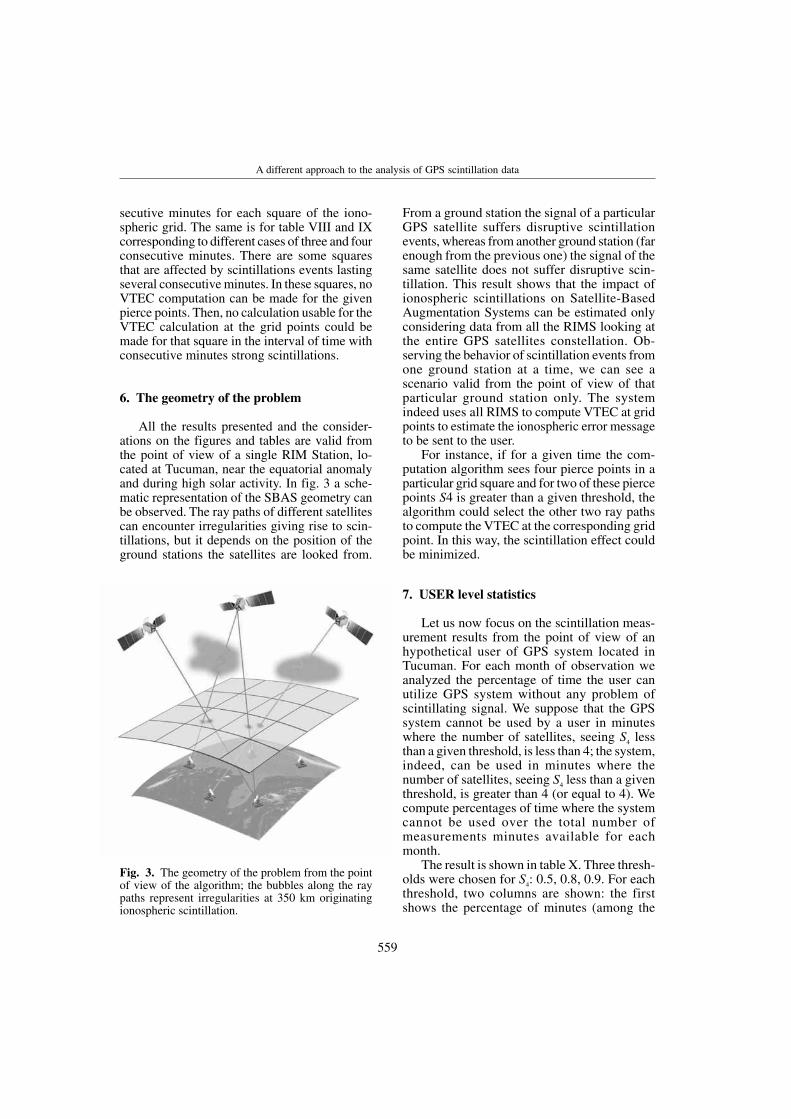
All the results presented and the considerations on the figures and tables are valid from the point of view of a single RIM Station, located at Tucuman, near the equatorial anomaly and during high solar activity. In fig. 3 a schematic representation of the SBAS geometry can be observed. The ray paths of different satellites can encounter irregularities giving rise to scintillations, but it depends on the position of the ground stations the satellites are looked from.
Fig. 3. The geometry of the problem from the point of view of the algorithm; the bubbles along the ray paths represent irregularities at 350 km originating ionospheric scintillation.
From a ground station the signal of a particular GPS satellite suffers disruptive scintillation events, whereas from another ground station (far enough from the previous one) the signal of the same satellite does not suffer disruptive scintillation. This result shows that the impact of ionospheric scintillations on Satellite-Based Augmentation Systems can be estimated only considering data from all the RIMS looking at the entire GPS satellites constellation. Observing the behavior of scintillation events from one ground station at a time, we can see a scenario valid from the point of view of that particular ground station only. The system indeed uses all RIMS to compute VTEC at grid points to estimate the ionospheric error message to be sent to the user.
For instance, if for a given time the computation algorithm sees four pierce points in a particular grid square and for two of these pierce points S4 is greater than a given threshold, the algorithm could select the other two ray paths to compute the VTEC at the corresponding grid point. In this way, the scintillation effect could be minimized.
7. USER level statistics
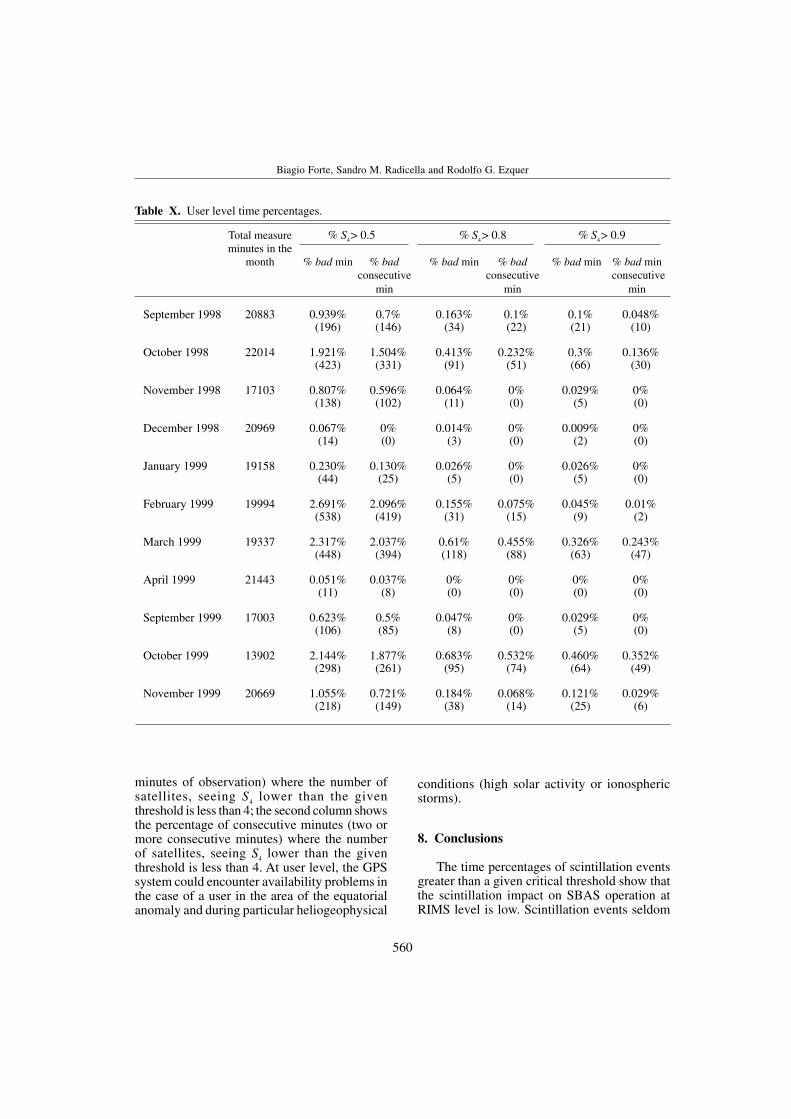
Let us now focus on the scintillation measurement results from the point of view of an hypothetical user of GPS system located in Tucuman. For each month of observation we analyzed the percentage of time the user can utilize GPS system without any problem of scintillating signal. We suppose that the GPS system cannot be used by a user in minutes where the number of satellites, seeing S4 less than a given threshold, is less than 4; the system, indeed, can be used in minutes where the number of satellites, seeing S4 less than a given threshold, is greater than 4 (or equal to 4). We compute percentages of time where the system cannot be used over the total number of measurements minutes available for each month.
The result is shown in table X. Three thresholds were chosen for S4: 0.5, 0.8, 0.9. For each threshold, two columns are shown: the first shows the percentage of minutes (among the
559
Biagio Forte, Sandro M. Radicella and Rodolfo G. Ezquer
Table X. User level time percentages.
Total measure minutes in the
month
% S4 > 0.5
% bad min % bad consecutive
min
% S4 > 0.8
% bad min % bad consecutive
min
% S4 > 0.9
% bad min % bad min consecutive
min
September 1998 20883 0.939% (196)
0.7% (146)
0.163% (34)
0.1% (22)
0.1% (21)
0.048% (10)
October 1998 22014 1.921% (423)
1.504% (331)
0.413% (91)
0.232% (51)
0.3% (66)
0.136% (30)
November 1998 17103 0.807% (138)
0.596% (102)
0.064% (11)
0% (0)
0.029% (5)
0% (0)
December 1998 20969 0.067% (14)
0% (0)
0.014% (3)
0% (0)
0.009% (2)
0% (0)
January 1999 19158 0.230% (44)
0.130% (25)
0.026% (5)
0% (0)
0.026% (5)
0% (0)
February 1999 19994 2.691% (538)
2.096% (419)
0.155% (31)
0.075% (15)
0.045% (9)
0.01% (2)
March 1999 19337 2.317% (448)
2.037% (394)
0.61% (118)
0.455% (88)
0.326% (63)
0.243% (47)
April 1999 21443 0.051% (11)
0.037% (8)
0% (0)
0% (0)
0% (0)
0% (0)
September 1999 17003 0.623% (106)
0.5% (85)
0.047% (8)
0% (0)
0.029% (5)
0% (0)
October 1999 13902 2.144% (298)
1.877% (261)
0.683% (95)
0.532% (74)
0.460% (64)
0.352% (49)
November 1999 20669 1.055% (218)
0.721% (149)
0.184% (38)
0.068% (14)
0.121% (25)
0.029% (6)
minutes of observation) where the number of satellites, seeing S4 lower than the given threshold is less than 4; the second column shows the percentage of consecutive minutes (two or more consecutive minutes) where the number of satellites, seeing S4 lower than the given threshold is less than 4. At user level, the GPS system could encounter availability problems in the case of a user in the area of the equatorial anomaly and during particular heliogeophysical
conditions (high solar activity or ionospheric storms).
8. Conclusions
The time percentages of scintillation events greater than a given critical threshold show that the scintillation impact on SBAS operation at RIMS level is low. Scintillation events seldom
560
A different approach to the analysis of GPS scintillation data
affect the system at this level. The impact becomes still lower if the number of RIMS is increased for the calculation of VTEC at a given grid point. In this case, the time percentages shown for different cases in tables IV-IX could be lower, with improving availability, integrity and safety of SBAS.
Previous analyses of scintillation behavior are based on data collected at single and isolated stations. The results found are not readily applicable to SBAS, because such systems have a multi-RIM Station geometry rather than a single-station geometry. If a particular RIMS is detecting high scintillation events from a given GPS satellite probably from another RIMS (far from the previous one), the signal from the same satellite is no longer affected by high scintillation events. If the signal to the first RIMS can go through an irregularity causing scintillations, the signal to the second RIMS probably does not go through any irregularity, suffering no scintillation problems. The SBAS algorithm then could select the second signal data to compute VTEC at grid points.
The time percentages shown in tables IV to IX were computed assuming loss of lock when S4 > 0.8. As only amplitude scintillations data were available, this threshold was chosen assuming the phase screen approximation to estimate the correlation between phase and amplitude scintillations.
The analysis method illustrated represents the starting point to describe a more realistic scenario for the impact of scintillations on SBAS: the next step is the simultaneous analysis of data from all the RIMS. Finally, the data analysis made at USER level also describes a realistic scenario. The impact of scintillations on a single frequency receiver is evaluated by means of percentages of minutes where the number of satellites, seeing S4 less than a given threshold, is less than 4 (table X). Once again, the thresholds were theoretically fixed. The results show that in some cases system availability problems could be encountered.
Acknowledgements
The data showed in this work were measured by means of a receiver kindly provided by Dr. P. Kintner (Cornell University).
REFERENCES
AARONS, J. (1982): Global morphology of ionospheric scintillations, Proc. IEEE, 70 (4), 360-378.
AARONS, J., J.P. MULLEN and H.E. WHITNEY (1981): UHF scintillation activity over polar latitudes, Geophys. Res. Lett., 8 (3), 277-280.
BASU, S. and S. BASU (1981): Equatorial scintillations-a review, J. Atmos. Terr. Phys., 43 (5), 473-489.
BASU, S., E. MACKENZIE and SU. BASU (1988): Ionospheric constraints on VHF/UHF communications links during solar maximum and minimum periods, Radio Sci., 23 (3), 363-378.
BEACH, T.L. (1998): Global Positioning System studies of equatorial scintillations, Ph.D. Thesis, Cornell University, Ithaca, New York.
BEACH, T.L. and P.M. KINTNER (1999): Simultaneous Global Positioning System observations of equatorial scintillations and total electron content fluctuations, J. Geophys. Res., 104 (A10), 22,553-22,565.
BRIGGS, B.H. and I.A. PARKINS (1963): On the variation of radio star and satellite scintillations with zenith angle, J. Atmos. Terr. Phys., 25, 339-365.
FUJITA, M., K. SINNO and T. OGAWA (1982): Frequency dependence of ionospheric scintillations and its application to spectral estimation of electron density irregularities, J. Atmos. Terr. Phys., 44 (1), 13-18.
HAJKOWICZ, L.A. (1977): Morphological and ionospheric aspects of quasiperiodic scintillations, J. Atmos. Terr. Phys., 39, 833-841.
HAJKOWICZ, L.A. (1978): Multi-satellite scintillations spread-F and sporadic-E over Brisbane-2, J. Atmos. Terr. Phys., 40, 99-104.
HAJKOWICZ, L.A. (1994): Types of ionospheric scintillations in southern mid-latitudes during the last sunspot maximum, J. Atmos. Terr. Phys., 56 (3), 391-399.
HAJKOWICZ, L.A., and D.J. DEARDEN (1988): Observations of random and quasi-periodic scintillations at southern mid-latitudes over a solar cycle, J. Atmos. Terr. Phys., 50 (6), 511-517.
HAJKOWICZ, L.A., E.N. BRAMLEY and R. BROWING (1981): Drift analysis of random and quasiperiodic scintillations in the ionosphere, J. Atmos. Terr. Phys., 43 (7), 723-733.
RASTOGI, R.G., P.V. KOPARKAR, H. CHANDRA and M.R. DESHPANDE (1990): Multifrequency studies of equatorial ionospheric scintillations at Ootacamund, J. Atmos. Terr. Phys., 52 (1), 69-76.
RINO, C.L. and S.J. MATTHEWS (1980): On the morphology of auroral zone radio wave scintillation, J. Gephys. Res., 85 (A8), 4139-4151.
VICKREY, J.F., C.L. RINO and T.A. POTEMRA (1980): Chatanika/Triad observations of unstable ionization enhancements in the auroral F-region, Geophys. Res. Lett., 7 (10), 789-792.
WHITNEY, H.E., C. MALIK and J. AARONS (1969): Aproposed index for measuring ionospheric scintillation, Planet. Space Sci., 17, 1069-1073.
(received April 8, 2002; accepted August 26, 2002)
561