Embed Size (px)
Citation preview
UNIVERSITY OF CALIFORNIA
Los Angeles
Nitrification Enhancement by Powdered Activated
Carbon Addition In Activated Sludge
A dissertation submitted in partial satisfaction of the
requirements for the Doctor of Philosophy
in Engineering
by
Adam S . Ng
1985

The dissertation of Adam S. Ng is approved .
Robert A. Mah
7t4L& K.SLL~Michael S . Stenstrom, Committee Chair
University of California, Los Angeles
9 85
ii

This is dedicated to my parents, family and B .

Table of l, Contents
Page
LIST OF FIGURES y viii
LIST OF TABLES zi
LIST OF ABBREVIATIONS ziii
ACKNOWLEDGMENT ziv
ABSTRACT zvi
1. INTRODUCTIONj, 1
2. LITERATURE REVIEW~ 8
A. NITRIFICATION 8
Biocheaistry~ 8
Ammonia Oxidation by Nitro~toaoaas
9
Oxidation of Nitrite to N4rate by Nitrobacter14
Energetics and Energy Assi ilation 17
Microbiology of Nitrification 20
General Characteristics ofiiNitrifiers 20
Nutritional Growth Requireiients 22
Kinetics of
25
Monod Kinetics 25
Nitrification in Activated Sledge Processes 39
MCRT, OLR and HRT 40
Effect of Temperature on N~trification 44
pH and Alkalinity Effect
n Nitrification47
Effect of Dissolved Oxygen on Nitrification50I
B.INHIBITION OF NITRIFICATION....56Enzyme Inhibition57Michaelis-Menten Kinetics.k59Classical Enzyme Inhibitio Mechanisms60iiCharacterization of Inhibition• • 65
C .
D .
Specific Inhibitors of Nitrif Iicatioa 7011
Substrate and End Product nhibition inNitrification . . . . • • . . • • •0.• . • .00•• • • • • ..71Specific Inhibitors of Nit~ifieation in PureCulture Studies . • . . . • '• • • • . • ..• ..•• . 75
Specific Inhibitors of Nit ification inActivated Sludge ., .**• . • ..• . •80
PAC-ENHANCED NITRIFICATION • • • • • • • • • • • • • • • 92
Proposed Mechanisms for PAC-E hanced Nitrification97
Adsorption of Inhibitory Compounds . . .0 . • . •• • ..• • • • 97
Preferential Microbial Attachment • •• • • • • • 97
Enhanced Bioactivity 98
Bioregeaeration• • • • ...• • ..• • ..• . • • • ..• • • • • • ..• ..98CHARACTERISTICS OF ACTIVATED
BONS• • • • • ...• • •100
Isotherms 101
Langmnir•• • . •••101
Freundlich IsothermI • • • • • . .102
BET• • • • . •• . . . .103
Specific Indicators of Carbon Properties 104
Adsorption Characteristics of Various OrganicCompounds•• • • • • ..• ..• •• ...•107
3 . EXPERIMENTAL METHODS4•• . • • • • • • • • • • • • • • • . 114
A . EXPERIMENTAL APPARATUS • • • • • • • . • • • • . 114I

B.
4 .
A .
Reactors and Associated Ex erimental Equipment114
Feed Systems and Substrates„ ,, 117
Glucose-Based Feed Dilutio System 117
Glucose Substrate Composition, 117
Refinery astewater Feed . .,P 120
Reactor Start-up and Opera ion 122
EXPERIMENTAL PROCEDURESIIr 126
Isotherm Studies
Batch Experiments with Spe'ific Inhibitorsof Nitrification 127
Chronic Experiments with iline 130
Carbon Dose Experiments 133
126
C. ANALYTICAL PROCEDURES 136
Analysis of Ammonia-N 136
Analysis of Nitrite-N 136
Analysis of Nitrate-N 137
Analysis of Organic NitrogS~n 140'
Gas Liquid Chromatography taalysis 141
TOC Analysisf
144
Analysis of MLSS and MLVSS 144
RESULTS AND DISCUSSION 148
PRELIMINARY EXPERIMENTS 148
GC/MS Analysis' 148
Refinery astewater Isothe s 152
Aniline Isotherms 165
B. BATCH INHIBITION EXPERIMENTS 172
C. CHRONIC EXPERIMENTS 181

E .
5 .
Preliminary Discussion * . . . . 19411
Discussion on Carbon Dose ~xperiments 229
ADDITIONAL OBSERVATIONS 241
SUMMARY AND CONCLUSIONS 245
Conclusions 248
REFERENCES
250I
APPENDICES j 264
LIST 0 FIGURES
Page
Fig . 1
Proposed Oxidation Pathwa of Ammonia to Nitrite15
Fig . 2
Proposed Mechanism of Rev rsed Electron Flow21
Fig . 3
Effect - of Sludge Age on N trification 43
Fig . 4
Effects of Double Substra e Limiting Kinetics55
Fig . 5
Plot of Michaelis-Menten quation 61
Fig . 6
Effect of Inhibitor Type n Lineweaver-Burke Analysis67
Fig . 7
Reactors and Associated A paratus 115
Fig . 8
Substrate Dilution System 118
Fig . 9
Refinery astewater Isoth rm : q vs . Cc for PAC154
Fig . 10 Refinery astewater Isoth rm : In q vs . In Cc for PAC155
Fig . 11 Refinery astewater Isoth rm : 1/q vs . 1/ce for PAC156
Fig. 12 Refinery astewater Isot rm : q vs . Cc for Bentonite157
Fig . 13
Refinery astewater Isot rm : In q vs . In Ccfor Bentonite 158
Fig. 14
Refinery astewater Iso
rm : 1/q vs . 1/Cefor Bentonite 159
Fig . 15
Cumulative SOC Probabilit of Refinery Reactors160
Fig . 16 Cumulative TOC Reduction fficiency Probability161
Fig . 17 Cumulative Effluent SOC obability for GlucoseReactors 163
Fig . 18 Aniline Isotherm : q vs . a for PAC 168
Fig . 19 Aniline Isotherm : log q s . log Cc for PAC169
Fig . 20 Aniline Isotherm : q vs . a for Bentonite170
Fig . 21
Aniline Isotherm : log q s . log Cc for Bentonite171
Fig . 22 First Chronic Test : Amon
Fig . 23 First Chronic Test : Caust
Fig . 24 First Chronic Test : Nitra
Fig . 25 Second Chronic Test : Ammo
Fig . 26 Second Chronic Test : SOC
Fig . 27 Second Chronic Test : NO2
Fig . 28 Second Chronic Test : Nitr
Fig . 29 Second Chronic Test : Nitr
Fig . 30 Carbon Dose Experiment :
Fig . 31 Carbon Dose Experiment : N
Fig . 32 Carbon Dose Experiment : C
Fig . 33 Inorganic Nitrogen Produc ion and FilteredTIN vs . Time 200
Fig . 35
Fig . 36 Ammonia vs . Time for 10 m
Fig . 37 Nitrate vs . Time for 10 m
Fig . 38 Ammonia vs . Time for 20 m
Fig . 39 Nitrate vs . Time for 20 m
a vs . time 182
Uptake vs . time183
e vs . time 184
a vs . time 185
. time 186
r N03 vs, time187
to vs . time 188
to vs . time 189
onia vs . Time196
trate vs . Time197
ustic Uptake vs . Time198
Fig . 34
Inorganic Nitrogen Produc ion and FilteredTIN vs . Time' 201
Unfiltered TIN and KN vs .(Time 202
/1 Aniline Spike207
/1 Aniline Spike208
/1 Phenol Spike209
/1 Cyanide Spike210
Fig . 40 Ammonia vs . Time for 0.7 g/l Cyanide Spike211
Fig . 41
Nitrate vs . Time for 0.7 g/l Cyanide Spike212
Fig . 42 Ammonia vs . Time for 1 .4 g/l Cyanide Spike213
Fig . 43
Nitrate vs . Time for 1 .4 g/l Cyanide Spike214
Fig . 44 Ammonia vs . Time for 2500 mg/l Ethanol Spike215
Fig . 45
Nitrate vs . Time for 25001, mg/l Ethanol Spike216
Fig . 46 Ammonia vs . Time for 10 m /1 Aniline Spike217
Fig . 59
Cumulative Ammonia Probability for GlucoseReactors, 243
Fig . 60 Cumulative Ammonia Probability for GlucoseReactors 244
Fig . 52 Percent Inhibition vs . P rcent Inorganic N Loss(Aniline, 10 mg/1) 226
Fig . 53 Percent Inhibition vs . P(Phenol, 20 mg/l and 250
rcentmg/l
Inorganic N LossEthanol)227
Fig . 54 Percent Inhibition vs . P(Phenol, 20 mg/l and 250
rcentmg/l
Inorganic N LossEthanol)227
Fig . 55 Percent Inhibition vs . P rcent Inorganic N Loss(Cyanide, 0 .7 mg/l and 1 mg/1) 228
Fig . 56 Percent Inhibition vs . P rcent Inorganic N Loss(Cyanide, 0 .7 mg/l and 1 . mg/1) 228
Fig . 57 Inhibition Coefficient I (NH3-N) vs . PACExperiments237Dosage for All Carbon Do
Fig . 58 Inhibition Coefficient IDosage for All Carbon Do
(NH3-N) vs . PACExperiments238,-
Fig . 47 Nitrite vs . Time for 10 g/l Aniline Spike218
Fig . 48 Nitrate vs . Time for 10 g/l Aniline Spike219
Fig . 49 Liquid Phase Aniline vs . Time 220
Fig . 50 Percent Inhibition vs . Percent Inorganic Nitrogen Loss224
Fig . 51 Percent Inhibition vs . P rcent Inorganic N Loss(Aniline, 10 mg/1) 226
TABLES
Page
Reactions 18
logical Characteristics • . . . • • • . •23
of Nitrifiers26
g Monod Parametera31
Kinetic Constants 32
of Kinetic Coefficients34
aturation Coefficients52
1 Agents and Possible 58
Lineweaver-Burke 66
Inhibitors in the • • • o e-82
s 106
rameters Literature 108
astewater 119
entrations 121
Different ISAs139
of the GC/MS Analysis149
harm Data 153
MLVSS Concentrations • . . .164
LIST 0
Table 1 Standard Free Energy of
Table 2 Morphological and Physiof the Nitrifiers
Table 3 Nutritional Requirement
Table 4 Techniques for Estimati
Table 5 Typical Values of Monodfor Nitrifiers
Table 6 Comparison of the Range
Table 7 Summary of Oxygen Half
Table 8 Major Inhibitory ChemicModes of Inhibition. . . .
Table 9 Linearized Equations foAnalysis
Table 10 Summary of NitrificatioLiterature Review
Table 11 Typical Carbon Properti
Table 12 Results of Adsorption PReview
Table 13 Composition of Syntheti
Table 14 Calculated Influent Con
Table 15 Comparative Results wit
Table 16 Results and Comparisons
Table 17 Refinery astewater Iso
Table 18 Oxygen Uptake Rates andat Various Times

Table 19
Table 20
Table 21
Table 22
Table 23
Table 24
Table 25
Adsorption and Inhibito y Characteristics ofCompounds used in Carbo Dose Experiments205
Ammonia and Nitrate Rea tion Rate Constantsfor Carbon Dose Experi nts 221
Table 26
Table 27
Table 28
Table 29
Aniline Isotherm Results o .166
Calculated Isotherm Par motors 167
Calculated Ammonia Ratel'Constants, Y9174
Ammonia Oxidation Rate nhibition Coefficients176
Analysis of Covariance ." 179
Results of the Initial arbon Dose Experiment195
Percent Inhibition and ercent Inorganic N Lossfor Carbon Dose Experim nts 225
Inhibition Coefficient
(NH3-N) vs PACDosage for All Carbon D se Experiments235
Inhibition Coefficient
(N03-N) vs PACDosage for All Carbon D se Experiments236
AI
AN I
Ben
DO
GC
GNC
HRT
ISA
KN
MCRT
ML SS
MLVSS
NAI
NANI
R
RC
RNC
SOC
SCFH
List of Abbreviations
Adsorbable,
ibitory
Adsorbable, No -inhibitory
Bentonite Reac or
Dissolved Oxyg
Glucose Activa
Glucose Non-Ac
Hydraulic Rate
Ionic Strength
Kjeldahl Nitro
Mean Cell Rate
Mixed Liquor S
Mixed Liquor
Non-adsorbable,, inhibitory
Non-adsorbable,, non-inhibitory
star
star Fed PAC Reactor
ater Fed Non-PAC Reactor
Carbon
Refinery ast
Refinery ast
Refinery aste
Soluble Organ
Standard Cubi
x
c
iii
n
ad Carbon Reactor
ivated Carbon Reactor
tion Time, days
Adjuster
en
tion Time, days
spended Solids, mg/l
latile Suspended Solids, mg/l
Feet per Hour
ACKNO DGEMENTS
I wish to express my utmost appreciation to my graduate advisor,
Dr . Michael K. Stenstrom for his unwavering support, patience and
friendship throughout graduate study ; and to members of the doctoral
committee, Professors Robert A . Mah,j'I illiam Y-G Yeh, J .B. Neethling and
Robert Lindberg for their help in the preparation of this dissertation .
I acknowledge Dr . ohn A. Dracup for, his encouragement . I am especially
grateful to Dr . Stenstrom and Dr . Mah for the priviledge of studying
under their guidance .
I also wish to thank the following for their tolerance and help
throughout my graduate studies ;
To Dr . Hyung ( eff) loo Hwang for all his patience, effort and longs
hours making the uncompr~ hensible more comprehensible .
To Stephen Song for his techni lal advice and his more often than
not fruitful discussions on nitrification .
To laboratory mates Gail Masut
, Prasanta Bhunia, Seth Abramson,
Dr . Boa Tran, Hamid Nej
and Sami Fam for their moral sup-
port, encouragement, andi'Icomic relief .
To Deborah Haines for preparation of the final manuscript and a
continuous supply of candy striped mints and Mr . Preztels .I
The author is grateful for financial assistance provided in part
by the Standard Oil Company of Ohio (SOHIO) and in part by the National
Science Foundation (No . CME-7911792)!! .
V TA
November 10, 1953-Born, San Franci co, Cailfornia
1976--A.B., Environmental Biology, niversity of Calfornia . Berkeley
1979--Master of Public Health in En ironmental Health,
University of California, Los'Angeles
1984--Advance to Candidacy, Doctor of Philosophy,
School of Engineering and Appl ied Science, UCLA
Publications
Stenstrom, M .I., Ng, A.S ., . Bhunia' P.I . and S .D . Abramson (1983)Anaerobic Digestion of Municipal olid aste, ournal of EnvironmentalEngineering, ASCE, 109 (5), pp. 114 -1158 .
Stenstrom, M.I., Vazirinejad, H.R. nd A.S . Ng (1984) Economic Evalua-tion of Upgrading Aeration System , ournal of ater Pollution ControlFed ., 56 (20), pp . 20-25 .
Ng, A .S ., ong, D .Y ., Stenstrom, M. ., Larson, L ., and R .A. Mah (1984)Bioconversion of Classified Muni ipal Solid aste : State -of-the-ArtReview and Recent Advances, Chapter in Fuel Gas Develovments, Ed. DonaldL . ise, CRC Press, Inc ., Boca Rato , Fl ., pp . 73-106 .
Reports
Stenstrom, M.I. and A.S . Ng (1984) owdered Activated Carbon EnhancedNitrification of Petroleum Refine y astewater Treatment, Final Reportprepared for the Standard Oil Co ., Ohio), UCLA Engineering Report No .84-11, 223 pgs .
Stenstrom, M .I ., Ng, A.S ., Bhunia, I. and S .D . Abramson (1983) Anaero-bic Digestion of Municipal Solid ste, Final Report for Southern Cali-fornia Edison, UCLA Engineering Rep rt No . No . 83-23, 190 pgs .
ABSTRACT OF 1 E DISSERTATION
Nitrification Enhancement in Powdered
Activated Carbon-Activated Sludge
Adam S . Ng
Doctor of Philosophy in Engineering
University of Califo is . Los Angeles, 1985
Professor Michael IK . Stenstrom, Chair
Previous investigators provid d evidence that the addition of
powdered activated carbon (PAC) to nitrifying activated sludge (AS) can
improve nitrification rates . Plansi 1 but unsubstantiated mechanisms
proposed to explain these observa ions include adsorption of compounds
toxic to nitrifiers ; enhanced growt of nitrifiers and/or concentration
of trace nutrients on the carbon s face .
The major objective of this research is to further define the
mechanism of nitrification enh anent in PAC-AS . Using refinery and
synthetic wastewater feed, a seriesil of acute and chronic experiments, as
well as experiments with variable carbon dosages, was conducted to
evaluate the relative importance o adsorption, suspended solids, and
microbial acclimation on AS nitr fication rates . The general procedure
was to compare the effect of a "spi d ' adsorbable/non-adsorbable, inhi-
bitory compound on nitrification rates in AS and in AS supplemented
~vi

either with PAC or inert suspended olids (bentonite clay) .
strated nitrification enhancement due to PAC addition in anacclimated
sludge cultures . Statistically ig~nificant enhancement due to either
PAC or bentonite addition was of evident in any experiment where a
nonadsorbable inhibitor was added .
A chronic experiment gave evidence that the addition of PAC to AS
can indirectly inhibit nitrificati n by virtue of desorption of a previ-
ously adsorbed inhibitor . In this same experiment, it was shown that an
adequate dose of virgin PAC caa~ dramatically arrest the effect of an
adsorbable inhibitor and restore f~ll nitrification capability .
Results from the variable P C dose experiments suggested that
there may be an optimal dose of PA required to negate the effects of an
adsorbable inhibitor . For adsorbs inhibitors, PAC addition resulted
in virtual complete nitrificatio and enchancements of 75 to 100% over
that of the controls (i .e ., no PACl,addition) . No significant loss of
nitrification capability was obse
d at PAC concentrations greater than
2-4000 ag/l PAC for all adsorbable
non-adsorbable inhibitiors, enhan4ements of only 3 to 30% were observed
at the highest PAC dosage evaluate .
The overall results provide trong evidence that the major mechan-
of nitrification enhancement in PAC-AS is related to the carbon'sism
with "spiked" adsorbable inhibitors, the acute experiments demon-
inhibitors tested .
For relatively
NTB DUCTION
The modern day activated sludge process was originally conceived
in 1914 by Arden and Lockett, who were the first to realize that the
naturally occurring microbial process could be captured and controlled
in a slurry type reactor . Heretofore biological wastewater treatment
had been restricted to processes sing microorganisms growing in fixed-
films . At the time of their develgpment understanding of process kinet-
ics and stoichiometry was non-existent, and the mechanisms of treatment
such as "adsorption on the concret walls" were frequently proposed .
Presently the activated sludge process
choice for treating domestic and industrial wastewaters, especially for
larger applications . e now understand the process kinetics and
stoichiometry much better than iH the time of Arden and Lockett, but a
understanding of its behavior still,i eludes us .
Over the past decade, several
made to enhance activated sludge process performance and energy conser-
vation . One of the important enha ements for improved performance is
the addition of powdered activated carbon . The motive for adding
activated carbon was the notion that the carbon would remove biologi-
cally resistant compounds that w
isms, providing levels of treatment
able with physicochemical treatment
is usually the process of
important developments have been
Early work in the powdered acivated carbon-activated sludge pro-
cess is described in . various p,
I
tents of Derleth (1927) and Statham
I1
re not degradable by the microorgan-
which were previously only obtain-
techniques .
(1938), while the modern patent was held by DuPont (Hutton and Robertae-
cio, 1975) until recently, and sold to Zimpro Corporation . Since the
development of the activated sludge-powdered activated carbon process, a
lnumber of evaluations have been made of the process' efficacy on various
types of wastewaters .
The success of PAC research ~s demonstrated by the current opera-
tion of a number of full scale P4C-activated sludge (PAC-AS) treatment
plants in both the municipal and industrial sectors . Operational data
from bench, pilot and full scale ilants have provided evidence that PAC
has the following benefits over co4ventional activated sludge systems :
Improved organic* removals
Improved removal of EPA priority pollutants
Improved sludge thickening/dewatering
Reduced sludge bulking
Increased color removal
Suppressed aerator roaming
Improved nitrification
The primary objective of earl PAC-AS research was to determine
the carbon's ability to remove biol'',logically resistant organic compounds .
Although some or all of the advantages of PAC addition have been rou-
ltinely reported in a number of stdies, there is a lack of fundamental
understanding of the process mechanisms responsible for these benefits .
This is especially true in the rel,~tively few cases where improved nit-
rification was noted . To date, alm~st all PAC-AS studies have focused
upon the elucidation of the mechinism(s) involved in increased organic
removals . An equally important benefit of PAC addition is nitrification
enhancement and although a number of mechanisms have been proposed to
explain this phenomena, no research has been conducted to substantiate
any one mechanism . Mechanisms proposed to explain nitrification
enhancement are adsorption of compounds toxic or inhibitory to nitrif-
iers ; enhanced growth of nitrif ers on the surface of the carbon ; and
concentration of trace nutrients a the carbon surface, among others .
The major objective of this zesearch is to further define the
mechanism of PAC-AS nitrification enhancement . To differentiate among
the proposed mechanisms an exp#
emphasis placed upon evaluation of the adsorption and surface growth
theories . This was done because previous researchers have provided ten-
tative support for these theories .
The experimental program, carried out in four phases, was devised
to evaluate the relative influenced of 1) adsorption, 2) the presence of
suspended particles and 3) acclimat on on activated sludge nitrification
rates, subjected to a variety of ompounds with known characteristics .
The effect of sludge acclimation toi an industrial wastewater feed is
included in this study because
acclimation ability may be an impor ant variable in the ultimate degreei
of nitrification inhibition .
The bench scale study was con
trol Laboratory . In an effort to
was made to obtain wastewaters with
rimental program was devised with
3
the literature review suggested that
acted in the UCLA ater Quality Con-
in practical results, an arrangement
a west coast refiner operating a
large,
integrated oil refinery
obtained (approximately every four
scale treatment plants (reactors) were
wastewater . In addition, two bane
a synthetic glucose-based wastew
of unacclimated sludge cultures
operated with and without carbon,
tionally a reactor treating refine
tonite clay . Bentonite clay is a
suitable surface chemistry for mic
for adsorption of organics . A c
the same mesh sire as the powdered
An intensive survey of all
and their carbon adsorption pr
group of compounds were selected f
upon a compound's adsorptive and n
the likelihood of finding it in re
The specific objective of th
of nitrification enhancement . Th
The wastewater was periodically
weeks), and three 15 liter bench
assembled and operated using this
scale plants were operated treating
ter, in order to provide for a source
or experimentation . Reactors were
sing both types of wastewaters . Addi-
y wastewater was operated with ben-
uspended solid which is known to have
obial attachment, but limited ability
ay was chosen which had approximately
activated carbon .
ow nitrification-inhibiting compounds
parties was made . From this survey a
r evaluation . Selection was based
trification inhibitory properties and
inery wastewaters .
study was to evaluate the mechanism
rocedure was to evaluate a series of
compounds which were could be gro d as adsorbable-inhibitory (AI),
nonadsorbable-inhibitory (NAI), o~nadsorbable-noninhibitory (NANI), and
adsorbable-noninhibitory (ANI) .
pounds selected were aniline (AI),
phenol (AI), cyanide (NAI), acr
ethanol (NAI) . Most of these compo
refinery or petrochemical proces
lonitrile (NANI) toluene (ANI) and
ds are traditionally associated with
e , and their presence in the west
coast refinery wastewater was con rated with gas chromatography/mass
spectrometry .
A series of experiments usin both refinery and synthetic wastewa-
ter* was conducted to distinguish enehancement due to the adsorption of
inhibitory compounds from preferen ial microbial attachment . The effect
of a "spiked" adsorbable/non-also bable, inhibitory/non-inhibitory com-
pound on nitrification rates was c pared for control activated sludge
units and those containing either PAC or bentonite . If higher nitrifi-
cation rates are observed in PAC units compared to bentonite units when
a spiked compound with both adsorbable and inhibitory characteristics is
tested, the adsorption theory is s u pported . Conversely, if equal or
are Clbserved in the bentonite units when ahigher nitrification rates
non-adsorbable, inhibitory compound is used, the surface attachment
theory is supported. The use o non-inhibitory compounds for testing
served the major purpose of verifying experimental techniques since the
ratio of nitrification rates should be close to unity in these cases .
The effects of selected compounds on nitrification rates in
acclimatised and non-acclimatized siludges were also examined in parallel
to the experiments discussed abovel,
was divided into four phases :
5
The overall experimental program
Phase I : Preliminary experiments
-- Three GC/MS analysis for acid/neutral/base extractable organ-
ics were performed on separate batches of refinery wastewaters to
screen for potential nitrification inhibitors .
-- A heavy metal analysis w s conducted on a single batch of
refinery wastewater .
--- Isotherm studies were conducted on PAC and bentonite to deter-
mine the efficacy for its use
Phase II : Batch experiments
--- A series of experiments was ran to determine the short term
effects of specific compounds on nitrification rates in PAC, ben-
tonite, acclimated and unacci
tion rates were compared
(i .e ., no spiked compound) in order to form a basis of comparison
among different reactor typesl ll, .
Phase III : Chronic experiments
- It is generally agreedth~ftt
short term acute tests do not give
a good indication of how
under actual field conditions
in subsequent experiments .
imated activated sludges . Nitrifica-
to that of the corresponding control
ducted to determine the long-term effects of a specific adsorbable
inhibitor on nitrification ra ttes with PAC and bentonite added to
nitrifying activated sludge .
a given biological system will react
As such, experiments were con-

Phase IV: Carbon Dose Experiments
-- A series of experiments sing nitification inhibitors of known
adsorptive characteristics was performed in the presence of vari-
able powdered activated carbon dosages .
NITRIFICATION
LITERA RE, REVIE
Biochgemistrv
The biological process of nitrification is carried out sequen-
tially under aerobic conditions principally by two chemosutotrophic gen-
era Nitrosomonas and Nitrobacter . These are responsible for the oxida-
tion of ammonia to nitrite and nitrite to nitrate, respectively . Both
organisms depend on membrane-bounded oxidative electron transport chains
in which chemical energy is derived from their respective inorganic
sources . These energy-yielding oxidations are coupled to cellular
biosynthetic reactions which involve the fixation of carbon dioxide
through mechanisms very similar to those of the Calvin cycle in pho-
tosynthetic organisms . The general stoichiometrie reaction sequence
occurring during nitrification can be written as follows (USEPA, 1975) :
NH4 +3
02 -~ NO2 + 2H+ + : H20 + 58-84 Kcal
N02 +T 02 -3 N03 + 15 .5 20 .9 Kcal
(1)
(2)
Although it is well established that certain heterotrophic organ-
isms are also capable of nitrification, it is generally considered that
heterotrophs contribute insignificant quantities of nitrate in natural
systems ( allace and Nichols, 1069; Verstraete and Alexander, 1973) .
The basic metabolic mechanisms and intermediate biochemical pathways of
nitrifiers has been reviewed previously by allace and Nichols (1969),
Aleem (1970) and Painter (1970) . The sections that follow will focus
8
upon the recent developments in the biochemistry of nitrification .
Ammonia Oxidation hl Nitrosomonas,
The oxidation of ammonia by Nitrosomonas involves a complex path-
way which is not yet completely understood . Hofman and Lees (1953)
were among the first investigators to obtain experimental evidence that
the oxidation of ammonia to nitrite proceeds via hydroxylamine (NH 2OH)
since it was observed that hydroxylamine accumulated during ammonia oxi-
dation in the presence of hydrazin0, an inhibitor of hydroxylamine oxi-
dation . These findings were supported in later studies conducted by
Engel and Alexander (1958) and Anderson (1965) .
Lees (1954) speculated that the oxidation of ammonia to nitrite
should theoretically occur in tree steps since the conversion of
ammonia to nitrate involves a six electron transfer causing the valence
change of nitrogen from -3 to +3 . Assuming a two electron transfer for
each oxidation-reduction reaction, $t least two intermediates with the
oxidation states of -1 and +1 a*e expected in the reaction sequence .
Aside from the initial reaction to form hydroxylamine, many intermediate
products have been proposed, such',as nitroxyl (NOR), nitric oxides (NO
or N20) and hyponitrite (N202 ) . Unfortunately, this other
intermediates) has not yet been co*clusively identified . The reason is
probably due to its extreme chemical instability .
The fact that Nitrosomonas ,cells are incapable of oxidizing
ammonia under anaerobic conditions in the presence or absence of an
electron acceptor led Bees and Naso* (1966) to suspect that molecular
oxygen is essential at least in the formation of hydroxylamine .
Indirect evidence for this suspicion was provided through 180 tracer
studies conducted by Verstraete and Alexander (1972) which demonstrated
that the oxidation of ammonia to hydroxylamine through heterotrophic
nitrification involved the incorporation of molecular oxygen . More
recently, Hollocher, et al . (1981) presented definitive evidence through
isotopic methods that ammonia to hydrozylamine oxidation proceeds by way
of a direct insertion (mono-ozygenese) reaction involving 0 2 , They
observed that of the two atoms in 02 , one is inserted in NH4 to form
NH2OH while the other is presumably' reduced to water . Furthermore, they
theorized that since the only source of reducing equivalents for the
reduction of that oxygen atom is Won, the oxidation of NHS and NH2OH
must be functionally linked . This theory is not novel as it has been
proposed by earlier investigators (Hooper, et al ., 1972 ; Hooper and
Terry . 1977) and was recently further advanced by Suzuki, et al .(1981) .
The intermediates) involved in hydrozylamine oxidation to nitrite
remains highly speculative at this time . Work by Nicholas and Jones
(1960) with Nitrosomonas cell-free extracts which produced nitrite from
hydroxylamine aerobically in the presence of mammalian cytochrome c,
provided direct evidence of the involvement of an electron transport
chain . A subsequent investigation by Anderson (1964) revealed that
under anaerobic conditions in the presence of Nitrosomonas cell extracts
and a hydrogen acceptor (methylene blue), nitrous and nitric oxides were
produced in the amounts equivalent to the hydroxylamine added . However,
under aerobic conditions in the presence of methylene blue or mammalian
cytochrome c, conversion of hydrozylamine to nitrite was observed .
Moreover, in the presence of cy,tochrome c, hydroxylamine and cyanide
under aerobic conditions, nitrite production was inhibited . This inhibi-
tion was removed when aethylene blue replaced cytoehroae c in the reac-
tion media . These results led Anderson to suggest that the metabolism
of NH2OH to nitrite is a two step process involving in formation of
nitroxyl and its subsequent nonenzyiatic decomposition to nitrous oxide .
Nitrous oxide was then converted to nitrite by an enzyme system requir-
ing oxygen .
Almost concurrent to Anderson's findings, Aleem and Lees (1963)
demonstrated that NH2OH oxidation by Nitrosomonas was mediated by cyto-
chrome b, c, and a-type components .' They suggested that NH2OH oxidation
is activated by the enzyme hydrpxylamine-cytochroae c reductase (now
referred to as hydroxylamine oxidoreductase) which they had partially
purified and studied . This enzyme'swas found to be sensitive to various
metal-binding agents which led the investigators to conclude that the
oxidation step involves the participation of electron transport carriers
and is mediated by a cytochrome enzyme system requiring a metal . It was
shown by Nicholas (1962) using paramagnetic resonance on Nitrosomonas
particles, that the essential metal', involved in the oxidase system is
copper .
Since then, the enzyme complex hydroxylamine oxidoreductase has
been extensively purified and studied further (Ritchie and Nicholas,
1974 ; Hooper, et al ., 1978 ; Terry slid Hooper, 1981) The enzyme has been
shown to be able to use either cytochrome c or phenazine aethosulfate as
an electron acceptor and carries out the removal of at least two elec-
11
trons from hydroxylamine :
NK2OH --! (NOR) + 2e + 2H+
Although intact Nitrosomonas cells can oxidize NH 2OH to NO2
stoichiometrically, the nitrite yielded by the enzyme system is less
than 50% even aerobically, the remainder being nitrate (NO3), nitric
oxide(NO) and nitrous oxide(N 20) (Hooper, et al ., 1979) . These results
are in contrast to the nitrite yields of 80 to 90% obtained by Aleem and
Lees (1963) with a 85-fold purified enzyme .
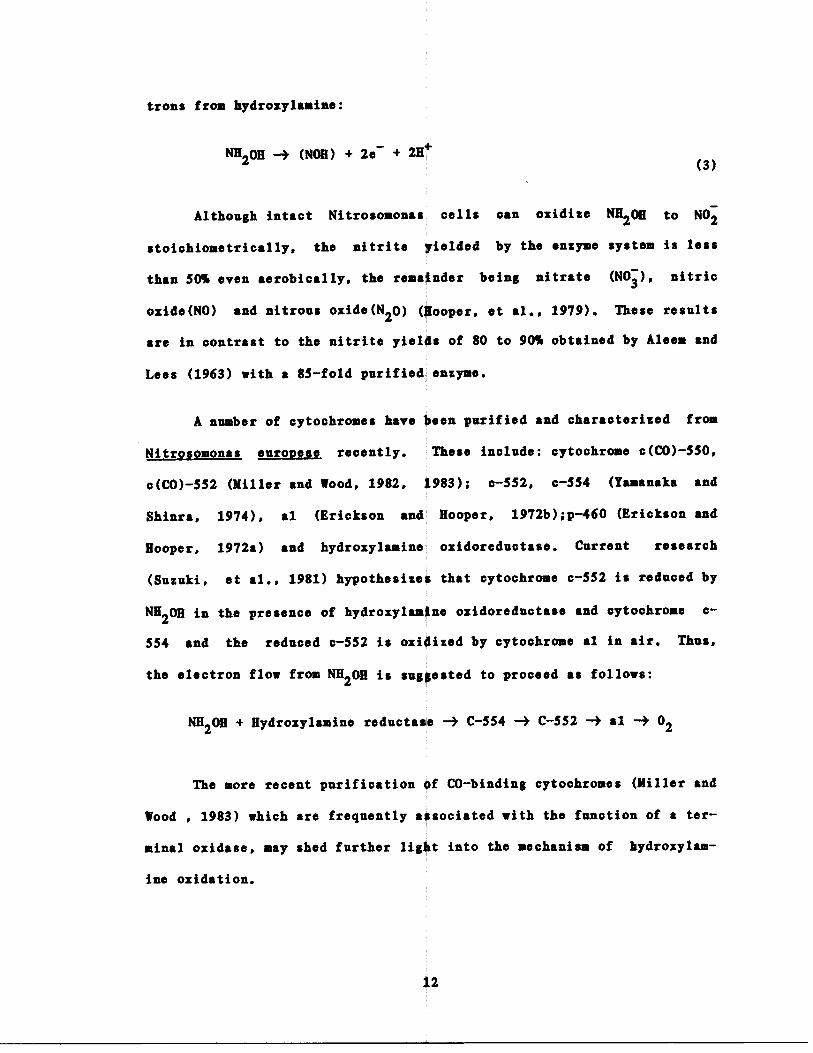
A number of cytochromes have been purified and characterized from
Nitrosomonas euroneae recently . These include : cytochrome c(CO)-550,
c(CO)-552 (Miller and Wood, 1982, 1983) ; c-552, c-554 (Yamanaka and
Shinra, 1974), al (Erickson and Hooper, 1972b) ;p-460 (Erickson and
Hooper, 1972a) and hydroxylamine', oxidoreductase . Current research
(Suzuki, et al ., 1981) hypothesizes that cytochrome c-552 is reduced by
NH2OH in the presence of hydroxylamine oxidoreductase and cytochrome c-
554 and the reduced c-552 is oxidized by cytochrome al in air . Thus,
the electron flow from NH2OH is suggested to proceed as follows :
NH2OH + Hydroxylamine reductate --i C-554 -'! C-552 --> al -3 02
The more recent purification of CO-binding cytochromes (Miller and
Wood , 1983) which are frequently associated with the function of a ter-
minal oxidase, may shed further light into the mechanism of hydroxylam-
ins oxidation .
12
(3)
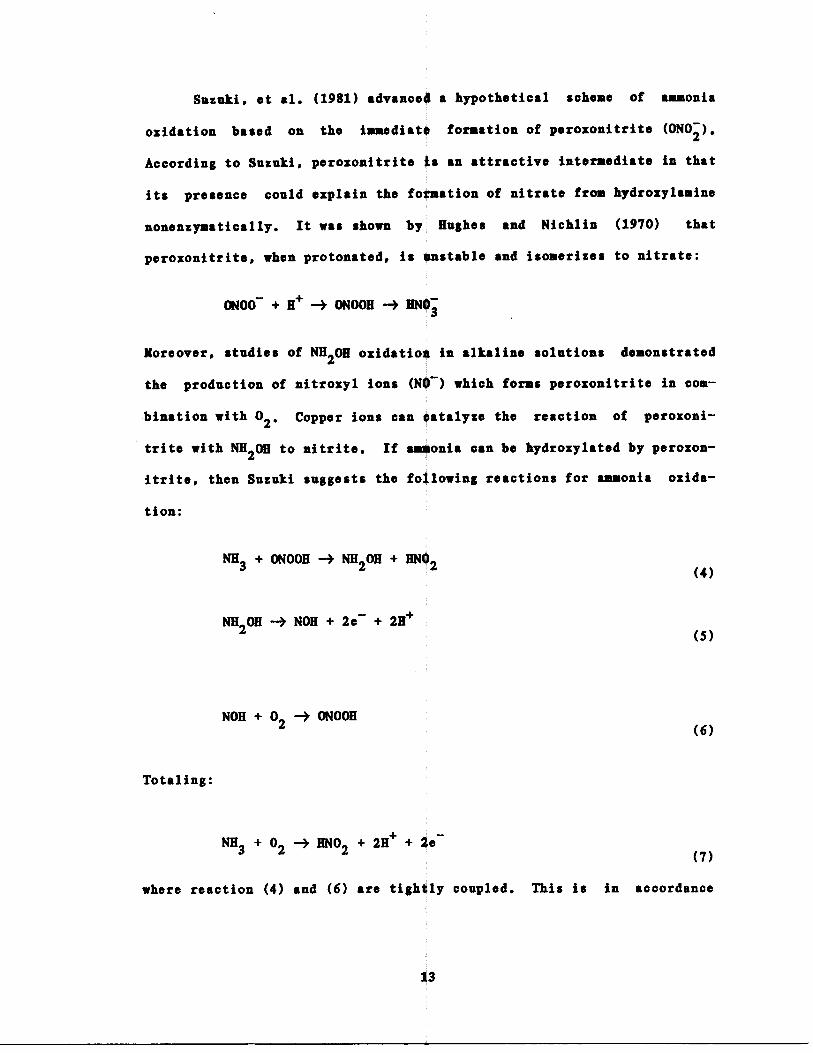
Suzuki, et al . (1981) advanced a hypothetical scheme of ammonia
oxidation based on the immediate formation of peroxonitrite (ON02) .
According to Suzuki, peroxonitrite is an attractive intermediate in that
its presence could explain the formation of nitrate from hydroxylamine
nonenzymatically. It was shown by, Hughes and Nichlin (1970) that
perozonitrite, when protonated, is unstable and isomerizes to nitrate :
ON00 + H+ -i ONOOH -i 0Nb3
Moreover, studies of NH2OH oxidation in alkaline solutions demonstrated
the production of nitroxyl ions (NO-) which forms peroxonitrite in com-
bination with 0 2 , Copper ions can catalyze the reaction of peroxoni-
trite with NH2OH to nitrite . If ammonia can be hydroxylated by perozon-
itrite, then Suzuki suggests the following reactions for ammonia oxida-
tion:
NH3 + ONOOH -+ NH2OH + HN02
NH2OH -+ NOR + 2e + 2H+
NOR + 02 -,! ONOOH
Totaling :
NH3 + 02 -'! HNO2 + 2H+ + 2e-
where reaction (4) and (6) are tightly coupled . This is in accordance
13
(4)
(5)
(6)
(7)

to earlier theories proposing that ammonia and hydroxylamine oxidations
are functionally linked . The hypothetical scheme for ammonia oxidation
is illustrated in Figure 1 . In Figure la ., ammonia is initially
hydroxylated by 02 plus electrons derived from endogenous metabolism or
added NADH . Once the hydroxylation is initiated, electrons from NN 20H
oxidation become available for further hydroxylation of ammonia . At
steady state (Figure lb .), the oxidation of nitroxyl (NOR) is coupled to
ammonia hydroxylation with peroxonitrite as the possible intermediate .
The only electrons going through the electron transport chain system to
molecular oxygen for possible energy generation are the two electrons
derived from hydroxylamine .
Oxidation of Nitrite to Nitrate by Nitrobacter
The oxidation pathway of nitrite to nitrate by the Nitrobacter
species is relatively simple compared to that of Nitrosomonas and is
better understood . The oxidative mechanism proceeds via a series of
enzymatic steps involving the sequential transfer of electrons from
nitrite to molecular oxygen Those role is strictly that of a terminal
electron acceptor (Lees and Simpson, 1957) . It was also demonstrated by
these same investigators that the oxidation involves the cytochrome-
electron transport enzyme nitrite osidase and that the transfer of elec-
trons is mediated by c and al-type cytochromes . Later, Aleem, et al .
(1965), working with 180 and HZ8O isotopes, discovered that the oxygen
atom in nitrate was generated from water and not from molecular oxygen .
These important findings led to' the current understanding of nitrite
oxidation . The oxidation of nitrite to nitrate by Nitrobacter can be
14

NH2OH
2e-c-554
(NOH)i
~---- 02
(ONOOH)c-552
1al
102
I
2e-NA DH--,,~`~c-554
(NOM)1/2 N 0
Endogenous ~~
02
c-552
(ONOOH)o- HNO3
al
102 la : Initial State of
Ammonia Oxidation
ib : Steady State
Figure 1 : Proposed Oxidation Pathway for Ammoniato Nitrate (After Suzuti, 1980)
is

represented by the following scheme (Aloes, 1970) and redox equations
(Sundermeyer and Book, 1981) :
NO2 -p cyt . c -+ cyt . Al -i 02
Nitrite
Cytochrome
Oxidase
Oxjdase
NO2 + H2O + 2 cyt . a l (+3) -+ N03 + 2H+ + 2 cyt . a l (+2)
2H+ + 2 cyt . al (+2) + 0 .5 02 -~ H2O + 2 cyt . al (+3)
Totaling :
N02 + 0 .5 02 --3 N03
In equation 8, oxygen is not involved, nitrite is oxidized to
nitrate by water, protons and electrons released, and the electrons are
transferred to cytochrome al, an essential component of the nitrite-
oxidizing system, and then subsequently to oxygen . Equation 8 is the
energy-yielding step, which is coupled to the electrotransport phospho-
rylation . No intermediates of nitrite oxidation have ever been found
(Painter, 1977) .
i6
(8)
(9)
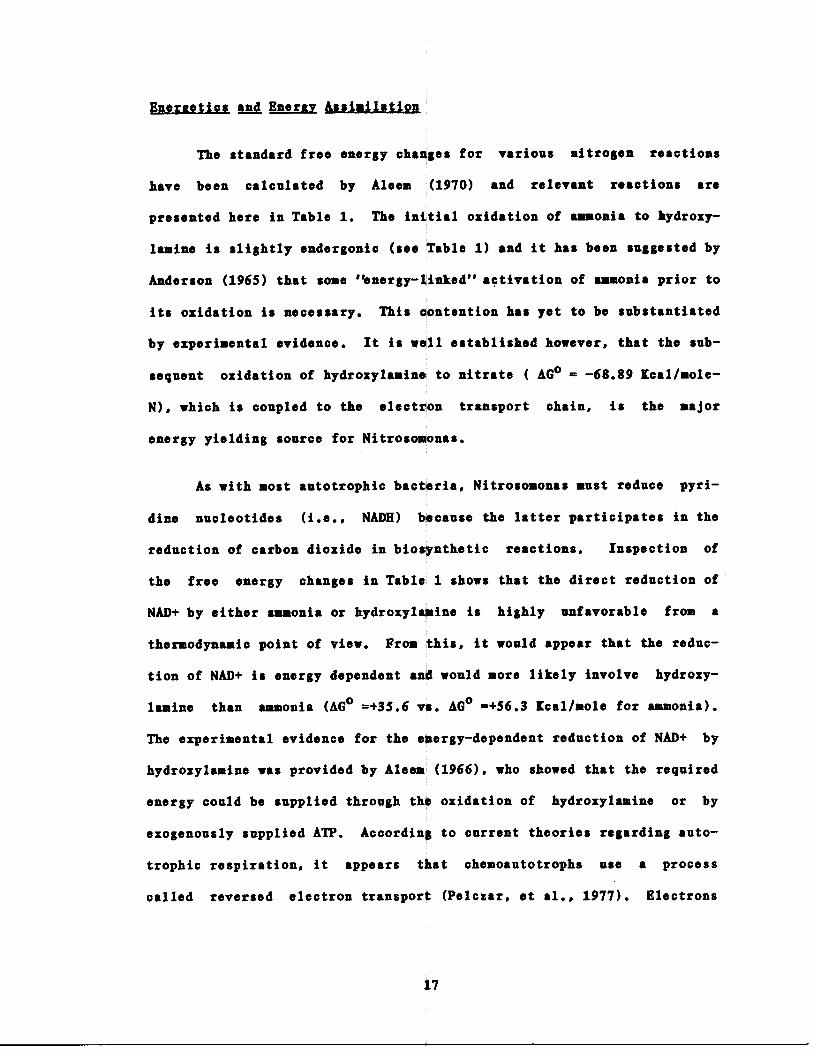
Eneraetics and Eneriv Assimilation'
The standard free energy changes for various nitrogen reactions
have been calculated by Aloes (1970) and relevant reactions are
presented here in Table 1 . The initial oxidation of ammonia to hydroxy-
lamina is slightly endergonic (see'Table 1) and it has been suggested by
Anderson (1965) that some 'energy-linked" activation of ammonia prior to
its oxidation is necessary . This contention has yet to be substantiated
by experimental evidence . It is wall established however, that the sub-
sequent oxidation of hydroxylamine to nitrate ( AGO _ -68 .89 [cal/mole-
N), which is coupled to the electron transport chain, is the major
.energy yielding source for Nitrosomonas .
As with most autotrophic bacteria, Nitrosomonas must reduce pyri-
dine nucleotides (i .e ., NADH) because the latter participates in the
reduction of carbon dioxide in biosynthetic reactions . Inspection of
the free energy changes in Table 1 shows that the direct reduction of
NAD+ by either ammonia or hydroxylamine is highly unfavorable from a
thermodynamic point of view . From this, it would appear that the reduc-
tion of NAD+ is energy dependent and would more likely involve hydroxy-
lamina than ammonia (AG• =+35 .6 vs . AGO =+56 .3 Kcal/mole for ammonia) .
The experimental evidence for the energy-dependent reduction of NAD+ by
hydroxylamine was provided by Aleem':(1966), who showed that the required
energy could be supplied through the oxidation of hydroxylamine or by
exogenously supplied ATP. According to current theories regarding auto-
trophic respiration, it appears that chemoautotrophs use a
called reversed electron transport (Pelczar, at al ., 1977) . Electrons
17
process
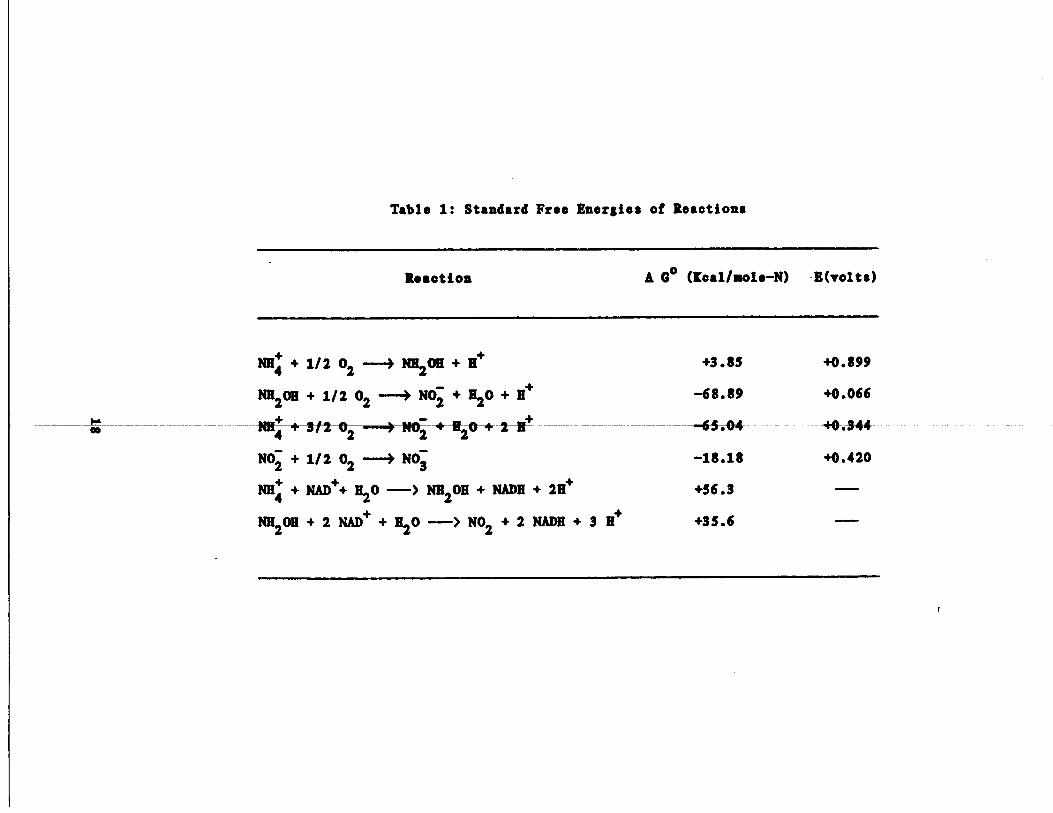
Table 1 : Standard Free Energies of Reactions
r
Reaction A 00 (Kcal/sole-N) E (volts)
1/2 -3 +3 .85 +0 .899NH4 +
02
NH2OH + 11+
-68.89 +0 .066NH2OH
+ 1120 + H++ 1/2 02 --~1 N02
-AI4~--+ 3/2 02
- - 2$*--~--H„ -- -65-.04 +0.-344
-18 .18 +0 .420N02
N03+ 1/2 02 ---)
NADH + 2H+ +56 .3 ---NN + NAD++ H2O -> NH2OH +
+35 .6 --NH2OH
+ 2 NADH + 3 H++ 2 NAD+ +1120 --> N02
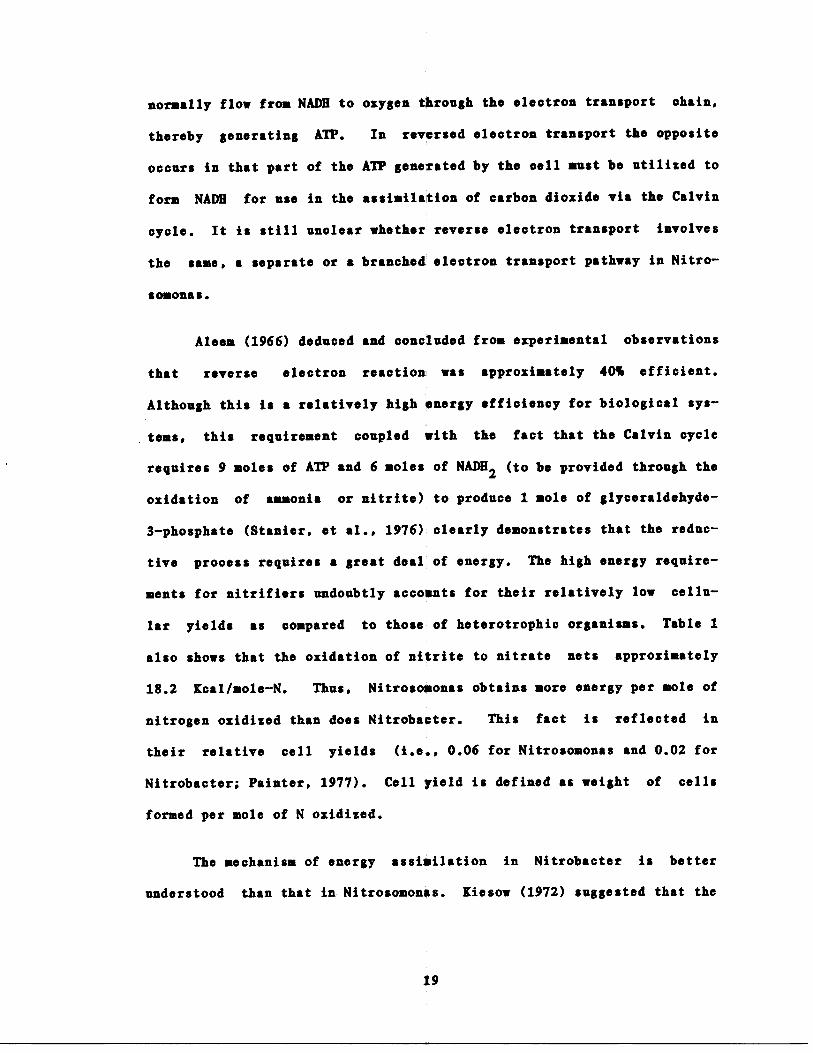
normally flow from NADH to oxygen through the electron transport chain,
thereby generating ATP. In reversed electron transport the opposite
occurs in that part of the ATP generated by the cell must be utilized to
form NADH for use in the assimilation of carbon dioxide via the Calvin
cycle . It is still unclear whether reverse electron transport involves
the same, a separate or a branched electron transport pathway in Nitro-
somonas .
Aleem (1966) deduced and concluded from experimental observations
that reverse electron reaction was approximately 40% efficient .
Although this is a relatively high energy efficiency for biological sys-
tems, this requirement coupled with the fact that the Calvin cycle
requires 9 moles of ATP and 6 moles of NADH2 (to be provided through the
oxidation of ammonia or nitrite) to produce 1 mole of glyceraldehyde-
3-phosphate (Staniar, et al ., 1976)' clearly demonstrates that the reduc-
tive process requires a great deal' of energy . The high energy require-
ments for nitrifiers undoubtly accounts for their relatively low cellu-
lar yields as compared to those of heterotrophic organisms . Table 1
also shows that the oxidation of nitrite to nitrate nets approximately
18 .2 Kcal/mole-N. Thus, Nitrosomonas obtains more energy per mole of
nitrogen oxidized than does Nitrobacter . This fact is reflected in
their relative cell yields (i .e ., 0 .06 for Nitrosomonas and 0 .02 for
Nitrobacter ; Painter, 1977) . Cell yield is defined as weight of cells
formed per mole of N oxidized .
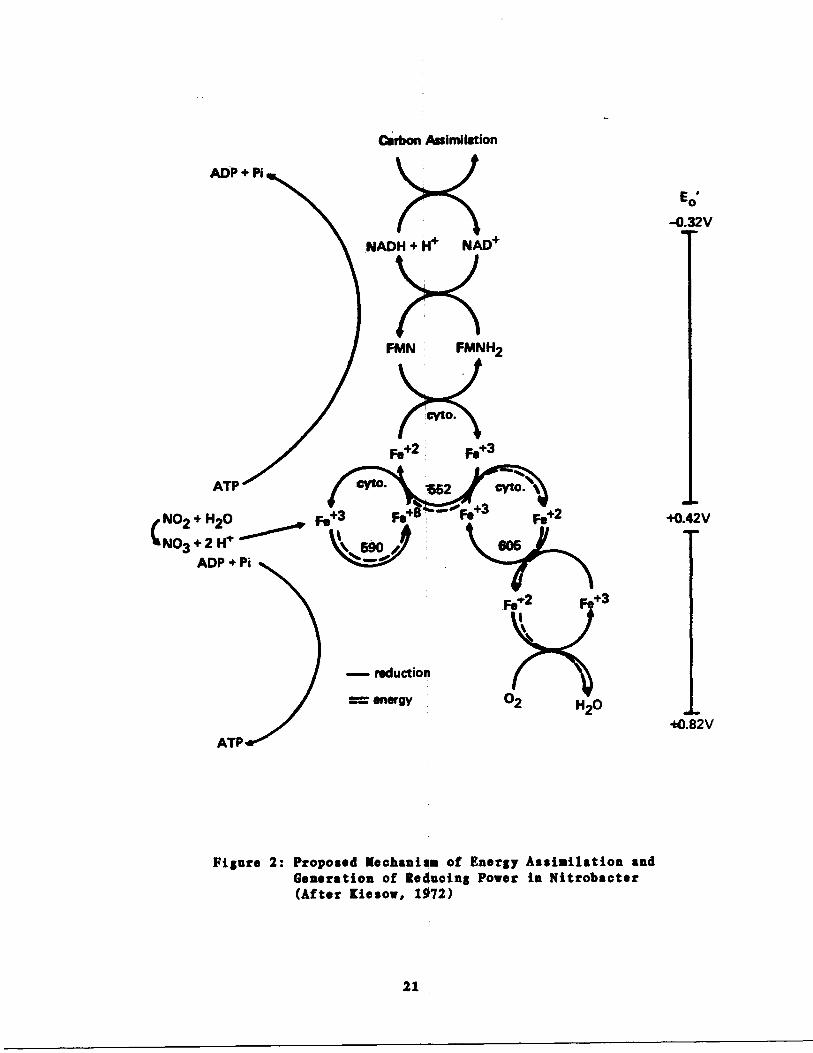
The mechanism of energy assimilation in Nitrobacter is better
understood than that in Nitrosomonas . Kiesow (1972) suggested that the
19
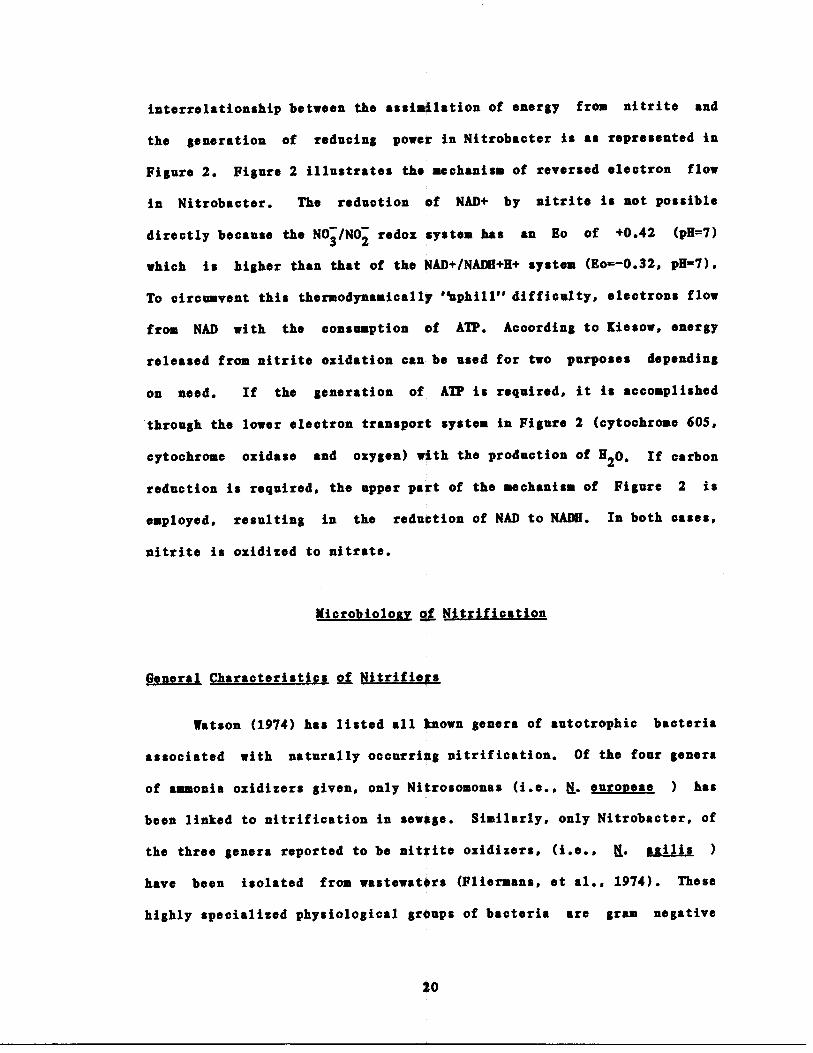
interrelationship between the assimilation of energy from nitrite and
the generation of reducing power in Nitrobacter is as represented in
Figure 2 . Figure 2 illustrates the mechanism of reversed electron flow
in Nitrobacter . The reduction of NAD+ by nitrite is not possible
directly because the NO3/NO2 redox system has an Bo of +0 .42 (pH=7)
which is higher than that of the NAD+/NADH+H+ system (Eo=-0 .32, pH=7) .
To circumvent this thermodynamically "uphill" difficulty, electrons flow
from NAD with the consumption of ATP . According to Kiesow, energy
released from nitrite oxidation can be used for two purposes depending
on need . If the generation of ATP is required, it is accomplished
through the lower electron transport system in Figure 2 (cytochrome 605,
cytochrome oxidase and oxygen) with the production of 1120. If carbon
reduction is required, the upper part of the mechanism of Figure 2 is
employed, resulting in the reduction of NAD to NADH. In both cases,
nitrite is oxidized to nitrate .
Nicrobioloav of Nitrification
General Characteristics,of Nitrifies
Watson (1974) has listed all known genera of autotrophic bacteria
associated with naturally occurring nitrification. Of the four genera
of ammonia oxidizers given, only Nitrosomonas (i .e ., !j& euroweae ) has
been linked to nitrification in sewage . Similarly, only Nitrobacter, of
the three genera reported to be nitrite oxidizers, (i .e ., ti. aailis )
have been isolated from wastewaters (Fliermans, et al ., 1974) . These
highly specialized physiological groups of bacteria are gram negative
20
Carbon, Assimilation
ATP
cyto.
NO2 + H2O
fe+3
Fe
~Fe+3
Fe+2
+0.42V
N03 + 2 H1
590
605ADP + Pi
ATP
Figure 2 : Proposed Mechanise of Energy Assimilation andGeneration of Reducing Power in Nitrobacter(After [iesow, 1972)
- reduction
energy
21
Eo
-0.32V
+0.82V

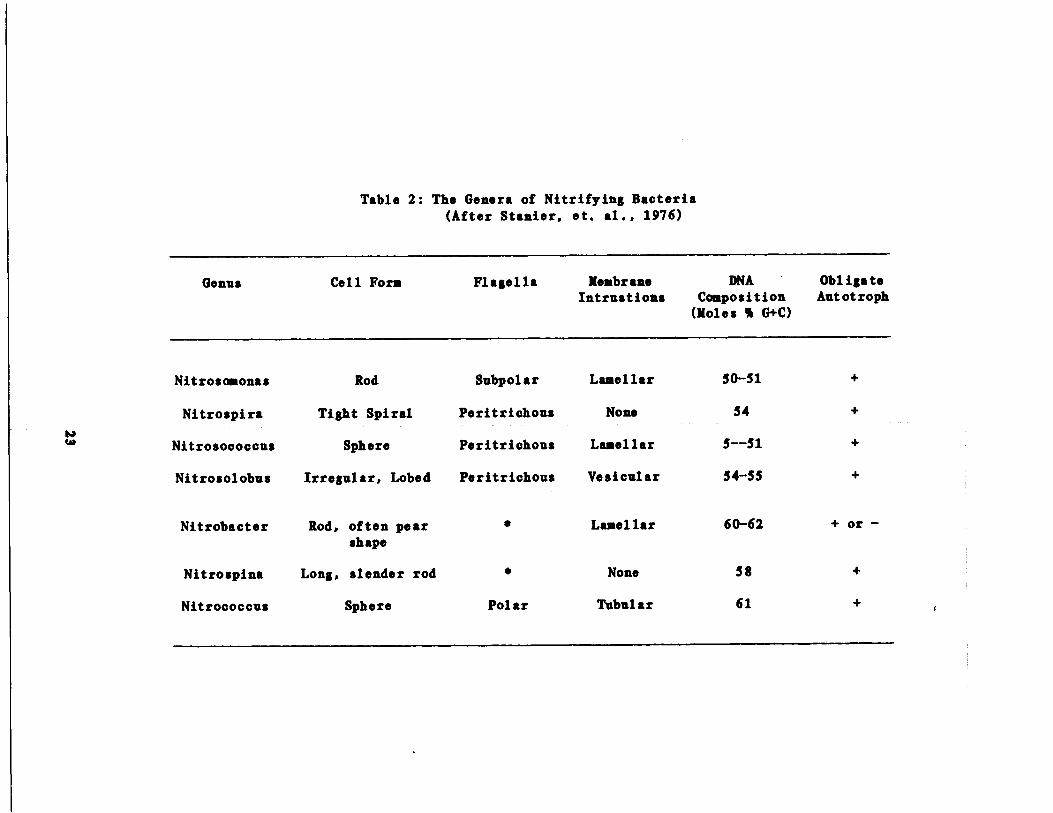
and strict aerobes with respect to their ability to nitrify . Other mor-
phological and physiological characteristics of nitrifiers are presented
in Table 2 (Staniar . et al ., 1976) .
Certain strains of Nitrobacter have been shown to assimilate
organic compounds such as acetate (Delwiche and Finstein, 1965) and for-
mate (Van Gool and Laudelout, 1966) as their sole energy and carbon
source, respectively ; however, these strains grew such more slowly than
with nitrite and CO2 , The basis of obligate autotrophy in Nitrososonas
and most species of Nitrobacter has been attributed to their lack of
certain key enzymes (i .e ., a-ketoalutaric dehydrogenase) of the tricar-
boxylic acid cycle (Hooper, 1969) ; although it was also proposed (Pan
and Umbrett, 1972) that growth of sitrifiers on organic compounds is
prevented by the formation of toxic organic products (i .e . pyruvic
acid) .
Nutritional Growth Reauiresents
Aside from carbon dioxide, ammonia or nitrite, a minimal amount of
dissolved oxygen and micronutrients are obligate requirements for nit-
rifier growth . The requirement of dissolved oxygen will be discussed in
detail in a later section. Up until 1955, it was generally considered
that particulate materials such as calcium carbonate, which was utilized
as a buffer in early culture experiments, were necessary for growth .
was postulated that the solid surface in the growth media provided obli-
gate surface sites to which nitrifying organisms adsorbed and multi-
plied . Although this "obligate surface" theory was later disproved by
It
Genus
Nitrososonas
Nitrospira
Nitrosococcus
Nitrosolobus
Nitrobacter
Nitrospina
Nitrococcus
Table 2 : The Genera of Nitrifying Bacteria(After Stanier, et . al ., 1976)
Cell Form
Flagella
Membrane
DNA
ObligateIntrustions
Composition
Autotroph(moles % G+C)
Rod
Subpolar
Lamellar
50-51
+
Tight Spiral
Peritrichous
None
54
+
Sphere
Peritrichous
Lanellar
5--51
+
Irregular, Lobed
Peritrichous
Vesicular
54-55
+
Rod, often pearshape
Long, slender rod
‚
Laaellar
None
Sphere
Polar
Tubular
60-62
+ or -
58
+
61
+ r
workers who successfully grew Nitrobacter. (Goldberg and Gainey, 1955)
and Nitrosoaonas (Engel and Alexander, 1958) in clear media, the role of
suspended solids in the nitrification process remains unclear . A stimu-
latory effect of suspended particles on nitrification rates has been
reported by a number of investigators in studies with surface waters
(Seppanen, 1970 ; 1972; Yholdebarin and Oertli, 1977) and soils (Lees and
Quastel, 1946a) . Lholdebarin and Oertli (1977) maintain that although
nitrifiers can function very well in the absence of suspended material,
their activities can be enhanced as the amount of particulates increases
in solution . Their results indicated that particle sizes of 1 to 3
.micrometers were most beneficial in enhancing nitrification rates . They
suggested that the enchanceaent mechanism involves the particle's abil-
ity to provide a physical support sodium for the proliferation of nit-
rifiers . This is in contrast to Laos and Quastel's theory of substrate
(ammonium ion) concentration at the surface of particles . Conflicting
evidence was presented by Aloes and Alexander (1960) who reported no
detectable effects on nitrification rates due to suspended particles .
Goldberg and Gainey (1955) asserted that while suspended solids were not
essential for nitrifier growth, attachment to particles will occur if
suspended solids are present .
The ability to cultivate nitr;Ifiers in clear media accelerated
research efforts by other investigators since prior metabolic and
mineral nutritional studies on nitrifiers were greatly hindered by the
presence of large quantities of insoluble ingredients in the culture
medium . Consequently, a large amount of information on the
24
nutritional
requirements of nitrifiers was acquired in the subsequent years after
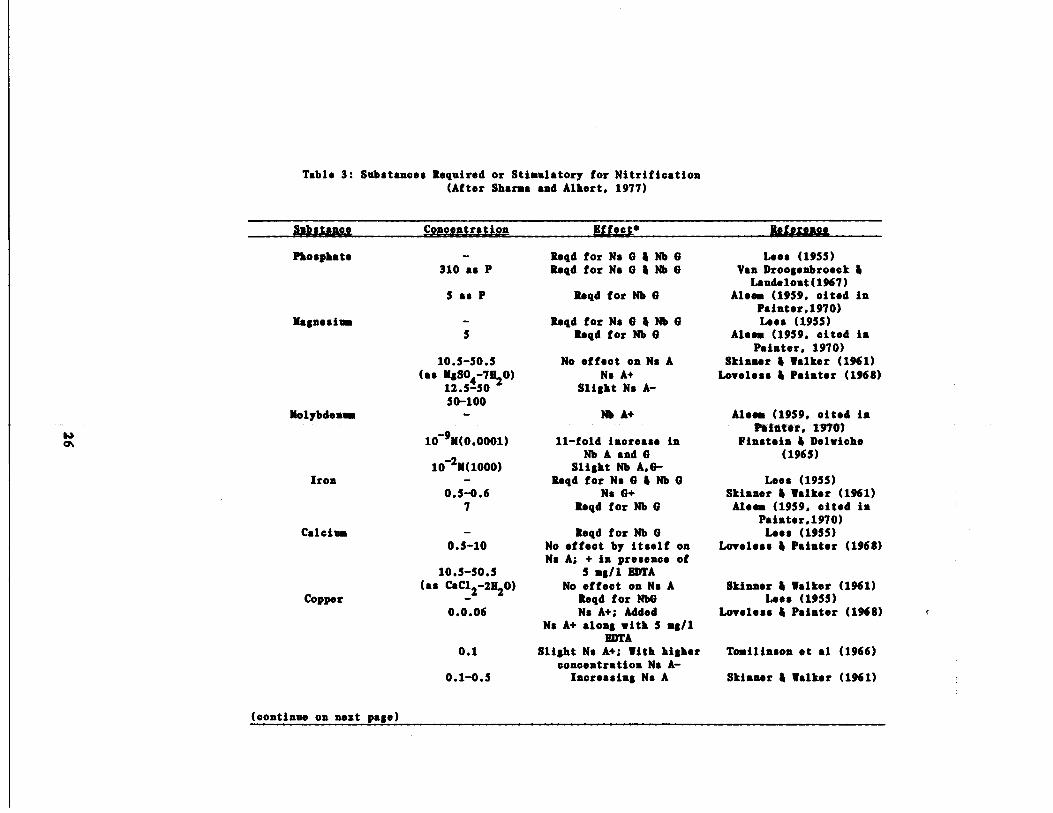
the clear growth medium had been defined . Sharma and Ahlert (1977), in
a comprehensive review on nitrification, have summarized much of of this
work . This summary along with other results are presented in Table 3 .
The results in Table 3 indicate that phosphate, magnesium, iron and
copper (0 .03 mg/l for Nitrosomonas ; Painter, 1977)
requirements for both Nitrosomonas and Nitrobacter . In addition, sodium
is probably required for Nitrosomonas (Loveless and Painter, 1968) while
calcium has been shown to be required by Nitrobacter (Lees, 1954) .
Painter (1977) contented that the optimal phosphate concentration (310
mg/1) reported by Van Droogenbroek and Laudelout was excessively high
and perhaps could be explained by carryover of the element in the ino-
cola and/or the effect of phosphate on the pH of the medium .
Kinetics of Nitrification
Monod Kinetics
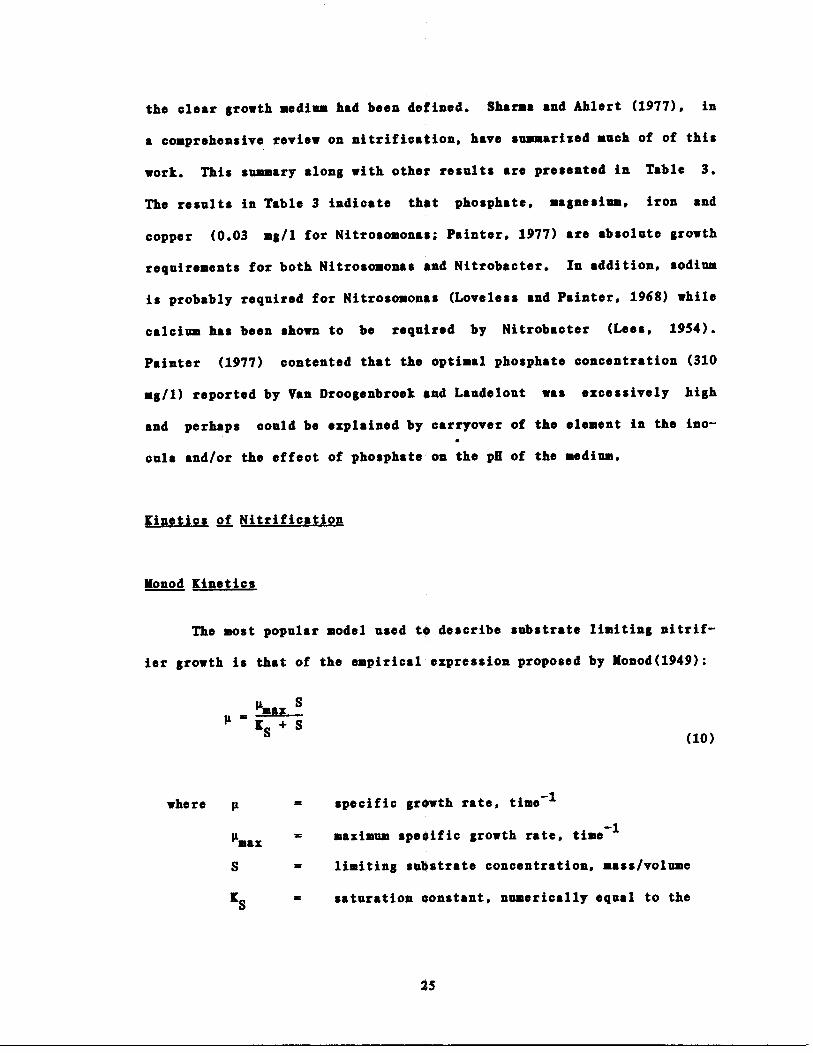
The most popular model used to describe substrate limiting nitrif-
ier growth is that of the empirical expression proposed by Monod(1949) :
where
ƒcoax Sƒ = KS + S
ƒ specific growth rate, time -1
ƒmax
maximum specific growth rate, time-1
S
=
limiting substrate concentration, mass/volume
KS
=
saturation constant, numerically equal to the
25
are absolute growth
(10)
(continue on next page)
r
Table 3 : Substances Required or Stimulatory for Nitrification(After Sharna and Alhert, 1977)
Phosphate Regd for No 0 i Nb 0 Lees (1955)310 as P Reqd for No 0 i Nb 0 Van Droogenbroeck i
Magnesium
5 as P Regd for Nb 0
RegdforNs0iNb0
Laudelout(1%7)Ale.. (1959, cited in
Painter,1970)Lees (1955)
S
10 .5-50 .5
Reqd for Nb 0
No effect on No A
Aloes (1959, cited inPainter, 1970)
Skinner i Walker (1961)(as MSSO4 71120) No A+ Loveless i Painter (1968)
12 .5-50 Slight No A-50-100
Molybdenum Nb A+ Aleem (1959, cited in
109M(0 .0001) 11-fold increase inPainter, 1W O)
Finateia i DelwicheNb A and 0 (1965)10-2X(1000) Slight Nb A,0-
Iron Regd for No 0 i Nb 0 Less (1955)0.5-0 .6 No 0+ Skinner i Walker (1%1)
7 Regd for Nb 0 Aleea (1959, cited in
Calcium Reqd for Nb 0Painter .1970)Lees (1955)
0.5-10 No effect by itself on Loveless i Painter (1968)
10 .5-50.5No A; + in presence of
5 mg/l EDTA
Copper(as CaC12 2H2O) No effect on No A
Regd for Nb0Skinner i Walker (1961)
Lees (1955)0.0.06 No A+; Added Loveless i Painter (1%8)
Na A+ along with 5 mg/1EDTA
0 .1 Slight No A+ ; With higher Tomilinson et al (1966)concentration Na A-
0 .1-0.5 Increasing No A Skinner i Walker (1961)
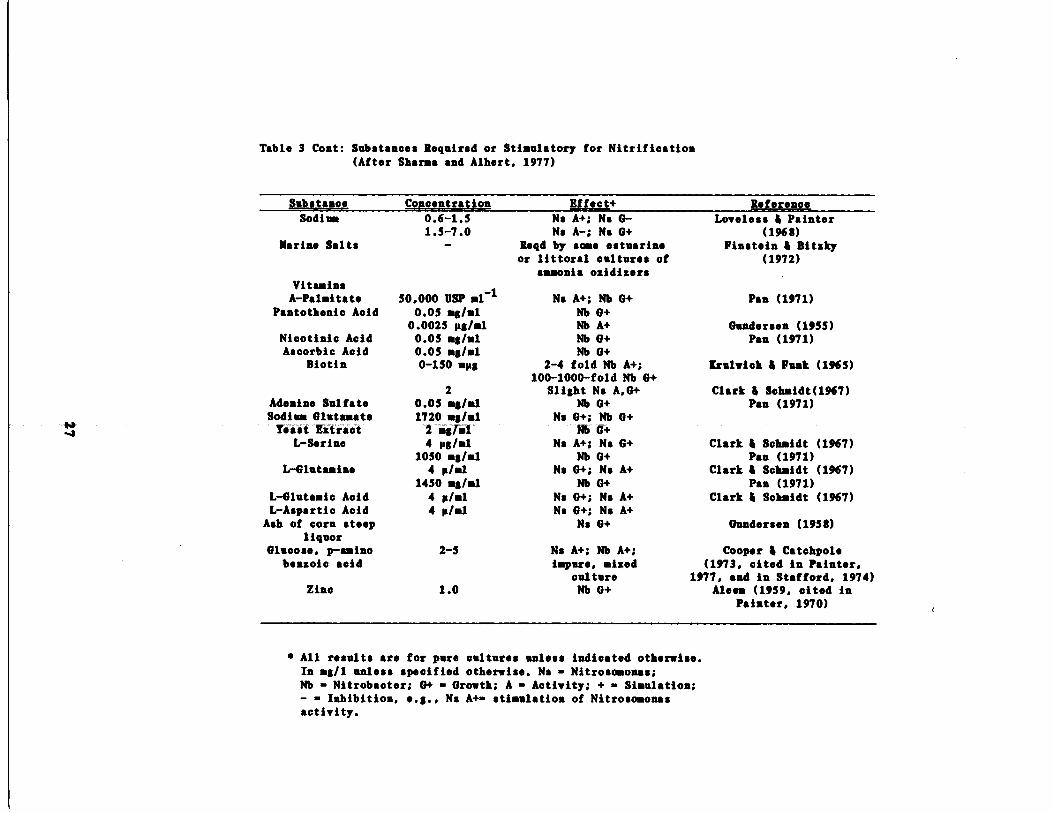
Table 3 Coat : Substances Required or Stimulatory for Nitrification(After Sharma and Alhert, 1977)
‚
All results are for pure cultures unless indicated otherwise .In ag/l unless specified otherwise . No - Nitrosomonas ;Nb = Nitrobacter; 0+ = Growth; A - Activity; + - Simulation ;- - Inhibition, e.g., No A+- stimulation of Nitrosomonasactivity .
Painter, 1970) r
Substance Concentration Elect+ Re ferenogSodium
Marine Salts
0.6-1 .51 .5-7 .0
Ns A+ ; No 0-No A-; No 0+
Yegd by some estuarineor littoral cultures of
ammonia oxidizers
Loveless i Painter(1968)
Finstein 4 Bitzky(1972)
VitaminsA-Palwitate 50.000 USP al-1 No A+; Nb 0+ Paz (1971)
Pantothenic Acid 0 .05 ag/al0 .0025 pg/al
Nb G+Nb A+ Gundersen (1955)
Nicotinic Acid 0 .05 mg/al Nb 0+ Pan (1971)Ascorbic Acid
Biotin0 .05 ag/al0-150 mpg
Nb 0+2-4 fold Nb A+ ; [rulwich 4 Funk (1965)
100-1000-fold Nb 0+2 Slight No A,G+ Clark ; Schmidt(1967)
Adenine Sulfate 0 .05 Us/U1 Nb 0+ Pan (1971)Sodium Glutamate 1720 mg/ml No 0+ ; Nb 0+Tsaii El ract
L-Serine
2 11.41
4 pg/al1050 ag/ml
Nb 0+No A+ ; Na G+
Nb 0+Clark 6 Schmidt (1967)
Pan (1971)L-Glutanine 4 p/al
1450 mg/mlNo 0+ ; No A+
Nb 0+Clark 6 Schmidt (1967)
Pan (1971)L-Glutamic AcidL-Aspartic AcidAsh of corn steep
liquorGlucose, p-amino
4 p/al4 p/al
2-5
No 0+ ; No A+No 0+; No A+
No G+
No A+ ; Nb A+ ;
Clark i Schmidt (1967)
Gundersen (1958)
Cooper i Catchpolebenzoic acid
Zinc 1 .0
impure, mixedcultureNb 0+
(1973, cited in Painter,1977, and in Stafford, 1974)
Also= (1959, cited in
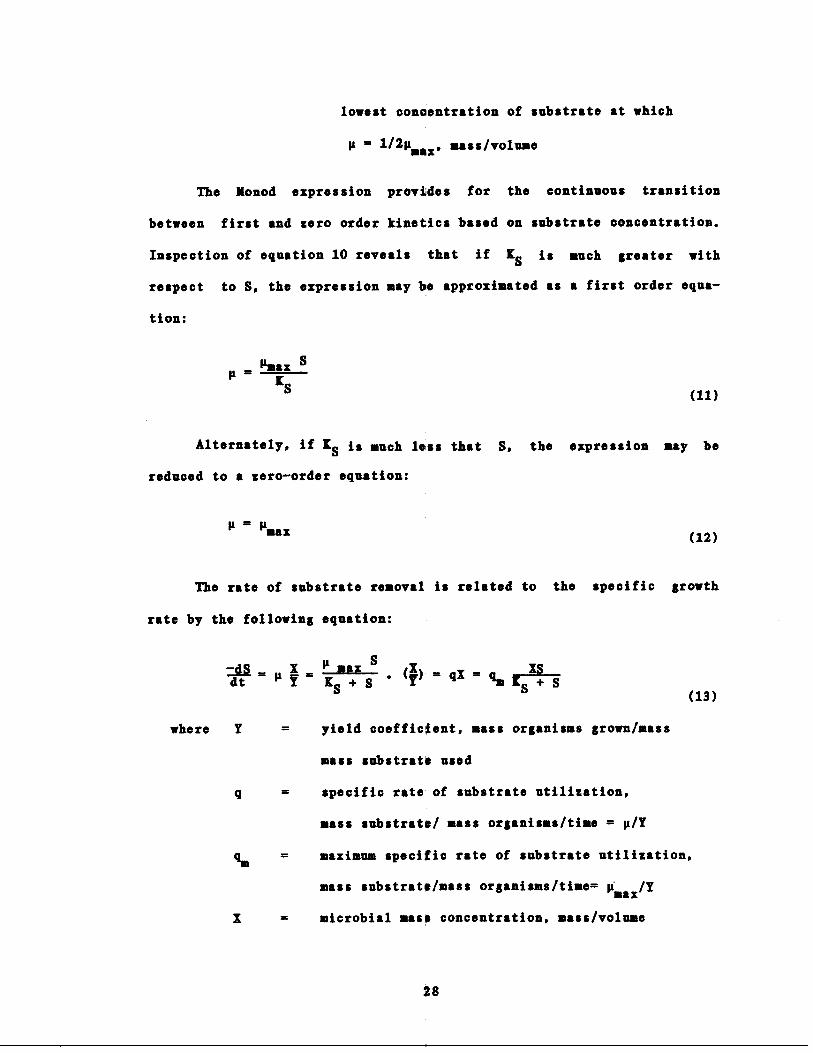
Inspection of equation 10 reveals that if IS is
respect to S, the expression may be approximated as
tion :
‚
=ƒmat S
IS
Alternately, if IS is much less that S, the expression may be
reduced to a zero-order equation :
‚
ƒmat
The rate of substrate removal is related to the specific growth
rate by the following equation :
lowest concentration of substrate at which
ƒ = 1/2ƒmax , mass/volume
The Monod expression provides for the continuous transition
between first and zero order kinetics based on substrate concentration .
-dS _ X _ ƒ max S
(g)'= q% _
XSdt
ƒ Y - IS + S ' T
qm KS + S
where Y
=
yield ooeffic~ent, mass organisms grown/mass
mass substrate used
‚
= specific rate of substrate utilization,
mass substrate/ mass organisms/time = ƒ/Y
qm
maximum specific rate of substrate utilization,
mass substrate/mass organisms/time= ƒmar/Y
‚
microbial mass concentration, mass/volume
much greater with
a first order equa-
28
(12)
(13)
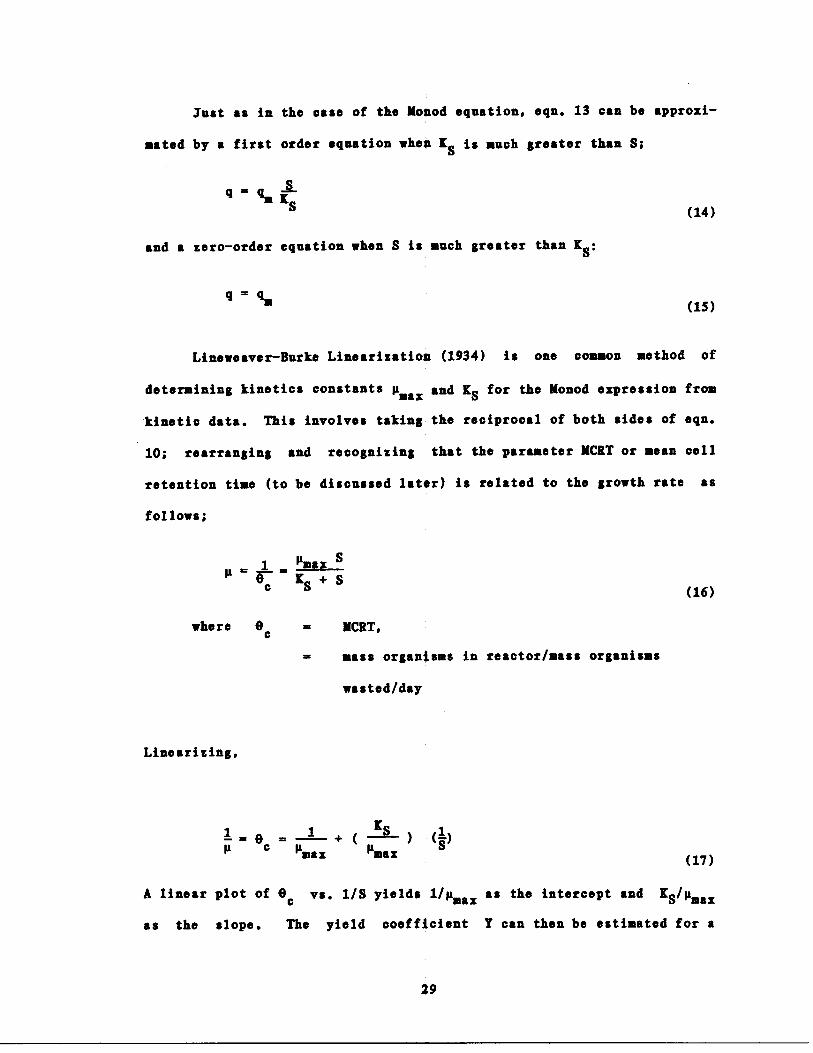
Just as in the case of the Nonod equation, eqn . 13 can be approxi-
mated by a first order equation when KS is much greater than S ;
q = qm KS
and a zero-order equation when S is much greater than SS ;
q = qm
Lineweaver-Burke Linearization (1934) is one common method of
determining kinetics constants ƒmix and SS for the Monod expression from
kinetic data . This involves taking the reciprocal of both sides of eqn .
10 ; rearranging and recognizing that the parameter NCBT or mean cell
retention time (to be discussed later) is related to the growth rate as
follows ;
ƒ = 1 ƒmar S=0c YS + S
where 0c
Linearizing,
1=0c = 1 + ( -K-) (S)ƒ
'max 'mat
MCBT,
mass organisms in reactor/mass organisms
wasted/day
(14)
(15)
(16)
(17)
A linear plot of 0. vs . 1/S yields 1/ƒmix as the intercept and KS/ ƒsax
as the slope .
The yield coefficient Y can then be estimated for a
29
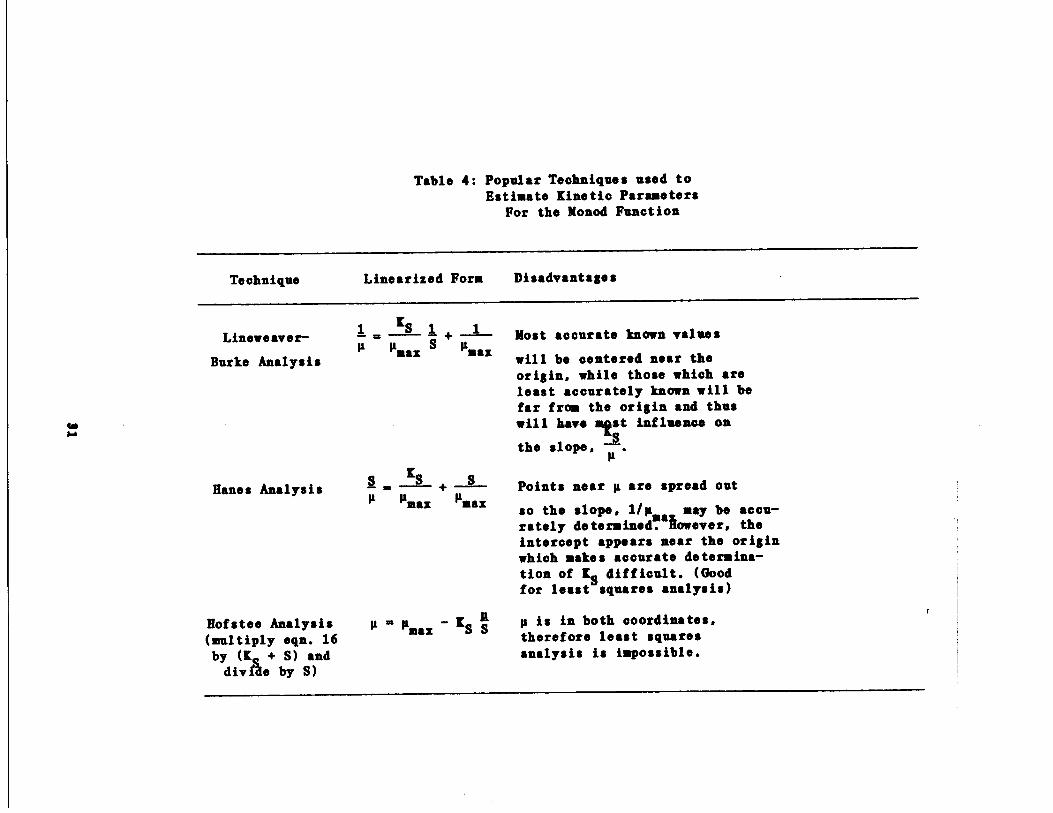
similar plot of equation 13 (1/q vs . 1/S) . Several other methods are
available for the determination of Monod kinetic parameters, including
those of Hanes (1932) and Hofstee (1955) . Each method has its own
inherent advantages and disadvantages (Dixon and Webb, 1979) and adop-
tion of any particular method will depend largely on the nature of the
data to be analyzed . These methods are summarized in Table 4 .
There is substantial literature supporting the use of the Monod
expression (eqn . 10 and 13) to describe nitrifier growth and/or sub-
strate uptake in a variety of environments . The equations have been
successfully applied to nitrification in soils (McLaren, 1971) ; pure
cultures (Skinner and Walker, 1961, Boon and Laudelout, 1962, Loveless
and Painter, 1968) ; estuaries and streams (Lnowles, et al ., 1965, Strat-
ton and McCarty, 1967) ; and activated sludge systems (Dowing, et al .,
1964, Poduska and Andrews, 1975, Williamson and McCarty, 1975) . In
addition, dynamic models of nitrifying activated sludge systems, based
on Monod kinetics, are available to simulate effects of changing
influent conditions on effluent quality (Poduska and Andrews, 1975 ; Mur-
phy, et al ., 1977; Batchelor, 1983)
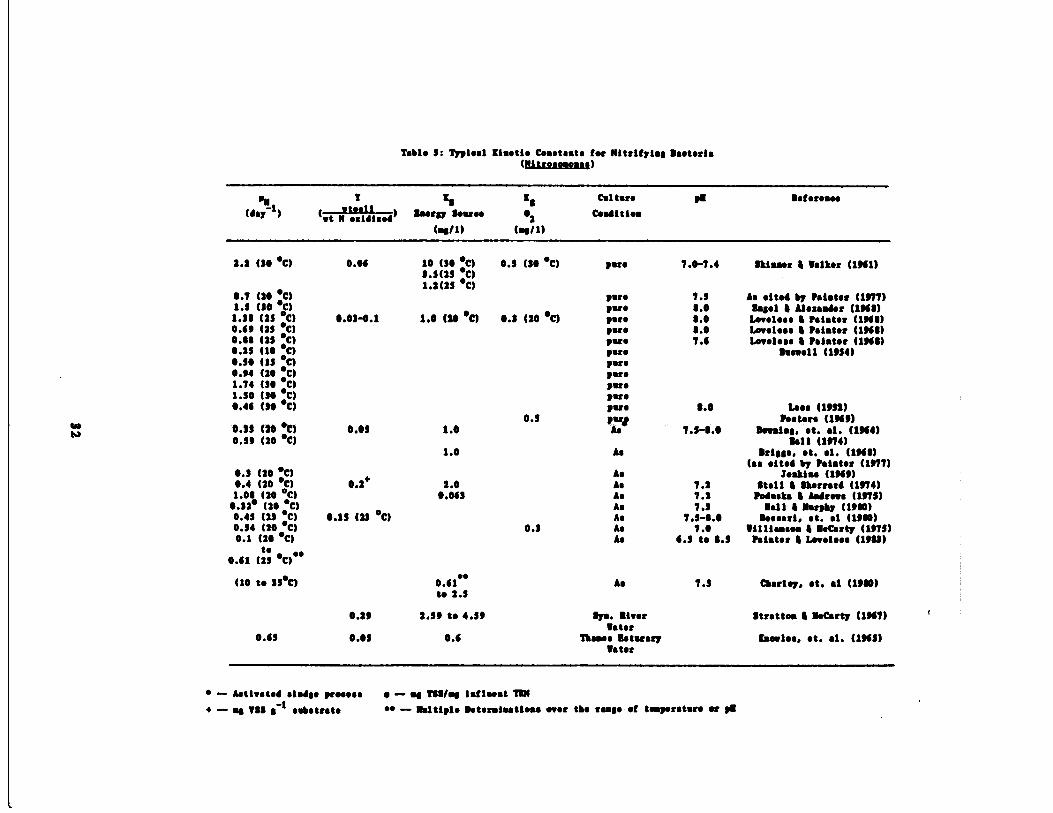
The growth limiting nutrient in equations 10 and 13 has been gen-
erally considered to be the energy source for Nitrosomonas or Nitrobac-
ter, and less frequently, the electron acceptor (dissolved oxygen) .
Typical values for Monod kinetic constants obtained from the literature
are shown in Table S . Table 6 summarizes Table 5 in terms of ranges of
kinetic constants reported for differing environmental conditions . For
comparison, Table 6 includes typical kinetic constants (Sharma and
30
Hanes Analysis
Hofstee Analysis(multiply eqn . 16by (K + S) anddive by S)
Table 4 : Popular Techniques used toEstimate Kinetic Parameters
For the Monod Function
S
KS + S
P ƒmat
max
Kƒ 22 ƒmat - KS S
Disadvantages
Most accurate known values
will be centered near theorigin, while those which areleast accurately known will befar from the origin and thuswill havo agst influence on
the slope, ƒ.Points near p are spread out
so the slope, 1/ƒma may be aoou-rately determined,however, theintercept appears near the originwhich makes accurate determina-tion of Ks difficult . (Goodfor least squares analysis)
ƒ is in both coordinates,therefore least squaresanalysis is impossible .
Technique Linearized Form
1 KS 1_ 1Lineweaver-
ƒ+
ƒmatƒmat SBurke Analysis
‚ -- Astivats0 918489 prose$$
‚ - as tells$ Influent To
-- .s tee 8-1 substrate
s ‚ - Multiple lotsr.iustlo.e over the tease of tomperstare or on
Table 5 : Typlesl [isetie Constants for Nitrifying Vaoteris(Nitrose.oaos)
a Tti 1 8
Cal tore so asforo.s o
(day1) ( at it x11 zed )
"orgy !out" 02 Condition
( .$/1) (sell)
2.2 (30 'C) 0.00 10 (30 'C) 0.5 (30 'C) pace 7.0-7 .4 Skinner 4 Walker (1301)3 .3(13 'C)1.2(23 'C)
0.7 (20 'C) rare 7 .3 As ‚lte4 by Painter (1377)1.3 (30 'C) rue 0 .0 Rssel 0 Alexander (130$)1 .3$ (2$ •C) 0.03-0.1 1 .0 (20 'c) 0.3 (20 ‚c) pare 0 .0 Loveless 0 Paiator (1300)0.03 (23 ‚C) pare 0 .0 Loveless 4 Painter (1300)0.00 (2$ 'C) pus 7 .0 Loveless % Pointer (130$)0.25 (l0 ‚C) pace 0awell (1334)0.30 (13 •C) rare0.34 (20 'C) rare1.74 (30 ‚C ) pare1.30 (30 ‚C ) pus0.40 (30 ‚c ) pars 0.0 Lose 41!32)
0.5 Posters (1303)0.33 (26 at) 0.00 1.0 As 7.3-1.0 Maim. St. al. (1304)0.33 (20 'C) Sell (1374)
1 .0 As arises. e t. al. (130$)
0.3 (20 'C) As(as sited by Pointer (1377)
looking (1303)0.4 (20 •C) 0.2
+1.0 As 7 .2 Stall 4 lhsrrsr0 (1374)
1 .00 (20 •C) 0.003 As 7 .2 Pedants 0 Andrews (137$)0.32‚ (20 ‚C) As 7 .3 Na11 4 Murphy (1300)0.45 (23 •C) 0.15 (23 'C) As 7 .3-0 .0 leesarl . ‚t . al (1300)0.54 (20 •C) 0.3 As 7.0 llllis.soa 0 M‚Carty (137$)0.1 (20 ‚C ) As 0.3 to 0.3 roister 4 Loveless (1303)
t;0.01 ( ‚C)'•
(10 to 33'C) 0.61ss
As 7 .3 Charley. et. al (1300)to 2 .3
0 .23 2.33 to 4 .3$ Sys. Riverr
Stratton 4 MsCarty (1307)
0.43 0 .03 0.0Water
Thanes Setuary Knwles, et. al . (1303)Water
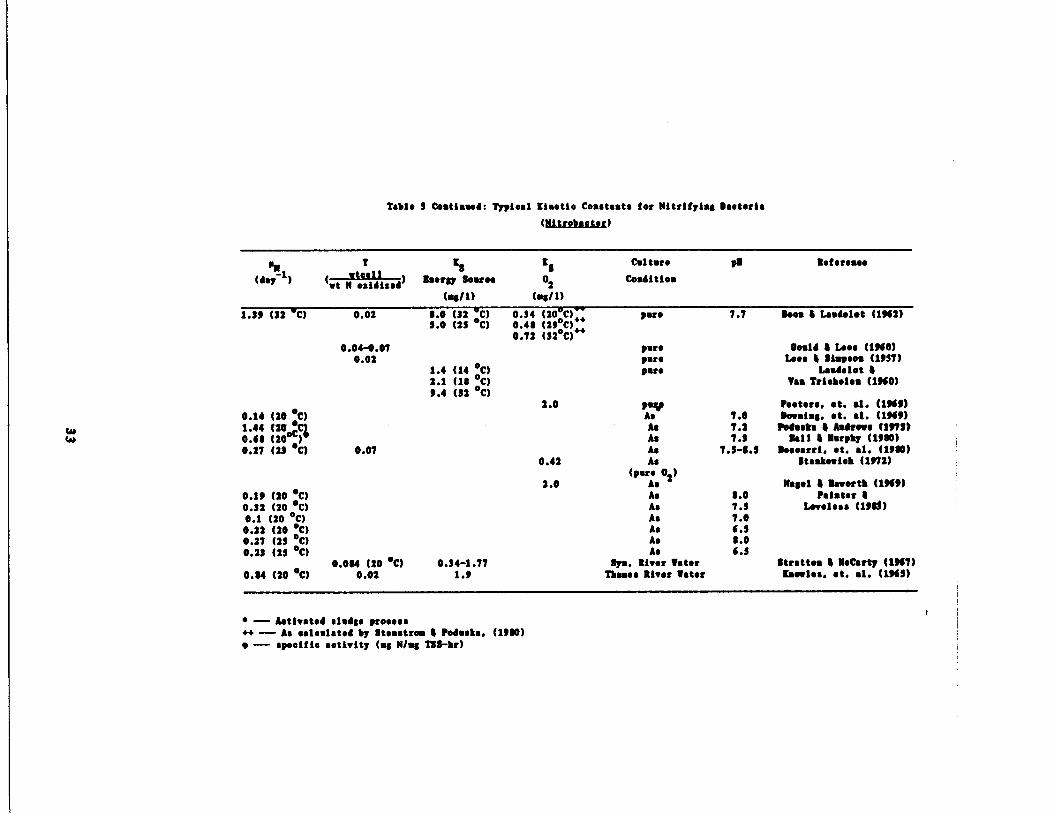
Table 7 Cautioned : Typical Kinetic Constants for Nitrifying Bacteria
‚
-- Activated sludge process~~ -- As calculated by etsastrom 4 Podusta . (1900)
‚
-- specific activity (mg N/mg T5S-hr)
r
($ltrobacter)
PM 7 IS KS
Culture pM Reference
(day1) (ut N osidised ) Nearly Source 02 Condition
(ey/1) (ag/1)
1.79 (32 •C) 0.02 0.0 (32 C) 0.14 (20 C) pare 7.7 Does 4 Laudelot (1962)! .0 (25 •C) 0.40 (29•C)~+
0.72 (32•C) ;a0.04-0 .07 pare held 4 Loos (1%0)
0.02 pure Ives 4 Simpson (1957)1.4 (14 •C) pare Laudelet 42.1 (10 •C) Taa Triehelsn (1960)9.4 (32 •C)
2.0 pay pesters, et. al. (1969)0.14 (20 •C) As 7.0 Dowsing. St. al. (1969)1 .44 (20 As 7.2 Podium $ Andrews (1173)0.60
C%.(20•0) As 7 .5 Mall 4 Murphy (1900)
0.27 (27 •C) 0.07 As 7.7-0 .5 Weearri . ‚t . al. (1900)0.42 As gtaakeuieh (1972)
2 .0(pare 02 )
As Nagel 4 Maeertb (196!)0.11 (20 •C) As 0.0 painter 40.32 (20 •C) As 7.5 Loveless (ltd)0.1 (20 •C) As 7.00 .22 (20 •C) As 6 .70 .27 (27 •C) As 0 .00.23 (25 •C) As 4 .5
0.004 (20 •C) 0.34-1 .77 Sys. River Water Stratton & McCarty (1967)0.04 (20 •C) 0.02 1 .9 Thames liver Later Kaeeles. at. al. (1960
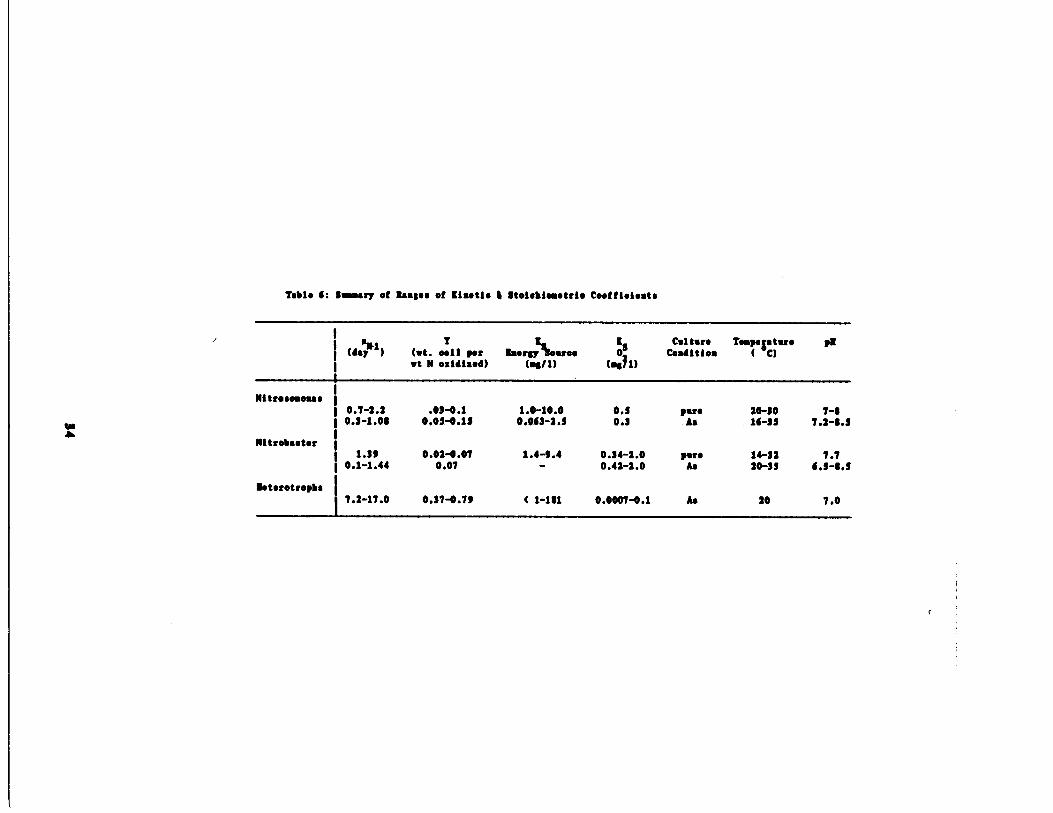
Table s : Summary of Ranges of tia.tie 4 $tolefi.sstrie Co.ffisionts
r
M1F1(day )
T(it . sell perwt N oxidised)
K%Energy su.s(us/1)
t80
(.,h)
Cal toroCondition
TsnpoS.tuo( C)
p1
Nitre.o.sna .0.7-2 .2 .03-0 .1 1.0-10 .0 0.3 par. 20-30 7-80.3-1 .00 0.05-0.13 0.043-2 .3 0.3 As 1s-33 7.2-1 .3
Nitroba.t.r1.39 0 .02-0 .07 1 .4-9 .4 0.34-2 .0 par. 14-32 7 .7
0.1-1 .44 0.07 0.42-2 .0 As 20-35 6.3-8 .3
N.t.retropbs7.2-17 .0 0.37-0 .79 ( 1-181 0.0007-0 .1 As 20 7.0
Ahlert, 1977) for heterotrophic bacteria grown on glucose substrate .
Several important points can be made with respect to the tables .
For example, Table 6 shows the the values of ƒa82 for nitrifiers are at
least an order of magnitude smaller than that of heterotrophs, indicat-
ing that nitrification in activated sludge processes will occur only
where the specific growth rate is low . Furthermore, the values of KS
(energy source) are seen to be relatively low for both nitrifying genera
as compared to the substrate concentrations normally encountered in a
typical wastewater treatment plant (i .e ., 20-40 mg/1 NHS N) . This would
wean that nitrifies growth rates are essentially independent of sub-
strate concentration (zero-ordered reaction) over a broad range . Such
zero-order substrate kinetics have been reported by numerous investiga-
tors under various conditions (Engel and Alexander, 1959 ; Nicholas and
Jones, 1960 ; Wild, et al ., 1971 ; tiff, 1972 ; Huang and Hopson, 1974 ;
Hall and Murphy, 1980 ; Sutton, et al ., 1981) over the composite range of
1 .6 to 673 ag/i NHSN) . Tomlinson, et al . (1966) has suggested that the
rates of nitrification will not be limited by energy sources as long as
the concentration of ammonia and nitrite exceeds 3 and 10 mg/1-N,
respectively .
However, there appears to be some disagreement in the literature
with respect to the true reaction kinetics of nitrification . A recent
investigation by Charley, et al . (1980) gave evidence that nitrification
rates followed strict Monod type kinetics at all operational concentra-
tions at a treatment plant . They reported that the ammonia concentra-
tion at which p is 90% of ƒmax ($90) can be as high as 22 .5 ag/l (350
3 5
C) . At the S90 value reaction kinetics can be regarded as changing from
first to zero order . They also reported first order reaction kinetics
for Nitrobacter up to 20 mg/l nitrite .
Until the recent work of Painter and Loveless (1983), there was a
paucity of data for ƒmat values of Nitrobacter in activated sludge . In
over half the ƒmat values reported in Table 3, ƒcoax for Nitrosomonas
is greater than that of Nitrobacter in activated sludge . According to
Painter and Loveless, in these cases it is Nitrobacter rather than
Nitrosomonas that could be the deciding factor as to whether or not full
nitrification will occur under any given set of conditions . moreover,
they implied that in some circumstances nitrite accumulation should
occur even under optimal nitrifying conditions . However, situations
such as those proposed by the authors are rarely observed . One possible
explanation for this may lie in the energetics of nitrification . Nitro-
somonas obtains approximately four times the energy per mole of nitrogen
oxidized than does Nitrobacter (see eqns . 1 and 2) . As such, this would
suggest that Nitrobacter would have to oxidize nitrite approximately 4
times as fast to generate the same mass (assuming equal cell mass/unit
energy produced) . Although ƒcoax for Nitrosomonas may be greater than
Nitrobacter for a given set of conditions, their specific growth rates,
p may be equal in magnitude due to a lower KS value for Nitrobacter . It
should be pointed out that no KS value has yet been reported for Nitrob-
actor in activated sludge systems . The common observation that nitrite
rarely accumulates in natural biological systems points to the fact that
the Nitrobacter species have developed a capacity for rapid nitrite oxi-
dation. And by doing so, the current general consensus is that the
3 6
overall nitrification process is governed by the activity of Nitrosomo-
nas .
Several investigators (Sharma and Ahlert, 1977; Beccari, et al .,
1980 ; Painter, 1977 ; Hall and Murphy, 1980) have noted the broad ranges
of kinetic constants reported in the literature for nitrifiers . In par-
ticular, the wide range of values for ƒmix is disturbing since the
design of wastewater nitrification systems depends on the accurate esti-
mation of this parameter . It is generally accepted that the estimation
of nitrifier kinetic parameters in mixed cultures of autotrophs and
heterotrophs is difficult at best . Most of this difficulty apparently
stems from inadequate methods of estimating the fraction of microorgan-
isms which are autotrophs . It is necessary to determine nitrifier
organism mass or to precisely know yield coefficients to determine the
values of p in equation 13 for differing culture conditions .
Sharma and Ahlert (1977) reviewed several methods used previously
to estimate nitrifier concentrations in both pure and mixed cultures .
Included in their discussion are the drawbacks of the various methods .
They concluded that most methods were based on invalid assumptions while
others are insufficiently tested to warrant general use . More recently,
Hall and Murphy (1980) reviewed several techniques that have emerged
within the last 5 years or so for nitrifier concentration measurement .
Among these methods are techniques based on most probable number (MPN) ;
fluorescent antibodies (FA) ; and 14 C-bicarbonate incorporation . They
dismissed the MPN and FA techniques on the basis of their inherent prac-
tical limitations and the
14 C-bicarbonate assimilation technique
3 7
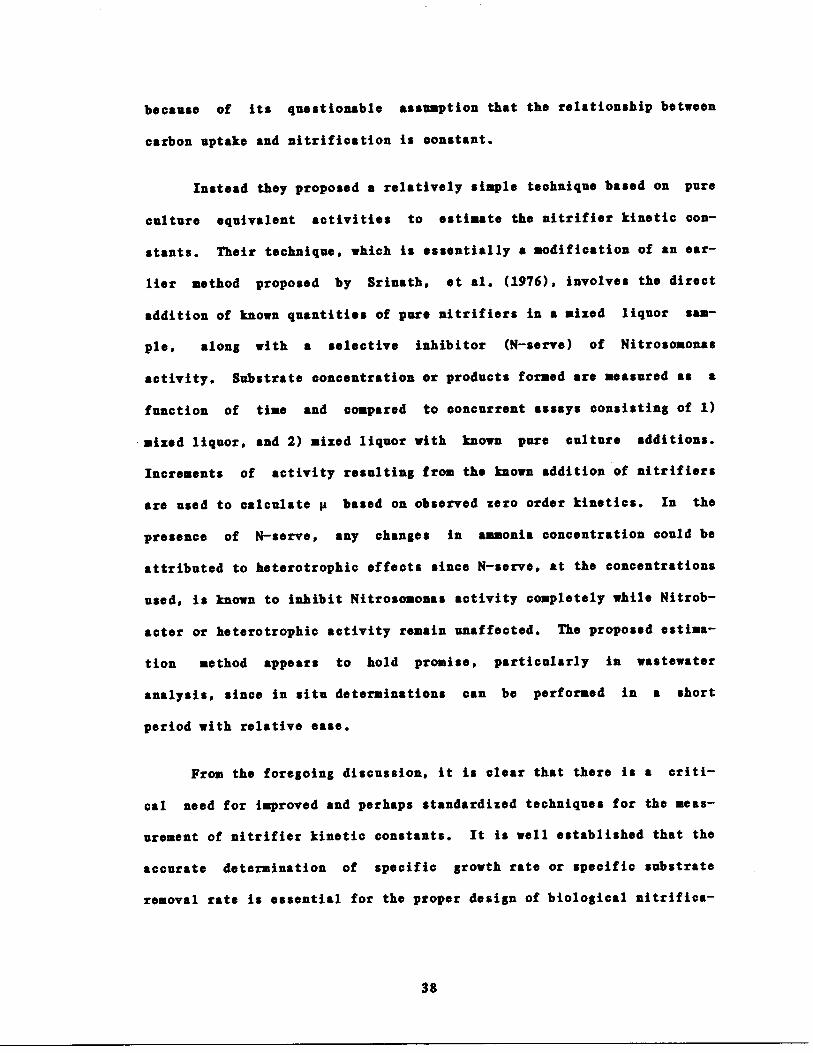
because of its questionable assumption that the relationship between
carbon uptake and nitrification is constant .
Instead they proposed a relatively simple technique based on pure
culture equivalent activities to estimate the nitrifier kinetic
stants . Their technique, which is essentially a modification of an
liar method proposed by Srinath,
3 8
et al . (1976),
con-
ear-
involves the direct
addition of known quantities of pure nitrifiers in a mixed liquor sam-
ple, along with a selective inhibitor (N-serve) of Nitrosomonas
activity . Substrate concentration or products formed are measured as a
function of time and compared to concurrent assays consisting of 1)
mixed liquor, and 2) mixed liquor with known pure culture additions .
Increments of activity resulting from the known addition of nitrifiers
are used to calculate p based on observed zero order kinetics . In the
presence of N-serve, any changes in ammonia concentration could be
attributed to heterotrophic effects since N-serve, at the concentrations
used, is known to inhibit Nitrosomonas activity completely while Nitrob-
acter or heterotrophic activity remain unaffected . The proposed estima-
tion method appears to hold promise, particularly in wastewater
analysis, since in situ determinations can be performed in a short
period with relative ease .
From the foregoing discussion, it is clear that there is a criti-
cal need for improved and perhaps standardized techniques for the meas-
urement of nitrifier kinetic constants . It is well established that the
accurate determination of specific growth rate or specific substrate
removal rate is essential for the proper design of biological nitrifica-

tion systems .
It is likely that the variability of reported kinetic constants
can be attributed not only to inadequate measurement techniques but also
to differing culture conditions . The exact kinetics occurring during
nitrification are governed by any number of complex interacting factors
relating to prevailing culture conditions . These factors include pH,
dissolved oxygen concentration, presence or absence of micronutrients or
inhibitors, temperature and interactions with heterotrophic organisms in
mixed culture . No relationship is available to allow the prediction of
at specified levels of these parameters .
Nitrification in Activated Sludge Processes
To date, biological nitrification in activated sludge systems is
the form of ammonia removal generally considered the most attractive in
terms of process applicability and cost effectiveness (USEPA, 1975 ;
Focht and Chang, 1975) . It is also recognized however, that nitrifying
organisms are extremely sensitive to prevailing environmental conditions
and process variables . Sufficient information based on literature
reports and years of operational experience is now available to provide
some basis for the design of nitrifying systems (USEPA, 1975) . In addi-
tion, two excellent reviews have appeared to address the subject of nit-
rification and/or denitrification as applied to wastewater treatment
systems (Focht and Chang, 1975 ; Sharma and Ahlert, 1977) .
39
Nitrification in activated sludge systems can be obtained if the
conditions suitable for the retention and accumulation of nitrifying
organisms are maintained . The necessary conditions may be expressed in
terms of inorganic substrate concentration, MCRT, pH, temperature, dis-
solved oxygen concentration, presence of required nutrients and absence
of inhibitory or toxic substances . The interplay among these various
factors plus the presence of a diverse heterotrophic population in any
given system makes for a unique and extremely complex ecosystem from
which only gross generalizations can be made . The purpose of this sec-
tion is to review the various factors affecting the nitrification pro-
cess, with emphasis on activated sludge systems . It is important to
note that the interpretation of the results presented herein should be
approached with caution since they were obtained under different sets of
conditions . generalizations are made when deemed appropriate .
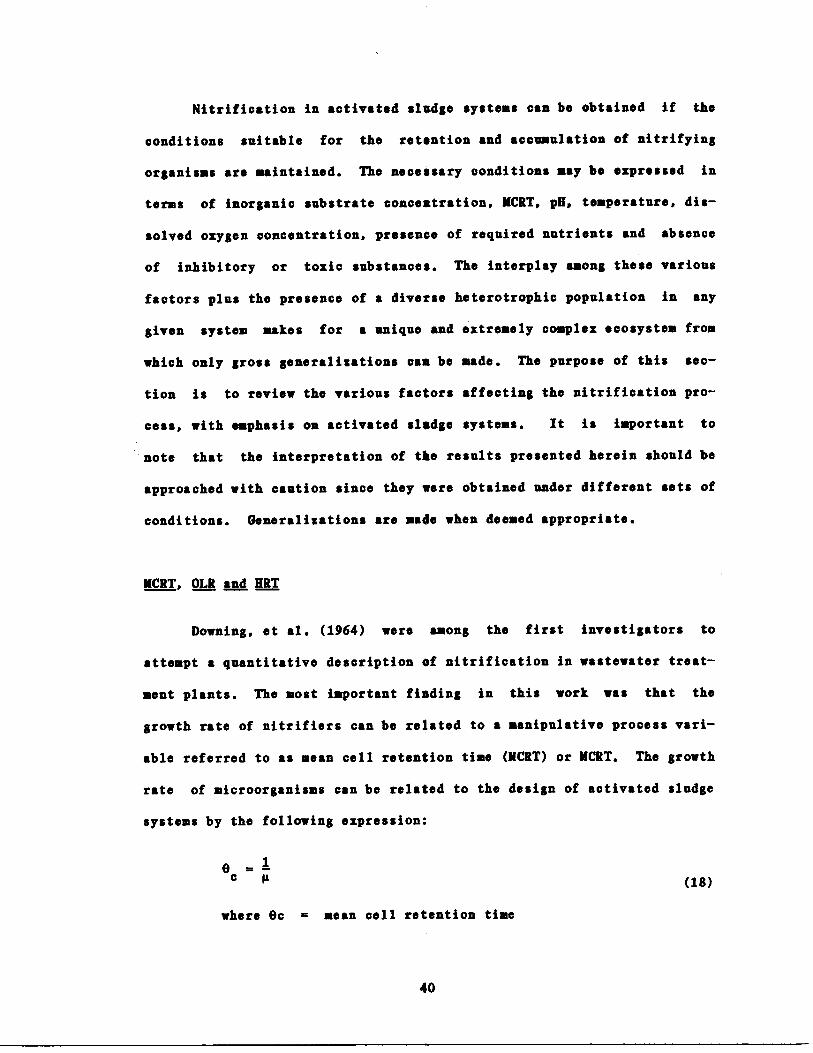
MCRT, OLR and HRT
Downing, et al . (1964) were among the first investigators to
attempt a quantitative description of nitrification in wastewater treat-
ment plants . The most important finding in this work was that the
growth rate of nitrifiers can be related to a manipulative process vari-
able referred to as mean cell retention time (NCRT) or $CRT . The growth
rate of microorganisms can be related to the design of activated sludge
systems by the following expression :
e = 1c
ƒ
where Oc = mean cell retention time
40
(18)
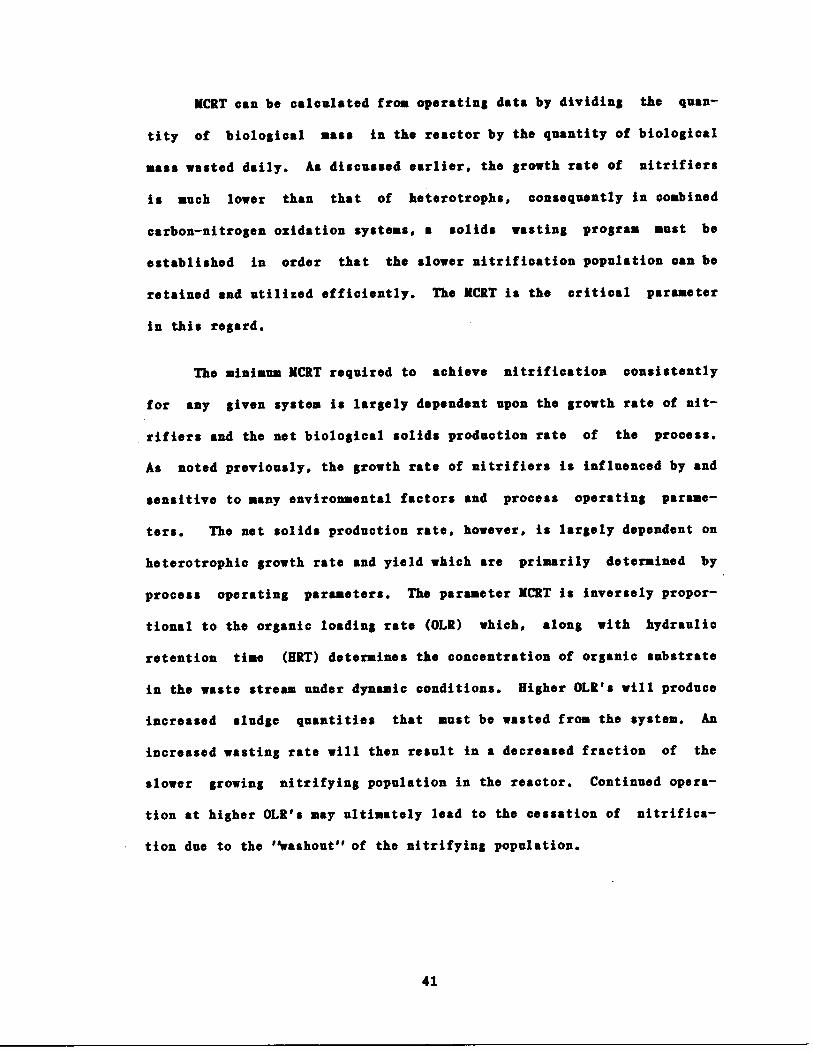
KCRT can be calculated from operating data by dividing the quan-
tity of biological mass in the reactor by the quantity of biological
mass wasted daily . As discussed earlier, the growth rate of nitrifiers
is much lower than that of heterotrophs, consequently in combined
carbon-nitrogen oxidation systems, a solids wasting program must be
established in order that the slower nitrification population can be
retained and utilized efficiently . The KCRT is the critical parameter
in this regard .
The minimum MCRT required to achieve nitrification consistently
for any given system is largely dependent upon the growth rate of nit-
rifiers and the net biological solids production rate of the process .
As noted previously, the growth rate of nitrifiers is influenced by and
sensitive to many environmental factors and process operating parame-
ters . The net solids production rate, however, is largely dependent on
heterotrophic growth rate and yield which are primarily determined by
process operating parameters . The parameter KCRT is inversely propor-
tional to the organic loading rate MR) which, along with hydraulic
retention time (HRT) determines the concentration of organic substrate
in the waste stream under dynamic conditions . Higher OLR's will produce
increased sludge quantities that must be wasted from the system . An
increased wasting rate will then result in a decreased fraction of the
slower growing nitrifying population in the reactor . Continued opera-
tion at higher OLR's may ultimately lead to the cessation of nitrifica-
tion due to the "washout" of the nitrifying population .
41

The maximum F/M ratio, defined as OLR divided by the mass of reac-
tor biological solids, required to maintain consistent nitrification
appears to be in the range of 0 .3 to 0 .4 lb BOD/lb MLVSS/day (Balakrish-
nan and Eckenfelder, 1969), and for increasing values above that range,
the degree of nitrification has been found to decrease correspondingly
(Prakasam and Loehr, 1972) . Johnson and Sehroepfer (1964) and later
Prakasam and Loehr (1972) reported that a minimum MCRT of 3 days is
required for nitrification in laboratory scale activated sludge units .
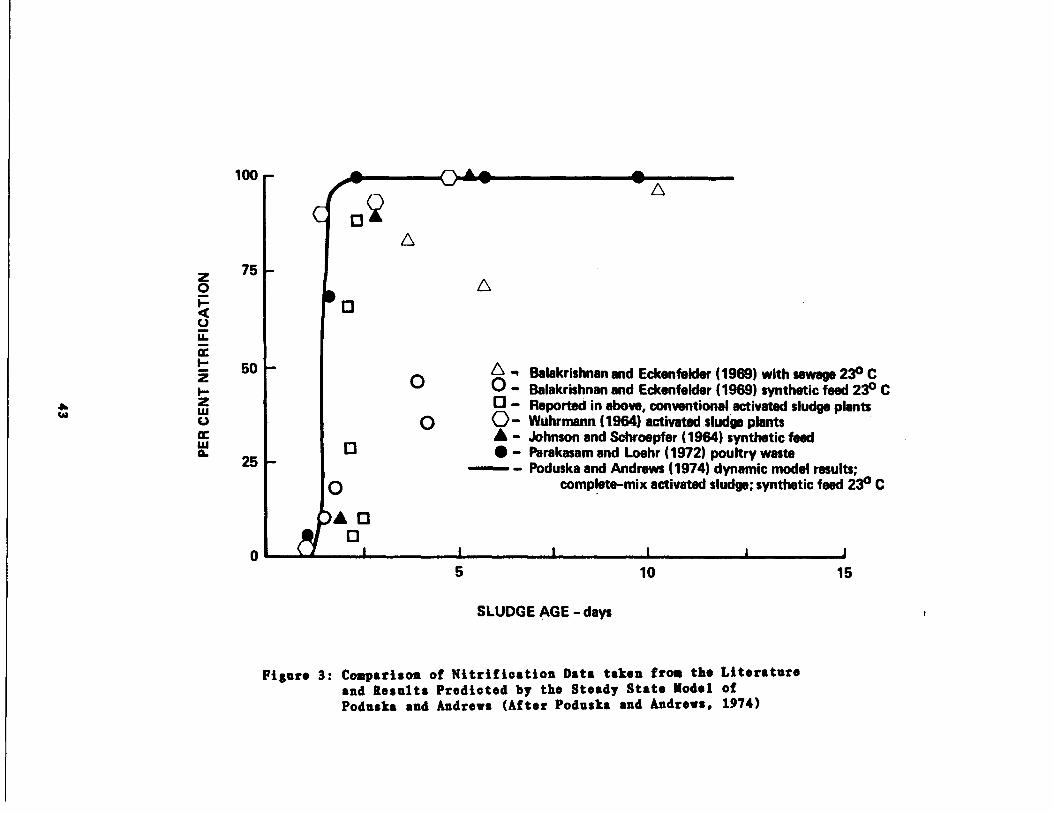
Poduska (1973) and Poduska and Andrews (1974) summarized previous
results on the effects of KCRT in relation to the degree of nitrifica-
tion obtainable (see Figure 3) and also noted that at temperatures less
than 20• C the MCRT required to maintain high nitrification efficiences
increases markedly .
Figure 3 points out an interesting fact in that under steady state
conditions, activated sludge systems will tend to give an "all or none"
response to nitrification for a given NCRT. The high efficiencies of
nitrification are associated with the low Y S (energy source) values of
nitrifiers . Poduska and Andrews (1974) pointed out that there are occa-
sions when this phenomenon will not occur . One is when the reactor is
subjected to dynamic loads, in which case a slightly higher MCRT will be
required . Other occasions can be attributed to the presence of inhibi-
tory substances .
42
100
75
50
25
A
QA‚
A
O
O - Balakrishnan and Eckenfelder (1969) with sewage 23• CBalakrishnan and Ecicenfelder (1969) synthetic feed 23• C
13- Reported in above, conventional activated sludge plants -0
0- Wuhrmann (1964) activated sludge plantsA - Johnson and Schroepfer (1964) synthetic feed
0
‚ - Parakasam and Loehr (1972) poultry wastePoduska and Andrews (1974) dynamic model results ;
o
complete-mix activated sludge ; synthetic feed 23• C
A 17
mp O
5
10
15
SLUDGE AGE - days
Figure 3 : Comparison of Nitrification Data taken from the Literatureand Results Predicted by the Steady State Model ofPoduska and Andrews (After Poduska and Andrews, 1974)
Effect of Temperature_ oa Nitrification
Temperature has a profound effect on nitrification rates . In a
full scale municipal treatment plant, Beckman, et al . (1972) observed 90
to 95% nitrification at 18• C with a MCRT of 6 .5 days and only 75% nit-
rification at 100 C . Sutton, et al . (1981), in studies conducted in a
full scale Canadian industrial treatment plant, reported that the degree
of nitrification was seasonal with the loss of nitrification each winter
as the aerobic basin temperature approached 10 0 C . In addition, they
observed that complete nitrification could not be sustained during
.winter months even under conditions of good process control with MCRT
greater than 70 days . As a result of these findings, it was decided to
proceed with a project to raise the aerobic basin temperature during
winter months .
Early studies with mixed and pure cultures of nitrifying organisms
revealed that the growth rate of nitrifiers, as well as that of hetero-
trophs, is a strong function of temperature . knowles, et al . (1965) fit
kinetic data collected from suspended growth cultures and determined the
following mathematical relationships between nitrifier growth rate and
temperature(8 to 28• C) :
Log10 ƒmar = 0 .413(T) - 0 .944
for Nitrosomonas (where T is expressed in degrees Celsius) ; and
Log 10 ƒmar = 0 .0255(T) - 0 .492
for Nitrobacter .
44
(19)
(20)
They also reported that nitrifier KS (energy source) values were
dependent upon temperature and established empirical expressions for
these relationships as well :
Log10 HS(NH4-N) = 0 .051(T) - 1 .158
for Nitrosomonas ; and
Log10 YS(N02N) = 0 .063(T) - 1 .149(22)
for Nitrobacter .
Charley, et al . (1980) reported that the relationship between K S
and temperature as proposed by Knowles does not always hold . From
kinetic data generated from laboratory scale activated sludge units,
they observed a general increase of MS (NH4N) with temperature over the
range of 10 to 35•C, but found that the KS for Nitrosomonas was lowest
(0 .61 „g/1) at 15•C . Moreover, they reported that the S(90) value (5 .49
mg/1) at 15•C was the lowest among all the temperatures tested . These
findings suggests that the nitrification reaction kinetics at this tem-
perature are more efficient than at any other temperature studied . How-
ever, these findings do not mean that treatment plants nitrify the
fastest at this particular temperature since the overriding factor
governing nitrification in activated sludge is the fraction of nitrif-
iers present . This, in turn is largely dependent on ƒmix or MCRT and
temperature . Their findings do indicate however, that at 15 •C, a given
population size of nitrifiers would oxidize ammonia more efficiently
than the same size population at any other temperature studied . A
further implication is that nitrifiers apparently have different optimum
45
(21)
temperatures for carbon assimilation
(nitrification) .
Because both • andKS
are a function of temperature, it is impor-
tant that both parameters be considered when attempting to determine the
effect of temperature dependent nitrification
In wastewater treatment systems, temperature is the most difficult
environmental parameter to control . This difficulty is reflected in
many cases where nitrifying ability is partially or completely lost in
treatment plants situated in colder climates . Studies involving nitrif-
ication in activated sludge have indicated that the nitrification rate
approximately doubles for a rise in temperature from 10 to 20 „C (USEPA,
1975) . The optimum temperature for nitrification in activated sludge is
reported to be in the range of 30 to 35„C with a pronounced decrease at
temperatures below 18„C and above 35„C (USEPA, 1975) . Therefore, in
many treatment plant environments nitrification proceeds at suboptimal
temperatures . In order to compensate for low or suboptimal tempera-
tures, operation at higher retention times and/or higher KCBT are often
required to maintain reasonable nitrification efficiencies. For exam-
ple, Sutton, et al . (1981) reported, based on bench scale studies, that
the minimum KCBT required to nitrify Du Pont wastewater was 25 to 30
days at 20„C ; compared to 55 to 60 days at 10 „C .
46
(growth) and energy production
pH and Alkalinity Effects on Nitrification
In general, functions relating pH to nitrification rates in pure,
mixed or activated sludge cultures are fairly flat over a limited pH
range and steadily decrease on either side of the plateau . For pure
cultures of Nitrosomonas, plateau ranges of 8 .0 to 8 .5 (Buswell, et al .
1954) ; 7 .2 to 9 .2 (Engel and Alexander, 1958) and 7 .0 to 8 .2 (Loveless
and Painter, 1968) have been reported . For pure cultures of Nitrobac-
ter, Lees (1954) and Boon and Laudelout (1962), reported the optimal pH
range to be 8 .3-8 .6 and 7 .3 to 8 .4, respectively . Similarly, optimal pH
ranges for nitrification in activated sludge have been reported to be
8 .4 to 8 .6 (Rimer and Woodward, 1972) ; 7 .5 to 8 .5 (Downing, et al .,
1964) and 7 .5 to 8 .0 (Painter and Loveless, 1983) . Although there are
apparent differences among reported optimal pH ranges, in all cases the
optimal pH is at least 7 .0 . The differences in reported ranges are
likely attributable to differences in culture conditions (i .e ., trace-
element status in the medium ; Loveless and Painter, 1968) and/or nitrif-
ier strains . It is generally accepted that nitrification will occur
optimally at a neutral to slightly alkaline pH (Focht and Chang, 1975 ;
Sharma and Ahlert, 1977) of 7 .0 to 8 .0 .
Most of the controversy regarding pH effects on nitrification
rates appear to be reported outside of the optimal range . Nitrification
rates for Nitrosomonas have been reported to occur with 50% optimal
activity at pH values as low as 6.2 to as high as 9 .6 (Engel and Alex-
ander, 1958), although much narrower ranges have been observed (Hofman
and Lees, 1952 ; Loveless and Painter, 1968) . For activated sludge Hall
47
(1974), Downing, et al . (1964) and Painter and Loveless (1983) reported
that the lower limit at which nitrification can occur is 6.2, 6 .5 and
6 .0 respectively . In contrast, nitrification at pH values as low as 4 .0
(Prakasam, at . al ., 1974) and 4 .9 (Prakasam and Loehr, 1972) have been
reported to occur in poultry wastewaters . Disalvo and Sherrard (1980)
and Stankewich (1972) reported nitrification occurring in activated
sludge systems at the pH of 5 .1 and 5 .8 respectively . It has been shown
however, that nitrifiers have the ability to acclimate to pH values out-
side their optimal ranges while retaining similar nitrification abili-
ties (Hang and McCarty, 1972) .
Anthonisen, et al . (1976) has suggested that the mechanism respon-
sible for lowered nitrification rates at pH values above or below the
optimal range involves pH dependent NH3/NH4 and N02/HNO 2 equilibria in
aqueous environments. He proposed that free ammonia (NH3 ) and free
nitrous acid (HNO2 ) which increase in concentration at higher and lower
pH's, respectively, inhibit nitrifying organisms . This theory has been
disputed by Poduska (1973) who performed impulse nitrite spiking tests
at various pH levels and demonstrated that the overall effect of a pH
decrease was significantly greater on nitrite oxidation rate than that
attributed to the increase in concentration of HNO 2 alone . From this,
it would appear that the mechanism responsible for the effect of pH on
nitrification rates is more complex than that proposed by Anthonisen,
and merits further study . The subject of substrate and end product
inhibition will be reviewed in greater detail in a later section .
48
The effect of CO2 produced from the degradation of organic matter
in the treatment of domestic wastewaters is generally not a problem
since the CO2 is the equilibrium with the atmosphere .
optimal pH for nitrification may be greater than 8 .0, Wang, et . al
(1978) recommended operating treatment plants at 7 .6 to 7 .8 in order to
allow CO2 to escape to the atmosphere .
If highly nitrogenous wastes are present in the waste stream,
depressed nitrification rates may be observed in cases where inadequate
buffering capacity exist . The effect of nitrification on pH depression
readily apparent by inspection of the following synthesis and oxida-
tion equations for nitrifiers (USEPA, 1975):
55 NH4 + 76 0 2 + 109 HCO3 -'1
CSH7N02 + 54 NO2 + 57 H20 + 104 H2C03
(Nitrosomonas)
400 NO- + NH4 + 4 H2C03 + HCO3 + 195 02 -->
C5H7N02 + 3 H20 + 400 N03
(Nitrobacter)
Although the
Development of equations 23 and 24 was based on a reasonable
49
(23)
(24)
Cell
yields and the commonly used empirical formulation for microbial cells .
These equations indicate that a large amount of alkalinity (HCO3) will
be utilized during nitrification . Although a small part of this will be
utilized in autotrophic biosynthesis, the majority will be used to neu-
tralize the production of free acid (H+) in context of the carbonic acid
system . A ratio of alkalinity destroyed (as mg/l CaCO3 ) per mg of
ammonia oxidized of approximately 7 .1 has been calculated (USEPA, 1975) .
Wang, et al . (1978), neglecting biosynthesis, showed that one mole of
calcium bicarbonate is needed to neutralize every two moles of nitric
acid produced from the nitrification process :
2 NH4 + 2 HCO3
+ 4 02 + Ca(HCO3)2 --+(25)
Ca(N03 ) 2 + 4 C02 + H2O
In wastewaters where insufficient buffering capacity exists, eqn.
25 can be used to readily calculate the amount of added alkalinity
(lime) required.
It has been shown that pH strongly influences the toxic effects of
heavy metals in activated sludge . This will be discussed more fully in
a later section .
Effect of Dissolved Oxygen of Nitrification
Equations 23 and 24 indicate that oxygen is required for the
oxidation-reduction reactions occurring in nitrification . These equa-
tions correspond to an oxygen consumption ratio of approximately 3 .15 mg
02/mg NH4 -N oxidized and 1 .11 mg 02./mg N0 -N oxidized (USEPA, 1975) . It
remains a point of controversy as to whether or not stoichiometric
amounts of oxygen are used during nitrification (Sharma and Ahlert,
50
1977) and it has been suggested (Kiesow, 1972 as cited in Sharma and
Ahlert, 1977) that the variable oxygen consumption rates for nitrifica-
tion reported in the literature may be explained by variable
stoichiometry exhibited by Nitrobacter during inorganic assimilation
(see Figure 2) .
The concentration of dissolved oxygen (DO) in wastewater treatment
plants has a significant effect of nitrification rates . Murphy (1974,
as cited in USEPA, 1975) observed that nitrification was more efficient
at 7 to 8 mg/l DO than at 1 mg/1 . Nagel and Haworth (1969) determined
that the relationship between DO and nitrification rates could be fitted
with the Monod expression over the concentration range studied . These
experiments, carried out in full-scale treatment plants, indicated that
the KS (02 ) value was a surprisingly high value of 2 .0 mg/1 .
A number of other experimental and theoretical studies involving
pure and mixed and activated sludge cultures have been reported on the
effects of DO on nitrification rates . Notable among these investiga-
tions is that by Stenstrom and Poduska (1980) who reviewed and summar-
ized much of the previous work n this respect . This summary is
presented in Table 7 . Several important generalizations can be made or
inferred from inspection of Table 7 :
1 . Oxygen substrate limitation exists in nitrification processes and
maintenance of a minimal dissolved oxygen concentration is essen-
tial to achieve a sustained degree of nitrification .
2 .
The KS (02 ) values for nitrifiers are reportedly higher than that
51
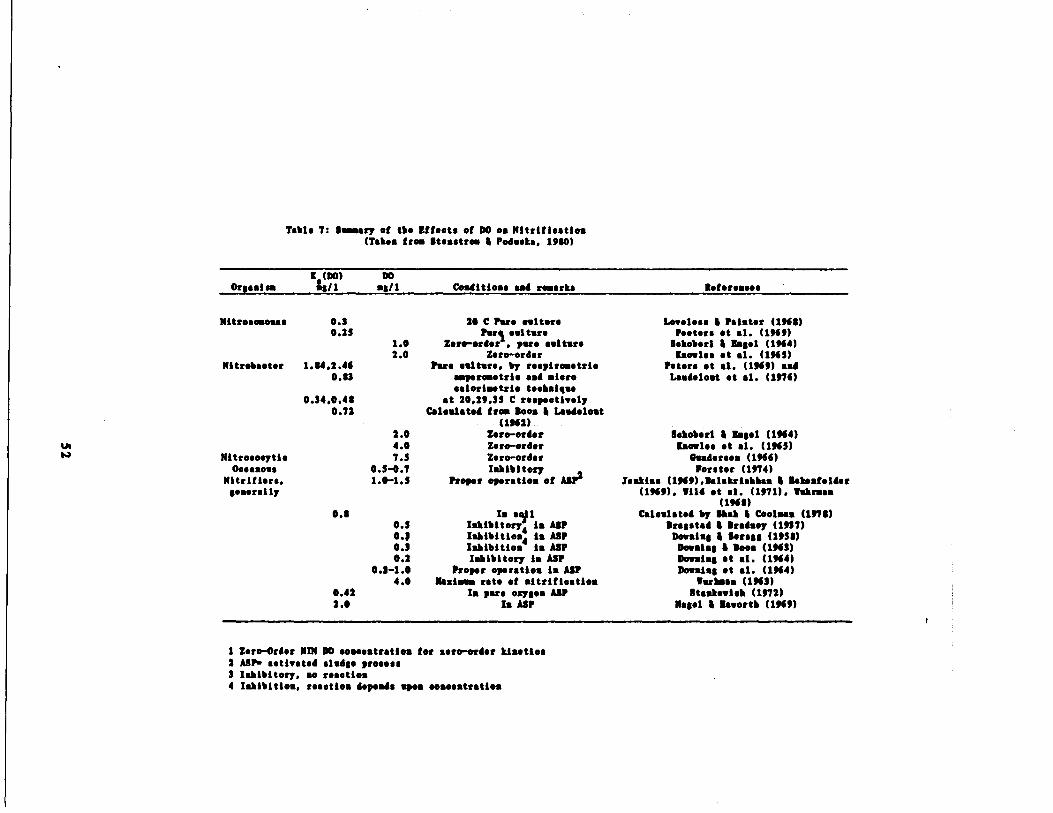
Table 7 : Summary of the Effects of DO a‚ Nitrification(Taken from Stsnstrom S Poduskt . 1980)
1 Zero-Order NIN DO concentration for zero-order kinetics2 ASP- motivated sludge process3 Inhibitory, so reaction4 Inhibition. reaction depends upon seassatratioa
r
Oriaalan(D0)
ng/1DOmg/l conditions and remarks References
Nitrosemouse 0.10 .23
20 C Pare guitarsPort culture
Loveless I Painter (1968)Pesters et a1 . (1969)
1 .0 Zero-order , pure suitors 8eboberi 4 Bagel (1964)2 .0 Zero-order Lowles et a1 . (1963)
Nitrobsster 1.84,2 .46 Pure culture, by rsspire‚etrie Peters et a1 . (1969) and0.83 amperometris and micro Laudelout et al. (1976)
0.34,0.48calorimetric technique
at 20.29.33 C respectively0.72 Calculated from Soon I La delost
(1962)2.0 Zero-order Sekobcrl 4 asset (1964)4.0 Zero-order Knowles at at . (1%5)
Nitrososytie 7.3 Zsro-order Gunderson (1966)Oessmoos 0 .3-0 .7 Inhibitory Forster (1974)
Nitrifisrs, 1 .0-1 .3 Proper operation of ASP2 Ysakiaa (1969) .Salakriskkaa a Eaksafoldergenerally (1969) . Wild at al . (1971) . Wshrmas
(1968)0.8 Is all Calculated by Stet 4 Coolman (1978)
0.3 Iabibitory is ASP Sregstal 4 Sredasy (1937)0.~ Inhibit ion4 Is ASP Downing a Sorest (1938)0.1 Imbibition is ASP Downing I Doom (1961)0.2 Inhibitory in ASP Downing ƒt al . (1964)
0.3-1 .0 Proper operation i‚ ASP Domain& at a1 . (1964)4.0 hobo. rate of nitrification Wurkmaa (1963)
0.42 Ia pare oxygen ASP Staaksuisk (1972)2 .0 Is ASP Natal I Lwortb (1969)
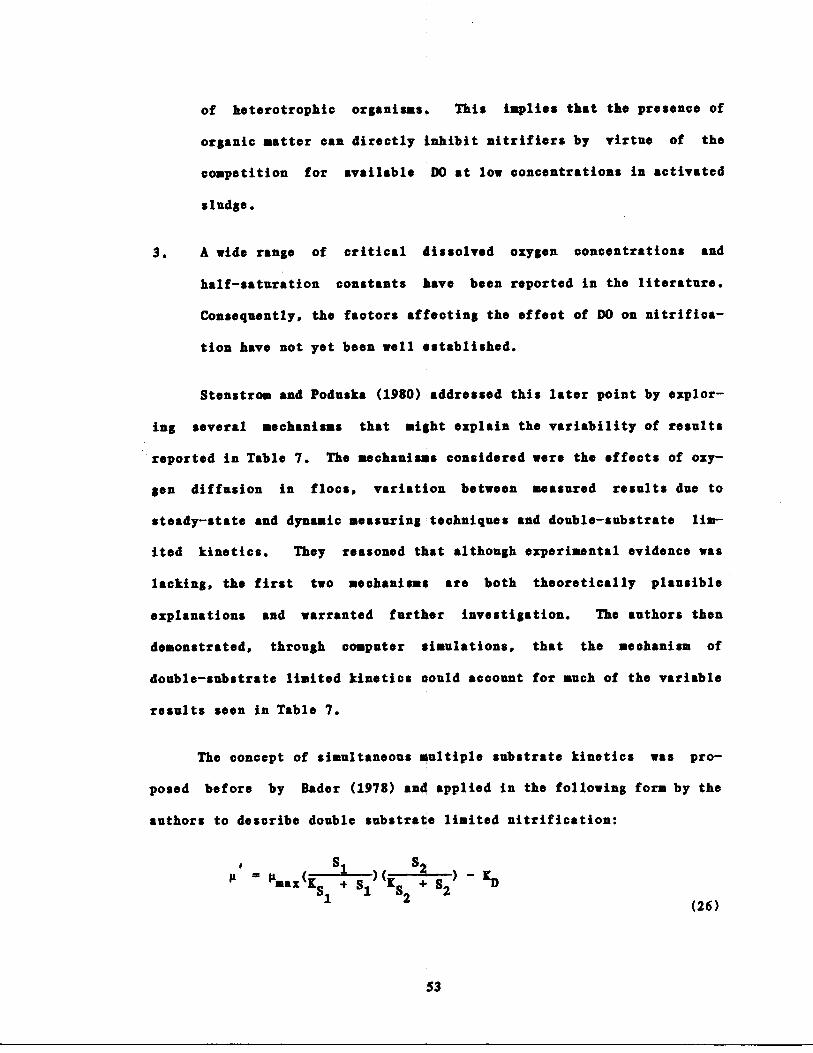
of heterotrophic organisms . This implies that the presence of
organic matter can directly inhibit nitrifiers by virtue of the
competition for available DO at low concentrations in activated
sludge .
3 . A wide range of critical dissolved oxygen concentrations and
half-saturation constants have been reported in the literature .
Consequently, the factors affecting the effect of DO on nitrifica-
tion have not yet been well established .
Stenstrom and Poduska (1980), addressed this later point by explor-
ing several mechanisms that night explain the variability of results
reported in Table 7 . The mechanises considered were the effects of oxy-
gen diffusion in flocs, variation between measured results due to
steady-state and dynamic measuring techniques and double-substrate lim-
ited kinetics . They reasoned that although experimental evidence was
lacking, the first two mechanisms are both theoretically plausible
explanations and warranted further investigation . The authors then
demonstrated, through computer simulations, that the mechanism of
double-substrate limited kinetics could account for much of the variable
results seen in Table 7 .
The concept of simultaneous multiple substrate kinetics was pro-
posed before by Bader (1978) and applied in the following form by the
authors to describe double substrate limited nitrification :
S
S2•
•max (KS + S1 )(gS + S2 ) - KD1
2
53
(26)
substrate 1 concentration (energy source)
substrate 2 concentration (0 2 )
half-saturation coefficient for S 1
half-saturation coefficient for S 2
decay or maintenance coefficient, time-1
net specific growth rate, time -1
Figure 4 (taken from Stenstrom and Poduska, 1981) illustrates the
effects of double substrate limiting kinetics on the growth rate (MCRT)
of nitrifiers assuming typical kinetic constants . The investigators
concluded, based on their analysis, that the lowest DO concentration at
which nitrification could occur is approximately 0 .3 mg/l . They further
propose that at a low MOST, it is possible to nitrify as efficiently as
at a higher MOST, although in such cases the required DO concentration
is such greater .
54
where S1
S2
=
YS1
=
1S2
=
KD
=
•~
=
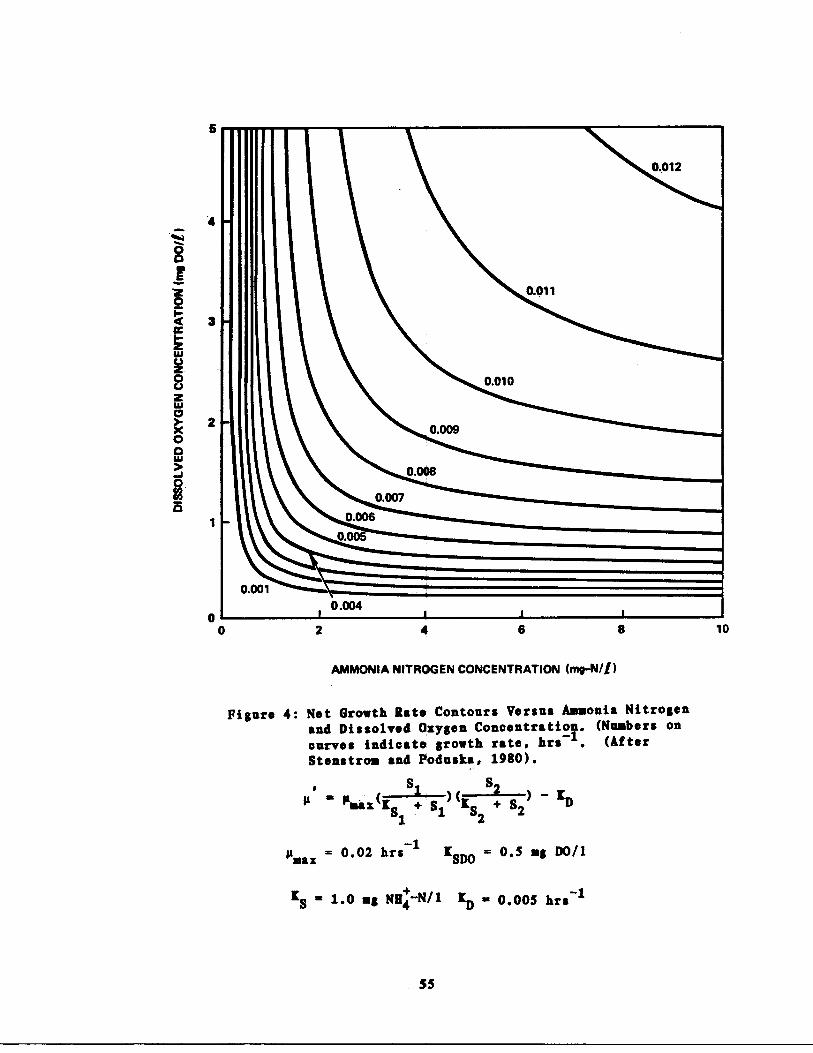
1
0
0.001
0.007
0.006
0.005
0.009
0.008
0.010
0.011
0 .004
1
0.012
0
2
6
8
10
AMMONIA NITROGEN CONCENTRATION (mg-N/1)
Figure 4 : Net Growth Rate Contours Versus Ammonia Nitrogenand Dissolved Oxygen Concentration . (Numbers oncurves indicate growth rate, hrs -1 . (AfterStenstrom and Poduska, 1980) .
Ii - • x(YS S+"S1) (L
) - tD1
2
•msz = 0 .02 hrs-1 YSDO = 0 .5 mg DO/1
=S - 1 .0 mg NH4-N/1 tD - 0 .005 hrs-1
55
Inhibition of Nitrification
For academic and practical reasons, it is important to have a con-
cept of how nitrifiers are inhibited or killed . Many physical processes
and chemical compounds may alter or destroy nitrifier activity . Typical
physical processes include low or high temperature and osmotic pressure
or surface tension effects, while a great number of chemical agents in
appropriate concentrations are capable of inhibiting or ceasing nitrifi-
cation completely . The purpose of this section is to review much of the
literature relating to the inhibition of nitrifying organisms, with spe-
cial emphasis on specific inhibitory compounds and the classification of
their effects through kinetic data . Knowledge of the mode of action for
particular inhibitors and its threshold concentration required to exert
appreciable effects may make it possible to predict and perhaps modify
conditions under which nitrification can continue .
The inhibitory effects of chemical compounds on microbiological
processes in general may take on one or more of many possible modes of
action. These include :
1 . Damage to the cell wall
2 . Inhibition of cell wall synthesis
3 . Alteration of cell permeability
4 . Alteration of protein and nucleic acid molecules
S . Blockage of biosynthetic reaction (antimetabolites)
56
6 . Inhibition of enzyme action
The relative importance among these mechanisms of action have been shown
for specific classes of chemical substances in studies with certain
heterotrophic microorganisms (Hugo, 1971) . Much less is known about the
general action of inhibitors on nitrifying organisms although it is
likely that certain inhibitors will act in a similar manner to that of
heterotrophs .
For the sake of generality, Carpenter (1971) has arbitrarily
grouped major inhibitory chemical agents along with their possible
mechanisms of action on microorganisms . This is summarized in Table 8 .
Most common among the modes of inhibitory or toxic action is that of
disruption of cell membranes and enzyme function . It is probable that
many of the inhibition effects (short of complete and irreversible toxi-
city) due to chemical substances can be explained by enzyme inhibition .
As will be discussed later, numerous attempts have been made to quantify ,
nitrification inhibition through the use of existing kinetic theories
and models describing enzyme inhibition .
Enzyme Inhibition
There is vast amount of literature (i .e ., Webb and Leyden, 1966 ;
Laidler and Bunting, 1973 ; Dixon and Webb, 1979) available which
describes quite elaborately the various theories and kinetic mechanisms
of enzyme inhibition in pure systems . In this report the discussion
will be limited to the "classical mechanisms" relating to steady-state
single substrate enzyme inhibition. This is done in recognition of the
57
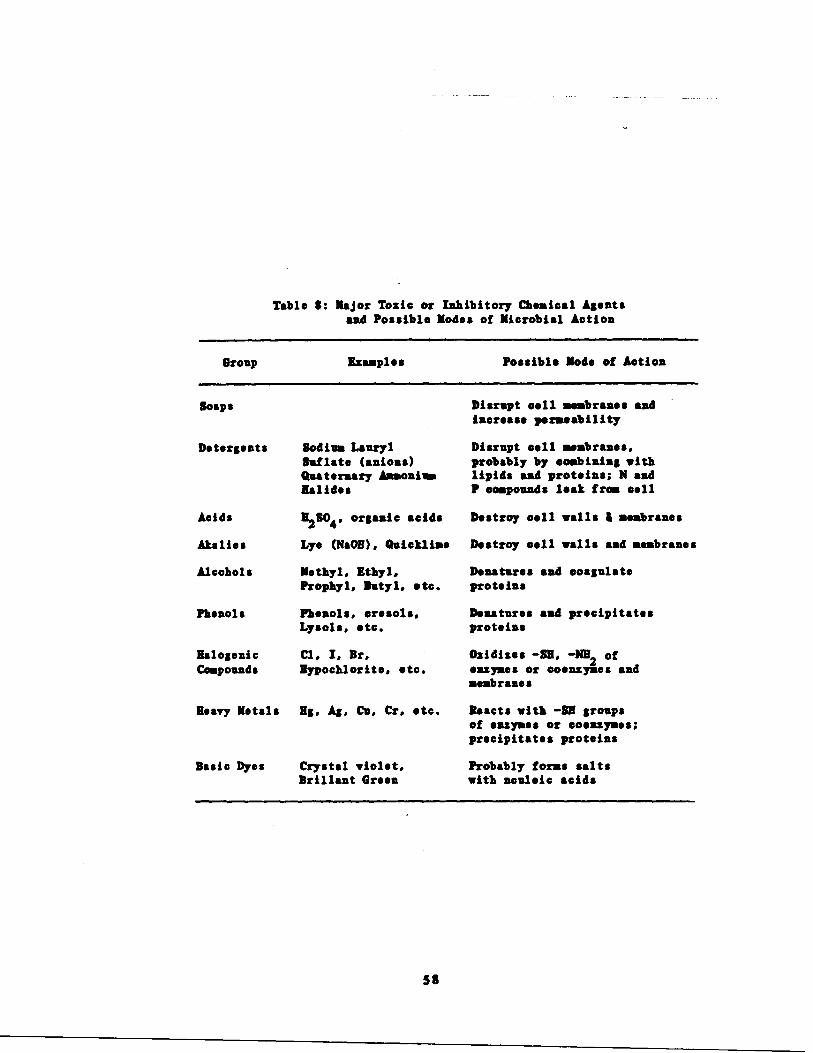
Soaps
Group
Detergents
Acids
Akalies
Alcohols
Phenols
BalogenicCompounds
Table 8 : Major Toxic or Inhibitory Chemical Agentsand Possible Modes of Microbial Action
Examples
Sodium LaurylSuflate (anions)Quaternary AmmoniumHalides
12504 , organic acids
Lye (NaOH), Quicklime
Methyl . Ethyl,Prophyl, Butyl, etc .
Phenols, cresols,Lysols. etc .
Cl . I, Br,Hypochlorite, etc .
Heavy Metals Hg, As. Cu. Cr, etc.
Basic Dyes Crystal violet,Brillant Green
58
Possible Mode of Action
Disrupt cell membranes andincrease permeability
Disrupt Cell membranes,probably by combining withlipids and proteins; N andP compounds leak from cell
Destroy cell walls & membranes
Destroy cell walls and membranes
Denatures and coagulateproteins
Denatures and precipitatesproteins
Oxidizes -SH, -NBZ ofenzymes or coenzymes andmembranes
Reacts with -SH groupsof enzymes or coenzymes ;precipitates proteins
Probably forms saltswith nculeic acids

fact that nitrifier enzyme systems are not yet well defined and that it
is currently impossible to express the more sophisticated mechanistic
models in terms of the complex enzymatic processes involved in nitrifi-
cation. It is acknowledged that the basic mechanisms to tie reviewed can
strongly influence the development of future empirical models character-
izing nitrification inhibition .
Michaelis-Menton Kinetics
The theoretical basis of almost all current enzyme inhibition
models is Michaelis-Menten kinetics . As such, it is worthwhile to
briefly review the elementary concepts involved in this theory . The
basic assumption of Michaelis-Menten kinetics is that enzymatic
catalysis occurs through a series of elementary reactions involving the
formation of an enzyme-substrate complex :
S + E
where S, E, ES, P represent the substrate, free enzyme, enzyme-
substrate complex, and product, respectively . Assuming equilibrium con-
ditions (i .e ., when the rate of formation of ES is equal to its rate of
breakdown) ;
E (E)(S) - L_l (ES) - L2 (ES) - 0(27)
The total enzyme concentration E 0 can be expressed as,
(E0 ) _ (E) + (ES)
ESK2
P40 KI 10
K_1
59
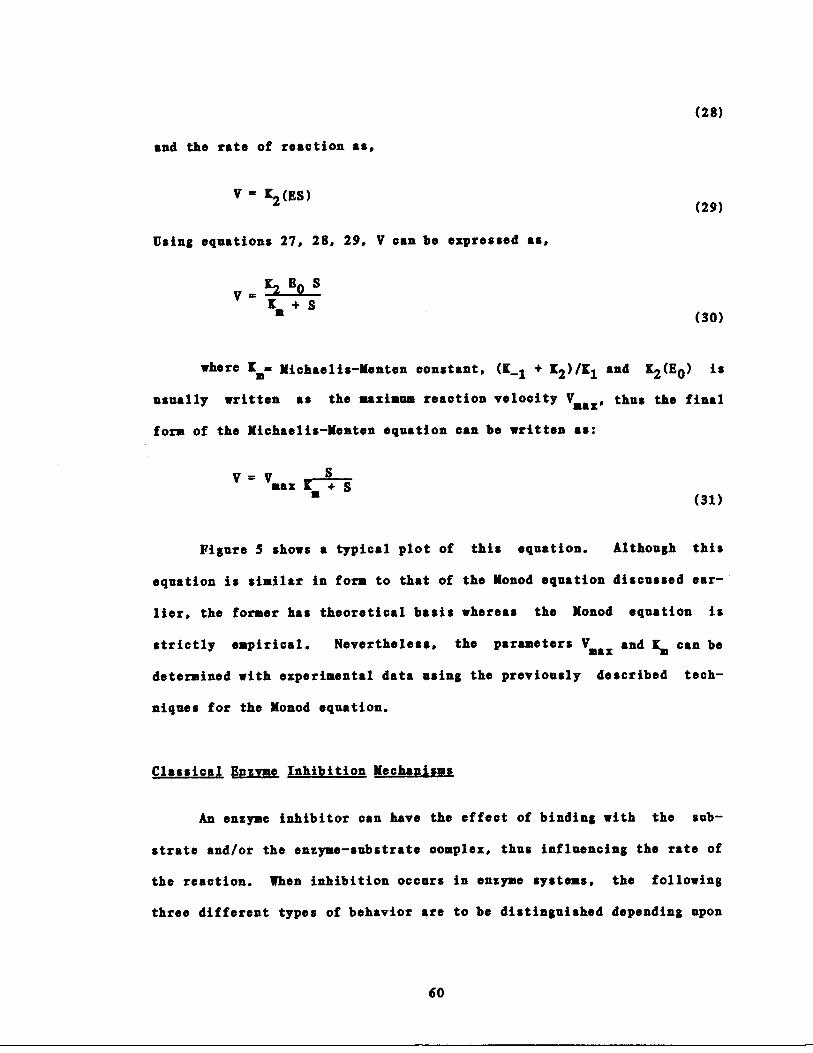
and the rate of reaction as,
V = 12 (ES)
Using equations 27, 28, 29, V can be expressed as,
V= g2 EO S
a +S
where a= Kichaelis-Menten constant, (Y_ 1 + =2)/K1 and K2(EO) is
usually written as the maximum reaction velocity Vmax, thus the final
form of the Michaelis-Kenten equation can be written as:
V- V
Sax+S
the reaction . When inhibition occurs in enzyme systems,
60
(28)
(29)
(30)
(31)
Figure 5 shows a typical plot of this equation. Although this
equation is similar in form to that of the Konod equation discussed car -
liar, the former has theoretical basis whereas the Konod equation is
strictly empirical . Nevertheless, the parameters max and Km can be
determined with experimental data using the previously described tech-
niques for the Konod equation.
Classical Enzyme Inhibition Kechanjsms
An enzyme inhibitor can have the effect of binding with the sub-
strata and/or the enzyme-substrate complex, thus influencing the rate of
the following
three different types of behavior are to be distinguished depending upon
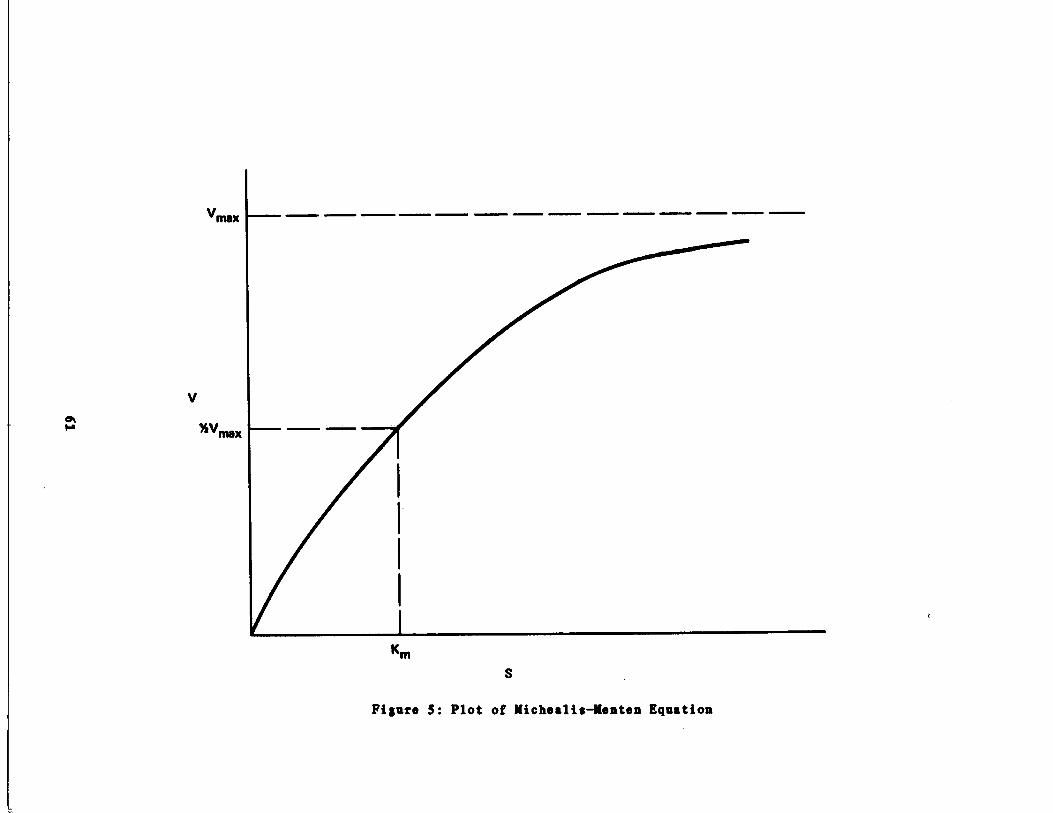
V
Vmax
%Vmax
Km
S
Figure 5 : Plot of Michealis-Kenten Equation
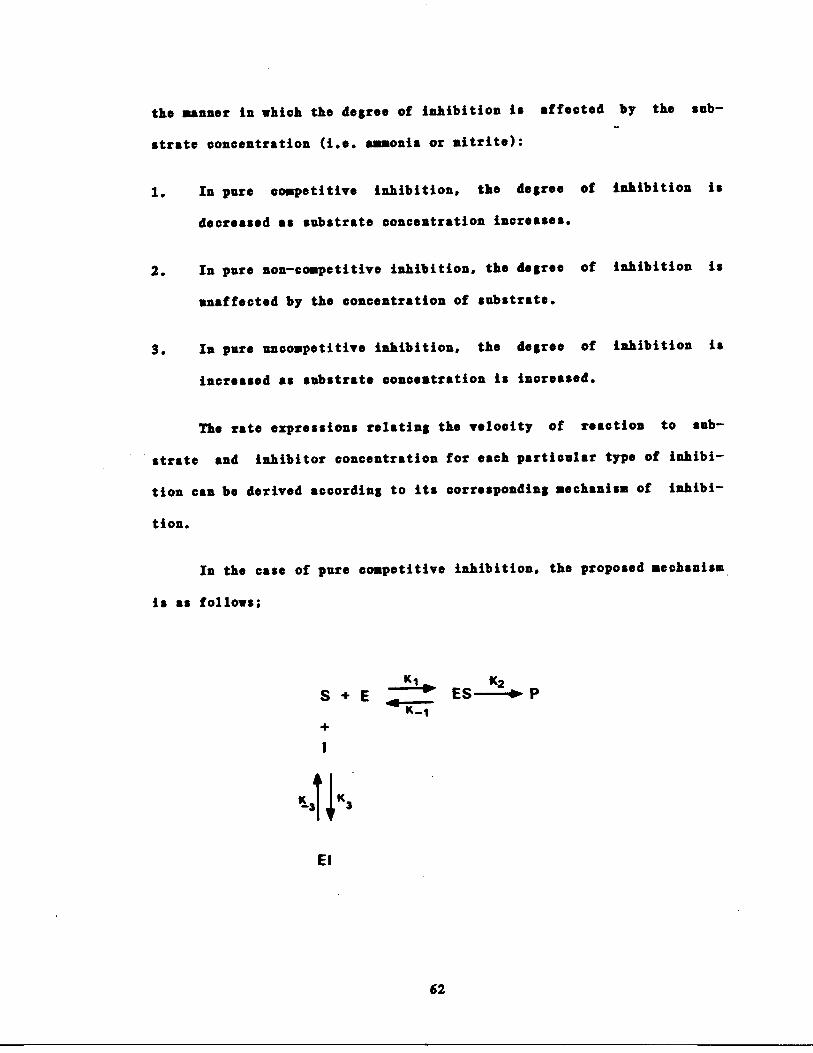
the manner in which the degree of inhibition is affected by the sub-
strate concentration (i .e . ammonia or nitrite) :
1.
In pure competitive inhibition, the degree of inhibition is
decreased as substrate concentration increases .
2.
In pure non-competitive inhibition, the degree of inhibition is
unaffected by the concentration of substrate .
3 .
In pure uncompetitive inhibition, the degree of inhibition is
increased as substrate concentration is increased .
The rate expressions relating the velocity of reaction to sub-
strate and inhibitor concentration for each particular type of inhibi-
tion can be derived according to its corresponding mechanism of inhibi-
tion .
In the case of pure competitive inhibition, the proposed mechanism
is as follows ;
S + E
I
El
K 1
K2ES--r P
62
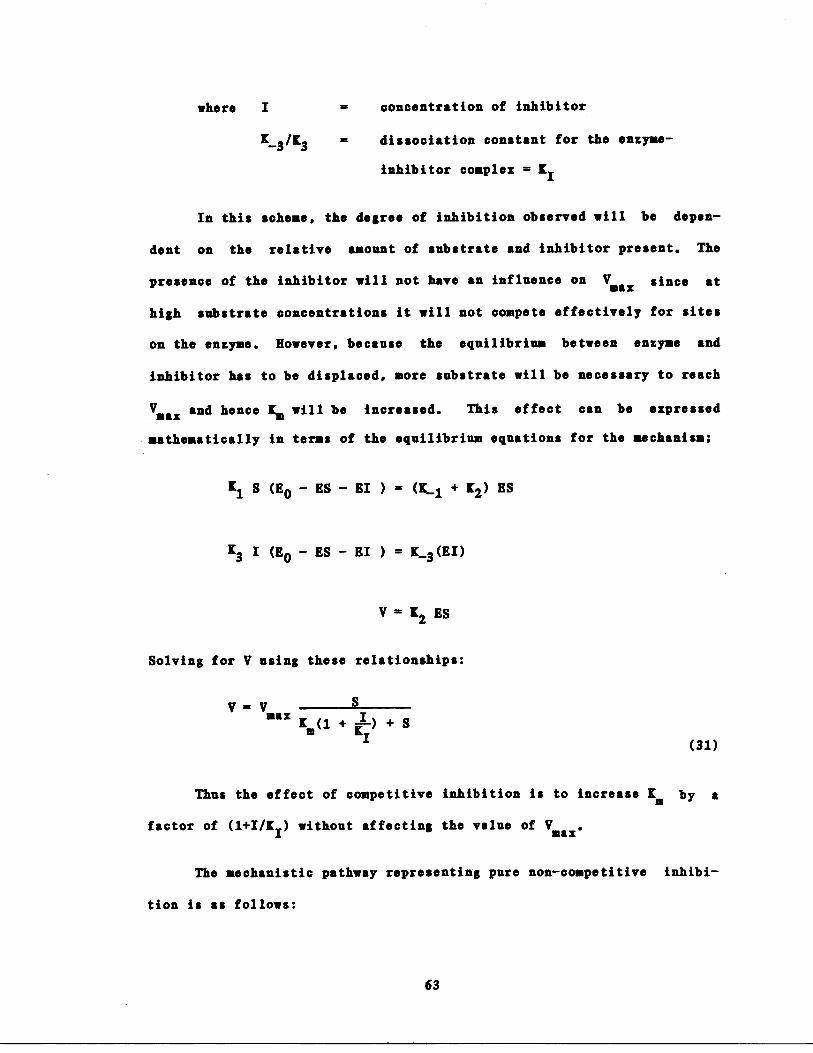
In this scheme, the degree of inhibition observed will be depen-
dent on the relative amount of substrate and inhibitor present . The
presence of the inhibitor will not have an influence on ii ax since at
high substrate concentrations it will not compete effectively for sites
on the enzyme . However, because the equilibrium between enzyme and
inhibitor has to be displaced, more substrate will be necessary to reach
IV ax and hence 1m will be increased .
This effect can be expressed
.mathematically in terns of the equilibrium equations for the mechanism;
11 S (EQ - ES - EI ) _ (K-1 + K2) ES
13 I (EO - ES - El ) = K-3 (E,)
V = 12 ES
Solving for V using these relationships :
V= V Smax m(1+g) + S
I (31)
Thus the effect of competitive inhibition is to increase 1 m by a
factor of (i+I/1I ) without affecting the value of max*
The mechanistic pathway representing pure non-competitive inhibi-
tion is as follows :
63
where I concentration of inhibitor
a-3113 dissociation constant for the enzyme-
inhibitor complex = 1I
S + E
1
1.311 K9 K4 K-4
KS
EI
S
The lengthy derivation of the equilibrium rate expression has been
presented by Dixon and webb (1979) and will not be reproduced here . The
resulting equation is,
V V Smax (S +
a)(1 + 1)I
64
ES_ KeP
1
ESI
Inspection of equation (32) reveals that the effect of non-competitive
inhibition is to divide aax by the factor (1+I/Y I ), leaving a unaf-
fected . If I becomes infinite, wax may become zero and it would be
impossible to alter the inhibitory effect by simply increasing the sub-
strate concentration .
The mechanism for uncompetitive inhibition is shown below,
(32)
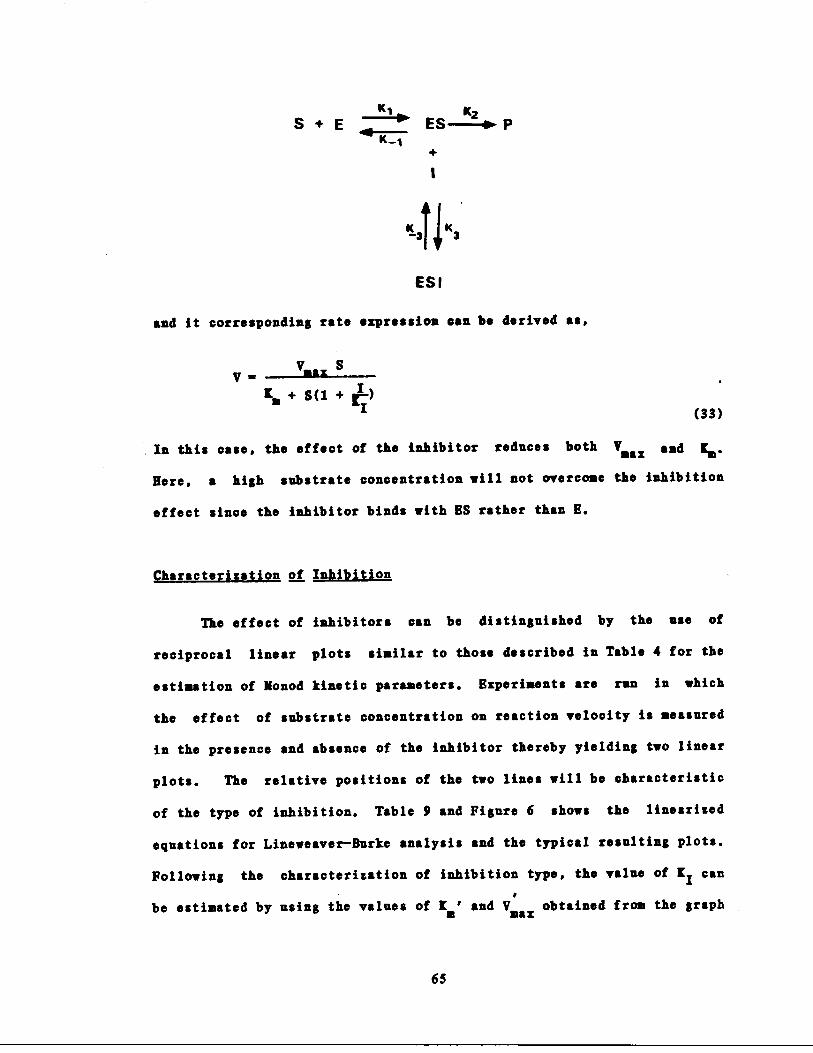
S+E f ESK2K 01.
K_1
I
ESI
and it corresponding rate expression can be derived as,
V =
y"z S
1; + S(1 + ~)I
In this case, the effect of the inhibitor reduces both %ax
65
(33)
aad rm
Here, a high substrate concentration will not overcome the inhibition
effect since the inhibitor binds with ES rather than E .
Characterization of Inhibition
The effect of inhibitors can be distinguished by the use of
reciprocal linear plots similar to those described in Table 4 for the
estimation of Monod kinetic parameters . Experiments are run in which
the effect of substrate concentration on reaction velocity is measured
in the presence and absence of the inhibitor thereby yielding two linear
plots . The relative positions of the two lines will be characteristic
of the type of inhibition. Table 9 and Figure 6 shows the linearized
equations for Lineweaver-Burke analysis and the typical resulting plots.
Following the characterization of inhibition type, the value of K I can
be estimated by using the values of Im' and Vmaxobtained from the graph
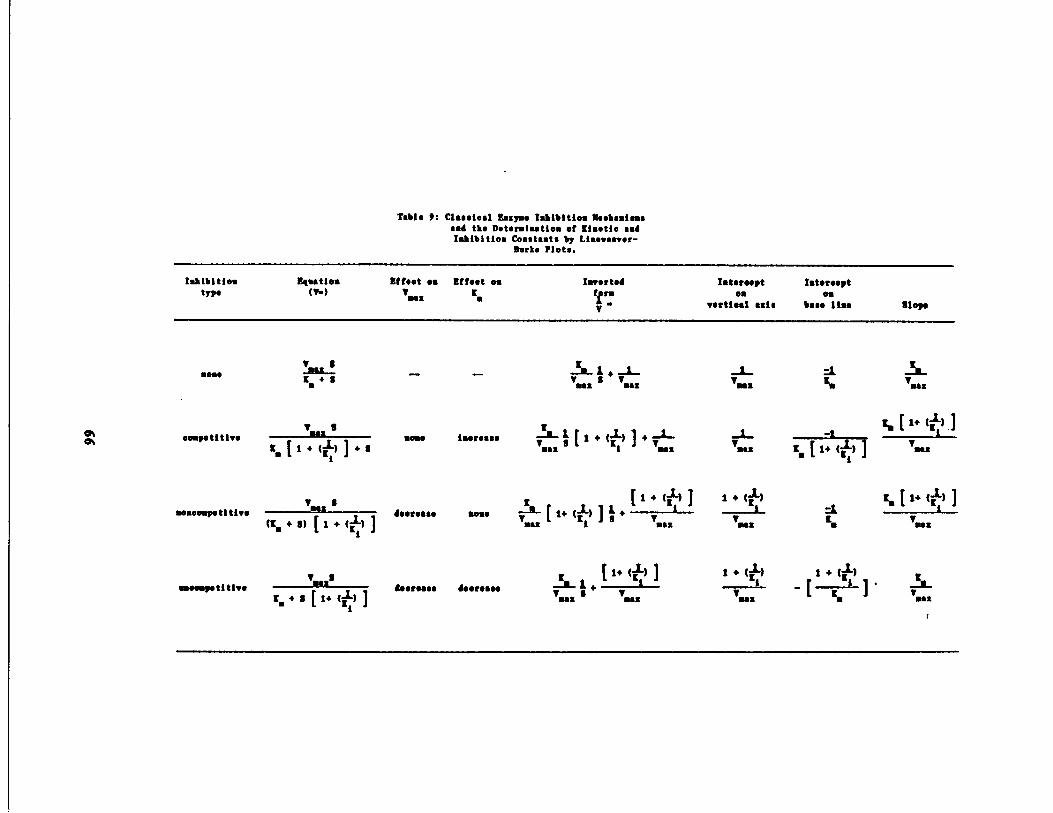
Inhibitiontypo
seas
eonetiti.e
seaeesp.titive
an.ogs tl tlv.
Elution(T-)
TOM 8Km +a
T... I
E [ƒ
1+(i),+Il
T„a I
([s +l) [1+(1)
Tu2E
t~+a [1+(K) Ii
Table !: Classical Easre I .bibition Meeb.ainssad tke betsniaatioa of [iastio sodIabibitloa Constants by Line.es,er-
B.rte Plots .
Effect as affect go
vs..
[s
aou
decrease
ingress@
song
loor..s*
doors...
Inverted
If 1:V
i_1 + 1_Dal 8
wait
~a[ 1+Sal
Intercept
Intercepten
avertical sale
base line
slope
Tea:
-1to [ 1+ (j) J
i
At-
V.81
z . [ 1+ CL) . ]
:ado
ƒ
[1+tJ)] 1+(1) S[1+(j)~3
T5as
[! Zf
max
ia:
i
Tuaa
[
[ 1+([) I--S- 1 +Tun B
Tsaa
1 * (A
1 + ti)
t
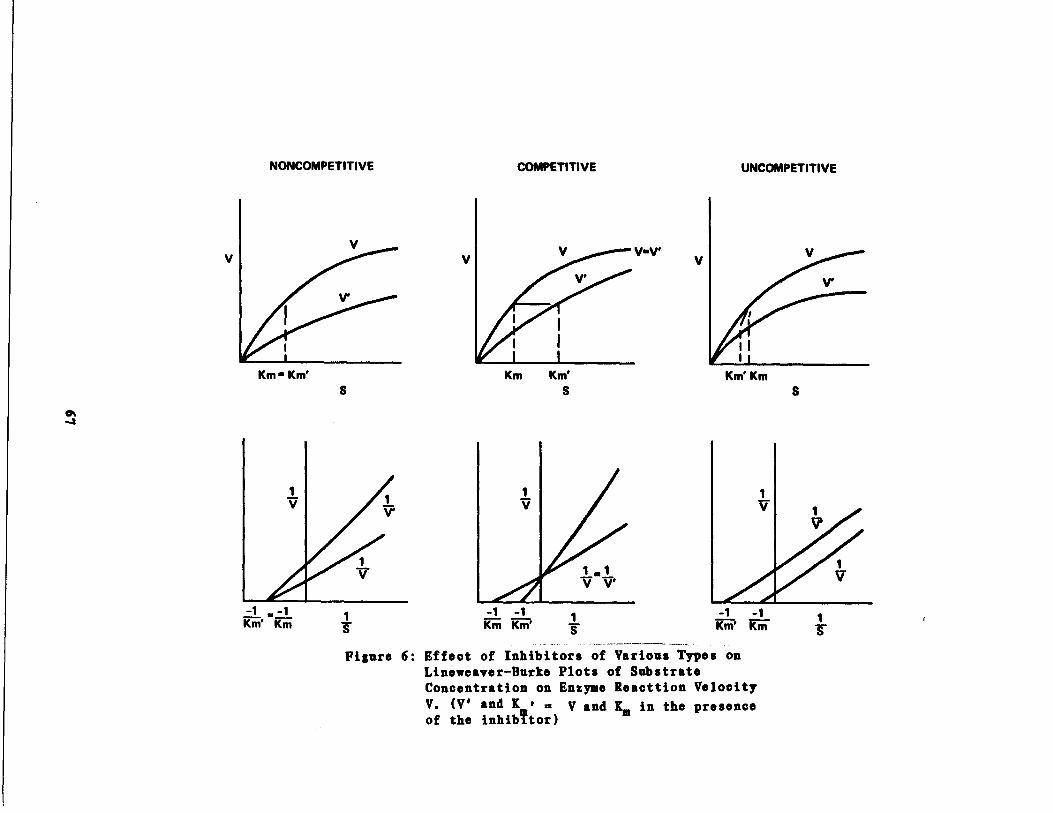
V
-1 . -1Km' Km
NONCOMPETITIVE
Km - Km'S
1S
V
-1 -1Km Km'
COMPETITIVE
1V
1S
V
-1
-1Km' R
Figure 6 : Effect of Inhibitors of Various Types onLineweaver-Burke Plots of SubstrateConcentration on Enzyme Reacttion VelocityV. (V' and K v = V and K. in the presenceof the inhibitor)
UNCOMPETITIVE
S
f
in conjunction to the values Sm and VUax obtained from the uninhibited
data . The values of I' and Vmaz 0 are defined as Lm(1+I/Ki ) and
Vax(1+I/KI ), respectively .
The distinction among the types of inhibition is often not easily
made based on graphical analysis due to the difficulties associated with
the given techniques (see Table 4). For example, exact experimental
data is often necessary to conclude that the lines are truly parallel
(as in uncompetitive inhibition) rather than weakly intersecting (as in
non-competitive inhibition) .
The Hunter-Downs plot is another method frequently used to charac-
terize inhibition effects (Dixon and Webb, 1964) . This technique
depends on the ratio of substrate concentration to inhibitor concentra-
tion and thus is less subject to the disadvantages of the reciprocal
linearized methods described previously . A Hunter-Downs plot may be
constructed by plotting the term Ma/(1-a)) against substrate concentra-
tion, where a = Vin the presence of the inhibitor)/V(in the correspond-
ing control) . A large value of I(a/(1-a)) represents a weak inhibitor
and a small value indicates strong inhibition. If the inhibition is
competitive, the Hunter-Downs plot will slope upward to the right
whereas in non-competitive inhibition, the data will lie on a horizontal
line . For uncompetitive inhibition, the line should slope downward .
Although this technique cannot be used to quantifym or KIP it has its
advantages over other methods in identifying the type of inhibition
exhibited .
68
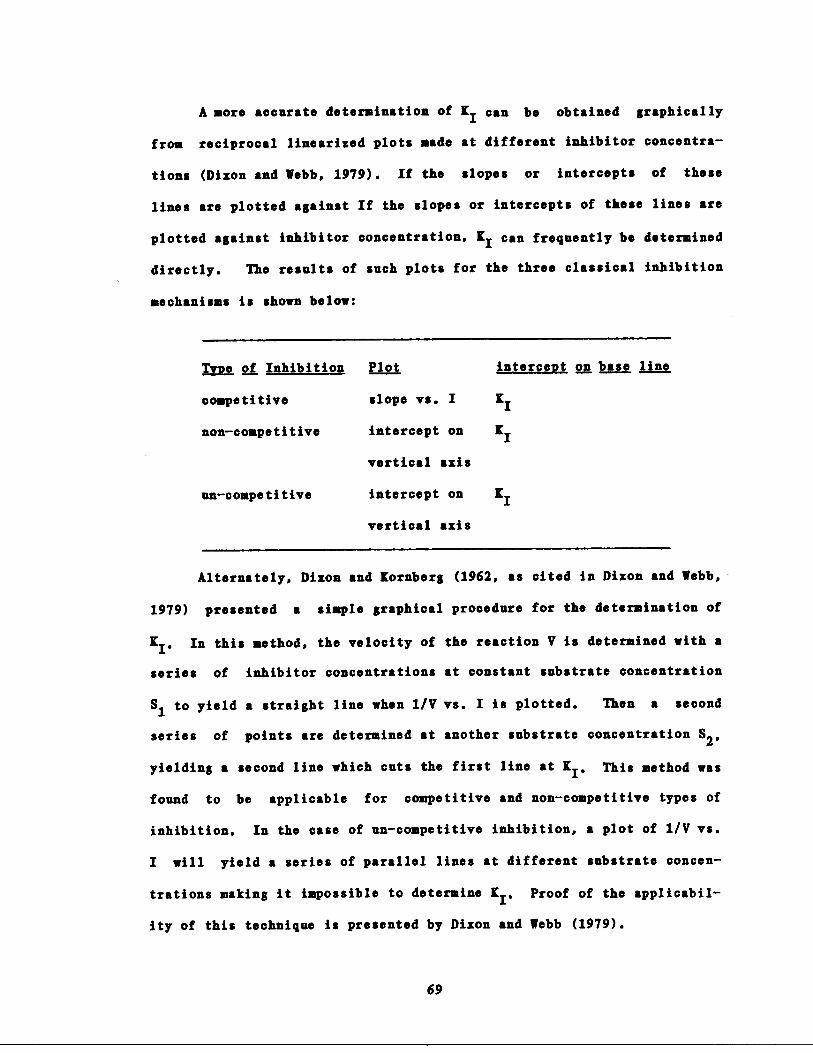
A more accurate determination of KI can be obtained graphically
from reciprocal linearized plots made at different inhibitor concentra-
tions (Dixon and Webb, 1979) . If the slopes or intercepts of these
lines are plotted against If the slopes or intercepts of these lines are
plotted against inhibitor concentration, KI can frequently be determined
directly. The results of such plots for the three classical inhibition
mechanisms is shown below :
TTe of Inhibition Plot
intercept on base line
competitive
slope vs . I
YI
non-competitive
intercept on
KI
vertical axis
un-competitive
intercept on
KI
vertical axis
Alternately, Dixon and Kornberg (1962, as cited in Dixon and webb
1979) presented a simple graphical procedure for the determination of
KI . In this method, the velocity of the reaction V is determined with a
series of inhibitor concentrations at constant substrate concentration
S1 to yield a straight line when 1/V vs . I is plotted. Then a second
series of points are determined at another substrate concentration S 2 ,
yielding a second line which cuts the first line at % I , This method was
found to be applicable for competitive and non-competitive types of
inhibition . In the case of un-competitive inhibition, a plot of 1/V vs .
I will yield a series of parallel lines at different substrate concen-
trations making it impossible to determine KI .Proof of the applicabil-
ity of this technique is presented by Dixon and Webb (1979).
69
Specific Inhibitors of Nitrification
The results of many studies performed with pare, mixed or
activated sludge cultures have clearly established that nitrifiers are
sensitive to a variety of compounds commonly found in wastewaters, espe-
cially those of industrial origin . In addition, both nitrifying genera
have been reported to be subject to substrate and end product inhibi-
tion.
The effect of inhibition on nitrification processes usually
implies that of lowered nitrifier specific growth rates and maximum sub-
strate utilization rates . The ramifications of these effects are obvi-
ous in relation to wastewater treatment systems, however what might not
be as obvious is that the degree of inhibition is contingent upon many
factors aside from the mere presence of a particular inhibitor . Painter
(1970) provided an overall perspective on nitrification inhibition in
this respect . He notes that the degree of effectiveness of an inhibitor
depends on :
1 .
presence of microorganisms other than nitrifiers
2 .
concentration of the inhibitor
3 .
duration of exposure to the inhibitor
4 .
circumstances of exposure (i .e ., whether nitrifiers are in a
batch or continuous system)
S .
presence of other inhibitors which may ƒzert antagonistic or
70
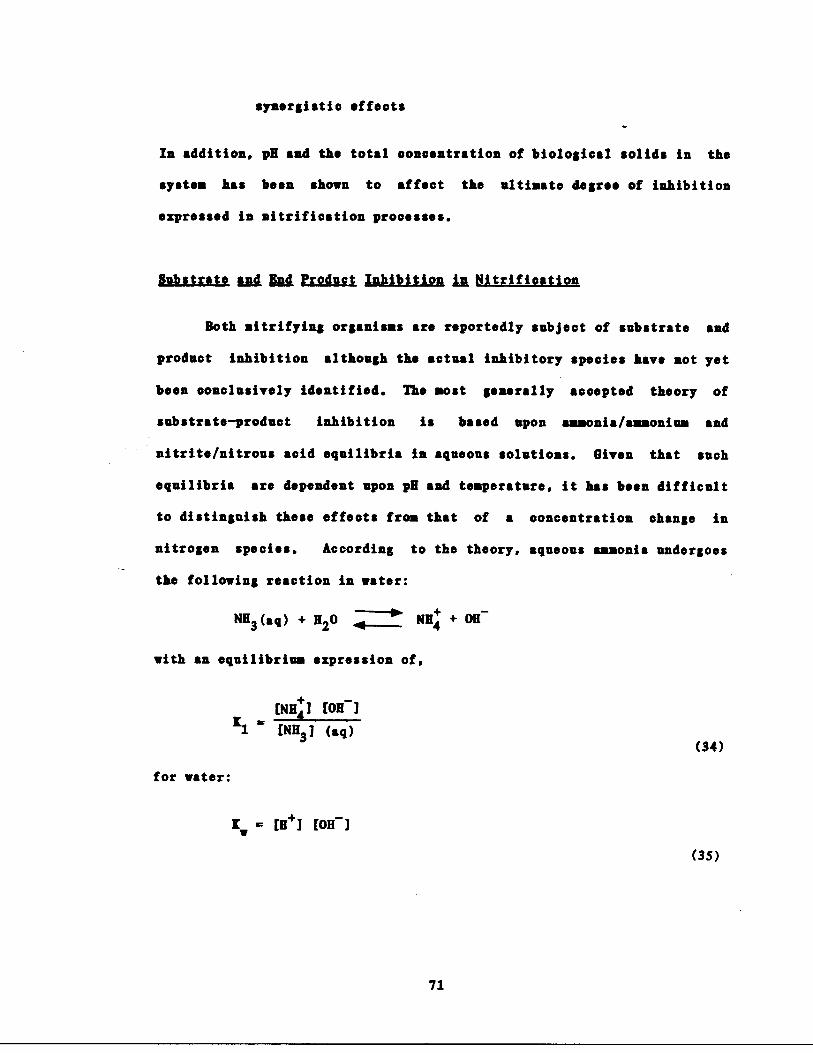
synergistic effects
In addition, pH and the total concentration of biological solids in the
system has been shown to affect the ultimate degree of inhibition
expressed in nitrification processes .
Substrate an nod Product Inhibition in Nitrification
Both nitrifying organisms are reportedly subject of substrate and
product inhibition although the actual inhibitory species have not yet
been conclusively identified . The most generally accepted theory of
substrate-product inhibition is based upon ammonia/ammonium and
nitrite/nitrous acid equilibria in aqueous solutions. given that such
equilibria are dependent upon pH and temperature, it has been difficult
to distinguish these effects from that of a concentration change in
nitrogen species . According to the theory, aqueous ammonia undergoes
the following reaction in water :
NH(aq) + H2O . NH4 + OH-3
with an equilibrium expression of,
INHa I [OH I
K1 = INH3 l (aq)
for water :
iw - [B+I [0H l
71
(34)
(35)

For practical purposes, the total ammonia is the sum of the ion-
ized and unionized form (free ammonia)
[NH3l(total) = [NH3](unionized) + [NH4]
Using equations 33, 35, and 36, the following expression may be
derived for the ratio of unionized ammonia to total aqueous ammonia:
[NH3 ] (unionized)-
[NH3 ]( total)
(Y ) [H+ ]1 +
YV
Using the same analysis for nitrite/nitrous acid equilibria, the
following expression can be obtained,
[HNO2 ]
_
1
[NO2] (total)
(Y )(Y )1 +
[H+ ]
where Y2 - dissociation constant for the
HN02/N02 equilibrium
Thus at progressively lower pH's, more and more nitrite is in the
form of undissociated nitrous acid (ENO2 ) . Conversely, at progressively
higher pH's increasing amounts of ammonia is in the form of free ammonia
(NH3 ) . For example, at pH 7 only about 0 .5% of the total ammonia is in
the free form compared to 5% at pH 8 . Although it has been reported
that nitrifiers are capable of withstanding a wide range of substrate
concentrations (i .e ., up to 1960 ag/l of NH3 and 5000 ag/l NO2 ; Sharma
and Ahlert, 1977) with only slight inhibitory effects, results from
72
(36)
(37)
(38)
other studies have suggested that the formation of free ammonia or
nitrous acid in minute quantities can have a very powerful inhibitory
effect .
Boon and Laudelout (1962) studied the influence of nitrite and
nitrate concentration on the activity of Nitrobacter and reported that
optimal activity occurs at 280 ag/1 nitrite, while nitrate inhibited the
rate of oxidation non-competitively . This inhibitory effect was shown
to follow the substrate inhibition model of Haldane (1930) . They also
theorized that the depressed rates of oxidation at higher nitrite con-
centrations was due to the formation on HNO2 at lower pH's . This theory
was subsequently supported by Prakasam and Loehr (1972) and Anthonisen
(1976) who reported nitrite oxidation inhibition above HNO 2 concentra-
tions of 0 .3 and 0.22 mg/l respectively. Both studies also indicated
that free NH3 was inhibitory to Nitrobacter activity, although Prakasam
and Loehr suggested that this effect was less important than that due to
HNO2 . Additional observations by Prakasam and Loehr on the removal of
inhibitory effects in the presence of denitrification led them to pro-
pose that the incomplete ammonia oxidation was due to the end products
NO- and N03.
Anthonisen (1976) used data collected from laboratory batch and
continuous nitrifying systems to devise an operational graph for the
evaluation of substrate and product inhibition . He proposed that both
ammonia and nitrite oxidation were inhibited by free ammonia and nitrous
acid by virtue of the substrate's propensity to permeate nitrifier cell
wells . He concluded that free NH3 in the concentration ranges of 0 .1 to
73
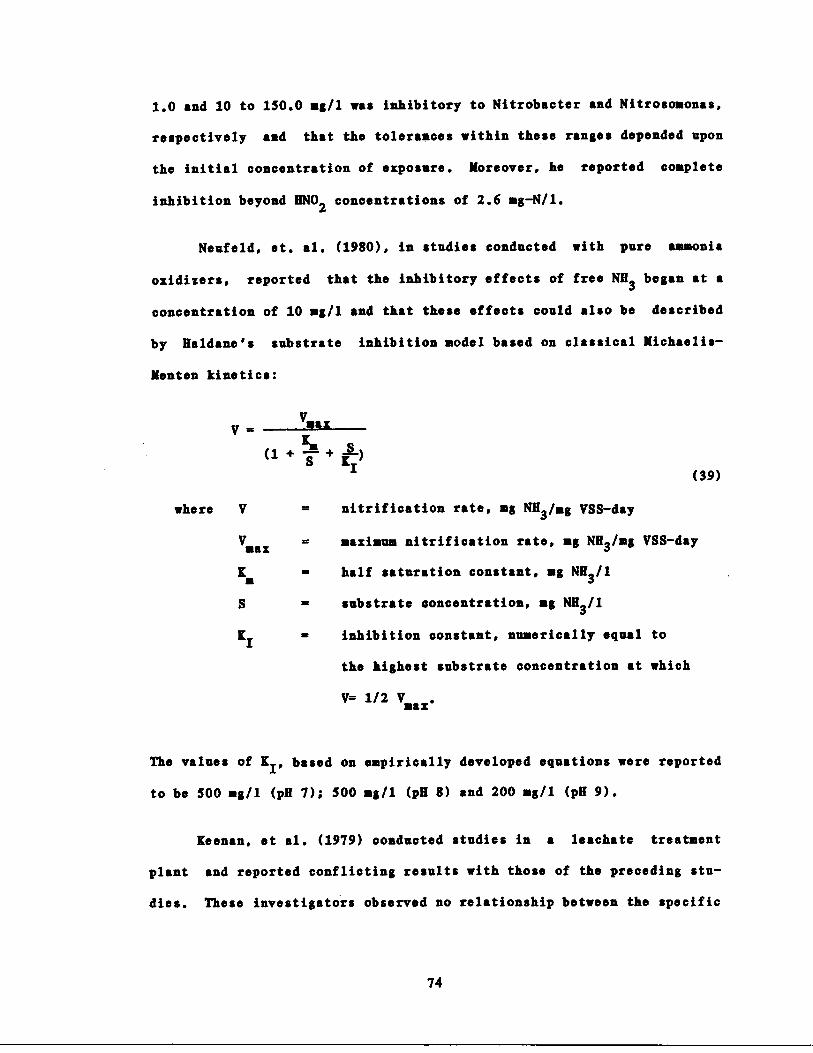
1 .0 and 10 to 150 .0 mg/1 was inhibitory to Nitrobacter and Nitrosomonas,
respectively and that the tolerances within these ranges depended upon
the initial concentration of exposure . Moreover, he reported complete
inhibition beyond HN02 concentrations of 2 .6 mg-N/l .
Neufeld, et . al . (1980), in studies conducted with pure ammonia
oxidizers, reported that the inhibitory effects of free NH3 began at a
concentration of 10 ag/l and that these effects could also be described
by Haldane's substrate inhibition model based on classical Michaelis-
Menten kinetics :
V = Vmax
(1+ K +t)I
where V
=
nitrification rate, mg NN3/mg VSS-day
max
=
maximum nitrification rate, mg NH 3 /mg VSS-day
a
half saturation constant, mg NH 3 /1
S
substrate concentration, mg NH3 /1
KI
inhibition constant, numerically equal to
the highest substrate concentration at which
V= 1/2 Vmax*
The values of Kip based on empirically developed equations were reported
to be 500 mg/l (pH 7) ; 500 mg/l (pH 8) and 200 mg/l (pH 9) .
Keenan, et al . (1979) conducted studies in a leachate treatment
plant and reported conflicting results with those of the preceding stu-
dies . These investigators observed no relationship between the specific
74
(39)
oxidation rate and the concentration of free ammonia, but instead
obtained a reasonable fit to the Haldane's inhibition model using ion-
ised ammonium (NH1) as the inhibitory substrate .
To further complicate the subject of substrate inhibition, Kholde-
barin and Oertli (1977) reported data from batch nitrification studies
with surface waters, suggesting that ionised ammonium exerts a stimula-
tory effect on nitrification rates . More significantly, their experi-
cents on nitrite oxidation at different pH's in the initial absence of
free ammonia demonstrated that elevated pH's (i .e ., pH = 9 .5) exerted
the inhibitory effect rather than the presence of free NH3 , These later
results are consistent with those cited previously (Poduska, 1974) and
support the contention that the overriding effect seen at higher sub-
strate concentration might be due to a yet unknown mechanism relating to
pH in general rather than to the elevated concentrations of free ammonia
or undissociated nitrous acids .
Specific Inhibitors of Nitrification in Pure Culture Studies,
Many pure culture studies have demonstrated that nitrifiers, espe-
cially Nitrosommonas, are sensitive to a large number of inorganic and
organic compounds as well as many heavy metals . It has been postulated
(Tomilinson, et . al ., 1966) that the greater susceptibility of Nitroso-
novas may be due to its relatively complicated enzyme system compared to
that of Nitrobacter . Much of the reported work on specific inhibitors
of nitrification was performed with pure cultures of Nitrosomonas .
75
Lees (1952) showed that oxygen uptake rates of Nitrosomonas are
inhibited in the presence of chelating agents (i .e ., histidine,
allythiourea, thiourea, 8-hydroquonline) in support of similar results
previously obtained with soil organisms (Quastel and Scholefield, 1949) .
Jensen and Sorensen (1952) studied the effect of a variety of known
enzyme inhibitors and herbicides on pure cultures of Nitrosomonas iso-
lated from manure . Their results indicated that the most powerful inhi-
bitors were organic sulfur compounds containing SH-groups (i .e ., cys-
teine ; diethyldithioearbamate) or those giving rise to them through tau-
tomerism (i .e ., thiourea) . They suggested that the mechanism of toxi-
city might be due to the inactivation of those enzymes requiring heavy
metals such as copper or nickel . Anderson (1965) reported that micromo-
lar concentrations of cyanide inhibited ammonia oxidation whereas
thiourea had no effect on hydroxylamine oxidation . This indicated that
certain inhibitors can be specific to the pathway of ammonia to nitrite
oxidation.
Hooper and Terry (1973) undertook an extensive investigation on
ammonia oxidation inhibition in which they categorized a wide range of
inhibitors according to its possible mode of action . They presented the
grouping of inhibitors as follows :
1 . Metal binding compounds- Those compounds which may disrupt
enzymatic function due to a strong affinity for essential
metals (i .e ., copper) . A partial listing of these compounds
include allythiourea, YCN, Diethyldithioearbamate as specific
inhibitors of ammonia oxidation and NaN2 , Na3S as inhibitors
76

to both ammonia and hydroxylanine oxidation .
2 .
Enzyme and home-binding compounds- Those compounds which have
a high affinity for enzymes of the electron transport chain
(i .e ., eytochromes or catalysis) . These compounds include
CO, thiosemicarbazide, diphenyithiocarbazone, N-serve, and
ethyl zanthate .
3 . Uncouplers of oxidative phosphorylation and inhibitors of
electron transport . In bacteria, this group of compounds
presumably inhibits one or more of the following : oxidative
phosphorylation, ATP-dependent NADP reduction ; proton pump-
ing, or ion transport . This group of compounds may consist
of 2-4 dinitrophenol, N-N' dieyclohexylcarbodiimide, phena-
tine aethosulfate and 2-6 dichlorophenolindephenol .
4 . Short chain alcohols and amines- These compounds are inhibi-
tors of ammonia but not of hydroxylamine oxidation . The pos-
sible mode of inhibitory action may be due to the disruption
of membrane function and/or reaction with catalysis . Among
the more powerful inhibitors studied in the group were
methanol, ethanol, n- and i- propanol, methylamine and ethyl
acetate .
5 . Miscellaneous factors such as N 20, light and low temperature
are also inhibitory to nitrification, although the mode of
action is considered distinct from the other categories
listed .
77
In another major study of nitrification inhibition, Hockenbury and
Grady (1977), investigated the effect of selected organic compounds on
nitrifying cultures with the major objective of identifying and quanti-
fying the effects of industrially significant inhibitors . Their results
indicated that of the 52 compounds tested, 20 were inhibitory at a con-
centration of 100 mg/l and of these 20, 12 compounds contained one or
more benzene rings in the structure . The most powerful inhibitors were
found to be dodecylamine, aniline and methylaniline, all of which inhi-
bited nitrification 50% or greater at 1 .0 mg/1 . Among the 13 most
industrially significant compounds tested, aniline, ethylenediamine and
hexamethylene were reported to be the most potent inhibitors . Only 3
compounds (at 100 mg/1), p-nitrobenzaldehyde ; p-nitroaniline and n-
methylanilins, all of which were inhibitory to Nitrosomonas, were found
to be inhibitory to Nitrobacter . These investigators also characterized
the inhibition of aniline, dodecylamine and ethyldiamine, all inhibitors
of ammonia oxidation . The results, obtained from Hunter-Downs plots, ,
revealed that all three inhibitors followed a uncompetitive type of
inhibition . They suggested that these effects may be related to sub-
strate inhibition .
Nenfeld, et al . (1980) evaluated the effect of phenol on a culture
of strict nitrifiers using respirometric techniques. The concentrations
of phenol tested (2 to 75 mg/1) were found to cause progressive inhibi-
tion of ammonia oxidation. In an attempt to characterize inhibition
type, a series of experiments was run at various substrate concentra-
tions . Analyzing the resulting data with Lineweaver-Burke plots, they
showed that the influence of phenol followed a modified non-competitive
78
type of inhibition in which II' varied with the square root of phenol
concentration. In separate experiments run at various inhibitor concen-
trations, slope and intercept analysis revealed a K I value of
(2 .lag/1) 1/2. The overall results were then used to obtain a kinetic
expression for relating the KCBT to effluent ammonia concentration for a
CSTR activated sludge reactor .
Several investigators have reported the effects of a variety of
heavy metals in pure nitrifying cultures .
found that chromium and nickel at concentrations of less than 0 .25 mg/1
had an inhibitory effect on the growth of Nitrosoaonas . Painter and
Loveless (1968) demonstrated the inhibition of
copper, zinc, and cobalt at concentration
Skinner and Walker (1961)
Nitrosoaonas growth by
ranges of 0 .05-0 .56 mg/l ;
0 .08-0 .5 mg/1 and 0.08-0.5 mg/l, respectively . They noted that although
copper is an essential element for Nitrosoaonas growth as evidenced by
its stimulatory effects at low concentrations (0 .005-0.03 mg/1) . its
presence at higher concentrations can result in complete but reversible
(with the addition of EDTA) inhibition . They also provided evidence
showing that the toxic effects of heavy metals can be influenced by pH .
Beg, et al . (1982) recently studied on the toxic effects of three
inorganic compounds ; sodium fluoride, sodium arsenite and potassium
dichromate, on nitrifying organisms in a packed bed, fixed-film biologi-
cal reactor . Their data indicated that the inhibited ammonia oxidation
rates, due to all the compounds tested, followed zero-order kinetics and
exhibited a non-competitive type of inhibition . Assuming that II is
much less than S, the investigators reduced the non-competitive equation
79
to the following form ;
V= ymax I =7KI+ I
i
They then used the observations of zero-ordered kinetics and the
following equation relating the velocities of uninhibited reaction (70 )
to the inhibited reaction (7 i ),
70
to derive an equation for non-competitive zero-ordered nitrification
inhibition kinetics ;
1/i = (K1/I) + 1 .0(40)
The authors correlated the data using equation 40 and found that
the concentrations required to inhibit nitrification 75% were 3654 mg/l
(K1 =1218 mg/1) . 876 mg/l (I = 292 mg/1) and 150 mg/l (lI 50 mg/1) for
sodium fluoride (as
mate, respectively .
F), sodium arsenite (as As) and potassium dichro-
Specific Inhibitors of Nitrification in Activated Sludae
The autotrophic nature of nitrifying organisms led to an earlier
belief that organic matter, in general, was inhibitory to nitrification .
(see reviews by Painter, 1970 ; Focht and Chang, 1970) . It is now gen-
erally accepted that this is not the case . Although peptone (1-10 mg/1)
80
was reportedly inhibitory to Nitrosoaonas (Buswell, et . al ., 1954), more
recent studies (Painter and Jones, 1963 ; Beccari, et . al ., 1980) have
indicated that the peptone concentrations studied (up to 60 mg/1) exert
no appreciable effect of nitrification rates . Beceari, et al . (1980)
extended the study of the effect of carbonaceous substrates on nitrifi-
cation to include various compounds commonly found in sewage (i .e ., glu-
cose, glutamic acid, starch, ete .) . They reported no significant
effects on nitrification due to the substrates tested .
The earlier observations commonly made of depressed nitrification
rates in municipal and industrial wastewater treatment plants can be
attributed to unsuitable operating conditions (i .e ., low DO or MCRT)
rather than to the presence of organic matter (Downing, et al . 1964 ;
Kiff, 1972 ; Hockenbury and Grady, 1977) . Moreover, it has been shown
that the presence of organic matter in sewage can have a stimulatory
effect on nitrification processes (Hoekenbury, et al ., 1977) . It i
becoming increasingly more apparent that the detrimental effects of
organic matter on nitrification are specific rather than general .
There have been a number of studies performed to determine the
effect of specific inhibitors on nitrification in activated sludge cul-
tures . The most comprehensive study to date is that conducted by Tomi-
linson, et . al . (1966) . A summary of the results of this exhaustive
study is presented in Table 10 along with other relevant studies . Also
included in this table are the results from pure culture studies cited
previously . Several important generalizations can be made from the work
of Tomilinson :
81
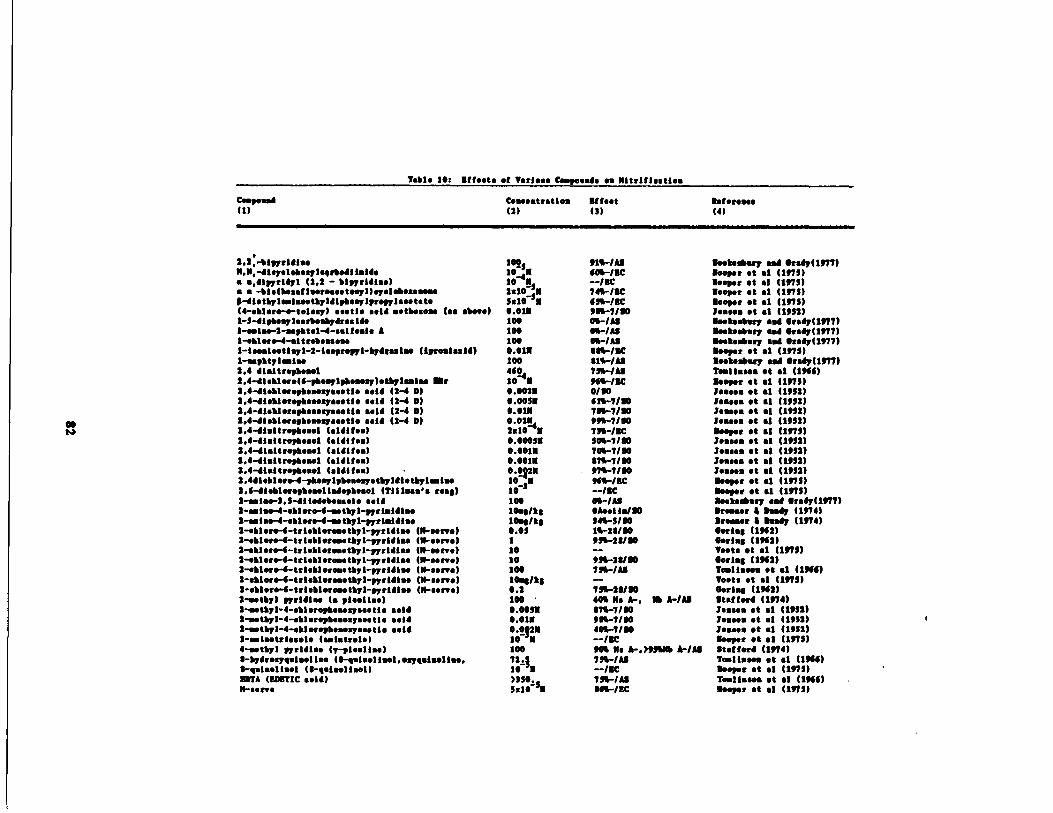
Table 10 : Iff.ats et Varies Compounds us Nitriflogties,
:
Cw9esd(1)
Ceuestratle .12)
Iff.et(3)
Retire...(4)
3,1,-~lnrilia 300-5 01'a-1AI rabslar7 ad fray(1977)N.N,-IIge1Neg1e1rbe111.14 . 20
-11M 100-/rC ‚eepr et al (1975)
a .,dlpriyl (2 .2 - blpridlas) 10 --'IC Beeper et at (1975)a a -bls(b ...lluretastegl)gelMet..es 1.10Sr 74%-IBC roopr et a1 (1975)/-Iletylwl‚eet1711ipbag10replaeetate Sa10S2 650-Inc reaps at at (1975)(4-.blare-e-teleq) ..etis sold ..tbeseY (as above) 0.010 900-7190 J.sNs at al (1952)1-S-117bpI.ub..b7lrss Ile 100 00-IAl I..bd.q ad Oroy(1977)1-s.1..-2-Y70te1-1-s.1f..le A t00 00-IA5 rabab.q sod Oroy(1917)1-ablerƒ-l-altrAuYea 100 00-/A5 reeb.b.q sod Orsy(1977)1-l soul *all gl-2-isgrepl-bydsatia (Ipreslasid) 0.011 0s0-/IC reepr et .t (1975)1-Ypbtylwia 100 010-/A5 reebabar7 and fray(1977)2.4 dl .ltr.psal 460 750-/A5 Teeti.YS of .1 (1966)2 .1-llsblere(6-7bglpboaq)otbylwla Mr 100IN 960/IC Beeper et al (1975)2 .1-dleblergbagae.tla said (2-4 0) 0 .0021 0/50 Joasos of al (1952)1.1-lloblerepb.aegaeetlo sold (2-4 0) 0.00SM 619-7/50 Josses at al (1952)2.1-dieuerepeagaatie sold (2-4 r) 0.019 760-7100 losses et ai (1952)3,1-ltebletgbsaegasatle said (2-4 r) 990-7100 Josses et al (1952)2 .1-dI .Itreposel laldlbal
0.0Isle-4m 730-/IC seeps et ai (1975)2.1-disittepbosel ( .1111 . .) 0.00051 500-7/10 Josses at al (1952)2.1-llaltrepsal ( .l/(tea) O.OO11 700-7100 Josses at .1 (1052)2.1-41.ttrgbeal (.lltt. .) 0.0010 079-7/00 Josses et al (1952)2.1-Iialtnp..e1 (sUit. .) 0.092N 979-7110 Josses of at (1952)2.Idleblere-d-p .y1p.aeq.tb71dIetb71w1a 10 I 9S%-/RC reepr et al (1975)2.6-disblerepb.elidgb...l (Tills.'ƒ roo$)2-salt.-3.S-l11.d.b.sel* sold
ii-S100
-/IC00-/A5
reopr et al (1975)reebabsr7 and Oroy(1977)
2-w1.e-l-abler.-6-eatbyl-pritidla. 1080/10 OA.e1101GO Irssor 0 My (1974)2-wise-l-abler.-6-stbyl-prlddl.e 10.0/t0 310-5/00 Ire...! I Iad7 (1971)2-abler.-6-trlsblerw .tbyl-pr111Y (II-Yno) 0.05 10-26/10 arias (1962)2-ablate-6-tri .blers..tbyt-prldl .s (N-sans) 1 950-26/00 Oerly (1962)2-.blare-6-trlsblerwabyl-prill .s (N-sins) t0 Test@ et .1 (1975)2-.blare-6-trl .bleraa.tb71-pr111 .e (N-ass,.) 10 950-20/00 Oerls@ (1962)2-eblere-4-trtabl .twstb71-prldla (N-stns) 100 750-/A5 Twllsa , at .1 (1966)1-ablerƒ-6-trl.bl.rwetbyl-prIdise (N-sane)2-.More-d-trt .biers..tbyl-pridl .s (N-stns)
IongIIs0 .2 750-20/50
Tests et al (1975)series (1902)
2-..tbyl pridlY (a 7leslls.) 100 400 No A- . M A-/A5 Itatt .rd (1974)said 0.0092 570-7/50 Josses at at (1992)
1-.stb71-1- .bl.rgb...s7s.a1. sold 0.019 900-7/10 Josses of at (1952)2-..tb7I-l-.blKgb.\eq..ale said 0 .0921 100-7/00 J....* at at (1952)3-witetris .ele (wt .trels) 10 0 --/IC seeps et at (1975)4-.ab71 pride.. (7-9i.ella.) 100 900 No A- . )99M A-/A5 lt.tterd (1911)I-bydregp1.e11a (0-O.lsellal .egpialla~ . 72 .11 150-/A5 Twlisam et al (1966)0-gelaellal 40-e.19011 .e1) 10 r -1IC reepr et al (1975)IOTA (UITIC ..id) "so_ 15%-/A5 Tw1l.sw of al (1966)"-serve $ .1o Sr 069-/IC Deeper et .1 (19/5)
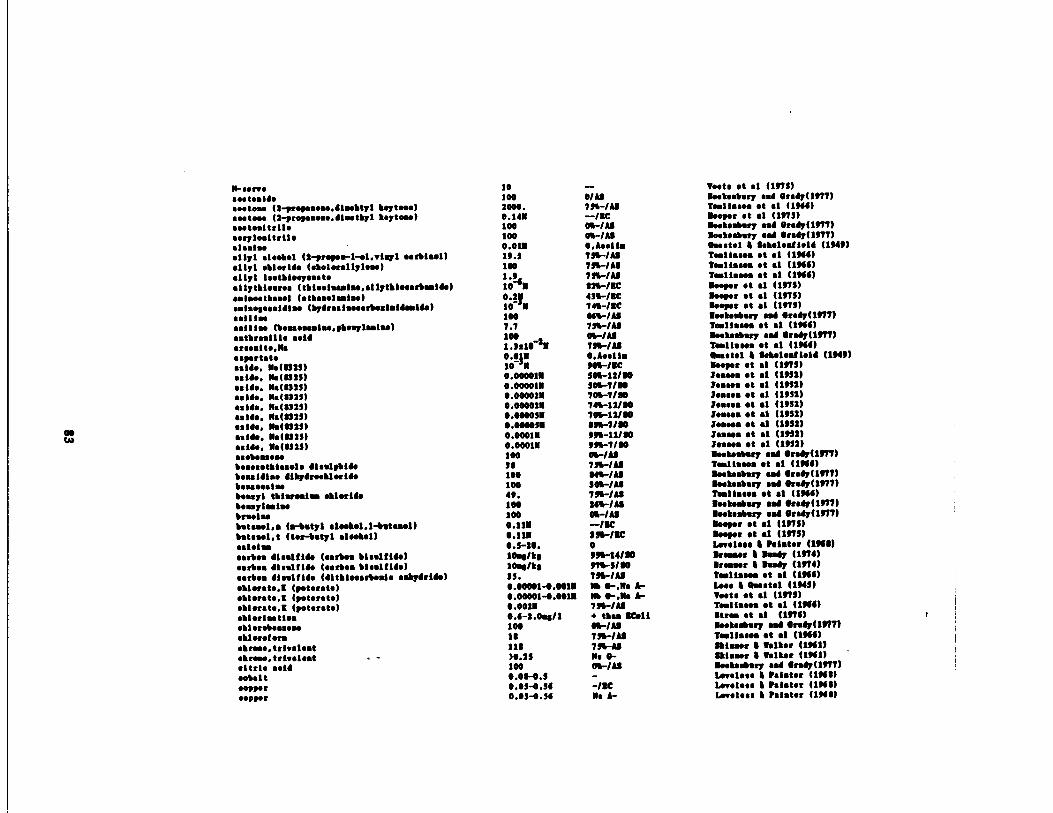
N-serveIde
sloto.e (2-0re5..ou .ll.eltyl tytese)soto.. (2-prop.e .. ƒd l .ethl tytos.)ƒ
.etosftrfiesayle.ltrlie.lulusly! .10.2.1 (2-Tr.p.-l-el.efgl 0.26:.1):1171 all .rfb ( .2el .rallyIeae)sly! feotkteysastes117tliesroa (tlfesf ...l...slyHie..Au.tb)ul.eetb ...l (ot ss.lwlse)
dime (bydrualsoostboxisidmido)s .ƒ
lll .esallfu (1..sess.l.e.9leglrlu)s.tbrosille sailƒ
r.0slte.Nsssprtaesalt. 0.(821)ƒ
:8. . .2 :10325)
Test* at al (1975)Msete .l.y sd Gray(1977)Twllasem at st (1066)Deeper at a1 (1973)Mute.2.y and fray(1077)Msste .2.y sad fray(1077)0.satel I WaY.le.f1.14 (1949)Testiness at at (1964)Twlfas.s at at (1966)Twlissw at .1 (1964)ƒ
eeper et a1 (1975)Deeper at al (1075)Deeper at al (1075)ƒ
ukeN.y sod fray(1077)Tasllssaa at al (1944)I.ekeM.y and Yrsy(1077)To.ll.sss et s1 (1046)gaatel I Mekeleaf1 .l4 (1040)Deeper at .1 (1975)losses at at (1951)losses at $1 (1052)loss.s et al (1952)losses et .1 (1952)losses et at (1952)lose" at .1 (1952)lasses at at (1952)lessas of al (1952)11eob l.ry was fray(1077)Twllsses et s1 (1944)1sekeA.y and fray(1077)mookembury sea graft(1977)Twltasw at al (1966)MukeMsy sd fray(1977)bekealory sad fray(1977)Deeper et at 11975)Deeper .t .1 (1975)L., .l.ss I hlstor (1441)Dresser I .say (1974)Mras.er I Only (1974)Twlt.seu et al (1966)Lose I asst.! (1945)Tests at a1 (1975)Twll.a, et al (1944)ftrw at al (19761M.eto.2ay and 0r.y(1077)Twlloso et al (1966)nisssr 4 Walker (1961)Ill...: I Walker (1961)Iukeslary and 0rsy(1077)L.v.looo 10slator (1066)Iwrale.e I hl .tar (1966)1wr .1ess I Psi .ter (1966)
r
10100 01"2000 . 7111-/A10 .149 --/IC100 0a-/A1100 O9/ A10.011 O.Asell.19 .5 759/A1100 715-/A11 .9 755-/All1041 I29/IC0.2y 419/IC10 M 745-/IC100 "%-/A17.7 755-/A1100 01-/A11.9210-211 759/A10.010 O .A.alfs10 M 005-/IC0.00001. $4111-12/901
. .140 . 05(0325) 0 .000010 301-71100.(0125) 0.000020 70-7/10:aide .
sills . 0.(0125) 0.000020 745-12/10.all.. 0.0325) 0.000051 70-12/10aside . 000325) 0.00105N 0597110.2160. 0.(0325) 0.00019 095-12110a.il., 0.(0325) 0.00019 0097/10asebn.u 100 O9/A1U..e.aktsele lls.lpbila 50 759/A1be..M.0 4alylr..2lorId. 1100 045-/A16.oN.ts. 100 $011-1"
tbiwouls . .2l.rll.!/easye
49 . 759/A1Ieuylwlse 100 241-/A16rs.1u 100 09/A1!.toss! . : (W-butyl .109W .1-Mtss.l) 0.110 -/Ictat ...I .t (ter-htyl .1.2.11) 0 .110 159/2Co. loins 0.5-20. 0.sr5.a lls .lflle (esrb." blsalfId.) 10.1/!1 05914/10eerlea 4fa .lfi4. (e .rlas ƒ9 0 .! 8!0) 10.88/t0 07%-5/10.srb.a lf ..lfide (litlt ..srle .ts ss174r1M) 15 . 759/A12 l .r .te.I (ptar .ts) 0.00001-0 .0019 0 0-.N. A-.2l.rste .I (p.terst.) 0.00001-0 .0011 Nb 0-.N. A-.2l.rate .I (peterste) 0.0020 759/A1Hierlutlo. 0.6-2 .088/1 ƒ
tlss 11611ell .r .2a .u.u 100 0h/All.2leref.r. i1 759/A1.2r...,trl..lest 111 796-AS.2rssattrhele.t )0 .25 0e 0-altrle said t00 OS-/A1:!belt 0.00-0 .5aeppr 6.65-0 .56 -/IC0eppr 0.05-0 .54 N . A-
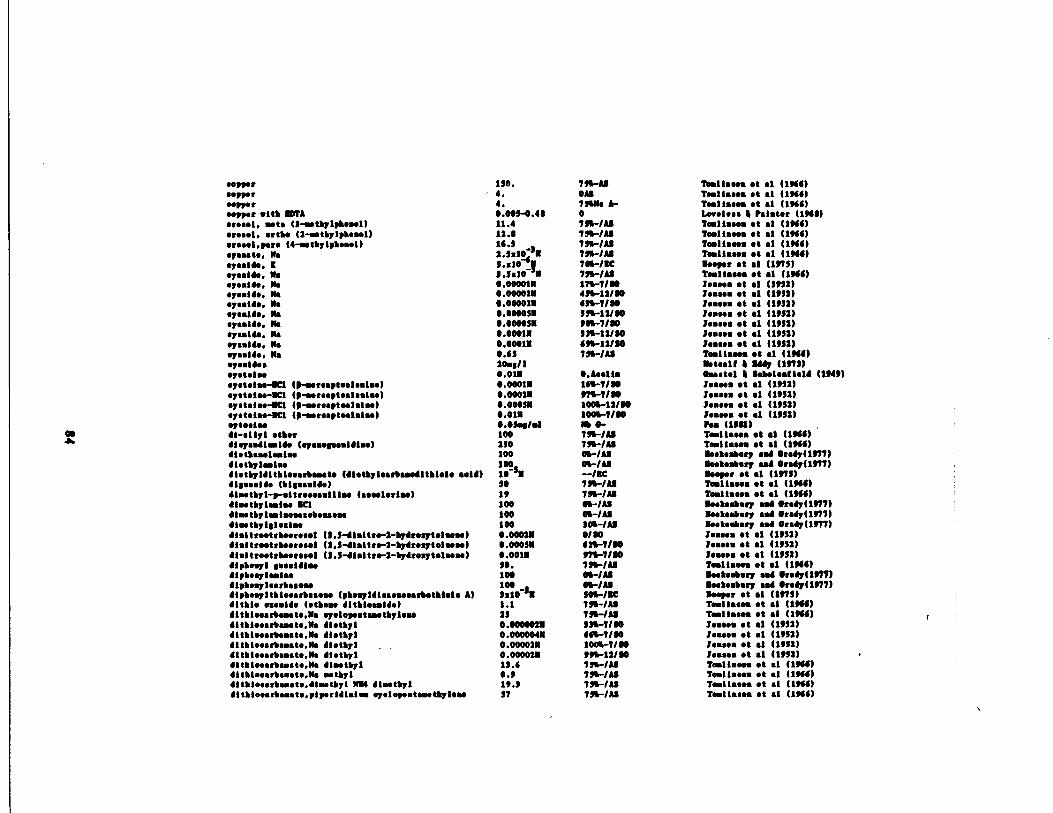
aepprsops.selpraypr sitI WrAoresel, sate (1-satlyl,beu1).1.5 .1 . ortt. (2-ut yltbosel)5roset.pra (4-r tt7101ase1)@yasato . Noa7asld. [o7aƒIM . NoopaulO. Maspas/do. Mssrealds, Maayasl4s. Maysslla. Mayaslde. May.sib . Nogravid* . M .eyeglassystolsoeystolss-lCl (I+ƒreytaalaslse)yatelu-1C1 (1-wrayt .alosls.)ystalN-101 to-mr.ytNlslas)ystalN-ICI (1-rteytNl .Iu1yteeludl-silyl attardlyasdlwlde (ya.gaslllu)di.tta.elai.dletylwlsodlotyldlttl.oartw.ts NiettyleaAasdlt1leio said)dipeslds (tipsslds)Nsottyl-rsitrasNSlllu (....1.r1..)dlsetylwlse ICIdi..ttylwis.sa.otes..Ndi.tt7101ssl .edlsitr..trt"r.sal (1.2-dlsttre-2-17dresytelsou)disltrwtrt.ores.l (1 .!-Ilsitre-l-171rer7teluu)dlsitr.atrturossl (1 .!-dlsltre-2-tydrosytelsass)dipteyl pasidisedllt.ylw/n .dipteyleartarerdlpboylttloosthesSN (9teyldla.eseaa .bttiols A)little 5.5.11. (egsu dlttlewld.)dlthtNarts‚ate.M4 yetepntw.ttylsadlttI .eartwat..M6 diettyldItklNarb.sta .Ms diotlyldlttl .aarb ..ate.Ma di .ttyldittio..rte.ate .ile dtettyldlttt..s,ba.ata .M6 dl.attyld lttteearta.a t .,Ms rttrldltlteaaNwato .dt..ttyl 116 dl..tt71dittiesarta.ate.plprldlslen yelopsta.att71ss.
r
120 . 7111-At Twllsass at al (1165)4 . OAS Twllsus at al (1964)4 . 7511. A- T..llsaw at .1 (191110.002-0 .40 0 Leaelesa 4 Fainter (I%$)11 .4 79 WAS Tuliss" at al (1001)12 .0 7!1-/Al Twlis." at a1 (1014)14 .! 72s-/AS Twlissw at al (1906)22.3s10 1 731-/AS Twlissn St .1 (1!06)l.s10i~ 7011-/1C Nearer at a1 (1975)2 .5.10 M 7!t-/Al Twllsus 5t a1 (1906)0 .000011 171-7/00 Josses et sl (19!2)0 .000021 420-12/00 losses .t a1 (1952)0.000021 110-7100 lesson at al (1932)0.000021 !l1-12/00 lesson at al (1952)0.000051 201-7/10 looses at at (1952)0.00011 !11-12100 losses at at (1952)0.00011 191-12100 losses at .1 (1951)0.15 7%1-/A1 Twlls.ss at al (1901)2008/1 IMtealt 0 114 (1973)0 .0111 O,Aselle Ouatol S hbI..It .ll (1949)0.00011 101-7100 losses .t s1 (1952)0.00021 !71-7/00 Josses ƒt a1 (1952)0 .00021 1001-12110 Josses et al (1952)0.010 100-7/00 losses at a1 (1952)0.06081 .1 11 0- hs (1906)100 711-/AS Twlissn at .1 (1911)2!0 7%-/AS Twiis.n at al (1966)100 01-/AS Meta.bsy sad Gray(1977)100 01<-/AS tuteatsr7 .d Ora4(1977)10-911 --/lc Mo.pr of .1 (1975)s0 7!1-/AS Twliaus at al (191$)19 721-/Al Twiis." at al (19$1)100 00-lAS lsetoAsr7 .d Ora4(1977)100 OS-/AS 14etSMsy .d Ora4(1977)100 501-lA2 loobstsr7 and Gray(1977)0 .00021 oleo losses at s1 (1952)0.00051 $11-7100 losses at a1 (1952)0.0011 971-7/10 losses at al (1952)so . 791-/Al Twllssos at al (1901)100 01-1AS lNtastsr7 and l sdy(1077)100 01-/Al lootoshy sad Or.4(107)1.10 !1 !01-/10 loapr at al (1973)1 .1 7611-/AS Twlls.w .t .1 (1906)21 7!1-/AS Twlissn at al (1906)0.0000021 111-7/10 lesson of at (1952)0.0000041 60-7/10 losses of al (1952)0.000021 100-7/00 losses at sI (19!2)0.000021 191-12/10 1 . . ..n at al (1952)11 .6 7%-lAS Twllsus at al (1906)0 .9 711-1AS Twlissw at al (1961)19.3 7!1-/AS Twlissw at al (1916)57 791-/A$ Tenting" et sI (1716)
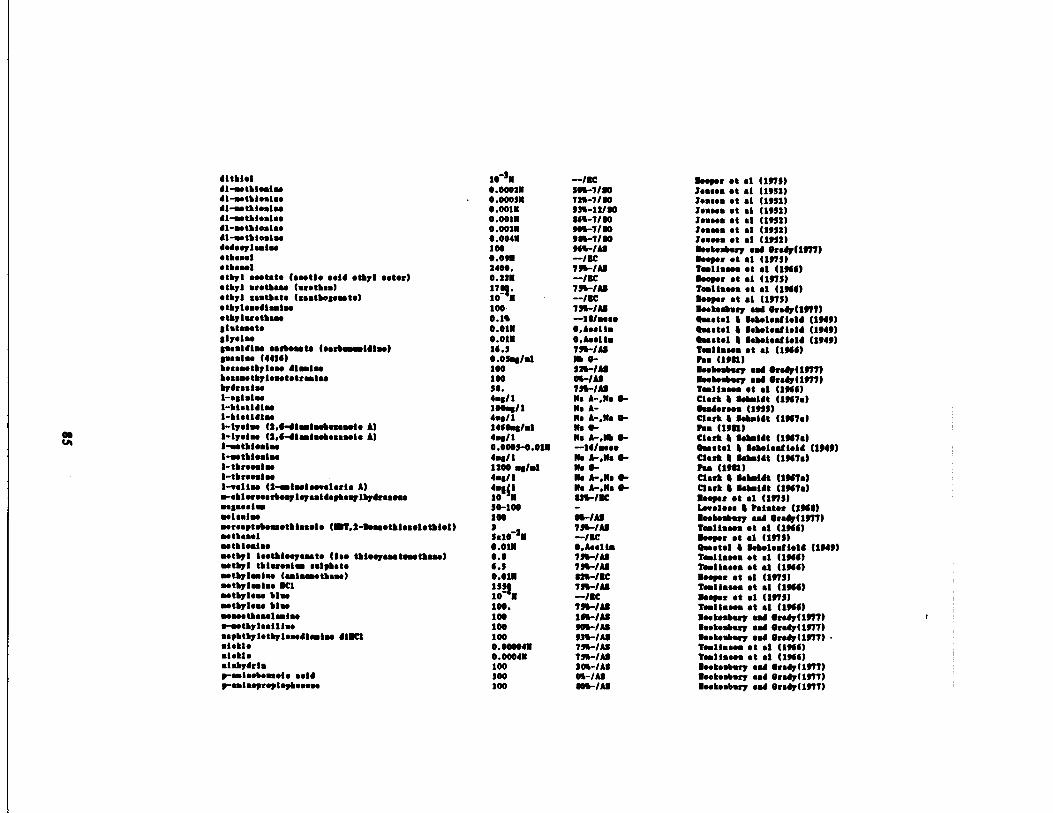
Deeper at at (1975)lo.s.s at a1 (1951)J. .s.m et al (19521losses at al (1952)losses at al (1952)J0...8 et al (1951)lesson et at (1952)ƒ
ofkaasr7 asd fray(1977)ƒ
eeper at at (1975)Twll.as et al (1966)Deeper at al (1975)To.11. ..n at al (1910)Deeper at al (1975)Re.k.asry sod Oray(lP77)O.ast.1 I lakeleatiel4 (1949)#metal 4 laketestl.l4 (1949)0aastel 4 hketesl1.14 (1949)Tosllsofs at al (1900)hs (1901)ƒ
ofbasry sod frsyf1977)Rofbasr7 sod sway(1977)Tasllsses at at (1966)Clark 1 1.1i4t (1907 .)Os.lersas (1955)Clark 1 lel.ldt (1907 .)Tap (l911)Clark 1 1.losidt (1907x)1.5 .tel I lablasllel4 (1949)Clark I 1Nri41 (1907.)0a. (1981)Clark 1 1.1ridt (1007.)Clark i sslri4t (1007x)Deeper at al (1975)Loveless 4 psistar (190$)Raebasr7 and Gray(1977)Teelisofs at al (1901)Deeper .t al (1075)O.estel 4 Mkel.slial4 (1949)Tslissas at al (1944)T..linson at *1 (1901)ƒ
eeper at at (1975)T..limaes et al (1966)Deeper at .1 (1975)Twllsaes et at (1966)Dofk..Mr7 and fray(1077)De.kaasr7 ad fray(1977)De.kea.r7 sod fray(1077)T..ll.sas at al (1900)T..lisofn et al (1900)leok.asr7 and Orsy(1977)Raake .N .ep and Oray(1777)ƒ
esks.b.r7 sad Gray(1977)
t
41111.1 it-so --/RCA1-erNleeiM 0.00021 501711041-Mtkle.lee 0.00050 7227/00dl-Mtlle.l.. 0.0010 51212/0041-MtbIe.I .e 0.0010 0427/10dl-MthI..I .e 0.0021 90%-7110dl-setlle.lee 0.0041 9M-7/10d.dee7losls. 100 941/M.1k...l 0.091 --/RCetks..l 2400. 731-/1etyl softate (softie sold Sibyl eater) 0 .250 -/RC.tyl .r.tkaM (srotkan) 1781 . 752/1etyl rs.tbat. (rs .tl.prts) 10 M --/RC tyleadla.IM 100 752/A1etylsratbM 9.1% -10/MSoslatuate 0.011 O .Aaeli.01704.0 0.010 0 .A. .11.esen/dLM .Aerts (aark.M.idise) 10 .5 7A-/M$spat . ƒ (4410) 0.05.0/.1 10) O-kas ..atyle. dies/of 100 522/1ker ..aylaoftetra.ins 100 O1/ASydrasiof 50 . 750-/11-.skis. 4.011 N. A-.Ns 0-1-klstIdla. 100 .,/1 We A-1-11.114IM 4.011 Ne A-.Ns 0-1-1ye1M (2,0-t1r/MOea .eie A) 1440.x4.1 N. 0-1-17.1of (2,0-41x.1 1s x.040 A) 4.0/1 N. A-.Nb O-lyetklesiof 0.0005-0 .011 -14/Mae1-MtkledM 4.0/1 No A-,N . 0-I-tkr.MIM 1200 us/.l N. 0-1-tkreeslof 4.0/1 Ms A-.Ns 0-I-,.l1.. (2-sslMlee .s l .rle A) 4.1 1 N . A-.N. 0-areklovofarkeglgasldapkaqlydraseM 10 M 811-/RCMes..lss 50-100 -MIa.IM 100 O1/ARMreaptNessetlissele (111T.2-Msetklaseletkiel)MekaMl 511021LIt --/RCMtkleslse 0.011 @ .A..1is11171 isatkieeyasta (lee tkiegastesetks .s) 0 .0 750-/1
551171 tk/sraals selpbst. 0 .5 751-/1Mty1..IM (a.Isa.. tk.so ) 0 .010 121-/RCMtylsis. DCl 155. 750-/MMtyl.M blue 10 1 --/RCMty1... 11.. 100 . 751-/MMM. tkanelYlna 100 111-/Als-setkyl ..llls. 100 901/A1sspktyletylsM4laslss di11C1 100 912/Mstable 0.000041 751/1‚2.21 . 0.00041 750-/1.1. 74ris 100 100-/Mp-..I.N..r .lo sold 100 00-/Mp-s.lsepreplepbs.s . 100 $O0-/M

N1pk.a7lsalae-12 104p-aitrossiliwraltrob.asa11.yd.9-9k.glaa.sallla.p‚totk .als amid ( .it . 1)pk.aaslu. Mtk..altst.Okeaelphase!phase! . s-.r.p-.roods0ba.lpridise)pbl.rllalapklerldalapkierldsis9ki.rldalaplT=Fsi‚ 1Potassium thugs..to (9.ta.slm salt..yasato)prepael . lpropsel . apropisl..Paris**hridimpriaidl..s (astadiasis.)prwate (2-sgrepaete A)prwate (2rosyr.pa.le A)rtod..lee a.e.-butylaaiao.2.1.1 . (1-s…tyl-l*is.le)seal.. aside(5125)ƒ
.11...itratm salsa fl . .rl4e
eelm ri .arldsseal= flaarllsƒalas tl.arld.s.4ium leles .etates.di.. la.as.tatesodium la.aeetatesodium 1 .1.a.etatesoil.. salt!! .
tear! ƒ saids tr.ptaq.isstryskala. SC1salt..!. Amidƒ
airmailuml4lselfatkl.s.i eeelfatkleselesepals soldtaaal‚ S derivatives. paella meldstaaris. (2-..isaetkasesalfeal . A)tear! .. (1-ula.akaaesaif..l, A)tearis. (2-..la.atkas.salt..l. A)tetra .kl.resellglaatlidst.tr...tyi tkler .ali .alpids (tklrak)
. !lava..!/ƒ
l..kaskary as Oray(1977)M..k.sbery USA Oray(1977)l..k.sbaq asGray(1f77)b.k.Nar7 USA fray(1977)ha (1901)M..pr et al (197!)Stafford (1970T..ilaeea at al (1944)ttatt.r0 (1974)
losses at at (19521Josses at al (19!2)leases at a1 (1952)losses at $1 (1952)N.pr at al (1975)Teallosaa at al (1940)!loopt at al (197!)loop, at a1 (1975)l..bsbq asfray(1977)P.. (1901)Stafford (1974)Pea (1901)Pea (1921)Ps. (1951)lwkaakary Unit Grody(1977)toabdar7 ms fray(1977)T..11...a at a1 (1944)Twilasea at al (1944)leeksal.ry as dray(1977))eases at al (1952)leases at al (1952)leases at al (19!2)leases at at (1952)leases at al (1952)leases at al (1952)leases, at at (1952)leases at al (1952)leaver .t at (1975)l..k.slap as Oray(1977)T4tfasN at at (1!44)T..lla..a at al (1944)1e.keabar7 as fray(1977)b.t..hry as Gray(1977)Bremner I lacy (1974)Bream., $ hay (1974)11..b* um ms 0ray(1977)Sloe S 9 a.ak.ly (1974)losses et al (1952)losses et al (1952)leases at al (1952)loopy at al (1975)T..llaaea at al (1944)
r
100 01/Al100 4A-/A1100 7A-/All00 541-/Al0 .03ƒ} /al M 0-l:10 M --/IC100 O .A..lia.Al5 .1 7!1<-1AS100 O .A.alia.Al
0.0041 121-12/000.0041 e016-7/100.0031 015-12/00051 9917/0010 0/al -/SC…00 751/Al0.131 111-/!C0.331 --/SC100 01-/Al0.03.1/al M Q-100 !01 No A-.)9!1 M A -/Al0.03.1/al M 0-0.04.1/al M 0-)0.00003 M 0-100 O1/Al100 01/Al7.0 731-/Al23 . 731/Al100 01/AS0.021 O*-7/100.031 7717/100.051 9917/100.031 991-7/100.0000021 221-7/100.0000031 921-7/100.000011 94-121100.090011 9917/1010 M -/lc100 01-/Al400 . 731-/Al175 . 7!1-/Alloo O1/Al100 01-/Al10.1/k1 $Ae.Ila20a4/k0 111-!/10100 201-/Al1074-1010 .031 991-7/100.0751 001-12/100.0351 441-7/1010 M 591-/SC10 7!1-/A1

tetrretyi thlare..eseeslpbldothl .als.thia ..ts.lde (sth .sethles.ld .)tbiaas. .l .erheslde (ydreal...erhethlerlde )thl .s.s/esrh.s/do (ydrsslse ..rhethlorlde)thiosrea (thleesrhe .lde)thlarea (tkles .r0 . .10.)thleares (thl ..arta.lde)thleares (tktasrb ..lde)thioar.. (thle.aNe.11.)trlytyirl .etrleN.selrlestrletylrlsetris.tylrlse pl-N-ll.etyls.tbasrlse)
.1tlrlse,hi.hl2.oto .Bias
all asoostratina is q/1 class otherwise rtod. Altor .ato ss.e s are !s prosthesis sod aeprstod y swags .
A is the ƒ.seed field is as ahhrovlstles for said
Ku 1!L Brog's Is 018=1 221M.
- inhibitory -- e..pletelp Ishlbitey. so .Itriflestles -s or --a where ‚ !s a swter wrrspads to labibitery orcompletely Ishibltey after a Aye .spearo prsoat peeoediss the '4-" else idlestes level of !shibitles 0e O or M
O preoe.dta the '"' Idl..te . lshihltloa of prwthof Nltr . .e.raa or dltrobaster . reopotively .
No A or M A pr . .. .dlss the "-" Idle.t.e Ishlhlti.m of aethltyof Nltrose.es .s or ((/trobaster, rsep.tlvely .
/AO mossaremsts made is s.tivated .lads ./0C measurements mad* Is as esrl .h.est sltsro/PC measurements mad. Is pure sultaroISO .aassr. ..sts "do is $oil
r
Is .9m.s/ .1
7l.-/AOMe A-
Toolisses at &1 41%4)Osderses (1959)
OA79%-/AO Tastiness at .1 (1966)
10 W 996-/0C Oeepr et .1 (1979)0.10 796-/AO T..lis ..s at .1 (1966)0.0000020 900-7/10 1et .1 (1992)0.0000090 900-12/00 Je...s at .1 (1952)0.00010 -11/.e coastal 0 tehele .fl .ld (1949)0.010 79%-/"So Ossetel $ OHelesfl .11 (1949)0.076 790-/AO Twllsen of .1 (1961)100 00-/AO SoskesNy Bad fray(1917)100 00-/AO 0 ..k. .b ry sod Oray(1977)100 090-/AO 0o.teahsy sod Gray(1977)11$ 790-/AO T..11. ... of al (1966)100 00-/AO lbebNsry ad Orsy(1971)O.09y/ml M 0- Pas (1901)0.0$-O .9 Loveless 0 histor (191$)

1 . The most inhibitory class of compounds were found to be
nitrogenous organosulfar compounds such as thiourea,
thioacetamide and dithioxide . These compounds generally
inhibited the oxidation of ammonia as opposed to hydroxylam-
ine or nitrite oxidation .
2 . Although the short term effects of inhibitory compounds on
ammonia oxidation were found to be similar to that reported
for pure culture work, there were considerable differences in
tolerances to cyanide and heavy metals .
activated sludge cultures exhibited a much greater tolerance .
3 .
Except for cyanide, the compounds found to be powerful inhi-
bitors of Nitrosomonas had relatively little
8 8
In this respect
effect on
Nitrobacter . However, chlorate, hydrazine, and sodium aside
were more toxic to Nitrobacter than Nitrosomonas .
4 .
The compounds studied generally appeared to follow the non-
competitive mode of inhibition .
5 .
The effect of mixtures of inhibitors was generally greater
than the effects of individual compounds .
6 . Activated sludges have the ability to acclimate to certain
inhibitory substances (i .e ., thiourea, cyanide) and this
ability may be related to the initial concentration to which
the sludge is exposed .
7 .
Short term inhibitory tests do not generally give a good
indication of actual conditions in a treatment plant . Accli-
mation to a "powerful" inhibitors can result in much lower
effects under treatment plant conditions . Conversely, heavy
metals may exert a more severe effect, possibly due to the
exhaustion of the adsorptive capacity of organic matter .
8 . The inhibitory effects of the compounds examined varied from
day to day according to the nitrification capability of the
sludge .
Since the work of Tomilinson, et . al . (1966), a number of studies
on specific inhibitors in activated sludge have been reported, each of
which have supported one or more of the points cited above . Stafford
(1974) investigated the effect of phenolic compounds on continuous
nitrifying activated sludge units using ammonium thiocyanate (500 mg/1)
as feed . His results showed that activated sludges were capable of
nitrifying ammonium thiocyanate and that the addition of 10 mg/l phenol
completely inhibited ammonia oxidation while nitrite oxidation was unaf-
fected at phenol concentrations up to 100 mg/l . Although the reported
concentration of phenol required to produce 75% inhibition was the same
as that reported by Tomilinson, the required concentrations of o, m and
p-cresols were approximately 3 times lower . They also provided evidence
for acclimation of activated sludge to nitrifier inhibitors and showed
that acclimated sludges handled shock loads of phenol (up to 100 mg/1)
much more readily than unacclimated sludges .
89

Joel and Grady (1977) examined the nitrifying ability of activated
sludge in a series of experiments using continuous flow and fill and
draw reactors receiving aniline as feed . In the continuous flow expert-
ants, where aniline eventually served as the sole carbon/nitrogen
source for organism growth, it was shown that a MCBT of 7 days was suf-
ficient to remove any inhibitory effect aniline had on the nitrifiers .
They reported that COD removal and nitrification could occur simultane-
ously provided that the heterotrophs had degraded aniline to a non-
inhibitory concentration. The authors noted however, that these results
were obtained under carefully controlled steady state conditions . Com-
plete inhibition of nitrification occurred if the reactor was subjected
a shock load of aniline, raising the concentration in the reactor a
few mg/1 . In the fill and draw experiments, it was shown that, within
the range of 4 to 13 days, MCBT had no effect on aniline degradation,
although longer MCRT resulted in greater nitrification efficiencies . In
these experiments aniline degradation and nitrification were found to be
sequential with nitrification commencing as soon as aniline was reduced
to non-inhibitory concentrations . Furthermore, it was observed that the
metabolic by-products of aniline degradation enhanced the rates of nit-
rification in separate stock cultures of nitrifiers . The overall
results in the study demonstrated that a severely inhibitory compound
such as aniline could be degraded sufficiently to allow nitrification to
occur if the proper conditions were met .
Wood, et al . (1981) examined the toxic effects of various com-
pounds on nitrifying activated sludge in batch test procedures similar
to that used by Tomilinson. They noted, as Tomilinson did, that the
90
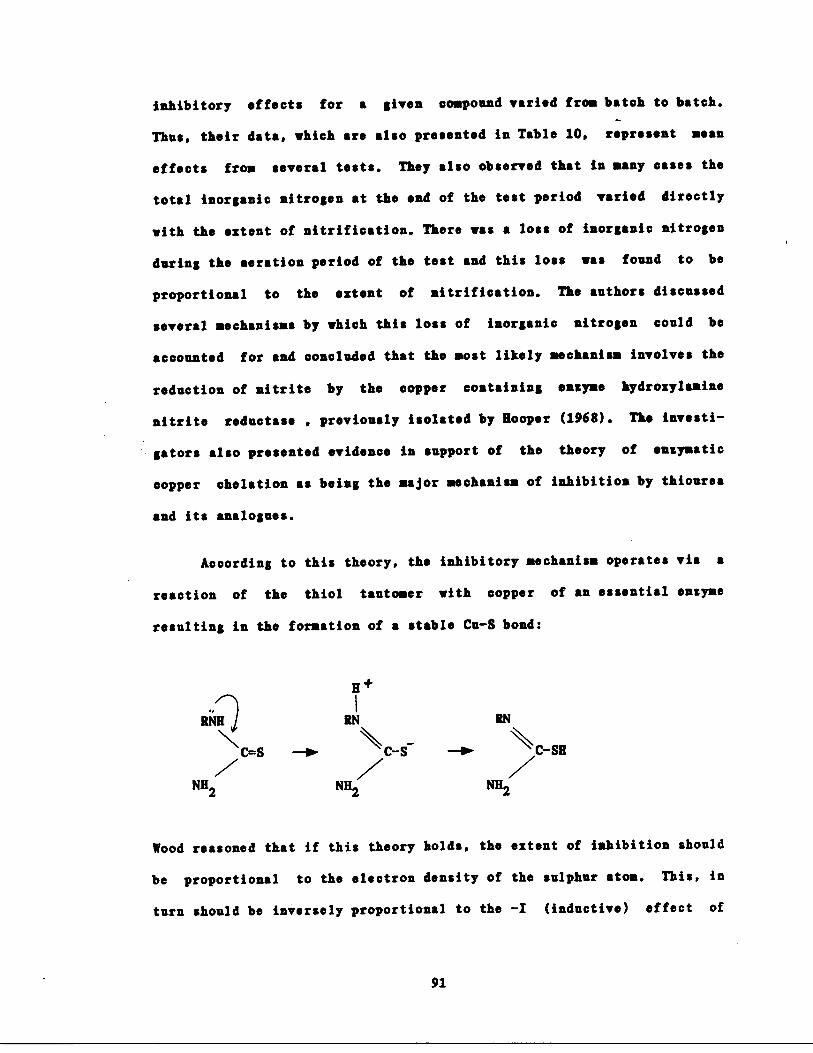
inhibitory effects for a given compound varied from batch to batch .
Thus, their data, which are also presented in Table 10, represent mean
effects from several tests . They also observed that in many cases the
total inorganic nitrogen at the end of the test period varied directly
with the extent of nitrification. There was a loss of inorganic nitrogen
during the aeration period of the test and this loss was found to be
proportional to the extent of nitrification . The authors discussed
several mechanisms by which this loss of inorganic nitrogen could be
accounted for and concluded that the most likely mechanism involves the
reduction of nitrite by the copper containing enzyme hydroxylaaine
nitrite reductase , previously isolated by Hooper (1968) . The investi-
gators also presented evidence in support of the theory of enzymatic
copper chelation as being the major mechanism of inhibition by thiourea
and its analogues .
According to this theory, the inhibitory mechanism operates via a
reaction of the thiol tautomer with copper of an essential enzyme
resulting in the formation of a stable Cu-S bond :
H+
BN
RN
C-S
--~ C-SH
NH 2
NH2/
NH /2
Wood reasoned that if this theory holds, the extent of inhibition should
be proportional to the electron density of the sulphur atom . This, in
turn should be inversely proportional to the -I (inductive) effect of
91
C=S
substituents (i .e ., those with a tendency to withdraw electrons) on the
nitrogen atom . Using both Tomiliason's experimental data as well as
their own, the investigators found these postulates to be valid .
Braam and Ilapwijk (1981) recently presented results on the effect
of added copper on nitrification rates in activated sludge with dif-
ferent mixed liquor concentrations and different pH's. These results
showed that the inhibitory effect of copper is dependent upon the free
copper concentration in the system rather than the total copper concen-
tration. The free copper concentration in activated sludges was demon-
strated to be strongly correlated to pH and sludge concentration, with
the free copper concentration increasing as pH and/or sludge con-
centration decreased . They suggested that these findings could not only
explain the effect of pH on nitrification by means of heavy metals (as
cited originally by Painter and Loveless, 1968) but also the wide range
of reported tolerances to heavy metal inhibition in the literature .
PAC-ENHANCED NITRIFICATION
Among the first reports of enhanced nitrification in the powdered
activated carbon-activated sludge process was that made by Stenstrom and
Grieves (1977), who reported improved nitrification in 42 liter reactors
operated over a 15-month period at the Amoco Oil Texas City Refinery .
The objective of their investigations was to determine the quality of an
experimental powdered carbon produced from petroleum coke . They reported
that PAC reactors nitrified much more reliably than son-PAC reactors,
producing a mean effluent NH 3-N concentration of less than 1 .0 mg/1 . The
92
non-PAC reactors produced a mean effluent concentration of 5 .1 mg/1,
while the influent NH3-N was 19 .8 mg/1 . The relative improvement in
ammonia oxidation was much greater than the improvement in removal in
other contaminants .
Subsequent tests (Grieves, et. al . 1979) showed that the PAC reac-
tors did not always nitrify better than non-PAC reactors . Over a summer
period at the Texas City Refinery non-PAC and PAC reactors produced vir-
tually identical nitrification rates ; however, over the next cool period
the PAC reactors nitrified more efficiently . During the latter phases of
this research a reactor was operated with catalytic-cracker catalyst
"fines" added in lieu of activated carbon . The nitrification efficiency
of this reactor, and the nitrification efficiency of another reactor
using a very poorly performing carbon, were no better than the effi-
ciency of the non-carbon control reactor . They concluded that a prob-
able mechanism of nitrification enhancement was adsorption of inhibitory
compounds, since reactors operating with non-adsorbing suspended solids
nitrified no better than the control reactor . They also noted that the
enhancement was most observable under microbiologically stressed condi-
tions, such as lower temperature, or higher influent chemical oxygen
demand (COD) .
Further experiments at the Amoco Wood River Refinery in larger
scale reactors (pilot scale, approximately 10,000 liter reactors) demon-
strated less nitrification enhancement ; however, the general level of
nitrification in the pilot reactors at this refinery was always better
than the results found previously at the Texas City Refinery . The non-
93
carbon reactors produced mean NH3N effluent concentrations less than
1 .0 mg/1 . Therefore it would be difficult to enhance nitrification .
Other investigators have reported variable findings with respect
to improved nitrification with PAC addition in activated sludge . Thi-
bault, et . al . (1977) investigated the claims of increased treatment
efficiencies due to PAC addition with 4 liter bench-scale refinery
wastewater fed activated sludge units . Their objective was to evaluate
different carbon types and treatment performance using various carbon
doses . They reported marginally improved organic removals at high carbon
levels regardless of carbon dose . Both the carbon and non-carbon reac-
tors did not nitrify throughout the study period . Their results on
shock organic loads experienced throughout the test period indicated
that certain carbons (i .e ., wood-based units) are able to withstand and
recover from upsets better than other carbons (i .e ., lignin or coke
based units) . In addition, their results suggested that PAC addition
could have detrimental effects on treatment efficiency due to desorption
of accumulated toxic compounds during shock loads .
Battens (1979) conducted industrial tests with the addition of PAC
to an activated sludge plant treating textile-finishing plant wastewa-
ters . His results, based on observations "before and after PAC addi-
tion" over a three year study period, showed that almost
stable nitrification efficiencies were achieved only after many months
of uninterrupted PAC dosing (50-100 mg/i influent) . Moreover, denitrif-
ication ability was found to improve in the single stage reactor . Bet-
tens attributed the increased stability of the nitrification/ denitrifi-
94
complete and
cation system to the "high concentration of nitrifying organisms
attached to the carbon particles".
In treatability studies of chemical production wastewaters,
Leipzig (1980) reported that stable nitrification efficiencies were pos-
sible in PAC pilot reactors operating at high NCRT ; whereas nitrifica-
tion was found to be variable and less efficient in parallel non-PAC
reactors . The major portion of this study was divided into two test
periods devoted to testing the effect of hydraulic retention time (H8T)
and carbon dosage on nitrification efficiency . A general increase in
nitrification efficiency with H8T and carbon dosage was noted in the
first test period, however, this relationship deteriorated during the
second test period . Nitrification was found to be most efficient in a
reactor operating at an intermediate HRT (2 days) and carbon dose (167
mg/l influent) in the latter period . In all cases, the PAC reactors
outperformed the parallel control reactors in terms of nitrification
efficiency. Leipzig suggested that this was due to the adsorption of
inhibitory compounds and/or nitrifier attachment to the carbon surface .
In the same report, Leipzig performed additional experiments on
PAC-AS reactors to examine the effects of cold temperature and equalized
and unequalized wastewater feed over an extended period of time . A tem-
perature shock from 22• C to 7 0 C over 24 hours resulted in the complete
cessation of nitrification within 16 days ; whereas nitrification in a
similarly operating reactor gradually subjected to the same temperature
decrease over 90 days was unaffected . In two separate experiments, con-
ducted in series over an eleven month period, a PAC-AS reactor achieved
95
an average nitrification efficiency of 97% with equalized wastewaters as
feed compared to 82% with unequalized wastewater . Unfortunately, the
latter series of experiments are less convincing evidence for PAC
enchanced nitrification since no control reactor was operated for the
purpose of comparison .
Specchia and Gianetto (1984) recently demonstrated increased
nitrification/denitrification capacity due to PAC addition in a full
scale industrial plant treating dye-works wastewater . Their comparisons
were based on 'before and after PAC addition" to the aeration basin (800
mg/i reactor concentration) over a four month period . The investigators
suggested that observed results were due to either low disssolved oxygen
concentrations at the bottom of the aeration basin created by PAC addi-
tion or to the high concentration of nitrifying-denitrifying bacteria on
the carbon surface .
In summary, previous reports have provided strong evidence
indicate that the addition of PAC can result in improved nitrification,
especially under "stressful conditions" such as low temperature and/or
the presence of inhibitory compounds . Although mechanisms such as
adsorption of toxic compounds and preferential surface growth have been
suggested for explaining PAC enchanced nitrification, no studies have
attempted to define the mechanism by which the enhancement phenomenon
occurs .
96
Proposed Mechanisms for SAC-Enhanced Nitrification
Various mechanisms for explaining PAC-enhanced nitrification have
been proposed . All are possible and in fact it is quite difficult to
disprove any mechanism, or to show that one mechanism is dominant . The
following sections describe proposed mechanisms .
Adsorption of Inhibitory Compounds
As shown previously many compounds inhibit nitrification . Some of
these compounds are biologically resistant while others are resistant
as well as highly adsorbable by activated carbon . Therefore, it is
likely that the presence of activated carbon protects the nitrifiers
from the adsorbable compounds . Evidence to support this theory was
demonstrated to a limited degree in the previous work of Stenstrom and
Grieves (1977) in that non-adsorbing suspended solids added to the reac-
tors did not enhance nitrification. However, one could argue that the
same carbon characteristics which promote adsorption of organic com-
pounds also promote attachment of nitrifying bacteria .
Preferential Microbial Attachment,
In the early days of anaerobic digestion it was thought that
suspended solids, in the form of an inorganic inert material such as
soda ash or calcium carbonate, were required as a medium to grow the
anaerobic bacteria (Buswell and Hatfield, 1939) . This theory may have
also been applied to nitrifiers because the earliest isolations of nit-
rifiers in pure culture were always made on precipitates such as calcium
97
carbonate (see Nutritional Requirements) . This theory applied to anaero-
bic digesters still has its followers today, and inert materials
(' igestaid") are frequently added to "sour" or "stuck" digesters .
The existence of surface area in the mixed liquor may promote
stronger floc-organism associations which retain the nitrifying organ-
isms longer in the activated sludge reactor .
Enhanced Bioactivitv
It has been proposed that activated carbon may actually concen-
trate trace elements or nutrients at its surface which may stimulate
microorganism growth. There is very little experimental evidence to sup-
port this theory, but it is plausible . For example, it is known that
some inhibitors, such as thiourea, inhibit nitrification by complexing
free copper, effectively "starving" the organisms of copper . The pres-
ence of carbon may provide a mechanism of overcoming this type of inhi-
bition.
Bioregeneration
'Bioregeneration" is a term which is being used by some research-
ers to describe the synergism which is often observed in PAC reactors .
Various researchers have noted that for certain cases a PAC reactor
removes an organic compound more efficiently than would be expected from
either adsorption or biodegradation alone . Explanatory theories have
been proposed which require that the compound first be adsorbed to the
carbon surface, making it available to the microorganisms at higher
98
concentrations than would be expected in the mixed-liquor, thereby
stimulating biological growth .
This theory is questionable, since it is not known whether the
adsorbed compounds are actually available to the microorganisms . Furth-
ermore the theory's applicability to enhanced nitrification is even more
questionable, since adsorption of ammonia at the pH and concentration
found in wastewaters is negligible ; however, it has been shown that cer-
tain amino acids and growth factors required by nitrifying bacteria need
not be synthesized by the cell if they are present in solution because
they can be transported through the cell walls (Clark and Schmidt, 1967 ;
Delwiche and Finstein, 1965) . This is in direct contradiction to the
known strict chemoantotrophy metabolism of the nitrifying bacteria and
the phenomenon is not well-documented or accepted (Ida and Alexander,
1965) however, if true, carbon could be stimulatory to the nitrifiers by
concentrating these growth factors and making them more available .
Bioregeneration may also be important in the acclimation of hetero-
trophic microorganisms to certain slowly biodegradable inhibitors of
nitrification. Once adsorbed, these compounds are in contact with the
biomass for a length of time equal to the system's NCRT. This would
allow more time for heterotrophic acclimation and ultimately for the
removal of nitrifier inhibition .
The various mechanisms discussed are all realistic ways of
explaining carbon-enhanced nitrification . The most plausible is the
adsorption of toxic organics theory based upon the previous work, but
other theories may still be important .
9 9
CHARACTERISTICS OF ACTIVATED CARBONS,
There are various ways of describing activated carbons . These
methods have arisen over the years from operational tests performed by
various industries using carbon in manufacturing processes . Many of the
tests are strictly empirical, while other are based upon isotherm
results . The need for tests to describe carbon arises because manufac-
turing techniques and carbon sources vary considerably, producing car-
bons with very different properties and activities .
the various tests resulted because industries have rather special needs
which can only be quantified by specific tests . Carbons tend to be clas-
dsified by the test results .
Two broad classifications are granular and powdered . Granular car-
bons generally are retained by 40 mesh or smaller screens, while
powdered carbons generally pass 100 mesh screens . The mesh size is an
indicator of the distribution of surface area available to adsorption .
granular carbon has the vast majority of its surface area in the inter-
stices of the particle, while the majority of powdered carbon's surface
area is on or near the particle's true outside surface . This distribu-
tion of areas affects kinetics, and powdered carbon is used in applica-
tions which require the most rapid rates of adsorption . An example is
in potable water treatment where powdered carbon is added to floccula-
tors and mixers and subsequently removed by filters . The contact time
for removal in this application is quite short, thereby requiring rapid
reaction rates for efficient operation .
100
The proliferation of
Isotherms
Isotherms are the most common way of describing the ability of
carbon to adsorb a chemical substance . There are several types, but the
most commonly used are the Langmuir, Freundlich, and the Branauer,
Emmett, and Teller (BET) isotherms .
Lanamuir
The Langmuir isotherm is based upon physical adsorption theory and
is described as follows :
Q b Ccqe = (1 + bCe )
where :
qe = adsorbed material (mass material/ mass carbon)
Q = maximum value of q as Ce approaches -
Ce= equilibrium concentration of the material (mass/volume)
b = experimentally determined constant, equaling the rate constant
for adsorption divided by the rate constant for desorption .
To estimate the values of Q and b, the isotherm is frequently plotted in
"linearized" form, as follows :
1
=
1 Ce +e b
~
101
(41)
(42)
This equation can be plotted as a straight line if9
is plotted againste
1C
The slope of the best-fit straight line through the data points is'
e
Qib and the intercept is Q. This is the commonly accepted method of
parameter estimation for this isotherm and others (with modification of
the linearized equation) . However, it has been shown that the use of the
reciprocal form biases the data and parameter estimates, which is the
same problem encountered with the estimation of growth kinetics parame-
ters. Fortunately, adsorption data are usually easier to collect than
biological growth data, and a variety of computer-aided parameter esti-
mation techniques are available (Sweeny, et . al . 1982) .
Freundlich Isotherm
The Freundlich Isotherm is an empirical isotherm which makes it
-less desirable from a theoretical viewpoint, but it often describes the
experimental isotherm more accurately . For this reason it finds more
frequent application in environmental engineering . The isotherm is
described as follows :
where
K andn
are experimentally described parameters .
The linearized form of the isotherm is as follows :
ln(ge ) = ln(K) + a ln(C,)
(43)
(44)
This equation is very easily plotted as a straight line on log-log
graph paper, with the slope of the best fit line approximating 1. Ton
define K one must also define the units of Ce . For environmental
102
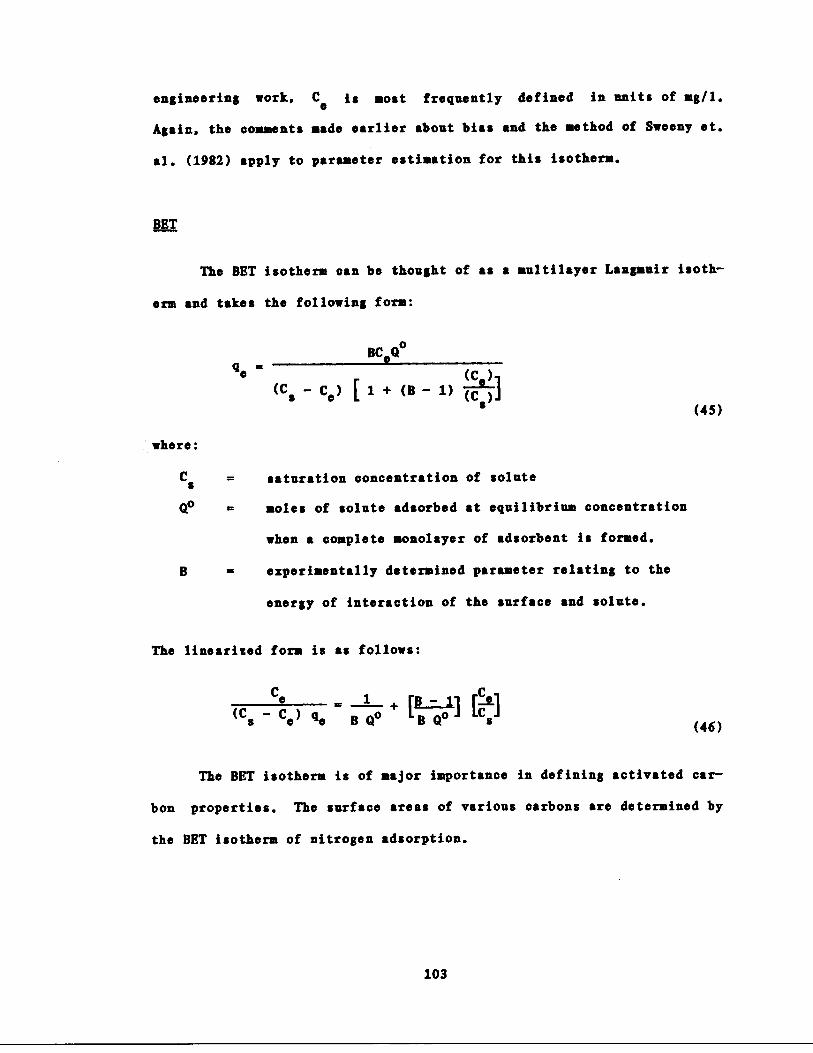
engineering work, Ce is most frequently defined in units of mg/1 .
Again, the comments made earlier about bias and the method of Sweeny et .
al . (1982) apply to parameter estimation for this isotherm .
BET
Qo
The BET isotherm can be thought of as a multilayer Langmuir isoth-
erm and takes the following form :
BCeQ•qe
=
(C )
(Cs - Ce ) [ 1 + (B - 1) (Ce )s
saturation concentration of solute
soles of solute adsorbed at equilibrium concentration
when a complete monolayer of adsorbent is formed .
B
=
experimentally determined parameter relating to the
energy of interaction of the surface and solute .
The linearized form is as follows :
=
(B -
1C
(Cs - Ce ) qe B Q• +LB Q• J ICs'
The BET isotherm is of major importance in defining activated car-
bon properties . The surface areas of various carbons are determined by
the BET isotherm of nitrogen adsorption .
103
(45)
(46)
Specific Indicators of Carbon Properties
As mentioned previously there are many indicators of carbon effi-
cacy. The commonly used ones are tabulated as follows :
1 . EST specific surface area : The BET surface area, usually reported
as m2/g carbon, is calculated from the adsorption of N2 . The sur-
face area can be used to directly compare carbons ; however, the
adsorption of compounds on different carbons is usually not the
same, resulting in different quantities adsorbed per unit of sur-
face area .
2 .
Pore volume : The pore volume is usually reported in om3/gram and
0is usually reported for two pore sizes : less that 15 A and greater
0than 15 A . The volume of larger pores is important when trying to
remove contaminates with greater molecular weights .
3 . Phenol Num er : The phenol number is primarily used in water treat-
meat to evaluate a carbon's potential for removing phenol from
drinking waters (phenols form chlorophenols_during disinfection by
chlorine ; therefore it is highly desirable to remove phenols prior
to chlorination in order to reduce the health effects and taste
and odor problems associated with chlorophenols) . The phenol
number is amount of carbon in mg/l required to reduce a phenol
solution from 100 micromoles/1 to 10 micromoles/1 in 30 minutes .
4 .
Iodine number : The iodine number is the amount of iodine, in mil-
ligrams, adsorbed per gram of carbon when the equilibrium concen-
104
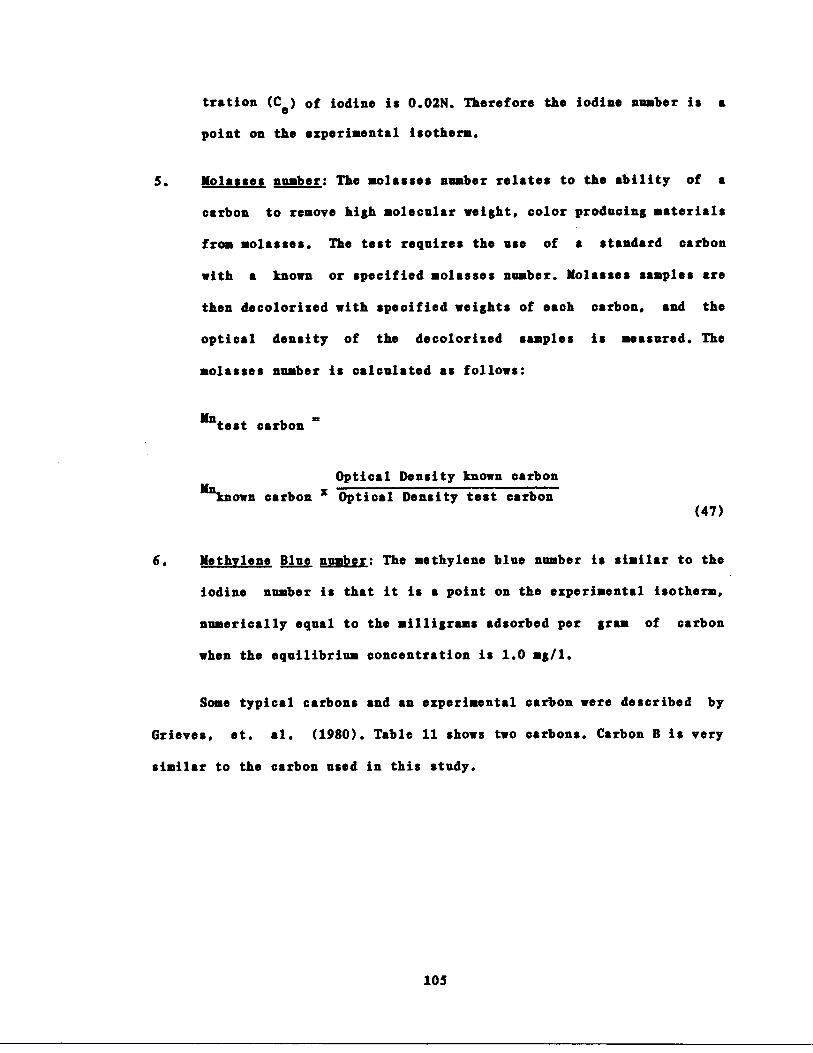
tration (Ce ) of iodine is 0 .02N . Therefore the iodine number is a
point on the experimental isotherm .
S . Molasses number : The molasses number relates to the ability of a
carbon to remove high molecular weight, color producing materials
from molasses . The test requires the use of a standard carbon
with a known or specified molasses number . Molasses samples are
then decolorised with specified weights of each carbon, and the
optical density of the decolorized samples is measured . The
molasses number is calculated as follows :
test carbon
Optical Density known carbon
-known carbon x Optical Density test carbon(47)
6 . Methylene Blue number : The methylene blue number is similar to the
iodine number is that it is a point on the experimental isotherm,
numerically equal to the milligrams adsorbed per gram of carbon
when the equilibrium concentration is 1 .0 mg/1 .
Some typical carbons and an experimental carbon were described by
Grieves, et . al . (1980) . Table 11 shows two carbons .
similar to the carbon used in this study .
105
Carbon B is very
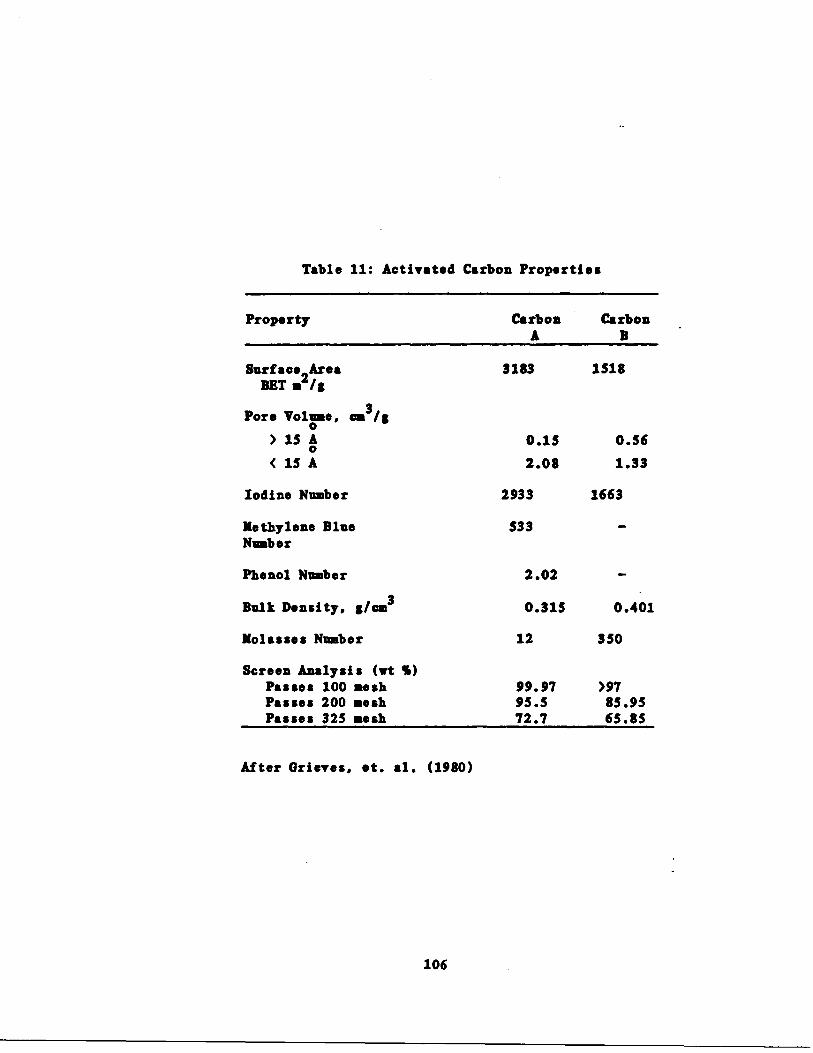
Table 11 : Activated Carbon Properties
After Grieves, et . al . (1980)
106
Property CarbonA
CarbonB
Surface AreaBET a2/g
3183 1518
Pore Volume, ca3 /8> 15 0 0 .15 0 .56
< 15 A 2 .08 1 .33
Iodine Number 2933 1663
ethylene BlueNumber
533
Phenol Number 2 .02 -
Bulk Density, g/ca3 0 .315 0 .401
Molasses Number
Screen Analysis (wt %)
12 350
Passes 100 mesh 99.97 >97Passes 200 mesh 95 .5 85 .95Passes 325 mesh 72 .7 65 .85
Adsorption Characteristics of Various Organic Compounds
In order to determine the candidate nitrification inhibitors, a
search was made of adsorption characteristics of various organic com-
pounds . These were later matched with the nitrification characteristics .
Table 12 shows the results of the search . The values reported are gen-
orally Freundlich isotherm coefficients, although some are qe values at
specified equilibrium concentrations . Care should be taken when using
these results . Many of the results are contradictory or quite variable .
Some of the variability is probably due to the method of estimating In
and Y. Also many of the references cited are for review papers of hand-
books ; the original source should be consulted prior to using the
results from this table .
107
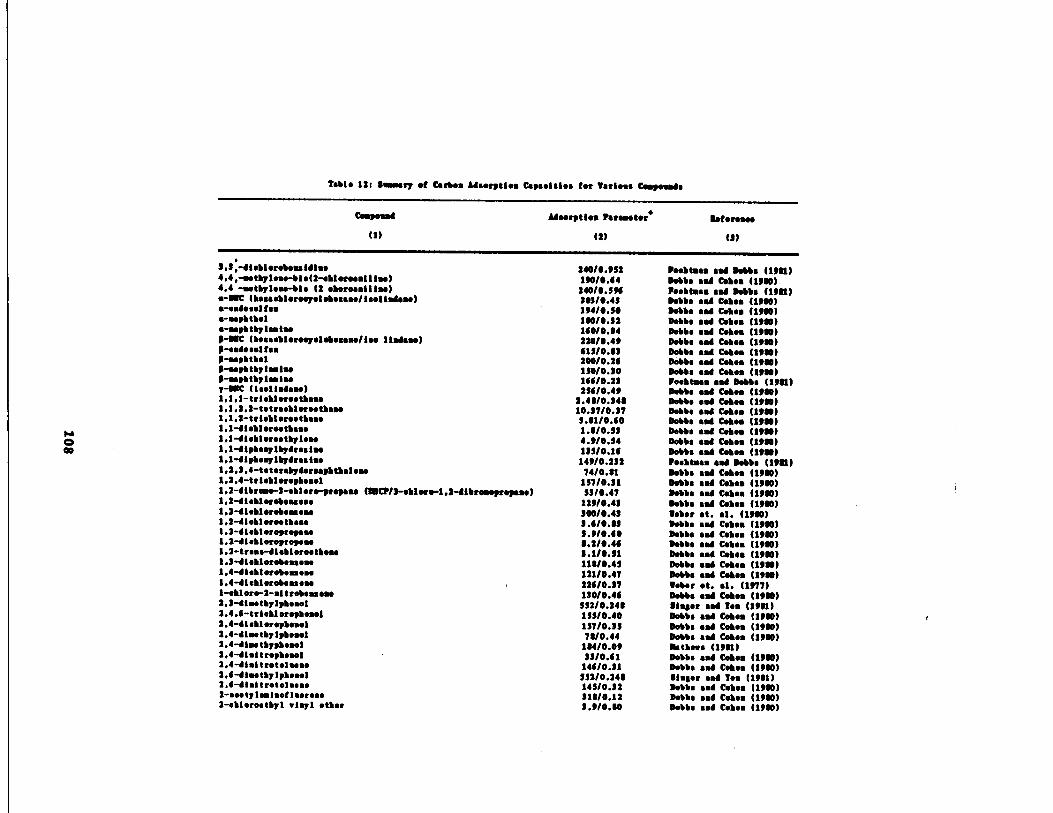
Table 125 Ovary of Carbon A4sorptls Capasities for Various Compounds
r
(1)
Adsorption Parameter+
(2)
Roter.s.
I1)
1.1,-diHlerele.aldl .e 240/0 .152 Owht.ss and Dome (1101)4.4,-.style..-bie(2-ebleree .lllu) 130/0 .44 Dobbs sad Cokes (1300)4.4 -..tylese-fl . (2 shoreesliis.) 24010.5% peeht .a s ad Dokls (1301)-IOC (lessellores)elok.asse/is.lldsso) 103/0 .41 Dokls and Cokes (1300).-.d.s.lfns 134/0 .50 Dobbs sad Cokes (1300).-wpltlel 10010 .32 Dolls sad Cohen 41300)o-wpltyls .iso 160/0 .14 Dolls sad Cohen (1300)3-UC (l.aseller.elelMeasa/is. 1td.s.) 22010 .43 Dolls sad Cokes (1300)- e.les.lfaa 415/0 .01 Dolls and Cokes (1000)/-..pltl.l 200/0 .26 Dolls sad Cokes (1000)3-.spbtyl ..lso 150/0 .10 Dobbs Sad Cohen (1300)/-.splityl . .ls. 166/0 .21 Roelt..m sad Dobbs (1301)7- 011C (I .elld..e) 256/0 .43 Dolls Sad Cohen (1300)1 .1 .1-tri.uero.tlas. 2.4010 .140 Dobbs sad Cokes (1300)1 .1 .2 .2-totrsoklersetless 10.17/0 .17 Dells sad Cokes (1900)1 .1 .2-trieblore.t h ..e 5.11/0 .60 Dobbs sad Cobs. (1300)1.1-dIoklero.thas. 1 .0/0 .51 Dolls sad Cohen (1300)1.1-diokt .r.etyles. 4.3/0 .54 Dobbs and Cokes (1300)1.1-41Nsaylydrsls. 115/0 .16 D bbs sad Cokes (1300)1,1-d 11leglydrea Ise 143/0 .212 peelt.as and Dobbs (1o01)1 .2 .3 .4-t.tersyder.pltlalew 74/0 .01 Dolls sad Cohen (1300)1 .2 .4-trl .hlereph.sel 157/0.11 Dolls end Cokes (1300)1.2-dilre. .-l-sllero-3r.pw (10Q/1-ellers-l.2-41lre.yrepw) 13/0 .47 Dobbs sad Cohen (1300)1 .2-di .llerok.sse.e 123/0.41 Dolls Rod Cokes (1300)1, 2-dlellerNess .se 100/0.41 t.lor .t . al . (1000)1 .2-Ilell .r..tls.. 1 .6/0.11 Dolls Bad Cohen (1300)1 .1-dtsbI.rgr.pse 5.3/0.60 Dells sod Cok.. (1300)1.2-dlellerejropse 0.2/0.46 Dells sad Cohen (1300)1 .2-tress-dlellereethew 1.1/0.11 Dobbs sad Cehos (1300)1,1-61 ell ersb..aew 110/0.45 Dolls and Cohen (1300)1 .4-llellerelessess 121/0 .47 Dells sad Cokes (1300)1.4-diehloroleueso 226/0 .17 O.ler .t. al . (1077)1-.lloro-2-sitrobsses 110/0 .46 Dobbs sad Cokes (1300)2.1-4i .otylplewl 552/0 .240 Sister and Too (1301)2.4,6-trlehleroplesel 111/0 .40 Dolls sad Cobs (1300)2.4-dielleroplese1 117/0 .11 Dolls sad Cokes (1300)2.4-dlstlplph .sol 70/0 .44 Dobbs sad Celts (1300)2."i.typlewl 104/0 .03 Mothers (1301)2.4-dl .itreplesol 11/0 .41 Dolls and Cohen (1300)2.4-dIaltretels.se 146/0 .31 Dolls and Cohen (1300)2.6-d iw ty l ph. .el 152/0 .241 Sister sad 7.. (1301)2.4-41 .ltretolse .e 145/0 .12 Dobbs sad Celts (1300)2-seetyla.i.ofl.etose 110/0 .12 Dolls and Cokes (1300)2-elloroetyl vinyl ether 1 .3/0 .00 Dobbs sod Cobs (1300)
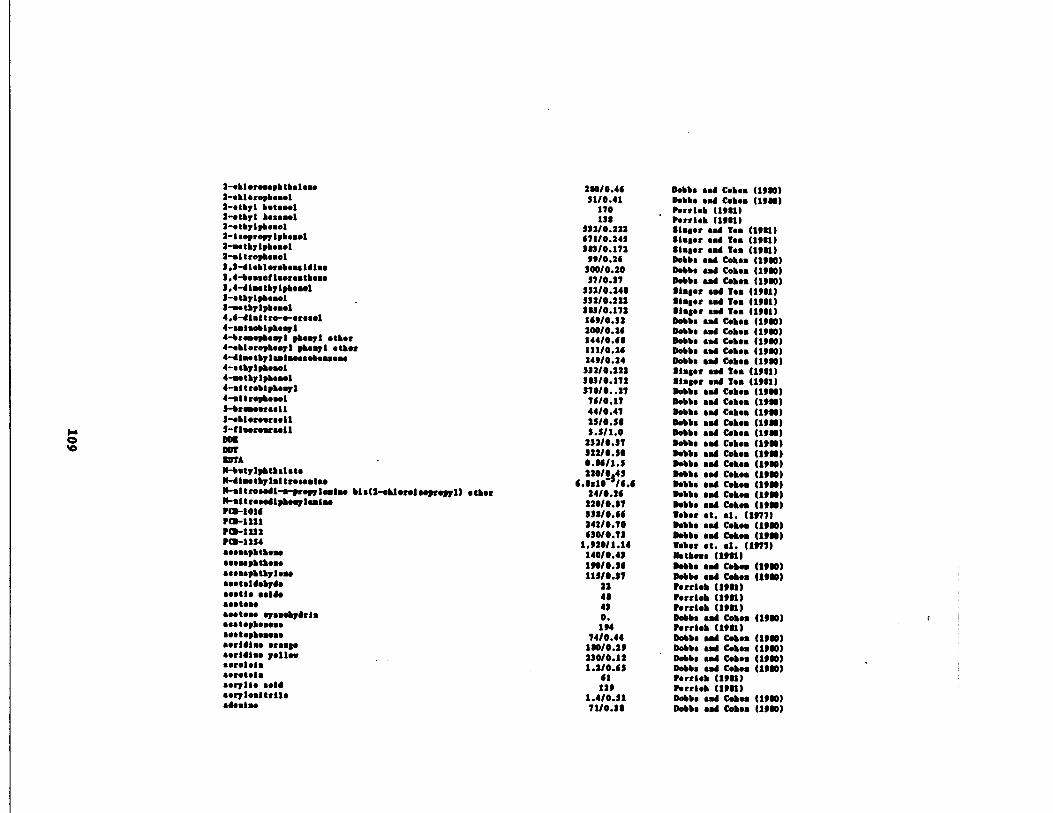
2- .bl .r.sspbtbal.a . 200/0 .46 Dobbs and Cokes (1900)2-sbl .ropb . .ol S1/0 .41 Dobbs ..4 Cob.. (1900)2-otyl b .ta..l 170 p.rrl.b (1901)2-.tyl b.ra.ol 130 Parrish (1901)2-.tbylpb.sel 31210 .222 Sister sad 7. . (ton)2-is.preplpb.a.1 671/0 .245 sister sad r. . (1981)2-..tylpbosol 303/0 .172 Sister and To . (1981)2-sitr.pb.s .l 99/0 .26 Dobbs wad Cokes (1900)2 .1-d1 .bl .r.l..sldla. 30010 .20 Dobbs sod Col .. (1900)3 .4-b.ssotl.ersstb .s. 57/0 .17 Dobbs ash C.hes (1900)1 .4-61 ..tylpb.ul S3210 .24$ lisp., sod 1.. (1981)1-.tylpb. . .l $32/0 .222 Sister sad 1.„ (1901)3-s.tylpb .s.l 303/0 .172 Sister and T.„ (1o01)4.6-6i .itro-o-a ...l 169/0 .12 Dobbs ad Cobs (1900)4-olaebipb ..pl 200/0 .26 Dobbs a.6 Cokes (1900)4-bra.epb.gl phosyl other 144/0 .66 Dobbs sod Cokes (lose)4-.blorepb.sgl phosyl other 111/0 .26 Dobbs ad Cobs (1000)4-41..tyIsmlsoasol .ss . .s 249/0 .24 Dobbs and Cobs (1900)4-s tylpb..ol 532/0 .222 linger sad 7.a (ion)4-s. ty lpb . .el 303/0 .172 1I. .r sad 7.s (1901)4-.l trsbipb.gl 370/0 . .27 Dobbs and Cokes (1900)4-sttropb..ol 76/0 .17 Dobbs and Cokes (2900)5-br ....r../1 44/0 .47 Dobbs sad Cole . (1900)5-.bla.ar . .tl 23/0 .50 Dobbs ad Cohes (1900)3-lls.r.araell 5.3/1 .0 Dobbs sod Cokes (1900)ODD 232/0 .37 Dobbs sad Cokes (1900)DO? 322/0 .50 Dobbs sad Cohen (1900)IOTA 0.04/1 .5 Dobbs sod C.hes (1900)M-b.tylpbtbalot . 220/0 45 Dobbs sod Cokes (1o00)M-di..tylaltr.saslso 6.8218-5/6 .6 Dobbs sod Cokes (1900)N-.ltre.dl-.-pr.pls.lso bt .(2-oblonloepreyl) other 24/0 .26 Dobbs sod Cobs (1900)11-sltr.sdlph.glssls. 220/0 .17 Dobbs ant Cokes (1900)p1-1016 110/0 .66 W.ber .t. al . (1977)PO-1221 242/0 .70 Dobbs sod Cokes (1900)PC0-1232 630/0 .73 D bbs sod Cobs (1900)PCB-1254 1 .02011 .14 Veb.r et . al . (1977)s..aaphth.s. 140/0 .43 wtb.e. (1901)a ..sapbtb.s. 190/0 .16 Dobbs and Coh.s (1900)sa...pbtyl.p 113l0 .37 Dobbs and C b.s (1000)a..tsideb76. 22 Parrish (1901)...tie aside 40 P.rrlob (1981). ..I ... 43 Parrish (Ion).1.1 ... q.soydrls 0 . Dobbs ad Cob .a (1900)
ra.,topb.as. 194 Parrish (1081).. . t .pb . .oso 74/0 .44 Dobbs sod Cokes (1900)a.ridi .. .rasps 100/0 .29 Dobbs sad Cobs (1900)s.r141 .o yellow 230/0 .12 Dobbs sod Cobs (1900)s .r .l.ls 1 .2/0 .65 Dobbs sod Ceh.s (1900)s.r.tols 61 p.rri.b (loll)a.ryll . s.14 129 hrrl.b (1901)s.ryleattrll . 1 .4/0 .31 Dobbs and Cokes (2200)d..1.. 71/0.30 Dobbs and Cohen (ion)
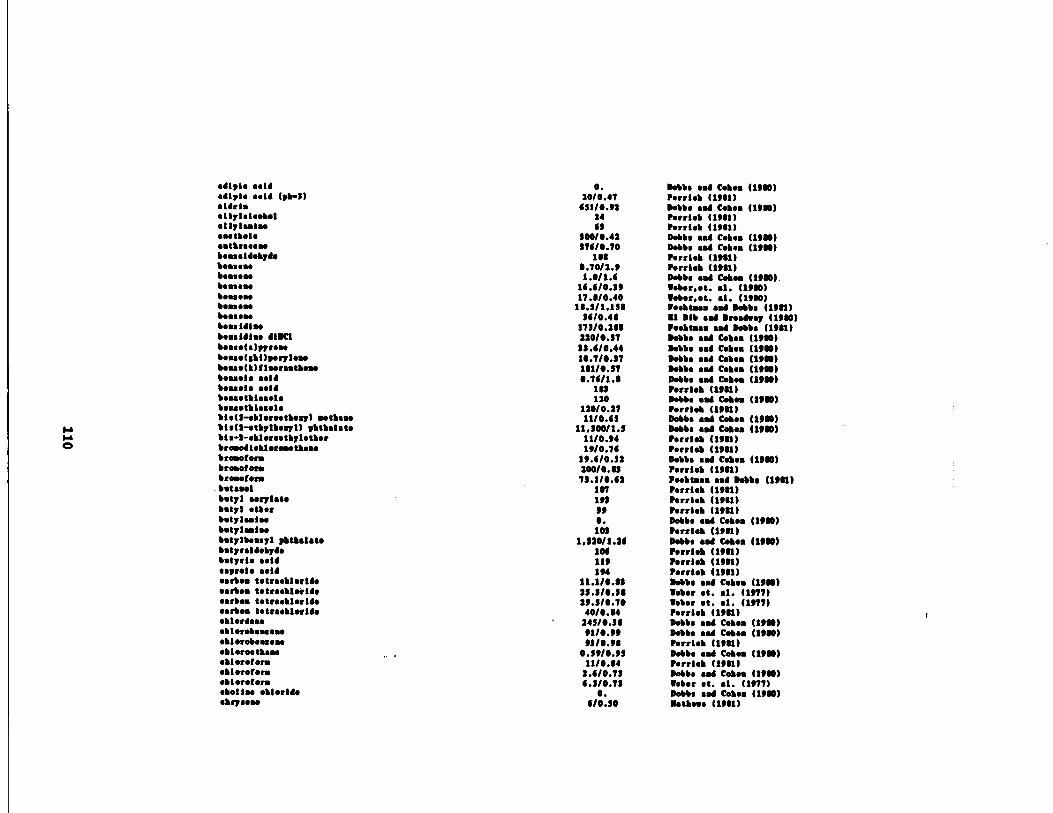
r
adiple sold 0 . Dobbs Bad Cokes 11900)earls said (pb-3) 2010 .47 lorrlob (1901)oldrla 451/0 .92 Dobbs sad CNes (1900).li7l .l .obel 24 hrrleb (1901).1l7/r1" 43 hrrleb 41901)s"tbol* $0010 .42 Dobbs and Cokes (1900)satbrseese 374/0 .70 Dobbs Bad Cobs& (1900)besasldebydo 10$ Parrish (1911)boons" 0.7012 .9 hrrleb (1901)bane" 1.0/1 .4 Dobbs BM Cokes (1900) .bosses* 14 .4/0 .39 tder,et . a1 . (1900)bases" 17 .0/0 .40 tober,et . al . (1900)beuose 10.511 .1!0 9o .kt.B& sad Dobbs (1911)bass." 34/0 .40 11 bib sad Broadway (1910)ban ldl" 173/0 .200 leebt.ss and Dobbs (1911)beasldla. dIMC1 220/0 .37 Dobbs sad Cokes (1900)besse(s)l7ro.e 33 .4/0 .44 Dobbs Bad Coboa (1900)beue(Ob()leylo" 10.7/0 .37 Dobbs sad Cokes (1900)b.uelt) tl"rsotbe" 101/0 .57 Dobbs and Cobs. (1900)beaself sold 0.74/1 .0 Dobbs sad Coboa (ills)b.uele soldbossetblssole
In120
Porrlob (1911)Dobbs Bad Cokes (Ion)
bessotb l .sel e 120/0 .27 lerrleb (1981)ble(2-ablersotboay) sot.s 11/0 .45 Dobbs sad Cokes (Ills)blo(2-stbylbeyl) 9btbslsts 11 .30011 .1 Dobbs and Cokes (1980)bi.-2-oblecsotbyletbsr 1110 .94 hrrleb (1901)bre.odlsblere.etba" 19/0 .74 hrrleb (1901)bresaterm 19 .410 .52 Dobbs sod Cohes (1900)breasts= 20010 .13 hrrleb (1911)bra.otorm 73 .1/0 .42 Pastimes Bad Dobbs (Ion)b.tuuel 107 rarrleb (1911)butyl saylste 193 Parrish (1901)butyl sitar I9 hrrleb (1981)batylaslss 0 . Dobbs and Coboa (Ills)b*tyl..ls, 101 hrrleb (1911)b.tylb..syl phthalate 1,320/1 .34 Dobbs sad C.ben (1980)b.tyraldebydo 104 rarrleb (1111)batyrl . sold 111 hrrleb (1911)asprolo sold 194 P.rrl.b (2901)garb" tetrs .blerldo 11.1/1 .88 Dobbs sad Cobs* (1980)earboa totroebletlde 25.110.31 teber at. al . (1977)sarbes totrs.blerldo 29.5/0.70 tabor et . al . (1977) Brbes t .treeblorlde 40/0 .04 Perrlab (1901)sblerdss, 24510 .30 Dobbs sod Coboa (1100)ebloreb.eeo.e 11/0 .99 Dobbs and Cobs& (1980)ebloreb.a s." 1310 .91 lorrl .b 1!951)eblere .tb." 0 .59/0 .93 Debts sad Cobs. (Ion)ebl.retorm 11/0 .04 hrrleb (1911)obloreterm 2.4/0.71 Dobbs Bad Cokes (Ion)obloreter. 4.3/0.73 tabor et . al . (1977).toll" oblerlde 0 . Dobbs Bad Cobs& (1980)abys." 4/0.50 „otbeas (1911)
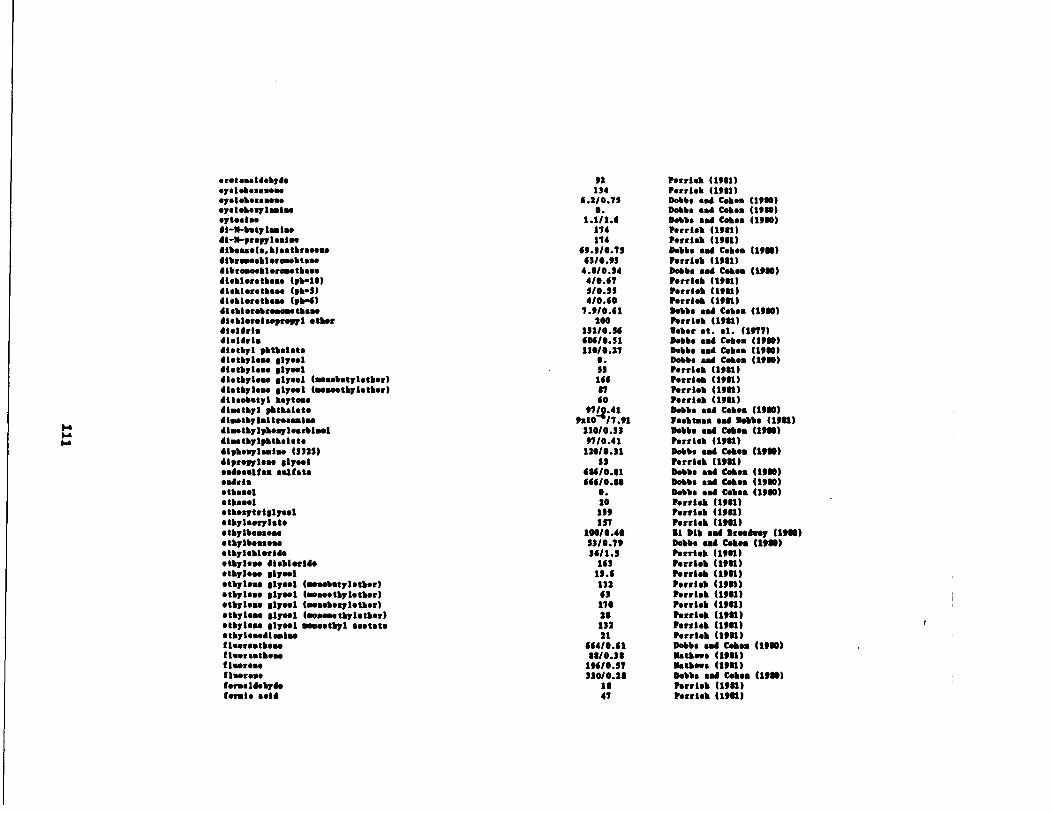
.rot ..sl4.yde 92 Parrish (1911)
.7 .1 .hos..o.o 134 P.rrieb (1981)e7.lae 4 .210 .75 Dobbs s .4 Cues (1900)q.lokey1..IM 0 . Dobbs ..4 Cakes, (1900)gto.i.. 1 .1/1 .4 Dabs sad Coke* (1900)41-N-DutyIs. I.. 174 Parrish (ion)41-M-rrepl..i.. 174 Parrish (1981)4ibsse(s .h).stbr ..eu 69.1/0.71 Dabs .d Cokes (1900)4ibr..sobler ..obts. 4110 .01 T.rrish (1901)4/br.subl.r..oth .s. 4 .0/0 .14 Dobbs .d Cohs (1900)4isbl .r.th.se (9.10) 4/0.47 Parrish (1001)41.hlerethes. (91-1) 1/0 .11 Parrish (1901)6lebleretbau (01-4) 410 .40 Parrish (1911)6lebl.rars.e..tbss. 7 .910 .41 Dobbs sad Cokes (1900)4loklor .Isopro"l other 200 Parrish (Ion)41.14rI . 131/0 .54 Tabor .t . .1 . (1977)41.ldrls 604/0 .51 Dobbs sad Cokes (1900)4i.thyl phth .l.ts 11010 .27 Dobbs sad Coes (1900)4lethyleso slysel 0 . Dobbs and Cobas (low)6/et171 . .. $ly.el 11 Parrish (1001)4 1.tyl.se 0170.1 (sssob .tylotb.r) 166 Parrish (1911)diethyl...017..1 (.ose.tlnl .ther)dIlsob.tyl keyt...
n60
Parrish (ton)Parrish (1981)
41..tyl 01e1 .l.t . 97!1 .41 Dabs .d Coh .. (1900)N.ety l .i tres..lu 9210 17 .91 F.sbes.. .d Dobbs (19n)4i..thylphesyl ..rb1..1 210/0 .11 Dobbs sad Coks. (1900)6i..tylpbtbsla . 9710 .41 Parrish (1981)4ipb..71e.i.. (1125) 120/0 .11 Dabs sad cokes (1910)410roppleu 017..1 33 9.rrleh (Ion)ovidesulfam sulfate 606/0 .01 Dobbs sad Cobs . (1900)sdris 66410 .60 Dobbs .d Ceh.s (1990)eges.l 0 . Dobbs .d Cokes (1900)o tb ...l 20 Parrish (1901).th.gtri017..1 119 Parrish (1981)otyl.orylato 117 Parrish (1911)02171114 .ss.. 100/0 .40 al DID Sad Broadway (1900)tylbou.u, $310 .79 Dobbs and Cohe. (1900)
.tbylehlorido 14/1 .9 Parrish (Ion)otylsse dIebt.rldo 141 Parrish (1001)style.. 017..1 11 .4 Parrish (1911)otyl., slyssi (eu.eb.tyl.tb.r) 112 Parrish (19n)ahyl.s. 0171 .1 (.o.oetyl.tbor) 61 Parrish (1901)styles. 017..1 (.aub.glotb .r) 170 Parrish (1911)style.. 017..1 (ao.e..tyleth.r) 26 Parrish (1911)ethylene 017111 .sseothyl .estate 132 Parrish (1901)
rotyleu41..1.5 21 Parrish (1911)Il .ors.tboo 664/0 .61 Dobbs s4 Cokes (1900)fleer..tb... 00/0 .10 Makes (1901)I lure .. 19410 .37 M.th ..s (19n)I1..r... 110/0 .29 Dobbs sad Cokes (1900)forms ldoyde 10 Parrish (10n)bent. .aid 47 hrrlob (1911)
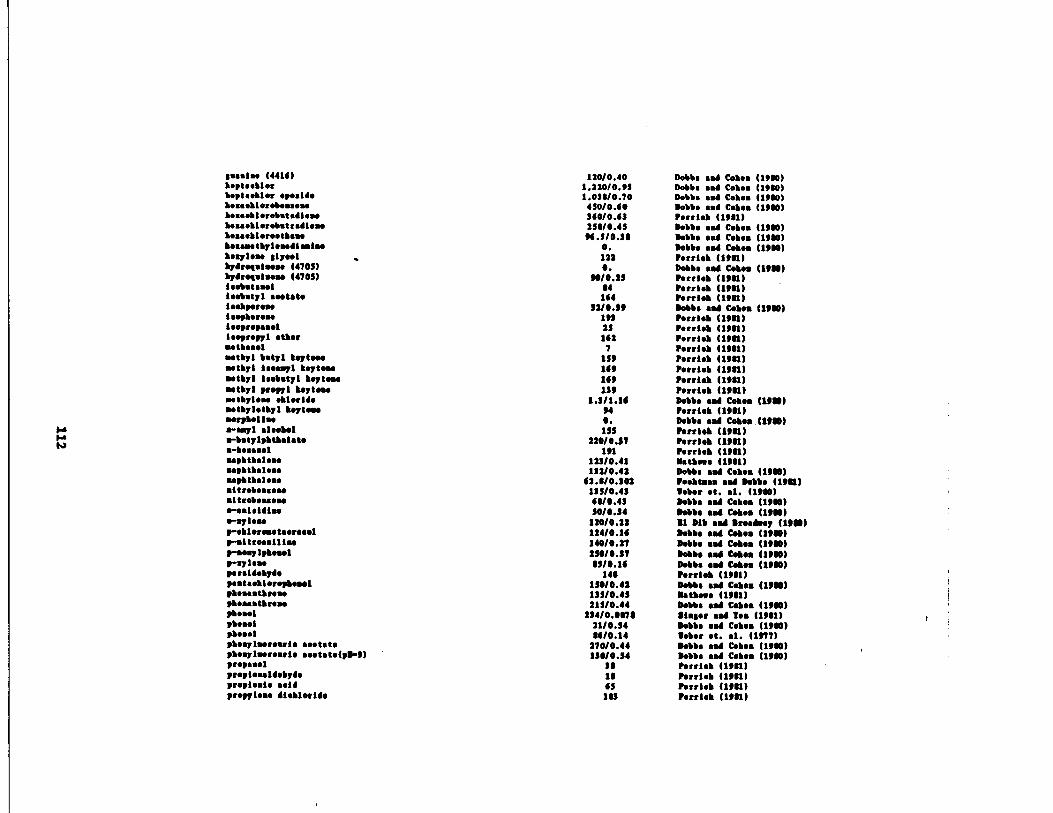
f
basis. (4414) 120/0 .40 Dobbs sad Coh.n (1100)b .pt . .hl .r 1 .220/0 .99 Dobbs sad Cohen (1900)b.pts .bl .r .paide 1 .010/0 .70 Dobbs sod Cobea (1900)h.asoblet .bess .se 450/0 .60 Dobbs sad Cokes (1900)b.as .bf.rebet .dieas !60/0 .61 Perri.h (1901)b.a. . b l .t.bstudf.ae 256/0 .45 Dobbs sad Cobs (1900)b .as .bl .r.etbsae 96 .5/0 .10 Dobbs *ad Cues (1900)b.assetylen.dl.slnm 0 . Dobbs sad Cob.a (1900)bsaylon. OIyNI 122 Pettish (1901)ydrgsls.s. (4705) 0 . Dobbs sad C.ba (19M)ydrg.ts.se (4705) 90/0 .25 Pettish (1901)is.bstsa.l 04 Pettish (1901)leshatyl se.tsto 164 pettish (1901)l ..bpr.a. 12/0 .19 Dobbs sad Cohen (1900)I s.q.r.so 191 pettish (1901)l . .pr.ps.l 21 Pettish (1901)f sgr.gl ether 162 ]Pettish (1901)U.Nsaol 7 Pettish (1901)s.tyl butyl keyte" 119 Petrl .h (1901)s‚tyl 1sss.( tgt.a" 169 Pettish (1901)s.tyl ts.bstyl koyt.a. 140 Pettish (1901)Mtyl 0r.p1 ksytMs 119 Pettish (1901)sayl.a. .bl.rlde 1 .1/1 .16 Dobbs sad Cob .. (1900)s.tyletyl b.gt.w 94 Pettish (1901)mrpb.llae 0 . Dobbs and Cobs (1900)a- ..yl al ..b.la-bstylpbtbslsto
ls$220/0 .17
Perrlsh (1901)l.rrieb (1901)
a-bass.( 191 Pettish (1901)agbtbsl.a 111/0 .41 Mathews (1901)asytbsl .a e 112/0 .42 Dobbs sad Cokes (1900)aghthol .s e 62.0/0 .102 ls.btsas sod Dobbs (1901)aftr.b.ss.s. 115/0 .41 Web.r .t . .1 . (1900).1trebesaea. 60/0 .41 Dobbs sad Cokes (1900).-saistdfa 50/0 .14 Dobbs and Cokes (1900)s-syl .n. 120/0 .22 I1 bib sad Broadway (1900)/- .hl.rs.t..r . ..l 124/0.16 Dobbs sad Cobs. (1900)p-sitresalt fp 140/0.27 Dobbs .ad Cokes (1900)$.q lph.n.l 2$0/0.17 Dobbs and Cokes (1900)0-q l ea. 05/0 .16 Dobbs and Cokes (1900)p.rsld.yd. 140 l.rrl.h (1901)9.stoebl.reph.aol 150/0.42 Dobbs sad Cebes (1900)ph.asstbres, 135/0 .45 Matbws (1901)ph.ssstbr.ss 215/0 .44 Dobbs and Cohen (1900)phew( 23410 .0171 11alor sad t'. . (1901)pb.set 21/0 .54 Dobbs and Cokes (1900)pb.sel 04/0 .14 O .b.r et . al . (1977)9begls.r.srfe s .ststo 27010 .44 Dobbs and Cshes (1900)pb.gls.rssrfo se.tae(9M0) 110/0 .54 Dobbs sad Cokes (1900)proposal 10 Perrieb (1901)prerfonsld.yde 1s Pettish (1901)propieale sold 65 Pettish (1901)proplese dfshl .rid. l6/ Pettish (1901)
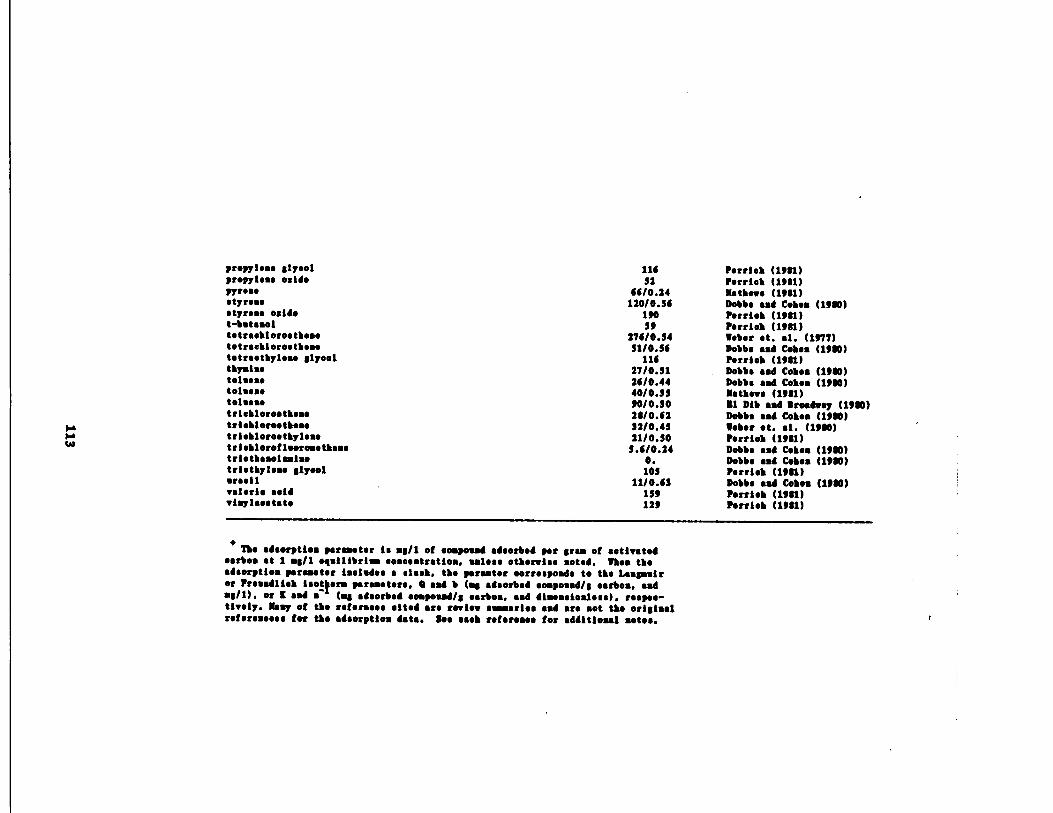
4 71e adsorpties parsaotor is a8/1 of sompeud adsorbed per gram of motivatedsarbes at 1 s8/1 equilibrium eosoestratioa, unless otherwise anted . Pben theadsorption parameter iseisdos a slash, the peraater eorrosponds to the Ls .Basiror prosadlisb loot term parameters . 4 sad b (q adsorbed eompoand/8 earboa, wadwell) . or [ and a (m8 adsorbed oempond/8 earboa, and dimessioaless) . rsspes-tively. Many of the refersses sited are review surarles and are sot the originalrefereseees for the adsorption data . too sash roferetee for additional totes . r
propplose glycol 116 perrish (1981)propylene oxide 52 perrieb (1981)"rose 66/0.24 Mathew$ (1981)styrene 120/0 .56 Dobbs and Cokes (1980)styress oxide 190 parrieb (1981)t-bstasol s9 parrieb (1981)tetraebloroetbese 276/0 .54 Weber at . a1. (1977)totraeblorootheas 51/0.56 Dobbs and Coben (1980)totreetbyleso elyeol 116 Parrish (1981)thyaiao 27/0.51 Dobbs sad Coben (1980)tolaese 26/0.44 Dobbs mad Cobes (1980)toluene 40/0.35 Mathows (1981)toisoso 90/0.30 31 Dib and Broadway (1980)triabloroetbene 28/0.62 Dobbs and Cokes (1980)trioblorootboso 32/0.45 Weber st . at . (1980)trlebloroetbylese 21/0.50 parrieb (1981)triobloroflsoroaetheas 5.6/0.24 Dobbs sad Cobea (1980)triotbasolamine 0 . Dobbs and Coben (1980)trlothylene glycol 105 parrieb (1981)arasil 11/0.63 Dobbs sad Cokes (1980)Valerie Reid 199 perrieb (1981)vinylseetate 129 perrieb (1981)
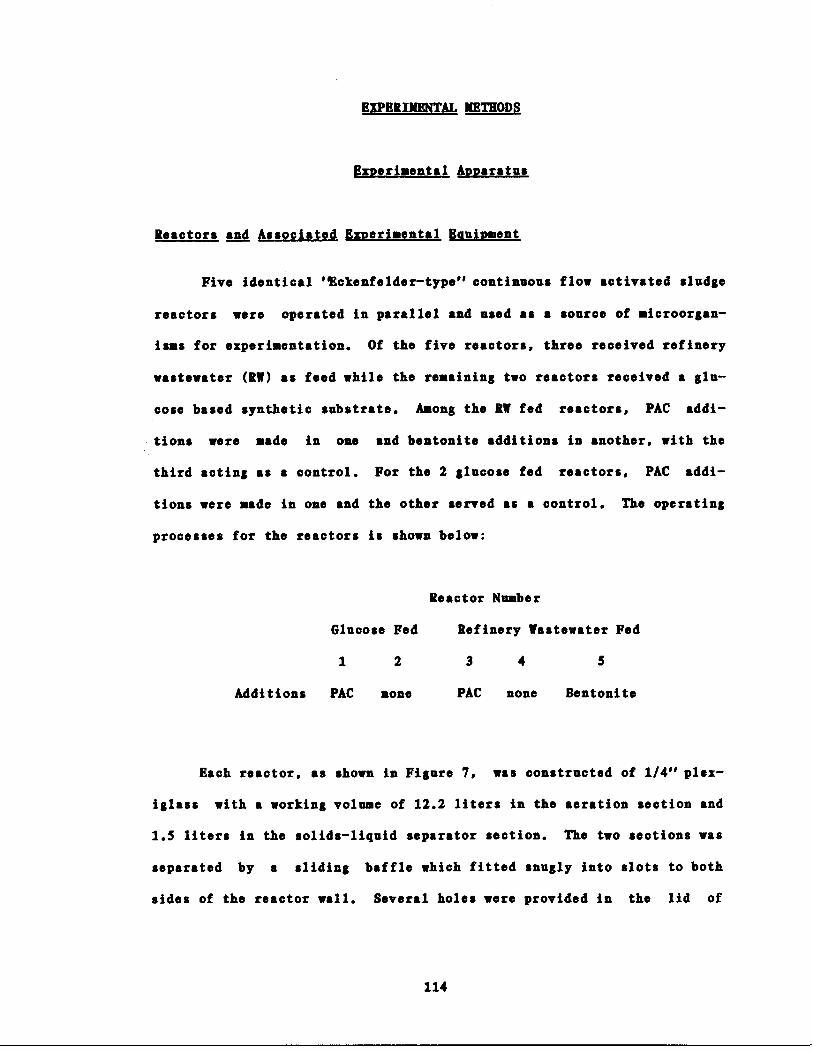
EXPERIMENTAL METHOD
ƒzoerimental Apparatus
Reactors an Associated Experimental Equipment
Five identical "Eckenfelder-type" continuous flow activated sludge
reactors were operated in parallel and used as a source of microorgan-
isms for experimentation . Of the five reactors, three received refinery
wastewater (RW) as feed while the remaining two reactors received a glu-
cose based synthetic substrate . Among the RW fed reactors, PAC addi-
tions were made in one and bentonite additions in another, with the
third acting as a control . For the 2 glucose fed reactors, PAC addi-
tions were made in one and the other served as a control . The operating
processes for the reactors is shown below :
Reactor Number
Glucose Fed
Refinery Wastewater Fed
1
2
3
4
5
Additions PAC
none
PAC none
Bentonite
Each reactor, as shown in Figure 7, was constructed of 1/4" plex-
iglass with a working volume of 12 .2 liters in the aeration section and
1 .5 liters in the solids-liquid separator section . The two sections was
separated by a sliding baffle which fitted snugly into slots to both
sides of the reactor wall . Several holes were provided in the lid of
114

Air
Air
Feed
Air
SIDE
TOP
pH probe
O
0
0
Effluent
12.2 liter
1 .5 liter
Aeration Zone
Settling Zone
Sludge Blanket
PlexiglassConstruction
wme Effluent0
Air
Feed
0
END
Figure 7 : Schematic of Reactor andAssoicated Apparatus
Air
Sampling Port
the reactor ; larger holes for a pH probe and access for maintenance pur-
poses and smaller holes for influent feed, base addition and air lines .
A port hole on the side of the aeration section was used to withdraw
mixed liquor for analysis and for the control of sludge age .
Air, which was added through diffuser stones located near the bot-
tom of the mixed liquor aeration section, provided oxygen for microbial
activity and growth as well as turbulence for mixing purposes . Airflow
rates, which ranged from 5 to 10 SCFH, were monitored independently in
each reactor by routing the air through a rotameter prior to its intro-
duction into the mixed liquor . Lower airflow rates were necessary at
times to control reactor foaming and higher flow rates were occasionally
required to provide adequate mixing . Even with the lowest airflow rates
used, the dissolved oxygen concentration in the mixed liquor was always
above a level (i .e ., 3 mg/1) that would be expected to limit the growth
of either heterotrophs or nitrifiers at this high MCRT environment .
The pH was maintained independently in each reactor at a range of
7 .0 to 7 .2 by means of either an industrial grade pH control unit
mmanufactured by Lees and Northrup or by a similar type unit manufactured
by Horizons, Inc . (Model 5997-20) . Each pH control system consisted of
a combination pH electrode (Orion model 34), immersed in the mixed
liquor, and a pH control unit with set point dials to control the action
of a pump for base addition . Whenever the pH would fall below a set
value, the base pump was actuated, delivering NaOH (1 .0 -2 .0 N) directly
into the aeration section to bring the pH back up to its predetermined
operating value .
116
Feed stems and Substrates
Glucose-Based Food Dilation $vstem
Due to the large quantity of glucose-based substrate required by
reactors 1 and 2, a dilution system was used whereby concentrated sub-
strate was automatically diluted before being pumped into the reactors .
The concentrated feed and a mixing reservoir was contained in a refri-
gerator at 100 C. A schematic of the dilution system is shown in Figure
8.
The liquid level in the mixing reservoir was electronically sensed
by two float switches which controlled both the concentrate feed pumps
to the reservoir and an external solenoid valve for the flow of dilution
tap water . The diluted substrate was pumped directly from the mixing
reservoir into the reactors using a separate pump system .
Glucose Substrate Composition
The substrate feed was composed of glucose, ammonia and other
nutrients required to support the growth of heterotrophs and nitrifiers .
The composition of the concentrated feed solution is shown in Table 13 .
The CaC1 2-KgCl 2 solution was separately pumped into the reservoir at
each dilution cycle . This was done to prevent the formation of calcium
phosphate precipitates in the concentrate . The pH of freshly prepared
feed concentrate was adjusted from 7 .9 to 7 .0 with concentrated HC1
prior to use . Fresh concentrate was prepared when required (usually 4-5
days) or when, in rare occasions, the concentrate appeared cloudy . This
117
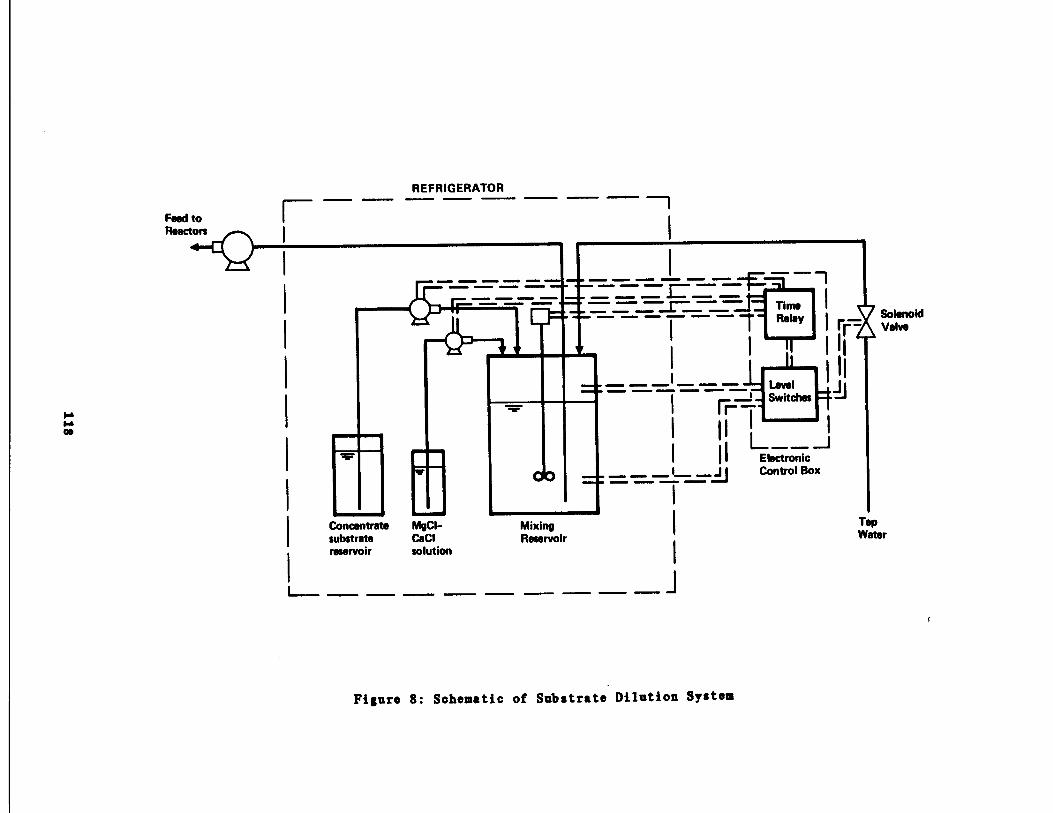
Feed toReactors
4 IQ
REFRIGERATOR
Figure 8 : Schematic of Substrate Dilution System
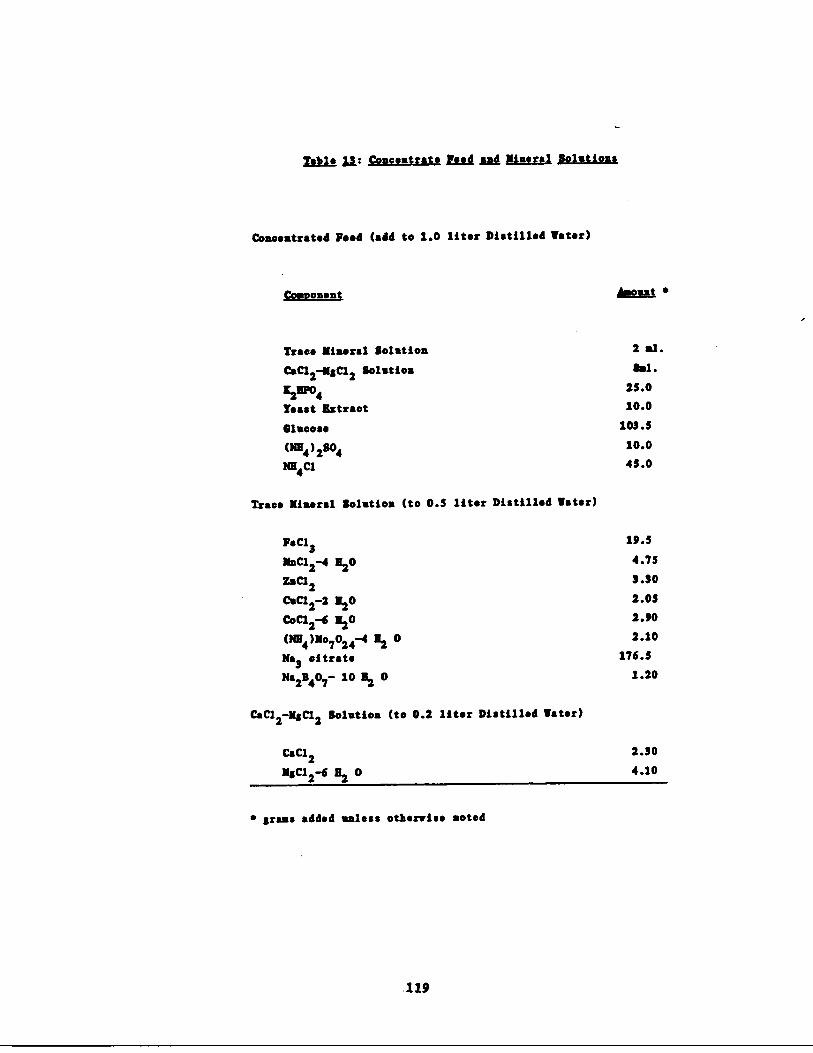
Table It : ,Concentrate Feed 1gd, Mineral Solutions
e grams added sales* otherwise noted
.119
Concentrated Feed (add to 1 .0 liter Distilled Water)
Conoonent Amount e
Trace Mineral Solution 2 a1 .
CaC12-M1C12 Solution M1 .
YP0425.0
Yeast Extract 10.0
Glucose 103.5
(1W4)230410.0
NH4C145 .0
Trace Mineral Solution (to 0 .5 liter Distilled Water)
FeCl3 19.5
MbC12-4 1204.75
ynC12 3 .30
CuC12-2 1202.05
CoC12-6 120 2.90
(N14 )M07024-4 12 0 2.10
No3 citrate 176.5
Na2B407- 10 12 0 1 .20
CaC12-MLC12 Solution (to 0.2 liter Distilled Water)
CaCl22 .30
MXC12-6 12 0 4 .10
cloudiness indicated excessive microbial contamination . The concentrate
was diluted approximately 250 times during each cycle, resulting the the
calculated influent concentrations shown in Table 14 . The total steady
state influent ammonia-N concentration was calculated and measured to be
50 mg/l NH4-N .
The following steps were taken to minimize microbial growth in the
feed lines and in the mixing reservoir :
1 . The reservoir was thoroughly rinsed with hot water
at least once a week .
2 . The entire length of the feed lines (Tygon tubing) was
manually squeezed daily and its contents disposed of .
3 . The feed lines were changed every 3 weeks .
4 . The temperature in the refrigerator was
maintained at 100 C at all times .
Refinery Wastewater Feed
Three of the five reactors were fed refinery wastewater obtained
from a nearby oil refinery . The wastewater, drawn from the effluent
side of dissolved air flotation units (DAF), was trucked from the
refinery to the UCLA campus in seven 55 gallon polyethylene drums and
stored in a walk-in refrigerator at 4 0 C. From there, the wastewater
was automatically pumped, using an electronic filling/refilling system,
into a refrigerated reservoir in the laboratory .
From the reservoir,
120
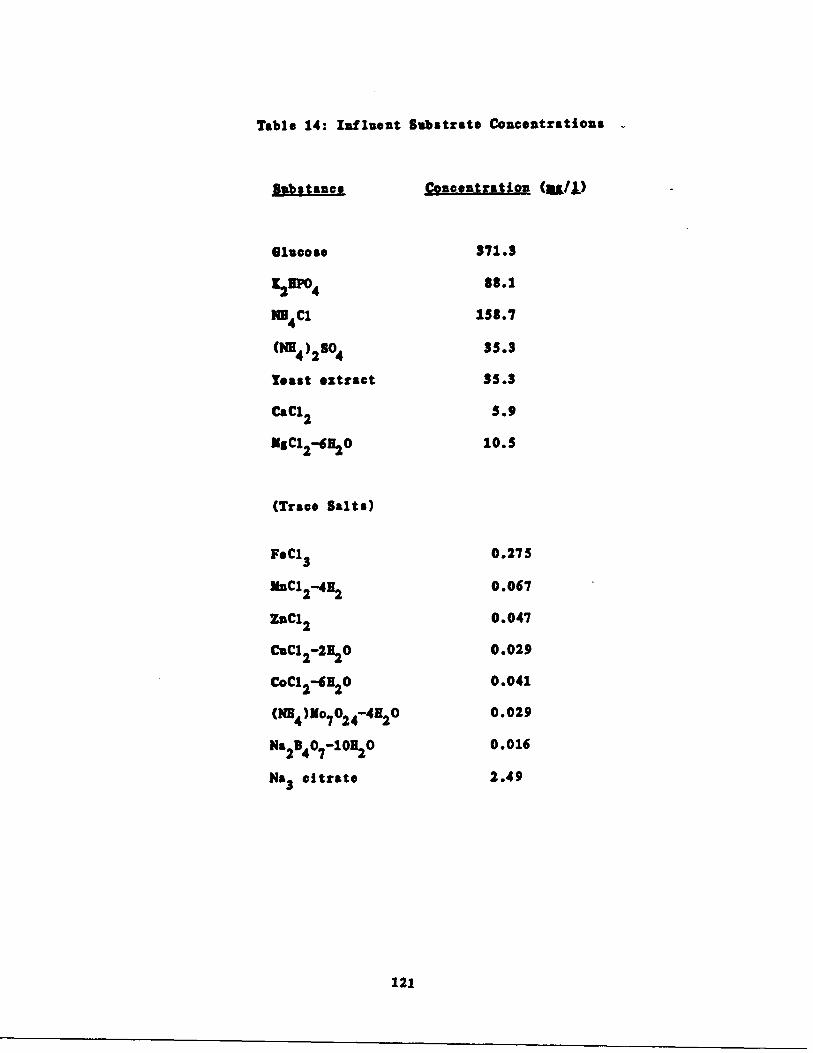
Table 14 : Influent Substrate Concentrations
121
$ub}tance, Concentration
Glucose 371 .3
828P04 $8 .1
NN4C1 158.7
(N84)2804 35 .3
Yeast extract 35 .3
Cad12 5 .9
MSC12-6820 10.5
(Trace Salts)
FeCl30 .275
NuCl2-482 0 .067
ZnC1 2 0 .047
CvC122820 0 .029
CoC12-6820 0 .041
(N84 )Y07024-4830 0 .029
Na21407-10%00 .016
Na3 citrate 2 .49
the wastewater was pumped into the activated sludge reactors by a
separate pump system . Since refinery wastewaters are generally lacking
in phosphorus, an essential nutrient for microbial growth, phosphoric
acid (1 mg/l feed) was manually added to the RW reactors on a daily
basis . No other nutrient was supplemented .
For each batch of wastewater received from the refinery, determi-
nations of ammonia-N, nitrate-N and TOC were made . A GC-KS analysis was
performed for base/neutral/acidic extractable organics in three separate
batches of wastewater in order to screen for potential inhibitors of
nitrification and to assess the general composition of the wastewater .
This work was done by James Montgomery Consulting Engineers, Inc . in
Pasadena, California, using a Finnigan 4000 GC/MS . In addition, a heavy
metal analysis on a single batch of wastewater was performed by the
SOHIO Research Center, Cleveland, Ohio .
Reactor Start-Up and Overation
The powdered activated carbon (PAC) used in this study was West-
vaco Nuchar SA-15 and the bentonite clay used was obtained from Westwood
Ceramic Co., Los Angeles . Prior to reactor seeding, the following steps
were taken to prepare the PAC reactors :
1 .
PAC was dried at 1500 C for 3 hours and stored in a dessicator
before use .
2 .
The steady state carbon concentration to be used, based on initial
operating variables, was calculated using the following mass
122
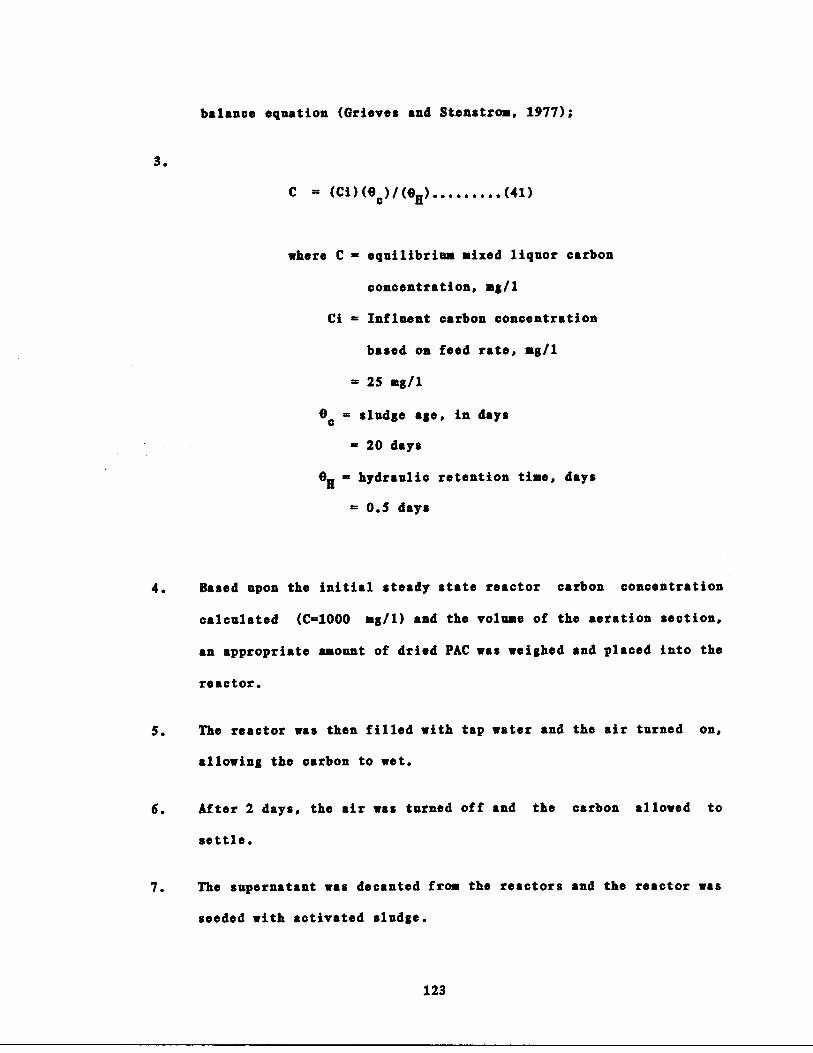
3 .
balance equation (Grieves and Stenstrom, 1977) ;
C = (Ci)(9c)/(9H)(41)
where C = equilibrium sized liquor carbon
concentration, ag/l
Ci = Influent carbon concentration
based on feed rate, ag/l
„
25 ag/l
0e = sludge age, in days
„
20 days
eH = hydraulic retention time, days
„
0.5 days
4 . Based upon the initial steady state reactor carbon concentration
calculated (C=1000 mg/1) and the volume of the aeration section,
an appropriate amount of dried PAC was weighed and placed into the
reactor .
S .
The reactor was then filled with tap water and the air turned on,
allowing the carbon to wet .
6.
After 2 days, the air was turned off and the carbon allowed to
settle .
7 .
The supernatant was decanted from the reactors and the reactor was
seeded with activated sludge .
123
Similar steps were taken to prepare the bentonite reactors ; however,
because the bentonite particles tended to agglomerate when wetted, it
was necessary to slowly suspend the particles in an agitated beaker
containing tap water before adding the suspension to the reactor .
All reactors were seeded with mixed liquor obtained from the aera-
tion tanks of the Hyperion Wastewater Treatment Plant, Los Angeles, Cal-
ifornia . The initial IILSS concentration was measured at 2450 mg/l . Due
to delays in obtaining the refinery wastewater feed, the initial feed
used for all reactors was diluted Sego, a complex carbonaceous sub-
strate, supplemented with potassium phosphate and ammonium chloride .
The TOC, NH4 -N and PO4-P concentrations in the influent was maintained
at approximately 160 mg/l, 25 mg/l and 10 mg/l, respectively during the
start-up period. Appropriate volumes of PAC and bentonite were added as
a slurry to the aeration section of the reactors on a daily basis .
Following one month of steady state operation, the sludge age for ,
all reactors were increased to 60 days in anticipation of the final
operating conditions to be used during experimentation . Two months
after the initial reactor start-up, the feed was switched from Sego to
the refinery wastewater in reactors 3, 4 and S . At this time, the PAC
and bentonite dosage and the hydraulic retention time for these reactors
were increased to the final operating values of 50 mg/l feed and 24
hours, respectively . Due to the presence of organic nitrogen in the
Sego substrate, reactors 1 and 2 were switched to the glucose-based
feed . This change was necessary to facilitate the measurement of nitro-
genous species in the influent and to have better control of nitrogen
124
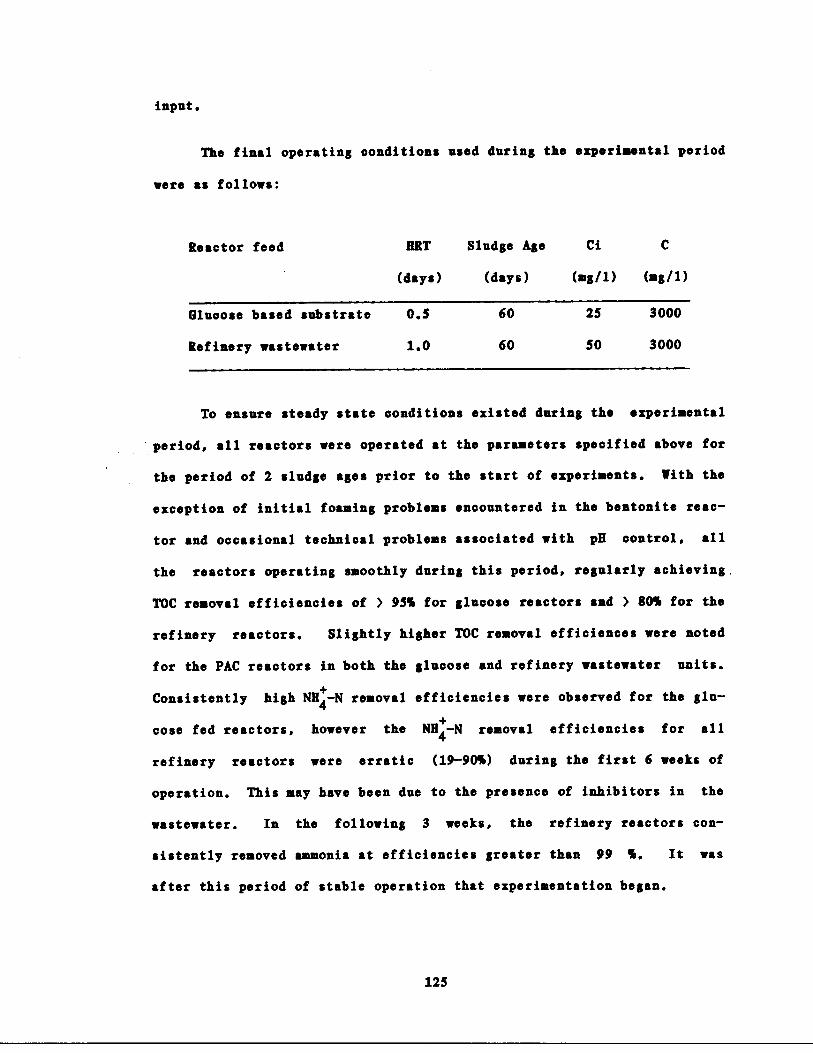
To ensure steady state conditions existed during the experimental
period, all reactors were operated at the parameters specified above for
the period of 2 sludge ages prior to the start of experiments . With the
exception of initial foaming problems encountered in the bentonite rose-
or and occasional technical problems associated with pH control, all
the reactors operating smoothly during this period, regularly achieving,
TOC removal efficiencies of > 95% for glucose reactors and > 80% for the
refinery reactors . Slightly higher TOC removal efficiences were noted
for the PAC reactors in both the glucose and refinery wastewater units .
Consistently high NH4N removal efficiencies were observed for the glu-
cose fed reactors, however the NH4-N removal efficiencies for all
refinery reactors were erratic (19-90%) during the first 6 weeks of
operation . This may have been due to the presence of inhibitors in the
wastewater . In the following 3 weeks, the refinery reactors con-
sistently removed ammonia at efficiencies greater than 99 % . It was
after this period of stable operation that experimentation began .
125
input .
The final operating conditions used during the experimental period
were as follows :
Reactor feed HRT Sludge Age Ci C
(days) (days) (mg/1) (mg/1)
Glucose based substrate 0.5 60 25 3000
Refinery wastewater 1 .0 60 50 3000
Isotherm Studies
Two sets of adsorption isotherm studies were performed. One to
assess the relative adsorptive capacities of PAC and bentonite using the
refinery wastewater as an adsorbate and another to determine the adsorp-
tive characteristics of aniline using PAC and bentonite as the adsor-
bent . The later isotherm was done because aniline was considered to be
an "ideal" inhibitor for experimental use in this study . Its effects on
nitrification are well documented in the literature and it is known to
.be both biodegradable and adsorbable, although the extent of its adsorp-
tive properties have not been well established .
1) Refinery Wastewater Isotherm : The procedure for this isotherm
consisted of the following steps ;
a) PAC and bentonite were dried at 150 0 C for 3 hours and placed in
a dessicator before use .
b) Appropriate amounts of PAC and bentonite were analytically
weighed and placed into 150 al Pyrex square bottles . Two
bottles containing neither PAC or bentonite was retained as
controls .
c) 125 ml of refinery wastewater was added into each bottle,
resulting in PAC or bentonite concentrations of 0 .1, 0 .2,
0 .4, 1 .0, 2 .0, 5 .0 and 10 .0 grams/1 refinery wastewater and 2
controls .
Exverimental Procedures
126
d) All bottles were stoppered; placed in a horizontal position on
an orbital shaker (Labline, Model 3590) and agitated at 130
RPM for 3 hours (room temperature - 27-29• C) .
e) At the end of the agitation period, the contents of each flask
were vacuum filtered through a 0 .45 micron membrane filter
and analyzed for TOC .
2) Aniline Isotherm : The procedure used for this isotherm was
similar to that just described, except that 100 al of a test solution
containing 100 ag/l (pH adjusted to 7 .0) aniline was used in lieu of the
refinery wastewater . Also, a slightly wider range of carbon and benton-
ite doses were evaluated (0 .1, 0 .2, 0.6, 1 .0, 2 .0, 5 .0, 8 .0, 10.0, 15 .0
and 20 .0 grams/l solution) . The agitation period was 9 hours which was
representative of a typical batch inhibition experiment . Residual
liquid phase aniline concentrations were determined by gas-liquid
chromatography after centrifugation .
Batch Experiments with Specific Inhibitors of Nitrification
A series of batch experiments was run to examine the short-term
influences of PAC, bentonite and sludge acclimation on activated sludge
nitrification rates in the presence of selectively spiked compounds .
The selection of the compounds used in these experiments was based pri-
marily on the information available in the literature on the inhibition
and adsorption characteristics of the specific compound . Other con-
siderations included the solubility and the industrial significance of
the compound . The selected compounds at the concentrations used in
127
experiments are summarised as follows :
adsorbable-inhibitory :
aniline (10, 10 mg/1)
phenol (10, 20 mg/1)
adsorbable-noninhibitory :
toluene (10 mg/1)
nonadsorbable-inhibitory :
cyanide (1 . 3, 3 mg/i)
nonadsorbable-noninhibitory : acrylonitrile (10 mg/1)
Unless otherwise noted, the following procedure was used for all
batch experiments :
a . Prior to each test, the NH4-N and NO3--N effluent concentrations
were determined for each activated sludge reactor and recorded .
b . 430 al of mixed liquor was withdrawn from each reactor into 500 al
flasks and an appropriate volume (1 to 3 ml) of a NH 4 C1 solution
was mixed into each flask to bring the concentration of NH4 -N to a
predetermined level (i .e ., 75 mg-N/1) .
c . The volume of mixed liquor in each flask was divided equally into
two 250 ml Erlenmeyer flasks containing mixing beads . For each
pair of flasks, an appropriate volume of the test solution com-
pound (e .g ., sodium cyanide) was added into one of the flask to
bring its concentration to the desired level, while the other
flask was retained as a control .
d .
All flasks (250 ml) were placed under a hood and aerated for a
128
g.
specific period of time . The air was supplied through a dispos-
able Disposo pipet at a flow rate of 3 .5 SCFH to ensure adequate
dissolved oxygen concentrations and mixing at all times .
p
e . Shortly after the start of aeration (typically 1 to 2 minutes),
two separate 5 or 10 ml samples of mixed liquor was withdrawn from
each flask with volumetric pipets . The mixed-liquor samples were
diluted to volume with an appropriate dilution solution in 100 ml
volumetric flasks, capped, and stored for the analysis of ammonia
and nitrate at the end of the aeration period . These samples were
designated as t=0 . All samples were preserved according to the
rocedures prescribed by Standard Methods (1975) . See also
Analytical Methods .
f . Additional samples were taken throughout the aeration period . In
the first two experiments with 10 mg/l aniline and 1 mg/l cyanide,
the aeration period was 24 hours with sampling intervals ranging
from 1 .5 to 9 hours . In all the following experiments, the aera-
tion period was 9 hours with samples taken at t = 1, 3, 5 and 9
hours .
Every hour throughout the aeration period, the pH was checked and
adjusted, if necessary, to the range of 7 .2 to 7 .4 (using 0 .05 or
O .1N NaOH) . The volume of caustic use was noted and recorded
after each pH adjustment .
129
Chronic Experiments with Aniline
Two consecutive tests were conducted to determine the long-term
influences of PAC and bentonite additions on activated sludge nitrifica-
tion rates in the presence of aniline, a known adsorbable and inhibitory
compound . The two tests were carried out over a period of 2 months
using the three continuous flow RW fed reactors as experimental units .
Consistent ammonia oxidation efficiencies of > 99% over a period of one
week or longer were a necessary prerequisite prior to the start of each
test . This was to ensure that the observed inhibitory effect could be
attributed to the presence of aniline rather than to poor nitrification
. in general .
In the initial test, all three reactors were subjected to a simul-
taneous step and pulse input of 30 mg/l aniline and a pulse input of 75
mg/l NH4-N. Immediately following this, the concentrations of ammonia
and nitrate in the mixed liquor were sampled with time at regular inter
vals (every 2 to 8 hours) for 265 hours and then once a day for the next
3 weeks .
In the second test, the reactors, which had been operating with a
continuous input of 30 mg/l aniline in the RW feed, were subjected to
another simultaneous step and pulse input of aniline and a pulse spike
of 75 mg/l NH4-N . The step input resulted in the increase of aniline
concentration from 30 to 60 mg/l in the feed, while the pulse input con-
sisted of a spike of 60 mg/l aniline directly into the reactors . The
concentrations of ammonia, nitrite and nitrate was monitored with time
using sampling intervals of 2 to 3 hours up to the first 100 hours and
130
once a day thereafter .
The general procedure for these tests consisted of the following
steps :
1 . Prior to the chronic experiments, a separate pump system was
installed for the continuous addition of aniline to the RW reser-
voir . This system consisted of a time-controlled pump operating
via liquid level switches in the feed reservoir . At each reser-
voir filling cycle, a predetermined volume of aniline was pumped ;
diluted and mixed with the incoming stream of refinery wastewater .
The aniline was pumped from a prepared concentrated stock solution
contained in a flask adjacent to the reservoir . The amount of
concentrated aniline pumped gave an incoming feed concentration of
30 and 60 mg/l aniline for the first and second test, respec-
tively .
2 . Prior to the start of each experiment, the RW reservoir was
thoroughly cleaned by scrubbing and rinsing with hot water . Each
test began with the reservoir at the start of a new filling cycle .
3 .
The influent and effluent ammonia concentrations were measured for
each RW fed activated sludge unit .
4 .
The RW feed pumps were turned on to give the step input of ani-
line .
5 .
10 ml of a concentrated aniline solution was pipeted directly into
the aeration section of each reactor to give an instantaneous
131
(pulse) input of aniline .
6. 20 al of a concentrated stock solution of ammonium chloride was
pipeted into each reactor to give an instantaneous concentration
of 75 mg/l NH4-N.
7 . Two 10 al mixed liquor samples were taken directly from the aera-
tion section of each reactor at every sampling period . The sam-
ples were diluted to volume in a 100 al volumetric flask with dis-
tilled water (for the analysis of NH4-N) or with a dilution solu-
tion (for the analysis of N03-N) . For nitrite samples, 100 als .
of mixed liquor from each test reactor was withdrawn and allow to
settle . Using a volumetric pipet, 1 or 2 mls . of the resulting
supernatant was withdrawn and diluted with distilled water into a
200 al . volumetric flask . The settle mixed liquor and supernatant
was then promptly returned into aeration section of each
corresponding reactor .
8 . Throughout the entire test period, the pH was maintained at 7 .0 to
7 .2 . Cumulative caustic (1 .0 N NaOH) usage was recorded for each
reactor .
9 .
Usual daily sludge wastage and carbon or bentonite additions were
maintained throughout the tests .
132
Carbon Dose Ezveriments
A series of batch experiments using variable carbon doses was per-
formed to study PAC-activated sludge nitrification enchancement in the
presence of a known nitrification inhibitors with different adsorption
characteristics . The general procedure consisted of the following
steps :
1 .
PAC was dried at 1500 C for a minimum of 3 hours and stored
in a dessicator until use .
2 .
For the initial experiment, a weighed amount of dried PAC was
put into solution and mixed into a volumetric flask .
3 .
The N11N and N03-N concentrations in the effluent of the
non-carbon glucose fed reactor were measured .
4 . A measured volume of mixed liquor was withdrawn from reactor
and divided equally into Erylenmeyer flasks (250-500 ml
volume) .
S . In the first experiment, appropriate volumes of the PAC
slurry was pipetted into 4 of the flasks to give the desired
carbon concentrations . PAC doses tested in the initial exper-
iment was calculated to be 387, 775, 1960, and 4000 mg/l . In
the subsequent experiments, the PAC was analytically weighed
and placed dry into the designated empty flasks prior to
the introduction of mixed liquor . PAC doses tested in here
were 500, 1000, 2000, and 4000 mg/l . In all experiments, a
133
minimum of two flasks were retained as controls and did not
recieve any PAC .
6 . An exogenous source of NH4 N in the form of a solution of
ammonium chloride was pipetted into each flask to bring the
NH4-N concentration from <0 .1 to 40-50-N mg/l .
7 . 1 .0 al . of test compound from a concentration stock solution
was pipetted into the test flasks to give the desired calcu-
lated concentration .
8 . It should be noted that the changes in volumes brought about
by the additions of PAC, NH4C1, and the aniline were
accounted for in the calculation of the final concentrations
used .
9 . All flasks were placed under a hood and aerated throughout
the experiment . In the initial experiment, air was supplied
through a disposable Disposo pipet at a flow rate of 3 .5 SCFH
to ensure adequate dissolved oxygen concentrations and mixing
at all times . In subsequent experiments, air was supplied
through disposable, plastic aquarium diffuser stones at the
same flowrate .
10 .
One or two minutes after the start of aeration (designated
t=0), 2 separate 5-10 al portions of the mixed liquor were
withdrawn from each flask, using volumetric pipets, and added
into a 100 al volumetric flask half filled with distilled
water and an appropriate preservative . The flasks were then
134

diluted to volume, capped, shaken, and stored for the
analysis of ammonia and nitrate at the end of the experiment .
11 .
Step 10 was repeated for t = 2,4,6, and 8 or 9 hours .
12 . Every hour throughout the aeration period, the pH was checked
and manually adjusted, if necessary, to the range of 7 .2 to
7 .4 using 0 .1 N NaOH .
Activated sludge mixed liquor used in the initial carbon dose
experiment was obtained from a continuously fed non-carbon glucose reac-
tor operating at a sludge age of 60 days, hydraulic retention time of 24
hours and an average influent ammonia concentration of 45 mg/l ammonia-
N . Automated control of pH in the reactor was achieved by adding NeOH .
Subsequent carbon dose experiments, performed 9 to 12 months after the
initial experiment, utilized mixed liquor from the reactor now operating
at a sludge age of 9 .0 days, hydraulic retention time of 8 hours, and
influent ammonia-N concentrations of approximately 50 mg/l . Automated
control of pH in the reactor was achieved using a saturated solution of
sodium bicarbonate .
135
Analysis of Ammonia-N-
An Orion Model 95-10 ammonia specific ion electrode in conjunction
with an Orion ionanalyzer (Model 407A) was used
ammonia concentrations in the influent, mixed liquor and effluent sam-
pies . The probe was calibrated at least once, using laboratory prepared
standards, prior to and during each analytical run . All samples were
preserved with 1M HC1 (0.1 ml/0.1 liter of sample) and stored in capped
volumetric flasks . Because the probe is only sensitive to dissolved
ammonia, the pH of the sample was raised to 11-13 with 10 M NaOH immedi-
ately prior to analysis . The probe method was found to give accurate
and repeatable readings for the concentrations encountered in both glu-
cose and BA reactor derived samples . Sample volume analyzed were 100 ml
or aliquots diluted to 100 ml .
Analysis of Nitrite-N-
Nitrite nitrogen was determined by a wet chemical technique as
described in standard Methods, (1975, method 418C, page 370) . All
nitrite samples were preserved with 4 mg HgCl 2/100 ml sample, filtered,
and diluted with distilled water to be cover the applicable range of the
method (0.01 to 1 .0 mg/l NOZN) . Briefly, the method consisted of
measuring NO2 in the sample through the formation of a reddish purple
azo dye produced by the coupling of diazotized sulfanic acid with NED
dihydrochloride .
Photometric determinations was accomplished by using
Analytical Procedures
to directly measure
136
Bausch and Lomb Spectronic 20 (1 cm light path) at 543 nm . Standard
curves were obtained for each analytical run using serially diluted
nitrite standards (NaNO2 ) prepared in the laboratory .
Analysis of Nitrate-N
A calibrated Orion 93-07 nitrate electrode with an Orion Model
407A ionanalyzer was used for the determination of nitrate in all sam-
pies . Initially the cadmium-reduction method (Standard Methods,
pp . 370) was used . However, after an evaluation of the two methods for
analyzing nitrates in refinery wastewater, it was decided that the probe
method was the better choice, based on the following observations :
1 . Although both methods suffered from unknown interferences present
in H! MLSS, the electrode method was judged to be at least as
accurate as the Cd-reduction method .
2 .
The electrode method was a much faster and a more economical tech-
nique than the Cd-reduction method .
3 . The efficiency of the Cd-reduction column decreased rapidly and
eventually exhausted completely after only a few sample runs
(approximately 8-9 samples) . The degree of the reduction in
column efficiency or the point of exhaustion was difficult to
detect or predict during analytical runs . This made it difficult
to establish the proper time for corrective measures, such as Cd
regeneration or cadmium granule replacement . Often times, the
reduction in column efficiency was detected only after samples had
1975,
137
already been analyzed .
Other colorimetric techniques for the analysis of nitrate, such as
the Chromotropic acid and the Brucine methods, were also considered for
potential application . These methods were eventually abandoned in light
of the fact that these methods also suffered in one way or another from
serious interference*, poor reproducibility, poor sensitivity or exces-
sively tedious procedures with undesirable reagents (Jenkins, 1977) . It
was recognized that although significant experimental errors may result
with the use of the electrode method, it was considered that this method
was best suited for the particular wastewater to be analyzed .
In using the electrode method for the determination of nitrate, a
constant ionic strength background must be maintained . This is accoa-
plished by the addition of an ionic strength adjuster (ISA) solution
directly into the sample to be analyzed . The recommended ISA for water
and domestic wastewater samples is 2 al of 2M ammonium sulfate/100 al .
sample, resulting in an ionic strength background of 0 .12 M. This ISA
gave good accuracy and reproducibility for glucose fed influent, MLSS,
and effluent samples, but poor to adequate results were obtained with
refinery wastewater derived samples . An alternate ISA (Milham, 1970 ;
Orion Methods Manual, 1976) normally used for the analysis for nitrates
in soils, was tested and found to provide more acceptable results for RW
samples (see Table 15) . The modified ISA consisted of the following :
16 .66 g Al 2 (SO4 ) 3 . 18H20, 4 .67 g Ag2SO4 and 2 .43 g NH2 SO3 in one liter
of distilled water . The ionic strength background for this ISA was cal-
culated to be 0 .49 M. According to Milham (1970), the aluminum sulfate
138

Table 15 : Comparative Results of Different ISASin Analysis of Nitrates in RefineryWastewater Samples (diluted 1 :20)
Using Known Addition Method
„
- Unstable Readings on Meter
139
InitiallyMeasured
N03 (ppm-N)
AddedN03
3
CalculatedTotalN03
Measured NOUsing Modified
ISA
S Error
76 .5 4 .9 $1 .4 $5 .0 5 .3
9 .6 86 .1 $5 .5 0 .6
14 .2 90 .7 92 .5 1 .9
18 .5 95 .0 112.5 18 .4
IntiallyMeasuredN03 (ppm-N)
AddedNO3
CalculatedTotalN03
Measured NO3Using regular
ISA
S Error
76 .0 4 .9 80 .9 $5 .4 5 .6
9 .6 85 .6 106 .90 24 .9
14 .2 90.0 95 .3 „ 5 .9
18 .5 94 .5 106 .5 „ 12.7

removes organic anions ; the silver sulfate precipitates chlorides and
the sulfamic acid destroys excessive nitrites that may interfere with
the analysis . In this study, the modified ISA solution was used as a
dilution liquid for the analysis of nitrates in Mw derived samples,
while the 2M ammonium sulfate ISA was used for nitrate analysis in glu-
cose substrate derived samples . The dilution liquid used in the later
cases was distilled water . All samples were preserved with 1 M boric
acid (1 ml/100 ml sample) .
Analysis of Organic Nitrogen
Organic nitrogen was analyzed for using a modification of the
method described by Scheiner (1976) . The method is essentially the
micro-Ijeldahl technique described in Standard Methods (1976) . Sample
volumes of 5 to 10 ml were digested in 100 ml Ijeldahl flasks for at
least 2 hours . The digestive solution was composed of 134 g potassium
sulfate, 200 ml concentrated sulfuric acid and 5 ml selenium oxychloride
(catalyst) per liter . Following digestion, the mixture was diluted with
distilled water to volume in a 200 ml volumetric flask . The resulting
solution was analyzed for ammonia nitrogen using the selective ion elec-
trode described earlier, using a 10 N NaOH and „NaI (30 g/0.1) solution
in lieu of 10 N NaOH for pH adjustment to > 11 .0 . Calculation of
ammonia nitrogen concentration was made according to the Orion Methods
Manual (1976) using the concentration ratio, Q (unknown/known) for Ijel-
dahl digests . Standard known ammonia concentrations ranged from 1 .0 to
5 .0 mg/l ammonia-N. Differences in ammonia concentration before and
after digestion was attributed to organic nitrogen . Accuracy of the
140
overall method was determined by analyzing a number of amino acids and
ammonia chloride solutions of known concentrations . Results of these
preliminary tests indicated measured values were within 5 'a or better of
known values (see Appendix IV) .
Gas Lianid Chromatography Analysis
Liquid phase aniline concentrations for the adsorption isotherm
and carbon dose experiments were measured by direct aqueous injection
using a Varian Vista series 6000 gas chromatograph and a Hewitt Packard
3300 integrator . The column used was a 22 meter SP2100 operated isoth-
ermally at 1100 C . Optimal operating conditions for the analysis of ani-
line was found to be as follows ;
- Injection temperature = 200 0 C.
- Detector (Flame Ionization) temperature = 300 0 C .
- Carrier gas (He) flowrate = 2 .0 ml ./minute .
- Detector make-up gas flowrate = 30 .0 ml ./minute .
- Air flowrate = 300 ml ./minute .
- Hydrogen flowrate = 30 al ./minute .
- Method of injection : splitless at 1 .0 microliter sample size .
- Purge vent : opened after 0 .9 minutes at 100 ml He/minute .
- Sensitivity = 4 to 32 x 10-11 .
141
Reproducibility for a given injection was found to be within 5%
for peak area response and 7% for peak height response . All calcula-
tions were based on peak area response . A standard area curve was
to be more reliable than an absolute response factor
found
concentration/area counts) for determining unknown aniline concentra-
tion. Using the standard curve and at the lowest sensitivity used, it
was possible to detect aniline at a concentration of approximately 0 .3
ag/l by direct aqueous injection . According to the definition of the
limits of detection (defined a three times the baseline noise), it is
possible 'to detect aniline to less that 0 .1 ag/l at the sensitivity
used.
For the carbon dose experiments, a preliminary test was conducted
to determine whether aniline could be recovered from the liquid phase of
mixed liquor and accurately analyzed for by gas chromatography . The
nature of the substrate used for reactor feed suggested that there would .
be little interference in the analysis of aniline by direct aqueous
injection. The procedure used for the test was as follows ;
1 . 1 .35 liters of mixed liquor (NLSS= 1250 mg/l) was withdrawn
from the glucose non-carbon reactor and divided equally into
3 flasks with magnetic stirrers .
2 . An appropriate volume of aniline stock solution was added via
volumetric pipet into each flask while mixing in vortex,
resulting in calculated aniline concentrations of 1 .0, 5 .0,
and 10 .0 mg/l aniline .
142
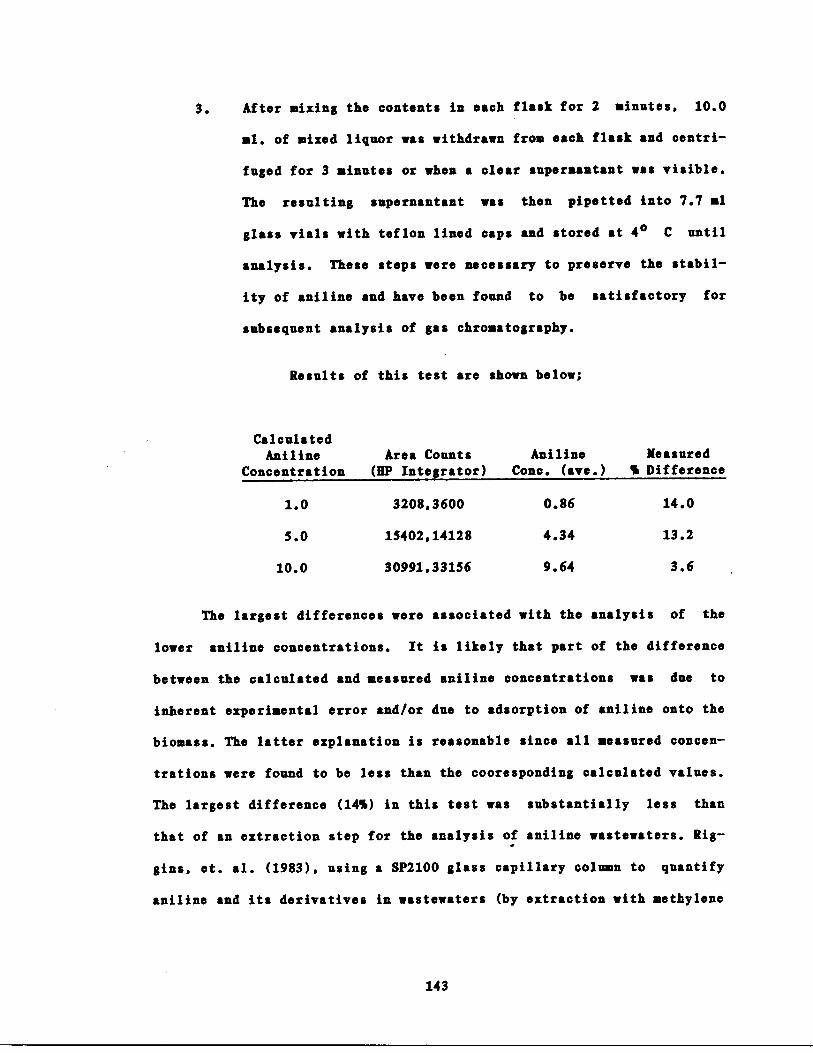
3 . After mixing the contents in each flask for 2 minutes, 10 .0
ml . of mixed liquor was withdrawn from each flask and centri-
fuged for 3 minutes or when a clear supernantant was visible .
The resulting supernantant was then pipetted into 7 .7 al
glass vials with teflon lined caps and stored at 4 • C until
analysis . These steps were necessary to preserve the stabil-
The largest differences were associated with the analysis of the
lower aniline concentrations . It is likely that part of the difference
between the calculated and measured aniline concentrations was due
inherent experimental error and/or due to adsorption of aniline onto the
biomass . The latter explanation is reasonable since all measured concen-
trations were found to be less than the cooresponding calculated values .
The largest difference (14%) in this test was substantially less than
that of an extraction step for the analysis of aniline wastewaters . Rig-
gins, et . al . (1983), using a SP2100 glass capillary column to quantify
aniline and its derivatives in wastewaters (by extraction with methylene
143
ity of aniline and have been found to be
subsequent analysis of gas chromatography .
satisfactory for
Results of this test are shown below ;
CalculatedAniline
ConcentrationArea Counts
Aniline(HP Integrator)
Cone. (ave .)Measured
% Difference
1 .0 3208,3600
0.86 14 .0
5 .0 15402,14128
4.34 13 .2
10.0 30991,33156
9.64 3 .6
chloride) reported aniline recoveries of 75% or better . Given that the
aniline recoveries at the concentrations of interest for these particu-
lar tests were greater than 75% by direct aqueous injection, an extrac-
tion step was deemed unnecessary .
TOC analysis
All total organic carbon (TOC) determinations were made with an
Ionics TOD and TOC analyzer (Model 1270) which employed a combustion-
infrared method for the analysis of soluble and purgable TOC . Samples
were collected in glass bottles ; preserved with concentrated HC1 (pH <
2) and stored at 40 C, if analysis was not immediate . All samples were
either filtered (0 .45 micron) or centrifuged and purged of inorganic
carbon using HCl prior to analysis . A minimum of 3 consecutive repli-
cates per sample was analyzed with the-last two replicates averaged and
recorded . The calibration solution standard was acetic acid and a new
standard curve was obtained for each analytical run .
Analysis of MLSS and MUSS
Total mixed liquor suspended solids (MLSS) and mixed liquor vola-
tile suspended solids (MLVSS) concentrations for each reactor were
determined at various times throughout the entire experimental program .
For the non-carbon reactors, the solids were determined by the following
procedure ;
1) 2 .1 cm glass microfiber filters (Whatman 934-AR) were placed into
porcelain Gooch crucibles (Coors C8450-4) and washed by vacuum
144
filtration of 3 successive 20 ul portions of distilled water . The cru-
cibles were ignited in a muffle furnace at 550 + S0•C for 15 minutes ;
allowed to cool in dessicator ; and analytically weighed (constant
weight) immediately before use .
2) A well mixed 5 ml portion of mixed liquor was passed through the
filter in the crucible . The entire crucible was dried at 103 •C in an
oven for one hour ; allowed to cool in a dessicator and weighed for the
determination of IILSS . Two replicates were made for each sample with
the averaged value recorded .
3) For volatile solids determinations, the crucibles from the preceding
analysis were ignited in a muffle furnace at 550 + S0•C for 15 minutes,
allowed to cool in a dessicator and weighed .
For the carbon and bentonite reactors, the ILSS concentrations may
be determined using the above procedure and the following equation based
on the steady state reactor concentration of carbon or bentonite ;
IQ.SS(biomass)
where IIL.SS(biomass)
ILSS(mmeasured)
C
NLSS (measured) - C
„
the total suspended biologicalsolids in the reactor
„
the ILSS measured using theproceeding technique
„
the steady state carbon orbentonite concentration in thereactor . This is defined by thevariables in equation 41 .
The MUSS concentration can be determined by a similar steady state
equation;
MUSS(biomass)
=
MUSS - C „ NLSS * X
145
where X the fraction of PAC or bentonitevolatilized in MUSS tests(assumed to be equal to the fractionof PAC or bentonite volatilized in aseparate test with PAC or bentonite)
Alternately, Arbuckle, et al . (1982) proposed a method that can be
used for the determination of biological solids concentrations in PAC
sludges operating under nonsteady state conditions . Briefly, the pro-
cedure involves the determination of MLSS, MUSS at 4000 C, and NLVSS at
550• C for PAC sludge* and PAC by itself . The following equation was
developed by Arbuckle calculate MLVSS (biomass)'
NLVSS (biomass) = V (550) - CAR „ 1 (SSO)MLSS
where V (550) = fraction of 1Q.SS volatilized at 550 0 C
X (550) = fraction of PAC volatilized at 550 0 C
CAR
= fraction of MLSS which is PAC
Based on studies with different PAC sludges, Arbuckle used the following
empirical equation to define CAR ;
CAR 1(400)-0.9„1 (550)
where
V(400), V(550)
=
fraction of MLSS volatilized at
400• C and 500• C, respectively
1(400), 1(550)
=
fraction of PAC volatilized at
400• C and 500• C, respectively
According to Arbuckle, the average error of 5 tests using this method
was 4 .4 % with a high of 16.7 % . In this study, the steady state
146

method was used to determine the MLSS and MUSS concentrations in the
bentonite reactors, while Arbuckle's method was used for PAC reactors .
147
RESULTS,AND DISCUSSION
PRELIMINARY, EXPERIMENTS,
GC/MS Analysis
GC/MS analysis of the untreated refinery wastewater was performed
three times during the beginning of the study . The purpose of the
analysis was to determine the variability of the wastewater and to
screen the wastewater for specific nitrification inhibitors . As men-
tioned previously, it was desired to use inhibitors in the later experi-
ments which are typically found in refinery wastewater . Table 16 show
the results of the GC/MS analysis conducted on September, 1982,
December, 1982, and February, 1983 . The tables show the Merk index
number in parenthesis after the compound, in many instances . The tests
are similar in that they show the presence of a large number of phenolic
compounds and straight chain hydrocarbons . All tests detected aniline .
Organic acids and ring compounds, such as anthracene, were found at low
concentrations . Compounds were selected for further evaluation in the
batch and chronic tests from this data and from the results of the
literature review of nitrification inhibitors and adsorption charac-
teristics .
148
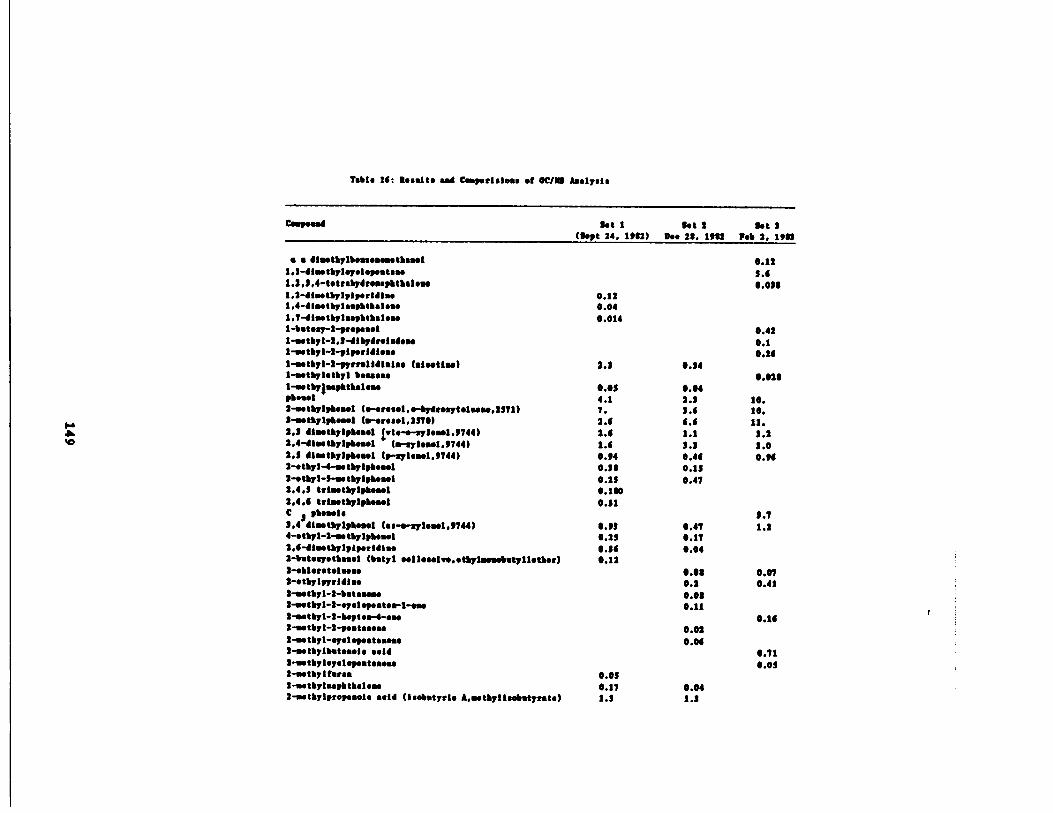
?able 10 : ne .dts ad ce.pri.fess .f ocie A.ah.i .
t
Composed set i(I.pt 24. 1902)
tot 2Doe 20. 19n
lot 2rel 2 . 19"
. . „fatyllesseseatlaal 0.121 .1-rfatyl.y.le,e.taae 5 , 41 .2 .1 .4-t .tr.yer.u~lelaLu 0.0311 .2-llatylpIprldlae 0.121,4-41aty/aapltlale.e 0 .041.7-~latylu~lttalea 0.0141-l .tea7-2-prepael 0 .421-ewtyl-2,1-dIydrelsNa 0.11-..tyl-2-pIprfueae 0.101yetyl-2-,yrr .llltalae (sIs.tla) 2.1 0.141- etyletyl b .sseae 0.0201-aty}u,ltlalea 0.0! 0.049lesel 4 .1 2 .1 10 .2- stylpleal (o-erea.l . .-Wdresyt.lwa.2171) 7 . 1 .0 10 .lyetyl*lea! (.-.r . ..1.2570) 2 .0 6 .0 11 .2.3 4latyIpb. ..l (vie- .-ayleal .9744)
+2 .4 1 .1 3 .2
2.4-Olatylplesel to-syleseI .0744) 1.6 3 .3 1 .02.1 Olatylpleal ("l .sel.9744) 0.94 0 .44 0.902-.tyl-4-m tytpl...1 0.10 0.112-.tyt-S-.etylpleal 0.22 0.472 .4 .1 trfatylp$..el 0.1002 .4 .0 triatylplea.l 0.11c 2 ,16.male 1.71.4 4latylplesel (at-Mlylaa1,9744) 0.01 0.47 1 .24-etyl-2-.etyl*leael 0 .2! 0.172.0-dIatylptprI4Ise 0.30 0.042-lstesyetlasel (5.071 eel l.sel.e.etyl raluylletler) 0.12I-elleretelase 0.01 0.072-„tyltirldlse 0.2 0.412-.eayl-2-bstaa. .. 0.00i-.etyl-i-gelepaterl-ea 0.112yetyl-2-lutes-4-ea 0.162-atyl-2-pstaaea 0.022-atyl-gelepataaea 0 .042-.etyllstaale said 0.712-.etylyslepstaaeas 0.0$2-atylhraa 0.052-.etylaapltlalea 0.17 0.042-.etylprepsele said (isobstyrie A,atyliea.tyrat .) 1 .3 1 .3
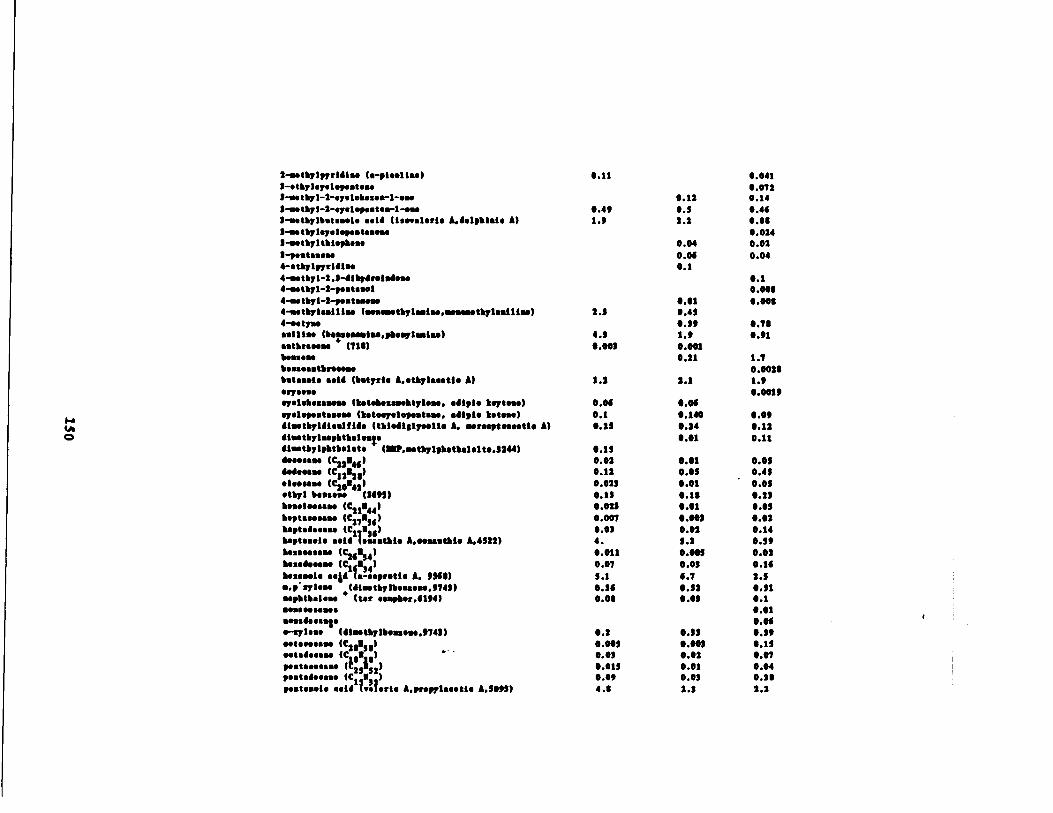
2-aetylprl41 .e (e-plosliu)!-.tyls~elepaste.a!-saetyi-2- .y .1.b.su-l-e.e!-~etyl-i-gelyeaerl-e alyetyll.te.ele said (isee .lori . A.delpkisi. A)!-.. ty tqs I epestsuu!-.styltbtepku„e!-past4-etylpridi.e4-..tyl-2.3-41ylreldeu4-.sibyl-2-pestsul4-..tyl-i-p .„ta.e.e4-uatyln111M (.ess.etylsdM..ese.etyl.dliM)4-eety .e.sill .. (1elsosriu,pb .y1 1..)..tkroso.. 4 (718)lass ...beases .tkr .ss..l.t.s.1s said (b tyri. A..tyl.eetie A)or7 ....e,.lekes.uu (bt.bss...ktyleu, adipte kgt...)q.lep.st.seu (k.t.gelepssts.., .dipis kites.)dimtyldisulfide ( tki.di017e.i1. A. erers.pt....tie A)di..tylupbtk.1u=.41..tylpktkelat. (OOP...tylpkstkalslt ..3244)4o....se (C22146 )4d.e... (012121)el.es... (020142 )otyl lass... (9601)ksssl ..ss .e (021144 )Yept .os.sse (027156 )bptsd ..s.. (C1'03i )bpt.sets sold l ..sstkie A...ustki. A.4122)bossC24!54 )bssd(C1`034 )bss..1s sold ts-sspr.tle A. 0960)„
.p's,le.. (4i..tylbesss...0743)sopktbsle.. a (tar eopber .4104)„esseees..e.„„ 6.5.9 .e-syle.. (4i.stylboss.u.074!)..tseea... (020050 )..ted.es. (51516 )pSsteaess.. 2552)p..tsd..sse (C )posts „.is said we
11231*via A.prepl..etis A.5005)
0.11 0.0410.072
0.12 0 .140.49 0 .! 0.441 .0 2 .1 0.00
0.0240.04 0.020 .04 0.040 .1
0.10.000
0.01 0 .0002 .! 0.4!
0.10 0.704 .3 1 .0 0.010.009 0.001
0.21 1 .70.0020
1 .2 2 .1 1 .00.0010
0.04 0 .040 .1 0 .140 0.000.25 0.24 0.12
0 .01 0 .110.150.02 0.01 0.050.11 0.00 0.400.023 0.01 0.000.13 0.10 0.290.023 0.01 0.050.007 0.00! 0.020 .01 0 .02 0.1441 0.900:011 0 .001 0.020 .07 0 .03 0.165 .1 6 .7 2.50.36 0.52 0.510.00 0.0! 0 .1
0.01r0 .04
0 .2 0.11 0.300.005 0.003 0.150.03 0.02 0.070.015 0.01 0.040.00 0.03 0.204 .0 2 .3 2 .2
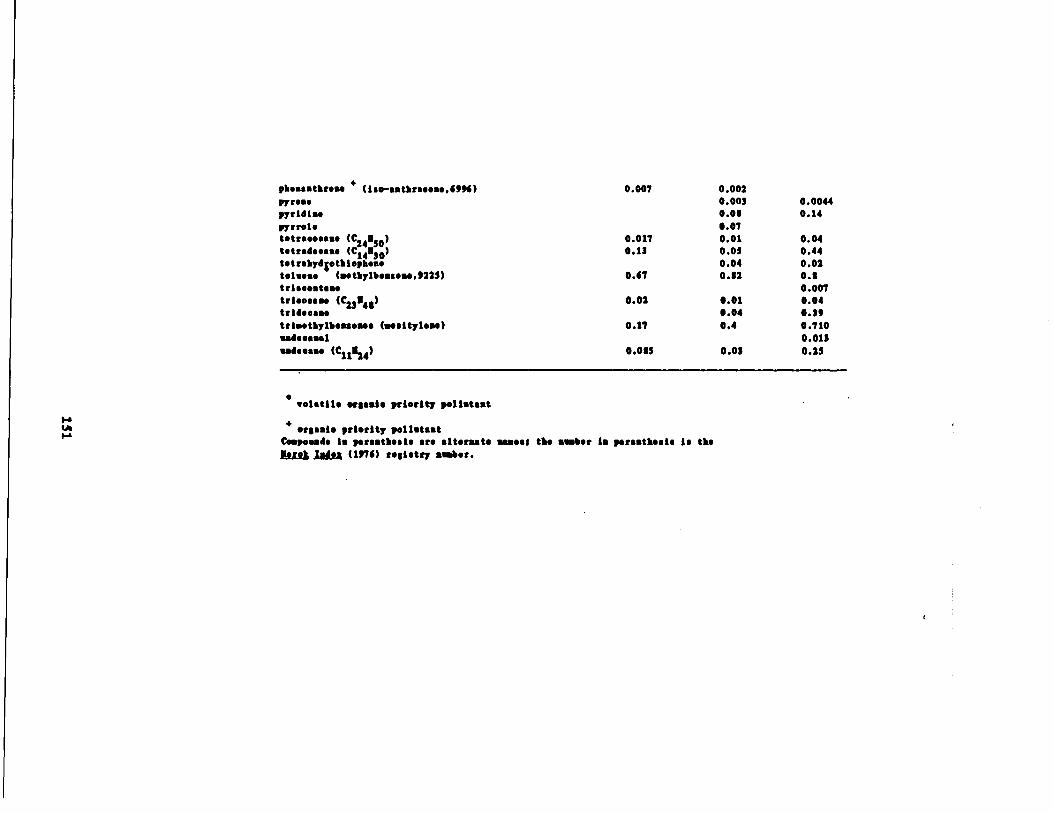
volatile er8asio priority pollutant
orga.ie priority pollutantCompounds i„ parenthesis are alternate woes the amber is parenthesis is thegLa 1"" (1976) registry amber .
r
o ..aatlre .e
(ies-aatb:aeeae,6fl6) 0.007 0 .002prose 0.003 0.0044pridise 0 .08 0.14prrole 0 .07tetraeoaaae (024850 ) 0.017 0.01 0.04tetradeea .e (014850) 0.13 0.05 0.44tstrebydjotbiofbsa . 0.04 0.02toluene
(.etbylb.aseae .9225) 0.67 0.82 0.8trisso.tsae 0.007trleosau (0848) 0.02 0.01 0.04trideoaae 0.04 0.59trisetbylbenaeue (sesityleu) 0.17 0.4 0.710sadessaal 0.013udee.ae (C11124) 0 .085 0.03 0.25
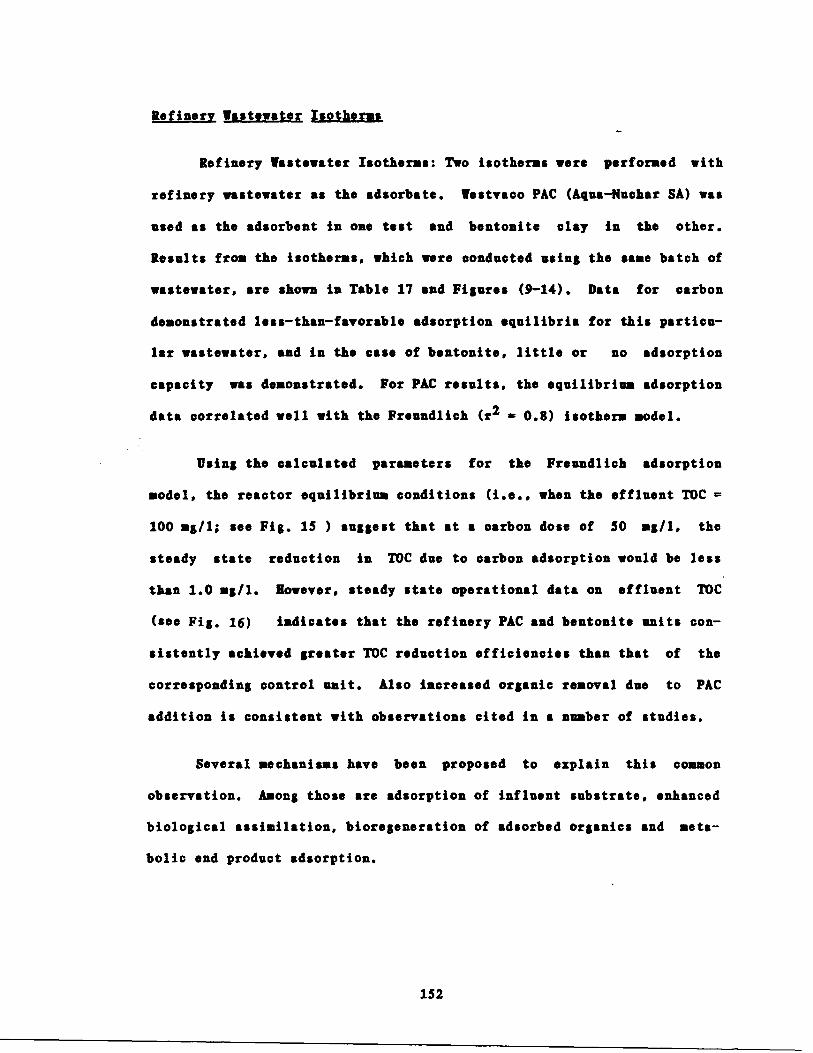
Refinery Wastewater Isotherms
Refinery Wastewater Isotherms : Two isotherms were performed with
refinery wastewater as the adsorbate . Westvaco PAC (Aqua-Nuchar SA) was
used as the adsorbent in one test and bentonite clay n the other .
Results from the isotherms, which were conducted using the same batch of
wastewater, are shown in Table 17 and Figures (9-14) . Data for carbon
demonstrated less-than-favorable adsorption equilibria for this particu-
lar wastewater, and in the case of bentonite, little or no adsorption
capacity was demonstrated . For PAC results, the equilibrium adsorption
data correlated well with the Freundlich (r 2 = 0 .8) isotherm model .
Using the calculated parameters for the Freundlich adsorption
model, the reactor equilibrium conditions (i .e ., when the effluent TOC =
100 as/l ; see Fig . 15 ) suggest that at a carbon dose of 50 mg/l, the
steady state reduction in TOC due to carbon adsorption would be less
than 1 .0 „g/l . However, steady state operational data on effluent
15 2
TOC
(see Fig . 16) indicates that the refinery PAC and bentonite units con-
sistently achieved greater TOC reduction efficiencies than that of the
corresponding control unit . Also increased organic removal due to PAC
addition is consistent with observations cited in a number of studies .
Several mechanisms have been proposed to explain this common
observation . Among those are adsorption of influent substrate, enhanced
biological assimilation, bioregeneration of adsorbed organics and meta-
bolic end product adsorption .
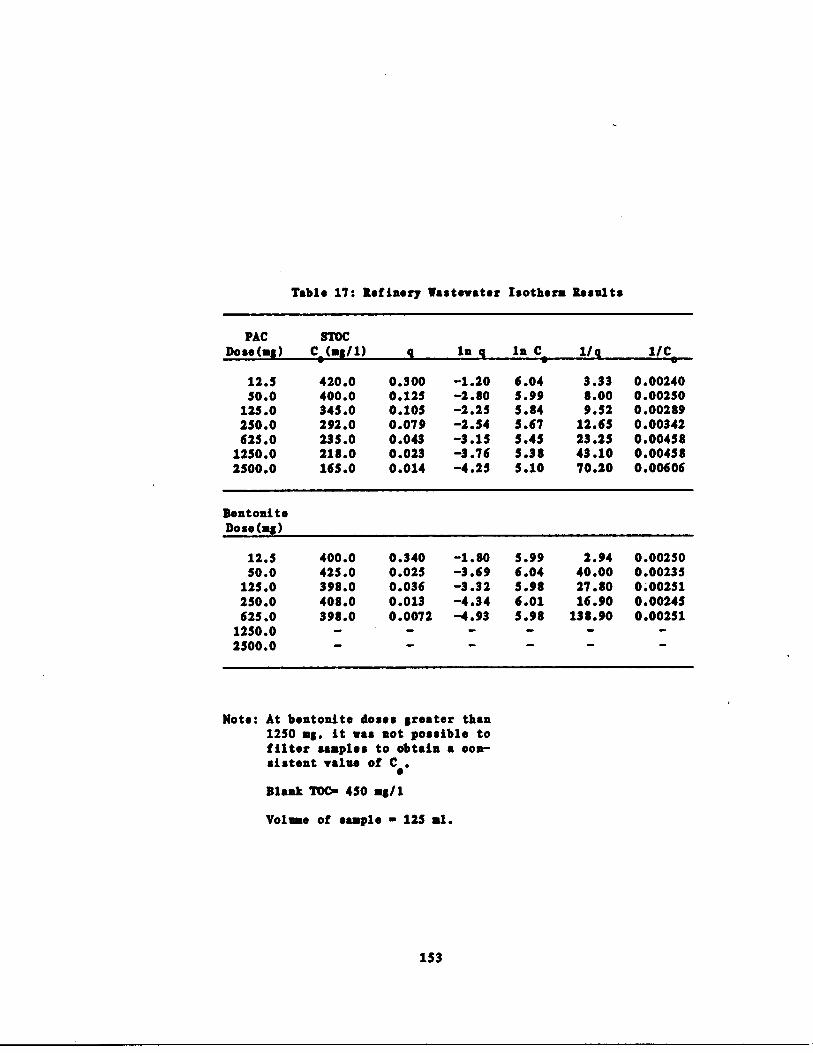
Table 17 : Refinery Wastewater Isotherm Results
Note : At bentonite doses greater than1250 mg . it was not possible tofilter samples to obtain a con-sistent value of C .
e
Blank TOC- 450 ag/1
Volume of sample - 125 al .
153
PACDoss (US)
STOCCO (ag/1) q In q In C
e1/q 1/C0
12.5 420 .0 0 .300 -1 .20 6 .04 3 .33 0.0024050 .0 400 .0 0 .125 -2 .80 5 .99 8.00 0.00250
125 .0 345 .0 0.105 -2 .25 5 .84 9.52 0 .00289250 .0 292 .0 0 .079 -2 .54 5 .67 12.65 0.00342625 .0 235 .0 0 .043 -3 .15 5 .45 23 .25 0 .004581250 .0 218 .0 0 .023 -3 .76 5 .38 43 .10 0 .004582500.0 165 .0 0 .014 -4 .25 5 .10 70.20 0.00606
BentoniteDose(mg)
12.5 400 .0 0 .340 -1 .80 5 .99 2.94 0 .0023050 .0 425 .0 0 .025 -3 .69 6 .04 40.00 0 .00235
125 .0 398 .0 0 .036 -3 .32 5 .98 27 .80 0 .00251250 .0 408 .0 0 .013 -4 .34 6 .01 16.90 0 .00245625 .0 398 .0 0 .0072 -4 .93 5 .98 138.90 0 .002511250 .0 - - - - - -2500.0 - - - - - -
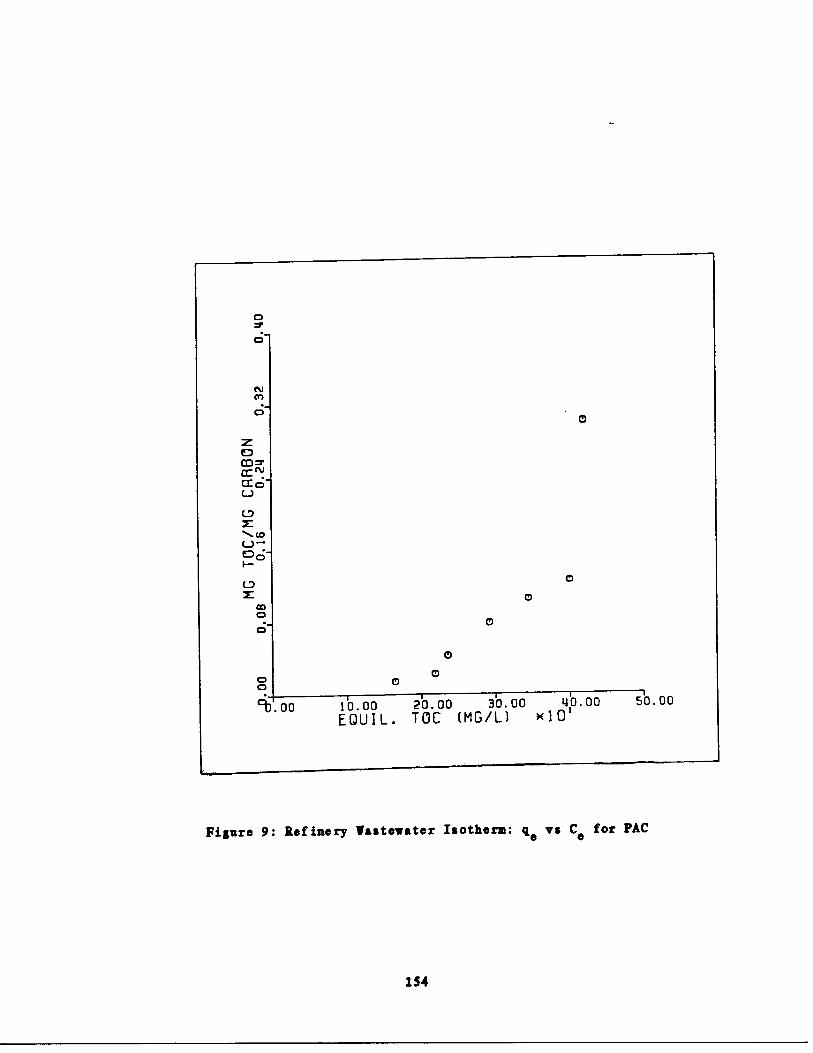
0
0
NMO
ZOm~cx:No-U(.7f
00
Figure 9 : Refinery Wastewater Isotherm : qe vs Ce for PAC
154
co0 00
000 0
9 .00 10 .00
20 .00
30.00
40.00
50 .00
EQUIL . TOC (MG/L)
N1O'
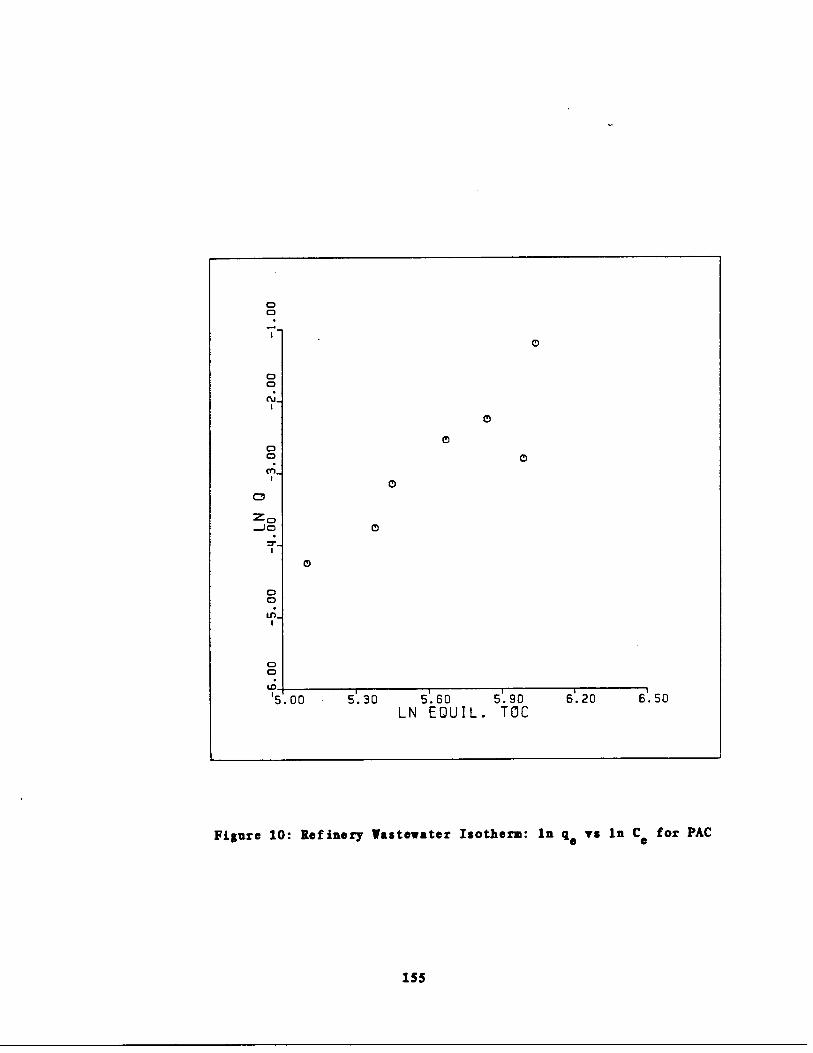
O
00
00
00
M c,J o
00
X 5 .00
5'.30
5'.60
5 '.90
6.20
6.50LN EQUIL . TOC
O
0Otn_
0
O
0
O
O
0
Figure 10 : Refinery Wastewater Isotherm : In qe vs In Ce for PAC
155
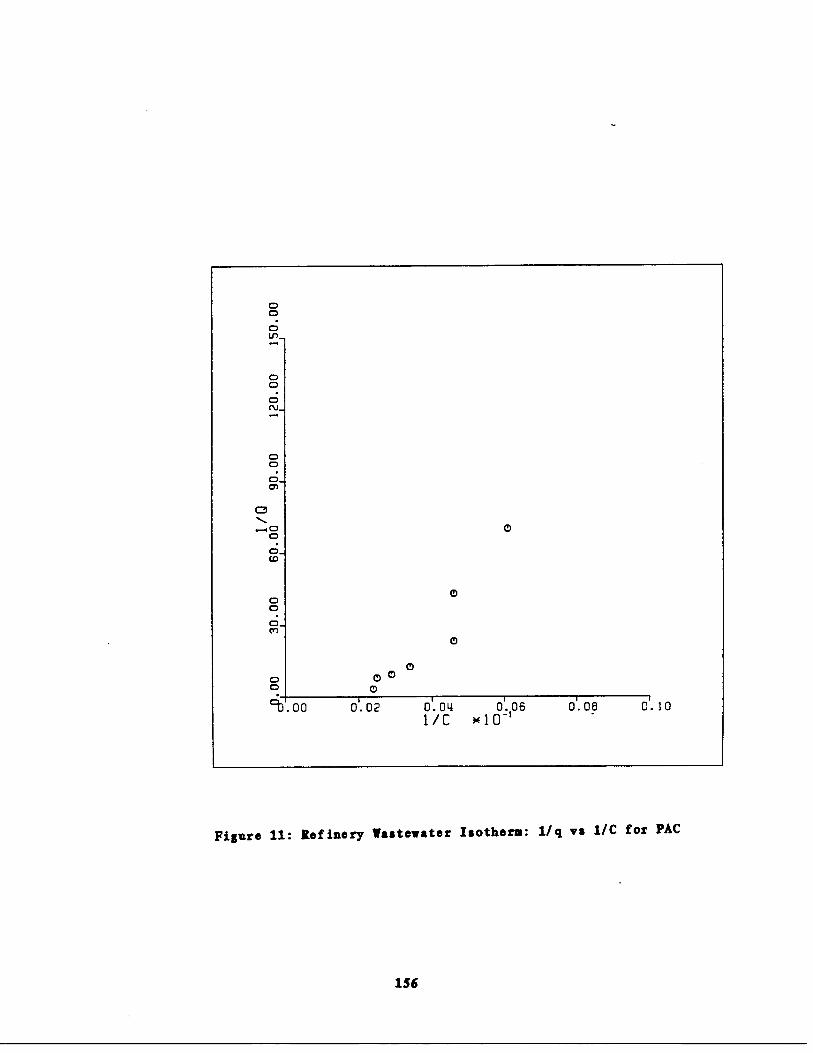
OOO
0
OO0N_
OO
Qf
00CD-m
OO
0
0
00 00
9J .00
0.02
0.04
0'.06
0.081/C
X10"'
Figure 11 : Refinery Wastewater Isotherm : 1/q vs 1/C for PAC
156
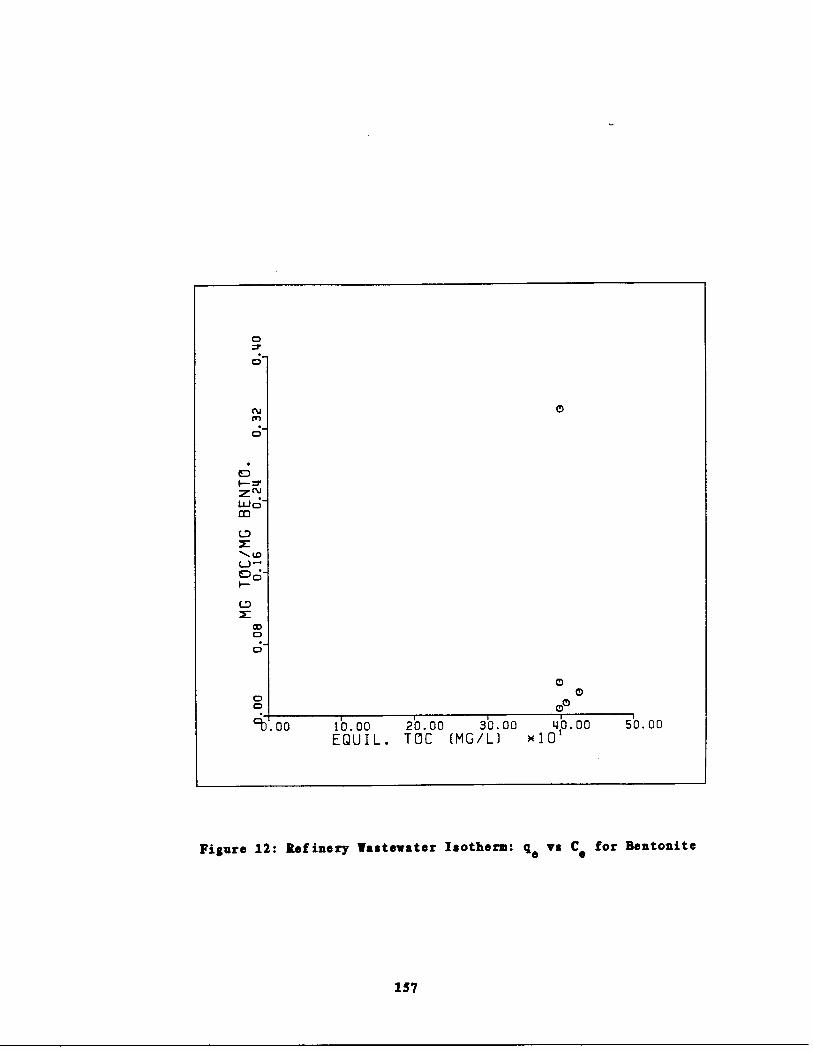
O~- VZNWo~m
C7F
00
00'0 .00
10 .00
20 .00
30.00
40.00EQUIL . TOC (MG/L)
N1O'
0
0
NM0
0
150 .00
Figure 12 : Refinery Wastewater Isotherm : qe vs Ce for Bentonite
15 7
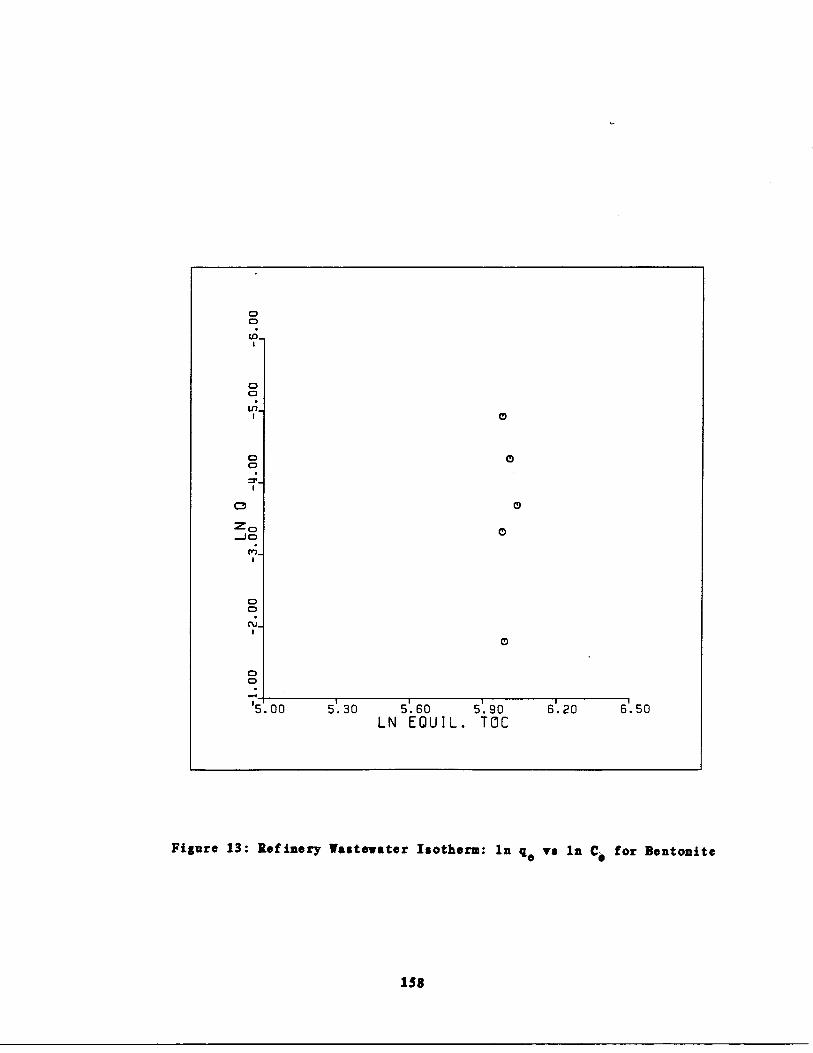
C30
00N_
00
Z:C ,J o
00
00
5 .00
O
0
O
5 .30
5 .60
5 .90LN EOUIL . TOC
O
O
6 '.20
61.50
Figure 13 : Refinery Wastewater Isotherm : In qe vs In Ce for Bentonite
158
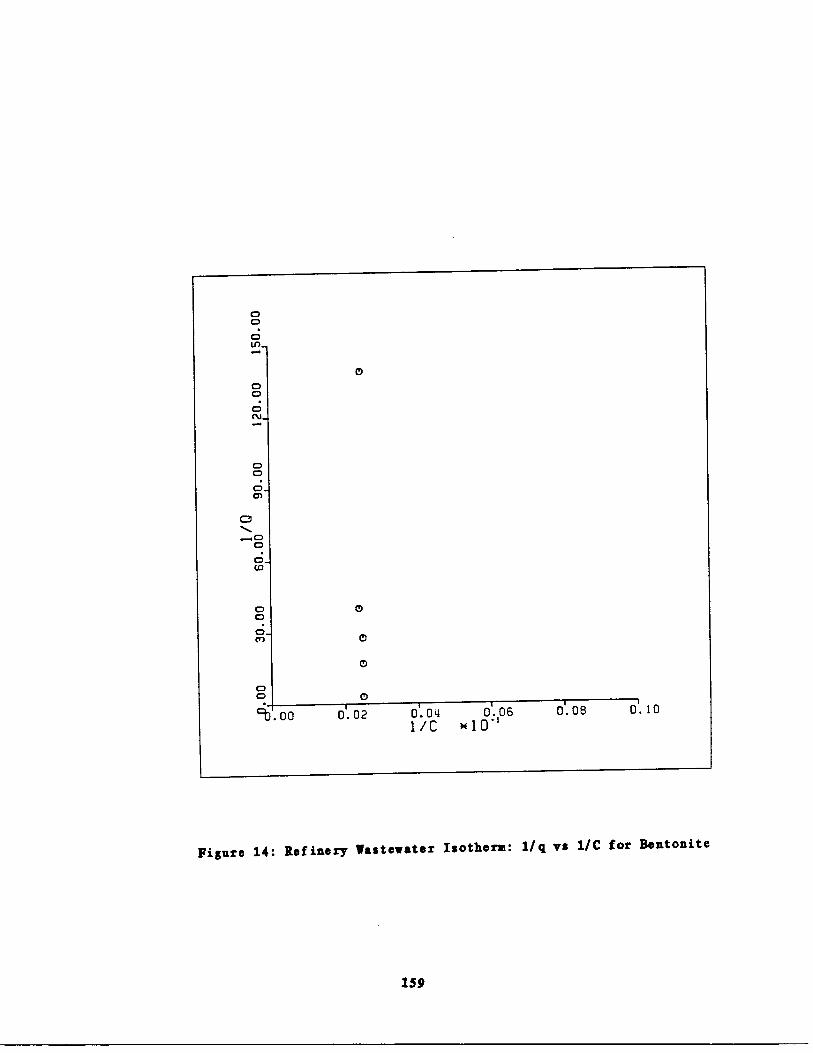
OOOU,
OOON
O0O_O
QOOO
0OCD-(r)
OO
0
0
O
O
0
x.00
0 '.02
0 '.04
0 '.06
0 '.08
0 '.101/c )10 '
Figure 14 : Refinery Wastewater Isotherm : 1/q vs 1/C for Bentonite
159
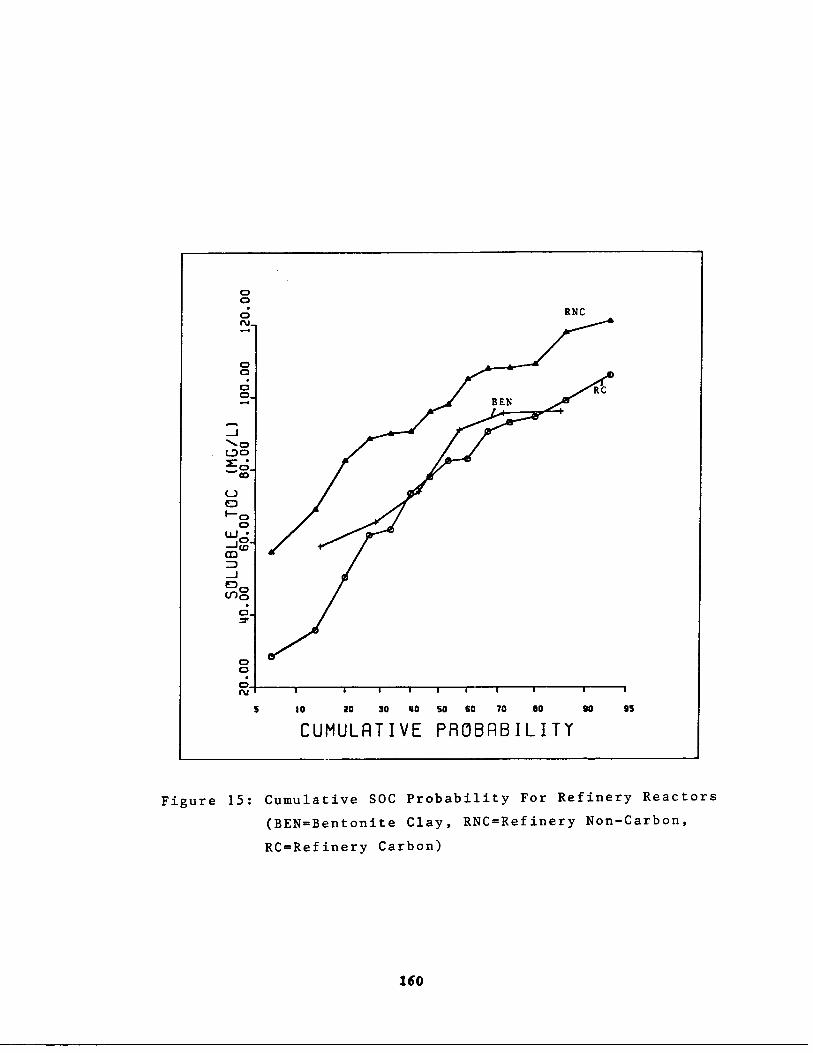
C300N-
0OOO-
J'~'o(Do~ o-,. .0
UO~' o0woM `•
J
V) OC3-_r
000N
5
10
I I
I
I
i
20
!0
40 50
60
160
CUMULATIVE PROBABILITY
RNC
I
70
so
9o
t
95
Figure 15 : Cumulative SOC Probability For Refinery Reactors(BEN=Bentonite Clay, RNC=Refinery Non-Carbon,RC=Refinery Carbon)

Figure 16 : Cuimulative TOC Reduction Efficiency Probability
(GC-Glucose Carbon, GNC=Glueose Non-Carbon, BEN=Bentonite Clay,
RC-Refinery Carbon, RNC-Ref inert' Non-Carbon)
161
The results from the isotherm study suggest that the increased TOC
removals in the PAC unit are due to some mechanisms) other than the
steady state adsorption of the influent substrate . This is supported,
although less dramatically, by the steady state effluent TOC data for
the glucose-fed reactors (see Fig . 17) . Although glucose is a non-
adsorbable substrate, the PAC reactor generally outperformed the non-PAC
reactor in TOC reduction . Therefore it appears that in this study,
influent substrate adsorption is not important under steady state condi-
tions because PAC is at equilibrium with the treated effluent compounds
and concentration rather than the influent compounds and concentration .
Other mechanisms such as enhanced biological assimilation (EBA)
can be considered an explanation for increased organics removal . In
other studies, increased steady state oxygen uptake rates and/or
increased 1LVSS in PAC units over non-PAC units were taken as evidence
for EBA. In this study steady state data on oxygen uptake rates and
MUSS concentration (see Table 18) taken at various intervals throughout
the entire study period provides no definite evidence to support the
existence of EBA. In fact, the NLVSS concentrations in the PAC and ben-
tonite clay reactors were generally less than in the corresponding con-
trol reactor .
One possible mechanism that may account for the observed TOC
reduction by PAC is metabolic end product (MEP) adsorption . MEP are
organics of microbial origin (i .e ., metabolites, slime or cellular com-
ponents from lysed organisms) . Recent studies by Schultz (1982) with
radioactively labeled phenol substrates showed that 75% of the KEP pro-
162
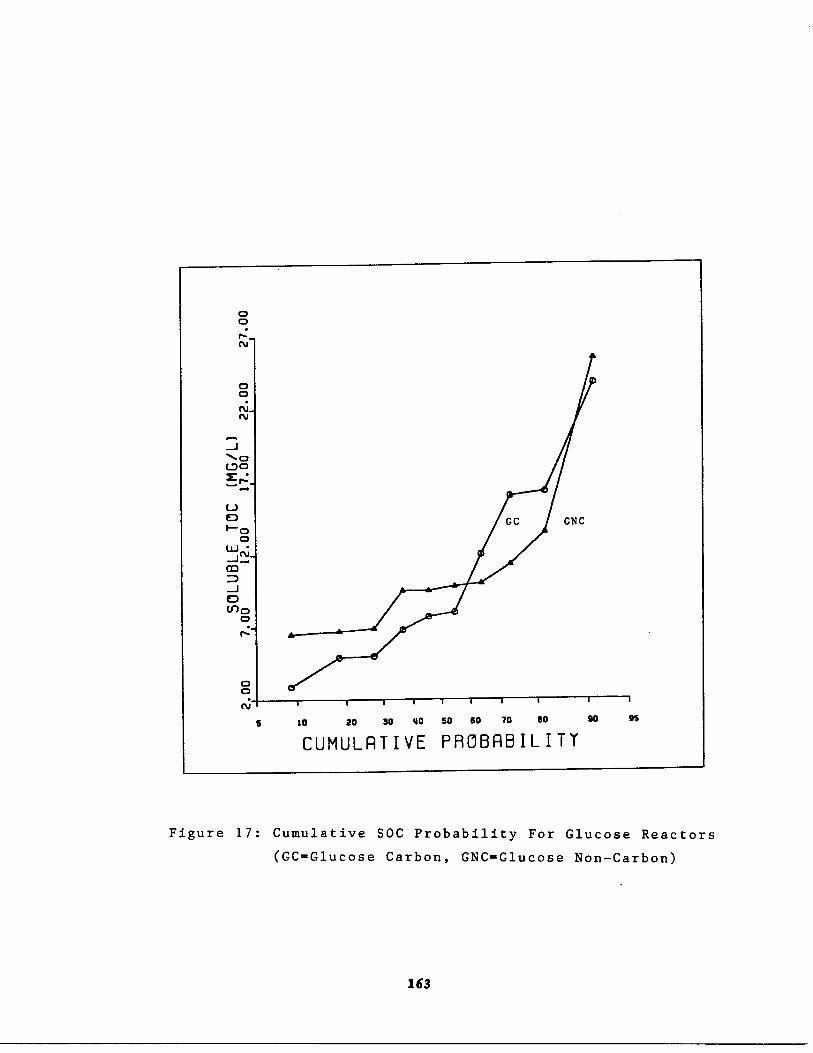
Figure 17 : Cumulative SOC Probability For Glucose Reactors(GC=Glucose Carbon, GNC=Glucose Non-Carbon)
163
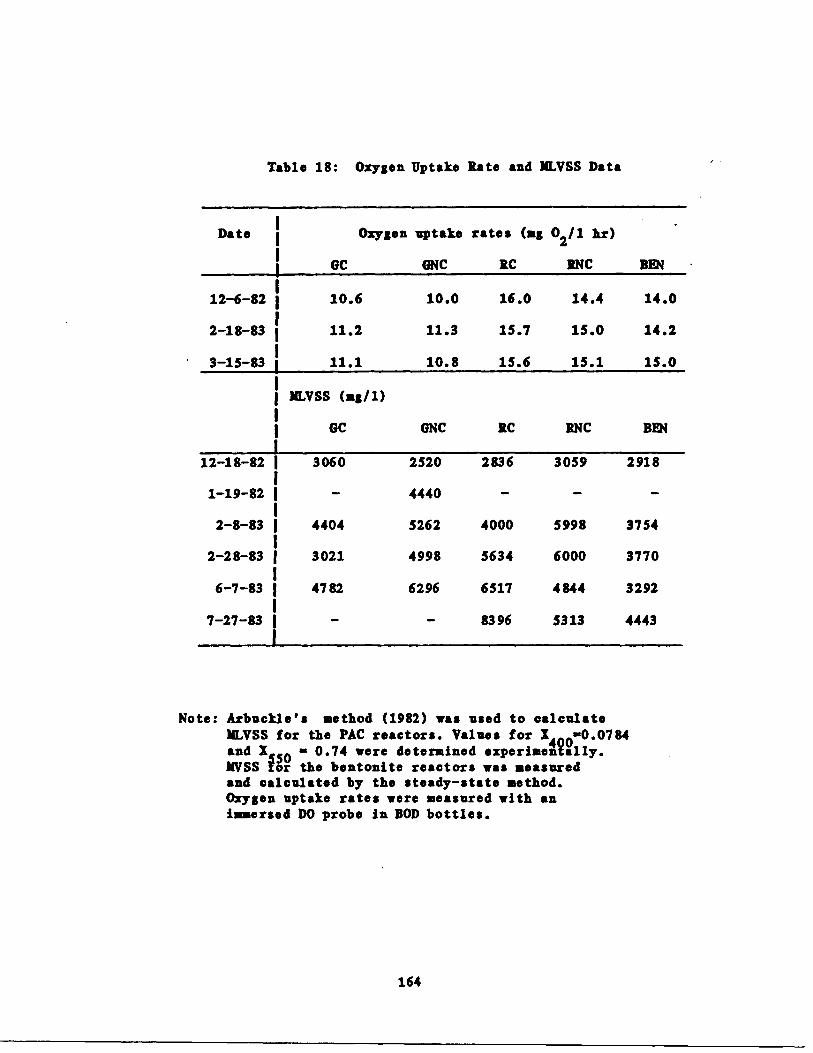
Table 18 : Oxygen Uptake Rate and 1Q .VSS Data
Note : Arbuckle's method (1982) was used to calculate1Q.VSS for the PAC reactors . Values for 14 0=0 .0784and Z 50 0 .74 were determined experimentally .MVSS !or the bentonite reactors was measuredand calculated by the steady-state method .Oxygen uptake rates were measured with animmersed DO probe in DOD bottles .
164
Date Oxygen uptake rates (mg 02/1 hr)
GC GNC RC RNC BD
12-6-82 10 .6 10 .0 16 .0 14 .4 14 .0
2-18-83 11 .2 11 .3 15 .7 15 .0 14 .2
3-15-83 11 .1 10 .8 15 .6 15 .1 15 .0
ILVSS (mg/1)
GC GNC BC RNC BEN
12-18-82 3060 2520 2836 3059 29181
1-19-82 ~ 4440 - -
2-8-83 ~ 4404 5262 4000 5998 3754
2-28-83 3021 4998 5634 6000 3770
6-7-83 4782 6296 6517 4844 3292
7-27-83 - - 8396 5313 4443
duced from the biodegradation of phenol was irreversibly adsorbed by
PAC . Other studies (as cited in Schultz (1982)) suggested that the
adsorption of IIEP may play an important role in PAC systems, especially
if the wastewater to be treated contains a low amount of adsorbable com-
pounds .
The less pronounced differences in TOC removal efficiencies noted
for the glucose reactors (see Fig . 17) may be attributed to the differ-
ence in substrate fed. glucose is a very simple and easily biodegrad-
able substrate, whereas the refinery wastewater contains a wide variety
of very complex compounds, many of which biodegrade very slowly (see
Table 16) . The differences in substrate no doubt influence the micro-
bial population in the respective reactors -- thus influencing the
nature and quantity of IIEP produced .
tonite unit performed as effectively as the PAC unit with respect to TOC
removal efficiency . If indeed the KEP adsorption theory is valid in
this situation, a MEP isotherm study with bentonite should be under-
taken.
Aniline Isotherms
Two isotherms were performed using aniline as the adsorbate with
PAC and bentonite as the adsorbents . The results, shown in Tables 19-20
and Figures (18-21), indicate that aniline is nonadsorbable on bentonite
and adsorbable on PAC . Aniline was not adsorbed at bentonite doses of
less than 1000 mg/1, consequently these dosages were excluded in the
calculation of isotherm parameters .
The equilibrium "data for the
165
It should be noted that the ben-
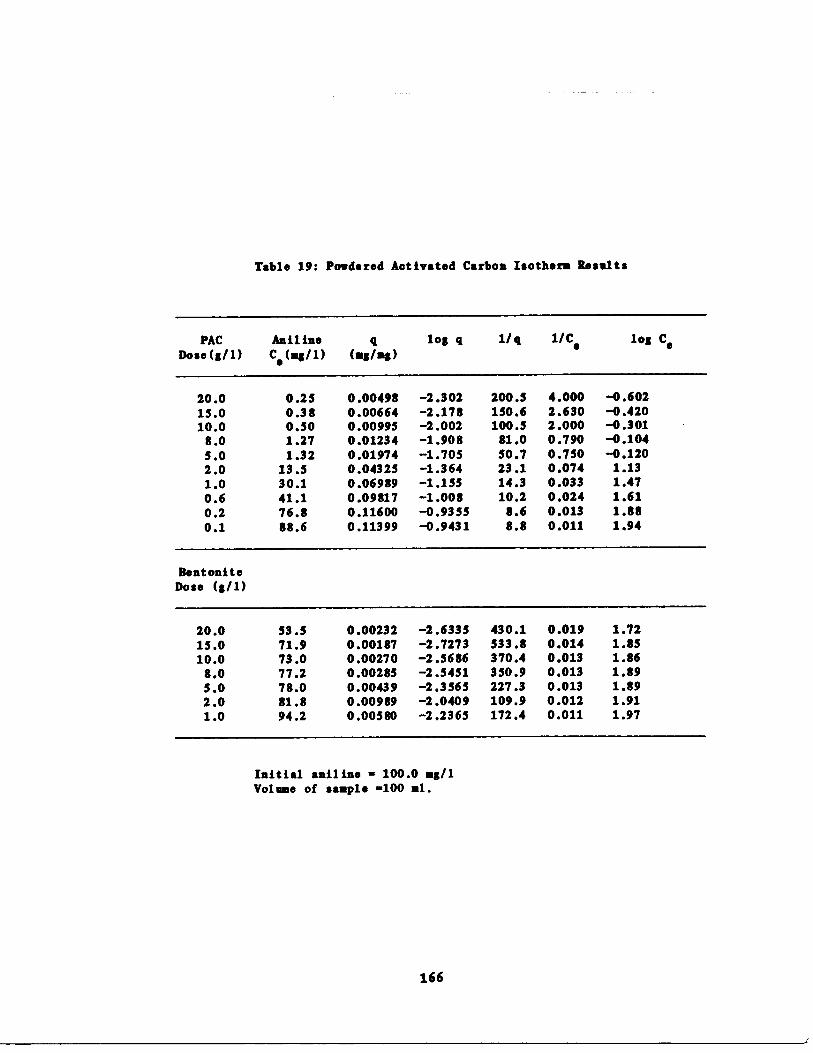
Table 19 : Powdered Activated Carbon Isotherm Results
Initial aniline - 100 .0 mg/1Volume of sample -100 „l .
166
PACDose(g/l)
AnilineC0 (mg/1)
q(mg/mg)
log q 1/q l/Ce log Ce
20 .0 0 .25 0 .00498 -2 .302 200 .5 4 .000 -0 .60215 .0 0 .38 0 .00664 -2 .178 150 .6 2 .630 -0 .42010 .0 0 .50 0 .00995 -2 .002 100 .3 2 .000 -0 .3018 .0 1 .27 0 .01234 -1 .908 81 .0 0 .790 -0 .1045 .0 1 .32 0 .01974 -1 .705 50 .7 0 .750 -0 .1202 .0 13 .5 0 .04325 -1 .364 23 .1 0 .074 1 .131 .0 30 .1 0 .06989 -1 .155 14 .3 0 .033 1 .470 .6 41 .1 0 .09817 -1 .008 10 .2 0 .024 1 .610 .2 76 .8 0 .11600 -0 .9355 8 .6 0 .013 1 .880 .1 88 .6 0 .11399 -0 .9431 8 .8 0 .011 1 .94
BentoniteDose (g/1)
20 .0 53 .5 0 .00232 -2 .6335 430 .1 0 .019 1 .7215 .0 71 .9 0 .00187 -2 .7273 533 .8 0 .014 1 .8510 .0 73 .0 0 .00270 -2 .5686 370 .4 0 .013 1 .868 .0 77 .2 0 .00285 -2 .5431 350 .9 0 .013 1 .895 .0 78.0 0 .00439 -2 .3563 227 .3 0 .013 1 .892 .0 81 .8 0 .00989 -2 .0409 109 .9 0 .012 1 .911 .0 94 .2 0 .00580 -2 .2365 172 .4 0 .011 1 .97
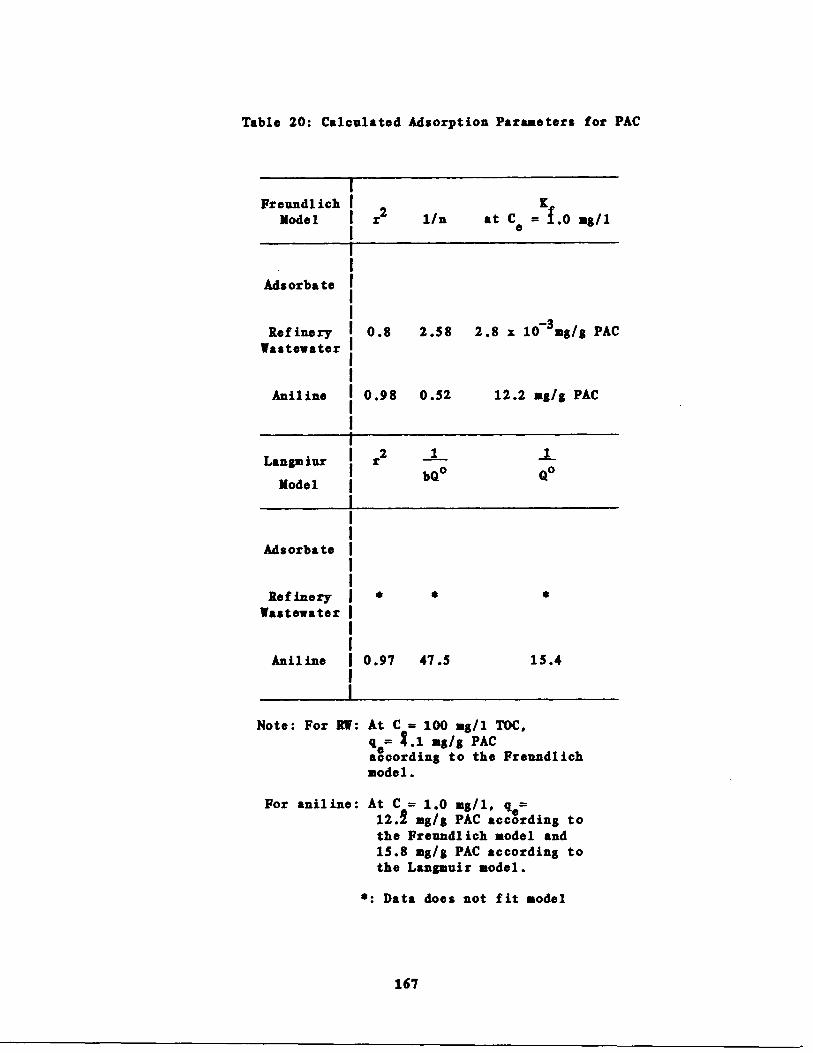
Table 20 : Calculated Adsorption Parameters for PAC
Freundlich I
IgModel
I r2
1/n
at Cc = 1 .0 ag/i
Note : For RW : At C = 100 ag/l TOC,qc= 3 .1 ag/g PAC
according to the Freundlichmodel .
For aniline : At C = 1 .0 mg/1, qe=12 .1 mg/g PAC according tothe Freundlich model and15 .8 mg/g PAC according tothe Langmuir model .
: Data does not fit model
1 67
I
Adsorbate
RefineryWastewater
Aniline
0 .8
0 .98
2 .58
0 .52
2 .8 x 10-3 mg/S PAC
12 .2 ag/g PAC
1 1Langmiur r2
Model bQ• Qo
Adsorbato
Refinerywastewater
Aniline 0 .97 47 .5 15 .4
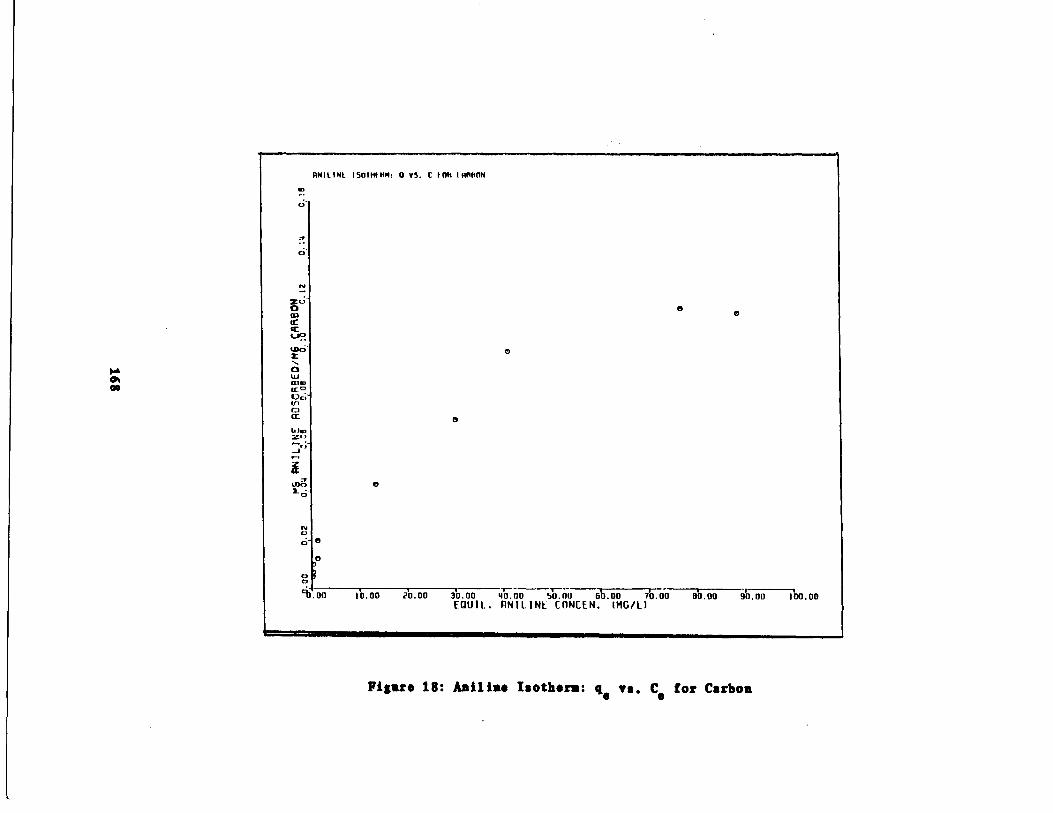
y
N
aolr~ -
0WaimQoOo'Un
WmLU:I, -
zal0~3'0
NO0
RNILINL ISOIMIHM : 0 VS . C FOR IRRHON
0
O
0
O7
oO
'0 .00
10 .00
20.00
0
00
30.00
40.00
50 .00
60.00
70.00
ob . 00
90 .00
100.00EOUIL . RNILINL Cf1NCEN . IMG/L1
Figure 18: Aniline Isotherm : qe vs . Ce for Carbon

Figure 19 : Aniline Isotherm : log qe vs . log Ce for Carbon
169
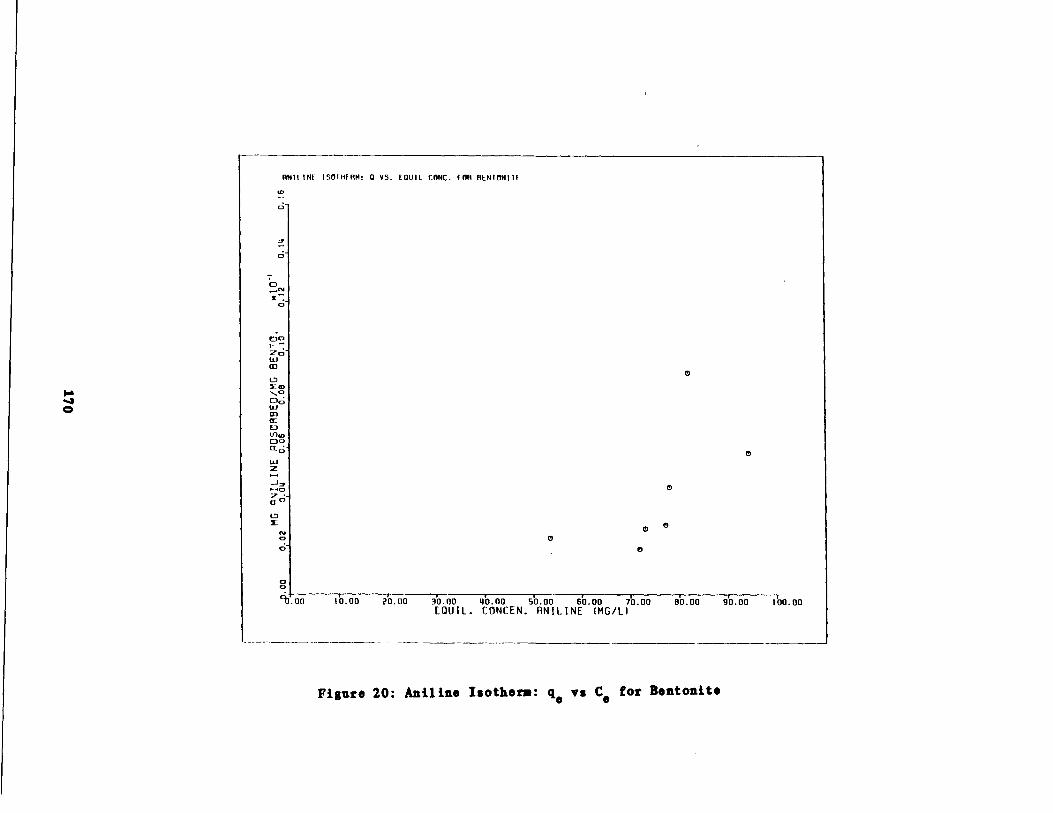
QOZoWm1.7TmUiwmm
(00OofZoWZJyzc;-a .
EN00
ANILINE ISOIHFMM : 0 VS . LOUIL CONC . ION SLNIONIIL
y0
O
a0'0.00
10.00
20 .00
O0
0
30.00
40.00
50 .00
60 .00
70 .00EOUIL . CONCEN . ANILINE (MG/L)
0
0
0
0
BO . DO
90.00
1 ,00.00
Figure 20 : Aniline Isotherm : qe vs Ce for Bentonite
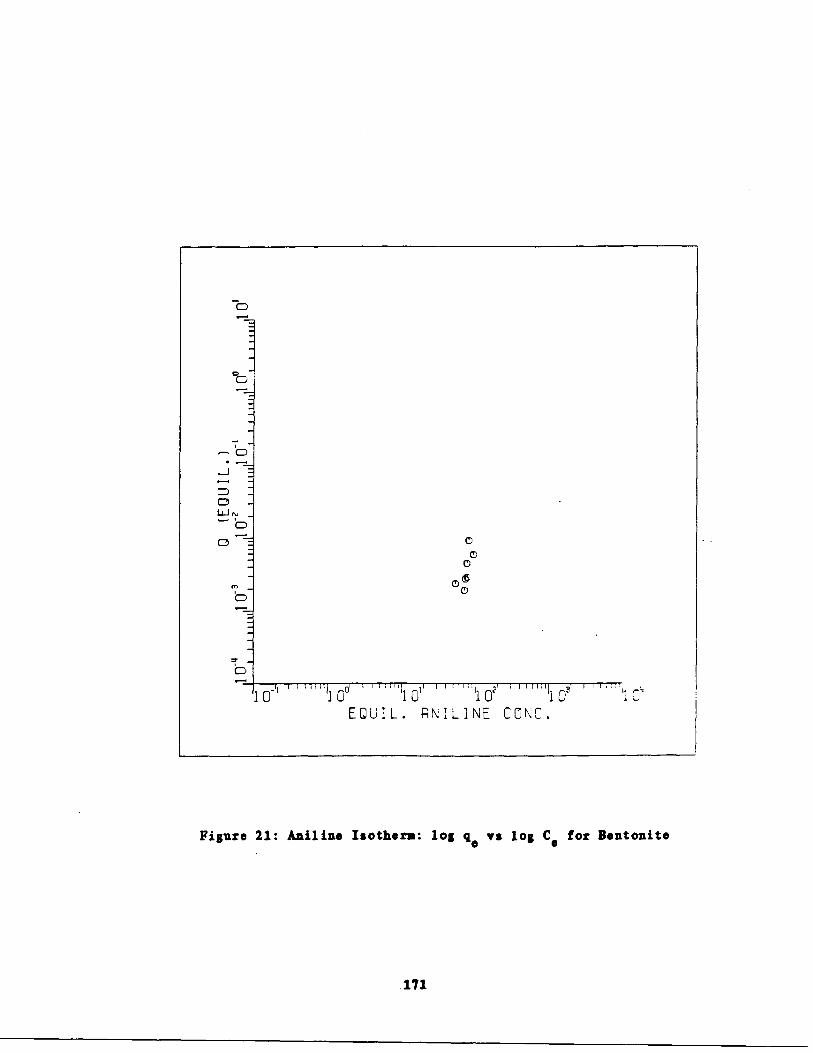
G
o -G
OO
O
O
MOWa -O
O
T -O
G
10
10
10
1
10EQUIL . ANILINE CONC .
Figure 21 : Aniline Isotherm : log qe vs log Ce for Bentonite
.171
adsorption of aniline on carbon fitted both the Freundlich (r2 = 0 .98)
and the Langmuir (r2 = 0 .97) reasonably well . Figure 18 shows that the
PAC isotherm resembles that typical of an isotherm described by the
Langmuir model . This suggests monolayer solute disposition and reversi-
ble adsorption sites on the carbon surface . Equilibrium considerations
suggest that approximately 12.2 mg of aniline per gram of carbon is
adsorbed at a equilibrium aniline concentration of 1 .0 mg/l . Calculated
adsorption parameters for both the refinery and aniline isotherms are
shown in Table 20 .
BATCH INHIBITION EXPERIMENTS
A series of batch experiments was performed for the various inhi-
bitors used in the study. In order to interpret observed nitrification
rates, some quantitative method of determining a reaction parameter was
needed . Using knowledge of the half-saturation Monod coefficients, a
zero-order kinetic method can be used .
It has been shown that the SS value for nitrification is in the
range of 0 .5 to 2 .0 mg/l ; therefore, for ammonia concentrations above
2 .0 ag/l one can use zero-order kinetics to describe ammonia oxidation .
The kinetic expression for ammonia oxidation in a batch reactor becomes :
dNH _ -gdt
If ammonia oxidation is rate limiting, the nitrate production can be
similarly modeled :
172
(48)
-dNO
3 a Kdt (49)
Therefore the rate constant, K, can be determined using simple linear
regression when the of ammonia concentration is above a few milligrams
per liter .
Data analysis included linear regression for the evaluation of the
ammonia and nitrate reaction constants from observed zero order kinetics
and covariance analysis using the Generalized Linear Model (GLM) pro-
cedure of the Statistical Analysis System (SAS, 1981) . Covariance
analysis tests for the heterogeneity of the slopes between the treatment
group (i .e ., in the presence of the added compound) and the control
group . This analysis was restricted to comparisons between test and con-
trol groups since they differ only in the presence or absence of the
added inhibitory compound .
The calculated reaction rate constants, K for each experimental
flask are shown in Table 21 . In general, for RR derived flasks, the K
values for ammonia oxidation and nitrate production were not found to be
in stoichiometric agreement ; nitrate production rates were usually
higher than the corresponding ammonia oxidation rates . This was
ably due to excessive cellular lysis releasing nitrogen . from the addi-
tion of the inhibitory compound or because of the inherent analytical
difficulties associated with the measurement of nitrate in this particu-
lar type of wastewater (see Analytical Methods) . For this reason the
ammonia data, which was considered to be more reliable than the nitrate
data, was selected for further analysis .
173
prob-

Table 21 : Ammonia Oxidation Constants, Z and Regression Coefficients, r
NANI- aca-odsorbabic, sea-inhibitory compound
OC - $Income carbon remoterAI- adsorbable. inhibitory compound
ONC - $Incose aou-carbon reactorNAI- .oradsorbabls, inhibitory composed
RC - refinery carbon reactorANI- adsorbable, son-inhibitory compound
INC - refinery son-earboa reactor1- ammosta oxidation rate
so"!
mg NN /hour
iN - refinery beatositsr- linear regression correlation cosffielJat
Appended C dcaotes correspoadiag control
spiked Compound Type OC 0CC ONC ONCC iC ice iNC iNCC iN MC
Asrylonitrils NNII r : 0.96 0.99 0.96 0 .99 0.95 0 .97 0.92 0.97 0 .92 0.9010 „g/l -1 3 .47 3 .33 3.35 3 .20 2.39 2 .49 1.25 1.40 1 .07 1 .13(3/3) ~ ~
Mills. AI r 0.95 0.98 0 .72 0.99 0 .94 0.99 0.96 0.99 0.89 0 .9910 mg/l -1 5.12 6.98 1 .87 5.92 4 .76 5.47 4 .17 4.82 3.77 4 .14(6/14)
Duplicate ~ r 0 .90 0 .99Test 4 .82 6 .98
Asilise AI r 0.88 0.094 0 .66 0.502 0 .97 0.96 0.94 0.98 0.81 0.9510 mg/i -1 0.9 0 .03 -0.39 -0 .269 1 .44 1.83 0 .84 1 .73 0.49 1 .42(2/28)
Cyanide MAX r 0 .01 0.99 0.99 0 .97 0.97 0 .93 0.97 0.93 0 .99 0.983 mg/1 -1 0.66 2.9 1 .39 3 .76 1 .25 2.46 1.3 2.15 0.752 1.70(4/28)
Cyanide NAI r 0.12 0.99 0 .49 0.97 0.70 0.96 0 .80 0.95 0.89 0 .943 mg/1 -1 -0.16 4 .51 0.72 3 .88 2.17 4 .86 1 .33 2 .37 1.77 2.5(6/7)
Phenol AI r 0 .69 0.95 0 .93 0.94 0.96 0.94 0.99 0 .98 0.97 0 .9610 mg/1 -1 1 .26 2.89 2 .69 3 .65 2 .46 2.51 1 .84 1 .83 1.82 1 .77(3/13)
Phenol AI r 0.90 0 .99 0.67 0 .97 .099 0 .97 0.90 0.91 0 .98 0.96
20 mg/1 -i 4 .36 5 .42 1.59 4 .42 3.20 3 .46 2.65 2 .44 2 .03 2.1(5/25)
Toisoao MI r ' 0.99 0.99 0 .99 0.99 0 .90 0.95 0 .96 0.99 0.97 0.931001/1 A 5.30 5.44 5 .24 5 .19 4 .22 4 .02 3 .15 3 .13 4 .24 3 .29(6/10)
Duplicate r 0.97 0.99Test -1 3.88 4 .03
Table 22 presents the ammonia oxidation rate constant in terms of
an inhibition coefficient, "I". I is defined as the ratio of I in the
presence of the added compound to I of the control flask . This is done
to facilitate comparisons among the different reactor types and the
degrees of inhibition observed . An I value of 1 .0, or less than 1 .0
would indicate, respectively, no inhibition, or an inhibitory effect on
nitrification, due to the added inhibitory compound .
Inspection of Table 22 reveals that the addition of acrylonitrile
(non-adsorbable) and toluene (adsorbable), which are both known to be
non-inhibitory to nitrifiers, did not significantly affect the rate of
nitrification . With the exception of two cases (toluene in the benton-
ite reactor, 1=1 .29, and acrylonitrile in the refinery wastewater non-
carbon reactor, 1=0 .85), all I values for all flasks are close to unity .
Duplicate tests on the same reactor type in two separate test runs
(i .e ., aniline and toluene) indicated that the reproducibility of I,
within an experimental run is approximately 7% or less .
The original intent of performing experiments with known non-
inhibitory compounds was not only to provide for the evaluation of a
full spectrum of compounds, but also to provide a means of determining
the precision experimental technique . In this respect, the results with
the non-inhibitory compounds show that these objectives are met .
Table 22 shows that for adsorbable/inhibitory compounds such as
aniline or phenol, the benefits of PAC addition are pronounced for unac-
climated activated sludges (i .e ., glucose fed reactors) . In two cases
out of three, the PAC reactor was able to handle a shock load of the
175
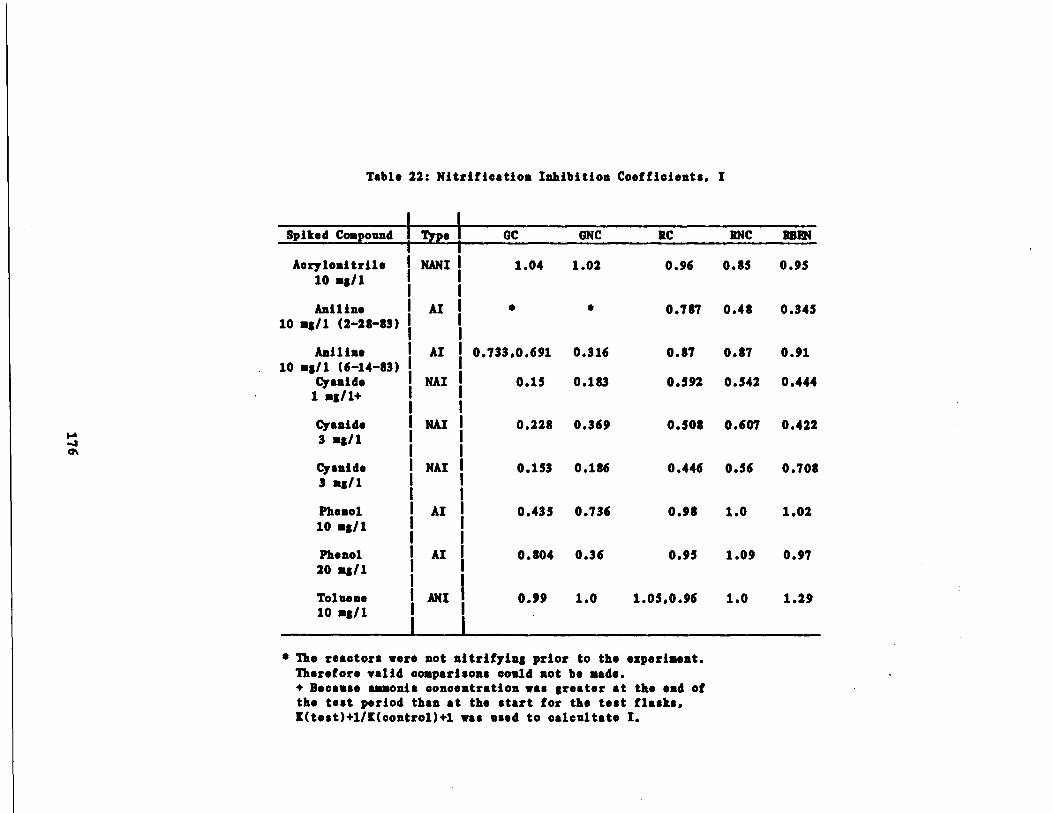
Table 22: Nitrification Inhibition Coefficients, I
„
The reactors were not nitrifying prior to the experiment .Therefore valid comparisons could not be made .+ Because ammonia concentration was greater at the end ofthe test period than at the start for the test flasks,[(test)+1/t(control)+1 was used to calcultate I .
ISpiked Compound 1 Type
OC ONC RC RNC BBFN
Aorylonitrile MANX 1 .04 1 .02 0 .96 0 .85 0 .9510 Us/1
Aniline AI 4 01 0 .787 0.48 0.34510 a3/1 (2-28-83)
Aniline Al 0 .733,0 .691 0.316 0 .87 0 .87 0 .9110 „g/l (6-14-83)
Cyanide1 as/I+
NAI 0 .15 0 .183 0 .592 0 .542 0 .444
Cyanide3 ag/l
NAI 0 .228 0 .369 0 .508 0.607 0.422
Cyanide3 USA
NAI 0 .153 0.186 0 .446 0 .56 0 .708
Phenol AI 0 .435 0 .736 0 .98 1 .0 1 .0210 mg/1
Phenol AI 0 .804 0 .36 0.95 1 .09 0.9720 mg/1
Toluene ANI 0 .99 1 .0 1 .05,0 .96 1 .0 1 .2910 mg/1 '
inhibitory compound such more readily than the corresponding non-PAC
reactor . In the case where the non-PAC unit outperformed the PAC unit
(according to I values), the difference is not statistically signifi-
cant, and will be discussed further later .
As seen in Table 22, the differences among the refinery wastewater
fed reactors subjected to adsorbable inhibitors are less pronounced than
that of the glucose fed reactors . This is attributed to the ability of
the microorganisms to acclimate to a particular type of wastewater feed .
Since the microorganisms in these reactors were routinely exposed to a
wide variety of inhibitory compounds in the refinery wastewater for an
extended period of time (including aniline and phenol), it is speculated
that the adsorption due to the relatively low PAC or bentonite dose
(i .e ., 50 ag/l feed) used was not sufficient to provided any further
improvement beyond the benefits of acclimation .
It should be noted however, that in the first batch experimental
run conducted (i .e ., 10 mg/l aniline), the PAC reactor outperformed the
corresponding non-PAC and bentonite reactors . It is conceivable that
the refinery reactors, at this earliest stage of experimentation, were
not yet fully acclimated to the wastewater . This then, would provide a
sore sensitive experiment for the detection of any beneficial effect of
the added carbon . A similar experiment with 10 mg/l aniline which was
run 3 1/2 months later showed no appreciable benefit of PAC for the
refinery reactors .
177

Perhaps the strongest evidence for microbial acclimation ability
in the refinery wastewater is the experiments when cyanide was spiked .
Table 22 shows that cyanide, a non-adsorbable inhibitor, had detrimental
effect on all measured nitrification rates . Although the results are
inconclusive with respect to any observable benefit of added PAC or ben-
tonite, the benefits of acclimation are evident in all three runs in
which cyanide was tested (refinery wastewaters usually have some small
cyanide concentration) .
Table 23 presents a more rigorous analysis of the batch inhibition
experiments with a pre-established criteria for judging the benefit of
-PAC or bentonite addition . The results of covariance analysis (SAS,
1981) on ammonia oxidation rate data for all experimental runs are shown
in this table . Covariance analysis can be described as combining the
methods of linear regression and analysis of variance . In this study,
the null hypothesis (i .e ., no difference between the test and control
flasks) is tested, and either accepted or rejected according to a
prescribed level of probability, using the F statistic . The F statistic
is defined as the ratio of the variance between oxidation rates in the
test flask and control flask to the variance within each flask ;
F = 02 (between)
a2 (within)
Theoretically, the two variance estimates should be equal if the null
hypothesis is true, however due to sampling fluctuations F may differ
substantially from 1 .0 .
178
(51)
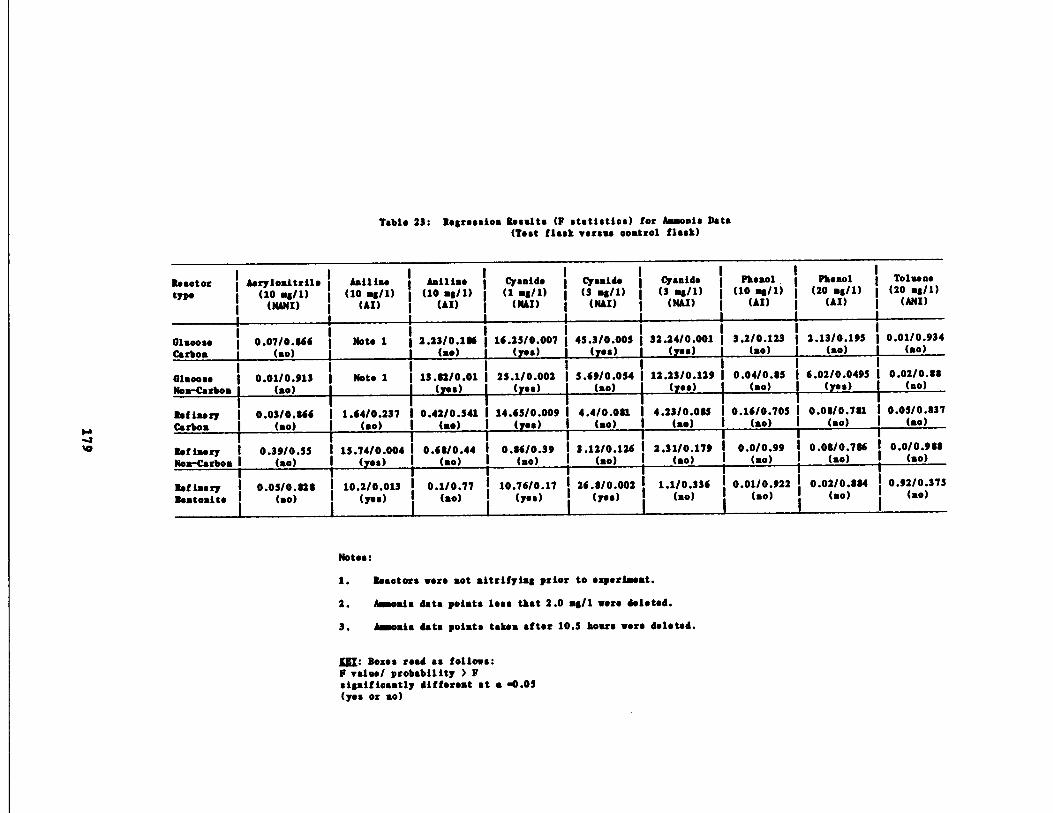
Table 23 : Regression Results (F statistics) for Aaaonia Data(Test flask versus control flask)
Notes :
1 .
Reactors were not nitrifying prior to ozperiasat .
2 .
Amonia data points loss that 2 .0 ag/l were deleted .
3 .
Aaaoaia data points taken after 10 .5 hours were deleted .
…,j : Horns road as follows :F value/ probability > Fsignificantly different at a -0 .05(yes or so)
Reactor Aoryloaitrile Aniliue Aniline Cyanide Cyanide Cyanide Phenol, Phenol Toluene
type (10 mg/1)(MIANI)
(10 as/1)(AI)
(10 a8/1)(AI)
(1 US/1)(NH)
(3 al/1)MI)
(3 as/1)(NAI)
(10 ag/1)(AI)
(20 mg/1)(AI)
(20 ag/1)(AND
Glucose 0 .07/0 .866 Note 1 2 .23/0.166 16.25/0.007 43 .3/0 .005 32 .24/0.001 3 .2/0 .123 2.13/0 .195 0 .01/0 .934
Carbon
1 (so)
) ) (so) (yes)
) (yes)
1 (yes) (so) (so) (so)
glucose I 0 .01/0 .913 I
Note 1 113 .82/0.01 125 .1/0.002 15 .69/0 .054 112 .23/0 .129 10 .04/0 .85 6 .02/0.0495 0 .02/0 .88
Non-Carbos (no) (yes) (yes) (no)I I
(yes) (ao) (yes) (as)
Refinery I 0 .03/0 .866 1 .64/0.237
I10 .42/0.341 14.65/0 .009 14.4/0 .081 14 .23/0.085 10 .16/0.705 10 .08/0 .781 10.05/0 .837
Carbon I
(so) (so) (so) (yes) i
(as) i
(so) I
(so) I
(no) I
(so)I 1 1 1 1 1
Refinery i
0 .39/0 .55 13 .74/0.004 0 .68/0.44 0 .86/0.39 13 .12/0 .126 12 .31/0 .179 I 0.0/0 .99 10 .08/0.786 0 .0/0.988
Now-Carbon I
(so) (yes) (so) (so) i
(so) I
(so) i
(so) i
(no) (so)
1 1Refinery I 0.05/0.828 110 .2/0 .013 0 .1/0.77 10.76/0 .17 126 .8/0.002 I 1 .1/0 .336 1 0.01/0.922 1 0 .02/0.884 0.92/0.375
Reatoaits i
(so) i
(yes) (so) (yes) i
(yes) i
(so) i
(so) i
(so) (so)

For a given sample size and level of significance, the larger the
F value, the more significant the difference between the variates . The
prob > F is the observed level of significance of F or the probability
of accepting the null hypothesis if true . Thus, the larger the prob>F
value, the greater the credibility associated with the accepting the
null hypothesis . The level of significance typically used to reject the
null hypothesis is either 0.01, 0 .05, or 0 .1 . In this study, the
preselected level of significance is 0 .05 . Thus, if the null hypothesis
is rejected at a 0.05 level of significance, it may be said with 95%
confidence that the rates of ammonia oxidation between the test and con-
trol units differ and that this difference is attributed to the differ-
ences between the control and experiment, which for this case is only
the presence of the inhibitory compound .
The results of the statistical analysis confirm the generaliza-
tions drawn from the table of inhibition coefficients . No differences
are observed for the non-inhibitory compounds regardless of adsorption
characteristics . The statistical results for cyanide, a non-adsorbable
inhibitor, show no definite advantage in adding either PAC or bentonite .
In fact, the non-PAC units performed as well or better than the PAC or
bentonite units when spiked with cyanide . For the adsorbable inhibi-
tors, the benefit of PAC is clearly demonstrated in unaccliaated
activated sludge . For the refinery reactors, the benefits of PAC is
statistically significant only in the earliest experimental run . This
is presumably because the refinery reactors were not
acclimated .
180
yet fully
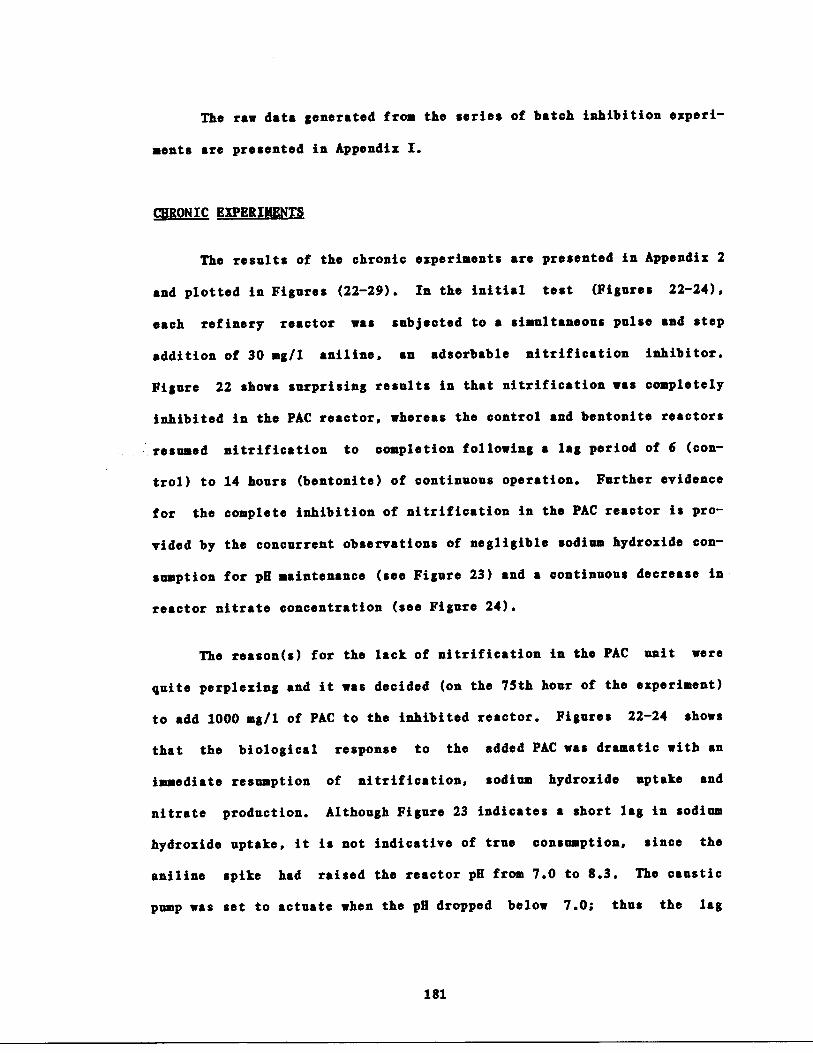
The raw data generated from the series of batch inhibition experi-
ments are presented in Appendix I .
CHRONIC EXPERIMENTS
The results of the chronic experiments are presented in Appendix 2
and plotted in Figures (22-29) . In the initial test (Figures 22-24),
each refinery reactor was subjected to a simultaneous pulse and step
addition of 30 mg/l aniline, an adsorbable nitrification inhibitor .
Figure 22 shows surprising results in that nitrification was completely
inhibited in the PAC reactor, whereas the control and bentonite reactors
resumed nitrification to completion following a lag period of 6 (con-
trol) to 14 hours (bentonite) of continuous operation . Further evidence
for the complete inhibition of nitrification in the PAC reactor is pro-
vided by the concurrent observations of negligible sodium hydroxide con-
sumption for pH maintenance (see Figure 23) and a continuous decrease in
reactor nitrate concentration (see Figure 24) .
The reasons) for the lack of nitrification in the PAC unit were
quite perplexing and it was decided (on the 75th hour of the experiment)
to add 1000 mg/i of PAC to the inhibited reactor . Figures 22-24 shows
that the biological response to the added PAC was dramatic with an
immediate resumption of nitrification, sodium hydroxide uptake and
nitrate production. Although Figure 23 indicates a short lag in sodium
hydroxide uptake, it is not indicative of true consumption, since the
aniline spike had raised the reactor pH from 7 .0 to 8 .3 . The caustic
pump was set to actuate when the pH dropped below 7 .0 ; thus the lag
181
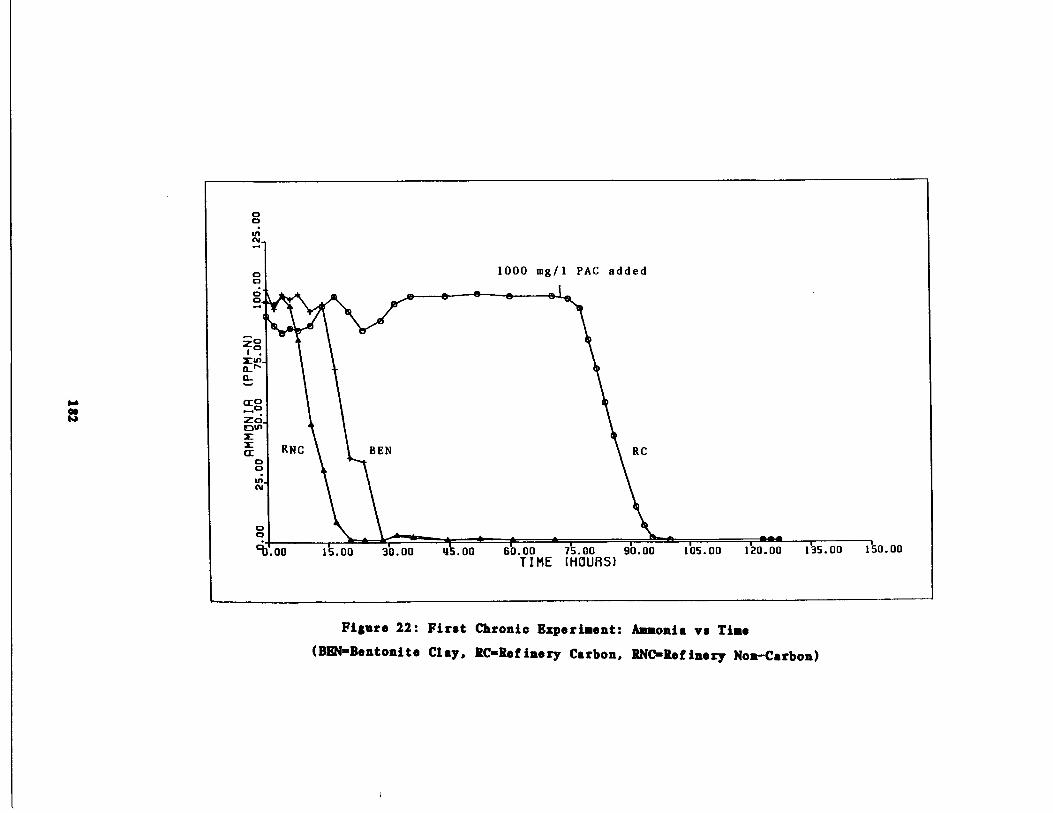
Figure 22 : First Chronic Experiment : Ammonia vs Time
(BEN=Bentonite Clay, RC-Refinery Carbon, BNC=Yefinery Non-Carbon)
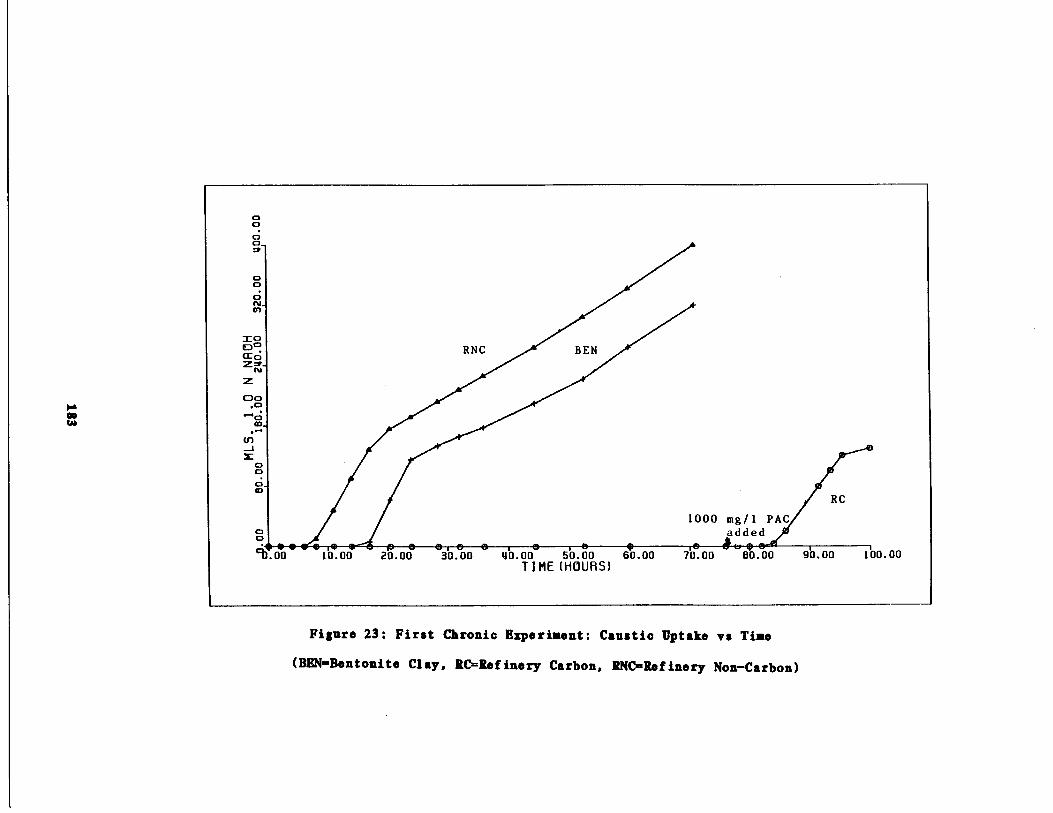
Figure 23 : First Chronic Experiment : Caustic Uptake vs Time
(BEN=Bentonite Clay, RC=Refinery Carbon, RNC=Refinery Non-Carbon)

0O00n-
000
z01 9XO"
a-
W0E-0ƒo-CC (DH
z0O
0m"
00
`b .00
15.00
30.00
4)5 .00
60.00
75.00
90.00
106.00
120.00
13s . o0
iso .ooTIME (HOURS)
BEN
RNC
RC
1000 mg/1 P Cadded
Figure 24 : First Chronic Experiment : Nitrate vs Tine
(BEN-Bentonite Clay, RC-Refinery Carbon, BNC=Bef inery Non-Carbon)

Figure 25 : Second Chronic Experiment : Ammonia vs Time
(BEN-Bentonite Clay, RC-Refinery Carbon, RNC-Refinery Non-Carbon)
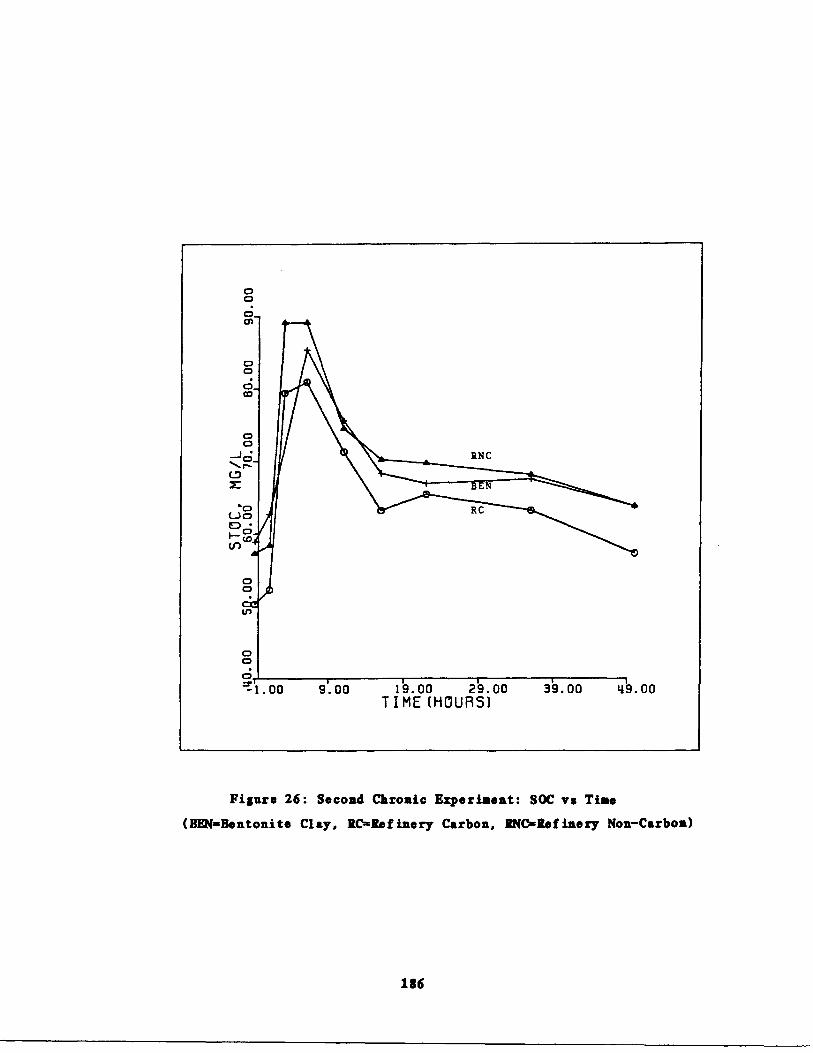
Figure 26 : Second Chronic Experiment : SOC vs Time
(BST=Bentonits Clay, RC-Refinery Carbon, RNC-Refinery Non-Carbon)
186
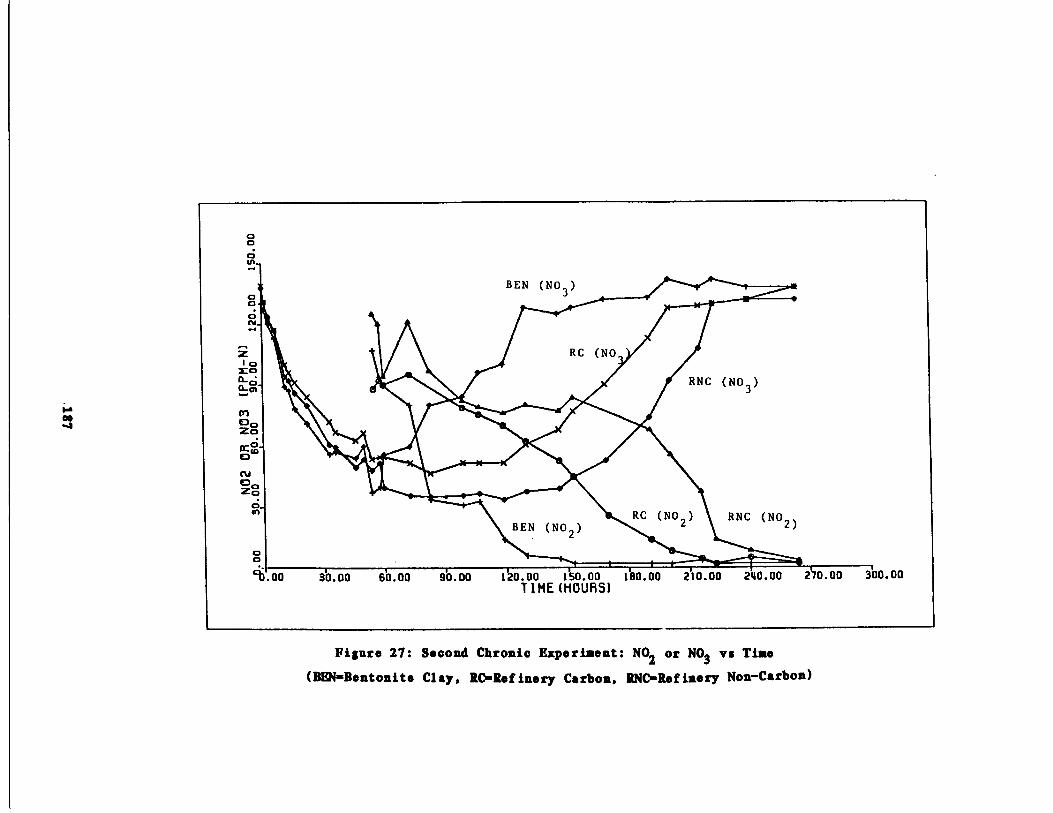
Figure 27 : Second Chronic Experiment : NO2 or N03 vs Time
(BBN=Bentonite Clay, RC-Refinery Carbon, RNC=Refinery Non-Carbon)
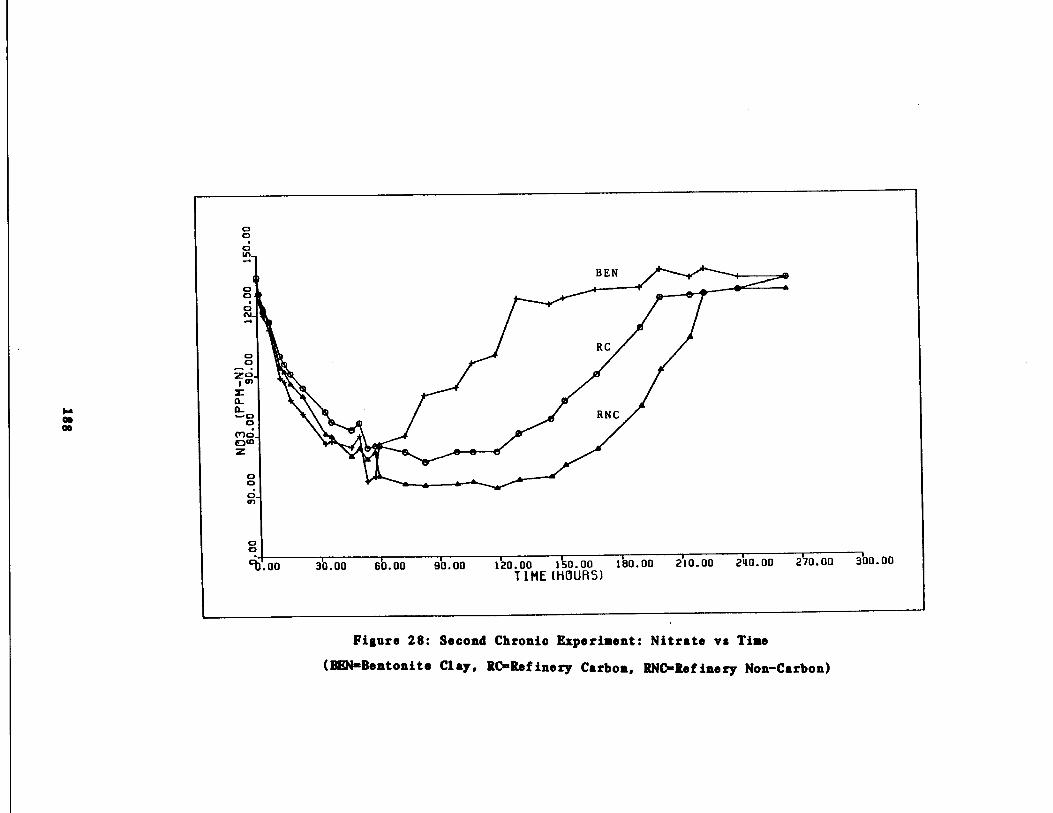
Figure 28 : Second Chronic Experiment : Nitrate vs Time
(BEN=Bentonite Clay, RC-Refinery Carbon, RNc'Refinery Non-Carbon)

Figure 29 : Second Chronic Experiment : Nitrite vs Time
(BEN=Bentonite Clay, RC-Refinery Carbon, BNC Refinery Non-Carbon)
noted in Figure 23 actually represents the period of time in which the
reactor pH dropped from 8 .3 to 7 .0 .
Following the experiment, daily reactor effluent samples indicated
that nitrification proceeded in all reactors at efficiencies greater
that 99 % (with 30 mg/1 aniline in the feed) for the next three weeks
until the second chronic experiment commenced .
It is difficult to interpret the results of the initial chronic
experiment, given that aniline is an adsorbable inhibitor and that the
PAC unit was the only reactor type severely inhibited . One plausible
explanation for the observed results is desorption . Desorption involves
the displacement of a previously adsorbed compound by another whose
adsorption affinity for the carbon is greater . It is possible that such
a compound existed in the refinery wastewater and when displaced by the
spiked aniline into the liquid phase, even in minute quantities,
resulted in the observed inhibition . In effect, the PAC had sequestered
this potential inhibitor from the microorganisms in the bulk solution .
If acclimation to the compound was possible, it was effectively
prevented by reduced exposure . Desorption of the compound may have
allowed the microbes an opportunity to slowly acclimate for a short
period of time (i .e ., 75 hours) until the virgin PAC was added . For
this explanation to be feasible, the unknown compound of interest must
be both a powerful inhibitor of nitrification and less adsorbable than
aniline . Inspection of Tables 16-18 on the GC/KS results of the
refinery wastewater and Table 10 on nitrification inhibitors shows many
potential candidates .
190
In the second chronic experiment, (Figures 25-29) the reactors
were subjected to a step increase aniline concentration from 30 to 60
ag/l along with a pulse addition of 60 mg/l aniline . It should be noted
that all reactor conditions were similar to that of the first chronic
experiment except that the PAC reactor was now running at a steady state
PAC concentration of 4000 mg/l . This was because of the additional 1000
mg/l PAC spiked in the initial experiment . The daily carbon dose was
adjusted appropriately to maintain this PAC reactor concentration (i .e .,
66 .7 mg/l feed) .
Figure 25 shows that all three reactor types responded similarly
with respect to ammonia oxidation with no apparent advantage of PAC or
bentonite addition . Ammonia oxidation was typically inhibited for 15
hours before the effects of the aniline dissipated . This observation is
consistent with the results of Joel and Grady (1977) who suggested that
heterotrophic aniline degradation and nitrification was sequential with,
nitrification commencing as soon as the aniline was reduced to non-
inhibitory concentrations . Concurrent data on soluble TOC further sup-
ports this theory . Figure 26 shows that the filtered mixed liquor SOC
in each reactor sharply increases approximately 30 to 40 mg/l when the
spiked aniline was added . An aniline concentration of 60 mg/l
corresponds roughly to 48 ag/l TOC . After approximately 16 hours, the
initial increase in SOC was reduced by more than 50% in all reactors .
Whether this decrease was primarily due to microbial degradation or to
the "washout" of aniline (i .e ., 0H = 24 hours) or a combination thereof
is unknown, however, it appears that as soon as the aniline reaches some
threshold concentration, nitrification begins .
191
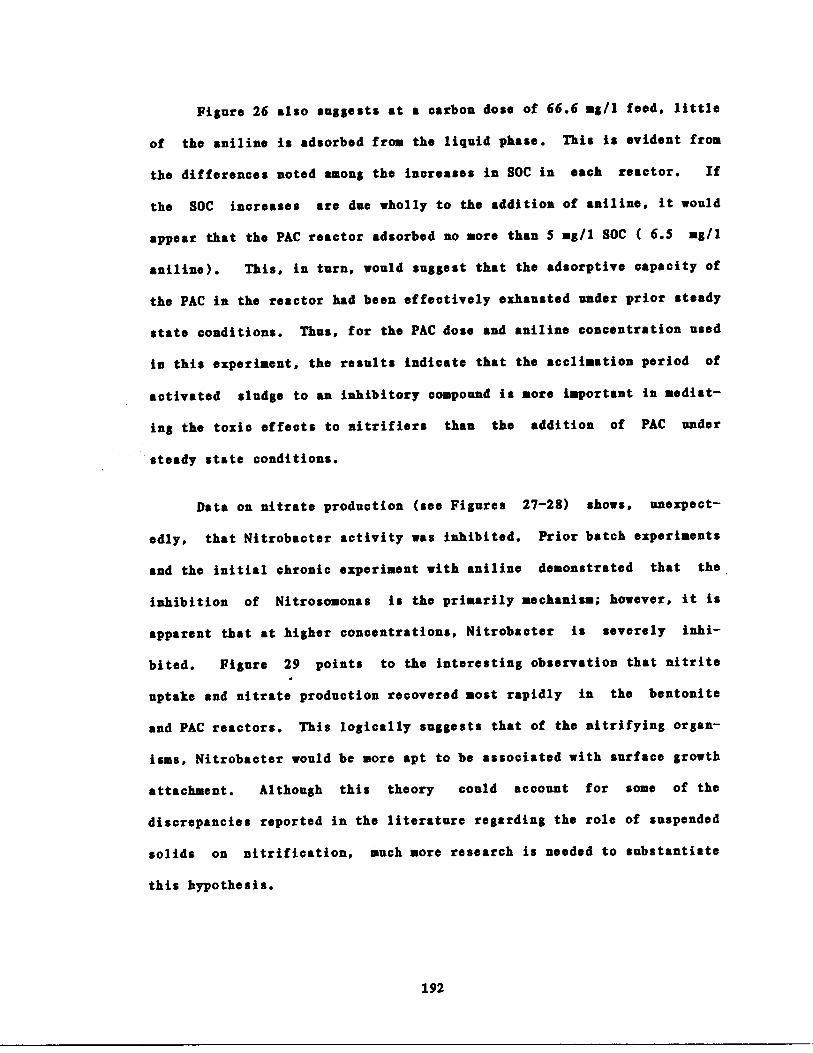
Figure 26 also suggests at a carbon dose of 66 .6 ag/l feed, little
of the aniline is adsorbed from the liquid phase . This is evident from
the differences noted among the increases in SOC in each reactor . If
the SOC increases are due wholly to the addition of aniline, it would
appear that the PAC reactor adsorbed no more than 5 ag/l SOC ( 6 .5 mg/l
aniline) . This, in turn, would suggest that the adsorptive capacity of
the PAC in the reactor had been effectively exhausted under prior steady
state conditions . Thus, for the PAC dose and aniline concentration used
in this experiment, the results indicate that the acclimation period of
activated sludge to an inhibitory compound is more important in mediat-
ing the toxic effects to nitrifiers than the addition of PAC under
steady state conditions .
Data on nitrate production (see Figures 27-28) shows, unexpect-
edly, that Nitrobacter activity was inhibited . Prior batch experiments
and the initial chronic experiment with aniline demonstrated that the
inhibition of Nitrosomonas is the primarily mechanism ; however, it is
apparent that at higher concentrations, Nitrobacter is severely inhi-
bited . Figure 29 points to the interesting observation that nitrite
uptake and nitrate production recovered most rapidly in the bentonite
and PAC reactors . This logically suggests that of the nitrifying organ-
isms, Nitrobacter would be more apt to be associated with surface growth
attachment . Although this theory could account for some of the
discrepancies reported in the literature regarding the role of suspended
solids on nitrification, much more research is needed to substantiate
this hypothesis .
192
Following the chronic experiments, daily effluent samples indi-
cated that all reactors consistently achieved nitrification efficiencies
greater than 99% in the presence of 60 mg/1 aniline in the feed .
193
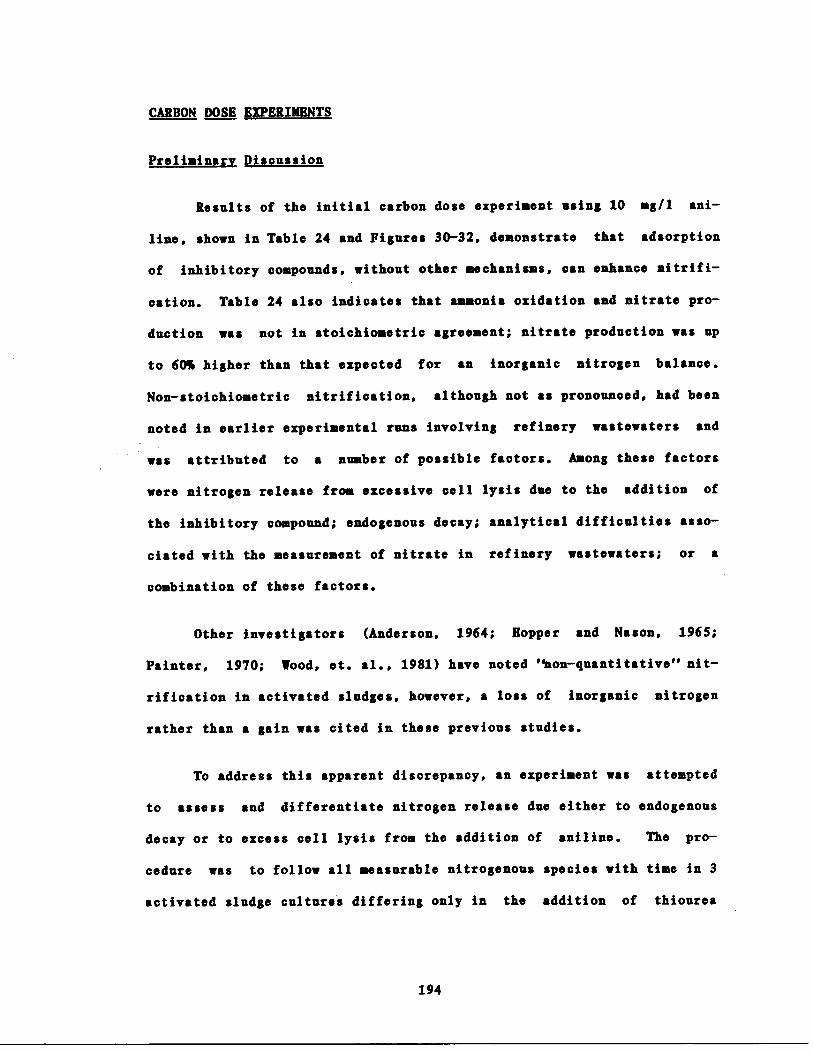
CARBON DOSE EXPERIMENTS
Preliminary Discussion
Results of the initial carbon dose experiment using 10 mg/l ani-
line, shown in Table 24 and Figures 30-32, demonstrate that
of inhibitory compounds, without other mechanisms, can enhance nitrifi-
cation . Table 24 also indicates that ammonia oxidation and nitrate pro-
duction was not in stoichiometric agreement ; nitrate production was up
to 60% higher than that expected for an inorganic nitrogen balance .
Non-stoichiometric nitrification, although not as pronounced, had been
noted in earlier experimental runs involving refinery wastewaters and
was attributed to a number of possible factors . Among these factors
were nitrogen release from excessive cell lysis due to the addition of
the inhibitory compound ; endogenous decay ; analytical difficulties asso-
ciated with the measurement of nitrate in refinery wastewaters ; or a
combination of these factors .
Other investigators (Anderson, 1964 ; Hopper and Nason, 1965 ;
Painter, 1970 ; Wood, et . al ., 1981) have noted 'icon-quantitative" nit-
rification in activated sludges, however, a loss of inorganic nitrogen
rather than a gain was cited in these previous studies .
To address this apparent discrepancy, an experiment was attempted
to assess and differentiate nitrogen release due either to endogenous
decay or to excess cell lysis from the addition of aniline . The pro-
cedure was to follow all measurable nitrogenous species with time in 3
activated sludge cultures differing only in the addition of thiourea
194
adsorption
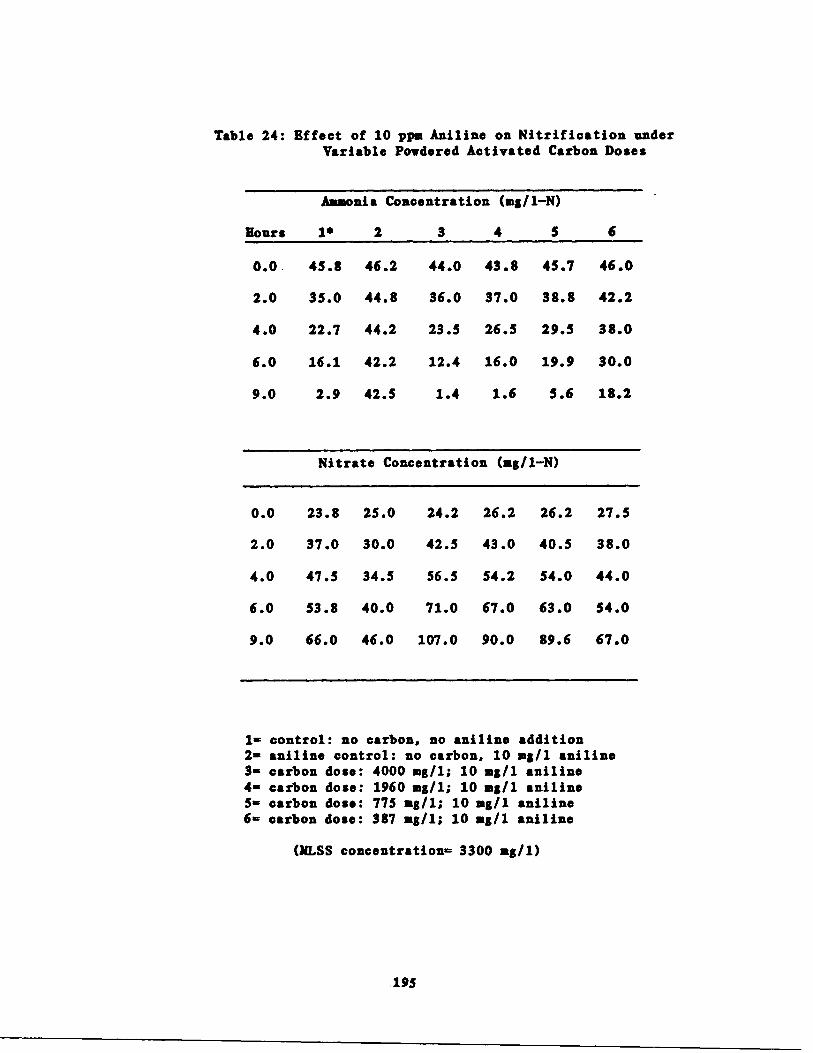
Table 24 : Effect of 10 ppm Aniline on Nitrification underVariable Powdered Activated Carbon Doses
0.0 45.8
2 .0 35 .0
4 .0 22 .7
6 .0
16.1
9 .0
1-2-3-4-S-6-
Ammonia Concentration (ag/1-N)
Hours
1„
2
3
4
5
6
46.2 44.0 43.8 45.7 46 .0
44.8 36.0 37.0 38.8 42 .2
44 .2 23 .5 26.5 29.5 38 .0
42.2
12.4
16.0
19.9
30.0
2 .9
42.5
1.4
1 .6
5.6
18.2
control : no carbon,aniline control : nocarbon dose :carbon dose :carbon dose :carbon dose :
no aniline additioncarbon, 10 ag/l aniline
4000 mg/l ; 10 mg/1 aniline1960 mg/l ; 10 mg/1 aniline775 mg/l ; 10 mg/1 aniline387 mg/l ; 10 mg/1 aniline
(JfLSS concentration= 3300 mg/1)
195
Nitrate Concentration (ag/1-N)
0 .0 23 .8
25 .0 24 .2 26 .2 26 .2 27 .5
2 .0 37 .0 30 .0 42 .5 43 .0 40 .5 38.0
4 .0 47 .5
34 .5 56 .5 54 .2 54 .0 44 .0
6 .0 53 .8
40.0 71 .0 67 .0 63 .0 54 .0
9 .0 66 .0 46 .0 107 .0 90 .0 89 .6 67 .0
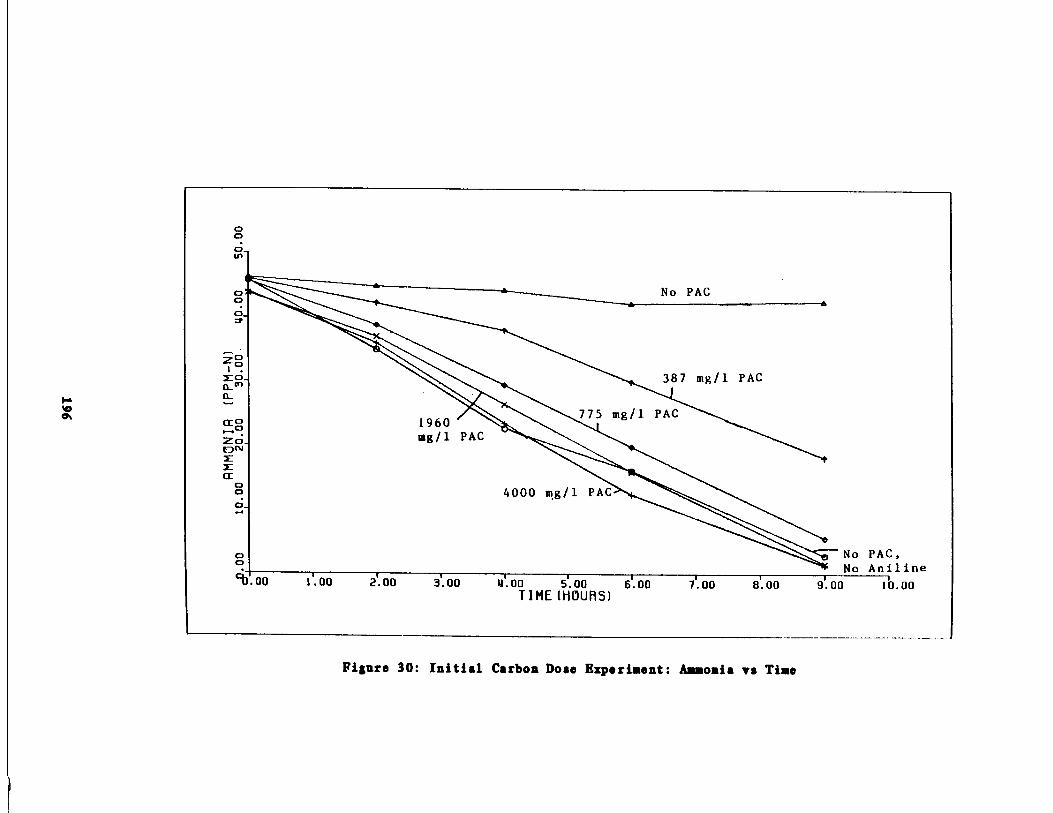
U .00
1'.00
2.00
3.00
4'.00
5 00
6.00
71.00T I ME (HOURS)
8 .00
Figure 3 0 : Initial Carbon Dose Experiment : Ammonia vs Time
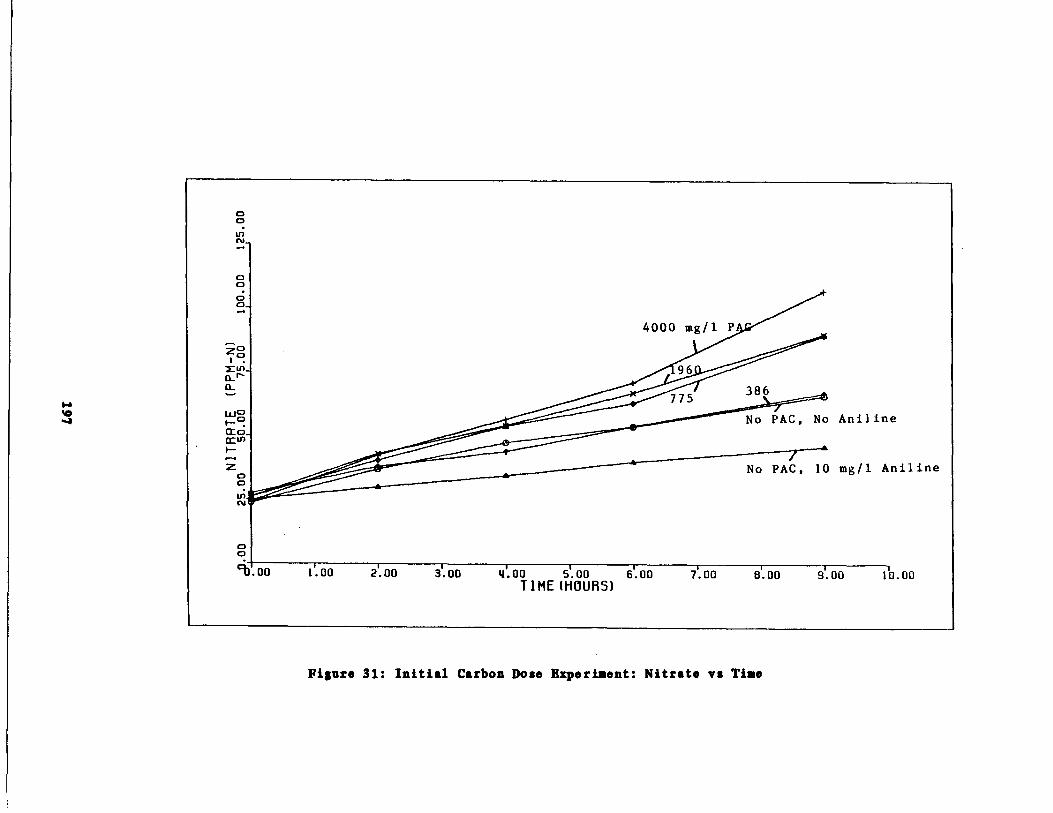
Figure 3 1 : Initial Carbon Dose Experiment : Nitrate vs Tine

Figure 32 : Initial Carbon Dose Experiment : Caustic Uptake vs Time
(1 .0 mg/1) ; thiourea (1 .0 mg/1) and aniline (10 .0 mg/1) ; or no additions
at all . Thiourea is a known potent inhibitor of ammonia oxidation
(0 .075 mg/l produces 75% inhibition, Tomilinson, 1966) and is commonly
used to inhibit nitrification during BOD tests . Nitrogen release due to
endogenous decay was followed in the culture with no added compounds .
Cell lysis due to aniline addition was taken to be the difference in
inorganic nitrogen production (after adjusting for endogenous decay)
between the cultures with and without aniline addition .
It should be noted that nitrate in the initial carbon dose experi-
went was analyzed for by the same nitrate sensing module used in the
earlier experiments involving refinery wastewaters . To avoid the possi-
ble introduction of probe error associated with its prior use in
refinery wastewaters, a new sensing module was obtained and used for
this and subsequent experiments .
Results of the nitrogen balance experiment are shown in Figures
33-35 . Initial nitrogen measurements for the activated sludge used were
1 .0 mg/l ammonia-N, 0 .26 mg/l nitrite-N, 43 .5 mg/l nitrate-N, and 260 .0
mg/1-N Total Kjeldahl Nitrogen (TIN) . Mixed liquor suspended solids was
measured to be 2150 mg/i and filtered TIN was 0 .94 mg/1-N. Figure 33,
corrected for initial nitrate-N, indicates that for the culture with no
additions, practically all inorganic nitrogen was in the form of
nitrate-N with only a trace of nitrite-N (0 .1 mg/1) present . Over the 8
hour aeration period, approximately 6 mg/l nitrate-N (corrected for ini-
tial ammonia-N) was formed . Using initial [jeldahl Nitrogen (IN) as an
indication of microbial mass and neglecting heterotrophic ammonia uptake
199
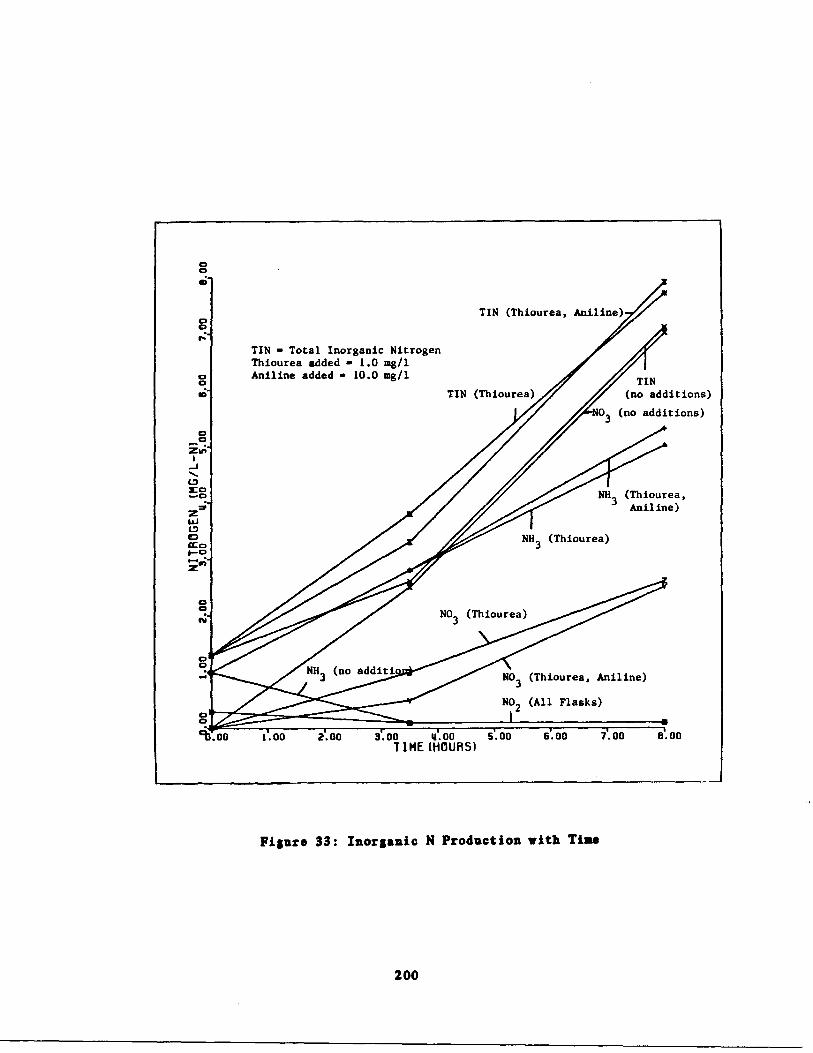
TIN - Total Inorganic NitrogenThiourea added - 1 .0 mg/1Aniline added - 10 .0 mg/1 TIN
TIN (Thiourea)
(no additions)
(no additions)
N02 (All Flasks)
`b.00
1 '.00
2 00
3.00
4, 00
5 00
6.00
7 00
8.00TIME (HOURS)
Figure 33 : Inorganic N Production with Time
I
U
200
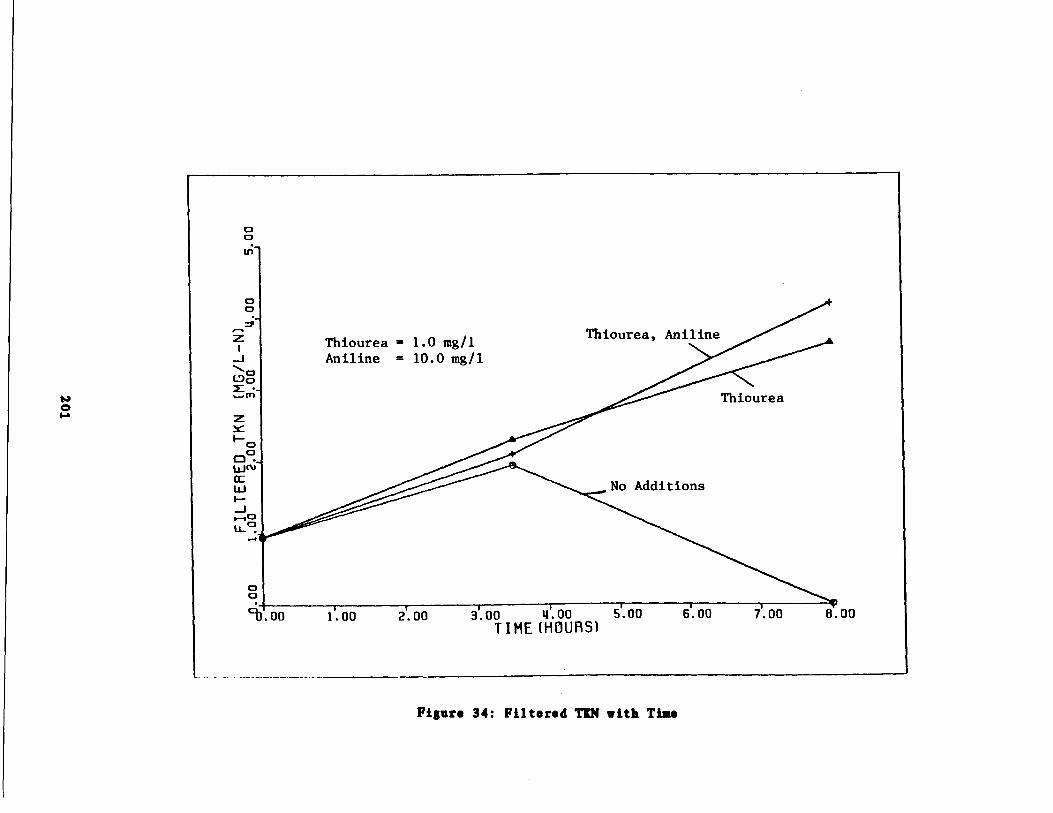
Thiourea - 1 .0 mg/lAniline = 10 .0 mg/l
3 .00
4.00
5 .00
6.00
7.00
8.00TIME (HOURS)
Thiourea, Aniline
Figure 34 : Filtered TEN with Time
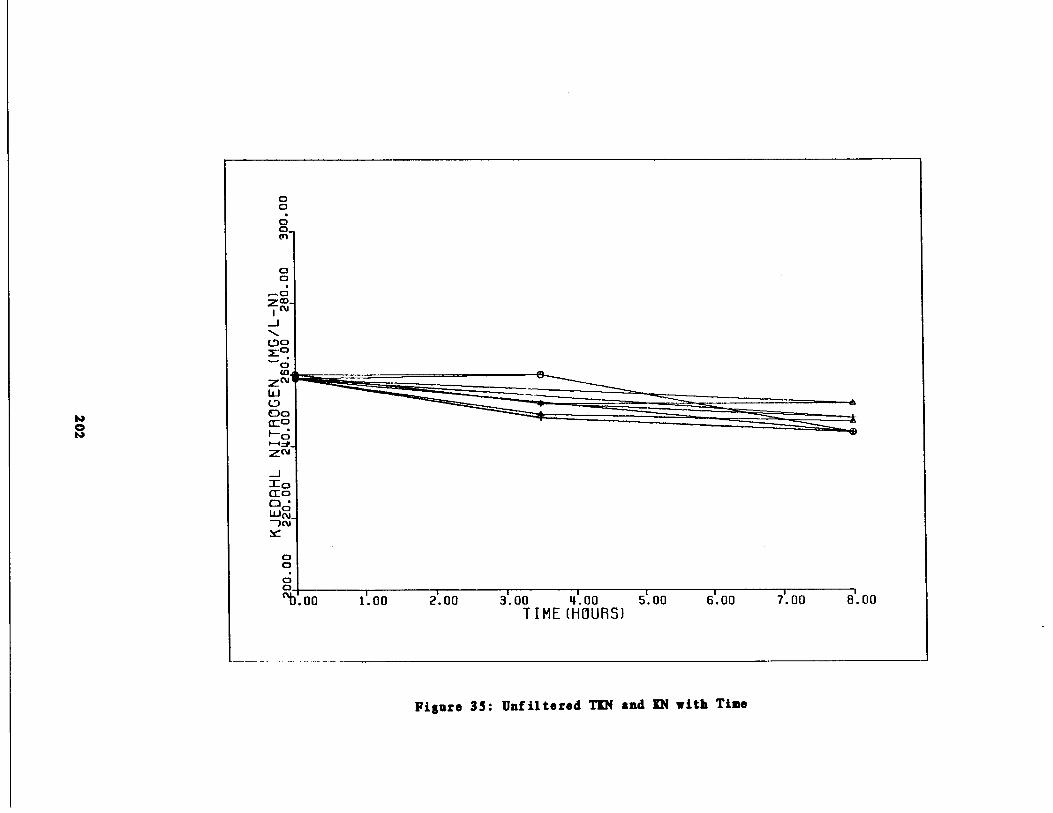
Figure 35 : Unfiltered TIN and LN with Time
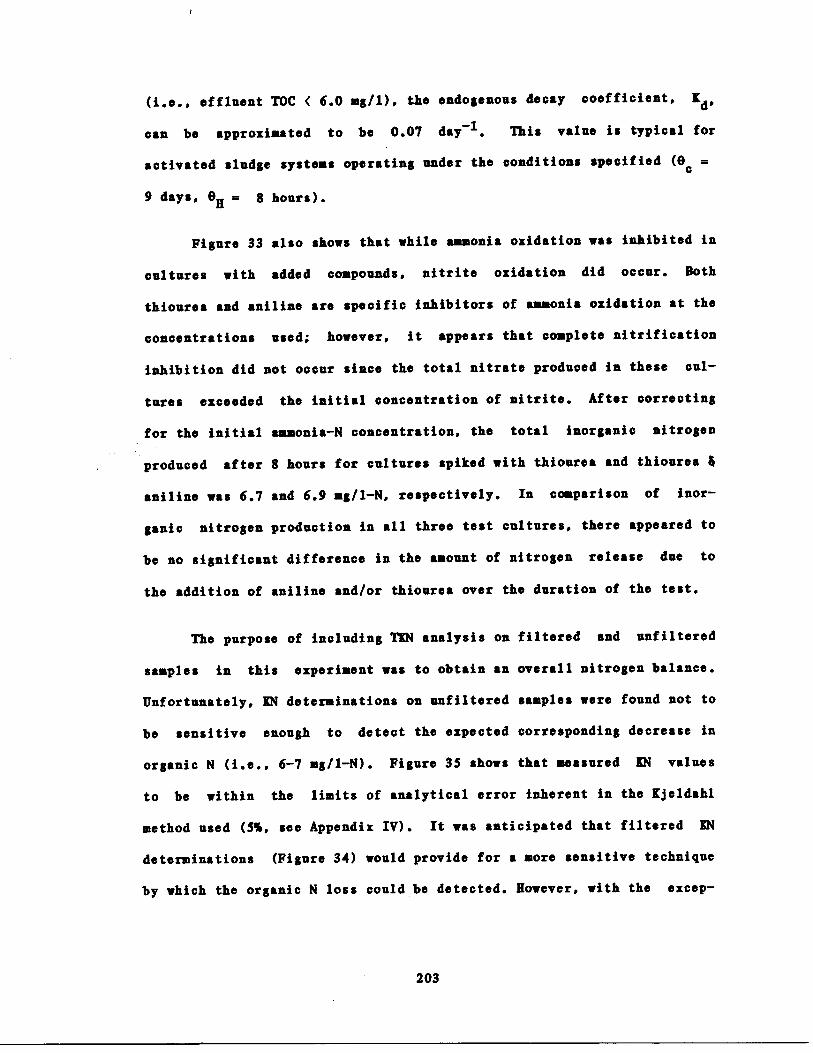
(i .e ., effluent TOC < 6 .0 mg/1), the endogenous decay coefficient, K d,
can be approximated to be 0.07 day-' . This value is typical for
activated sludge systems operating under the conditions specified (0 c
9 days, 0H = 8 hours) .
Figure 33 also shows that while ammonia oxidation was inhibited in
cultures with added compounds, nitrite oxidation did occur . Both
thiourea and aniline are specific inhibitors of ammonia oxidation at the
concentrations used ; however, it appears that complete nitrification
inhibition did not occur since the total nitrate produced in these cul-
tures exceeded the initial concentration of nitrite . After correcting
for the initial ammonia-N concentration, the total inorganic nitrogen
produced after 8 hours for cultures spiked with thiourea and thiourea 3
aniline was 6 .7 and 6 .9 mg/1-N, respectively. In comparison of inor-
ganic nitrogen production in all three test cultures, there appeared to
be no significant difference in the amount of nitrogen release due to
the addition of aniline and/or thiourea over the duration of the test .
The purpose of including TKN analysis on filtered and unfiltered
samples in this experiment was to obtain an overall nitrogen balance .
Unfortunately, KN determinations on unfiltered samples were found not to
be sensitive enough to detect the expected corresponding decrease in
organic N (i .e ., 6-7 mg/1-N) . Figure 35 shows that measured KN values
to be within the limits of analytical error inherent in the Kjeldahl
method used (5%, see Appendix IV) . It was anticipated that filtered IN
determinations (Figure 34) would provide for a more sensitive technique
by which the organic N loss could be detected . However, with the excep-
203

tion of one sample, the TIN detected in the filtrate samples
corresponded to the measured ammonia-N for any given sampling period.
After correcting for the ammonia-N present in the TIN determinations,
IN (organic N) was detected in only one filtrate sample .
The results of the nitrogen balance experiment suggested that the
total amount of nitrogen released through either endogenous decay or
through excess cell lysis was not sufficient to account for the non-
stoichiometry of nitrification observed in the initial carbon dose
experiment . Therefore, the pronounced inorganic nitrogen inbalance
resulting in the initial experiment was attributed to a faulty nitrate
sensing module in the selective ion probe . It should be noted that the
normal lifetime of the sensing module, depending on use, varies from a
few months to 1 year . Although probe performance was routinely moni-
tored through calibration checks prior to all experiments, it is con-
ceivable that the probe had begun to fail during analysis of nitrate in
the initial carbon dose experiment .
Nitrate was analyzed for with a new sensing module in all subse-
quent experiments reported . Carbon dose experiments using aniline (10
•g/1) were repeated twice . In addition, nitrification inhibitors with
different adsorption characteristics including phenol (20 mg/1), cyanide
(0 .7 and 1 .4 mg/1) and ethanol (2500 mg/1) were also evaluated. Nitrif-
ication inhibition and adsorptive characteristics for these compounds
are shown in Table 25 . Data from Table 25 were largely extracted from
the literature and hence are subject to interpretation due to differing
sets of conditions under which the values were obtained .
Nonetheless,
204
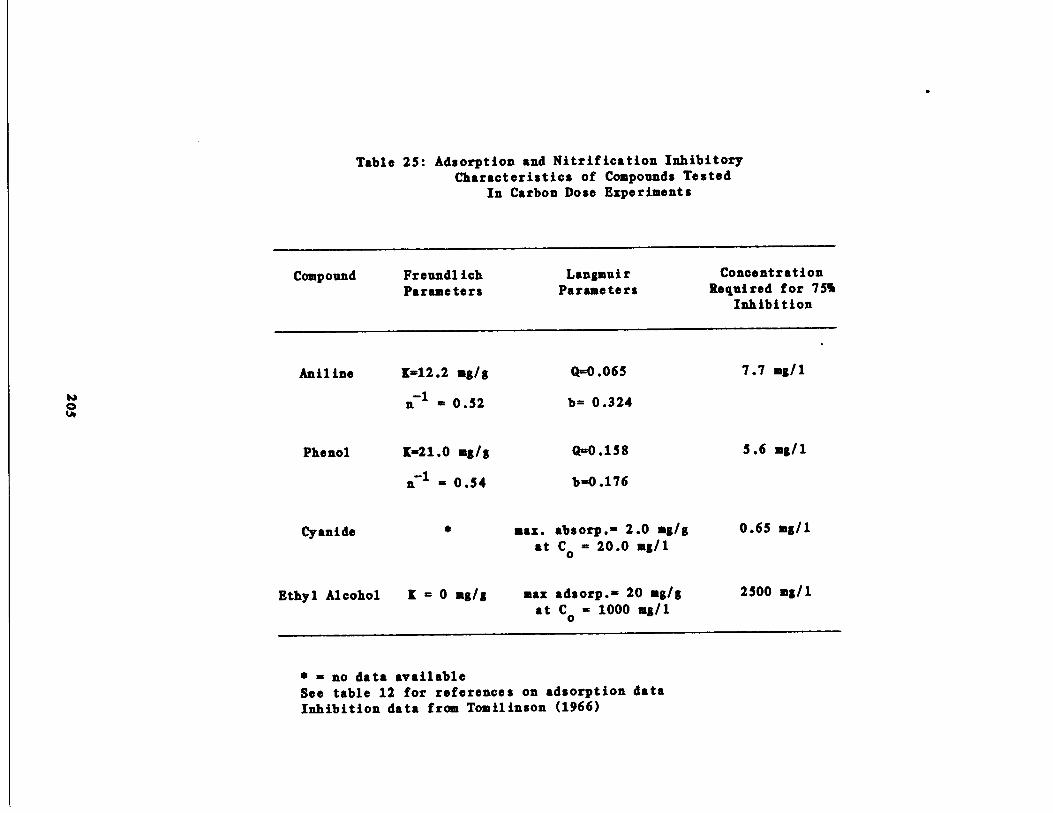
Table 25 : Adsorption and Nitrification InhibitoryCharacteristics of Compounds Tested
In Carbon Dose Experiments
„
= no data availableSee table 12 for references on adsorption dataInhibition data from Tomilinson (1966)
Compound FreundlichParameters
LangmuirParameters
ConcentrationRequired for 75'.
Inhibition
Aniline 8=12 .2 mg/g Q=0 .065 7 .7 mg/l
n71 = 0 .52 b= 0 .324
Phenol 8=21 .0 mg/g Q-0 .158 5 .6 mg/ l
n71 = 0 .54 b=0 .176
Cyanide max . absorp .= 2 .0 mg/g 0 .65 mg/1at Co = 20 .0 mg/l
Ethyl Alcohol Y = 0 mg/g max adsorp .= 20 mg/g 2500 mg/lat Co = 1000 mg/l
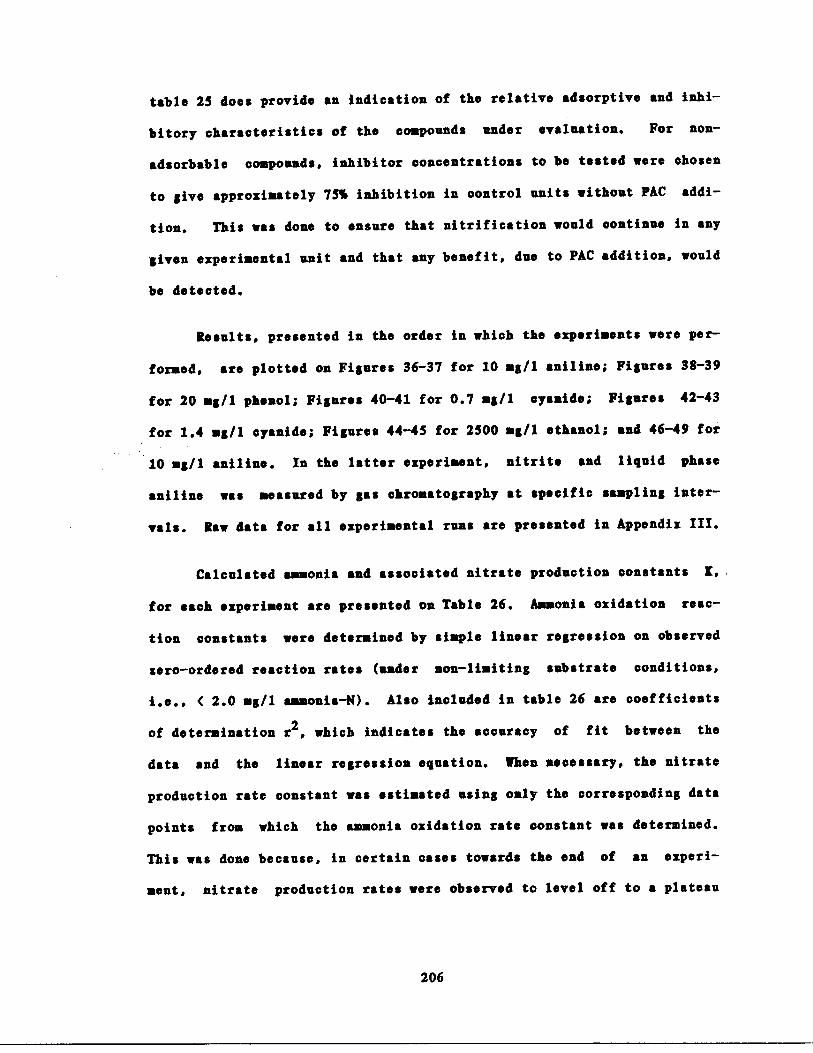
table 25 does provide an indication of the relative adsorptive and inhi-
bitory characteristics of the compounds under evaluation . For non-
adsorbable compounds, inhibitor concentrations to be tested were chosen
to give approximately 75% inhibition in control units without PAC addi-
tion . This was done to ensure that nitrification would continue in any
'given experimental unit and that any benefit, due to PAC addition, would
be detected .
Results, presented in the order in which the experiments were per-
formed, are plotted on Figures 36-37 for 10 mg/1 aniline ; Figures 38-39
for 20 mg/1 phenol ; Figures 40-41 for 0 .7 mg/1 cyanide ; Figures 42-43
for 1 .4 mg/1 cyanide ; Figures 44-45 for 2500 mg/1 ethanol ; and 46-49 for
10 mg/1 aniline . In the latter experiment, nitrite and liquid phase
aniline was measured by gas chromatography at specific sampling inter-
vals . Raw data for all experimental runs are presented in Appendix III .
Calculated ammonia and associated nitrate production constants
for each experiment are presented on Table 26 . Ammonia oxidation reac-
tion constants were determined by simple linear regression on observed
zero-ordered reaction rates (under son-limiting substrate conditions,
i .e ., ( 2 .0 mg/1 ammonia-N) . Also included in table 26 are coefficients
of determination r2 , which indicates the accuracy of fit between the
data and the linear regression equation. When necessary, the nitrate
production rate constant was estimated using only the corresponding data
points from which the ammonia oxidation rate constant was determined .
This was done because, in certain cases towards the end of an experi-
ment, nitrate production rates were observed to level off to a plateau
206
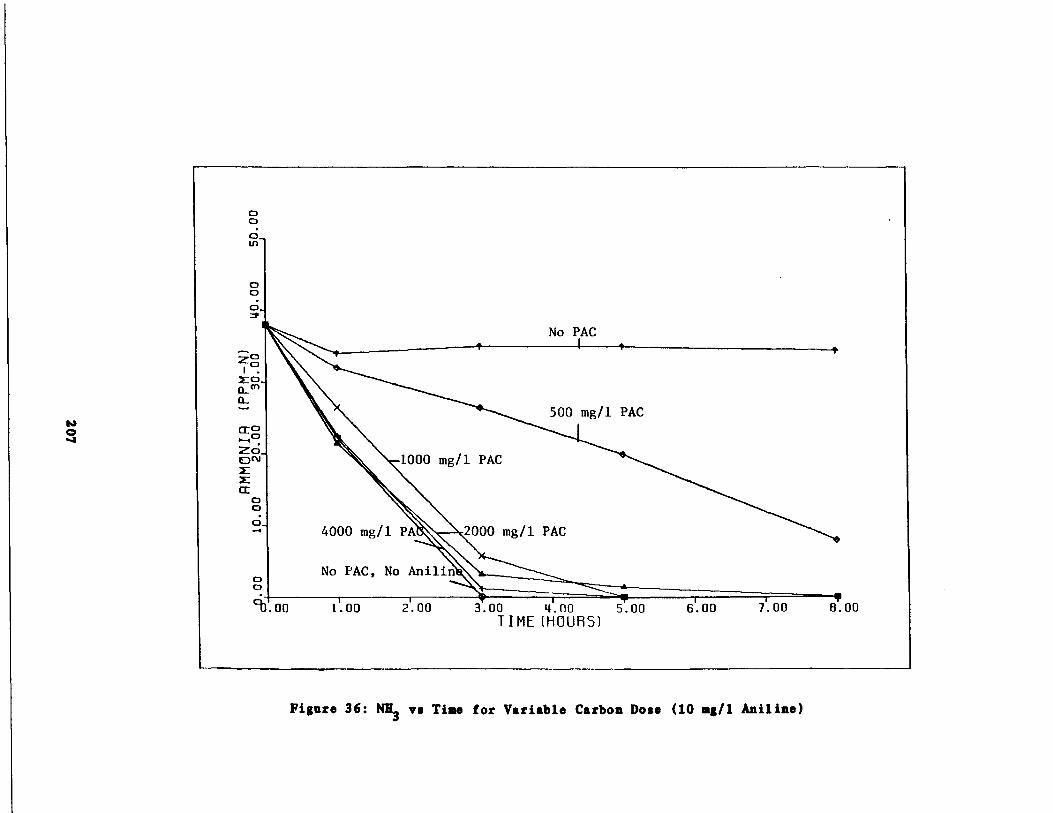
Figure 36 : NH3 vs Tine for Variable Carbon Dose (10 sg/l Aniline)
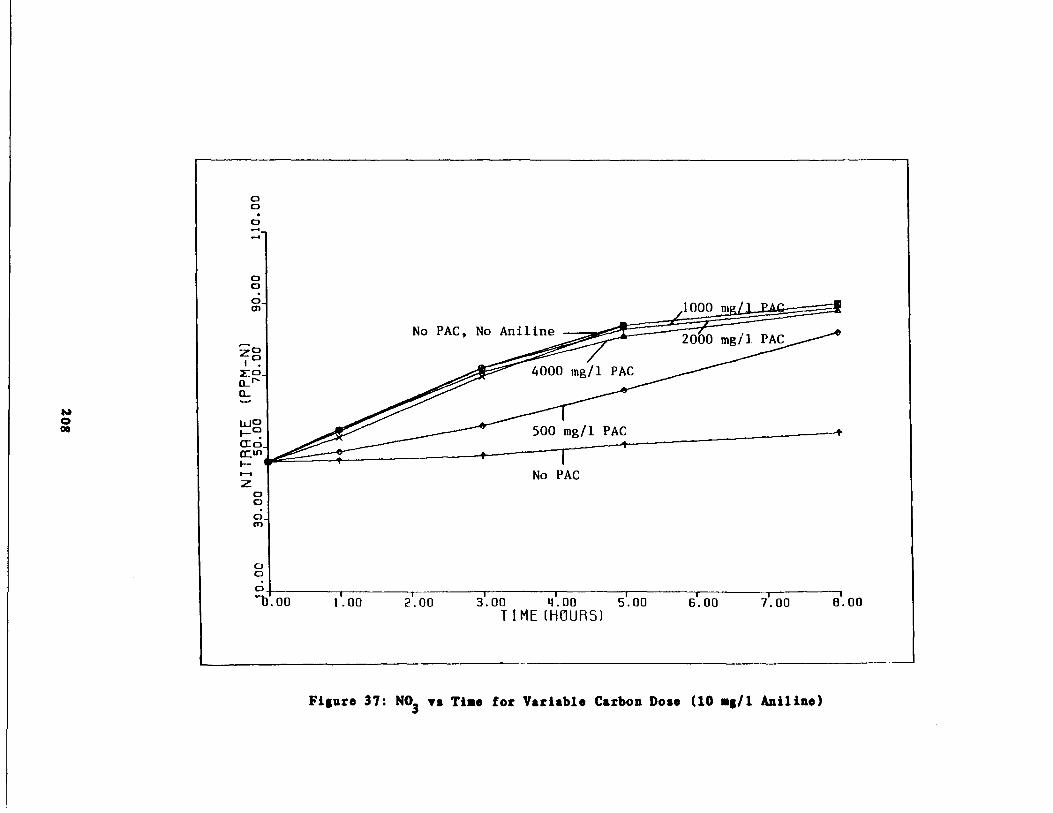
Figure 37 : NO3 vs Time for Variable Carbon Dose (10 .g/l Aniline)
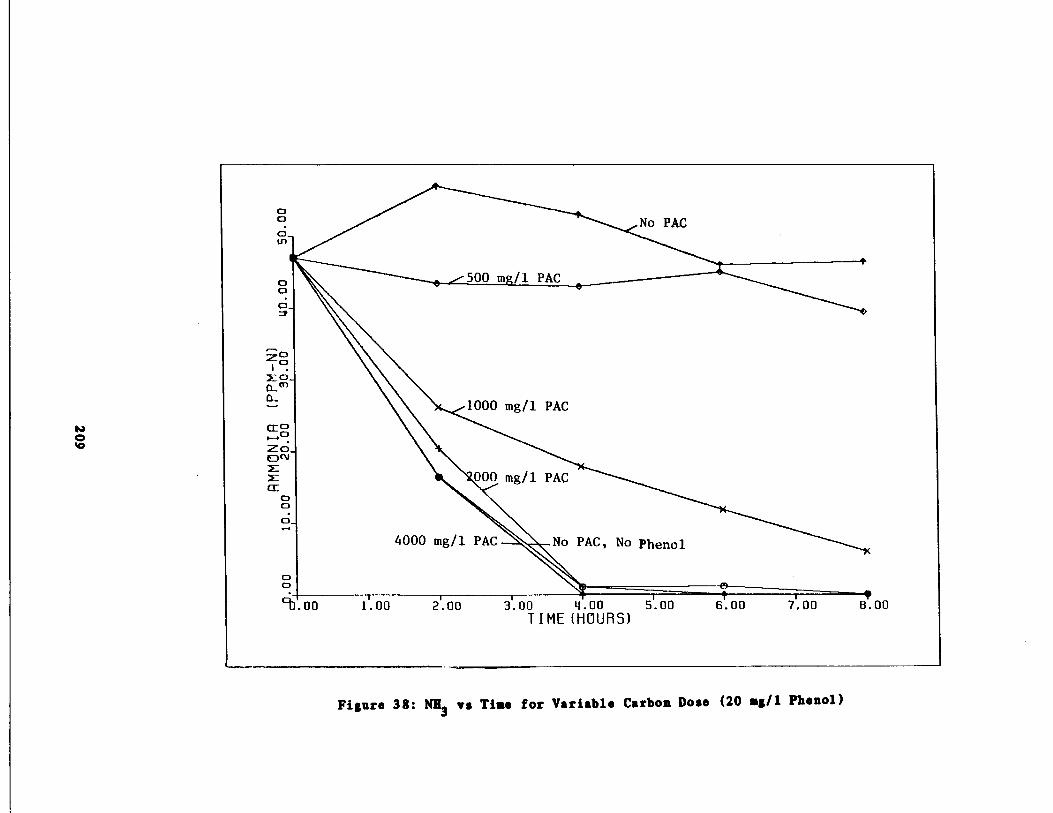
00`b .00
1'.00
2'.00
31.00
4.00
5.00TIME (HOURS)
6 .00 7 .00
8 .00
Figure 38 : NH3 vs Tine for Variable Carbon Dose (20 as/1 Phenol)
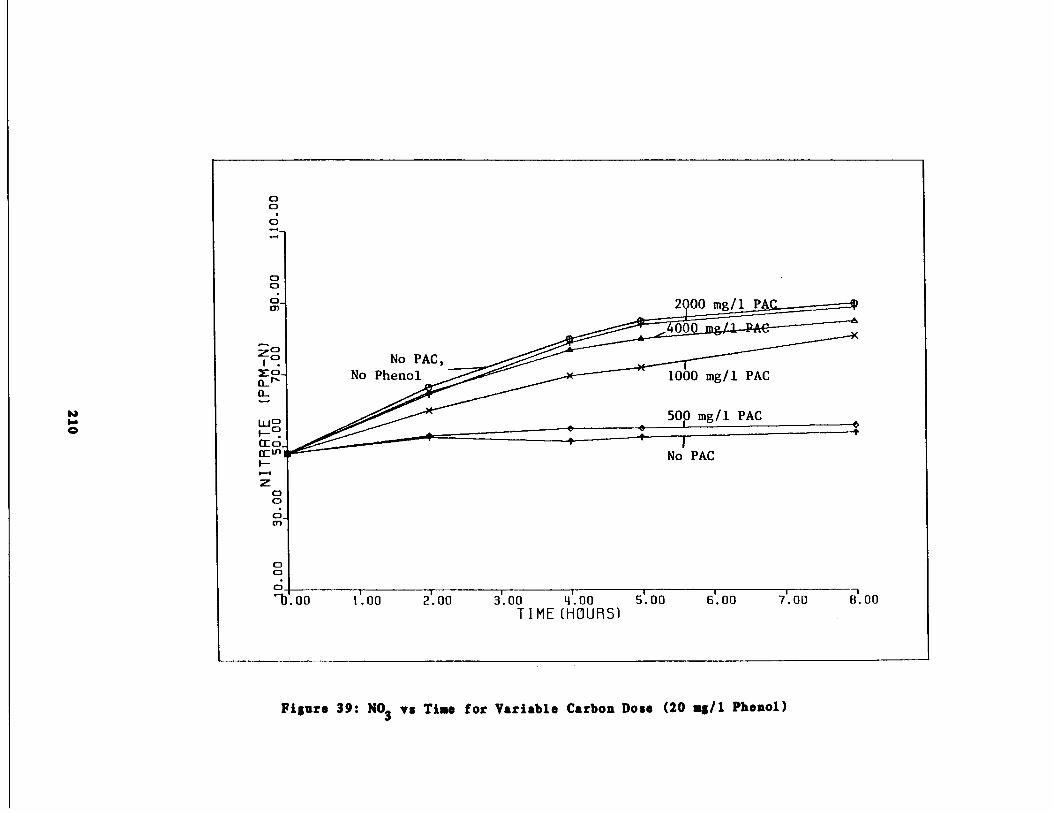
C)0
0
00o_O1
Z‚1 ogo_
o_
00
o_x .00
No PAC,No Phenol
1000 mg/l PAC
500 mg/l PAC
No PAC
1 .00
2.00
3 .00
4 .00
5 .00
6.00
7 .00
8.00TIME (HOURS)
Figure 39 : NO3 vs Time for Variable Carbon Dose (20 ag/1 Phenol)
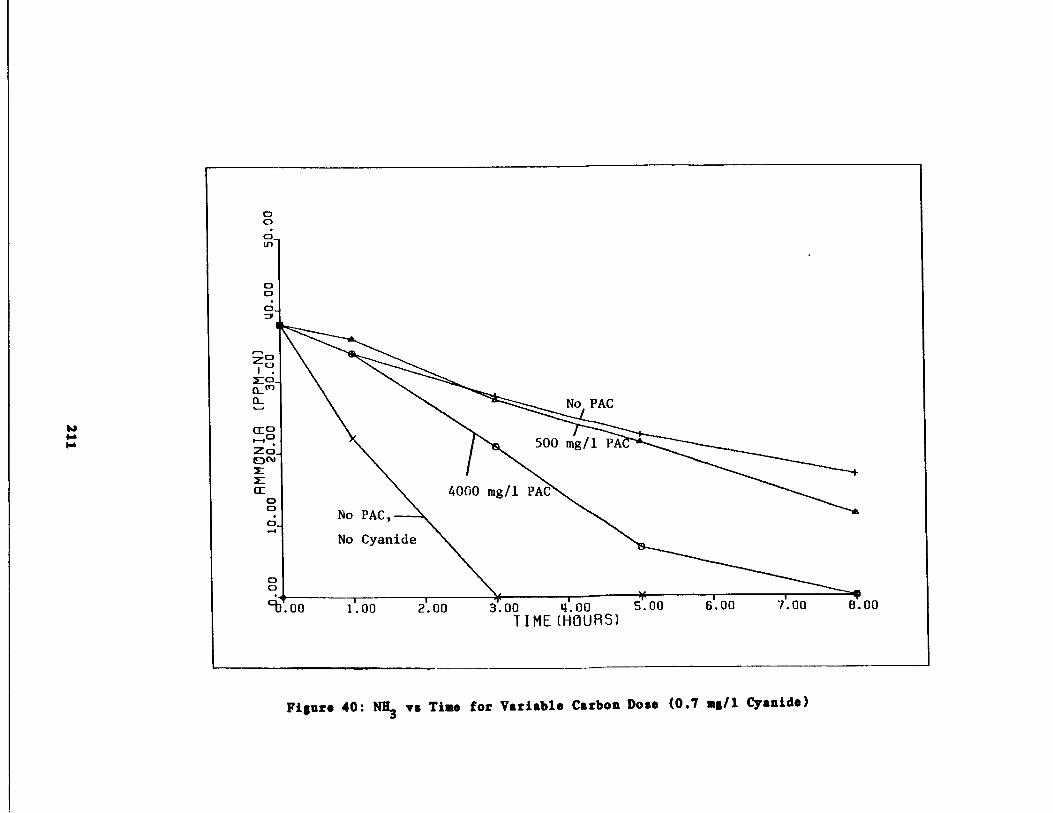
1 .00 2 .00 3 .00
4.00
s 00
6.00
7'.00
6 .00TIME (HOURS)
Figure 40 : NH3 vs Time for Variable Carbon Dose (0 .7 mg/l Cyanide)
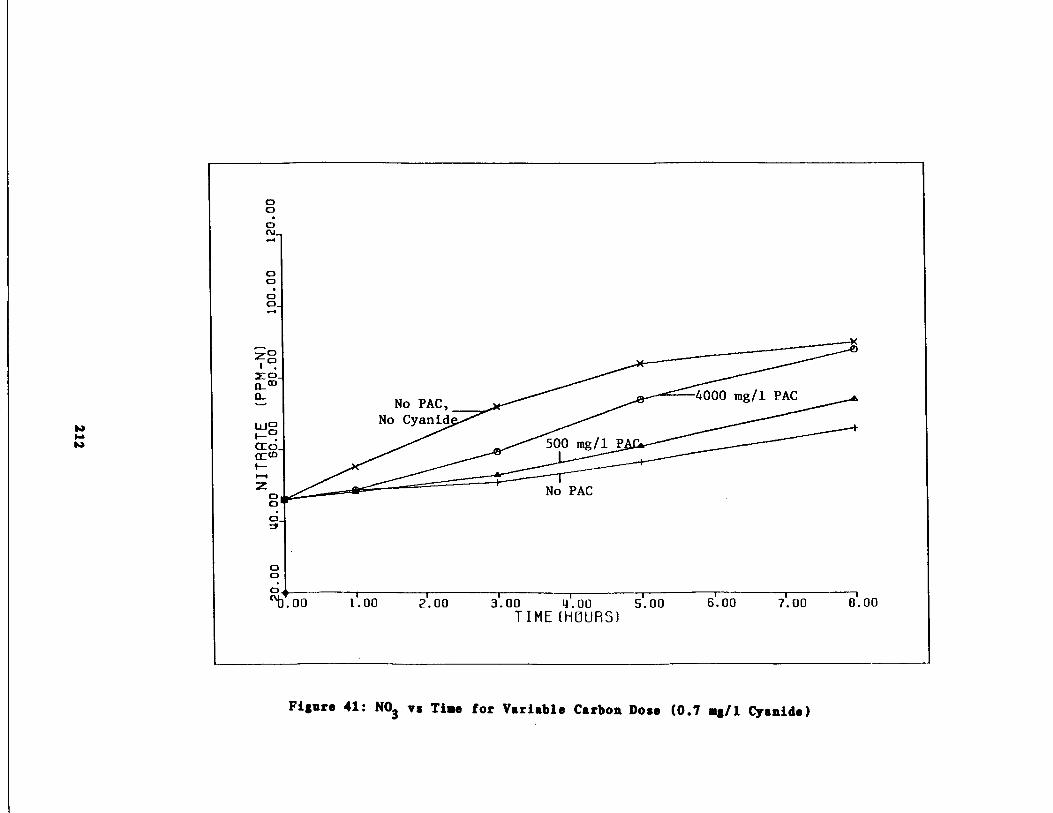
OOON_
OOOO.-a
j
0OO'b .00 1 .00
2.00
3.00
41.00
51.00TIME (HOURS)
I
1
16 .00
7.00
8.00
Fiinre 41 : NO3 vs Time for Variable Carbon Dose (0 .7 mg/1 Cyanide)

000N_
OOO'b . 00 1 .00
2.00
3.00
'1.00
5.00
6.00
7.00
8 .00TIME (HOURS)
Figure 42 : NH3 vs Time for Variable Carbon Dose (1 .4 mg/1 Cyanide
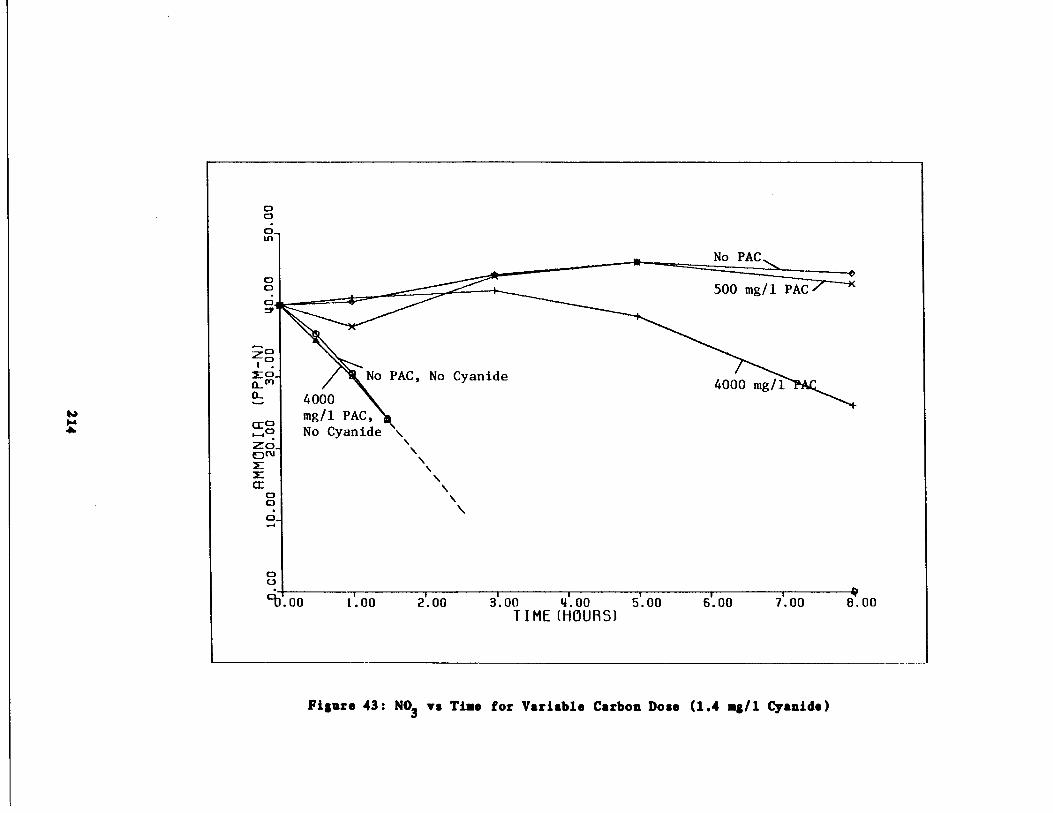
OOO_117OOOFo1--4Q
Zo_oNE00C:)-
No PAC, No Cyanide
4000mg/1 PAC,No Cyanide '\
\
\
00Q
9j .00
1'.00
2 . 00
3 '.00
'1 .00
5.00
6.00
71.00
6.00TIME (HOURS)
Fiinre 43 : NO3 vs Time for Variable Carbon Dose (1 .4 „g/l Cyanide)
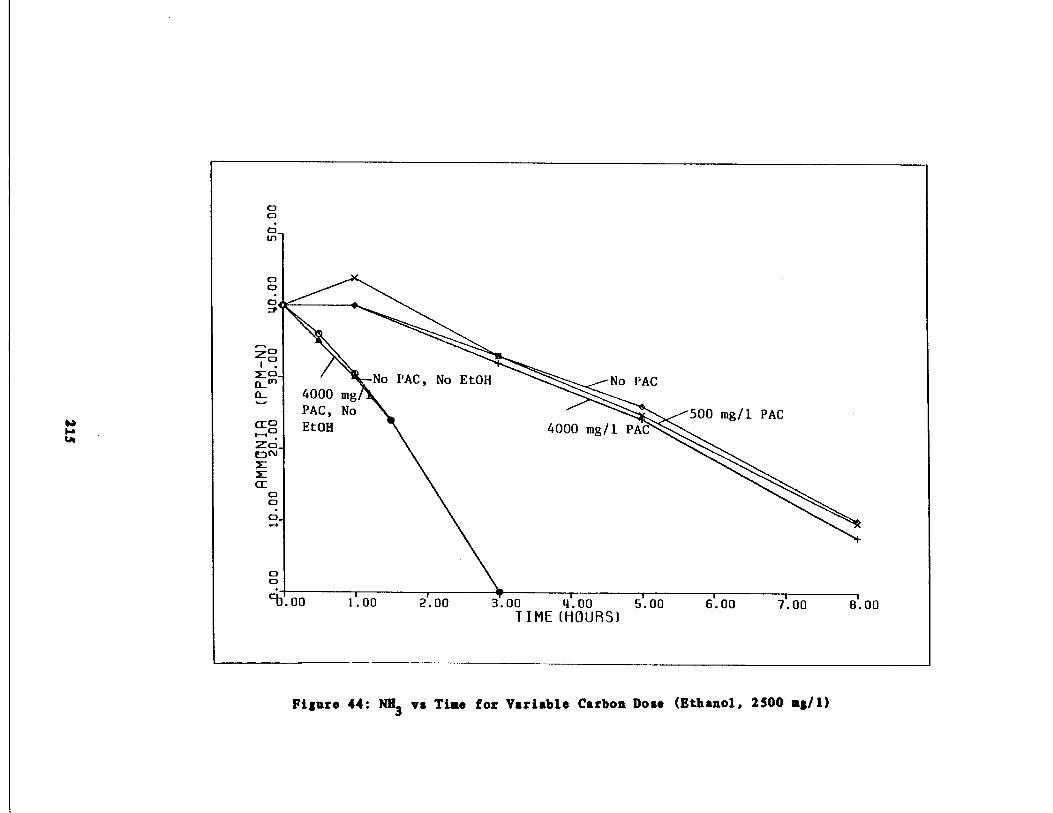
9j .00
1 .00
2.00
3.00
4 .00
5.00TIME (HOURS)
Figure 44 : NH3 vs Time for Variable Carbon Dose (Ethanol, 2500 mg/1)
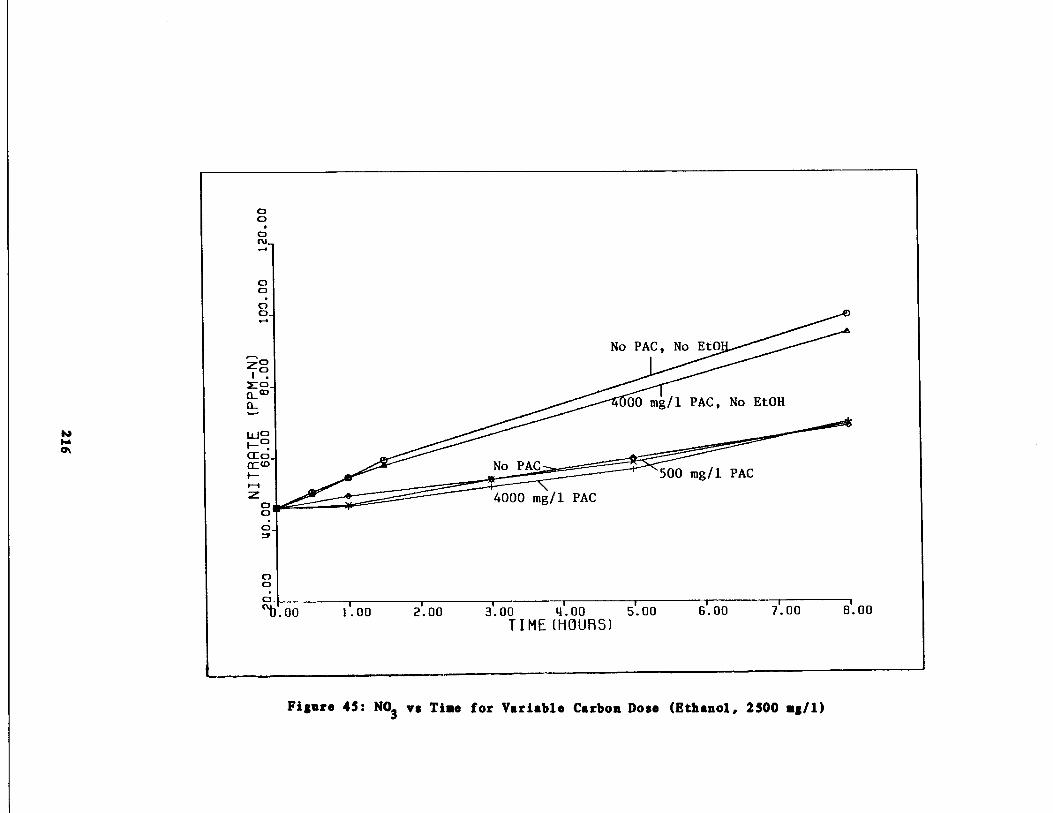
OOON_
O.
OOO~.00
1 .00
2.00
3.00
4~.00
5.00
6 .00
7.00
8.00TIME (HOURS)
Figure 45 : NO3 vs Time for Variable Carbon Dose (Ethanol, 2500 mg/1)
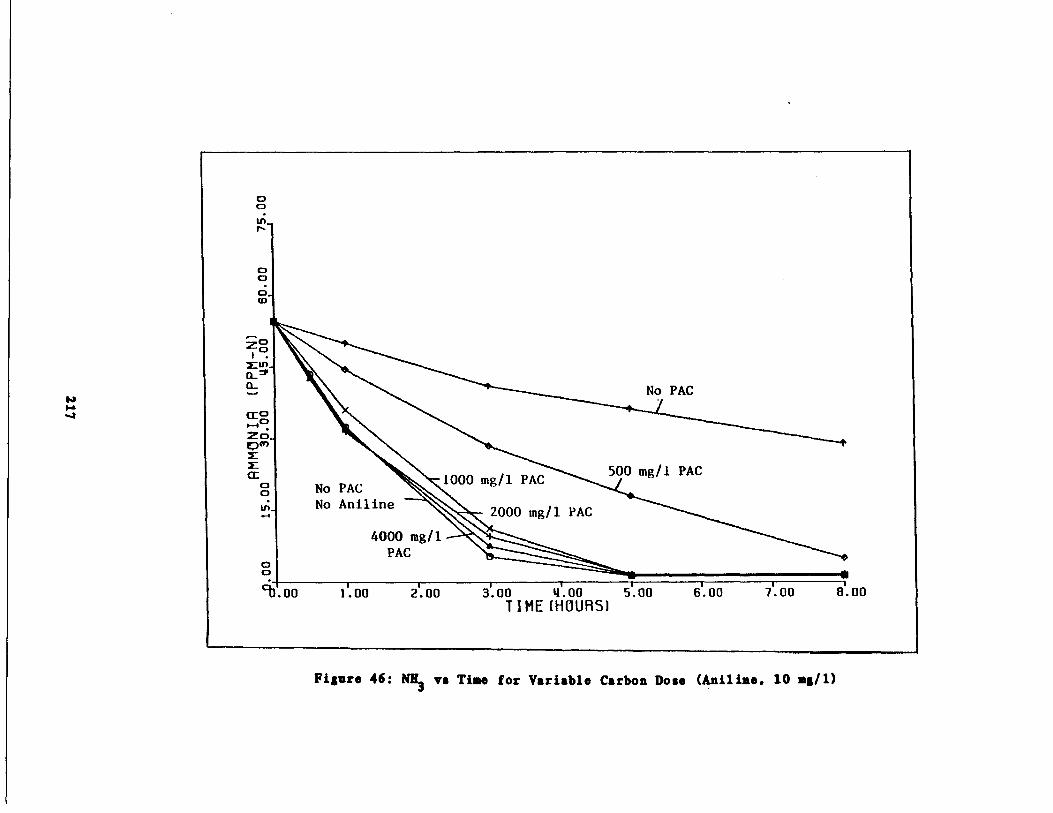
Figure 46 : NH3 vs Tine for Variable Carbon Dose (Aniline . 10 ,g/1)
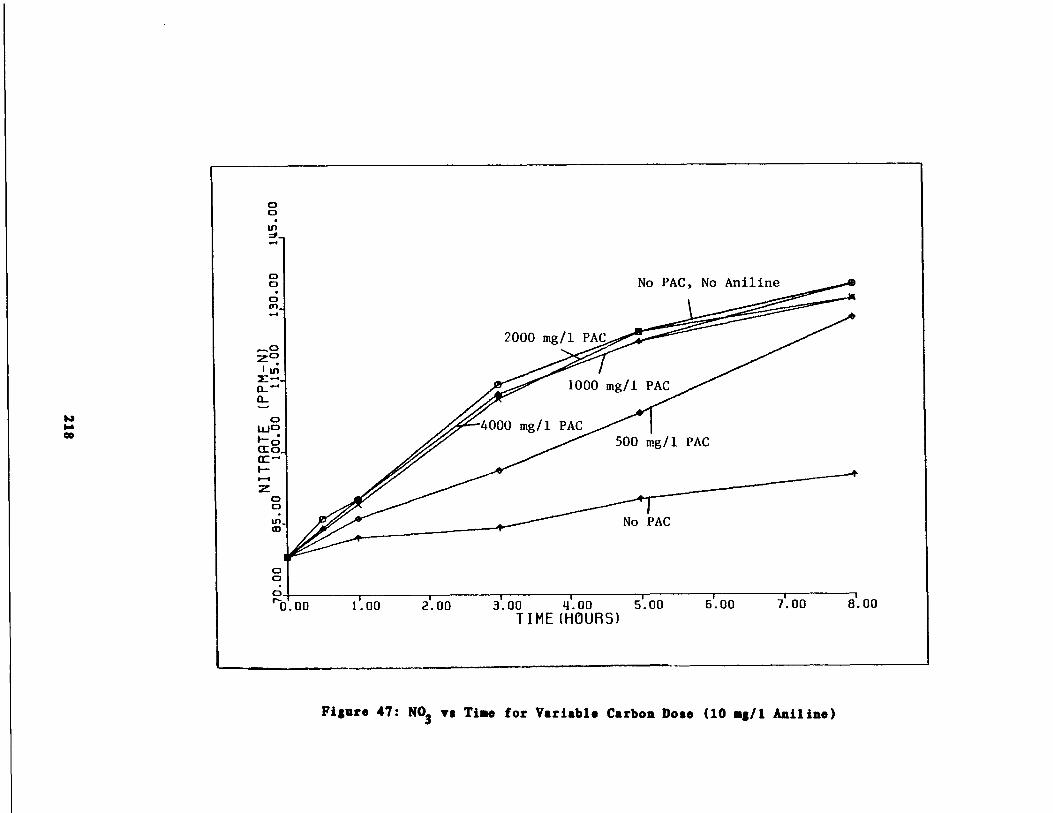
TIME (HOURS)
Figure 47 : N03 vs Tine for Variable Carbon Dose (10 mg/l Aniline)
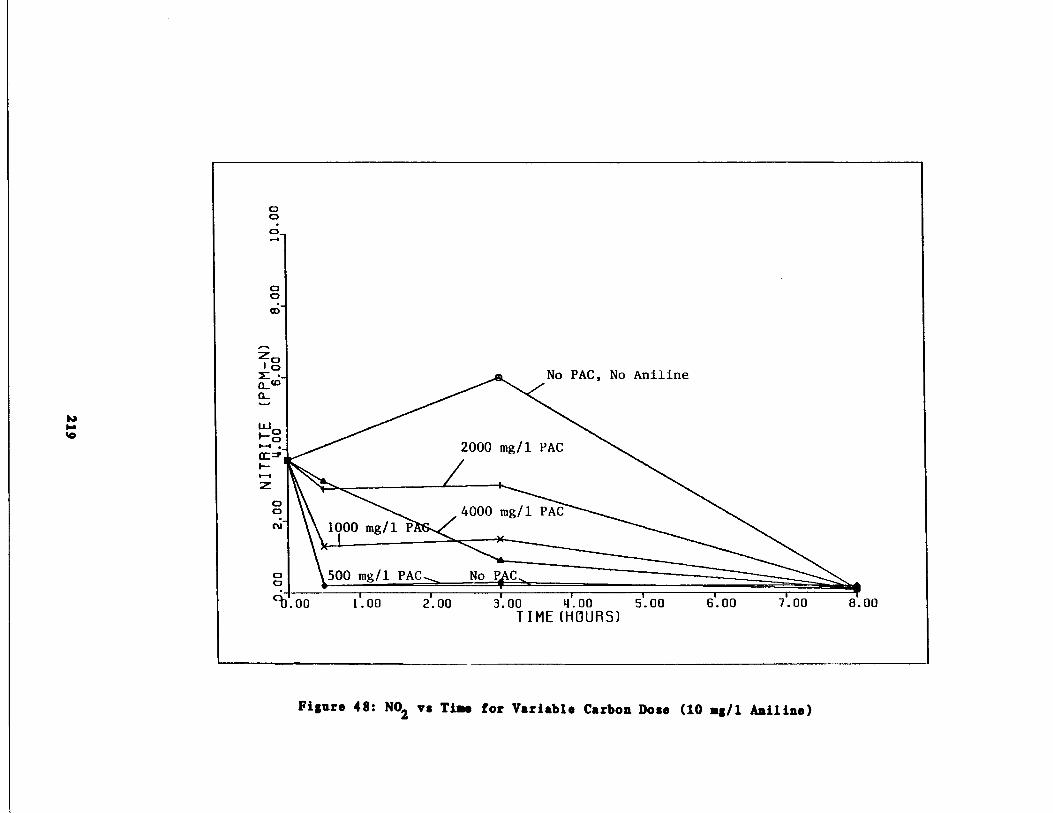
Figure 48 : NO2 vs Tine for Variable Carbon Dose (10 ag/l Aniline)
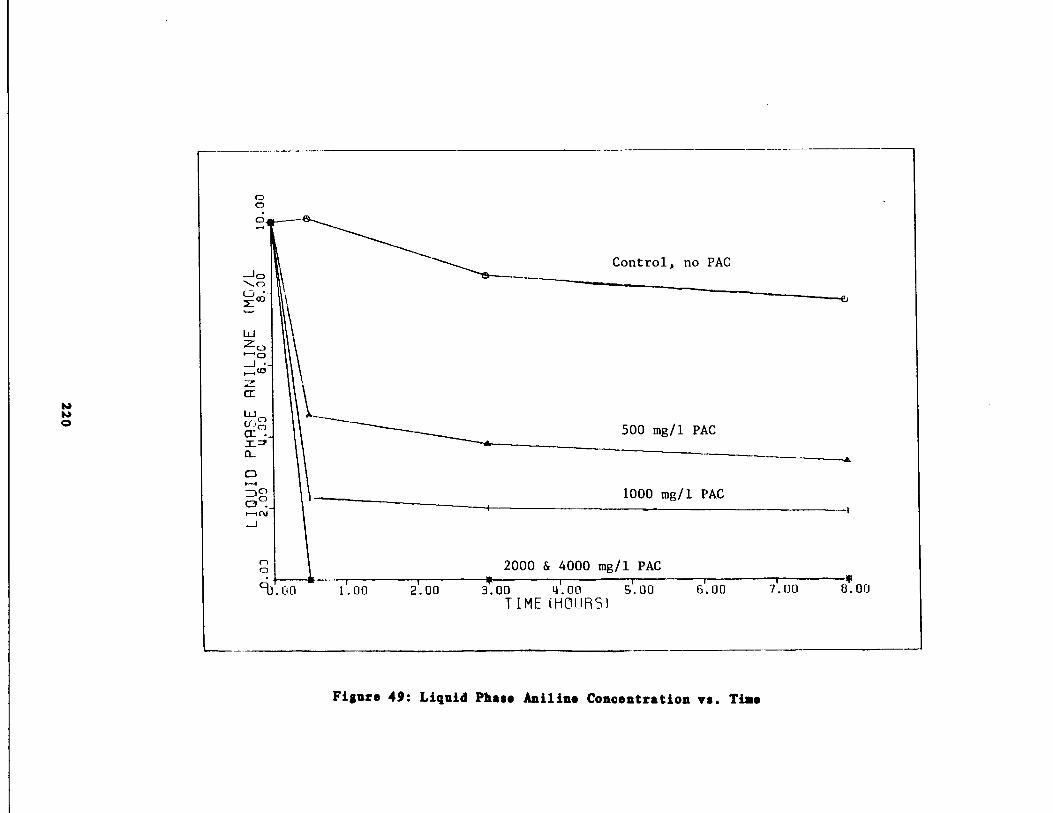
CDO
500 mg/l PAC
1000 mg/l PAC
2000 & 4000 mg/l PAC
i1. 00
21.00
3.00
4'.00
5'.00TIME (H011BS)
Control, no PAC
Figure 49 : Liquid Phase Aniline Concentration vs . Time
6 .00
7 .00
8 .00
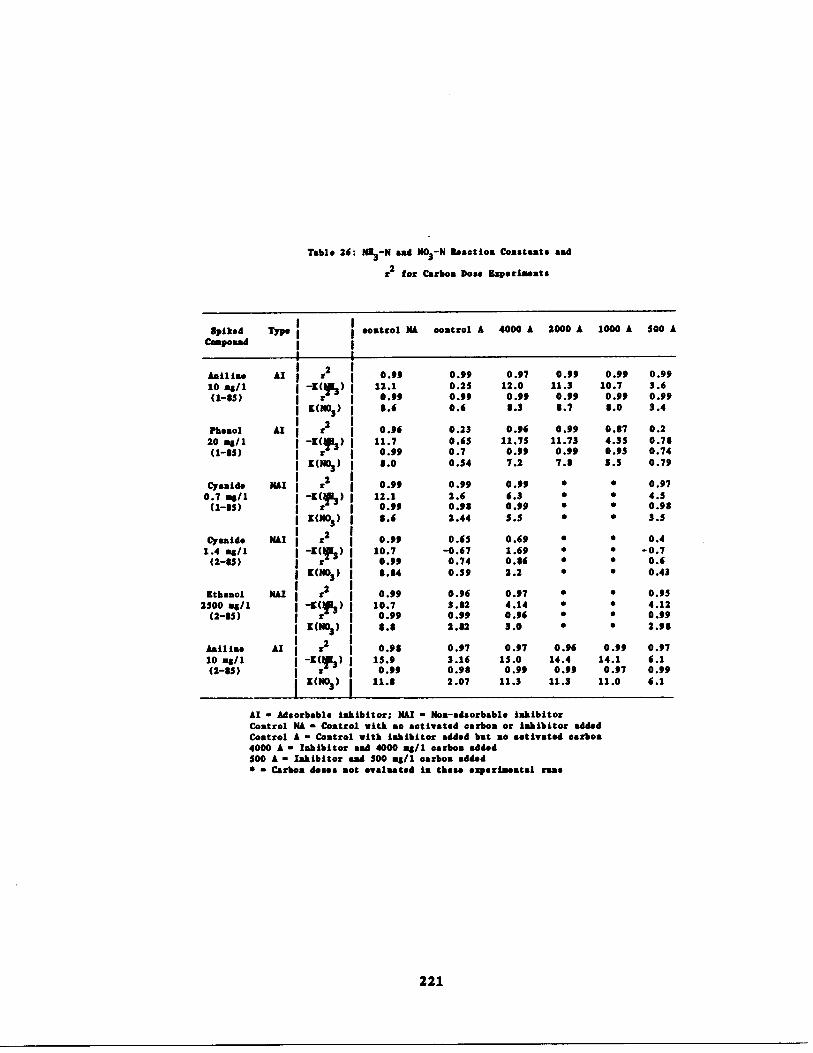
Table 26 : NE3-N aad N03-N Reaction Constants and
r2 for Carbon Doss Experiments
AI - Adsorbsble Inhibitor; NAI - Non-adsorbabls inhibitorControl NA - Control with so activated carbon or inhibitor addedControl A - Control with inhibitor added but so activated oarboa4000 A - Inhibitor and 4000 a8/1 carbon added500 A - Inhibitor and 500 a8/1 carbon added„
- Carbon doses act evaluated is these experimental runs
221
SpikedComposed
Type control NA control A 4000 A 2000 A 1000 A 500 A
Aniline AI r2 0.99 0.99 0 .97
0.99
0 .99 0 .9910 .g/1 -[(f3 ) 12 .1 0.25 12.0
11 .3
10 .7 3 .6(1-85) r 0 .99 0.99 0 .99
0.99
0 .99 0 .99[(NOS) 8 .6 0.6 8 .3
8.7
8.0 3 .4
Phenol AI r2 0 .96 0 .23 0 .96
0.99
0.87 0.220 a8/1 -[(V 3 ) 11 .7 0 .65 11 .75
11 .73
4.35 0.78(1-85) r 0 .99 0 .7 0 .99
0 .99
0.95 0.74[(NO3 ) 8 .0 0 .54 7 .2
7 .8
3 .5 0.79
Cyanide NAI r2 0 .99 0 .99 0 .99
„
„ 0.970.7 a8/1 -[(f3) 12.1 2.6 6.3
„
„ 4.5(1-85) r 0 .99 0 .98 0 .99
„
„ 0 .98[(NOS ) 8 .6 2.44 3.5
„
„ 3 .5
Cyanide MAX r 2 0.99 0.65 0 .69
„
„ 0 .41 .4 q/1 -[(1% ) 10.7 -0.67 1.69
„
„ -0 .7(2-85) r 0.99 0.74 0.86
„
„ 0 .6[(NO3 ) 8.84 0.59 2.2
„
„ 0 .43
Ethanol NAI r2 0 .99 0.96 0.97
„
„ 0.952500 as/1 -[(h) 10.7 3 .82 4 .14
„
„ 4.12(2-85) r 0 .99 0 .99 0.96
„
„ 0.99[(NO3 ) 8 .8 2 .82 3 .0
„
„ 2.98
Anilis, AI r2 0 .98 0 .97 0 .97
0 .96
0 .99 0.9710 a8/1 -&(V%) 15 .9 3 .16 15 .0
14 .4
14.1 6.1(2-85) r 0 .99 0 .98 0 .99
0 .99
0.97 0.99[(NO3 ) 11.8 2 .07 11 .3
11 .3
11 .0 6.1
following depletion of ammonia ; thus obscuring the inherent linearity of
the reaction .
In general, nitrate production rate constants were observed to
range from 60 to 100% of the corresponding ammonia oxidation rate con-
stants . However, at the end of each experiment, measured nitrate concen-
trations were all within 14% of expected values (based on the
stoichiometry of nitrification and excluding ammonia release due to
endogenous decay) . The reason(s) for the low nitrate production rates,
relative to the corresponding ammonia oxidation rates, observed espe-
cially in the early stages of the experiments are unknown ; although
similar findings have been reported in published studies . Hall and Mur-
phy (1980) reported data from batch activated sludge nitrification stu-
dies, indicating nitrate production rates 85% of corresponding ammonia
oxidation rates . They offered no explanation for these observations .
One possible explanation is the accumulation of nitrites, implying that
Nitobacter had limited overall nitrification . In the final carbon dose
experiment with 10 mg/1 aniline, nitrite was measured with time . These
results, shown in Figure 48, indicate that nitrite oxidation limiting
conditions may explain the lag in nitrate production rates .
Another possible explanation is that offered by wood, et . al .
(1980), who reported inorganic nitrogen losses of up to 43% in batch
nitrification inhibition studies with activated sludge cultures . After
exploring a number of possible explanations to account for their
results, the investigators attributed the losses to the reduction of
nitrite by hydroxylamine-nitrite reductase in Nitrosomonas when "suffi-
222
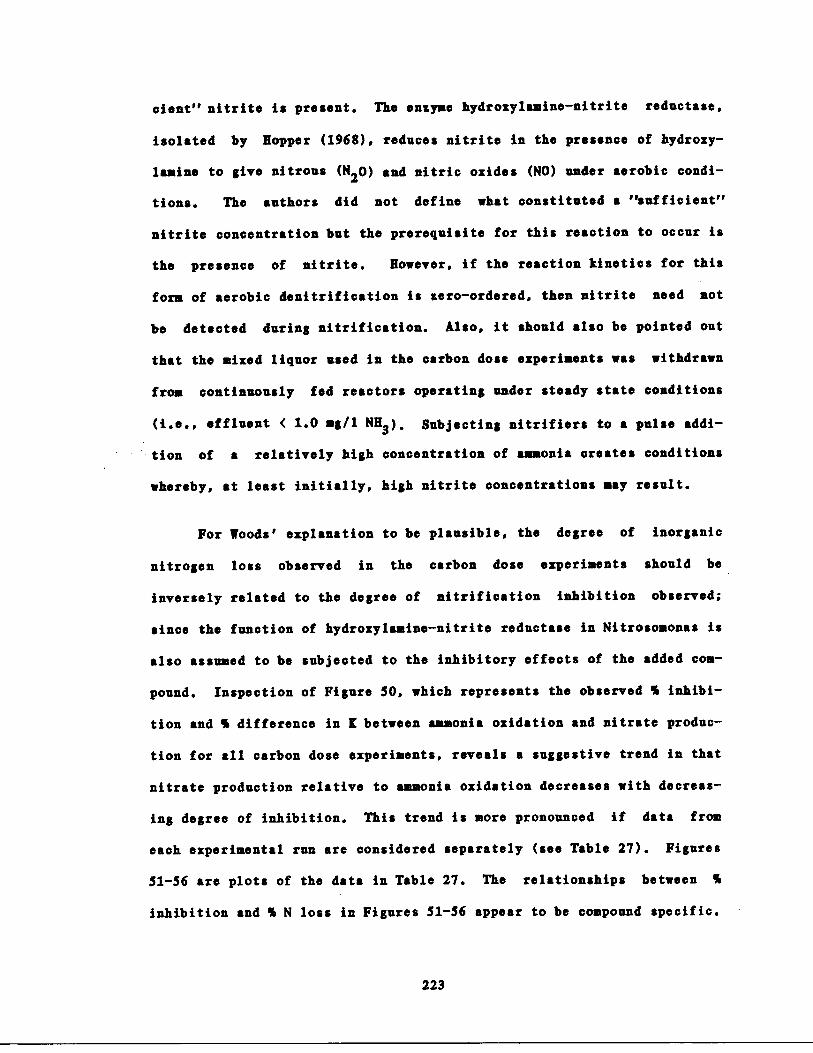
cient" nitrite is present . The enzyme hydroxylamine-nitrite reductase,
isolated by Hopper (1968), reduces nitrite in the presence of hydroxy-
lamine to give nitrous (N20) and nitric oxides (NO) under aerobic condi-
tions . The authors did not define what constituted a "sufficient"
nitrite concentration but the prerequisite for this reaction to occur is
the presence of nitrite . However, if the reaction kinetics for this
form of aerobic denitrification is zero-ordered, then nitrite need not
be detected during nitrification. Also, it should also be pointed out
that the mixed liquor used in the carbon dose experiments was withdrawn
from continuously fed reactors operating under steady state conditions
(i .e ., effluent ( 1 .0 mg/l NH3 ), Subjecting nitrifiers to a pulse addi-
tion of a relatively high concentration of ammonia creates conditions
whereby, at least initially, high nitrite concentrations may result .
For Woods' explanation to be plausible, the degree of inorganic
nitrogen loss observed in the carbon dose experiments should be
inversely related to the degree of nitrification inhibition observed ;
since the function of hydroxylamine-nitrite reductase in Nitrosononas is
also assumed to be subjected to the inhibitory effects of the added com-
pound . Inspection of Figure 50, which represents the observed S inhibi-
tion and % difference in B between ammonia oxidation and nitrate produc-
tion for all carbon dose experiments, reveals a suggestive trend in that
nitrate production relative to ammonia oxidation decreases with decreas-
ing degree of inhibition . This trend is more pronounced if data from
each experimental run are considered separately (see Table 27) . Figures
51-56 are plots of the data in Table 27 . The relationships between %
inhibition and % N loss in Figures 51-56 appear to be compound specific .
223
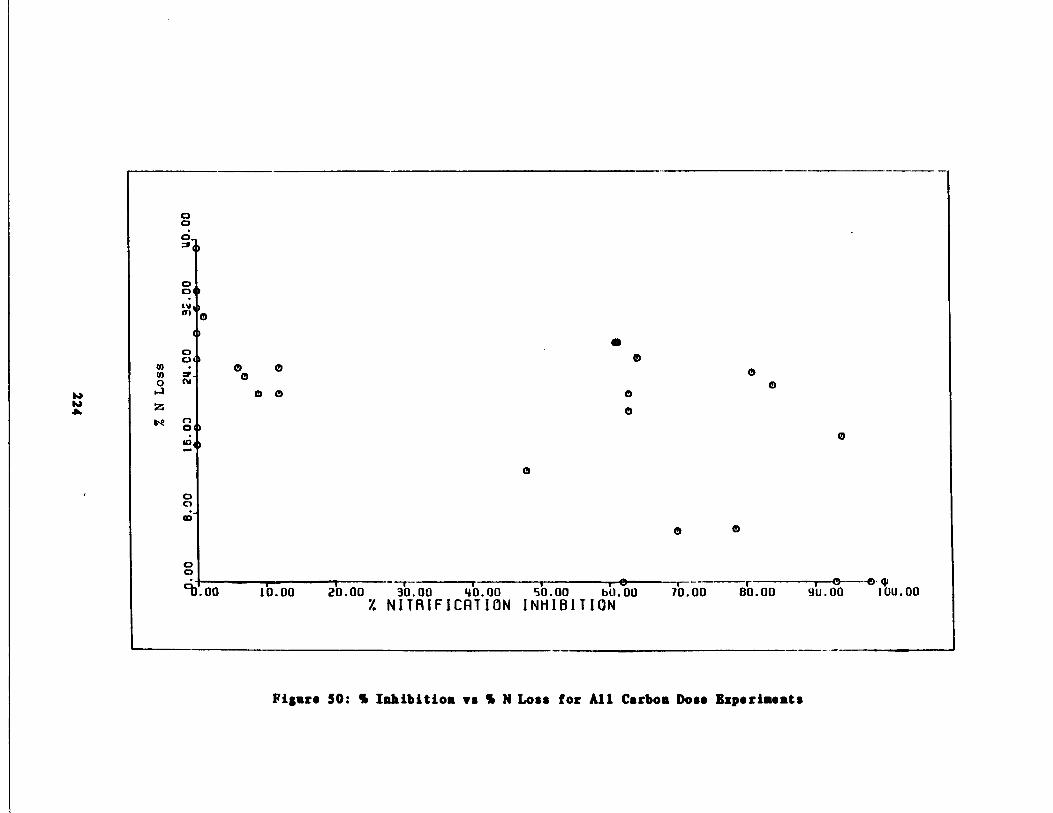
00O_=P0
O00
n)
00
UO
0W0
N-
0 0
0.a
o 0
0z
0n00
0.0m
OO
0
O 0
0
`b .00
10.00
20.00
30 00
40.00
50.00
bO.00 00
80.00
90.00
100.00NITRIFICRTION INHIBITION
Figure SO : % Inhibition vs % N Loss for All Carbon Dose Experinents
0
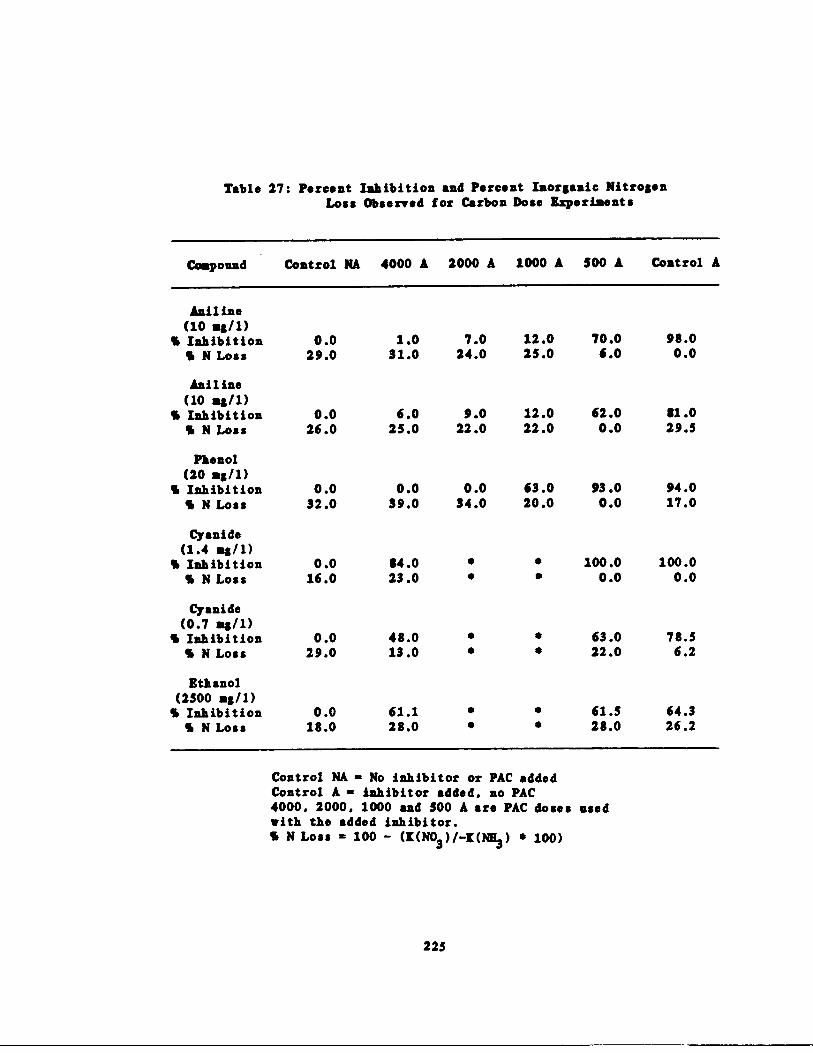
Table 27 : Percent Inhibition and Percent Inorganic NitrogenLoss Observed for Carbon Dose Experiments
Control NA - No inhibitor or PAC addedControl A - inhibitor added, no PAC4000, 2000, 1000 and 500 A are PAC doses usedwith the added inhibitor .S N Loss - 100 - (I(N03 )/-I(NE3 ) „ 100)
225
Compound Control NA 4000 A 2000 A 1000 A 500 A Control A
Aniline(10 US/1)
S Inhibition 0 .0 1 .0 7 .0 12 .0 70 .0 98 .0S N Loss 29 .0 31 .0 24 .0 25 .0 6.0 0 .0
Aniline(10 US/1)
S Inhibition 0 .0 6 .0 9 .0 12 .0 62.0 81 .0% N Loss 26 .0 25 .0 22 .0 22 .0 0 .0 29 .5
Phenol(20 US/1)
% Inhibition 0 .0 0 .0 0 .0 63 .0 93 .0 94 .0S N Loss 32 .0 39 .0 34 .0 20 .0 0.0 17 .0
Cyanide(1 .4 ag/1)
S Inhibition 0 .0 84 .0 0 „ 100 .0 100 .0S N Loss 16 .0 23 .0 „ „ 0 .0 0 .0
Cyanide(0 .7 ag/i)
S Inhibition 0 .0 48.0 „ „ 63 .0 78 .5% N Loss 29 .0 13 .0 „ „ 22 .0 6 .2
Ethanol(2500 ag/1)S Inhibition 0 .0 61 .1 „ „ 61 .5 64 .3
S N Loss 18 .0 28 .0 „ „ 28.0 26 .2
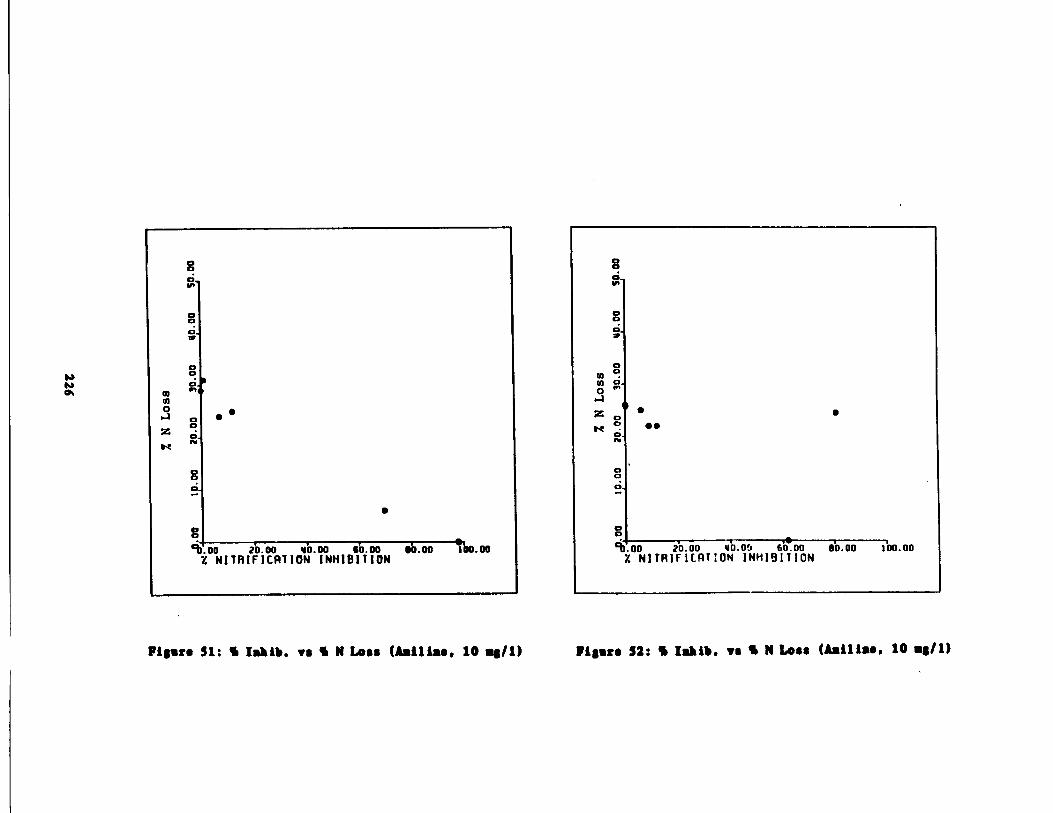
g
009.oo
2b.oo
vo.oo
sb.oo
ob. oo
ƒbo.ooNITRIFICATION INHIBITION
Figure 31 : 1 Iabib . „s S N Loss (Aniline. 10 y/1)
000_in
000
00
0t
‚oo.
001-b.oo
?b .oo
vo .oj
sb.oo
eb.oo
1oo.ooNITRIFICATION INHIBITION
„
0
„
0
Figure $2 : % Iabib . vs % N Loss (Aailia„, 10 a#/1)
g0
00
000Ato
m0PA 0
0zN,K

000
0O
0m0a
O00w -
z 000N
O00
0
cb.oo
70.00
40.00
Co .00
fro . 00
100.00NITRIFICATION INHIBITION
Fibre 33 : S Iabib . vs % N Loss (tboaol. 20 mg/ 1)
g0M
OO.7
00N
g0
o
gb.oo
2b.oo
sb.oo
sb.oo
sb.oo
1bo.ooZ NITRIFICATION INHIBITION
Figure 54 : 1 Iabib . „s S N Loss (Etbaaol, 2300 x13/1)
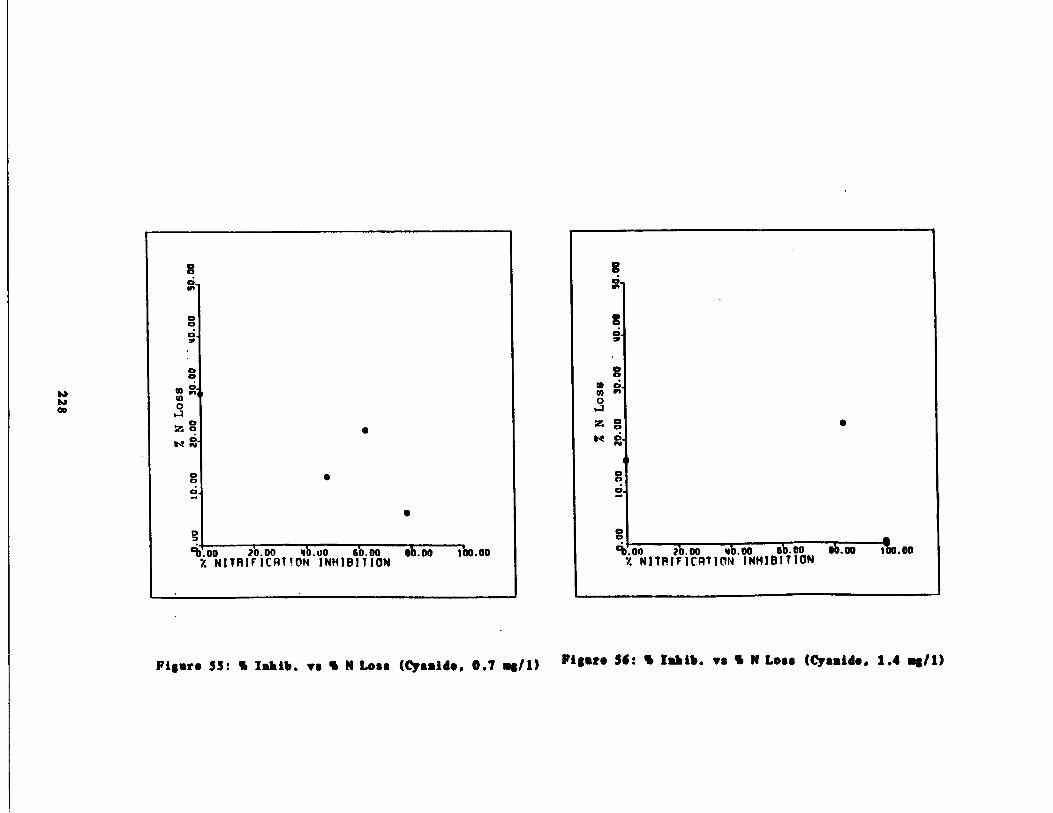
000
.
g
`D.oo
A.oo
wb.oo
sb.oo
ab.oo
ibo.ooY NITRIFICRI!ON INHIBITION
S0in
00.
00m 0.dl0ax 0K n'
00o.
.
S9 .oo
tb.oo
4b.oo
Am
ab.oo
ioo .ooNITPIFICATION INHIBITION
Figure 55 : S Iahib . vs ' N Loss (Cysaid. . 0 .7 mg/1) Figure Si : % Iamb. vs % N Loss (Cysaid. . 1 .4 mg/1)
000
000
00dl0
zo .tom' N'
For the adsorbable inhibitors, aniline and phenol, Woods' explanation
for aerobic denitrification is supported . The limited data available
for non-adsorbable inhibitors, cyanide and ethanol, is less convincing
support for aerobic denitrification . If Figures 51-56 are to be taken as
evidence for the inhibition of hydroxylamine-nitrite reductase activity,
then the observed disparities between initial ammonia and nitrate reac-
tion rates in the carbon dose experiments can be explained by aerobic
denitrification.
Discussion on Carbon Dose Experiments
The results for experiments performed using adsorbable inhibitors
(i .e ., phenol and aniline) clearly demonstrate enhancement of nitrifica-
tion rates due to the addition of powdered activated carbon .
In the final carbon dose experiment with 10 mg/l aniline, liquid
phase aniline concentrations were measured by gas chromatography at
specific sampling periods throughout the experiment . Results, plotted
on Figure 49, show that liquid phase aniline concentration is directly
related to nitrification inhibition (see Figures 46-47) and inversely
related to PAC concentration. It appears that for cultures with no PAC
addition, approximately 2 mg/l of aniline was either metabolized and/or
adsorbed onto the biological mass . Figure 49 also indicates that
equilibrium conditions for aniline adsorption were rapidly established
with 80 to 95 % of the total adsorption occurring within 0 .5 hour .
229
Using the previously determined adsorption isotherm parameters for
aniline, the expected liquid phase aniline concentration at any given
carbon dosage may be determined . Expected concentrations can then be
compared with measured concentrations at the carbon dosages used in the
experiment . The following equation, derived from the Freundlich adsorp-
tion model, was used to calculate expected liquid phase aniline concen-
trations ;
Ci - Cf
(In if + In M)= e
The limit of detection for the gas chromatography method used to
analyzed aniline was 0 .3 mg/i . The reasons for the differences between
230
C1/nf (52)
where C i = initial aniline concentration, 10 mg/I
Cf = final equilibrium liquid phase concentration , mg/1
1/n = experimentally determined Freundlich parameter,0 .52
In Yf = experimentally determined Freundlich parameter,= -4 .402 ; Yf = 12 .9 mg/g at C e=1 .0 mg/1
M = carbon dose, g/l
Ce , the only unknown, can be solved for by trial and error or by a pro-
grammable calculator . Results of expected and measured Ce at the PAC
concentrations used in
PAC dose(mg/1)
the experiment are shown
Expected LiquidPhase Aniline (mg/1)
below;
MeasuredAniline (mg/1)
500.0 1 .8 3 .31000.0 0 .6 1 .92000.0 0 .17 not detected4000 .0 0 .05 not detected
the expected and observed values of liquid phase aniline are specula-
tive . Aside from the different mixing conditions used in the experiment
and the isotherm, the presence of biological solids may have interferred
with carbon adsorption sites . Martin and Iwugo (1982) recently reported
on the effects of inorganic and biological solids on the adsorption of
organics by activated carbon. They concluded that suspended solids,
particularly organic suspended solids, could interfere with the adsorp-
tion process, both in terms of adsorption capacity and adsorption rate .
They found that organic suspended solids beginning at 500 mg/i appeared
to interfere with the adsorption process for single solute solutions and
that adsorption was significantly reduced .
By interpolation of Figure 57 (to be discussed) for the final ani-
line experiment of 2-85, it can be estimated that the PAC concentration
at which 75% nitrification occurred was 103 mg/1 . The corresponding
liquid phase aniline concentration for this PAC dosage, based on the
isotherm parameters, is 6 .8 mg/1 . For comparative purposes, Tomilinson
(1966) observed, under similar experimental conditions, that the concen-
tration of aniline causing 75% nitrification inhibition in nitrifying
activated sludge was 7 .7 mg/1 .
The foregoing discussion suggests, at least for aniline, that nit-
rification inhibition is caused by liquid phase inhibitor concentration
as opposed to total inhibitor concentration in a given PAC-activated
sludge system .
231
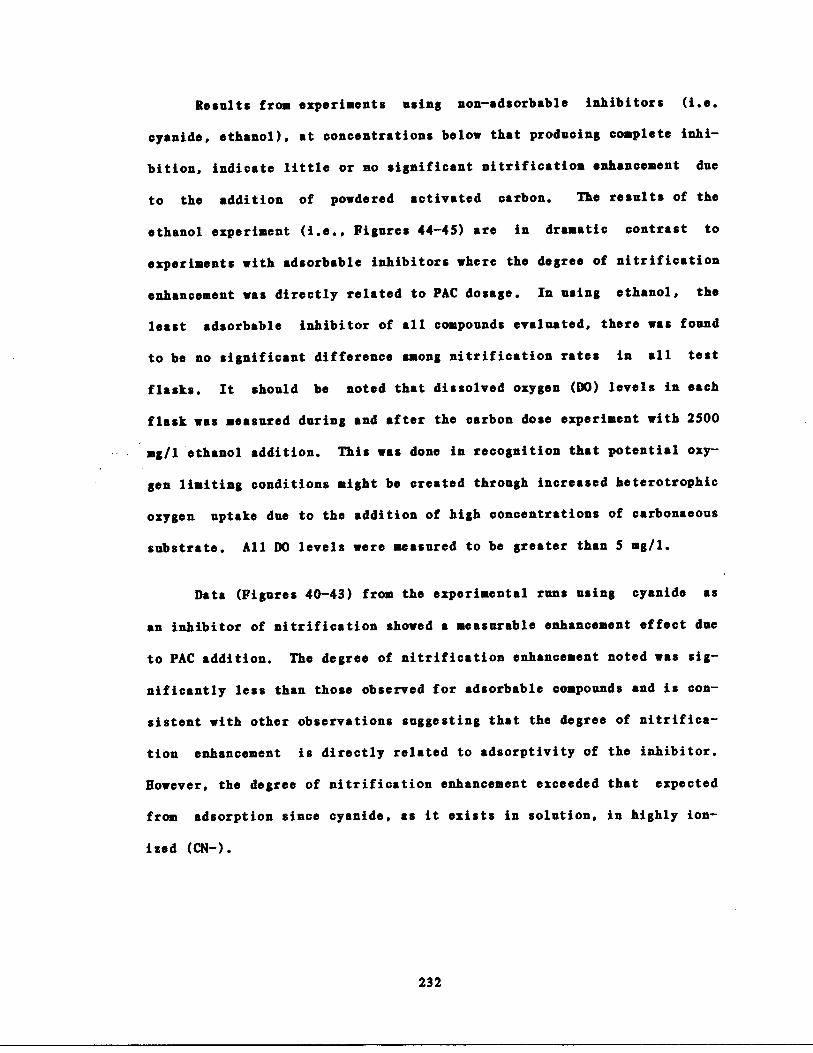
Results from experiments using non-adsorbable inhibitors (i .e .
cyanide, ethanol), at concentrations below that producing complete inhi-
bition, indicate little or no significant nitrification enhancement due
to the addition of powdered activated carbon . The results of the
ethanol experiment (i .e ., Figures 44-45) are in dramatic contrast to
experiments with adsorbable inhibitors where the degree of nitrification
enhancement was directly related to PAC dosage . In using ethanol, the
least adsorbable inhibitor of all compounds evaluated, there was found
to be no significant difference among nitrification rates in all test
flasks . It should be noted that dissolved oxygen (DO) levels in each
flask was measured during and after the carbon dose experiment with 2500
ag/l ethanol addition. This was done in recognition that potential oxy-
gen limiting conditions might be created through increased heterotrophic
oxygen uptake due to the addition of high concentrations of carbonaeous
substrate . All DO levels were measured to be greater than 5 mg/l .
Data (Figures 40-43) from the experimental runs using cyanide as
an inhibitor of nitrification showed a measurable enhancement effect due
to PAC addition . The degree of nitrification enhancement noted was sig-
nificantly less than those observed for adsorbable compounds and is con-
sistent with other observations suggesting that the degree of nitrifica-
tion enhancement is directly related to adsorptivity of the inhibitor .
However, the degree of nitrification enhancement exceeded that expected
from adsorption since cyanide, as it exists in solution, in highly ion-
ized (CN-) .
232
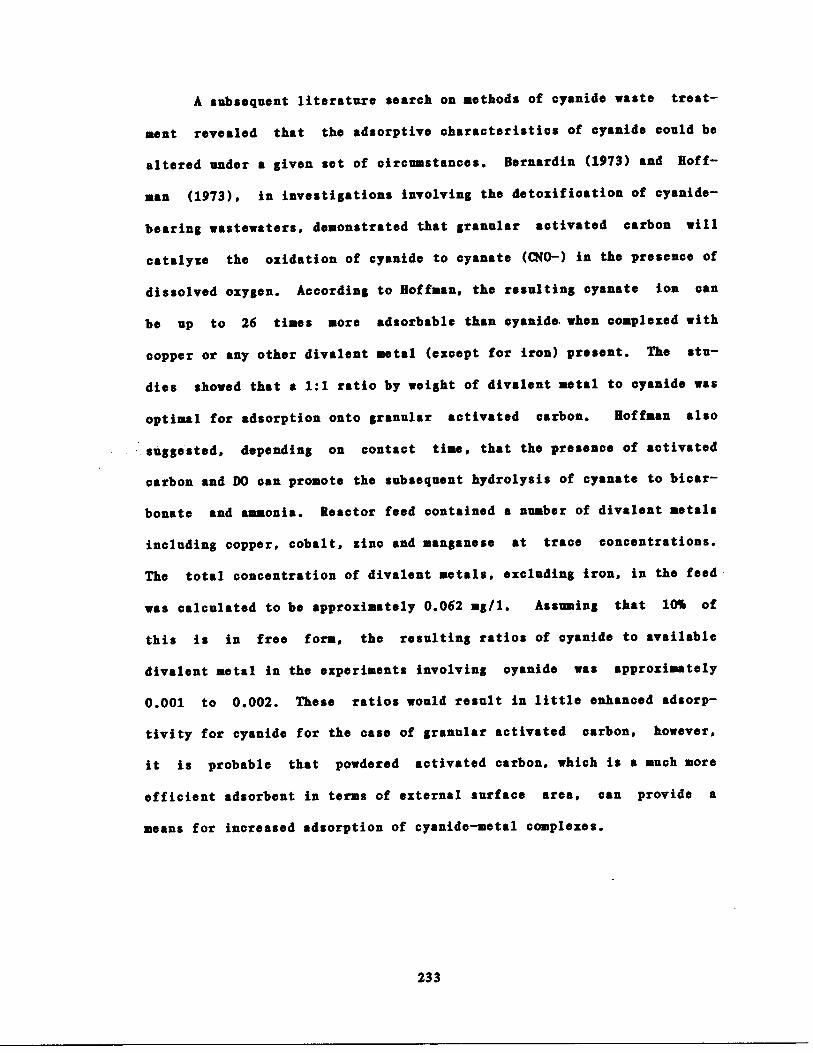
A subsequent literature search on methods of cyanide waste treat-
ment revealed that the adsorptive characteristics of cyanide could be
altered under a given set of circumstances . Bernardin (1973) and Hoff-
man (1973), in investigations involving the detoxification of cyanide-
bearing wastewaters, demonstrated that granular activated carbon will
catalyze the oxidation of cyanide to cyanate (CNO-) in the presence of
dissolved oxygen. According to Hoffman, the resulting cyanate ion can
be up to 26 times more adsorbable than cyanide . when complexed with
copper or any other divalent metal (except for iron) present . The stu-
dies showed that a 1 :1 ratio by weight of divalent metal to cyanide was
optimal for adsorption onto granular activated carbon . Hoffman also
suggested, depending on contact time, that the presence of activated
carbon and DO can promote the subsequent hydrolysis of cyanate to bicar-
bonate and ammonia . Reactor feed contained a number of divalent metals
including copper, cobalt, zinc and manganese at trace concentrations .
The total concentration of divalent metals, excluding iron, in the feed
was calculated to be approximately 0 .062 mg/l . Assuming that 10% of
this is in free form, the resulting ratios of cyanide to available
divalent metal in the experiments involving cyanide was approximately
0 .001 to 0 .002 . These ratios would result in little enhanced adsorp-
tivity for cyanide for the case of granular activated carbon, however,
it is probable that powdered activated carbon, which is a much more
efficient adsorbent in terms of external surface area, can provide a
means for increased adsorption of cyanide-metal complexes .
233
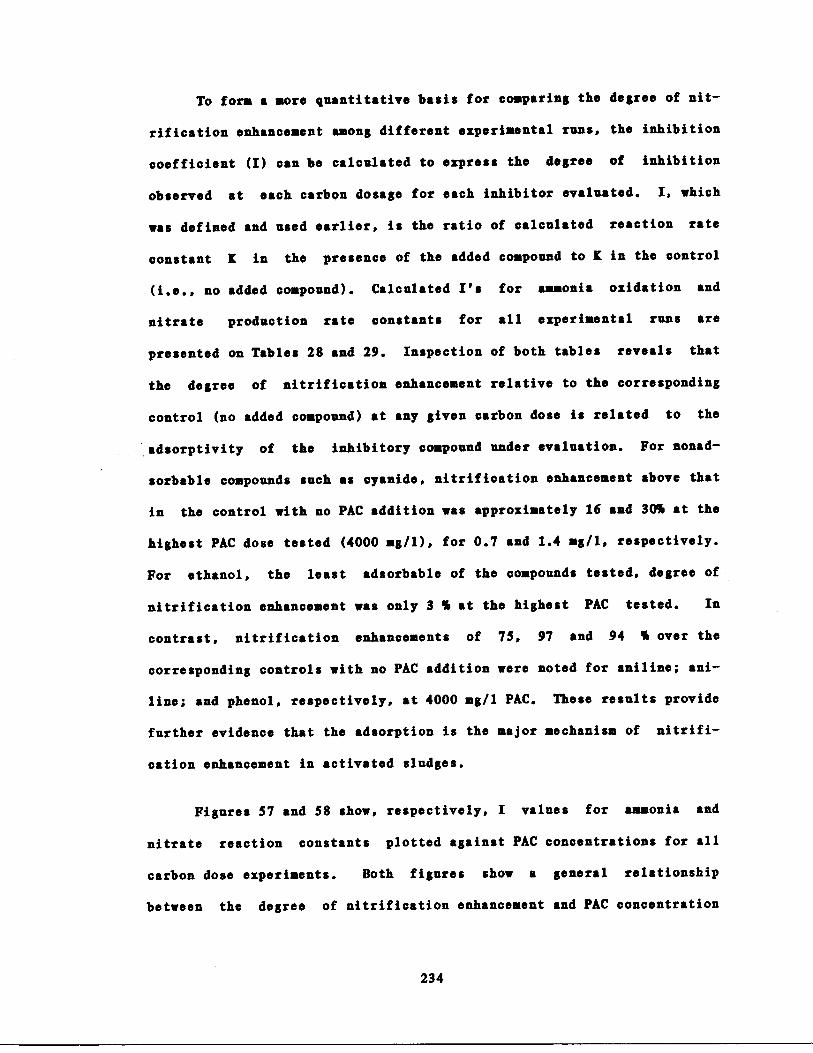
To form a more quantitative basis for comparing the degree of nit-
rification enhancement among different experimental runs, the inhibition
coefficient (I) can be calculated to express the degree of inhibition
observed at each carbon dosage for each inhibitor evaluated . I, which
was defined and used earlier, is the ratio of calculated reaction rate
constant K in the presence of the added compound to K in the control
(i .e ., no added compound) . Calculated I's for ammonia oxidation and
nitrate production rate constants for all experimental runs are
presented on Tables 28 and 29 . Inspection of both tables reveals that
the degree of nitrification enhancement relative to the corresponding
control (no added compound) at any given carbon dose is related to the
adsorptivity of the inhibitory compound under evaluation . For nonad-
sorbable compounds such as cyanide, nitrification enhancement above that
in the control with no PAC addition was approximately 16 and 30% at the
highest PAC dose tested (4000 mg/1), for 0 .7 and 1 .4 mg/l, respectively .
For ethanol, the least adsorbable of the compounds tested, degree of
nitrification enhancement was only 3 % at the highest PAC tested. In
contrast, nitrification enhancements of 75, 97 and 94 % over the
corresponding controls with no PAC addition were noted for aniline ; ani-
line ; and phenol, respectively, at 4000 mg/l PAC . These results provide
further evidence that the adsorption is the major mechanism of nitrifi-
cation enhancement in activated sludges .
Figures 57 and 58 show, respectively, I values for ammonia and
nitrate reaction constants plotted against PAC concentrations for all
carbon dose experiments . Both figures show a general relationship
between the degree of nitrification enhancement and PAC concentration
234
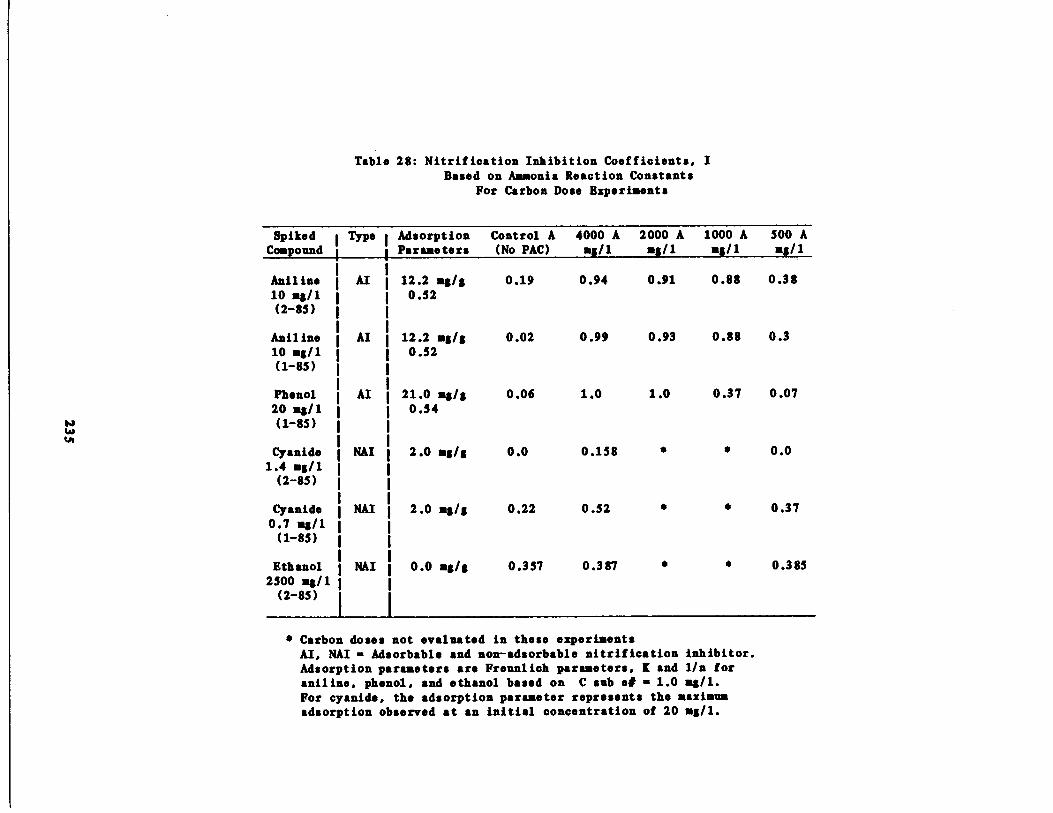
Table 28: Nitrification Inhibition Coefficients, IBased on Ammonia Reaction Constants
For Carbon Dose Experiments
(2-85)
„
Carbon doses not evaluated in these experimentsAl, NAI - Adsorbable and non-adsorbable nitrification inhibitor .Adsorption parameters are Freunlich parameters, I and 1/n foraniline, phenol, and ethanol based on C sub e# - 1 .0 a&/I .For cyanide, the adsorption parameter represents the maximumadsorption observed at an initial concentration of 20 a&/I .
SpikedCompound
Type 1 AdsorptionParameters
Control A(No PAC)
4000 Aa8/l
2000 AaI/l
1000 AUS/1
S00 Amg/1
Aniline Al
12.2 ag/g 0 .19 0 .94 0 .91 0 .88 0 .3810 a`/1 0 .52(2-85)
Aniline AI
12.2 a1/1 0 .02 0 .99 0 .93 0 .88 0 .310 aj/l 0 .52(1-85)
Phenol AI
21 .0 ai/S 0 .06 1 .0 1 .0 0 .37 0 .0720 mg/ I 0 .54(1-85)
Cyanide NAI
2 .0 a`/S 0 .0 0 .158 „ „ 0 .01 .4 mg/1
(2-85)
Cyanide NAI
2.0 ag/S 0 .22 0 .52 e „ 0 .370 .7 a`/1(1-85)
Ethanol NAI
0 .0 ag/` 0 .357 0 .387 „ „ 0 .3852500 ag/l

Table 29 : Nitrification Inhibition Coefficients, IBased on Nitrate Production Constants
For Carbon Dose Experiments
2500 mg/1(2-85)
„
Carbon doses not evaluated in these experimental runsAI, NAI - Adsorbable and non-adsorbable nitrification inhibitorAdsorption parameters are Freunlich parameters . I and 1/n foraniline, phenol, and ethanol based on C - 1 .0 mg/l .For cyanide, the adsorption parameter represents the maximumadsorption observed at an initial concentration of 20 mg/1 CN .
SpikedCompound
Type AdsorptionParameters
Control A(no PAC)
4000 A 2000 A 1000 Aa8/l
USA
mJ/1500 AUSA
Aniline AI 12 .2 m8/g 0 .18 0 .96
0.96
0.93 0 .5210 ms/l 0 .52(2-85)
Aniline AI 12 .2 mi/g 0 .07 0 .97
1 .01
0.93 0 .3910 mg/1 0 .52(1-85)
Phenol Al 21 .0 mg/S 0 .07 0 .9
0.98
0.44 0 .120 m1/1 0 .54(1-85)
Cyanide NAI 2 .0 aI/I 0 .07 0 .25
e
„ 0 .051 .4 mg/1(2-85)
Cyanide NAI 2 .0 mI/I 0 .28 0 .64
„
„ 0 .410 .7 mg/1(1-85)
Ethanol NAI 0 .0 ae/I 0 .32 0 .34
„
„ 0 .34

Phenol(20 mg/1)
Aniline (10 gig/1) Aniline (10 mg/1)(2-85)
thanol (2500 mg/1)
9.00
40.00
80.00
l 0.00
160.00
200.00
2110.00
280.00CARBON DOSE (MG/L1 w10'
Figure 57 : Inhibition Coefficient, I (NH3 ) vs PAC Dosage
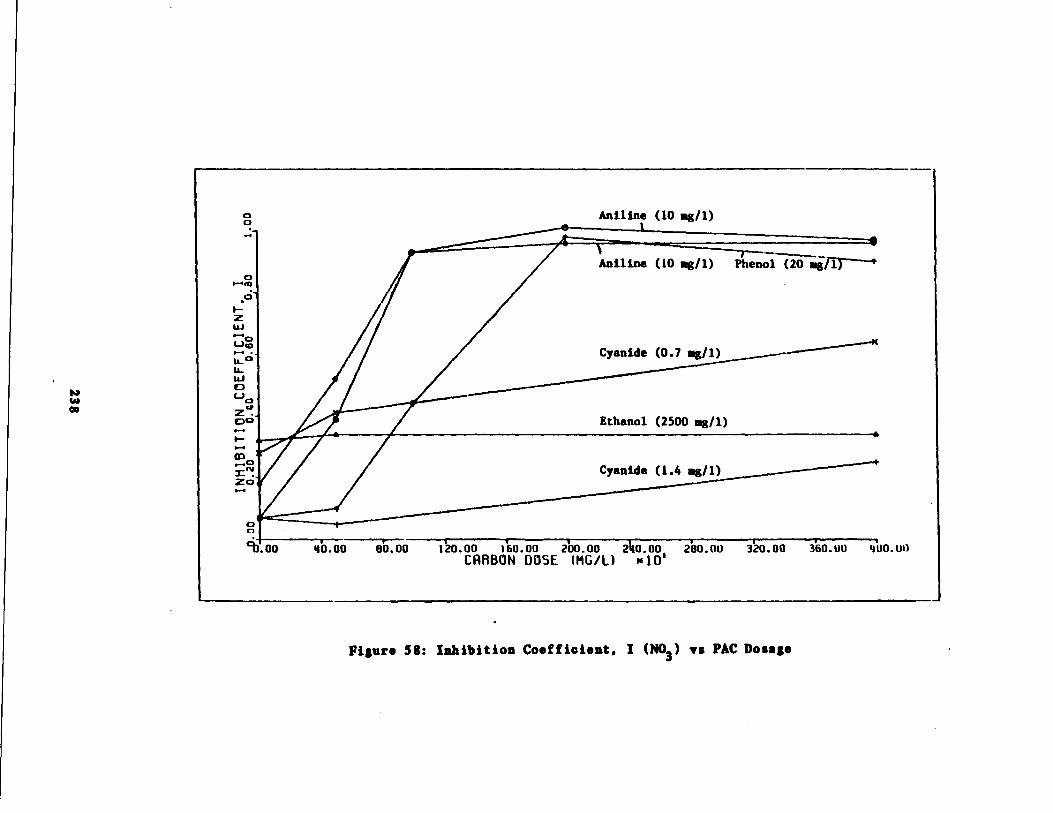
120 .00
160.00
200.00
2h0.00
280.00
320.00
360.00
400.00CARBON DOSE (MG/L) s10'
Figure 58 : Inhibition Coefficient, I (NO3 ) vs PAC Dosage
depending on the adsorptivity of the compound tested . For adsorbable
compounds, at the initial concentrations used, the relationship can be
characterized by a 'S" type curve . This indicates that nitrification
was enhanced marginally at low PAC doses and that the rate of nitrifica-
tion increased steadily with increasing PAC concentration until a pla-
teau was reached (i .e ., no further enhancement) . From this relation-
ship, it appears that nitrification enhancement depends upon the lower-
ing of inhibitor concentration, through adsorption, to some threshold
value before nitrification can proceed at reasonable rates . For nonad-
sorbable compounds, the enhancement/PAC relationship is characterize by
a relatively horizontal curve indicating no or little nitrification
enhancement with PAC concentration .
It is important to note that in these experiments, unacclimated
activated sludge and virgin PAC was used . For adsorbable inhibitors,
the beneficial effects of carbon were observed almost immediately after
the beginning of the test (i .e ., 2 hours) . These results support the
adsorption of inhibitory compounds theory of enhancement, and disproves
the other theories, at least for this series of experiments . The other
theories cannot account for the results of these experiments since there
was insufficient time for preferential growth on the carbon surfaces,
and the virgin carbon could not have been laden with trace nutrients or
have been able to concentrate them over short contact times . Therefore,
the role of PAC in mediating the effects of adsorbable inhibitory com-
pounds on nitrification in unacclimated activated sludge has been demon-
strated . In addition, these experiments provide strong evidence that a
major benefit of PAC addition in nitrifying activated sludge is
239
adsorption of toxic compounds that may be present in the waste stream .
240
ADDITIONAL OBSERVATIONS
Several other noteworthy observations can be made with respect to
refinery wastewater fed PAC activated sludge . Throughout the duration
of this study, the PAC reactor consistently demonstrated the greatest
stability .
Operation at an high sludge age (i .e ., 60 days) and high organic
loading (i .e ., influent > 500 mg/l TOC, 9g = 24 hours) invariably
results in high MLSS concentrations and probable settling difficulties
in the final clarifiers . There was never a problem in the PAC reactor
since PAC served as a weighting agent to improve settling . On the other
hand, the control and bentonite units often suffered from settling prob-
lems with high sludge blankets ; they generally did not demonstrate con-
sistent and desirable settling characteristics .
The difference between batches of wastewater received provided an
opportunity to compare the stability of all reactors . The PAC reactor
was observed to be the most stable in terms of foam suppression and
color removal . With almost every new wastewater batch, the control and,
especially, the bentonite reactor, experienced severe foaming problems .
No foaming was ever noted in the PAC reactor . Typically it would take
one week of stable operation with a new batch of wastewater before foam-
ing problems would subside in the non-PAC units . Increased color remo-
val in the PAC units over the control and bentonite units was also rou-
tinely observed . The color of the refinery wastewater was yellowish and
the effluent from the PAC reactors was noted to be as clear as the
effluent from the glucose reactors .
In contrast, the control and
241
bentonite reactor effluents retained the yellowish characteristic of the
inf luent .
Enhancement of nitrification efficiencies were also evident --
particularly during the initial start-up period for the reactors . The
later observation is best supported by Figures 59 and 60 which are cumu-
lative probability plots for effluent ammonia concentration for each
reactor type . These figures show that the addition of PAC in the glu-
cose fed reactors made no significant difference in nitrification . How-
ever, the addition of PAC to the refinery reactor resulted in signifi-
cantly more nitrification over the control and bentonite reactors . This
. was presumably due to a combination the factors noted earlier . It
should be noted that these benefits were observed almost exclusively
during the start-up period when reactor upsets were common . Following
the start-up period, all refinery reactors achieved excellent nitrifica-
tion and reactor effluent ammonia samples were taken less frequently .
242
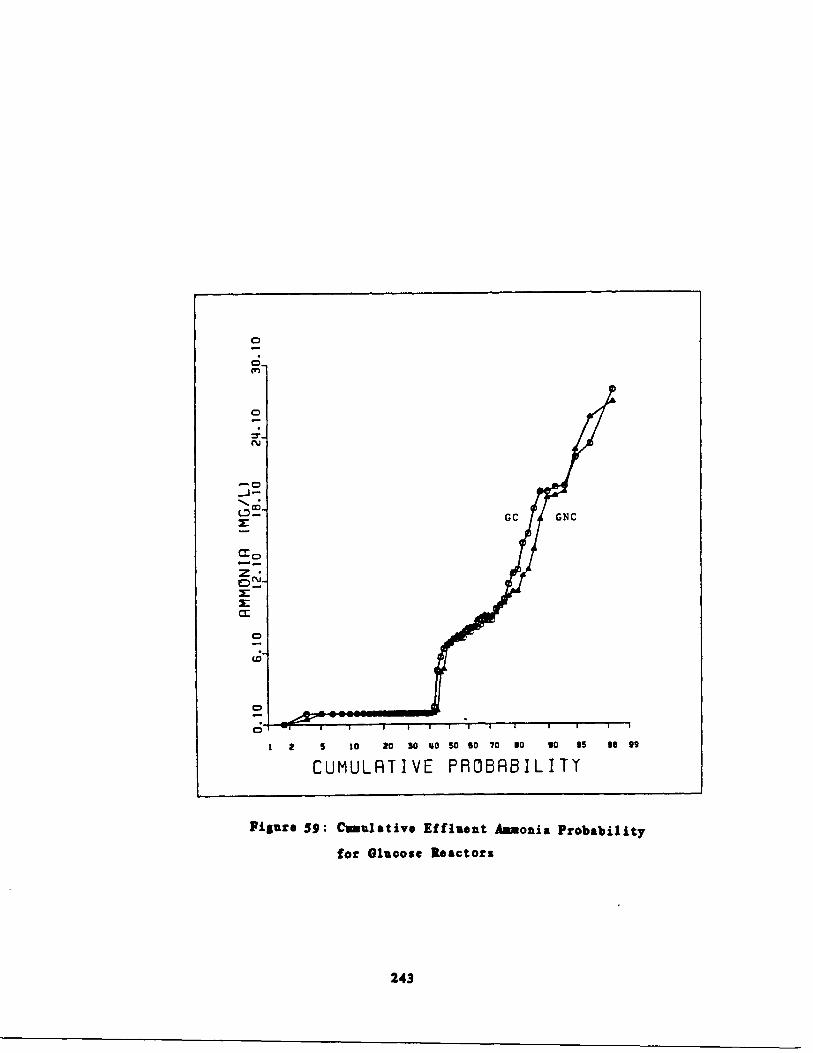
Figure S9 : Csssulative Effluent Aa onia Probability
for Glucose Reactors
243
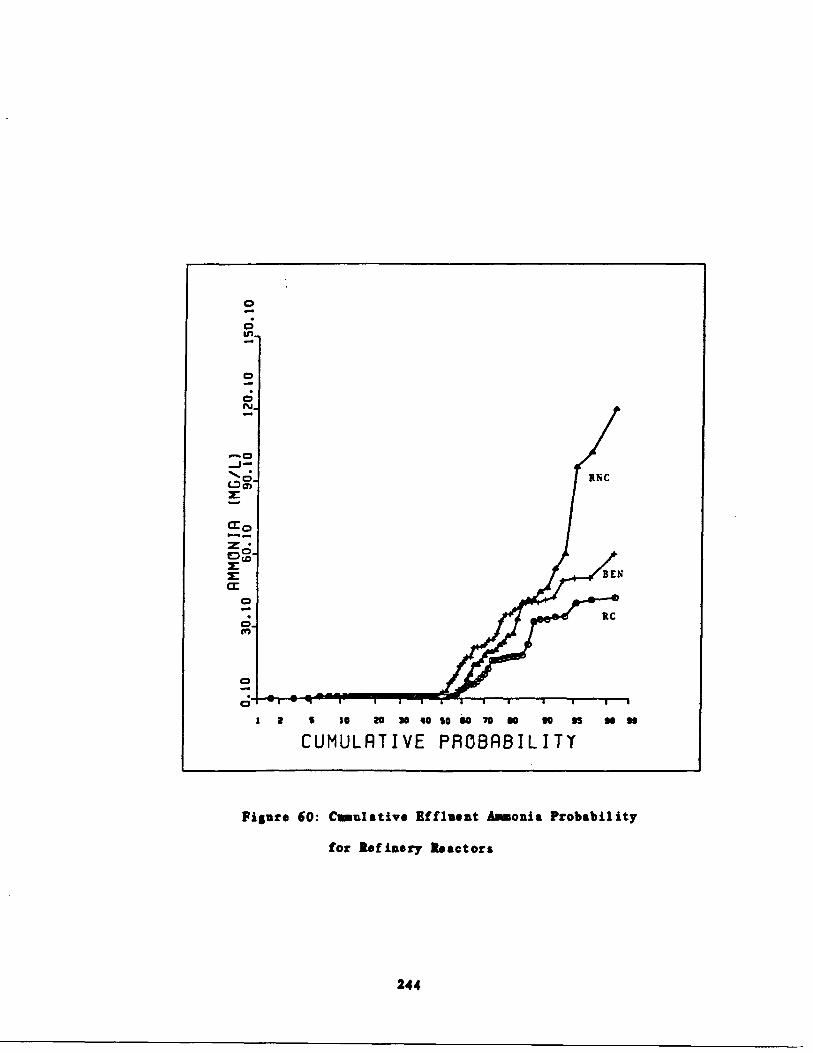
0
01n_
0
0
-O
„o=C;-
cc
OgypEf
O
RNC
BEN
RC
f
10
20 70 „0 $O „0 70 e0
so $5
M M
CUMULATIVE PROBABILITY
Figure 60 : CCulative Effluent Aamonia Probability
for Refinery Reactors
244
SUMMARY AND CONCLUSIONS
An experimental program was designed to assess the influence of
powdered activated carbon (PAC) and bentonite additions on activated
sludge nitrification rates in the presence of "spiked" compounds of
known inhibitory and adsorptive characteristics . Bentonite (aluminum
silicate) is a suspended solid with suitable surface chemistry for
microbial attachment but limited ability to adsorb organics . Based on
the results reported herein, the findings and conclusions in this study
can be summarized as follows :
1 . In batch inhibition studies, nitrification enhancement due to PAC
addition was demonstrated in unacclimated activated sludge cul-
tures in the presence of adsorbable inhibitors . Enhancement due
to the addition of either PAC or bentonite was not evident in any
experiments involving a non-adsorbable inhibitor . These results
provide evidence that adsorption of inhibitory compounds is a more
important mechanism for nitrification enhancement than is enhanced
nitrifier growth on the surface of suspended solids .
2 . For acclimated activated sludges, nitrification enhancement was
much more difficult to demonstrate, presumably because at the low
dosages used (50 mg/l influent), the benefits of sludge acclima-
tion were much more pronounced and perhaps obscured any benefit
the added carbon could produce .
3 .
The chronic experiments showed that acclimated sludges are capable
of recovering from shock load conditions of very high inhibitor
245

concentrations to full nitrification with no apparant after
effects . At the dosages used (50 mg/l influent), the addition of
either PAC or bentonite provided no significant enhancement of
nitrification rates under the experimental conditions .
4 . The initial chronic experiment gave evidence that the addition of
PAC to activated sludge can indirectly inhibit nitrification by
virtue of desorption of a previously adsorbed inhibitor . In this
same experiment, it was shown that an adequate dose of virgin PAC
can dramatically arrest the effect of an adsorbable inhibitor and
completely restore nitrification capability . The second chronic
experiment demonstrated that at a high concentration of aniline,
Nitrobacter activity was inhibited . Previous studies had impli-
cated aniline as an inhibitor only to ammonia oxidation . This
experiment also suggested that the Nitrobacter sp . may have an
affinity for attachment to suspended solids .
5 . Results from the carbon dose experiments indicated that the addi-
tion of PAC in the proper amounts can completely nullify the toxic
effects of an adsorable inhibitory compound in unacclimated
activated sludge cultures . For adsorbable nitrification inhibi-
tors, the addition of PAC resulted in no significant loss of nit-
rification capability and nitrification enhancements over control
units (i .e ., no PAC added) of 75 to 100%. For relatively non-
adsorbable inhibitors, nitrification enhancements of only 3 to 30%
were observed at the same carbon dosage . These results provide
convincing evidence in support of the theory that PAC can adsorb
246
inhibitory compounds, thereby enhancing nitrification rates .
6 . There appears to be an optimal dose of carbon required to negate
the effects of an inhibitor given that its concentration and
isotherm characteristics are known a priori .
7 . The results from the carbon dose experiments do not support the
theory that concentration of nutrients on the carbon surface is a
major mechanism for nitrification enhancement since the benefits
to nitrification from adding the virgin PAC was observed to be
immediate (i .e ., 1 hour or less) . Therefore, the effect of con-
centration of nutrients on the carbon surface over such short con-
tact times could provide little benefit in enhancing nitrifier
growth .
8 . Over the course of the experiments it became obvious that an
important factor for continued high efficiency nitrification was
the uniformity of influent fed to the reactors treating refinery
wastewater . It appears that providing a highly equalized influent
wastewater could provide approximately the same benefits to nit-
rification as powdered activated carbon addition at dosage
evaluated (50 mg/l influent) .
247
CONCLUSIONS
The results presented herein have important implications in the
wastewater treatment field, particularly in industrial wastewater treat-
ment, where nitrification inhibitors may be present . This study has
shown that the ma or mechanism by which PAC nitrification occurs is
adsorption of inhibitors that may be present . However, the results also
show that under steady state conditions, the gradual acclimation of
heterotrophic organisms to nitrification inhibitors is equally important
in maintaining the highest treatment efficiency possible .
Based on the results of the wor reported herein, the ma or con-
clusions of this study are threefold ;
1 . With respect to nitrification enhancement in nitrifying activated
sludges, the effects of the addition of powdered activated carbon
will be observed only in those wastewaters containing a predomi-
nance of adsorbable inhibitors . The addition of inert suspended
solid will not enhance nitrification under these conditions .
2 . The acclimation ability of heterotrophic microorganisms in
activated sludge to nitrification inhibitors present in wastewa-
ters, independent of adsorptive characteristics, can be a ma or
means of preventing loss of nitrification capability . In this
regard, the utilization of equalization basins, in situations
where the potential for nitrification inhibition exist, may serve
to buffer inhibitory effects by allowing ample opportunity for
heterotrophic acclimation .
248
3 . If nitrification loss due to adsorbable inhibitors is of primary
conceern, the periodic addition of PAC at relatively heavy doses
directly into the aeration basin may be a more efficient and
economical method of controlling "shoc loads" of adsorbable inhi-
bitors than is the steady state addition of PAC at low concentra-
tions (i .e ., 50 mg/i influent) .
249
ships in biological treatment processes, I . . Nitrification in theactivated sludge process, Water Res . 3, 73-81 .
25 0
REFERENCES
1 . Al-Bahrani, Y.S . and Martin, R .J. (1976) . Adsorption studiesusing gas-liquid chromatography- I . Effect of molecular structure,
t . Res ., 10, 731-736 .
2 . Aloes, M.I .H. (1966), Generation of reducing power in chemosyn-thesis, II .
Energy lin ed reduction of pyridine nucleotides inthe chemoautotroph, Nitrosomonas europaea, Bioehem . Biophys . Acts,113, 216-24 .
3 . Aleem, M.I .H. (1970), Oxidation of inorganic nitrogen compounds,
4 .
Ann . Rev . Plant Physio . 21, 67-90 .
Aleem, M.I .H. and Alexander, K . (1960), Nutrition and physiologyof Nitrobacter agilis, Applied Microbiol ., 8, 80 .
5 . Aleem, M.I .H . and Lees, H . (1963) . Autotrophic enzyme systems I .Electron transport systems concerned with hydroxylamine oxidationssystems in Nitrosomonas, Can . J_. Biochem. Phvsiol ., 41(3), 763-78 .
6 . Aleem, M.I .H ., Hoch, G.E., Varneo, J.E., (1965),
Water as the
7 .
source of oxidant and reductant in bacterial chemosynthesis, Proc .Nat . Aced . Sci . U .S ., 54, 869-73 .
Anderson, J .H . (1964), The metabolism of hydroxylamine to nitrite
8 .
by Nitrosomonas, Biochem, . J_. 91, 8-17 .
Anderson, J .H . (1965), Studies on the oxidation of ammonia byNitrosomonas, iochem . J_. 95, 688-698 .
9 . Anthonisen, A .C ., Loehr, R .C., Pra asam, T.B .S . and E .G . Srinath(1976),
Inhibition of nitrification by ammonia and nitrous acid,1_. Wet . Pollut . Control Fad. 48, 835-852 .
10 . Arbuc le, W .B . and Griggs, A.A., (1982), Determination of biomassMLVSS in PACT sludges, J_. Water Poll . Control . l., 54, 12, pp .1553-1557 .
11 . Arden, E., and Loc ett, W.T. (1914), Experiments on the oxidationof sewage without the aid of filters, . Soc . Chem . Ind., Vol 33,pp. 534 .
12 . Bader, F.G . (1978), Analysis of double-substrate limited growth,Biotechnol . Bioenana ., 20, 183-202 .
13 . Bala rishnan, S . and W .W . Ee enfelder (1969), Nitrogen relation-
14 .
Batchelor, B. (1983), Simulation of single-sludge nitrogen remo-val, ournal of Environ . fin., 109(1), 1-17 .
15 .
Beccari, H., Marani, D . and Ramadori, R ., (1980),
A criticalAnalysis of nitrification alternatives,
at . Reg., 13, 185-192 .
16 . Bec man, V.J ., Avendt, R .J ., Mulligan, T.J. and G.J. Kehrberger(1972), Design and operation of combined carbon oxidation-nitrification activated sludge plant, 1 . Water Pollut . ControlFed., 44(10) ; 1916-1931 .
17 . Beg, S .A., Siddiqi, R.H . and S . Llias (1982), Inhibition of nit-rification by arsenic, chromium and fluoride . J_, Water Pollut .Control,Fed ., 54(5), 482-488 .
18 . Bernardin, F .E . (1973), Cyanide detoxification using adsorptionand catalytic oxidation on granular activated carbon, L. WaterPollut . Control Fed ., 45(2), 221-231 .
19 .
Battens, L . (1979), Powdered activated carbon in an activatedsludge unit, Effluent and Water Treatment Journal, 9, 129-135 .
20 .
Boon, B. and Laudelout, H . (1962), Kinetics of nitrite oxidationby Nitrobacter winograds yi, Biochem . L. . 85, 440-447 .
21 .
Brass, F . and Ilapwi (1981), Effect of copper on nitrificationin activated sludge, Wat . Rns ., 15, 1093-1098 .
22 . Bragstad, R .E . and Bradney, L . (1937), Pac ing house waste andsewage treatment at Sioux Falls, South Da ota, Saw. Wor s J_., 9,959 .
23 . Brenner, J .M. and Bundy, L.G . (1974), Inhibition of nitrificationin soils by volatile sulfur compounds, Soil Bio . Biochem ., 6,161-165 .
24 . Buswell, A.M and Hatfield, W.D. (1939), Anaerobic Fermentations,State of Illinois, Department of Registration and Education, Bul-letin No . 32 .
25 . Buswell, A .M ., Shiota, T., Lawrence, N . and Meter, I .V. (1954),Laboratory studies in the inetics of the growth of Nitrosomonaswith relation to the nitrification phase of the BOD test, ADDl .
Microbiol ., 2, 21-25 .
26 .
Carpenter, P .L., Microbiology, W.B. Saunder Co ., Philadelphia,PA ., 1971 ; pp . 257-276 .
27 . Charley, R.C., Hooper, D.G. and A.G . McLee (1980), Nitrificationinetics in activated sludge at various temperatures and dissolvedoxygen concentrations, at . Research 14, 1387-1396 .
251
mieronutrient for Nitrobacter, J_, act., 89, 123-128 .
252
28 . Clar , C . and Schmidt, B .L . (1967), Growth response of Nitrosomo-nas europaea to amino acids, J_ . Bact ., 93, 1302-1308 .
29 . Delwiche, C.C . and Finstein, U .S . (1965),
Carbon and energysources for the nitrifying autotroph Nitrobacter, 1 . et . 90,102-107 .
30. Derleth, C .P . (1927), U .S. Patent 1,617,014, February 8, 1927 .
31 . Disalvo, R .M . and Sherrard, J.H., (1980), The simulation of nit-rification at low nic el concentrations, Proceedings 12th Mid-Atlantic Ind . Waste Conf ., 175 .
32 . Dixon, M . and Webb, B.C., 1979, Enzymes, 3rd ed .
Brace Jovano-vich, Publisher, Academic Press, N .Y., N .Y ., Chapter 8 .
33 . Dixon, M., and Webb, K.E.D., (1964),Press, N .Y., N.Y., pp . 313-359 .
Enzymes, 2nd ad ., Academic
34 . Dobbs, Richard A . and Cohen, Jesse M . (1980), Carbon adsorptionisotherms for toxic organics, US EPA report EPA-600/8-80-023 .
3S . Downing, A.L. and Boon, A.B . (1963), Oxygen transfer in activatedsludge process, Air and Water Pollution, 5, 131-148 .
36. Downing, A.L., Painter, H .A. and Knowles, G . (1964),
Nitrifica-tion in the activated sludge process, J_. Inst . Saw. Purif ., 2,130-158 .
37 . EPA (1975) Process Design Manual for Nitrogen Control, U.S.Environmental Protection Agency, Cincinnati, Ohio .
38 . E1-Dib, Mohamed A . and Badawy, Mohamed I . (1980), Adsorption ofsoluble aromatic hydrocarbons on granular activated carbon, WaterResearch, Vol 13, pp 255-258 .
39 . Engel, M .S . and Alexander M . (1958), Growth and autotrophic meta-bolism of Nitrosononas enropaea, J_. Bact . 76, 217-222 .
40 . Engel, M.S. and Alexander, M. (1959), Enzymatic activity ofNitrosomonas Extracts . T. Bacteriol . 78, 796-799 .
41 . Eric son, R.N. and Hooper, A .B . (1972a), Preliminary characteri-zation of a variant CO-binding gene protein from Nitrosomonas,Biochem . Biophys . Acta 275, 231-244 .
42 . Eric son, R .H ., Hooper, A.B. and Terry, S.R. (1972b), Solubiliza-tion 3 purification of cytochrome al from Nitrosomonas, Biochem .Biophys •. Acta 283, 155-166 .
43 . Finstein, M.S. and Delwiche, C.C. (1965),
Molybdenum as a
44 . Fliermans, C .B ., Bohlool, B.B. and Schmidt, E .L ., (1974) ,Autoecological study of the ehemoaatotroph Nitrobacter by by immu-nofluorescence, ADHl . Microbiol . 27, 124-129 .
45 . Focht, D .D . and Chang, A .C., (1975), Nitrification and denitrifi-cation processes related to wastewater treatment, Advances inAppl . Microbiol ., 19, 153-185 .
46 . Fochtman, Edward G ., and Dobbs, Richard, A . (1981), Adsorption ofcarcinogenic compounds by activated carbon, in Activated CarbonAdsorption of Organics from the Aqueous Phase, Vol 1, Ed . by I . H.Suffet, and M . J . McGuire, Ann Arbor Science, Ann Arbor, MI .
47 .
Forster, J .R .M . (1974), Studies on nitrification in marine bio-logical filters, Aauaculture, 4, 387-397 .
48 .
Goldberg, S .S . and Gainey, P.L., Role of surface phenomena innitrification, Soil Sci., 80, 73 (1955) .
49 .
Goring, C .A .I . (1962),
Control of nitrification by 2-chloro-6(trichloromethyl) pyridine, Soil Science,, 93, 211-218 .
50 . Gould, G.W ., and Lees, H. (1960), The isolation and culture ofthe nitrifying organisms . Part I : Nitrobacter, Cen . :..Microbiol,.6, 299-307 .
51 . Grieves, C.G., Crane, L.W., Venardos, D .G ., and Ying, W.C. (1980),Powdered versus granular carbon for oil refinery wastewater treat-ment, J. Water Pollut . Cont . Fed ., Vol 52, pp . 441-644 .
52 . Grieves, C.G., Stenstrom, M.S., Wal , S .D., and Grutch, S .F .(1977), Effluent quality improvement by powdered activated carbonin refinery activated sludge processes, a manuscript presented atthe API Refining Department, 42nd Midyear meeting, Chicago, Ill .,May 11, 1977 .
53 .
Gundersen, S. (1955), Effects of B vitamins and amino acids innitrification, Phvsiol . Plant, 8, 136-141 .
54 . Gundersen, K . (1958), Influence of corn-steep liquor on the oxida-tion of ammonia to nitrite by Nitrosomonas europaea, J_ . Gen .Microbiol ., 19, 190-197 .
55 . Gundersen, K. (1966), The growth and respiration of Nitrocystisoceanus at differential partial pressures of oxygen, J_. en .Microbiol ., 42, 367-396 .
56 .
Haldane, J .B.S ., Enzymes, Longmans, London, 1930 .
57 .
Hall, E .R . and Murphy, K .L . (1980),
Estimation of nitrifyingbiomass and inetics in wastewater, at . Research, 14, 279-304 .
25 3
of Nitrosomonas production of nitric oxide from hydroxylamine, iochem . Biovhvs . Acts, 571, 12-20.
73 . Hooper, A.B., Maxwell, P.C. and Terry, I.R . (1978), Hydroxylamineoxidoreductase from Nitrosomonas : Absorption spectra and contentof home and metal, iochem. 17, 2984-2989 .
74 . Hooper . A.B., and Terry I.R. (1977), Hydroxylamine oxido-reductase from Nitrosomonas : Inactivation by hydrogen peroxide,Biochemistry, 16, 455-459.
75 .
Huang, C.S. and Hopson, N.E. (1974), Nitrification rate in bio-logical processes, T, nviron. Enana . Div . 100, 409-422 .
76 . Hughes, M.N. and Nic lin, H.G . (1970), The chemistry of peroxoni-trites . Part II. Copper (II) - Catalyzed reaction betweenhydroxylamine and peroxonitrite in al ali, _. Chem. oc . (A) 925-929.
77 .
Hugo, N .B., ed., Inhibition and Destruction of the Microbial Cell,Academic Press Inc ., N .Y ., N.Y ., 1971; 819 pages .
78 .
Hutton, D .G . and Robertaccio, F.L. (1975), U .S . Patent 3,904,518,September 9, 1975 .
79 .
Jen ins, D . (1977), The analysis of nitrogen forms in water andwastewater, Proa . Hat . Tech., 8(415), pp . 31-53 .
80 .
Jen ins, S.H. (1969), Nitrification, Water Pollut . Control, 68,610-618 .
81 . Jensen, H.L. and Sorenson, H. (1952), The influence of someorganic sulphur compounds and enzyme inhibitors on Nitrosomonaseuropaea, Acta Agriculture Scandinavica, 2(3), 295-304 .
82 . Joel, A.R. and Grady, C.P., (1977), Inhibition of nitrification -effects of aniline after biodegradation, T. of Water Poll . Con-trol Fad ., 49, 778-788.
83 . Johnson, H.I. and Schroepfer, G.J . (1964) Nitrogen removal bynitrification and denitrification, lour . Water Pollut . ControlFed ., 36, 1015-1036 .
84 . Keenan, J.D., Stainer, R .L . and A.A. Fungaroli (1979) Substrateinhibition of nitrification, J . Environ. Sci Health, A14(5), 377-397 .
85 . Iholdebarin, B . and J .J . Oertli (1977) Effect of suspended parti-cles and their sizes on nitrification in surface water, J . Hat .Pollut . Control Fed ., 4 9, 1688-1692 .
86 .
Iholdebarin, B . and Oertli, J.J ., (1977) Effect of pH and ammonia
255
on the rate of nitrification on surface water, J. Water PollutionControl Feb ., 49, 1694-1697 .
87 .
Kiesow, L.A . (1972) A biologic assimilation of inorganic energy,Aldecchimica Acta, 5, 33-37 .
88 .
Kiff, K .J. (1972) The ecology of nitrification identificationactivated sludge, J . Mat . Pollut . Control Fed ., 71,systems in
475-484 .
89 . Knowles, 0., Downing, A.L. and Barett, M .J. (1965) Determinationof inetic constants for nitrifying bacteria in mixed culture,with the aid of an electronic computer, J . Gen. Microbiol . 38,263-278 .
90 .
Krulwich, T.A. and Fun , H.B . (1965) Stimulation of Nitrobacteragilis by biotin, J . Bact ., 90, 729-733 .
91 .
Laidler, K.J . and Bunting, P .S ., The Chemical Kinetics of EnzymeAction, 2nd ed ., Clarendon Press, Oxford, 1973, 471 pages .
92 .
Laudelout, H. and Van Tichelen, L. (1960) Kinetics of the nitriteoxidation by Nitrobacter winograds yi, J. Bact . 79, 39-42 .
93 . Laudelout, H ., Lambert B ., and Pham M.L.(1976) The effect of pHand partial pressure of oxygen on nitrification, Ann . Microbiol .127A, 347-396 .
94 . Lees, H . (1952) The biochemistry of the nitrifying organisms . I .The ammonia oxidizing systems of Nitrosomonas, Biochem . J. 52,134-139 .
95 . Lees, H . (1954) Biochemistry of the nitrifying bacteria . In"Autotrophic Microorganisms (B .A. Fry and J .L . Peel, eds .) pp.84-98 . Cambridge Univ . Press, N.Y.
96 .
Lees, H . (1955) Biochemistry of Autotrophic Bacteria, ButterworthsScientific Publications, London .
97 . Lees, H. and Quastel, J .H. (1946) Biochemistry of nitrification insoil . 3 . Nitrification of various organic nitrogen compounds,Biochem . J., 40, 824 .
98 . Laos, H. and Simpson, J .B . (1957) The biochemistry of the nitri-fying organisms . S . Nitrite oxidation by Nitrobacter, Biochem .1 ., 65, 297-305 .
99 . Leipzig, N .A. (1980) Effectiveness of the powdered activatedcarbon/activated sludge system in removing ammonia from an organicchemical production wastewater, in Proceedings of the 35th AnnualIndustrial Wastewater Conference, Purdue University (Ann Arbor,MI : Ann Arbor Scientific Publishers, Inc .), 889-897 .
256
100 . Lineweaver, H . and Bur , D . (1934) Determination of enzyme disso-ciation constants, J . Amer . Chem . Soc . 56, 658.
101 . Loveless, I .E. and Painter, H .A. (1968) The influence of metalion concentration and pH value on the growth of a Nitrosomonasstrain isolated from activated sludge, J . Gen . Microbial. 52,
1-14 .
102 . Martin, R.J. and Iwugo, K.O . (1982) The effects of pH andsuspended solids in the removal of organics from waters and waste-waters by the activated carbon adsorption process, Wat . Res ., 16,
73-82 .
103 . Matthews, John E . (1981) Evaluation of the effectiveness of granu-lar activate carbon adsorption and aquaculture for removing toxiccompounds from treated petroleum refinery effluents, EPA reportnumber EPA-600/S2-81-067, Robert S . Kerr Laboratory, Ads, OK .
104 . MoLaren, A.D. (1971) Kinetics of nitrification in soils - growthof nitrifiers, Soil Sci . Soc . Amer ., Proc . 35, 91-95 .
105 . Metcalf and Eddy (1973) Wastewater Engineering : Collection, Treat-ment, and Disposal, McGraw-Hill, New Yor , NY .
106 . Milham, P.J., Awad, A.S., Paull, R.E . and Bull, J .H . (1970)Analysis of plants, soils and waters for nitrate by using an ion-selective electrode, Analyst, 95, 751-757 .
107 . Miller, D.J. and P.M. Wood (1982) Characterization of the C-typecytochromes of Nitrosomonas europaea with the aid of fluorescentgels, Biochem . 1. 207, 511-517 .
108 . Miller, D.T. and P.M. Wood, (1983) CO-bonding C-type cytochromesand a high-potential cytochrome c in Nitrosomonas europaea,Biochem. 1. 211, 503-506 .
109 . Monod, 1. (1949) The growth of bacterial cultures, Ann . Rev .Microbiol ., 3, 371-394 .
110 . Murphy, M.R., Sutton P.M. and Jan , B .E . (1977) Dynamic nature ofnitrifying biological suspended growth systems, Prog . Water Tech-nol . 9, 279-290 .
111 . Nagel, C.A. and Haworth, J .G . (1969) Operational factors affect-ing nitrification process in activated sludge process, Paperpresented at the 42nd Annual WPCF . Dallas, Texas, Oct .
112 . Neufeld, R.D., Hill, A.J . and D .O . AdeKoya (1980) Phenol and FreeAmmonia Inhibition to Nitrosomonas Activity, Water Res ., 14,1695-1703 .
113 . Nicholas, D.J .D. and
Jones,
O.T.G .
(1960)
Oxidation
of
257
25 8
hydroxylamine in cell-free extracts of Nitrosomonas europaea,Nature (Load .), 185, 512-514 .
114 . Nicholas, D.J .D., Wilson, P .W ., Heiner, W., Palmer, G., andBeinharttroscopy
H. (1962), Use of electron paramagnetic resonance spec-in investigations of functional metal components in
microorganisms, Nature (London) 196, 433-36.
115 . Orion Research, Inc ., Methods Manual 93 series electrodes, 1976 .
116 . Painter, H .A. (1970) A review of literature on inorganic nitrogen
117 .
metabolism in micro organisms, Water Res . 4, 393-450 .
Painter, H .A. (1977) Microbial transformation of inorganic nitro-
118 .
gen, Prog . Wat . Tech ., 8 (4/5), 3-29) .
of the wide-bore drop-Painter, H .A. and Jones, K. (1963) The usepingupta e
mercuryand of
electrode for the determinationoxidation of ammonia by microorganisms,
of rates of oxygenJ. Appl .
Bact ., 26, 471-483 .
119 . Painter, H .A. and Loveless, J.E., (1983)
Effect of temperatureand pH valuesin the activated
on the growth rate constants of nitrifying bacteriasludge process, Water Res . 17(3), 237-248 .
120 . Pan, P .C . (1971) Basis of obligate autotrophy . Ph .D . Thesis,
121 .
Rutgers University, New Brunswic , New Jersey .
Pan, P .C . and Umbreit, W.W. (1972) Growth of obligate autotrophicbacteria on glucose in continuous flow through apparatus, J .Bact . 109, 1149-1155 .
122 . Peeters, T.L ., Van Gool, A.D. and Laudelout, H . (1969)
Kinetics
123 .
study of oxygen limited respiration in nitrifying bacteria . Bact .Proc ., 141 .
Pelzar, N.J ., Raid, R.D. and Chan, E .C .S . (1977)
Microbiology,
124 .
Fourth Edition, McGraw-Hill Co., pp . 180-181 .
Perrich, Jerry R. (1981) Activated carbon adsorption for wastewa-
125 .
ter treatment, CRC Press, Boca Raton, Florida .
Podus a, R . and Andrews, J .F. (1975) Dynamics of nitrification inthe activated sludge process, J . Wat . Pollut . Control Fed . 47,2599-2619 .
126 . Podus a, R.A. (1973) "A Dynamic Model of Nitrification in the
127 .
Activated Sludge Process ." Ph .D . Thesis, Clemson University,Clemson, South Carolina .
Dynamics of nitrificationPodus a, R.A. and J .F . Andrews, (1974)in the
activated sludge process, Proceedings of the 29th

259
Industrial Waste Conference, Purdue University Engineeringsion Series No . 145, 1005-1025 .
Exten-
128 . Pra asam, T.B .S . and Loehr, R.C. (1972)
Microbial nitrificationand denitrification in concentrated wastes, water Res . 6, 859-
869 .
129 . Pra asam, T.B .S ., Joo, Y .D., Srinath, E .G . and R .C . Loehr (1974)Nitrogen removal from a concentrated waste by nitrification anddenitrification . Proc . 29th Inst . Waste Conf ., Purdue Univ .
pp.497-509 .
130 . Quastel, J .H . and Scholefield, P.G. (1949) Influence of organicnitrogen compounds on nitrification in soils, Nature, 164, pp .1068-1072 .
131 . Ross, M . and Nason, A. (1966) Incorporation of atmospheric oxygen
132 .
into nitrite formed during ammonia oxidation by Nitrosomonas euro-paea, Biochem . biophys . Acta 113, 398-401 .
Riggin, R .M ., Cole, T.F. and Billets, S . (1983) Determination of
133 .
aniline and substituted derivatives in wastewaters by gas andliquid chromatography, Anal . Chem ., 55, 1862-1869 .
Rimer, A .B . and Woodward, R .L. (1972) Two stage activated sludge
134 .
pilot-plant operation of Fitchburg, Massachusetts, J . Wat . Pollut .Control Fed . 44, 101-106 .
Ritchie, G.A.F. and Nicholas, D.J .D . (1974) A partial characteri-
135 .
zation of purified nitrite reductase and hydroxylamine oxidasefrom Nitrosomonas europaea, Biochem . J . 138, 471-480 .
Rizzo, J.A. (1976) Activated carbon clears effluent, Oil and Gas
136 .
Journal, pp 52-56, may issue .
Rizzo, J.A. (1976) Case history : use of powdered activated carbonin an activated sludge system, a manuscript presented at the FirstOpen Forum on Petroleum Refinery Wastewaters, Tulsa, OS, January,1976 .
137 . Robertaccio, F.L., Hutton, D .G ., Grulich, G. and Glotzer, H.L .
138 .
(1972) Treatment of organic chemicals plant wastewater with theDuPont PACT process, a manuscript presented at the AIChE NationalMeeting, Dallas, TX, Feb 20-23, 1972 .
Scheiner, D . (1976) Determination of ammonia and eldahl nitrogen
139 .
by indophenol method, Wat . Res ., 10, 31-36 .
Schoberl, P . and Engel, H . (1964) Dar veirhalten der nitrification
140 .
ateries gegenuber gelostem, Archiv . Fin . Mi robiolgie, 393-400.
Schultz, J.R. (1982) PACT process mechanisms, Ph .D. Dissertation,
Environmental Systems Engineering, Clemson University, Clemson,SC .
141 . Seppanen, H ., Investigations on the nitrification capacity of asouthern Finnish la e and three rivers, Ann. Bat . Finn ., 7, 58(1970) .
142 . Shah, D .B . and Colman, G .A. (1978), Kinetics of nitrification anddenitrification reactions, Biotechnol . Bioengng ., 20, 43-72 .
143 . Sharma, B. and Ahlert, R .C . (1977),
Nitrification and nitrogenremoval, Water Res . 11, 897-925 .
144 . Singer, P . C . and Yen, Chen-Yu. (1981), Adsorption of al ylphenols by activated carbon," in Activated Carbon Adsorption ofOrganics from the Aqueous Phase, Vol 1, Ed . by I. H. Suffet, andM. J . McGuire, Ann Arbor Science, Ann Arbor, MI .
145 . S inner, F .A . and Wal er, N. (1961) Growth of Nitrosomonas euro-paea in water and continuous culture, Archs . Mi robiol . 38, 339-349 .
146 . Specchia, V. and Gianetto, A. (1984) Powdered activated carbon inan activated sludge treatment plant, Water Res ., 18(2), 133-137 .
147 . Srinath, E .G ., Pra asam, T.B.S. and Loehr, R.C. (1976) Nitrifyingorganism concentration and activity, 1 . Environ . Engng. Div .ASCE 102, 449-463 .
148 . Stafford, D .A. (1974) The effect of phenols and heterocyclicbases in nitrification in activated sludges, J . Appl . Bact ., 37,75-82 .
149 . Stall, T .R . and Sherrard, J.H. (1974), One-sludge or two sludge,Wat . Waste Engrg . 11, (4), 41-44 .
150 . Standard Methods for the Examination of Water and Wastewater, 14thed ., Am . Public Health Assoc . (1975) .
151 . Staniar, R.Y., Adelberg, E.A. and Ingrahorn, J. (1976), TheMicrobial World, Fourth Edition, Prentice-Hall, Inc ., EnglewoodCliffs, N.J., pp. 190-194 .
152 . Stan ewich, M.J. (1972), Biological nitrification with the highpurity Oxygenation Process, Proc . Purdue Industrial Waste Conf .27, 1-23 .
153 . Statham, N. (1936), U .S. Patent 2,059,286, November 3, 1936 .
154 . Stenstrom, M.K. and Grieves, C .G . (1977), Enhancement of OilRefinery Activated sludge by addition of powdered activated car-bon, Proceedings of the 32nd Purdue Industrial Waste Conference,
260

May 10-12, 1977, Ann Arbor Science, Ann Arbor, MI .
155 . Stenstrom, M.K. and R .A. Podus a (1980), The effect of dissolvedoxygen concentration nitrification, Water Res ., 14(6), pp . 643-650 .
156 . Stratton, F .E . and McCarty, P .L . (1967), Prediction of nitrifica-tion effects on the dissolved oxygen balance of streams, Environ .
Sci . Technol . 1, 405-410 .
157 . Stotz y, G., Surface interactions between clay minerals andmicrobes, viruses and soluble organics, and the probable impor-tance of these interactions to the ecology of microbes in soil, inMicrobial Adhesion to Surfaces, Chapter 13, Eds ., R.C.W. Ber eley,Ellis Harwood Publ ., London, pp . 231-247 .
158 . Stotz y, 0. (1966a), Influence of clay minerals on microorganismsII . Effect of various clay species, homoionic clays, and otherparticles on bacteria, Canadian Journal of Microbiology, 12, pp .831-848 .
159 . Stotz y, G. (1966b), Influence of clay minerals on microorganismsIII . Effect of particle size, cation exchange capacity, and sur-face area on bacteria, Canadian Journal of Microbiology, 12, pp.1235-1246 .
160 . Strom, P .F ., Matulewich, V.A., and Finstein, U.S . (1976) Concen-trations of nitrifying bacteria in sewages, effluents, and areceiving stream and resistance of these organisms to chlorina-tion, Appl . Env . Microbiol ., 31, 731-737 .
161 . Sundermeyer, H . and E . Boo , Characterization of the nitrite-oxidizing system in Nitrobacter, in Biology of Inorganic Nitrogenand Sulfur, H. Bothe and A. Trebst, eds . Springer-Verlay, BerlinHeidelberg, N .Y ., pp . 316-324, 1981 .
162 . Sutton, P .M ., Bridle, T.R., Reford, W.K. and J . Arnold (1981) Nit-rification and denitrification of an industrial wastewater, J .Water Pollut . Control Fed. 53(2) ; 176-184 .
163 . Suzu i, I ., Dular, U. and Kwo , S .C . (1974) Ammonia or ammoniumions as substrate for oxidation by Nitrosomonas europaea cells andextracts, J. Bact . 120, 556-558 .
164 . Suzu i, I ., S-Ch . %wo , D.C.T. Tseng, J .S . Oh and R.S. Bhella,Oxidation of ammonia by Nitrosomonas and of inorganic sulfur byThiobacilli, in Biology of Inorganic Nitrogen and Sulfur, H .Bothe and A. Trebst, eds . Springer-Verlag, Berlin, Heidelberg,N .Y., pp . 212-225, 1981 .
165 . Sweeny, M.W., Melville, W.A., Trgovcich, B., and Grady, C.P.L.(1982) Adsorption isotherm parameter estimation, Journal of the
261
Environmental Engineering Division, ASCE, Vol 108, No EES, pp913-922 .
166 . Terry, [ .R. and Hooper, A .B . (1981) Hydrozylamine Oxidoreductase :a 20-home, 200,000 molecular weight cytochrome c with unusualdenaturation properties which forms a 63000 molecular weight mono-mer after home removal, Biochem . 20, 7026-7032 .
167 . Thibault, G.T., Tracy, K.D. and Wil inson, J .B. (1977) PACT per-formance evaluated, Hydrocarbon Processing, S6(2), 143-146 .
168 . Tomlinson, T.G., Boon, A.G . and Trotman, C.W.A. (1966) Inhibitionof nitrification in the activated sludge process of sewage dispo-sal, J . Appl . Bact . 29, 266-291 .
169 . Tronson, D.A., Ritchie, G.A.F . and Nicholas, D.J .D . (1973) Purif-ication of c-type cytochromes from Nitrosomonas ouropaea,Biochem . Biophys . Acts . 310, 331-343 .
170 . Van Droogenbroec , R. and Laudelout, H. (1967) Phosphate require-ments of the nitrifying bacteria, Antonio van Leeuwenhoe , 33,287-296 .
171 . Van Gool, A. and Laudelout, H. (1966)
Formate utilization inNitrobacter winograds yi, Biochem . biophys . Acts, 127, 295-301 .
172 . Verstraete, W. and Alexander, M. (1972) Heterotrophic nitrifica-tion by Arthrobacter sp ., J . Bact . 110, 955-961 .
173 . Verstraete, W. and Alexander, M . (1973) Heterotrophic nitrifica-tion in sources of natural ecosystems, Envir . Sci . Technol . 7,39-42 .
174 . Verstraete, W ., Vanstaen, H ., and Voets, J .P. (1977) Adoption tonitrification of activated sludge systems treating highly nitro-genous waters, J . Water Pollution Control Fed .,49, 1604-1608 .
175 . Wallace, L.E . and Nicholas, D .J .D (1969)
The biochemistry ofnitrifying micro-organisms, Bio . Rev . 44, 359-391 .
176 . Wang, L.K., Poon, C .P .C ., Wong, N.H. and Bergenthal, J ., Chemistryof nitrification-denitrification process, J . of Environ . Sci .,Vol . 20, No . 6, pp . 23-28 .
177 . Watson, S .W. (1974) Gram Negative Chemolithotrophic Bacteria Fam-ily I . Bergey's Manual of Determinative Bacteriology, 8th ed .(edited by Buchanan, R .E. and Gibbons, N .E .) Williams 4 Wil ins,Balt . M .D .
178 . Webb, J .L ., (1966), Enzyme and Metabolic Inhibitors, Vols . I-III,Academic Press, N .Y., N .Y. I (1963) ; II (1966) ; III (1966) .
262

179 . Weber W. J., Jones, B., and Corfis, N . (1980) Removal of toxicsubstances from wastewaters by integrated biological-activatedcarbon treatment, Progress Report, Pro ect CR806030020, Nun.
Envir . Res . Lab ., Cincinnati, OH .
180 . Weber W . J., Pirbazari, Herbert, 1 . and Thompson, R . (1977) Effec-tiveness of activated carbon for removal of volatile halogenatedhydrocarbons from drin ing water, Chapter in Viruses and TraceContaminants in Water and Wastewater, W . Redman, et . al . editor,Ann Arbor Science Publishers, Ann Arbor, MI .
181 . Weber, W .J (1972) Physicochemical processes for water quality con-trol, Wiley-Interscience, New Yor .
182 . Wild, H.E ., Sawyer, C.E. and McMahon . T.C . (1971) Factors affect-ing nitrification inetics, 1 . Wat . Pollut . Control Fed ., 43,
1845-1854 .
183 . Williamson, K. and McCarty, P .L. (1975) Rapid measurement ofMonod half-velocity coefficients for bacterial inetics, Biotech-
nol . Bioengng . 17, 915-924 .
.184 . Wood, L.B., Burley, B.J .E. and P .J . Matthews (1981) Some observa-tions on the biochemistry and inhibition of nitrification, pat .
Res ., 15, pp. 543-551 .
185 . Wuhrmann, K. (1963) Effect of oxygen tension on biochemical reac-tions in sewage purification plants, Proc . 3rd Manhattan Conf .Advances in Biological Waste Treatment, McMillan, New Yor .
186 . Wuhrmann, K. (1964) Nitrogen removal
in sewage
treatment
processes, XV th Verh. Internat . Verin . Limnol . Proc ., 580 .
187 . Wuhrmann, K. (1968) Ob ectives, technology, and results of nitro-gen and phosphorus removal processes . In Advances in Water QualityImprovement . Gloyna, E.F. and Ec enfelder, W.W. (ads .), Universityof Texas Press, Austin, TX.
188 . Yamana a, T. and S inra, M. (1974) Cytochrome c-552 and cytochromec-554 derived from Nitrosomonas europaea, J . Biochem 75, 1265-1273 .
263

APPENDICES
2 64

Appendix I : Results of Batch Inhibition Experiments10 ag/l Aniline Spi e (6-14-83)
nitrates in refinery wastewater mixed liquor samples .
Time 0C ONC RC RNC BEN 0CC GNCC RCC • RNCC BENC
NH3
0 .0 62 .0 60 .0 60 .0 63 .0 60 .0 62 .0 60.0 60 .0 63 .0 60 .02 .0 67 .5 72 .0 60 .0 61.0 68 .5 50 .0 44 .0 50 .0 51 .0 52 .04 .0 52 .0 63 .5 56 .0 57 .0 59 .0 27 .8 33 .0 33 .5 42 .0 46 .06 .0 35 .2 59 .0 37 .0 40 .0 42 .5 14 .0 20 .0 23 .2 29 .5 32 .09 .0 22 .0 47 .0 20 .0 28 .0 32 .0 2 .1 6 .4 12.5 20 .2 24 .2
N03
0 .0 50 .5 48 .1 120 .0 115 .0 112 .0 50 .5 48 .1 120 .0 115 .0 112 .02 .0 49 .9 43 .0 132 .0 112 .0 122 .0 56 .0 54 .0 117 .0 125 .0 114 .04 .0 60 .0 48 .5 137 .0 145 .0 141 .0 74 .0 64 .0 150 .0 150 .0 145 .06 .0 76 .5 57 .0 162.0 155 .0 151 .0 89 .0 77 .0 171 .0 158 .0 150 .09 .0 93 .0 64 .5 178.0 169 .0 161 .0 111 .0 95 .0 182 .0 179 .0 165 .0
The total volume (alt .) of NaOH required to maintain pH at7 .3 was asOC :0 .25
follows :ONC :0 .0 RC:5 .7 RNC :4 .6 BEN :4 .4
OCC :6 .6 ONCC :14 .3 RCC :10 .2 RNCC:7 .8 BENC:8 .15In this experiment, the extraction solution (i.e ., OrionMethods Manual, 1973) was used for the analysis of

Appendix I : Results of Batch Inhibition Experiments10 mg/l Toluene Spi e (6-10-83)
Note : the initial reactor effluent ammonia concentrationswere measured to be as follows prior to ammonia spi ing;GC - <0 .1 mg/l ONC - 0 .5 mg/1 RC, RNC, and BEN- (0 .1 Mg/1The total volume Ws .) of NaOH required to maintain pH at
Time GC ONC RC RNC BEN GCC GNCC RCC RNCC BFNC
NK3
0 .0 54 .2 58 .0 53 .0 48 .0 54 .5 54 .2 58 .0 53 .0 48 .0 54 .52 .0 47 .5 44 .5 38 .0 36 .0 38 .0 48 .5 44 .0 35 .5 40 .0 42 .04 .0 32 .1 36 .5 28 .5 29 .5 35 .0 33 .0 36 .0 26 .2 31 .0 32 .06 .0 22 .1 25 .6 24 .2 23 .0 21 .2 21 .2 25 .1 23 .5 22 .0 26 .09 .0 7 .4 9 .8 13 .0 19 .1 15 .5 7 .8 10 .2 14 .0 21 .5 25 .1
N03
0 .0 55 .0 51 .5 118 .0 117 .0 113 .0 55 .0 51 .5 118 .0 117 .0 113 .02 .0 57 .0 52 .2 120 .0 121 .0 118 .0 57 .9 53 .0 128.0 123 .0 118 .04 .0 73 .0 62 .5 131 .0 127 .0 127 .0 74 .5 62 .5 140 .0 132 .0 135 .06 .0 86 .0 73 .0 142 .0 144 .0 150 .0 87 .0 73 .0 145 .0 148.0 150 .09 .0 102 .0 91 .0 171 .0 170 .0 175 .0 105 .0 92 .0 185 .0 185 .0 177 .0
7 .3 wasGC :9 .1
as follows :ONC:16 .2 RC :11 .0 RNC :8 .65 BBri:9 .2
GCC:8 .8 GNCC:15 .6 RCC:10 .8 RNCC:9 .25 BENC :8 .5
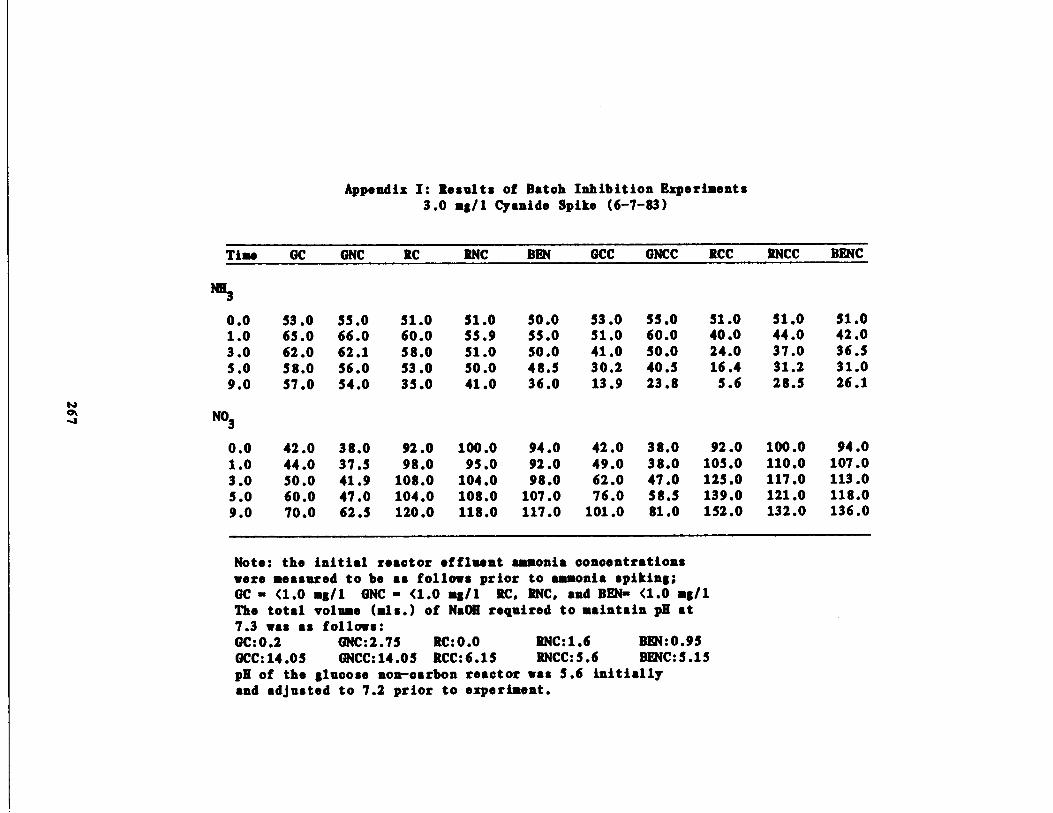
Appendix I : Results of Batch Inhibition Experiments3 .0 ag/i Cyanide Spi e (6-7-83)
Note : the initial reactor effluent ammonia concentrationswere measured to be as follows prior to ammonia spi ing;GC - <1 .0 ag/l ONC - <1 .0 Mg/l RC, RNC, and BEN- <1 .0 mg/l
pH of the glucose non-carbon reactor was 5 .6 initiallyand ad usted to 7 .2 prior to experiment .
Time GC ONC RC RNC BEN OCC GNCC RCC RNCC BENC
NB3
0 .0 53 .0 35 .0 51 .0 51 .0 50 .0 53 .0 35 .0 51 .0 51 .0 51 .01 .0 65 .0 66 .0 60 .0 55 .9 55 .0 51 .0 60.0 40 .0 44 .0 42 .03 .0 62 .0 62 .1 58 .0 51 .0 50 .0 41 .0 50 .0 24 .0 37 .0 36 .55 .0 58 .0 56 .0 53 .0 50 .0 48 .5 30 .2 40 .5 16 .4 31 .2 31 .09 .0 57 .0 54 .0 35 .0 41 .0 36 .0 13 .9 23 .8 5 .6 28 .5 26 .1
N03
0 .0 42 .0 38 .0 92 .0 100 .0 94 .0 42 .0 38 .0 92 .0 100 .0 94 .01 .0 44 .0 37 .5 98 .0 95 .0 92 .0 49 .0 38.0 105 .0 110 .0 107 .03 .0 50 .0 41 .9 108 .0 104 .0 98 .0 62 .0 47 .0 125 .0 117 .0 113 .05 .0 60 .0 47 .0 104 .0 108 .0 107 .0 76 .0 58 .5 139 .0 121 .0 118.09 .0 70 .0 62 .5 120 .0 118 .0 117 .0 101 .0 81 .0 152 .0 132 .0 136 .0
The total volume (ale .) of NOR required to maintain pH at7 .3 was asOC :0 .2
follows :ONC :2 .75 RC :0 .0 RNC :1 .6 BEN:0.95
OCC :14 .05 ONCC:14 .05 RCC :6 .15 RNCC:5 .6 BENC :5 .15
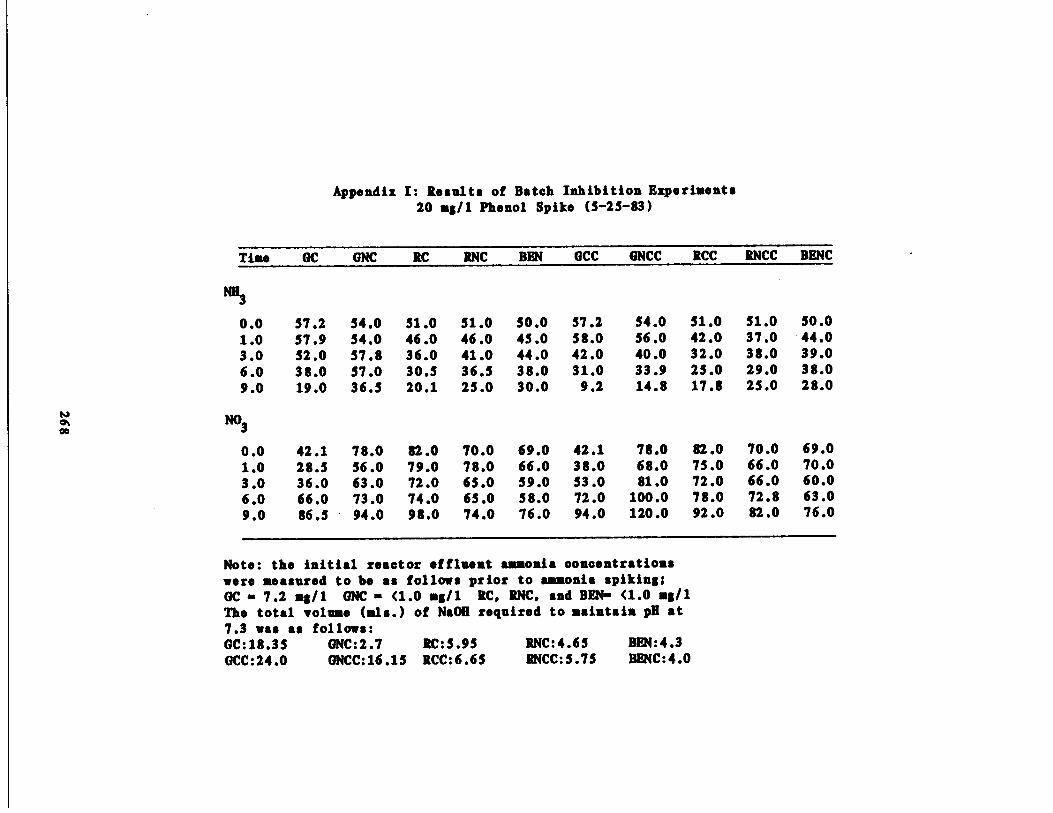
Appendix I : Results of Batch Inhibition Experiments20 al/1 Phenol Spi e (5-25-83)
Note : the initial reactor effluent aaaonia concentrationswere measured to be as follows prior to ammonia spi ing ;GC - 7 .2 mg/1 ONC - <1 .0 ag/l RC . RNC, and BEN- <1 .0 ag/lThe total volume (als.) of NaOH required to maintain pH at
Time GC ONC RC RNC BEN OCC ONCC RCC RNCC BENC
NH3
0 .0 57 .2 54 .0 51 .0 51 .0 50 .0 57 .2 54 .0 51 .0 51 .0 50 .01 .0 57 .9 54 .0 46 .0 46 .0 45 .0 58 .0 56 .0 42 .0 37 .0 '44 .03 .0 52 .0 57 .8 36 .0 41 .0 44 .0 42 .0 40 .0 32 .0 38.0 39 .06 .0 38 .0 57 .0 30 .5 36 .5 38 .0 31 .0 33 .9 25 .0 29 .0 38 .09 .0 19 .0 36 .3 20 .1 25 .0 30 .0 9 .2 14 .8 17 .8 25 .0 28 .0
N03
0 .0 42 .1 78 .0 82 .0 70 .0 69 .0 42 .1 78 .0 82 .0 70 .0 69 .01 .0 28 .5 56 .0 79 .0 78.0 66 .0 38 .0 68 .0 75 .0 66 .0 70 .03 .0 36 .0 63 .0 72 .0 65 .0 59 .0 53 .0 81 .0 72 .0 66 .0 60 .06 .0 66 .0 73 .0 74 .0 65 .0 58.0 72 .0 100 .0 78 .0 72 .8 63 .09 .0 86 .5 94 .0 98 .0 74 .0 76 .0 94 .0 120 .0 92 .0 82 .0 76 .0
7 .3 was asOC :18 .35
follows :ONC:2 .7 RC :5 .95 RNC:4 .65 BEN:4 .3
GCC :24 .0 ONCC:16 .15 RCC:6 .65 RNCC:5 .75 BENC :4 .0
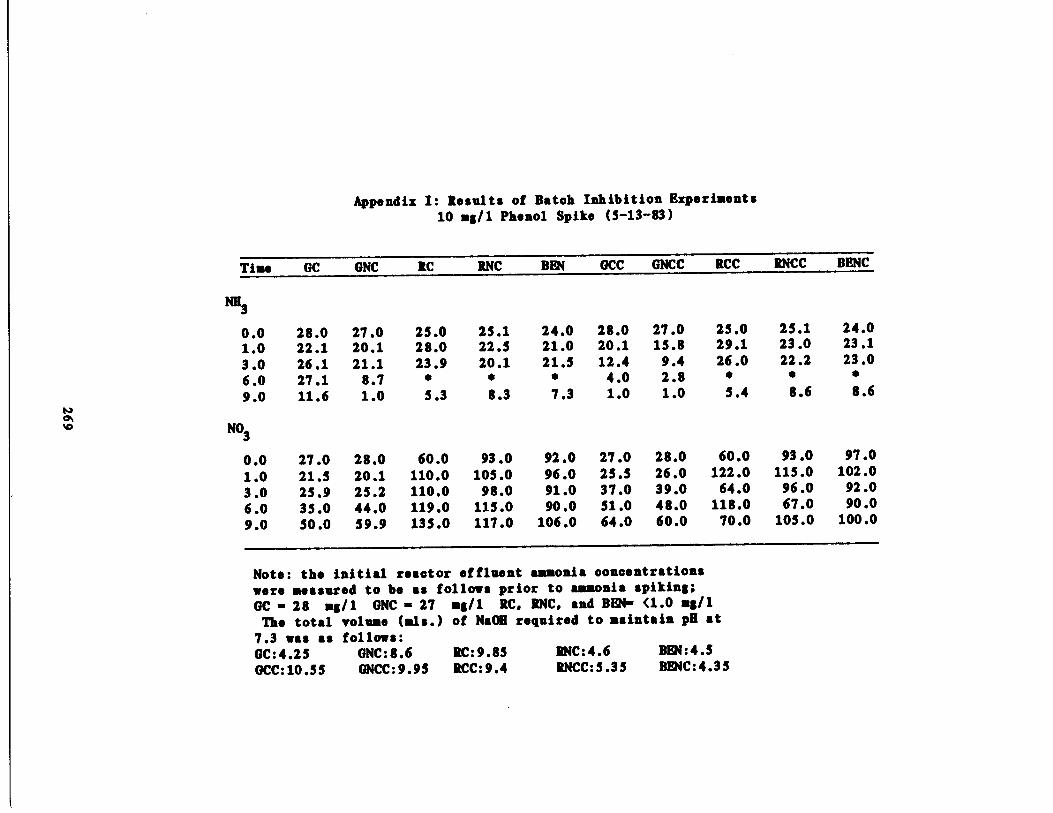
Appendix I : Results of Batch Inhibition Experiments10 mg/1 Phenol Spi e (5-13-83)
Note : the initial reactor effluent ammonia concentrationswere measured to be as follows prior to ammonia spi ing ;OC - 28 mg/l ONC - 27 ag/l RC, RNC, and BEN- <1 .0 ag/l
The total volume (als .) of NaOH required to maintain pH at
Time GC ONC RC RNC BEN 0CC GNCC RCC RNCC BENC
NH3
0 .0 28 .0 27 .0 25 .0 25 .1 24 .0 28 .0 27 .0 25 .0 25 .1 24 .0
1 .0 22 .1 20 .1 28 .0 22 .5 21 .0 20 .1 15 .8 29 .1 23 .0 23 .1
3 .0 26 .1 21 .1 23 .9 20 .1 21 .5 12 .4 9 .4 26 .0 22 .2 23 .0
6 .0 27 .1 8 .7 0 0 • 4 .0 2 .8
9 .0 11 .6 1 .0 5 .3 8 .3 7 .3 1 .0 1 .0 5 .4 8 .6 8 .6
NO3
0 .0 27 .0 28 .0 60 .0 93 .0 92 .0 27 .0 28 .0 60 .0 93 .0 97 .0
1 .0 21 .5 20 .1 110 .0 105 .0 96 .0 25 .5 26 .0 122 .0 115 .0 102 .0
3 .0 25 .9 25 .2 110 .0 98 .0 91 .0 37 .0 39 .0 64 .0 96 .0 92 .0
6 .0 35 .0 44 .0 119 .0 115 .0 90 .0 51 .0 48 .0 118 .0 67 .0 90 .0
9 .0 50 .0 59 .9 135 .0 117 .0 106 .0 64 .0 60 .0 70 .0 105 .0 100 .0
7 .3 was asOC :4.25
follows :ONC :8 .6 RC :9 .85 RNC :4 .6 BEN :4 .5
OCC :10.55 ONCC:9 .95 RCC :9 .4 RNCC:5 .35 BENC:4 .35
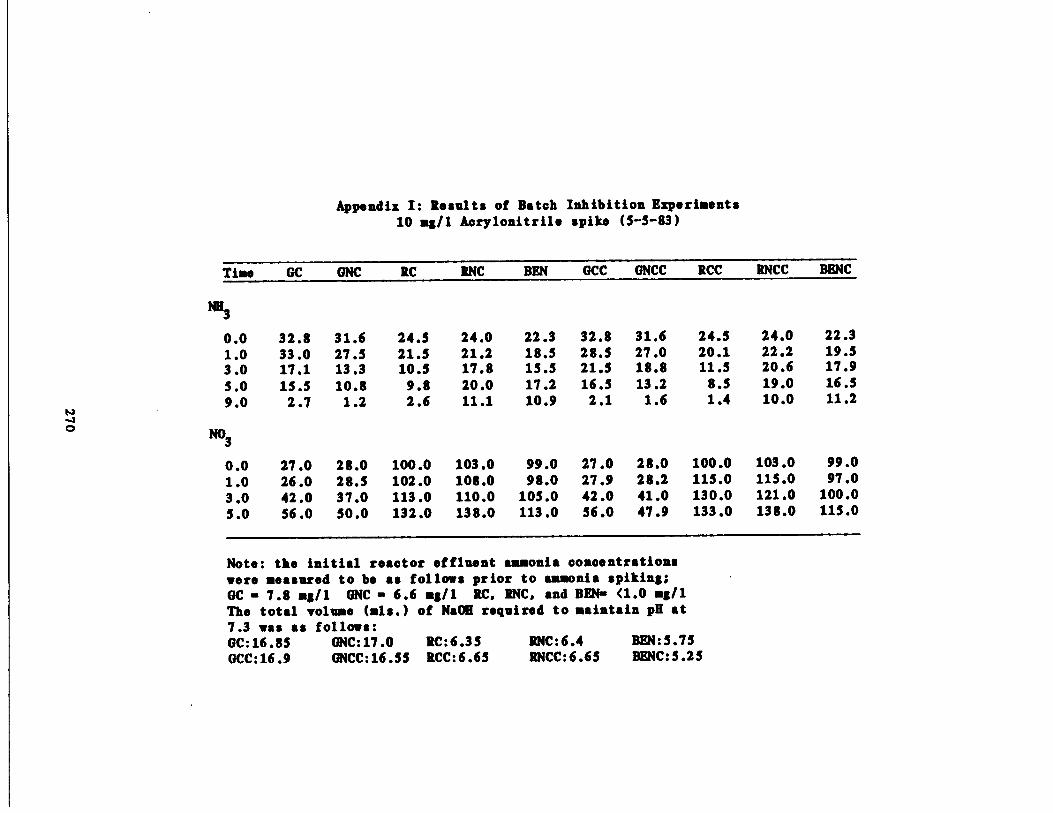
Appendix I : Results of Batch Inhibition Experiments10 mg/l Acrylonitrile spi e (5-5-83)
Note : the initial reactor effluent ammonia concentrationswere measured to be as follows prior to ammonia spi ing ;GC - 7 .8 ag/l GNC - 6 .6 a=/l RC. INC. and BEN- <1 .0 ag/lThe total volume (als .) of NaOH required to maintain pH at7 .3 was as follows :GC :16 .85
GNC:17 .0
RC:6 .35
RNC:6 .4
BEN:5 .75GCC :16 .9
GNCC:16 .55 RCC :6 .65
RNCC :6 .65
BENC :5 .25
Time GC GNC RC RNC BEN GCC GNCC RCC RNCC BENC
NH3
0 .0 32 .8 31 .6 24 .5 24 .0 22 .3 32 .8 31 .6 24 .5 24 .0 22 .31 .0 33 .0 27 .5 21 .5 21 .2 18 .5 28 .5 27 .0 20 .1 22 .2 19 .53 .0 17 .1 13 .3 10 .5 17 .8 15 .5 21 .5 18 .8 11 .5 20 .6 17 .9
5 .0 15 .5 10 .8 9 .8 20 .0 17 .2 16 .5 13 .2 8 .5 19 .0 16 .59 .0 2 .7 1 .2 2 .6 11 .1 10 .9 2 .1 1 .6 1 .4 10 .0 11 .2
N03
0 .0 27 .0 28 .0 100 .0 103 .0 99 .0 27 .0 28.0 100 .0 103 .0 99 .0
1 .0 26 .0 28.5 102 .0 108 .0 98.0 27 .9 28.2 115 .0 115 .0 97 .0
3 .0 42 .0 37 .0 113 .0 110 .0 105 .0 42 .0 41 .0 130 .0 121 .0 100 .0
5 .0 56 .0 50 .0 132 .0 138 .0 113 .0 56 .0 47 .9 133 .0 138 .0 115 .0
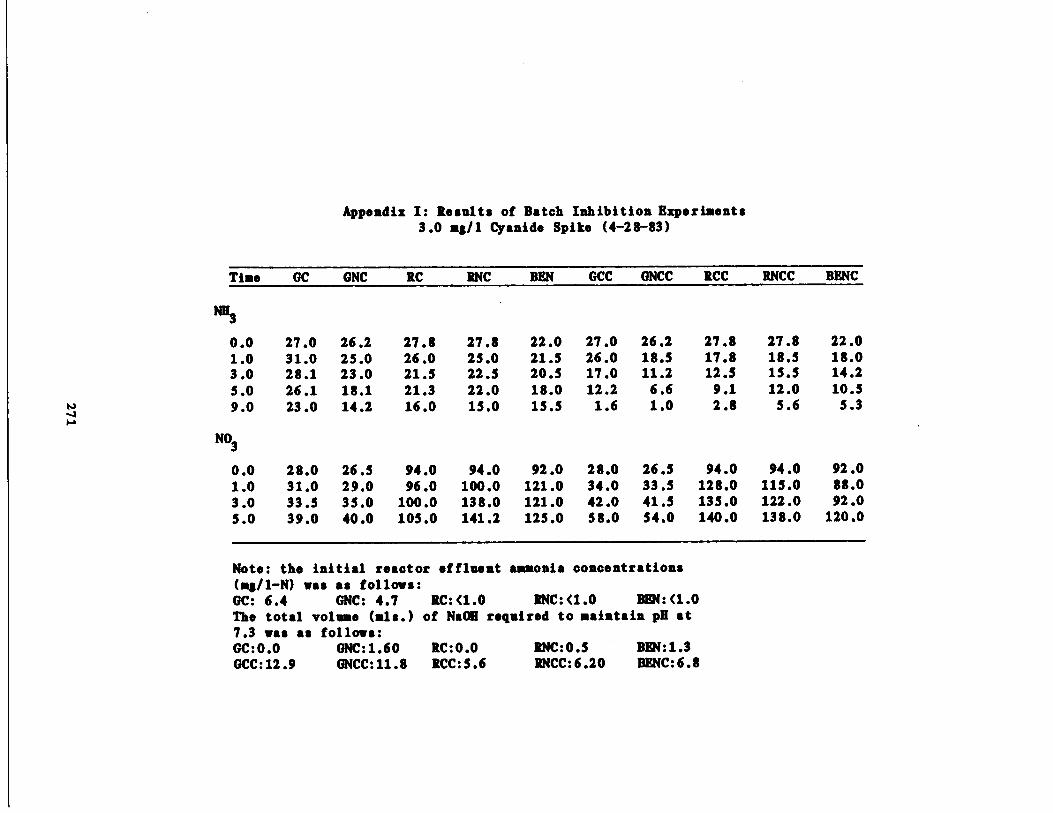
Appendix I : Results of Batch Inhibition Experiments3 .0 ng/l Cyanide Spi e (4-28-83)
Note : the initial reactor effluent ammonia concentrations(a /1-N) was as follows :GC : 6 .4
GNC: 4 .7
RC:<1 .0
RNC:<1 .0
BEN:<1 .0The total volume (ale .) of NOR required to maintain pH at
Time GC ONC RC RNC BEN GCC ONCC RCC RNCC BENC
0 .0 27 .0 26 .2 27 .8 27 .8 22 .0 27 .0 26 .2 27 .8 27 .8 22 .01 .0 31 .0 25 .0 26 .0 25 .0 21 .5 26 .0 18 .5 17 .8 18 .5 18 .03 .0 28 .1 23 .0 21 .5 22 .5 20 .5 17 .0 11 .2 12 .5 15 .5 14 .25 .0 26 .1 18 .1 21 .3 22 .0 18 .0 12 .2 6 .6 9 .1 12 .0 10 .59 .0 23 .0 14 .2 16 .0 15 .0 15 .5 1 .6 1 .0 2 .8 5 .6 5 .3
N03
0 .0 28 .0 26 .5 94 .0 94 .0 92 .0 28 .0 26 .5 94 .0 94 .0 92 .01 .0 31 .0 29 .0 96 .0 100 .0 121 .0 34 .0 33 .5 128 .0 115 .0 88 .03 .0 33 .5 35 .0 100 .0 138 .0 121 .0 42 .0 41 .5 135 .0 122 .0 92 .05 .0 39 .0 40 .0 105 .0 141 .2 125 .0 58 .0 54 .0 140 .0 138 .0 120 .0
7 .3 was asGC :0 .0
follows :ONC :1 .60 RC:0.0 RNC :0 .5 BEN :1 .3
OCC :12 .9 ONCC :11 .8 RCC :5 .6 RNCC :6 .20 BENC :6 .8
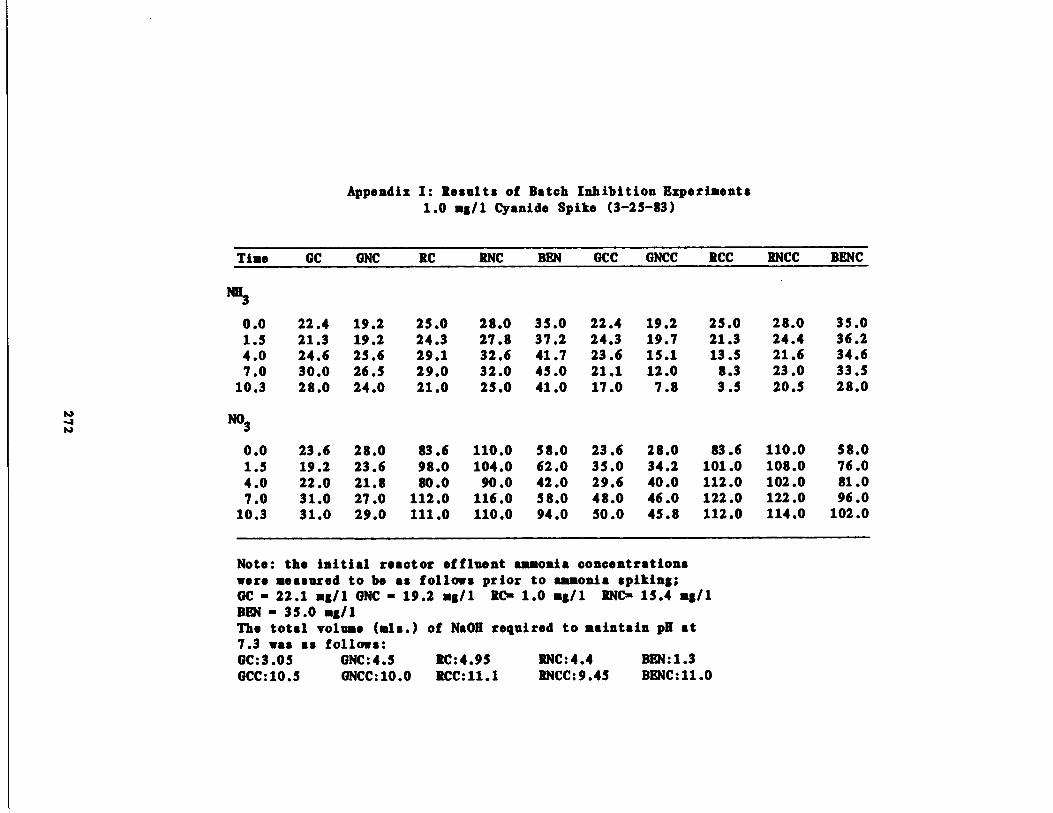
Appendix I : Results of Batch Inhibition Experiments1 .0 of/1 Cyanide Spi e (3-25-83)
Note : the initial reactor effluent ammonia concentrationswere measured to be as follows prior to ammonia spi ing;GC - 22 .1 mg/1 ONC - 19 .2 a`/i RC- 1 .0 mg/1 RNC- 15 .4 ag/iBEN - 35 .0 mg/1The total volume (ads .) of NaOH required to maintain pH at
Time GC GNC RC RNC BEN GCC GNCC RCC RNCC BENC
0 .0 22 .4 19 .2 25 .0 28 .0 35 .0 22 .4 19 .2 25 .0 28.0 35 .01 .5 21 .3 19 .2 24 .3 27 .8 37 .2 24.3 19 .7 21 .3 24 .4 36 .24 .0 24 .6 25 .6 29 .1 32 .6 41 .7 23 .6 15 .1 13 .5 21 .6 34 .67 .0 30 .0 26 .5 29 .0 32 .0 45 .0 21 .1 12 .0 8 .3 23 .0 33 .5
10 .3 28 .0 24 .0 21 .0 25 .0 41 .0 17 .0 7 .8 3 .5 20 .5 28 .0
N03
0 .0 23 .6 28 .0 83 .6 110 .0 58 .0 23 .6 28 .0 83 .6 110 .0 58 .01 .5 19 .2 23 .6 98 .0 104 .0 62 .0 35 .0 34 .2 101 .0 108 .0 76 .04 .0 22 .0 21 .8 80 .0 90 .0 42 .0 29 .6 40 .0 112 .0 102 .0 81 .07 .0 31 .0 27 .0 112 .0 116 .0 58 .0 49 .0 46 .0 122 .0 122 .0 96 .0
10 .3 31 .0 29 .0 111 .0 110 .0 94 .0 50 .0 45 .8 112 .0 114 .0 102 .0
7 .3 was asGC :3 .05
follows :GNC :4 .5 RC :4 .95 RNC :4 .4 BEN:1 .3
GCC :10 .5 ONCC:10 .0 RCC :11 .1 RNCC :9 .45 BENC:11 .0

Appendix I : Results of Batch Inhibition Experiments10 ms/l Aniline Spi e (2-23-83)
1
Note : Reactor QC and GNC were not nitrifyingprior to the experiment .Nitrate analyzed by Cadmims ReductionMethod . pH not ad usted in this experiment
Time GC GNC RC RNC BEN GCC (JNCC RCC RNCC BENC
_ 93
0 .0 19 .8 22 .5 22 .5 22 .5 21 .0 19 .8 22 .5 22 .5 22 .5 21 .01 .5 24.0 25 .0 23 .0 21 .2 22 .0 23 .4 24 .5 15 .2 19 .0 17 .83 .0 22 .0 22 .0 21 .5 22 .1 20 .5 22 .5 21 .1 12 .9 14 .2 12 .36,0 18 .2 22 .1 14 .5 18 .0 20 .2 22 .0 24 .2 6 .3 9 .6 8 .48 .0 15 .1 27 .0 13 .7 17 .9 20 .2 23 .0 26 .5 5 .1 9 .2 8 .8
10 .5 13 .0 27 .0 8 .3 13 .0 15 .0 21 .0 24 .5 1 .85 2 .7 5 .2
0 .0 13 .8 0 .7 73 .6 96 .8 52 .8 13 .7 0 .7 73 .6 96 .8 52 .83 .0 24.8 7 .4 113 .9 107 .1 114 .8 27 .0 18 .5 116 .9 93 .6 74 .8

APPENDIX II : Results of Chronic Inhibition ExperimentsSimultaneous Pulse-Step Feed of 30 m`Il Aniline (6/23-6/26-83)
Ammonia-N vs . Time (Hours)Time
RC
HNC
DEN
274
0 .0 94 .0 100 .0 105 .02 .0 90 .0 99 .0 97 .04 .0 87 .0 102 .0 103 .06 .0 89 .0 98 .0 101 .08 .0 88 .0 84 .0 103 .0
11 .0 90 .0 49 .0 96 .014 .0 98 .0 30 .0 99 .017 .0 102 .0 8 .3 72 .020 .5 96 .0 1 .2 35 .224 .0 88 .0 1 .0 33 .528 .5 92 .0 1 .0 1 .032 .0 99 .0 2 .9 3 .136 .0 102 .0 1 .9 2 .644 .5 102 .0 1 .0 1 .052 .5 103 .0 1 .3 1 .660 .5 102 .0 1 .0 1 .071 .0 102 .0 1 .0 1 .075 .0 101 .0 • s78 .0 97 .0 * s80 .0 84 .0 s s82 .0 72 .0 • s84 .0 58 .086 .0 44 .291 .5 14 .8 • s93 .5 7 .0 s s95 .5 2 .0 s
100 .0 1 .0123 .0 1 .0 1 .0 1 .0125 .0 1 .0 1 .0 1 .0127 .0 1 .0 1 .0 1 .0

Appendix II : Results of Chronic Inhibition ExperimentsSimultaneous Pulse-Step Feed of 30 mg/l. Aniline
Nitrate Data (a /l-N vs . Time)
275
Time GC GNC RC
0 .0 122 .0 128 .0 121 .02 .0 116 .0 125 .0 117 .04 .0 116 .0 122 .0 115 .08 .0 94 .5 94 .0 108 .0
14 .0 81 .0 102 .0 83 .020 .5 69 .0 104 .0 96 .528.5 53 .8 104 .0 110 .044 .5 48 .0 108 .0 132 .028 .5 53 .8 104 .0 110 .044 .5 48 .0 108 .0 132 .052 .5 33 .0 100 .0 138 .060.5 31 .5 102 .0 135 .071 .0 29 .9 102 .0 136 .076 .0 29 .5 •78.0 28 .580 .0 32 .0 • •82 .0 36 .2 •84 .0 40 .086 .0 44 .291 .5 56 .0 • •93 .5 60 .0 •95 .5 63 .0• •
100 .0 74 .0 • •123 .0 105 .0 100 .0 115 .0125 .0 108 .0 101 .0 116 .0127 .0 108 .0 98 .0 117 .0
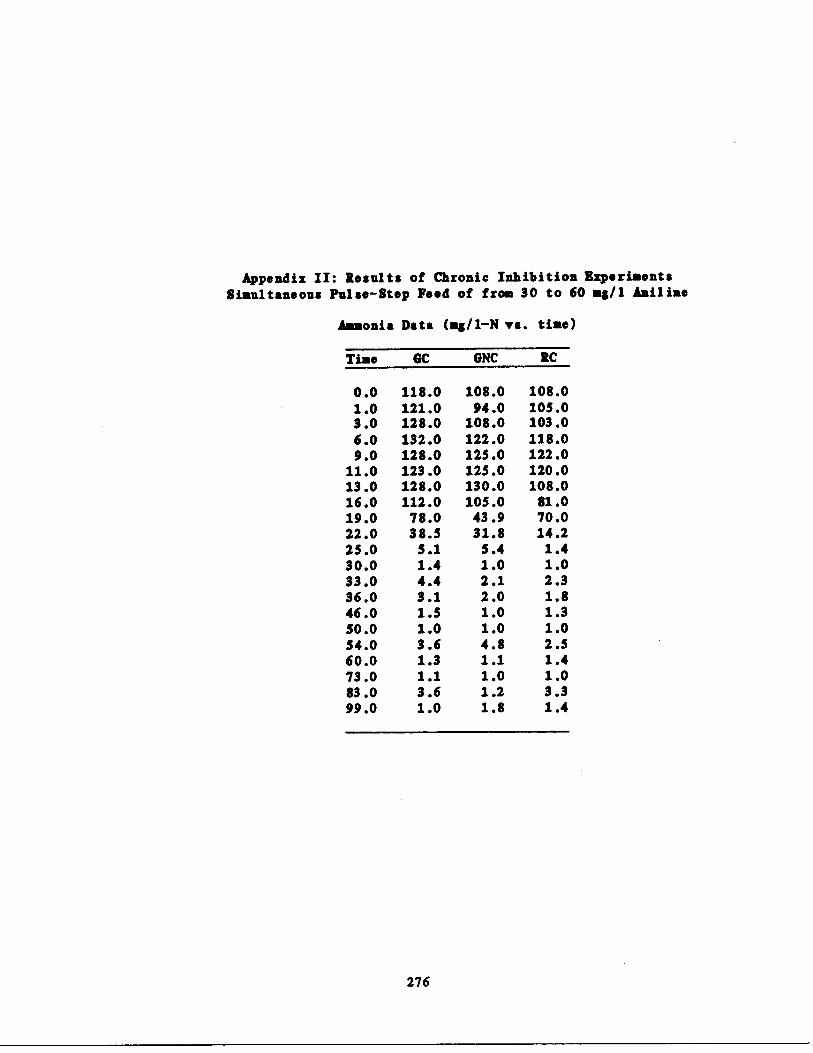
Appendix II : Results of Chronic Inhibition ExperiaentsSimultaneous Pulse-Step Feed of from 30 to 60 a /l Aniline
Ammonia Data (as/i-N vs . tine)
276
Time GC GNC RC
0 .0 118 .0 108 .0 108 .01 .0 121 .0 94 .0 105 .03 .0 128 .0 108 .0 103 .06 .0 132 .0 122 .0 118 .09 .0 128 .0 125 .0 122 .0
11 .0 123 .0 125 .0 120 .013 .0 128 .0 130 .0 108 .016 .0 112 .0 105 .0 81 .019 .0 78 .0 43 .9 70 .022 .0 38 .5 31 .8 14 .225 .0 5 .1 5 .4 1 .430 .0 1 .4 1 .0 1 .033 .0 4 .4 2 .1 2 .336 .0 3 .1 2 .0 1 .846 .0 1 .5 1 .0 1 .350 .0 1 .0 1 .0 1 .054 .0 3 .6 4 .8 2 .560 .0 1 .3 1 .1 1 .473 .0 1 .1 1 .0 1 .083 .0 3 .6 1 .2 3 .399 .0 1 .0 1 .8 1 .4

Appendix II : Results of Chronic Inhibition BzperinentsSimultaneous Pulse-Step Feed of 30 to 60 mg/1 Aniline
Nitrate Data (n8/l-N vs . tine)
277
Tine GC ONC RC0 .0 139 .0 138 .0 130 .01 .0 131 .0 131 .0 127 .03 .0 122 .0 124 .0 120 .06 .0 117 .0 117 .0 113 .0
11 .0 100 .0 94 .0 89 .013 .0 96 .0 92 .0 87 .016 .0 91 .0 86 .0 78 .022 .0 84 .0 79 .9 71 .033 .0 72 .0 61 .0 56 .536 .0 67 .0 59 .9 57 .546 .0 63 .0 50 .0 54 .550 .0 66 .5 53 .9 60 .054 .0 54 .0 48 .5 37 .558 .0 55 .0 52 .0 40 .060 .0 55 .5 40 .0 56 .073 .0 52 .0 36 .0 60 .083 .0 47 .0 35 .5 80 .099 .0 52 .0 36 .0 84 .0
107 .0 52 .0 37 .0 96 .0119 .0 52 .0 34 .0 100 .0130 .0 61 .0 38 .0 128 .0146 .0 68.0 39 .5 125 .0153 .0 77 .0 45 .0 128 .0169 .0 90 .0 53 .0 132 .0191 .0 113 .0 74 .0 133 .0201 .0 128 .0 92 .0 142 .0216 .0 129 .0 108 .0 138 .0223 .0 130 .0 130 .0 142 .0240 .0 132 .0 132 .0 138 .0264 .0 138 .0 132 .0 138.0
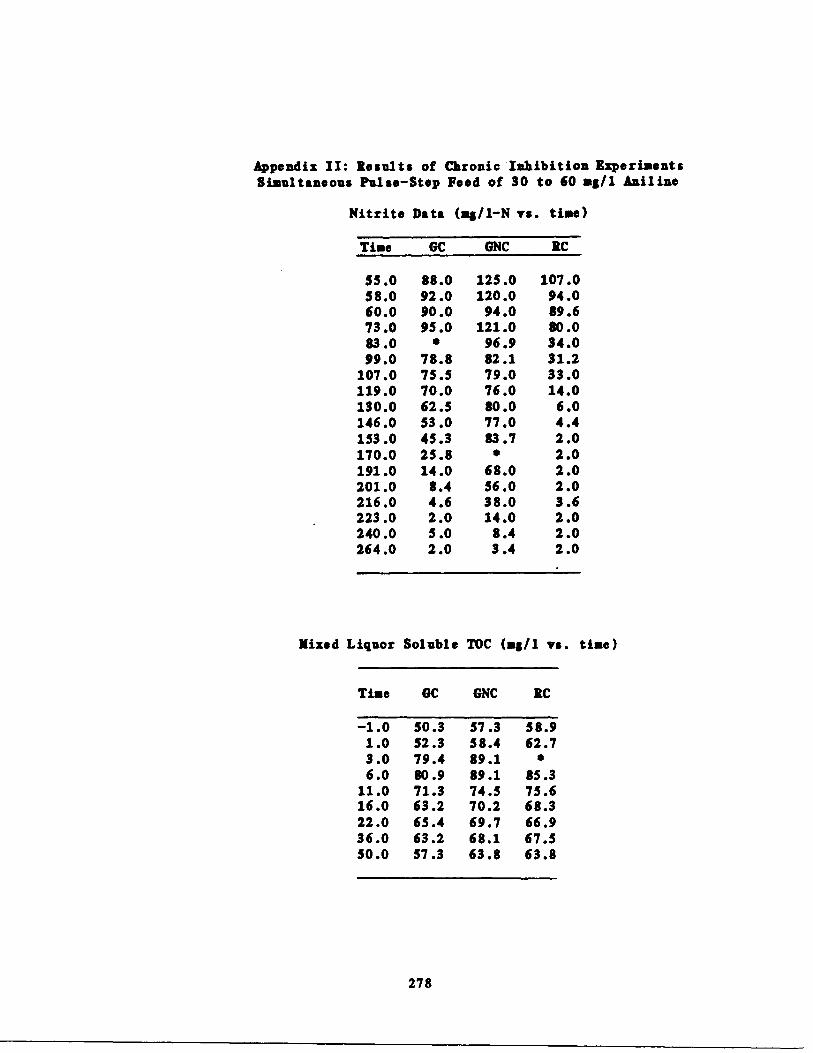
Appendix 11 : Results of Chronic Inhibition ExperimentsSimultaneous Pulse-Step Feed of 30 to 60 at/1 Aniline
Nitrite Data (a`/1-N vs . time)
Mixed Liquor Soluble TOC (ag/l vs . time)
278
Time GC GNC RC
55 .0 88 .0 125 .0 107 .058 .0 92 .0 120 .0 94 .060 .0 90 .0 94 .0 89 .673 .0 95 .0 121 .0 80 .083 .0 • 96 .9 34 .099 .0 78 .8 82 .1 31 .2
107 .0 75 .5 79 .0 33 .0119 .0 70 .0 76 .0 14 .0130 .0 62 .5 80 .0 6 .0146 .0 53 .0 77 .0 4 .4153 .0 45 .3 83 .7 2 .0170 .0 25 .8 • 2 .0191 .0 14 .0 68 .0 2 .0201 .0 8 .4 56 .0 2 .0216 .0 4 .6 38 .0 3 .6223 .0 2 .0 14 .0 2 .0240 .0 5 .0 8 .4 2 .0264 .0 2 .0 3 .4 2 .0
Time GC GNC RC
-1 .0 50 .3 57 .3 58 .91 .0 52 .3 58 .4 62 .73 .0 79 .4 89 .16 .0 80 .9 89 .1 85 .3
11 .0 71 .3 74 .5 75 .616 .0 63 .2 70 .2 68 .322 .0 65 .4 69 .7 66 .936 .0 63 .2 68 .1 67 .550 .0 57 .3 63 .8 63 .8

Time Control NA 4000 A 2000 A 1000 A 500 A Control A
0 .0
34 .5
54.5
54.5
54 .5
54.3
54 .50 .5
43 .5
42 .51 .0
32 .5
32 .0
31.5
36 .0
44.5
50 .03 .0
3 .4
7 .5
9 .6
11 .2
28.5
41 .05 .0
1 .3
1 .4
1 .6
1 .4
18.0
36.28 .0
1 .3
1 .4
1 .6
1 .4
5.0
29.0
N03
0 .0
78.0
78.0
78.0
78.0
78.0
78.00 .5
86 .0
84 .0
0
0
1 .0
90 .0
90 .0
90.0
89 .0
86.0
82 .03 .0
114.0
112.0
112.0
111 .0
96.0
84.05 .0
125.0
123 .0
123 .0
125.0
108.0
90.08 .0
135.0
132.0
135 .0
132.0
128.0
95.0
N02
0 .0
3 .7
3.7
3 .7
3 .7
3 .7
3 .70 .5
0 .0
3.1
2 .9
1 .3
0 .2
0 .23 .0
6 .0
0.9
3 .0
1 .5
0.3
0.28 .0
0.08
0 .1
0.1
0 .1
0.1
0.2
APPENDIX III : Results of Carbon Dose Inhibition ExperimentsExperiment with 10 ag/i Aniline Spi e (2-17-85)
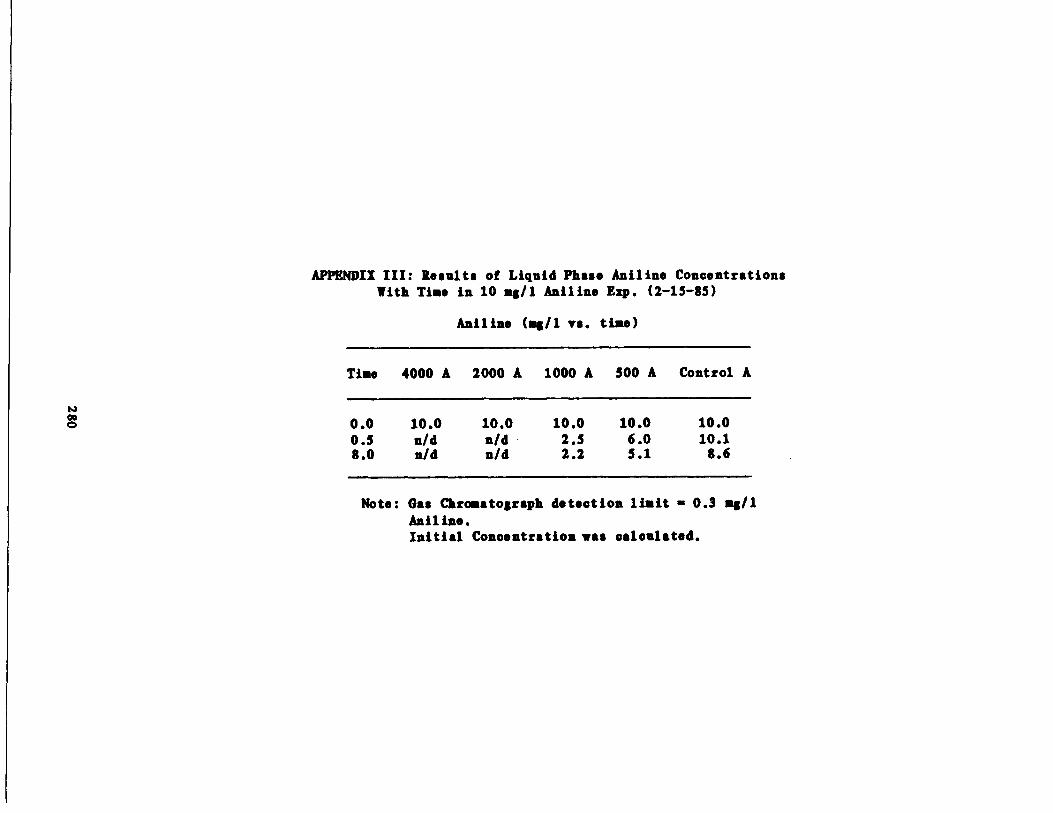
APPENDIX III : Results of Liquid Phase Aniline ConcentrationsWith Tiae in 10 ag/1 Aniline Exp . (2-15-85)
Aniline (mg/l vs . time)
Tiae 4000 A 2000 A 1000 A 500 A Control A
N0
0 .0
10.0
10.0
10.0
10.0
10 .00 .5
n/d
n/d
2.5
6.0
10.18 .0
n/d
a/d
2 .2
5.1
8 .6
Note : Gas Chromatograph detection limit - 0 .3 ag/lAniline .Initial Concentration was calculated .
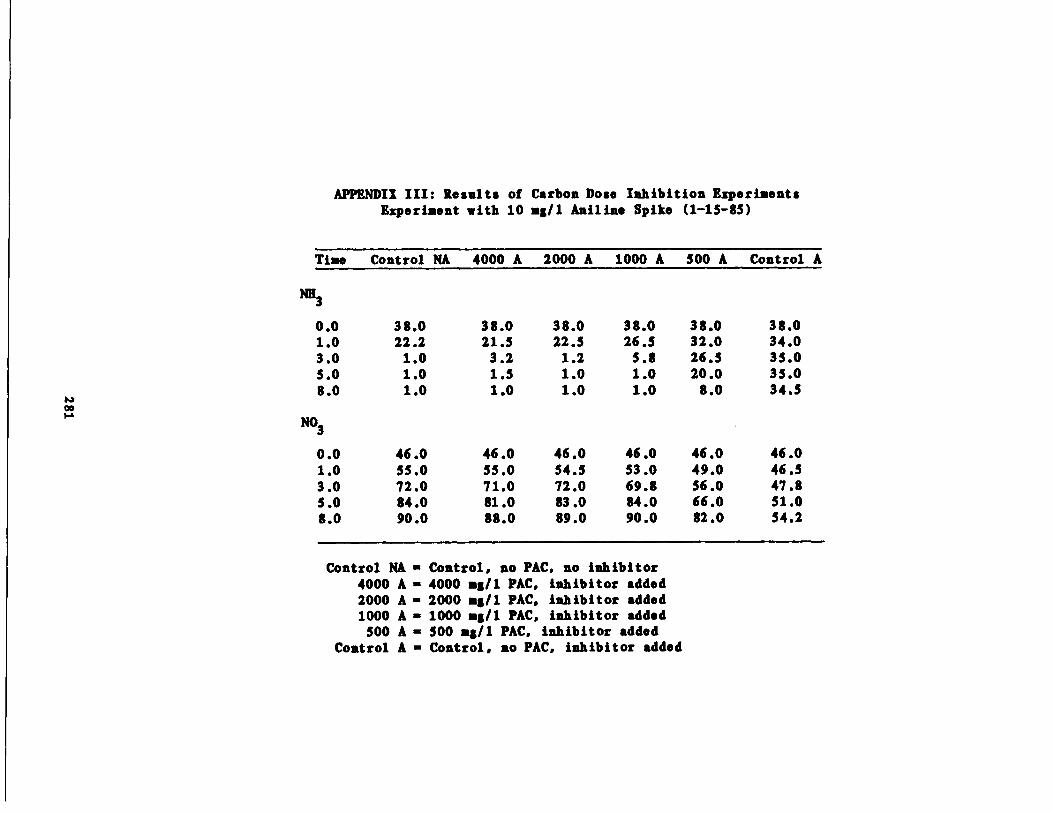
APPENDIX III : Results of Carbon Dose Inhibition ExperimentsExperiment with 10 mg/l Aniline Spi e (1-15-85)
Control NA - Control, no PAC, no inhibitor4000 A - 4000 mg/1 PAC, inhibitor added2000 A - 2000 a=/l PAC, inhibitor added1000 A - 1000 at/l PAC, inhibitor added500 A - 500 a /l PAC, inhibitor added
Control A - Control, no PAC, inhibitor added
Time Control NA 4000 A 2000 A 1000 A 500 A Control A
NH3
0 .0 38 .0 38 .0 38 .0 38 .0 38.0 38 .01 .0 22 .2 21 .5 22 .5 26 .5 32 .0 34 .03 .0 1 .0 3 .2 1 .2 5 .8 26 .5 35 .05 .0 1 .0 1 .5 1 .0 1 .0 20 .0 35 .08 .0 1 .0 1 .0 1 .0 1 .0 8 .0 34 .5
N03
0 .0 46 .0 46 .0 46 .0 46 .0 46 .0 46 .01 .0 55 .0 55 .0 54 .5 53 .0 49 .0 46 .53 .0 72 .0 71 .0 72 .0 69 .8 56 .0 47 .85 .0 84 .0 81 .0 83 .0 84 .0 66 .0 51 .08 .0 90 .0 88 .0 89 .0 90 .0 82 .0 54 .2

APPENDIX III : Results of Carbon Dose Inhibition ExperimentsExperiment with 0 .7 a`/l Cyanide Spi e (1-17-85)
Tine 4000 A 500 A Control A Control NA
0 .0 38 .0 38 .0 38.0 38.01 .0 34 .0 36 .0 34 .0 22 .23 .0 21 .0 27 .5 28.0 1 .05 .0 6 .8 21 .5 22 .5 1 .08 .0 1 .0 11 .5 17 .0 1 .0
N03
0 .0 46 .0 46 .0 46 .0 46 .01 .0 48 .5 48 .0 48.5 55 .03 .0 59 .5 53 .0 51 .0 72 .05 .0 74 .0 61 .0 56 .5 84 .08 .0 88 .0 74 .0 66 .0 90 .0
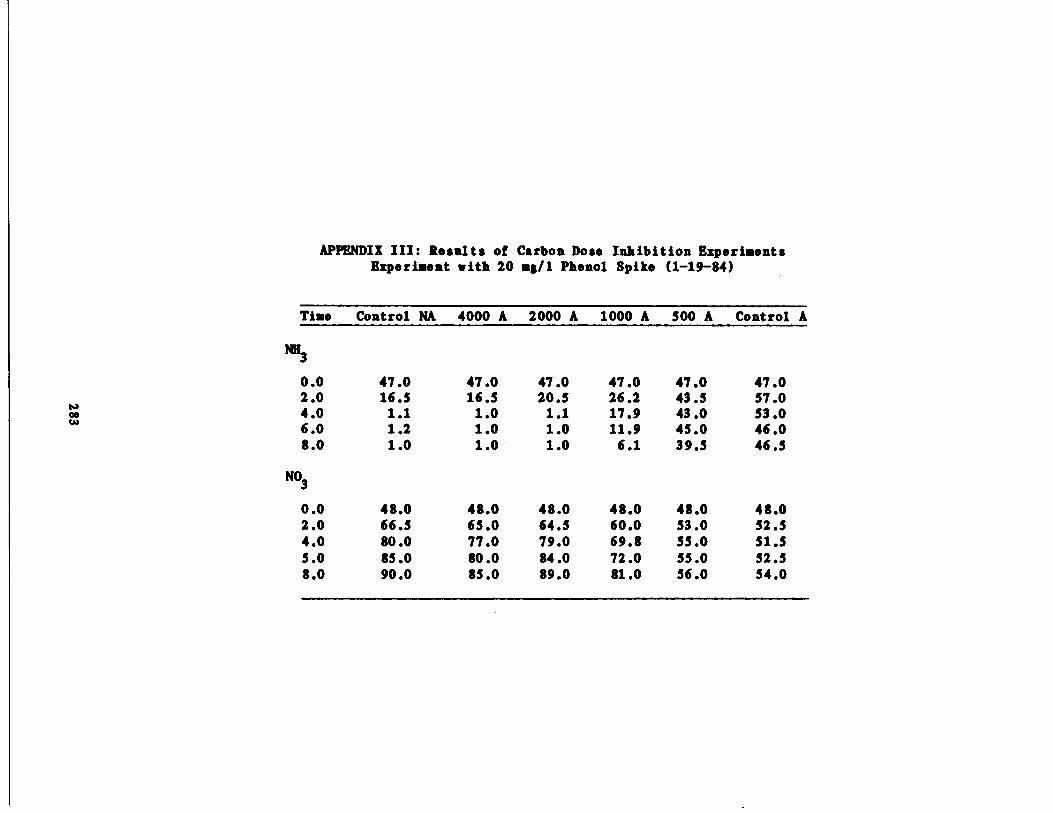
APPENDIX III : Results of Carbon Dose Inhibition ExperimentsExperiment with 20 mg/l Phenol Spi e (1-19-84)
Time Control NA 4000 A 2000 A 1000 A 500 A Control A
0 .0 47 .0 47 .0 47 .0 47 .0 47 .0 47 .02 .0 16 .5 16 .5 20 .5 26 .2 43 .5 57 .0
oNO 4 .0 1 .1 1 .0 1 .1 17 .9 43 .0 53 .06 .0 1 .2 1 .0 1 .0 11 .9 45 .0 46 .08 .0 1 .0 1 .0 - 1 .0 6 .1 39 .5 46 .5
N03
0 .0 48.0 48 .0 48 .0 48 .0 48 .0 48 .02 .0 66 .5 65 .0 64 .5 60 .0 53 .0 52 .54 .0 80 .0 77 .0 79 .0 69 .8 55 .0 51 .55 .0 85 .0 80 .0 84 .0 72 .0 55 .0 52 .58 .0 90 .0 85 .0 89 .0 81 .0 56 .0 54 .0
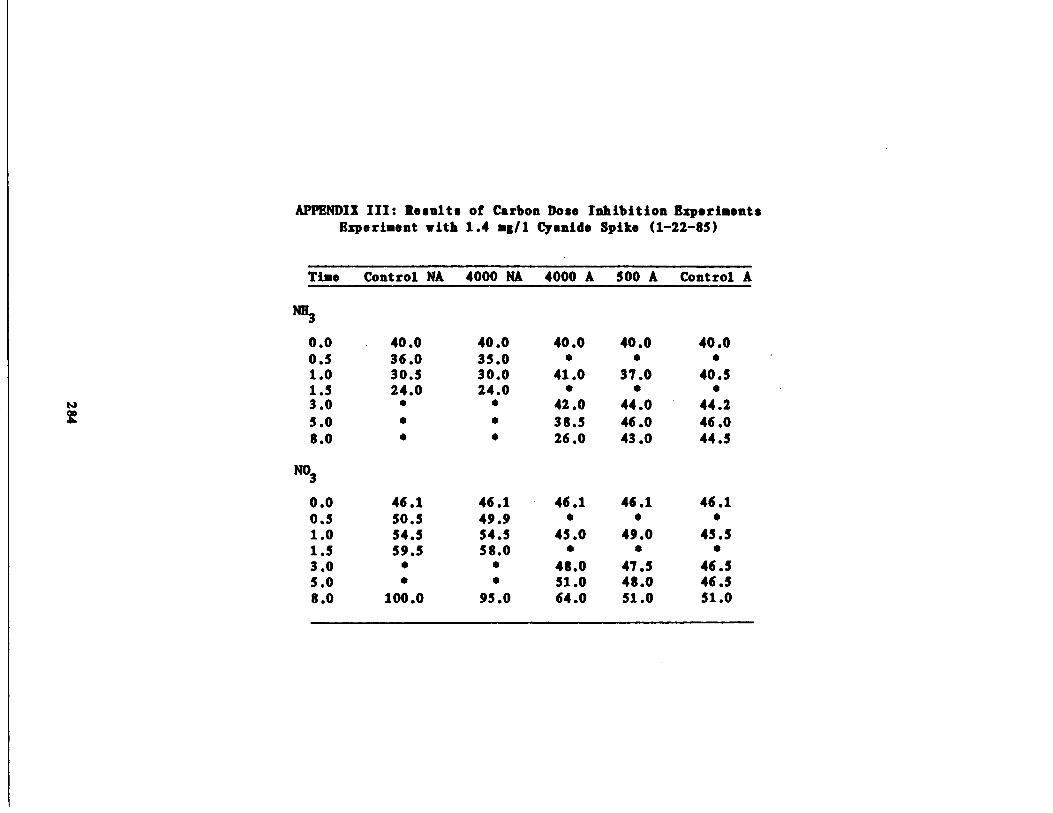
APPENDIX III : Results of Carbon Dose Inhibition ExperimentsExperiment with 1 .4 m8/l Cyanide Spi e (1-22-85)
Time Control NA 4000 NA 4000 A 500 A Control A
NK3
0 .0 40 .0 40 .0 40 .0 40 .0 40 .00 .5 36 .0 35 .01 .0 30 .5 30 .0 41 .0 37 .0 40 .51 .5 24 .0 24 .0
N 3 .0 • • 42 .0 44 .0 44 .25 .0 • • 39 .5 46 .0 46 .08 .0 • • 26 .0 43 .0 44 .5
N03
0 .0 46 .1 46 .1 46 .1 46 .1 46 .10 .3 50 .5 49 .91 .0 54 .5 54 .5 45 .0 49 .0 45 .51 .5 59 .5 58 .03 .0 • • 48 .0 47 .5 46 .55 .0 • • 51 .0 48 .0 46 .58 .0 100 .0 95 .0 64 .0 51 .0 31 .0
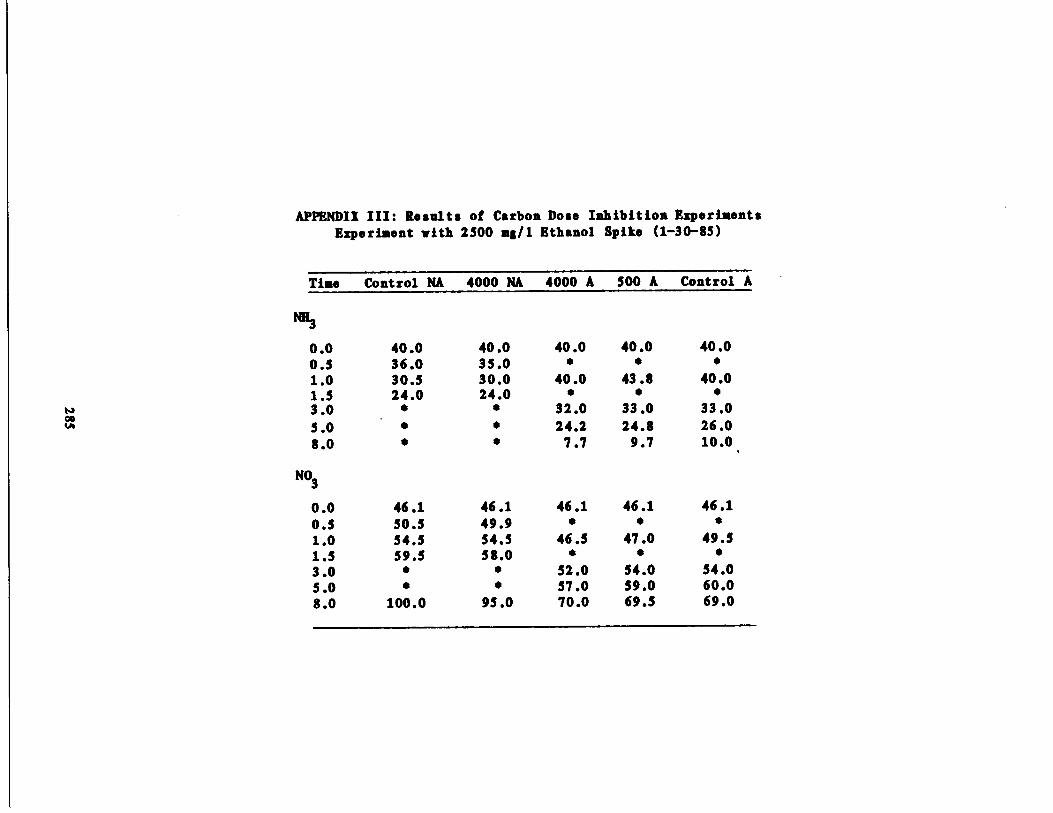
APPENDIX III : Results of Carbon Dose Inhibition ExperimentsExperiment with 2500 ng/1 Ethanol Spi e (1-30-85)
Tine Control NA 4000 NA 4000 A 500 A Control A
0 .0 40 .0 40 .0 40 .0 40 .0 40 .00 .5 36 .0 35 .01 .0 30 .5 30 .0 40 .0 43 .8 40 .01 .5 24 .0 24 .03 .0 • • 32 .0 33 .0 33 .05 .0 • • 24.2 24 .8 26 .08 .0 • • 7 .7 9 .7 10 .0
N03
0 .0 46 .1 46 .1 46 .1 46 .1 46 .10 .5 50 .5 49 .9 • • •1 .0 54 .5 54 .5 46 .5 47 .0 49 .51 .5 59 .5 58.03 .0 • • 52 .0 54 .0 54 .05 .0 • • 57 .0 59 .0 60 .08 .0 100 .0 95 .0 70 .0 69 .3 69 .0
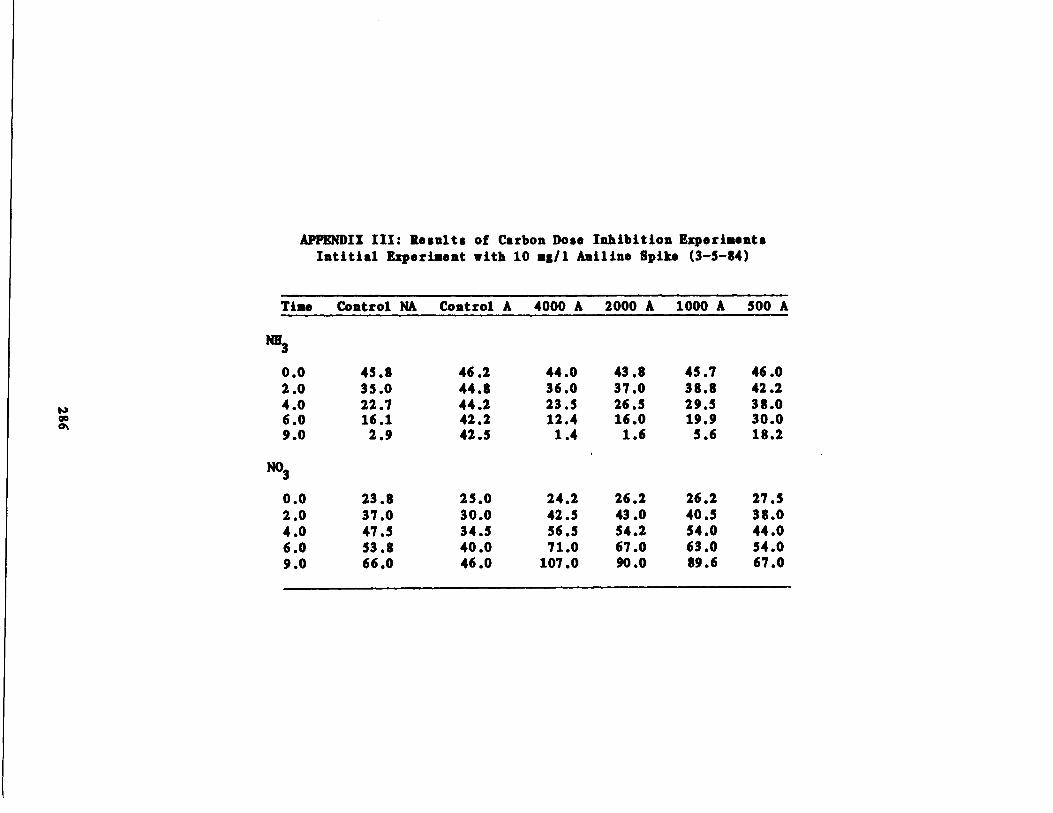
APPENDIX III : Results of Carbon Dose Inhibition ExperimentsIntitial Experiment with 10 m6/l Aniline Spi e (3-5-84)
Time Control NA Control A 4000 A 2000 A 1000 A 500 A
0 .0 45 .8 46 .2 44 .0 43 .8 45 .7 46 .02 .0 35 .0 44 .8 36 .0 37 .0 38 .8 42 .24 .0 22 .7 44 .2 23 .5 26 .5 29 .5 38 .06 .0 16 .1 42 .2 12 .4 16 .0 19.9 30 .09 .0 2,9 42 .5 1 .4 1 .6 5 .6 18 .2
N03
0 .0 23 .8 25 .0 24 .2 26 .2 26 .2 27 .52 .0 37 .0 30 .0 42 .5 43 .0 40 .5 38 .04 .0 47 .5 34 .5 56 .5 54 .2 54 .0 44 .06 .0 53 .8 40 .0 71 .0 67 .0 63 .0 54 .09 .0 66 .0 46 .0 107 .0 90 .0 89 .6 67 .0
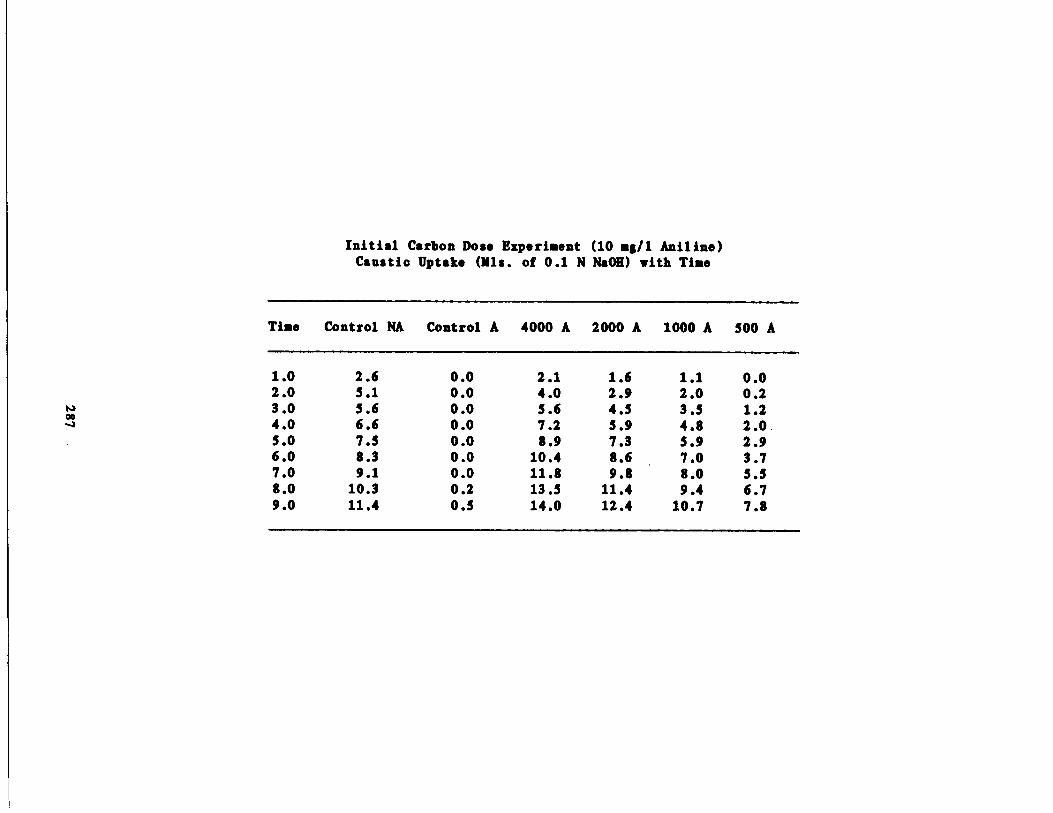
Initial Carbon Dose Experiment (10 mg/1 Aniline)Caustic Upta e (Mls . of 0 .1 N NaOR) with Tine
Time Control NA Control A 4000 A 2000 A 1000 A 500 A
1 .0 2 .6 0 .0 2 .1 1 .6 1 .1 0 .02 .0 5 .1 0 .0 4 .0 2 .9 2 .0 0 .23 .0 5 .6 0 .0 5 .6 4 .5 3 .5 1 .24 .0 6 .6 0 .0 7 .2 5 .9 4 .8 2 .0 .5 .0 7 .5 0 .0 8 .9 7 .3 5 .9 2 .96 .0 8 .3 0 .0 10 .4 8 .6 7 .0 3 .77 .0 9 .1 0 .0 11 .8 9 .8 8 .0 5 .58 .0 10 .3 0 .2 13 .5 11 .4 9 .4 6 .79 .0 11 .4 0 .5 14 .0 12 .4 10 .7 7 .8

Appendix IV : Results of I eldahi Nitrogen Trial Runs
•
Expected Q based on using 1 .0 al of 200 mg/l ammonia-N as the added standard .ag/1-N = Q•2•0 .2/0 .005
Vol of digest - 5 .0 al .' Expected Q based on using 1 .0 al of 100 mg/l ammonia-N as the added standard .Volume of digest- 10 .0 al .
x Expected Q based on using 5 .0 al vol digest . 1 .0 al of 500 mg/l ammonia-Nwas used as added standard .
Standard Calculated Expected Expected Measured Measured 'bCompound mg/1-N Concentration Q Q mg/1-N Difference
Asparagine 187 .0 4 .7 2 .35 2 .4 192 .0 2 .8Alanine 157 .0 3 .9 1 .95 1 .9 152 .0 3 .2
Ammonia-N 200 .0 5 .0 2 .5 2 .5 200 .0 0 .0Asparagine 187 .0 4 .7 2 .35 2 .4 192 .0 2 .8
Ammonia-Nx 200 .0 5 .0 1 .0 1 .0 200 .0 0 .0Alaninex 157 .0 3 .9 0 .78 0 .75 150 .0 4 .0
Asparaginex 187 .0 4 .7 0 .94 0 .95 190 .0 1 .6Ammonia-N' 10 .0 0 .5 0 .5 0 .4 9 .0 10.0Asparaginex 187 .0 4 .7 0 .94 0 .95 190 .0 1 .6