Embed Size (px)
Citation preview
UNIVERSITY OF CALIFORNIA
Santa Barbara
Overhauser Dynamic Nuclear Polarization to Study Hydration Dynamics
A Dissertation submitted in partial satisfaction of the
requirements for the degree Doctor of Philosophy
in Physics
by
Brandon Dean Armstrong
Committee in charge:
Professor Mark Sherwin (co-chair)
Professor Songi Han (co-chair)
Professor Andrew Cleland
Professor Philip Pincus
Professor Frederick Dahlquist
June 2010
The dissertation of Brandon Dean Armstrong is approved.
_____________________________________________
Songi Han
_____________________________________________
Andrew Cleland
_____________________________________________
Philip Pincus
_____________________________________________
Frederick Dahlquist
_____________________________________________
Mark Sherwin, Committee Co-Chair
May 2010
iii
Acknowledgments
I thank Songi Han for being the driving force behind the work presented here. She
is never short of ideas yet she gave me the independence to pursue my own scientific
interests. Her positive attitude and enthusiasm for both the small and big successes
made my graduate experience more enjoyable and rewarding.
The work presented here is also the work of many collaborators. I thank all my
co-authors for their contributions and valuable insights. I especially thank Elliot
Brown for his design of the microwave amplifier in chapter three and Silvia
Cavegnero for providing samples and expertise for the work in chapter 4. I thank
Mark Sherwin, Susumu Takahashi, Louis Claude Brunel, and Johan van Tol, who
volunteered much of their time to help me understand and design the quasi-optical
bridge of Chapter Five. Bruce Dunson, Terry Hart, Mike Johnson, and Richard Bock
built much of the equipment used in these experiments and also contributed to their
design. I thank all members of the Han group from 2005 to 2010 for many helpful
discussions. I thank Colin Shepherd, Matt Shepard, Greg Dyer, Joe Paul, Charlie
Wickersham, Ken Shen, and Gang Chen, with whom I spent many nights working on
homework assignments. I thank Beth Wynstra for her wonderful support. I also thank
my committee for taking time to critique my advancement exam and read this thesis.
I thank my mom and dad who taught me to always work hard. By encouraging me
to be curious and to try and solve problems myself, they laid the foundation for my
pursuit of physics. Thank you for all your love and support. This dissertation is as
much a reflection of your hard work as it is mine.
iv
VITA of Brandon Dean Armstrong
May 2010
EDUCATION
B.S. in Applied Mathematics, University of Northern Illinois, May 2004
B.S. in Physics, University of Northern Illinois, May 2004
Doctor of Philosophy in Physics, University of California, Santa Barbara, June 2010
(expected)
SCHOLARLY PRESENTATIONS
Invited Speaker: Magnetic Resonance Gordon-Kenan Research Seminar, University
of New England (June 2009). ―Water Dynamics of Apomyoglobin Folding
using Dynamic Nuclear Polarization.‖
Seminar Speaker: Chemistry Seminar, Massachusetts Institute of Technology (2008).
―Dynamic Nuclear Polarization to Study Local Water Dynamics.‖ Guest of
Robert Griffin.
Seminar Speaker: National High Magnetic Field Laboratory, Tallahassee, FL. (2007)
―DNP as a Tool for Unique NMR Contrast.‖ Guest of Johan van Tol.
AWARDS AND RECOGNITION
Institute for Quantum and Complex Dynamics Travel Award: UC — Santa Barbara
(2009).
Materials Research Laboratory Travel Fellowship: UC — Santa Barbara (2008)
Experimental Nuclear Magnetic Resonance Conference Travel Award (2007)
Dean‘s Award: Northern Illinois University (2003)
Nominated by department for campus award
University Scholar Award: Northern Illinois University (2001)
Full tuition plus room and board scholarship for two years
v
PUBLICATIONS
B.D. Armstrong, J. Choi, C. J. López, D. Wesener, W. L. Hubbell, S. Cavagnero,
and S. Han, ―Site–Specific Hydration Dynamics in Native, Molten Globular and
Unfolded Apomyoglobin,‖ in preparation
B.D. Armstrong, D. T. Edwards, R. J. Wylde, S. A. Walker, and S. Han, ―A 200
GHz dynamic nuclear polarization spectrometer,‖ Phys. Chem. Chem. Phys.
doi: 10.1039/c002290j
S. Garcia, J. H. Walton, B.D. Armstrong, S. Han, and M. J. McCarthy, ―L-band
Overhauser dynamic nuclear polarization,‖ J. Magn. Reson. 203 (2010) 138-143
B.D. Armstrong, P. Soto, J-E. Shea, and S. Han, ―Overhauser dynamic nuclear
polarization and molecular dynamics simulations using pyrroline and piperidine
ring nitroxide radicals,‖ J. Magn. Reson. 200 (2009) 137-141
B.D. Armstrong, and S. Han, ―Overhauser Dynamic Nuclear Polarization to Study
Local Water Dynamics,‖ J. Am. Chem. Soc. 131 (2009) 4641-4647
E.R. McCarney, B.D. Armstrong, R. Kausik, and S. Han, ―Dynamic Nuclear
Polarization Enhanced Nuclear Magnetic Resonance and Electron Spin
Resonance Studies of Hydration and Local Water Dynamics in Micelle and
Vesicle Assemblies,‖ Langmuir 24 (2008) 10062-10072.
S. Han, E.R. McCarney, and B.D. Armstrong, ―Dynamic Nuclear Polarization
Studies of Local Water Dynamics at 9.8 GHz,‖ Appl. Magn. Reson. 34 (2008)
439-451.
B.D. Armstrong, M.D. Lingwood, E.R. McCarney, E.R. Brown, P. Blümler, and S.
Han, ―Portable X-band system for solution state dynamic nuclear polarization,‖
J. Magn. Reson. 191 (2008) 273-281.
S. Han, E.R. McCarney, B.D. Armstrong, and M.D. Lingwood, ―Dynamic Nuclear
Polarization-Enhanced Magnetic Resonance Analysis at X-Band Using
Amplified 1H Water Signal‖ (2008), In S.L. Codd and J. D. Seymour (Eds.),
Magnetic Resonance Microscopy: Spatially Resolved NMR Techniques and
Applications (pp. 161-176). Weinheim, Germany: Wiley-VCH
B.D. Armstrong, R. Kausik, and S. Han, ―Local Hydration Dynamics in Soft Matter
by Dynamic Nuclear Polarization of 1H-water,‖ Magnetic Resonance in Porous
Media: Proceedings of the 9th
International Bologna Conference on Magnetic
Resonance in Porous Media, AIP Conf. Proc., 1081 (2008) 14-17.
vi
B.D. Armstrong, and S. Han, ―A New Model for Overhauser-Enhanced Nuclear
Magnetic Resonance Using Nitroxide Radicals,‖ J. Chem. Phys. 127 (2007)
104508-10.
E.R. McCarney, B.D. Armstrong, M.D. Lingwood, and S. Han, ―Hyperpolarized
Water as an Authentic Magnetic Resonance Imaging Contrast Agent,‖ Proc.
Nat. Acad. Sci. USA. 104 (2007) 1754-1759.
B. Dabrowski, O. Chmaissem, P.W. Klamut, S. Kolesnik, M. Maxwell, J. Mais, Y.
Ito, B.D. Armstrong, J.D. Jorgensen, and S. Short, ―Reduced Ferromagnetic
Transition Temperatures in SrRu1-vO3 Perovskites from Ru-site Vacancies,‖
Phys. Rev. B. 70 (2004) 014423.
vii
ABSTRACT
Overhauser Dynamic Nuclear Polarization to Study Hydration Dynamics
By
Brandon Dean Armstrong
Hydrophobic and hydrophilic interactions of water with biomolecules are known to
mediate important processes such as protein folding, protein aggregation, and the
formation of lipid bilayers and vesicles. Yet the exact role water plays in many
biological processes is complex, spanning a large range of length and timescales, and
is not well understood in quantitative detail despite extensive interest and decades of
study. Experimentally, water – surface interactions are difficult to study as water
lubricating a protein surface or moving across a membrane does not have a unique
spectroscopic signature. While nuclear magnetic resonance (NMR) is an ideal
technique for studying biological systems since it is non-invasive and uses low energy
radio frequencies to irradiate the sample, it cannot differentiate between bulk and
surface water. To overcome this obstacle, I advanced dynamic nuclear polarization
(DNP) as a technique to study water interactions with biomolecules. I present here my
work to develop a new theoretical model to quantify DNP experiments, apply DNP to
experimentally measure the timescale of water interactions in an intermediate state of
a protein, and in designing and building hardware to improve DNP performance and
extend these techniques to large magnetic fields.
viii
TABLE OF CONTENTS
I. Overhauser Dynamic Nuclear Polarization
A. Motivation…………………………………………………………......1
B. Theory of the Ovehauser Effect ..........................................................8
C. Modeling the Overhauser Effect……………………………………..15
D. Spin Labeled Electron Paramagnetic Resonance…………………….24
II. The Ovehauser Effect with Nitroxde Radicals
A. Introduction ..................................................................................... .28
B. A new model describing the saturation factor .................................. ..30
C. Results and Discussion………………………………………………..35
D. Conclusion……………………………………………………………47
E. Materials and Methods………………………………………………..48
III. Portable DNP and Improved Hardware
A. Introduction…………………………………………………………..51
B. Results and Discussion………………………………………………..52
C. Conclusion…………………………………………………………….61
D. Materials and Methods………………………………………………..62
IV. Site Specific Hydration Dynamics of Apomyoglobin
A. Introduction….………………………………………………………..66
B. Results and Discussion………………………………………………..69
C. Conclusion…………………………………………………………….80
ix
D. Materials and Methods………………………………………………..82
V. A 200 GHz Quasi-Optical DNP and EPR Spectrometer
A. Introduction……………………………………………………….….88
B. Experimental………………………………………………………….91
C. Results and Discussion………………………………………………..98
D. Conclusion…………………………………………………………..105
VI. Conclusion……………………………………………………………………...107
References…………………………………………………………………………..110
1
I. Overhauser Dynamic Nuclear Polarization
A. Motivation
Nuclear magnetic resonance (NMR) is a powerful spectroscopic technique with
applications ranging from reaction monitoring [1, 2], protein structure determination
[3], medical imaging [4], and even quantum computing applications [5]. As the NMR
experiment is both non-invasive and uses low energy radio frequency (RF) irradiation
to excite the nuclear spins, it is an ideal tool for the study of biological samples and
processes at ambient temperatures. However, NMR suffers from an inherit lack of
sensitivity due to the small thermal polarization of nuclear spins which follow
Boltzman statistics. For example, the world‘s largest NMR spectrometer currently
operates at 23.5 T. At room temperature the 1H nuclear spin polarization at this field
is still only 0.008%. Sensitivity becomes even more problematic with other nuclei
which are less abundant and have smaller gyromagnetic ratios. Additionally, spectral
overlap of the signal from like nuclei can complicate the spectra requiring two and
three dimensional techniques to separate the peaks. The result is that some
experiments can be prohibitively time consuming requiring days or weeks of signal
averaging, and in some cases cannot be performed at all due to lack of sensitivity. It is
a testament to the wealth of information available from an NMR experiment that it is
one of the most widely used spectroscopic techniques despite these shortcomings.
Of all the efforts put into improving the sensitivity of an NMR experiment,
Dynamic Nuclear Polarization (DNP) offers the largest potential gain. DNP is the
process by which an unpaired electron transfers its larger spin polarization to dipolar
2
or scalar (Fermi-contact) coupled nuclei, thereby enhancing the NMR signal by 2-3
orders of magnitude. The process was originally predicted in 1953 by Albert
Overhauser for conduction electrons and nuclei in metals [6] and quickly verified
experimentally by Carver and Slichter [7]. It was soon found that the effect was not
confined just to metals but also to diamagnetic crystals and paramagnetic molecules
in solution [8]. The e- spin polarization can be transferred to a coupled nuclear spin
through several DNP mechanisms: the Overhauser Effect (OE) [6], the solid effect [9,
10], thermal mixing [10, 11], and the cross effect [12]. The OE is effective when the
strength of the dipolar or scalar coupling is modulated by relative motion of the e- and
nuclear spin. If the timescale of this motion is ≲ 1/𝜔𝑒 , where 𝜔𝑒 is the e- Larmor
frequency, then transitions involving mutual e- - nuclear spin flips will occur with a
high probability, and the e- spin polarization can be transferred to the nuclei by
irradiation of the e- resonance transition.
The other three DNP mechanisms occur in insulating solids where the dipolar or
scalar coupling is essentially static or modulated very slowly. In this case, transitions
involving mutual e- - nuclear spin flips are forbidden. In the solid effect, the width of
the e- spin resonance is narrow compared to the nuclear Larmor frequency, 𝜔𝑛 .
Perturbation theory gives a small mixing of the energy levels such that high power
irradiation at 𝜔 = 𝜔𝑒 ± 𝜔𝑛 can drive these ‗forbidden‘ transitions, thereby enhancing
the NMR signal. Both thermal mixing and the cross effect can occur in systems where
the width of the e- resonance is on the order of, or broader than 𝜔𝑛 . In each case, the
application of off-resonant irradiation of the electron resonance line induces mutual
3
spin flips of two e- spins separated in frequency by 𝜔𝑛 , resulting in enhanced (positive
or negative) NMR signal. In the case of thermal mixing the e- spin resonance is
homogenously broadened, while the cross effect describes the situation where the e-
spin resonance is inhomogenously broadened due to g or A anisotropy.
The overall focus of this dissertation is on using DNP to study the dynamics
between an e- spin and nuclear spin, with a particular emphasis on hydration water
surrounding biological molecules. As the OE is the only DNP mechanism that is
effective in liquids, it forms the basis for most of the experiments presented in this
work. Therefore, a detailed description will be given in the next two sections. We
define hydration water as water molecules that have their translational, rotational, and
hydrogen bonding dynamics perturbed by the presence of a surface. The interaction
of water with hydrophobic and hydrophilic regions of biomolecules is known to play
an important role to mediate processes such as protein folding, protein aggregation,
and the formation and stabilization of lipid bilayers. However, as hydration water
does not have a unique spectroscopic signature, there is a lack of experimental
techniques capable of measuring the dynamics of water on the heterogeneous surface
of a protein or macromolecular assembly with site-specificity. For example, both
electron paramagnetic resonance (EPR) and femto-second fluorescence spectroscopy
have been applied to study local water dynamics on the surface of proteins [13-16].
Both methods, however, indirectly measure local water dynamics and are sensitive
not only to the local motion of water, but also to the local structure of the protein (e.g.
alpha-helix or beta-sheet), complicating the interpretation of results.
4
In the Han group, we propose attaching a free radical (molecule with an unpaired
e-) with site specificity to biomolecules, and then use DNP to directly measure the
1H
NMR signal enhancement of water. The dipolar interaction that causes the DNP
effect is short range, with 80% of the relaxation occurring within 5 Å [17], so the 1H
signal enhancement is heavily weighted to water close to the surface. As will be
shown, the NMR signal enhancement from DNP is strongly dependent on the
distance of closest approach between the two spin bearing molecules, d, and the local
diffusion of water. Thus, DNP can provide a measure of local water dynamics.
Several necessary steps were needed to achieve the goal of using DNP to study
local water dynamics. First, the existing theory of the DNP parameter known as the
saturation factor (to be defined shortly) for experiments using nitroxide free radicals
(which have a nitrogen covalently bonded to an oxygen with an unpaired e-; see Fig.
1.2) as the source of unpaired electrons was inadequate to explain our experimental
results. Nitroxide radicals will be discussed in more detail later, but they are a very
important class of free radicals because they are stable, soluble in water, and are easy
to covalently bind to biomolecules with site specificity. In chapter two, I show the
shortcoming of the existing DNP theory. I then detail a modified description of the
saturation factor and show experimental evidence to support the new model [18, 19].
In chapter three I detail our work on developing hardware for maximizing DNP
signal enhancements. The original motivation for this work was to produce larger
DNP enhancements for magnetic resonance imaging experiments. Our work in
improving hardware resulted in nearly a factor of three improvement in our DNP
5
signal enhancements compared to a commercially available X-band (8 - 12 GHz)
EPR bridge. Additionally, the setup was made portable by means of a tunable 9.5 –
10 GHz microwave cavity and a variable field Halbach magnet [20] allowing the
necessary equipment to easily be taken to an imaging facility rather than having a
dedicated instrument. However, for theoretical and practical reasons to be discussed,
0.35 T is a good choice of magnetic field to study local water dynamics with the OE,
and our custom X-band amplifier has become a piece of standard equipment in our
group‘s studies on hydration dynamics.
Armed with new theory and improved hardware, chapter four summarizes our
work on applying this new technique to a sample of biological importance. Sperm
whale apomyoglobin (apoMb) is widely studied in protein folding experiments
because it has a stable intermediate that can be populated at low pH and salt
concentrations. Most importantly, the stable intermediate closely resembles a kinetic
folding intermediate allowing a wide range of experimental techniques to be used to
study what is normally a short lived state [21]. Though apoMb is widely studied, it is
unknown if water is excluded from the hydrophobic core of the stable intermediate.
This is an important question since protein folding models differ on whether the
exclusion of water occurs after the initial collapse of a hydrophobic core or after the
protein has found its native structure. In chapter four, our DNP results show strong
evidence for a hydrated hydrophobic core in the intermediate state of apoMb. In
addition to the work presented here, this new technique has been applied in our group
6
to study water diffusion across membranes [22, 23], inside coacervates [24], and to
elucidate early forming species in the aggregation of tau protein [25].
While the experiments presented in chapters two through four were done at 0.35
T, most NMR experiments are done at much higher magnetic fields due to increased
spin polarization and greater spectral resolution. Despite the wide range of samples
that DNP experiments could be applied to at high magnetic fields (arbitrarily defined
here as > 5 T), the technique has not been widely used, largely due to hardware
difficulties. DNP requires resonant or near resonant irradiation of the electron Larmor
frequency. Magnetic fields up to 16 T are commonly used in NMR experiments
which would require a 450 GHz source for DNP experiments to be implemented. The
problem is not just limited to the availability of high frequency sources, but other
challenges must be overcome such as dielectric absorption by the sample, high
microwave power needed to excite broad electron spin resonances, and difficulties
building the necessary RF and microwave equipment into the bore of a
superconducting magnet without sacrificing spectral resolution. Recent technological
developments in microwave technologies [26, 27] have renewed interest in high field
DNP. The wider availability of hardware and increased interest has led to several
commercial instruments, notably, a 9 T gyrotron-based system from Bruker Biospin
for solid state magic angle spinning experiments (ssMAS) and a diode-based, 1.1 K
dissolution DNP setup for liquid state spectroscopy from GE and Oxford. In the
latter, the sample is cooled to 1.1 K during microwave irradiation in a 3.35 T magnet
and then quickly dissolved and shuttled to a high resolution NMR magnet. The
7
former uses a gyrotron to produce high power (several watts) 250 GHz irradiation and
over-moded waveguides to propagate the microwaves to the sample inside a ssMAS
probe in a 9 T magnet. Both systems are expensive, require significant lab space, and
do not incorporate the ability to detect the EPR signal of the sample which can also
contain a wealth of information about electron-nuclei interactions. In chapter five we
detail our work to bridge this cost—space—EPR gap with the development of a 7 T
DNP and EPR spectrometer based on quasi-optical techniques with a low power, 200
GHz diode source. In this chapter we present our initial DNP and EPR results on a
test sample at 4 K. Our experimental design allows for EPR and NMR detection in
the same setup without changing the sample. Also, we show the benefit of using
quasi-optical techniques for microwave propagation as the polarization of incident
radiation can be changed to maximize DNP enhancements or isolate the small EPR
signal from the large background.
As previously mentioned, all of the work at low field relies on the OE. As the goal
of these experiments is to understand the dynamics of water on biological surfaces, an
understanding of the theory is necessary. I therefore dedicate the next two sections to
the theory of the OE and paramagnetic relaxation by dissolved solutes. I end this
introductory chapter by giving a brief introduction to EPR with spin labeled
molecules because, as I show in chapter four, EPR and DNP can give complementary
information and together paint a more complete picture of the dynamics of proteins.
8
B. Theory of the Overhauser Effect
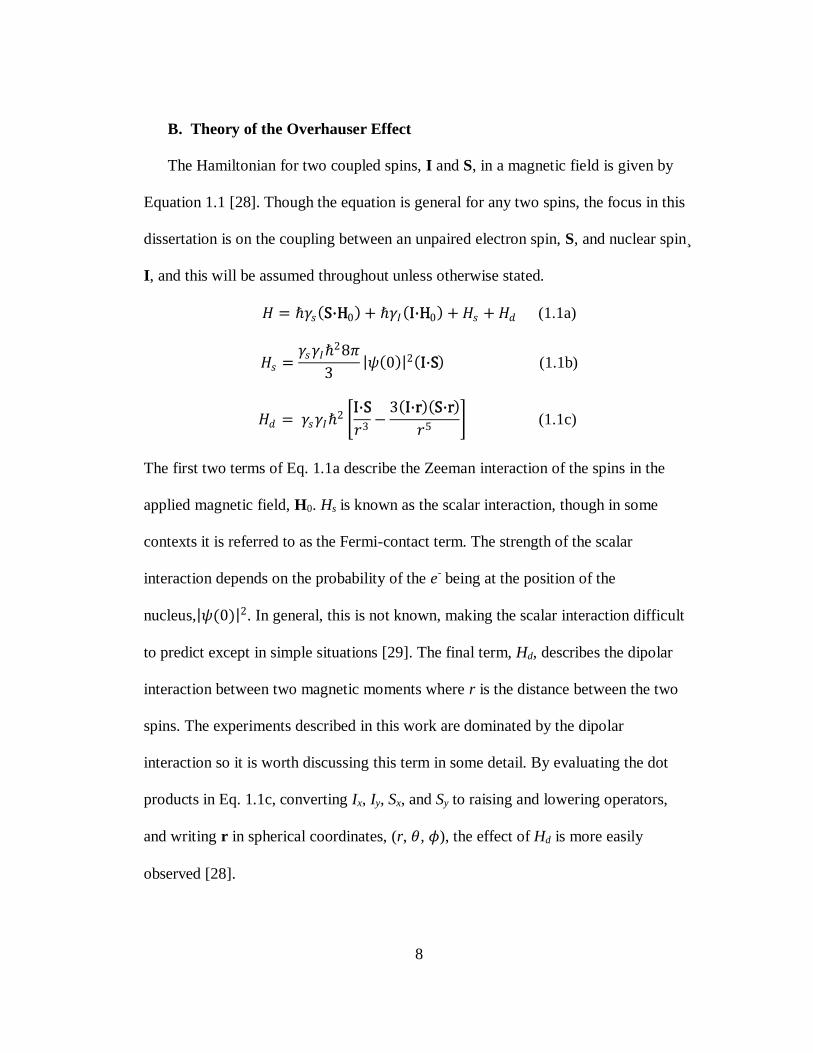
The Hamiltonian for two coupled spins, I and S, in a magnetic field is given by
Equation 1.1 [28]. Though the equation is general for any two spins, the focus in this
dissertation is on the coupling between an unpaired electron spin, S, and nuclear spin¸
I, and this will be assumed throughout unless otherwise stated.
𝐻 = ℏ𝛾𝑠 S⋅H0 + ℏ𝛾𝐼 I⋅H0 + 𝐻𝑠 + 𝐻𝑑 (1.1a)
𝐻𝑠 =𝛾𝑠𝛾𝐼ℏ
28𝜋
3 𝜓 0 2 I⋅S (1.1b)
𝐻𝑑 = 𝛾𝑠𝛾𝐼ℏ2
I⋅S
𝑟3−
3 I⋅r S⋅r
𝑟5 (1.1c)
The first two terms of Eq. 1.1a describe the Zeeman interaction of the spins in the
applied magnetic field, H0. Hs is known as the scalar interaction, though in some
contexts it is referred to as the Fermi-contact term. The strength of the scalar
interaction depends on the probability of the e- being at the position of the
nucleus, 𝜓(0) 2. In general, this is not known, making the scalar interaction difficult
to predict except in simple situations [29]. The final term, Hd, describes the dipolar
interaction between two magnetic moments where r is the distance between the two
spins. The experiments described in this work are dominated by the dipolar
interaction so it is worth discussing this term in some detail. By evaluating the dot
products in Eq. 1.1c, converting Ix, Iy, Sx, and Sy to raising and lowering operators,
and writing r in spherical coordinates, (r, 𝜃, 𝜙), the effect of Hd is more easily
observed [28].
9
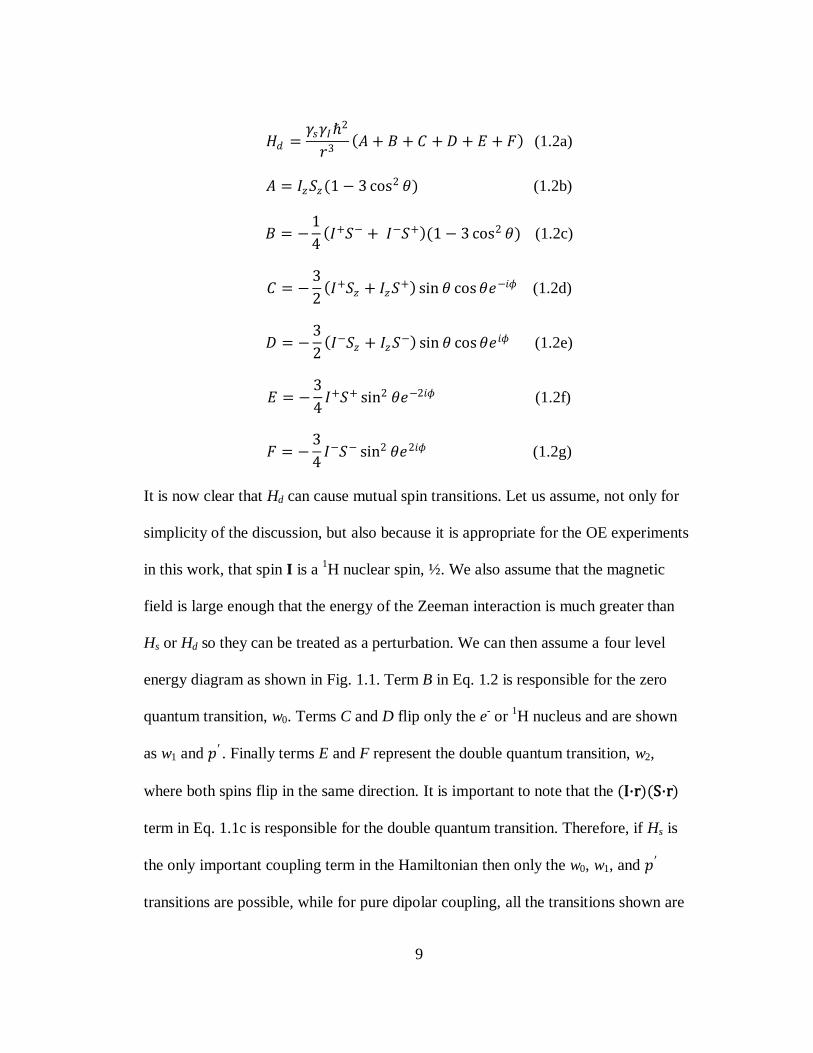
𝐻𝑑 =𝛾𝑠𝛾𝐼ℏ
2
𝑟3 𝐴 + 𝐵 + 𝐶 + 𝐷 + 𝐸 + 𝐹 (1.2a)
𝐴 = 𝐼𝑧𝑆𝑧(1 − 3 cos2 𝜃) (1.2b)
𝐵 = −1
4 𝐼+𝑆− + 𝐼−𝑆+ (1 − 3 cos2 𝜃) (1.2c)
𝐶 = −3
2 𝐼+𝑆𝑧 + 𝐼𝑧𝑆
+ sin 𝜃 cos𝜃𝑒−𝑖𝜙 (1.2d)
𝐷 = −3
2 𝐼−𝑆𝑧 + 𝐼𝑧𝑆
− sin 𝜃 cos𝜃𝑒𝑖𝜙 (1.2e)
𝐸 = −3
4𝐼+𝑆+ sin2 𝜃𝑒−2𝑖𝜙 (1.2f)
𝐹 = −3
4𝐼−𝑆− sin2 𝜃𝑒2𝑖𝜙 (1.2g)
It is now clear that Hd can cause mutual spin transitions. Let us assume, not only for
simplicity of the discussion, but also because it is appropriate for the OE experiments
in this work, that spin I is a 1H nuclear spin, ½. We also assume that the magnetic
field is large enough that the energy of the Zeeman interaction is much greater than
Hs or Hd so they can be treated as a perturbation. We can then assume a four level
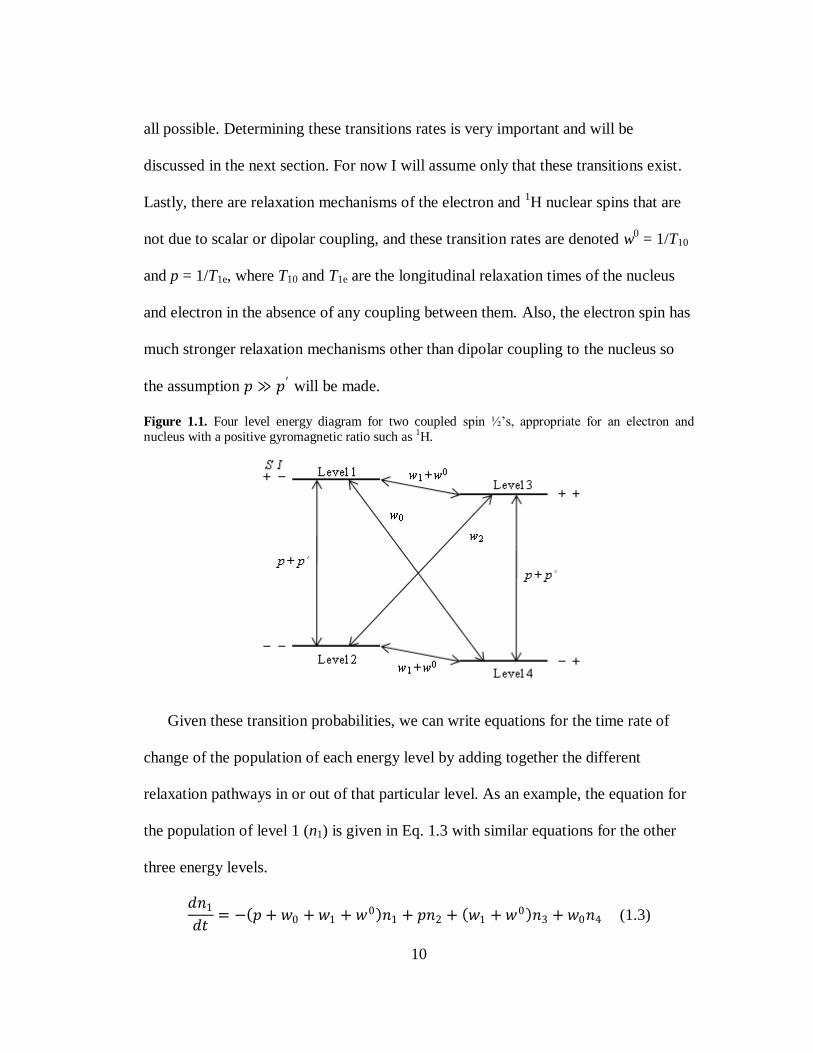
energy diagram as shown in Fig. 1.1. Term B in Eq. 1.2 is responsible for the zero
quantum transition, w0. Terms C and D flip only the e- or
1H nucleus and are shown
as w1 and 𝑝′ . Finally terms E and F represent the double quantum transition, w2,
where both spins flip in the same direction. It is important to note that the (I⋅r)(S⋅r)
term in Eq. 1.1c is responsible for the double quantum transition. Therefore, if Hs is
the only important coupling term in the Hamiltonian then only the w0, w1, and 𝑝′
transitions are possible, while for pure dipolar coupling, all the transitions shown are
10
all possible. Determining these transitions rates is very important and will be
discussed in the next section. For now I will assume only that these transitions exist.
Lastly, there are relaxation mechanisms of the electron and 1H nuclear spins that are
not due to scalar or dipolar coupling, and these transition rates are denoted w0 = 1/T10
and p = 1/T1e, where T10 and T1e are the longitudinal relaxation times of the nucleus
and electron in the absence of any coupling between them. Also, the electron spin has
much stronger relaxation mechanisms other than dipolar coupling to the nucleus so
the assumption 𝑝 ≫ 𝑝′ will be made.
Figure 1.1. Four level energy diagram for two coupled spin ½‘s, appropriate for an electron and
nucleus with a positive gyromagnetic ratio such as 1H.
Given these transition probabilities, we can write equations for the time rate of
change of the population of each energy level by adding together the different
relaxation pathways in or out of that particular level. As an example, the equation for
the population of level 1 (n1) is given in Eq. 1.3 with similar equations for the other
three energy levels.
𝑑𝑛1
𝑑𝑡= − 𝑝 + 𝑤0 + 𝑤1 + 𝑤0 𝑛1 + 𝑝𝑛2 + 𝑤1 + 𝑤0 𝑛3 + 𝑤0𝑛4 (1.3)
11
In an NMR experiment the net magnetization, ⟨𝐼𝑧⟩, is measured which is the total
number of spin up nuclei minus the number of spin down.
⟨𝐼𝑧⟩ ∝ 𝑛3 + 𝑛4 − (𝑛1 + 𝑛2) (1.4)
Using Eq. 1.3 (and the equations for n2, n3, and n4,) and Eq. 1.4 we can write,
𝑑⟨𝐼𝑧⟩
𝑑𝑡= − 𝑤0 + 2𝑤1 + 𝑤2 + 𝑤0 ⟨𝐼𝑧⟩ − 𝐼0 − 𝑤2 − 𝑤0 ⟨𝑆𝑧⟩ − 𝑆0 (1.5)
where I0 and S0 are the nuclear and electron spin equilibrium magnetizations. This is
one of the famous Solomon equations for describing the magnetization of two dipolar
coupled spin ½‘s [30]. There is of course a similar equation for the electron, but
because the electron spin has other strong relaxation mechanisms not due to coupling
with the nucleus we can ignore it. Using the relation 𝑆0 𝐼0 = 𝛾𝑠 𝛾𝐼 , we can define the
NMR signal enhancement, E = ⟨𝐼𝑧⟩/𝐼0, in the steady state by rearranging the terms in
Eq. 1.5.
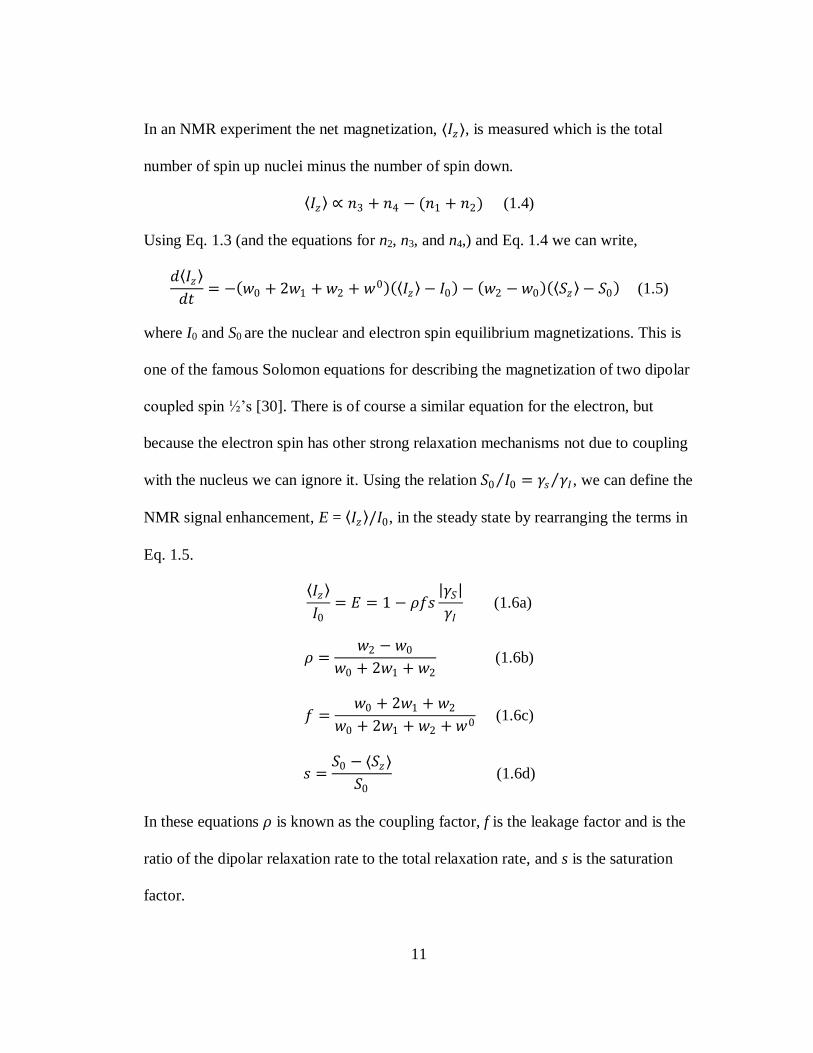
⟨𝐼𝑧⟩
𝐼0= 𝐸 = 1 − 𝜌𝑓𝑠
𝛾𝑆
𝛾𝐼 (1.6a)
𝜌 =𝑤2 − 𝑤0
𝑤0 + 2𝑤1 + 𝑤2 (1.6b)
𝑓 =𝑤0 + 2𝑤1 + 𝑤2
𝑤0 + 2𝑤1 + 𝑤2 + 𝑤0 (1.6c)
𝑠 =𝑆0 − ⟨𝑆𝑧⟩
𝑆0 (1.6d)
In these equations 𝜌 is known as the coupling factor, f is the leakage factor and is the
ratio of the dipolar relaxation rate to the total relaxation rate, and s is the saturation
factor.
12
The most striking feature of Eq. 1.6a is the ratio 𝛾𝑆 /𝛾𝐼, which for an electron
spin and 1H nuclear spin is ~ 660. It is therefore possible to achieve a large NMR
signal enhancement by irradiating the electron spin resonance and driving ⟨𝑆𝑧⟩ away
from its thermal equilibrium value and towards 0. Assuming the validity of the Bloch
equations for the electron spin [31] and on-resonant irradiation of the EPR transition,
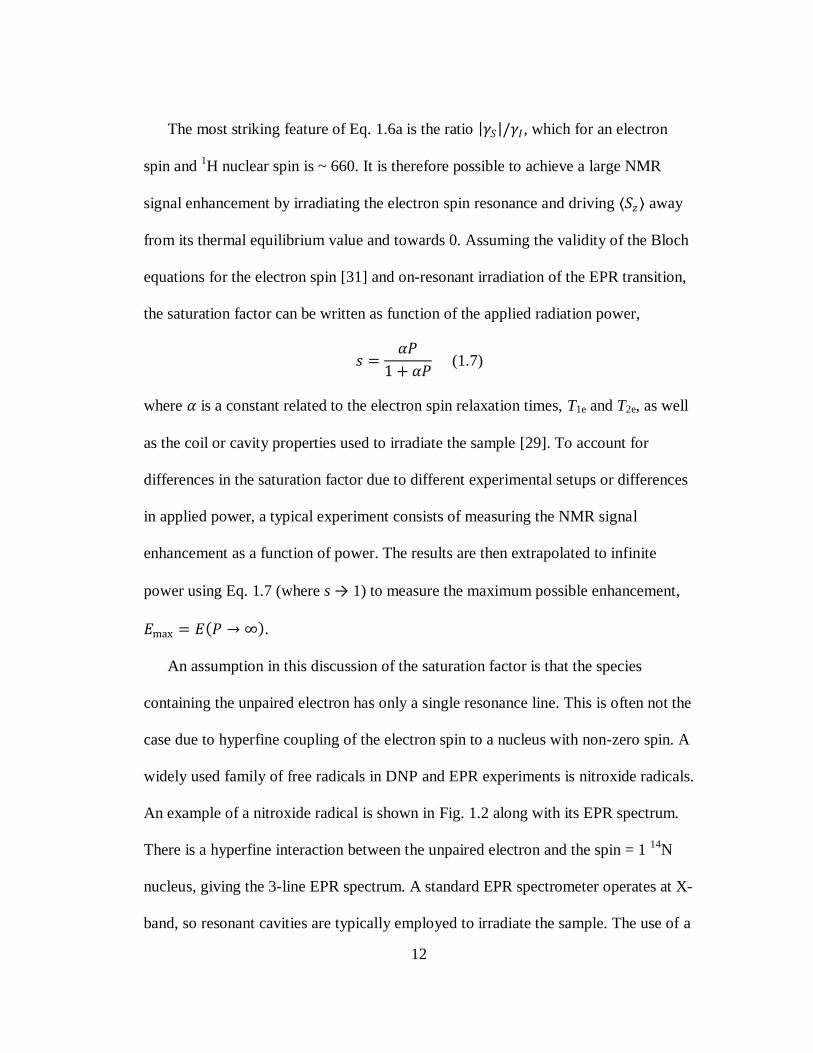
the saturation factor can be written as function of the applied radiation power,
𝑠 =𝛼𝑃
1 + 𝛼𝑃 (1.7)
where 𝛼 is a constant related to the electron spin relaxation times, T1e and T2e, as well
as the coil or cavity properties used to irradiate the sample [29]. To account for
differences in the saturation factor due to different experimental setups or differences
in applied power, a typical experiment consists of measuring the NMR signal
enhancement as a function of power. The results are then extrapolated to infinite
power using Eq. 1.7 (where s → 1) to measure the maximum possible enhancement,
𝐸max = 𝐸 𝑃 → ∞ .
An assumption in this discussion of the saturation factor is that the species
containing the unpaired electron has only a single resonance line. This is often not the
case due to hyperfine coupling of the electron spin to a nucleus with non-zero spin. A
widely used family of free radicals in DNP and EPR experiments is nitroxide radicals.
An example of a nitroxide radical is shown in Fig. 1.2 along with its EPR spectrum.
There is a hyperfine interaction between the unpaired electron and the spin = 1 14
N
nucleus, giving the 3-line EPR spectrum. A standard EPR spectrometer operates at X-
band, so resonant cavities are typically employed to irradiate the sample. The use of a
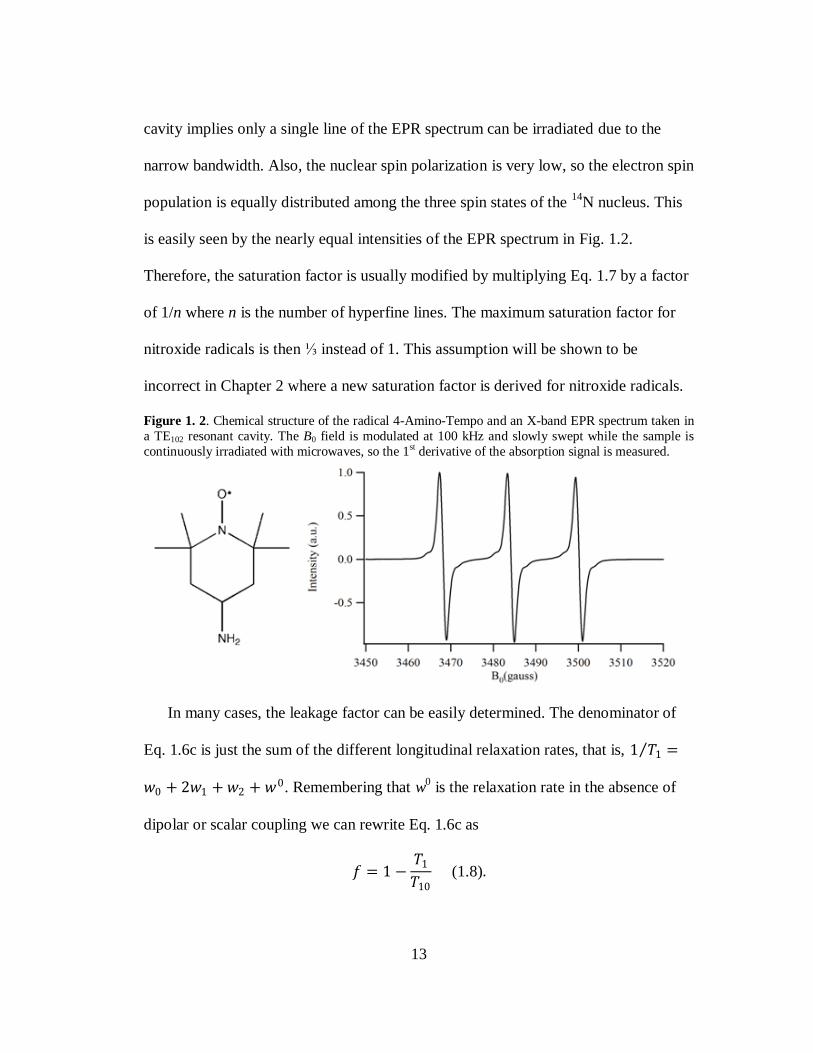
13
cavity implies only a single line of the EPR spectrum can be irradiated due to the
narrow bandwidth. Also, the nuclear spin polarization is very low, so the electron spin
population is equally distributed among the three spin states of the 14
N nucleus. This
is easily seen by the nearly equal intensities of the EPR spectrum in Fig. 1.2.
Therefore, the saturation factor is usually modified by multiplying Eq. 1.7 by a factor
of 1/n where n is the number of hyperfine lines. The maximum saturation factor for
nitroxide radicals is then ⅓ instead of 1. This assumption will be shown to be
incorrect in Chapter 2 where a new saturation factor is derived for nitroxide radicals.
Figure 1. 2. Chemical structure of the radical 4-Amino-Tempo and an X-band EPR spectrum taken in
a TE102 resonant cavity. The B0 field is modulated at 100 kHz and slowly swept while the sample is
continuously irradiated with microwaves, so the 1st derivative of the absorption signal is measured.
In many cases, the leakage factor can be easily determined. The denominator of
Eq. 1.6c is just the sum of the different longitudinal relaxation rates, that is, 1 𝑇1 =
𝑤0 + 2𝑤1 + 𝑤2 + 𝑤0. Remembering that w0 is the relaxation rate in the absence of
dipolar or scalar coupling we can rewrite Eq. 1.6c as
𝑓 = 1 −𝑇1
𝑇10 (1.8).
14
For samples where a paramagnetic solute is being used to hyperpolarize the solvent, f
can be determined by measuring the longitudinal nuclear spin relaxation in the
presence of the paramagnetic species (T1) and absence of the paramagnetic species
(T10). Thus, the leakage factor is a measure of how effectively the e- relaxes the nuclei
compared to other mechanisms. In the limit that all nuclear spin relaxation occurs via
coupling to the electron spin, T1 << T10 and f approaches 1. The total relaxation rate
caused by the e- spins obviously depends on the concentration of electron spins. For a
dilute concentration of electron spins compared to the nuclei, all dipolar relaxation
rates are all linear in e- spin concentration. We can then write Eq. 1.6c as
𝑓 =𝑘𝐶𝑇10
1 + 𝑘𝐶𝑇10 (1.9),
where k is known as the relaxivity constant and C is the unpaired e- concentration.
The coupling factor is so named because it provides information on the type of
interaction between the electron spin and nuclear spin. If the coupling is purely scalar,
the double quantum transition does not exist, and 𝜌 is negative. If the coupling is
purely dipolar, then w2 > w0 (this will be shown in the next section) and 𝜌 is positive.
Additionally, as Eq. 1.6b contains only transitions rates caused by coupling to the e-
spin, there is no concentration dependence in 𝜌. This makes 𝜌 the fundamental
parameter to determine from an Overhauser DNP experiment. The transition rates, w0,
w1, and w2, contain information on the type of coupling as well as the dynamics
modulating the coupling. It is therefore important to calculate these transition rates so
that useful information can be extracted.
15
C. Modeling the Overhauser Effect
In the previous section, we showed that both s and f can approach one, and thus
large NMR signal enhancements are possible if there is efficient cross relaxation. In
this section we show under what conditions this is in fact true. We also now narrow
the focus to the dipolar coupling between an electron of a paramagnetic solute and the
nucleus of a solvent. In this situation, the dipolar Hamiltonian, Hd, is time dependent
due to the diffusion of molecules. This implies that I, S, and r, are all functions of
time. Since diffusion is a random process, Hd is stationary, so the evolution from time
t to t′ depends only on their difference, 𝜏. The transition probability between two
energy levels from time dependent perturbation theory is then [32]
𝑤𝑚𝑛 = ⟨𝑚 𝐻𝑑 𝑡 𝑛⟩⟨𝑛 𝐻𝑑 𝑡 + 𝜏 𝑚⟩ 𝑒−𝑖𝜔𝑚𝑛 𝜏𝑑𝜏 (1.10)
∞
−∞
where the bar represents a statistical average. Eq. 1.10 looks like a Fourier transform,
and we can define a spectral density function, J(𝜔), and a correlation function, G(𝜏),
𝐽 𝜔 = 𝐺 𝜏 𝑒−𝑖𝜔𝜏
∞
−∞
(1.11)
where
𝐺 𝜏 = 𝐺 −𝜏 = ⟨𝑚 𝐻𝑑 𝑡 𝑛⟩⟨𝑛 𝐻𝑑 𝑡 + 𝜏 𝑚⟩ (1.12).
The first equality of Eq. 1.12 is true because G(𝜏) is stationary. If the time
dependence of r, 𝜃, 𝜙 in Eq. 1.2 is known, the transition rates can be calculated.
However, in general an exact calculation of the transition rates is not possible as not
only the diffusion of the two molecules needs to be modeled, but also the electrostatic
16
forces interacting between them. Fortunately, the field of paramagnetic relaxation
enhancement (PRE) is an active community with applications ranging from aiding in
protein structure determination to magnetic resonance imaging (MRI) contrast agents,
so much theoretical and experimental work has been done [33-42]. Three relatively
straight forward scenarios exist that have relatively simple solutions and apply to a
wide range of samples: a translational Brownian diffusion model where the spins are
centered on hard spheres with no forces acting between them (force, free hard sphere
model; FFHS, also referred to as the translational model) [36, 38], a rotational model
where the two spins form a bound complex so that r is a constant and Hd is modulated
by rotational motion [29, 32], and a model combining these two theories for samples
that exhibit both types of relaxation [42]. In chapter two we show that the FFHS
model approximates the nitroxide radical – 1H of water system fairly well. We
therefore calculate 𝜌 and T1 using this model to show the behavior of the DNP signal
enhancement as a function of dynamics and magnetic field. We also compare these
results to a simple rotational model to show how the two differ and how the different
phases of motion may be separated.
The FFHS model is a simplified case of a more general treatment of paramagnetic
relaxation developed by Hwang and Freed and remains a widely used model to
describe dipolar relaxation in liquids mediated by translational diffusion. The
important parameter describing the dynamics between the two spin bearing molecules
is the translational correlation time defined as
𝜏𝑡 =𝑑2
𝐷𝐼 + 𝐷𝑆 (1.13)
17
where d is the distance of closest approach and DI and DS are the diffusion
coefficients of the spin bearing molecules. Eq. 1.13 is important for determining local
hydration dynamics with the OE. If we can determine 𝜏𝑡 from a DNP experiment, we
can gain knowledge of the local diffusion of water. The FFHS model also includeds
the spin lattice and spin-spin relaxation times of the electron. If these times are long
compared to 𝜏𝑡 , which is the case for nitroxide radicals, they can be ignored and there
is a single reduced spectral density function for all the dipolar transition rates [36],
𝑗 𝜔, 𝜏𝑡
=1 +
5 2
8 𝜔𝜏𝑡
1 2 +𝜔𝜏𝑡
4
1 + 2𝜔𝜏𝑡 1 2 + 𝜔𝜏𝑡 +
2
3 𝜔𝜏𝑡
3 2 +16
81 𝜔𝜏𝑡
2 +4 2
81 𝜔𝜏𝑡
5 2 + 𝜔𝜏𝑡
3
81
(1.14)
(Note: In reference [36], equation 2 is correct, but in equation 4 the 𝜔𝜏𝑡 2 term in
the denominator is incorrectly missing). The total 1H nuclear spin relaxation rate of
water in this model is [43]
1
𝑇1=
32𝜋𝑁𝐴
4.05 × 10⁵𝛾𝐼
2𝛾𝑆2ℏ2𝑆 𝑆 + 1 𝐶
𝜏𝑡
𝑑3 𝑗 𝜔𝑆 − 𝜔𝐼 , 𝜏 + 3𝑗 𝜔𝐼 + 6𝑗(𝜔𝑆 + 𝜔𝐼)
+1
𝑇10 (1.15)
where S is the electron spin (1/2 for a nitroxide radical), NA is Avogadro‘s number, C
is the molar concentration, and 𝜔𝑆 and 𝜔𝐼 are the electron and 1H angular Larmor
frequencies.
The dominator of Eq. 1.6c is also the total relaxation rate, 𝑤0 + 2𝑤1 + 𝑤2 + 𝑤0.
The first term of Eq. 1.15 corresponds to the zero quantum transition rate, w0, the
second term to 2w1 and the third term to w2. The zero and double quantum transitions
18
involve simultaneous electron – 1H spin flips, and thus depend on 𝜔𝑆, while the single
quantum transition involves only a nuclear spin flip and therefore depends on 𝜔𝐼.
Since 𝜔𝑆 ≫ 𝜔𝐼 , the double quantum transition rate is about six times larger than the
zero quantum transition rate. Thus upon irradiation of the electron spin resonance, the
population of level 2 in Fig. 1.1 will become more populated than level 4 due to
preferential relaxation through w2, resulting in an NMR signal that is inverted
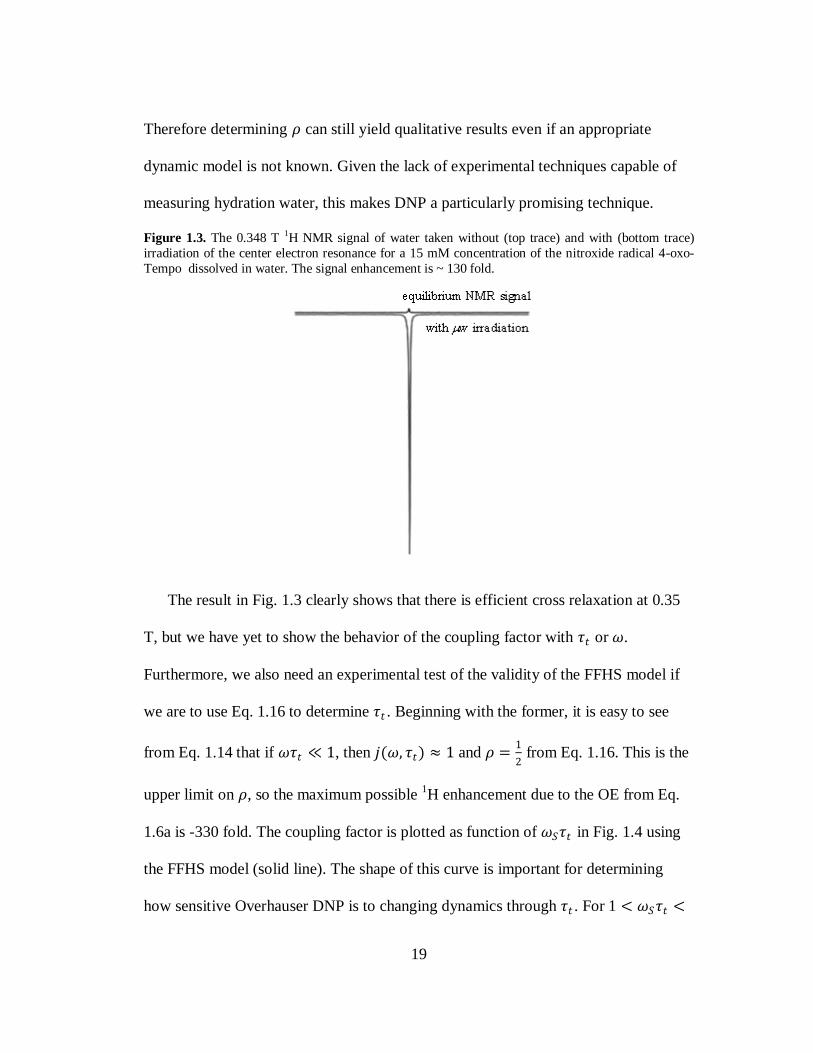
compared to thermal equilibrium. An example of this is shown in Fig. 1.3 where a
-130 fold signal enhancement of the 1H nuclear spin of water was recorded at 0.348
T. We can also rewrite Eq. 1.6b in terms of the reduced spectral density function,
𝜌 =5𝑗 𝜔𝑆 , 𝜏𝑡
7𝑗 𝜔𝑆 , 𝜏𝑡 + 3𝑗 𝜔𝐼 , 𝜏𝑡 (1.16)
where we have made use of the assumption 𝜔𝑆 ± 𝜔𝐼 ≈ 𝜔𝑆. By determining 𝜌 in a
DNP experiment, Eq. 1.16 can be used to calculate 𝜏𝑡 . Eqs 1.16, 1.14, and 1.13 form
the foundation for using DNP to study hydration dynamics. By measuring the DNP
signal enhancements, the leakage factor with Eq. 1.8, and determining the saturation
factor with the model to be developed in chapter 2, 𝜌 and 𝜏𝑡 can be calculated. It is
important to remember that the coupling factor can be found from Eq. 1.6a without
invoking a dynamic model. Additionally, Eq 1.16 is not specific to the FFHS model,
but is applicable anytime the system can be described by a single spectral density
function. This will be the case whenever the electron spin relaxation times do not
contribute to the time dependence of Hd, i.e. T1e and T2e >> 𝜏𝑐 , the correlation time
(for nitroxide radicals, T1e, T2e is typically tens of ns while 𝜏𝑐 is typically tens of ps).
19
Therefore determining 𝜌 can still yield qualitative results even if an appropriate
dynamic model is not known. Given the lack of experimental techniques capable of
measuring hydration water, this makes DNP a particularly promising technique.
Figure 1.3. The 0.348 T 1H NMR signal of water taken without (top trace) and with (bottom trace)
irradiation of the center electron resonance for a 15 mM concentration of the nitroxide radical 4-oxo-
Tempo dissolved in water. The signal enhancement is ~ 130 fold.
The result in Fig. 1.3 clearly shows that there is efficient cross relaxation at 0.35
T, but we have yet to show the behavior of the coupling factor with 𝜏𝑡 or 𝜔.
Furthermore, we also need an experimental test of the validity of the FFHS model if
we are to use Eq. 1.16 to determine 𝜏𝑡 . Beginning with the former, it is easy to see
from Eq. 1.14 that if 𝜔𝜏𝑡 ≪ 1, then 𝑗(𝜔, 𝜏𝑡) ≈ 1 and 𝜌 =1
2 from Eq. 1.16. This is the
upper limit on 𝜌, so the maximum possible 1H enhancement due to the OE from Eq.
1.6a is -330 fold. The coupling factor is plotted as function of 𝜔𝑆𝜏𝑡 in Fig. 1.4 using
the FFHS model (solid line). The shape of this curve is important for determining
how sensitive Overhauser DNP is to changing dynamics through 𝜏𝑡 . For 1 < 𝜔𝑆𝜏𝑡 <
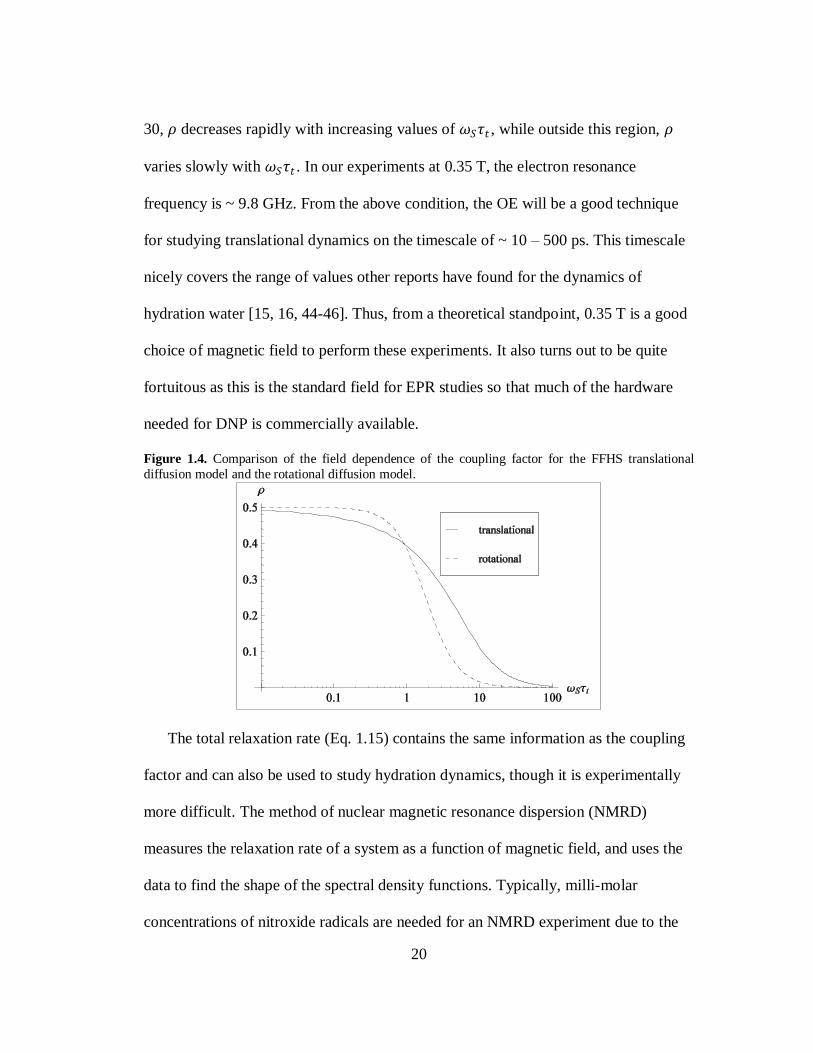
20
30, 𝜌 decreases rapidly with increasing values of 𝜔𝑆𝜏𝑡 , while outside this region, 𝜌
varies slowly with 𝜔𝑆𝜏𝑡 . In our experiments at 0.35 T, the electron resonance
frequency is ~ 9.8 GHz. From the above condition, the OE will be a good technique
for studying translational dynamics on the timescale of ~ 10 – 500 ps. This timescale
nicely covers the range of values other reports have found for the dynamics of
hydration water [15, 16, 44-46]. Thus, from a theoretical standpoint, 0.35 T is a good
choice of magnetic field to perform these experiments. It also turns out to be quite
fortuitous as this is the standard field for EPR studies so that much of the hardware
needed for DNP is commercially available.
Figure 1.4. Comparison of the field dependence of the coupling factor for the FFHS translational
diffusion model and the rotational diffusion model.
The total relaxation rate (Eq. 1.15) contains the same information as the coupling
factor and can also be used to study hydration dynamics, though it is experimentally
more difficult. The method of nuclear magnetic resonance dispersion (NMRD)
measures the relaxation rate of a system as a function of magnetic field, and uses the
data to find the shape of the spectral density functions. Typically, milli-molar
concentrations of nitroxide radicals are needed for an NMRD experiment due to the
21
concentration dependence of the relaxation rate. The solubility of proteins is generally
lower than this, so it is difficult to generate much contrast in the field dependence of
the relaxation data. DNP, on the other hand, is still a viable technique as the contrast
generated is the 1H NMR signal enhancement, and concentrations as low as 50 𝜇M of
nitroxide radicals can still give measurable enhancement [18]. However, NMRD is a
widely used and powerful technique because the relaxation curves can be used to
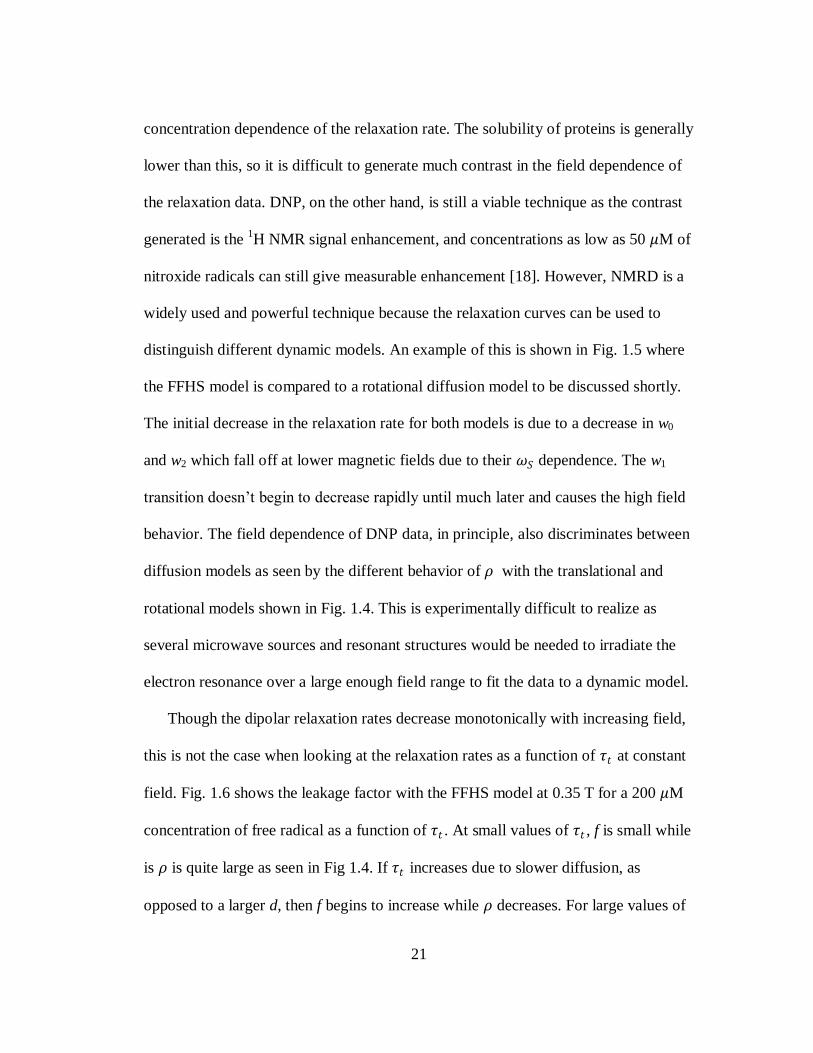
distinguish different dynamic models. An example of this is shown in Fig. 1.5 where
the FFHS model is compared to a rotational diffusion model to be discussed shortly.
The initial decrease in the relaxation rate for both models is due to a decrease in w0
and w2 which fall off at lower magnetic fields due to their 𝜔𝑆 dependence. The w1
transition doesn‘t begin to decrease rapidly until much later and causes the high field
behavior. The field dependence of DNP data, in principle, also discriminates between
diffusion models as seen by the different behavior of 𝜌 with the translational and
rotational models shown in Fig. 1.4. This is experimentally difficult to realize as
several microwave sources and resonant structures would be needed to irradiate the
electron resonance over a large enough field range to fit the data to a dynamic model.
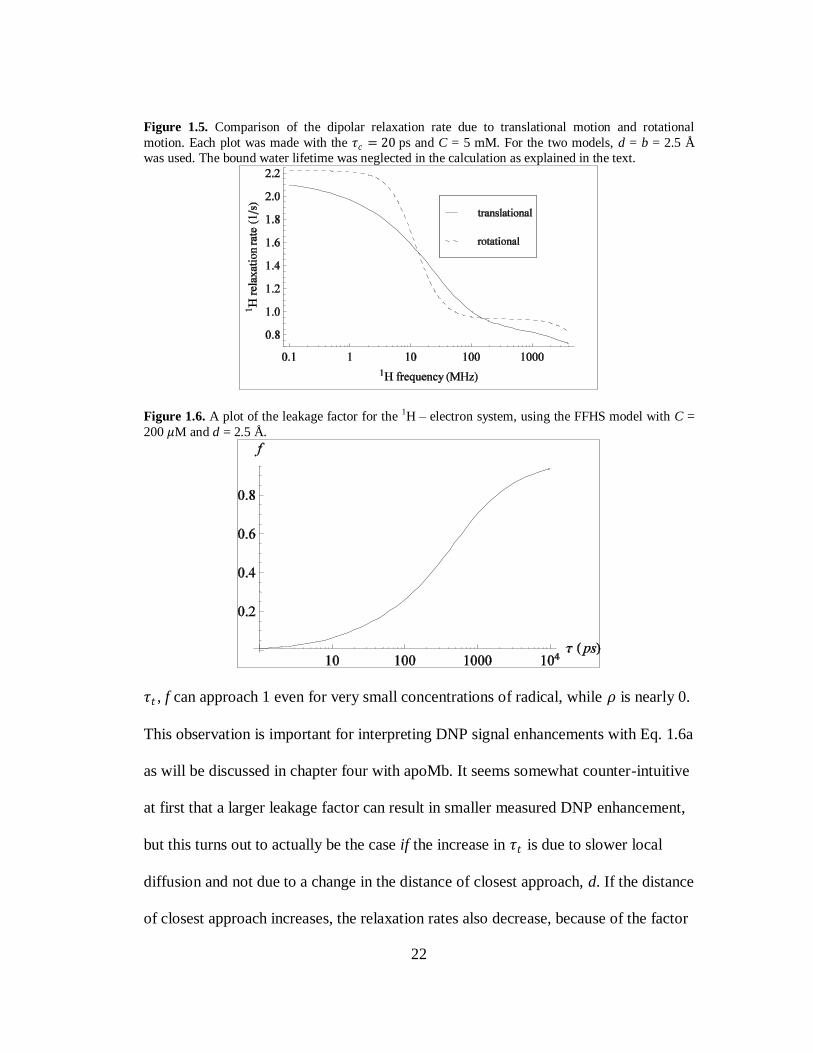
Though the dipolar relaxation rates decrease monotonically with increasing field,
this is not the case when looking at the relaxation rates as a function of 𝜏𝑡 at constant
field. Fig. 1.6 shows the leakage factor with the FFHS model at 0.35 T for a 200 𝜇M
concentration of free radical as a function of 𝜏𝑡 . At small values of 𝜏𝑡 , f is small while
is 𝜌 is quite large as seen in Fig 1.4. If 𝜏𝑡 increases due to slower diffusion, as
opposed to a larger d, then f begins to increase while 𝜌 decreases. For large values of
22
Figure 1.5. Comparison of the dipolar relaxation rate due to translational motion and rotational
motion. Each plot was made with the 𝜏𝑐 = 20 ps and C = 5 mM. For the two models, d = b = 2.5 Å
was used. The bound water lifetime was neglected in the calculation as explained in the text.
Figure 1.6. A plot of the leakage factor for the 1H – electron system, using the FFHS model with C =
200 𝜇M and d = 2.5 Å.
𝜏𝑡 , f can approach 1 even for very small concentrations of radical, while 𝜌 is nearly 0.
This observation is important for interpreting DNP signal enhancements with Eq. 1.6a
as will be discussed in chapter four with apoMb. It seems somewhat counter-intuitive
at first that a larger leakage factor can result in smaller measured DNP enhancement,
but this turns out to actually be the case if the increase in 𝜏𝑡 is due to slower local
diffusion and not due to a change in the distance of closest approach, d. If the distance
of closest approach increases, the relaxation rates also decrease, because of the factor
23
of 1/d3 in Eq. 1.15. Therefore, a decrease in 𝜌 that is associated with an increase in f
is likely due to slower local diffusion while a decrease in 𝜌 accompanied by a similar
or smaller f is more likely caused by an increase in d.
It is appropriate to briefly discuss dipolar relaxation mediated by rotational
motion as some proteins are known to have strongly bound water molecules that
tumble with the protein as a whole [47]. In this case, the distance between the e- and
1H nuclear spins is taken to be a constant and Hd is modulated by rotational diffusion.
The relaxation rate is given in 1.17a [42],
1
𝑇1=
𝑃𝑚𝑇1𝑚 + 𝜏𝑚
(1.17a)
1
𝑇1𝑚=
𝛾𝐼2𝛾𝑆
2ℏ2
10𝑏6𝜏𝑐 7𝑗 𝜔𝑆 , 𝜏𝑐 + 3𝑗 𝜔𝐼 , 𝜏𝑐 (1.17b)
𝑗 𝜔, 𝜏 =1
1 + 𝜔2𝜏2 (1.17c)
1
𝜏𝑐=
1
𝜏𝑟+
1
𝜏𝑚 (1.17d)
where 𝑃𝑚 is the mole fraction of bound water, which is proportional to concentration,
b is the distance between the two spins when bound, 𝜏𝑚 is the lifetime of bound
water, 𝜏𝑟 is the rotational correlation time of the bound complex, and 1/𝑇1𝑚 is 1H
relaxation rate in the bound complex. It has already been assumed in Eq. 1.17 that the
spin of the electron is ½ and 𝜔𝑆 ≫ 𝜔𝐼 . Though the rotational model appears
somewhat complicated because we have to account for the lifetime of the bound
complex, it is often the case that 1/𝜏𝑟 ≪ 1 𝜏𝑚 ≪ 1 𝑇1𝑚 so that 𝜏𝑚 can be ignored.
From Figs. 1.4 and 1.5, we can see that the spectral density function for rotational
24
motion remains fairly constant until higher fields than in the translational model, but
then falls off much more rapidly as the magnetic field is increased. Because of this
different behavior, NMRD experiments are useful for evaluating different relaxation
models and will be done in the next chapter. Combining the two models for mixed
modes of relaxation can be done by adding the relaxation rates together: 1 𝑇1 =
1 𝑇1 𝐹𝐹𝐻𝑆 + 1 𝑇1 𝑅 + 1 𝑇10 .
As a final note for this section, it is now clear as to why the OE, though
discovered in 1953, has not found widespread use in NMR spectroscopy (unlike the
nuclear OE that is a standard technique in NMR). The coupling factor rapidly
decreases at higher magnetic fields, and small sample volumes must be used to avoid
dielectric absorption. The DNP signal enhancements at high field are not substantial
enough to overcome the loss in sample volume or hardware difficulties. However, our
focus is not on increasing absolute sensitivity, but on gaining information on the
dynamics between the two spin bearing molecules. As the preceding discussion has
shown, and chapters two through four will prove, DNP is well suited for this role.
D. Spin Labeled Electron Paramagnetic Resonance
Electron paramagnetic resonance using nitroxide spin labels (often referred to as
electron spin resonance, ESR, with organic radicals) is widely used to study the
structure and dynamics of biological systems [48]. Unlike NMR, EPR is not limited
by the size of the paramagnetic label or spin labeled protein and can be used with 𝜇M
sample concentrations. Hence, many proteins that are inaccessible to NMR can be
studied with EPR. The same will be true for measuring hydration dynamics with DNP
25
since the 1H NMR signal of water, and not that of the protein, is being measured. EPR
is also sensitive to a faster dynamic timescale than NMR due to the larger Larmor
frequency of the electron spin. Protein conformational motions in the 𝜇s timescale,
for example, are averaged in a NMR experiment, but show up as distinct peaks or
changes in the lineshape of an X-band EPR spectrum. As our proposed method of
measuring local water dynamics with DNP relies on spin labeled molecules, EPR is a
natural technique to employ in our study of these systems. In chapter four we show
how the two methods give quite complementary information and can be used together
to narrow the possible interpretations of the results for complex systems. One
important point is that EPR spectra are usually taken in continuous wave, meaning the
sample is irradiated with low power microwaves at constant frequency while the B0
field is swept slowly. A direct absorption peak could be measured, but to increase
sensitivity, the B0 field is usually modulated at 10—100 kHz and the signal detected
with a lock—in amplifier. The resulting spectrum is the derivative of the absorption
signal and most EPR spectra presented in this dissertation are derivative spectra.
The electron g and A tensor values (A being the strength of the hyperfine
interaction with the 14
N nucleus) of a nitroxide radical are anisotropic since the
unpaired electron resides in a p-orbital. For fast rotational motion, (tens to hundreds
of ps at 0.35 T) the g and A values are averaged, and the spectrum appears isotropic
as in Fig. 1.2. As the tumbling of the nitroxide slows, the anisotropic values for g and
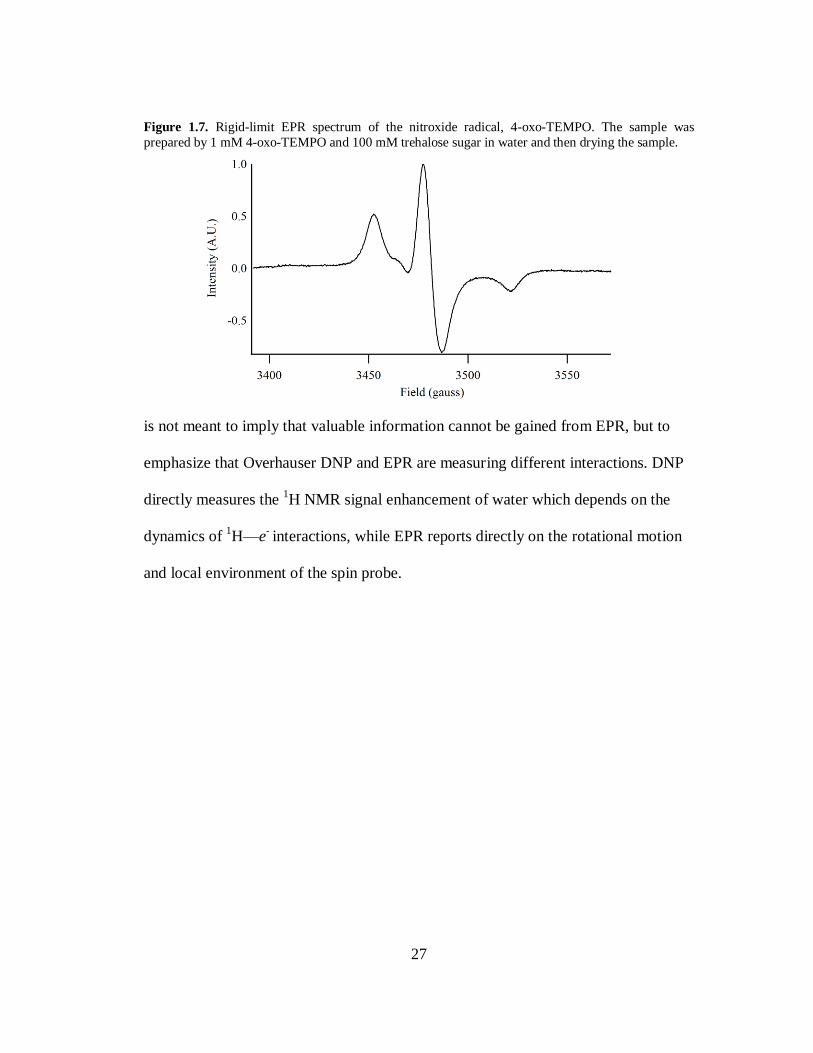
A result in line broadening and spreading out of the spectrum. A rigid-limit powder
spectrum of a nitroxide, shown in Fig 1.7, is drastically different from the liquid
26
spectrum in Fig 1.2. Thus, an EPR spectrum can be used to estimate rotational motion
of molecules occurring on the nanosecond timescale at X-band. Additionally, the g
and A tensor values depend on the local environment of the nitroxide. Azz in particular
is sensitive to local polarity [49-51]. Much effort has been put into calculating and
fitting EPR spectra to gain information about the local dynamics of the molecule the
label is attached to, such as protein backbone dynamics. This is not a trivial matter as
there are many free parameters. In addition to g-values, A-values, and rotational
motion, the lineshape can also be influenced by unresolved hyperfine couplings and
local order parameters. At X-band excitation frequencies where most EPR is done,
there is significant spectral overlap of these quantities, and care must taken when
fitting spectra and interpreting results. Nevertheless, the importance of spin labeled
EPR of biological samples with nitroxide radicals has motivated the development of
two programs to fit spectra, Easyspin [52] and NLSL [53-56]. Details of the fitting
procedure will be given in chapter four where we use NLSL to estimate the local
motions and polarity of apoMb.
Though an EPR spectrum contains a wealth of information about the local
environment of the spin label, it is not directly measuring water dynamics. Certainly
the rotational motion of the protein backbone is influenced by the motion of local
water, but the EPR spectra will also depend on whether the spin labeled residue is in
an 𝛼-helix, 𝛽-sheet, or an unstructured loop. Further, the spectrum is influenced by
the rigidity of the bond linking the nitroxide radical to the protein backbone [57]. This
27
Figure 1.7. Rigid-limit EPR spectrum of the nitroxide radical, 4-oxo-TEMPO. The sample was
prepared by 1 mM 4-oxo-TEMPO and 100 mM trehalose sugar in water and then drying the sample.
is not meant to imply that valuable information cannot be gained from EPR, but to
emphasize that Overhauser DNP and EPR are measuring different interactions. DNP
directly measures the 1H NMR signal enhancement of water which depends on the
dynamics of 1H—e
- interactions, while EPR reports directly on the rotational motion
and local environment of the spin probe.
28
II. The Overhauser effect with nitroxide radicals
A. Introduction
Nitroxide radicals have been used in liquid DNP studies for over 30 years and are
commonly used in proton—electron double resonance imaging experiments [58-64].
Two of the advantages of these radicals are their stability and that they can be
functionalized for different applications. For example, the amine (NH2) group of 4-
Amino Tempo shown in Fig 1.2 can be replaced by a hydroxyl or carboxyl group, as
well as many other functional groups. This is very useful for attaching nitroxides to
various molecules as local spin probes. Due to their usefulness in DNP experiments,
several studies have been performed to quantify which radicals of this family have the
largest coupling factor [65-67]. However, the results of these studies have varied
greatly with values of 𝜌 ranging from ~ 0.2 to larger than the theoretical maximum of
0.5. The differences are not consistent with the experiments being done at different
magnetic fields. All three of these studies were done at low magnetic fields in the
range of 6 to 15 mT. In this field range, 𝜌 should be varying only slowly with
increasing field, and dramatic differences should not be observed (see Fig 1.4). There
is also no explanation for a measured 𝜌 > 0.5. Common to these studies was the use
of Eq. 2.1 for the saturation factor
𝑠 =1
3
𝛼𝑃
1 + 𝛼𝑃 (2.1).
To account for variances in applied power, the DNP enhancement is measured as a
function of power, and the result extrapolated to infinite power. Thus we define
29
𝐸max = 𝐸 𝑃 → ∞ = 1 − 𝜌𝑓𝑠max
𝛾𝑆
𝛾𝐼 (2.2)
where 𝑠max = ⅓ from Eq. 2.1. The leakage factor depends on the radical
concentration through Eq. 1.9, but can be measured and accounted for with Eq. 1.8.
Thus, no matter what concentration of radical is used, Eq. 2.2 can be used to find 𝜌.
As we show in the Results and Discussion section, this method fails for nitroxide
radicals. The three hyperfine lines of the nitroxide radical are not independent, but are
coupled through collision induced electron spin exchange and through rapid
relaxation of the 14
N nucleus of the nitroxide due to slow molecular tumbling [68]. A
model for the saturation factor taking into account e- spin exchange was originally
proposed in 1977 by Bates and Drozdoski [69] in a rarely cited paper that I will
discuss shortly. We show that this model works very well for nitroxides dissolved
freely in solution, but does not explain our experimental results of spin labeled
proteins and gels. These results require a model incorporating nitrogen nuclear spin
relaxation into the saturation factor. It is important to note that in none of the studies
investigating the coupling factor mentioned above (one as recent as 2006), did the
authors use the work of Bates and Drozdoski in explaining their experimental data.
Though nitroxide radicals were being widely used in Overhauser DNP experiments,
and effort was being put into determining the ones that gave the best performance, a
thorough investigation into these radicals and a quantitative understanding was
lacking.
We also apply the FFHS model to the DNP and NMRD results as a check on the
validity of this model. Our results show that the FFHS model fits the NMRD data
30
well. However, there is an unresolved discrepancy between the DNP and NMRD
analysis. These experiments are important for showing that DNP can be used to gain
information on hydration dynamics and for evaluating the limitations of the
technique. Finally, we compare the DNP, NMRD, and molecular dynamics (MD)
simulations results of two widely used types of nitroxide radicals; a pyrroline (5-
membered ring) based and piperidine (6-membered ring) based ring structure. We
show that the change in ring structure does not measurably change the coupling factor
or relaxation behavior. This is relevant because a particular structure can be chosen
for spin labels based on symmetry or ease of chemical modification, and the DNP
results can still be compared. For example, 5-membered rings are usually used as spin
labels for proteins and lipid tail groups, while 6-membered rings are often used on
poly-electrolytes and lipid head groups. Additionally, our MD experiments discussed
below show that the local diffusion coefficient of water is unaffected by the presence
of the nitroxide radical. Hence, the measured DNP enhancements reflect the actual
timescale of water diffusion and are not significantly perturbed by the spin label.
B. A new model describing the saturation factor
Bates and Drozdoski proposed that collision based electron spin exchange mixes
the three hyperfine lines of a nitroxide radical. Since spin exchange requires a
collision between two radicals, the effect will depend on concentration. Instead of
assuming the simple four level model of Fig. 1.1, all three hyperfine states must be
included. The new 12-level model is shown in figure 2.1 along with the possible
exchange transitions with rate, 𝜅 = 𝜅′𝐶. Only exchange transitions involving
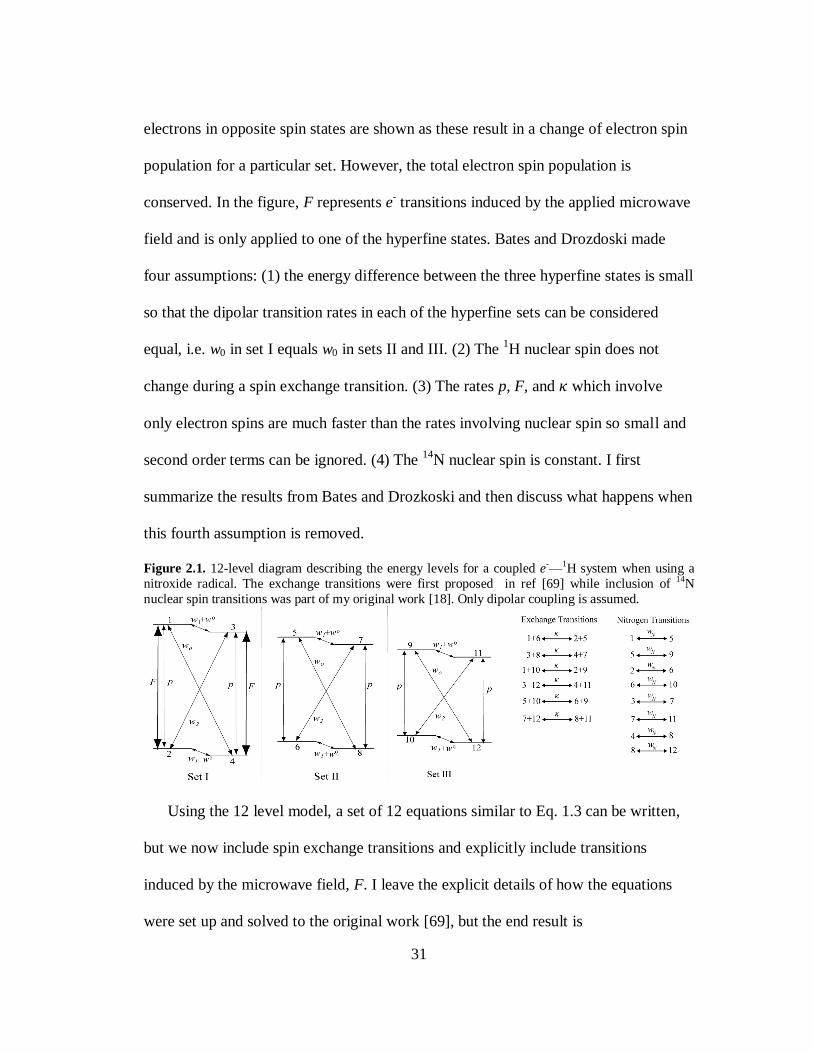
31
electrons in opposite spin states are shown as these result in a change of electron spin
population for a particular set. However, the total electron spin population is
conserved. In the figure, F represents e- transitions induced by the applied microwave
field and is only applied to one of the hyperfine states. Bates and Drozdoski made
four assumptions: (1) the energy difference between the three hyperfine states is small
so that the dipolar transition rates in each of the hyperfine sets can be considered
equal, i.e. w0 in set I equals w0 in sets II and III. (2) The 1H nuclear spin does not
change during a spin exchange transition. (3) The rates p, F, and 𝜅 which involve
only electron spins are much faster than the rates involving nuclear spin so small and
second order terms can be ignored. (4) The 14
N nuclear spin is constant. I first
summarize the results from Bates and Drozkoski and then discuss what happens when
this fourth assumption is removed.
Figure 2.1. 12-level diagram describing the energy levels for a coupled e-—1H system when using a
nitroxide radical. The exchange transitions were first proposed in ref [69] while inclusion of 14N
nuclear spin transitions was part of my original work [18]. Only dipolar coupling is assumed.
Using the 12 level model, a set of 12 equations similar to Eq. 1.3 can be written,
but we now include spin exchange transitions and explicitly include transitions
induced by the microwave field, F. I leave the explicit details of how the equations
were set up and solved to the original work [69], but the end result is
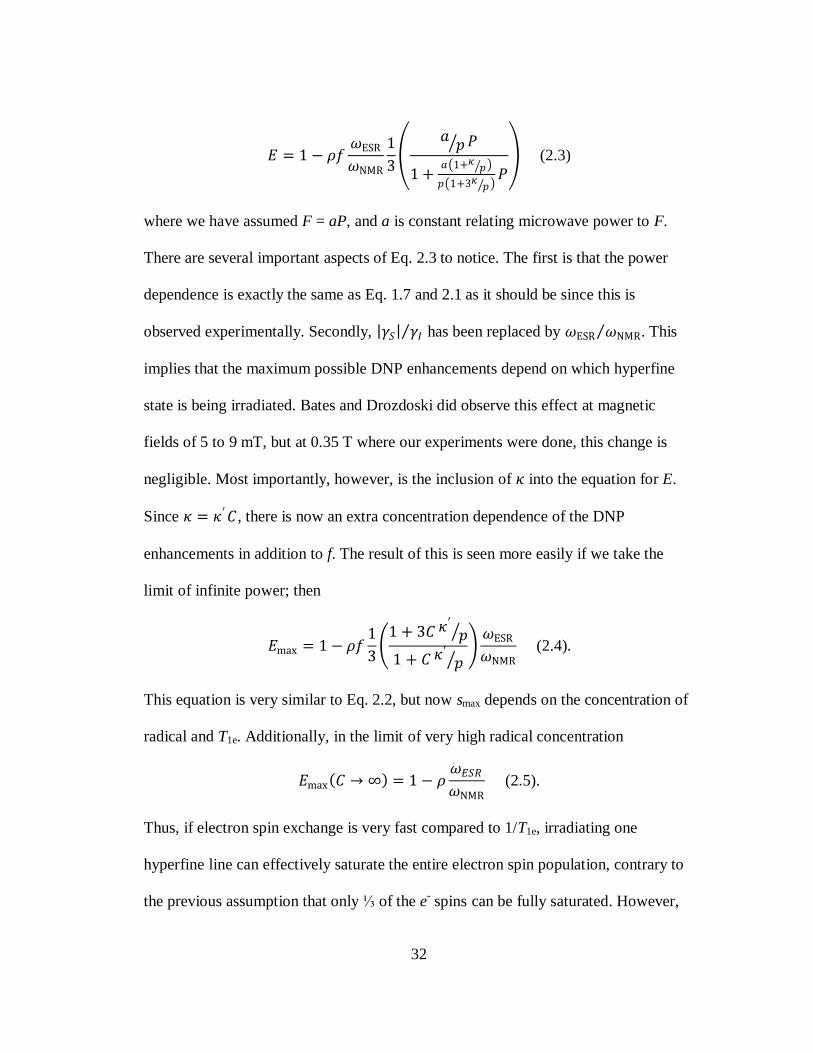
32
𝐸 = 1 − 𝜌𝑓𝜔ESR
𝜔NMR
1
3
𝑎𝑝 𝑃
1 +𝑎 1+𝜅
𝑝
𝑝 1+3𝜅𝑝
𝑃 (2.3)
where we have assumed F = aP, and a is constant relating microwave power to F.
There are several important aspects of Eq. 2.3 to notice. The first is that the power
dependence is exactly the same as Eq. 1.7 and 2.1 as it should be since this is
observed experimentally. Secondly, 𝛾𝑆 𝛾𝐼 has been replaced by 𝜔ESR 𝜔NMR . This
implies that the maximum possible DNP enhancements depend on which hyperfine
state is being irradiated. Bates and Drozdoski did observe this effect at magnetic
fields of 5 to 9 mT, but at 0.35 T where our experiments were done, this change is
negligible. Most importantly, however, is the inclusion of 𝜅 into the equation for E.
Since 𝜅 = 𝜅′𝐶, there is now an extra concentration dependence of the DNP
enhancements in addition to f. The result of this is seen more easily if we take the
limit of infinite power; then
𝐸max = 1 − 𝜌𝑓1
3
1 + 3𝐶 𝜅′
𝑝
1 + 𝐶 𝜅′𝑝
𝜔ESR
𝜔NMR (2.4).
This equation is very similar to Eq. 2.2, but now smax depends on the concentration of
radical and T1e. Additionally, in the limit of very high radical concentration
𝐸max 𝐶 → ∞ = 1 − 𝜌𝜔𝐸𝑆𝑅
𝜔NMR (2.5).
Thus, if electron spin exchange is very fast compared to 1/T1e, irradiating one
hyperfine line can effectively saturate the entire electron spin population, contrary to
the previous assumption that only ⅓ of the e- spins can be fully saturated. However,
33
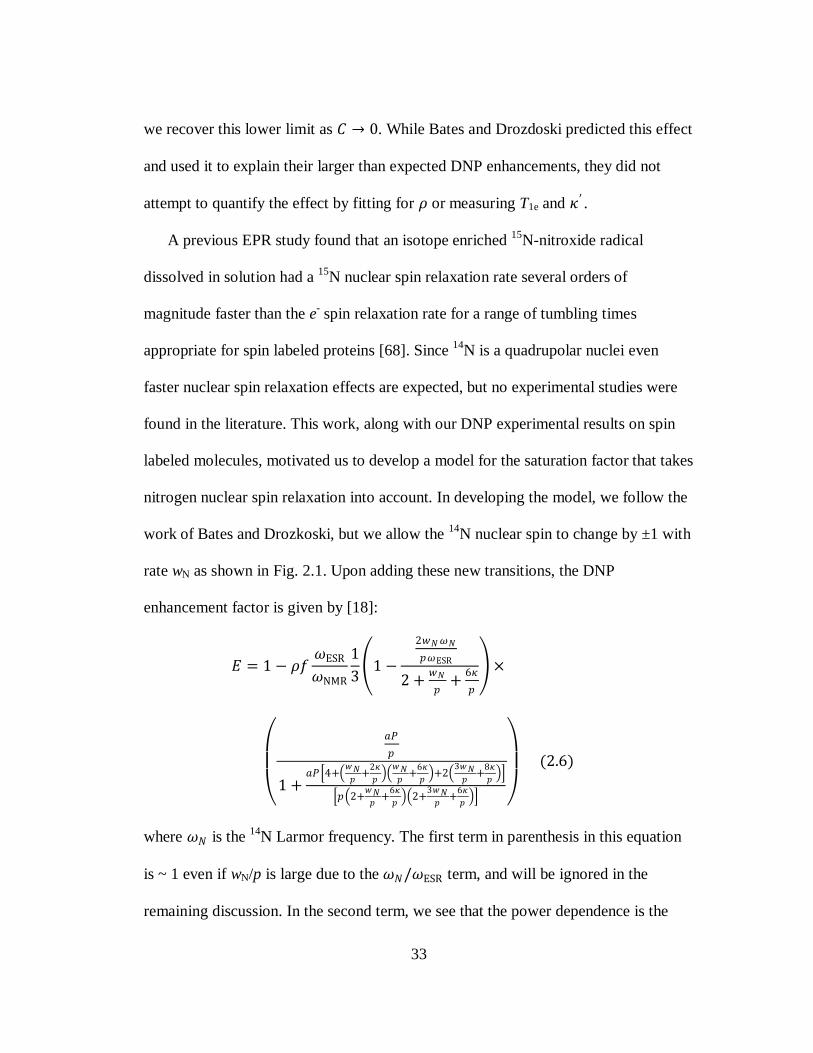
we recover this lower limit as 𝐶 → 0. While Bates and Drozdoski predicted this effect
and used it to explain their larger than expected DNP enhancements, they did not
attempt to quantify the effect by fitting for 𝜌 or measuring T1e and 𝜅′ .
A previous EPR study found that an isotope enriched 15
N-nitroxide radical
dissolved in solution had a 15
N nuclear spin relaxation rate several orders of
magnitude faster than the e- spin relaxation rate for a range of tumbling times
appropriate for spin labeled proteins [68]. Since 14
N is a quadrupolar nuclei even
faster nuclear spin relaxation effects are expected, but no experimental studies were
found in the literature. This work, along with our DNP experimental results on spin
labeled molecules, motivated us to develop a model for the saturation factor that takes
nitrogen nuclear spin relaxation into account. In developing the model, we follow the
work of Bates and Drozkoski, but we allow the 14
N nuclear spin to change by ±1 with
rate wN as shown in Fig. 2.1. Upon adding these new transitions, the DNP
enhancement factor is given by [18]:
𝐸 = 1 − 𝜌𝑓𝜔ESR
𝜔NMR
1
3 1 −
2𝑤𝑁𝜔𝑁
𝑝𝜔ESR
2 +𝑤𝑁
𝑝+
6𝜅
𝑝
×
𝑎𝑃
𝑝
1 +𝑎𝑃 4+
𝑤𝑁𝑝
+2𝜅
𝑝
𝑤𝑁𝑝
+6𝜅
𝑝 +2
3𝑤𝑁𝑝
+8𝜅
𝑝
𝑝 2+𝑤𝑁𝑝
+6𝜅
𝑝 2+
3𝑤𝑁𝑝
+6𝜅
𝑝
(2.6)
where 𝜔𝑁 is the 14
N Larmor frequency. The first term in parenthesis in this equation
is ~ 1 even if wN/p is large due to the 𝜔𝑁/𝜔ESR term, and will be ignored in the
remaining discussion. In the second term, we see that the power dependence is the
34
same as Eq 2.3, agreeing with experimental results, but now the saturation factor
depends on the e- spin exchange rate, 1/T1e, and wN. In the limit of infinite power, the
maximum saturation factor becomes
𝑠max =1
3
2 +𝑤𝑁
𝑝+
6𝜅
𝑝 2 +
3𝑤𝑁
𝑝+
6𝜅
𝑝
4 + 𝑤𝑁
𝑝+
2𝜅
𝑝
𝑤𝑁
𝑝+
6𝜅
𝑝 + 2
3𝑤𝑁
𝑝+
8𝜅
𝑝 (2.7).
If wN is unimportant, then Eq. 2.7 reduces to the saturation factor of Eq. 2.4.
However, in the absence of any e- spin exchange we still have
𝑠max 𝜅 = 0 =1
3 2 +
𝑤𝑁
𝑝 2 +
3𝑤𝑁
𝑝
4 +6𝑤𝑁
𝑝+
𝑤𝑁
𝑝
2 (2.8).
Thus, if the nitroxide radical is tethered to a larger molecule to eliminate e- spin
exchange, smax can still approach 1 if wN >> p. A plot of Eq. 2.7 is shown in Fig 2.2.
As either 𝜅 or wN becomes large compared to p, smax approaches 1 due to efficient
mixing of the hyperfine states. As they both go to 0, smax reduces to ⅓ as expected.
Also, smax increases more rapidly with 𝜅/p than with wN/p. This is because an
exchange interaction is a bimolecular process involving two nitroxide radicals,
whereas nitrogen nuclear spin relaxation involves only one molecule.
Lastly, we also derived a saturation factor for a 15
N enriched nitroxide radical
where there are only two hyperfine states. The maximum saturation factor is
𝑠max( N) =1
2 1 +
𝑤𝑁
𝑝+
2𝜅
𝑝
1 +𝑤𝑁
2𝑝+
𝜅
𝑝
(2.9). 15
35
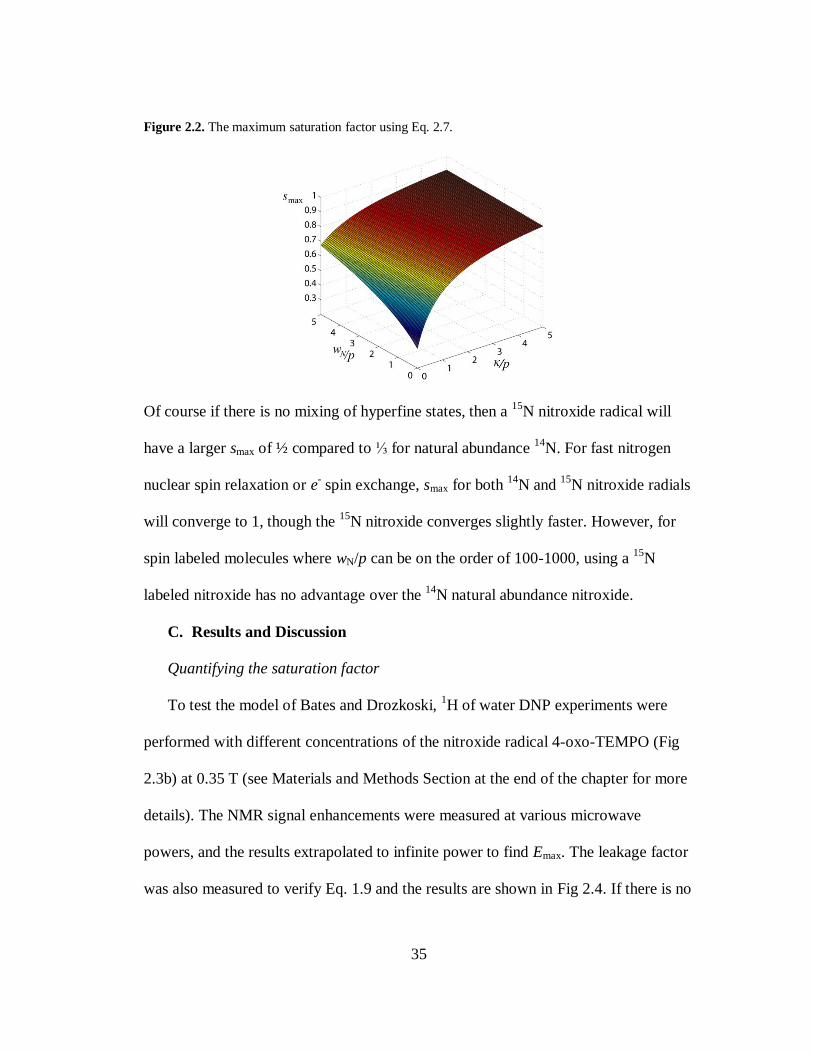
Figure 2.2. The maximum saturation factor using Eq. 2.7.
Of course if there is no mixing of hyperfine states, then a 15
N nitroxide radical will
have a larger smax of ½ compared to ⅓ for natural abundance 14
N. For fast nitrogen
nuclear spin relaxation or e- spin exchange, smax for both
14N and
15N nitroxide radials
will converge to 1, though the 15
N nitroxide converges slightly faster. However, for
spin labeled molecules where wN/p can be on the order of 100-1000, using a 15
N
labeled nitroxide has no advantage over the 14
N natural abundance nitroxide.
C. Results and Discussion
Quantifying the saturation factor
To test the model of Bates and Drozkoski, 1H of water DNP experiments were
performed with different concentrations of the nitroxide radical 4-oxo-TEMPO (Fig
2.3b) at 0.35 T (see Materials and Methods Section at the end of the chapter for more
details). The NMR signal enhancements were measured at various microwave
powers, and the results extrapolated to infinite power to find Emax. The leakage factor
was also measured to verify Eq. 1.9 and the results are shown in Fig 2.4. If there is no
36
mixing of the hyperfine states, then knowing Emax and f would be enough to
determine 𝜌 with Eq. 2.2 since all the concentration dependence is included in f. The
calculated coupling factors using this method are shown in Fig 2.5. Clearly 𝜌 is not
constant as would be expected if smax = ⅓. Also, 𝜌 was found to be greater than the
theoretical maximum for every concentration above 2 mM. The experimental data for
the leakage factor on the other hand, is accurately described by Eq. 1.9. Since f
depends on the same dipolar relaxation rates as 𝜌, with the addition of w0, and Eq. 1.9
fits the data for f well, it is unlikely that there is an unaccounted for dependence of 𝜌
on C. Thus we must re-examine the data using a model that incorporates mixing
between the different hyperfine states.
The rotational correlation time of nitroxide radicals freely dissolved in solution
(i.e. not being used as a spin label) is on the order of 20 ps and wN/p is expected to be
small [68, 71]. Thus, we can neglect wN/p in this case and use Eq. 2.4 to analyze the
DNP results. A plot of Emax vs. C for 4-oxo-TEMPO is shown in Fig. 2.6 (solid
circles; proxyl will be discussed below) and the data was fit to equation 2.4 with two
fit parameters, 𝜌 and 𝜅′/𝑝. The model fits the data well and gives 𝜌 = 0.22 ± 0.01 and
𝜅′/𝑝 = 1.0 ± 0.3. The electron spin exchange rate and relaxation time can be
measured independently to serve as a check for the validity of this model, and the
assumption that wN/p can be ignored. Note that 𝜌, however, can actually be found
from this method without measuring the leakage factor, spin exchange rate, or T1e.
37
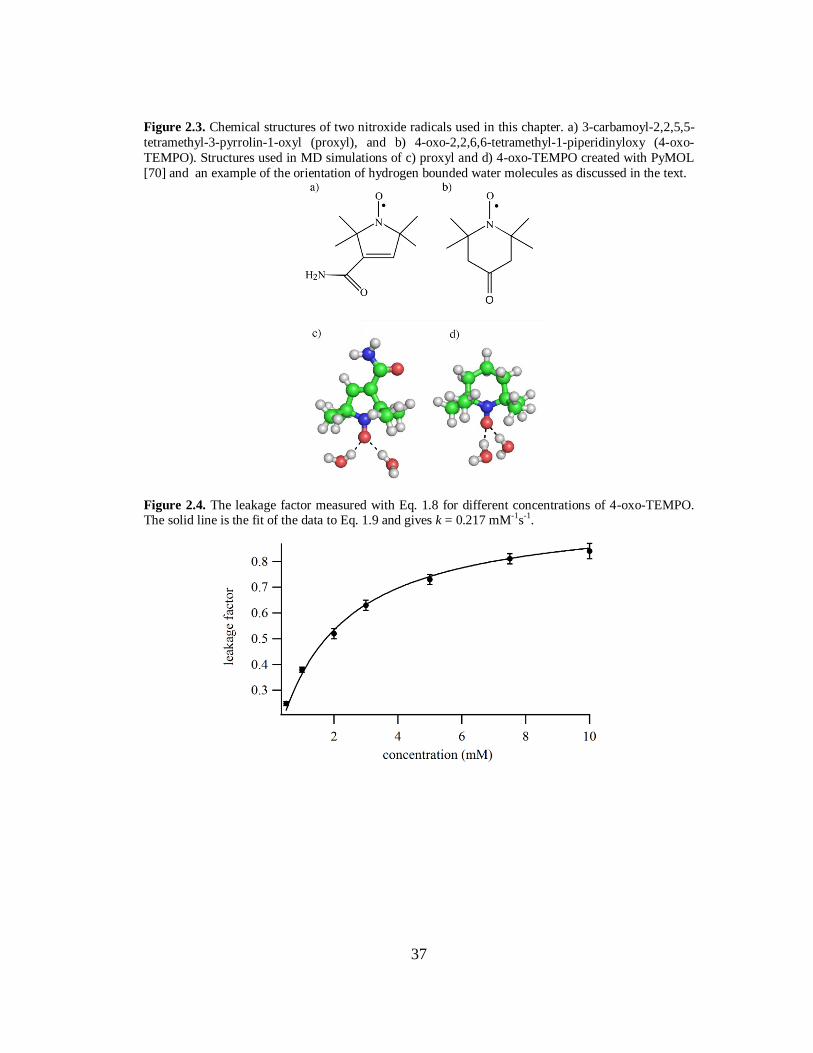
Figure 2.3. Chemical structures of two nitroxide radicals used in this chapter. a) 3-carbamoyl-2,2,5,5-
tetramethyl-3-pyrrolin-1-oxyl (proxyl), and b) 4-oxo-2,2,6,6-tetramethyl-1-piperidinyloxy (4-oxo-
TEMPO). Structures used in MD simulations of c) proxyl and d) 4-oxo-TEMPO created with PyMOL
[70] and an example of the orientation of hydrogen bounded water molecules as discussed in the text.
Figure 2.4. The leakage factor measured with Eq. 1.8 for different concentrations of 4-oxo-TEMPO. The solid line is the fit of the data to Eq. 1.9 and gives k = 0.217 mM-1s-1.
38
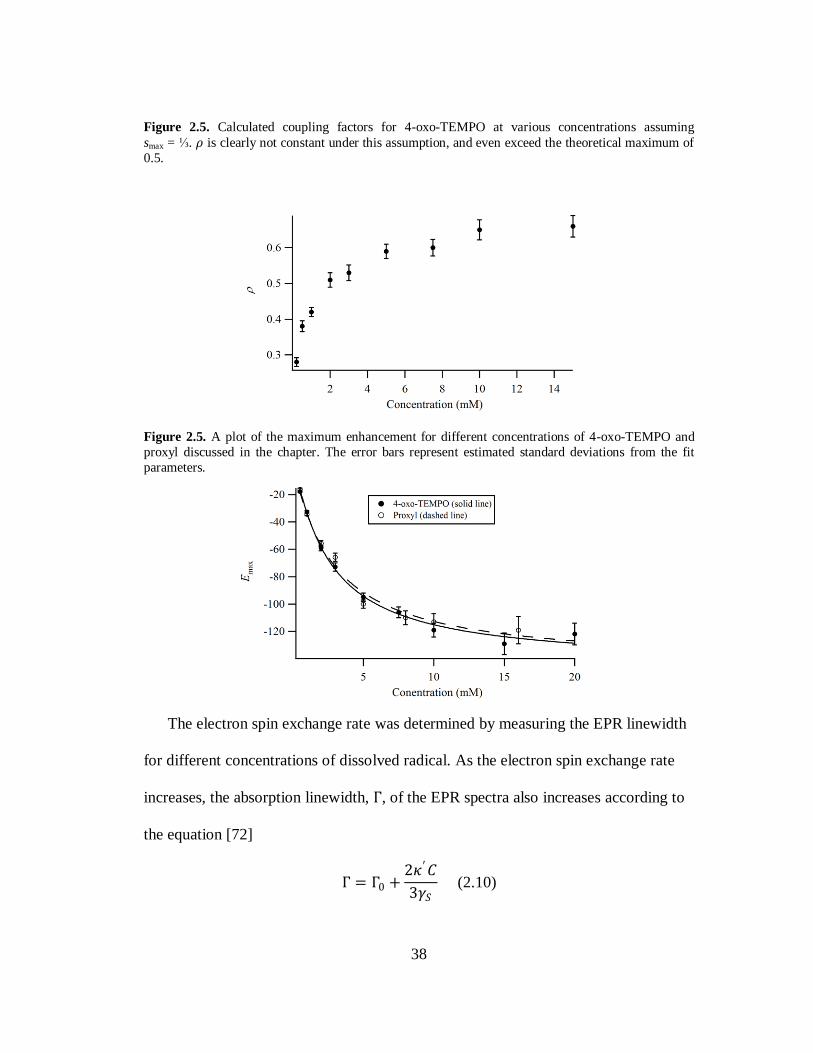
Figure 2.5. Calculated coupling factors for 4-oxo-TEMPO at various concentrations assuming
smax = ⅓. 𝜌 is clearly not constant under this assumption, and even exceed the theoretical maximum of
0.5.
Figure 2.5. A plot of the maximum enhancement for different concentrations of 4-oxo-TEMPO and
proxyl discussed in the chapter. The error bars represent estimated standard deviations from the fit
parameters.
The electron spin exchange rate was determined by measuring the EPR linewidth
for different concentrations of dissolved radical. As the electron spin exchange rate
increases, the absorption linewidth, Γ, of the EPR spectra also increases according to
the equation [72]
Γ = Γ0 +2𝜅′𝐶
3𝛾𝑆 (2.10)
39
where Γ0 is the linewidth in the limit of no spin exchange, and the factor of ⅔ is
needed because ⅓ of all collisions will involve nitroxides that have the same 14
N spin
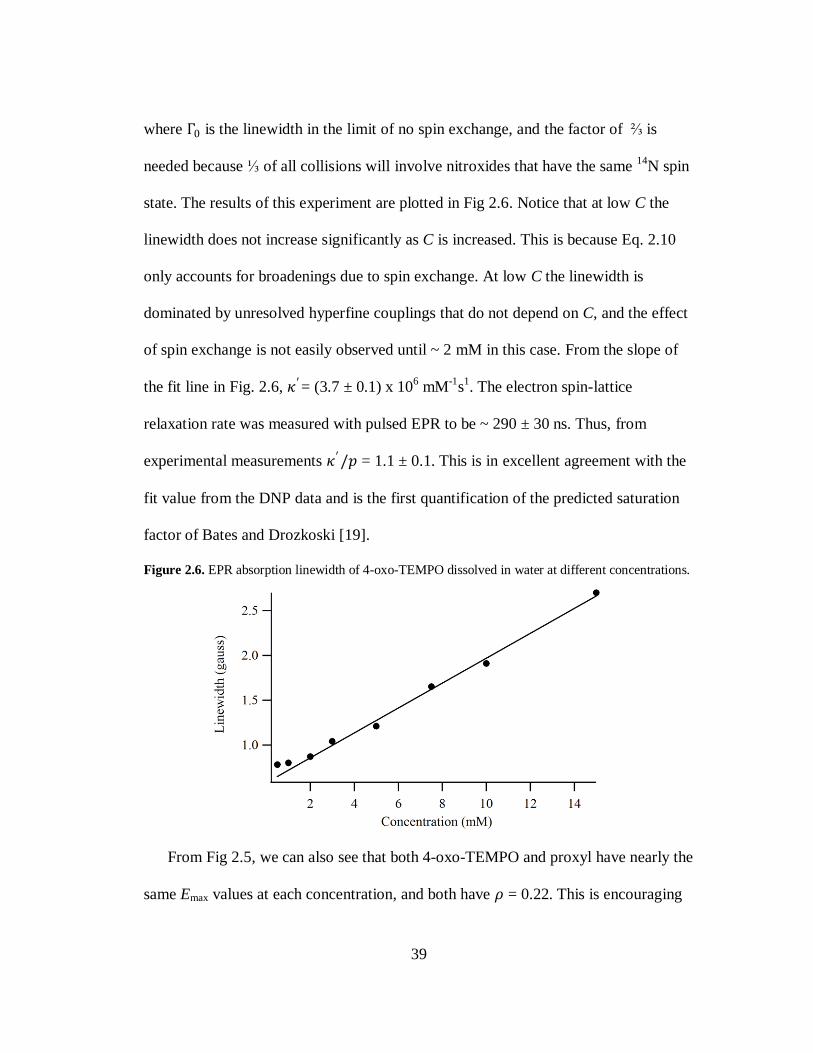
state. The results of this experiment are plotted in Fig 2.6. Notice that at low C the
linewidth does not increase significantly as C is increased. This is because Eq. 2.10
only accounts for broadenings due to spin exchange. At low C the linewidth is
dominated by unresolved hyperfine couplings that do not depend on C, and the effect
of spin exchange is not easily observed until ~ 2 mM in this case. From the slope of
the fit line in Fig. 2.6, 𝜅′= (3.7 ± 0.1) x 106 mM
-1s
1. The electron spin-lattice
relaxation rate was measured with pulsed EPR to be ~ 290 ± 30 ns. Thus, from
experimental measurements 𝜅′/𝑝 = 1.1 ± 0.1. This is in excellent agreement with the
fit value from the DNP data and is the first quantification of the predicted saturation
factor of Bates and Drozkoski [19].
Figure 2.6. EPR absorption linewidth of 4-oxo-TEMPO dissolved in water at different concentrations.
From Fig 2.5, we can also see that both 4-oxo-TEMPO and proxyl have nearly the
same Emax values at each concentration, and both have 𝜌 = 0.22. This is encouraging
40
as it implies that we can compare DNP results using either radical. This will be
further confirmed by the NMRD and MD simulations discussed below. We can
extract the timescale of translational motion from 𝜌 using the FFHS model with Eqns
1.14 and 1.16. Using 𝜌 = 0.22, and solving for the translational correlation time gives
𝜏𝑡 = 76 ps. This result will be discussed with the value for 𝜏𝑡 found from fitting the
NMRD data shortly.
Including only e- spin exchange into the saturation factor works well for nitroxide
radicals freely dissolved in solution, but when the radical is attached to a protein we
expect that collisions between nitroxide radicals will be eliminated. Hence, if nitrogen
nuclear spin relaxation is unimportant, then smax should be ⅓. Additionally, the
diffusion of water is expected to be slower near the surface of biomolecules, reducing
𝜌 from its bulk value. Thus, at any concentration, the value of 𝜌𝑠max for a spin labeled
molecule should be smaller than that for the free label. However, this was not
observed when attaching a nitroxide radical to the human protein isoform tau187
(details of this sample can be found in reference [73]). Table 2.1 compares the DNP
results for equal concentrations of 4-oxo-TEMPO free in solution and spin labeled
tau. The leakage factors were measured, so that the values of 𝜌𝑠max can be compared.
For 200 𝜇M tau, 𝜌𝑠max is greater than for 200 𝜇M 4-oxo-TEMPO. This result can
only be explained if the saturation factor is larger than ⅓. The increase in the
saturation factor cannot be due to e- spin exchange since the values of 𝜌𝑠max for 200
𝜇M and 1 mM spin labeled tau are equal, and thus 𝜌𝑠max is independent of
concentration. Thus, nitrogen nuclear spin relaxation must be mixing the electron
41
hyperfine state. Even if we were to assume the coupling factors for spin labeled tau
and 4-oxo-TEMPO in solution are equal, then smax for tau would be 0.64, so greater
than ⅓. This places a lower limit on smax because 𝜌 is likely smaller for spin labeled
tau due to slower diffusion of water near its surface than in bulk. In fact, using the
work of Robinson and coworkers, wN/p is likely to be so large that smax is very close
to 1 [23, 68]. This is an exciting result that had never before been predicted until our
2007 publication [18].
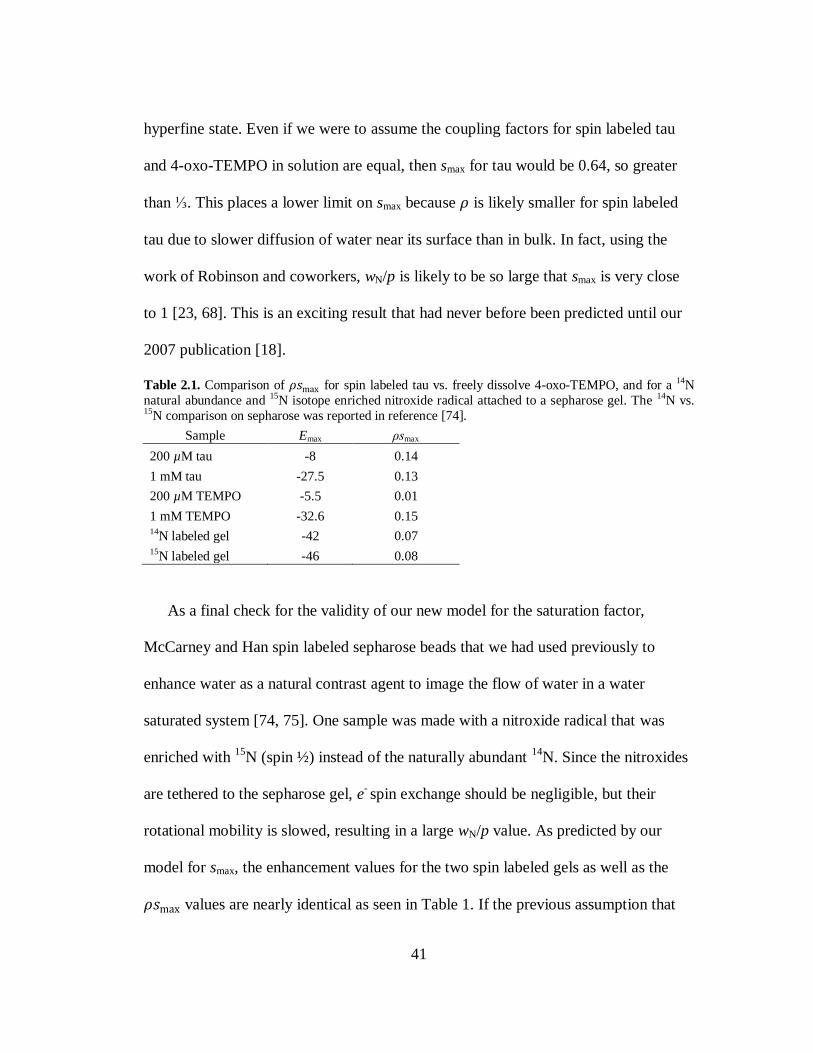
Table 2.1. Comparison of 𝜌𝑠max for spin labeled tau vs. freely dissolve 4-oxo-TEMPO, and for a 14N
natural abundance and 15N isotope enriched nitroxide radical attached to a sepharose gel. The 14N vs. 15N comparison on sepharose was reported in reference [74].
Sample Emax ρsmax
200 µM tau -8 0.14
1 mM tau -27.5 0.13
200 µM TEMPO -5.5 0.01
1 mM TEMPO -32.6 0.15 14N labeled gel -42 0.07 15N labeled gel -46 0.08
As a final check for the validity of our new model for the saturation factor,
McCarney and Han spin labeled sepharose beads that we had used previously to
enhance water as a natural contrast agent to image the flow of water in a water
saturated system [74, 75]. One sample was made with a nitroxide radical that was
enriched with 15
N (spin ½) instead of the naturally abundant 14
N. Since the nitroxides
are tethered to the sepharose gel, e- spin exchange should be negligible, but their
rotational mobility is slowed, resulting in a large wN/p value. As predicted by our
model for smax, the enhancement values for the two spin labeled gels as well as the
𝜌𝑠max values are nearly identical as seen in Table 1. If the previous assumption that
42
only one of the hyperfine states was affected by the microwave irradiation, the 15
N
nitroxide radical should give much larger enhancements, but this is not observed.
Again, this result can only be explained by efficient mixing of the electron hyperfine
states.
Evaluating the Force Free, Hard Sphere Model
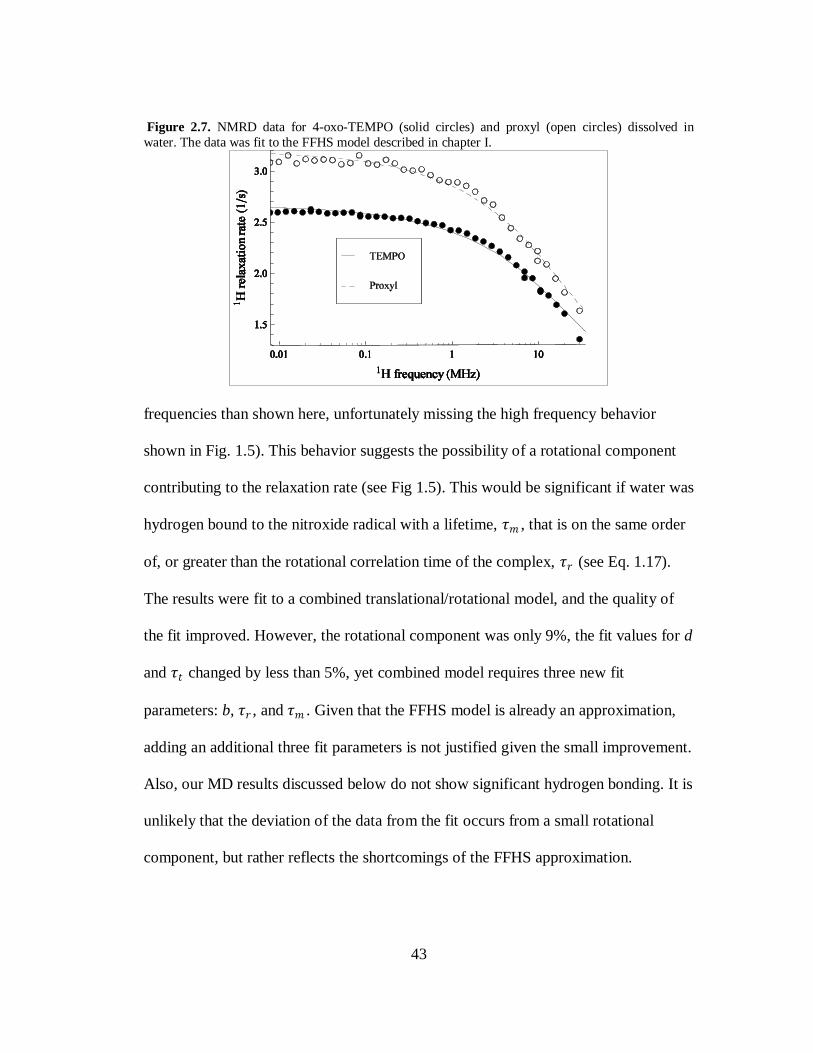
In chapter I, the theory of the FFHS model was discussed. Figure 2.7 shows the
1H relaxation rate of water with 5 mM of 4-oxo-TEMPO (solid circles) and 5 mM
proxyl (open circles) as a function of the 1H Larmor frequency. The data was fit to
FFHS model using Eq. 1.14 and Eq. 1.15. As seen in Fig 2.7, the FFHS model
approximates the experimental data well. The parameters for the two radicals are in
very good agreement with each other; for 4-oxo-TEMPO 𝜏𝑡 = 24 ps and d = 2.43 Å,
while for proxyl 𝜏𝑡 = 27 ps and d = 2.36 Å. We consider these differences
insignificant even though the data suggests that proxyl is more efficient at relaxing
the 1H of water. This is most likely due to an error in the measured concentrations as
a deviation of < 10% would account for this difference. These measurements are also
in very good agreement with previously published NMRD results of nitroxide
radicals [76, 77].
While the FFHS model approximates the relaxation data well, it is apparent that
for both nitroxide samples the 1H relaxation rate does not initially decrease as rapidly
as predicted. Further, at higher frequencies the data falls off more rapidly than
predicted by the fit (note that standard NMRD spectrometers do go to higher
43
Figure 2.7. NMRD data for 4-oxo-TEMPO (solid circles) and proxyl (open circles) dissolved in
water. The data was fit to the FFHS model described in chapter I.
frequencies than shown here, unfortunately missing the high frequency behavior
shown in Fig. 1.5). This behavior suggests the possibility of a rotational component
contributing to the relaxation rate (see Fig 1.5). This would be significant if water was
hydrogen bound to the nitroxide radical with a lifetime, 𝜏𝑚 , that is on the same order
of, or greater than the rotational correlation time of the complex, 𝜏𝑟 (see Eq. 1.17).
The results were fit to a combined translational/rotational model, and the quality of
the fit improved. However, the rotational component was only 9%, the fit values for d
and 𝜏𝑡 changed by less than 5%, yet combined model requires three new fit
parameters: b, 𝜏𝑟 , and 𝜏𝑚 . Given that the FFHS model is already an approximation,
adding an additional three fit parameters is not justified given the small improvement.
Also, our MD results discussed below do not show significant hydrogen bonding. It is
unlikely that the deviation of the data from the fit occurs from a small rotational
component, but rather reflects the shortcomings of the FFHS approximation.
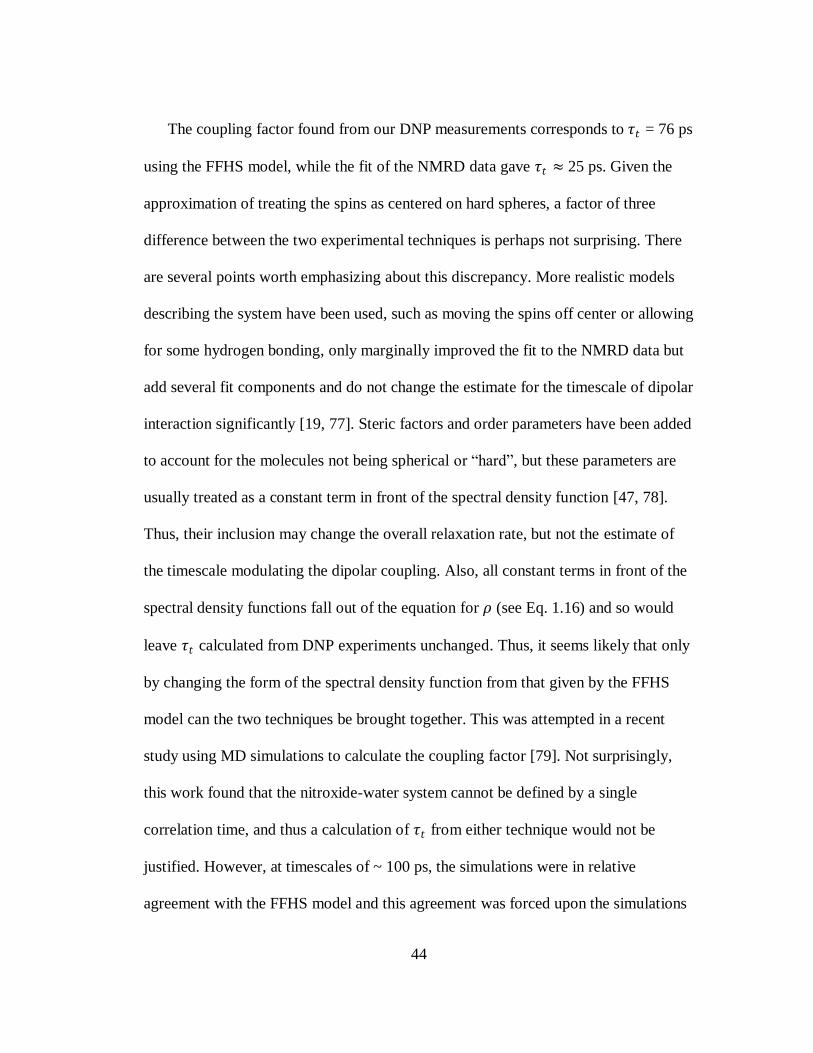
44
The coupling factor found from our DNP measurements corresponds to 𝜏𝑡 = 76 ps
using the FFHS model, while the fit of the NMRD data gave 𝜏𝑡 ≈ 25 ps. Given the
approximation of treating the spins as centered on hard spheres, a factor of three
difference between the two experimental techniques is perhaps not surprising. There
are several points worth emphasizing about this discrepancy. More realistic models
describing the system have been used, such as moving the spins off center or allowing
for some hydrogen bonding, only marginally improved the fit to the NMRD data but
add several fit components and do not change the estimate for the timescale of dipolar
interaction significantly [19, 77]. Steric factors and order parameters have been added
to account for the molecules not being spherical or ―hard‖, but these parameters are
usually treated as a constant term in front of the spectral density function [47, 78].
Thus, their inclusion may change the overall relaxation rate, but not the estimate of
the timescale modulating the dipolar coupling. Also, all constant terms in front of the
spectral density functions fall out of the equation for 𝜌 (see Eq. 1.16) and so would
leave 𝜏𝑡 calculated from DNP experiments unchanged. Thus, it seems likely that only
by changing the form of the spectral density function from that given by the FFHS
model can the two techniques be brought together. This was attempted in a recent
study using MD simulations to calculate the coupling factor [79]. Not surprisingly,
this work found that the nitroxide-water system cannot be defined by a single
correlation time, and thus a calculation of 𝜏𝑡 from either technique would not be
justified. However, at timescales of ~ 100 ps, the simulations were in relative
agreement with the FFHS model and this agreement was forced upon the simulations
45
at longer timescales. This implies that Overhauser DNP can still be used to find the
dynamics of water interacting with biological surfaces. DNP studies in the Han group
on lipid vesicles have found values of 𝜏𝑡 that are within a factor of two of those found
with NMRD on very similar systems (this time with DNP giving the smaller 𝜏𝑡 ),
suggesting that there is indeed better agreement as 𝜏𝑡 increases [22, 43]. It must be
stressed that the MD simulations in reference [79] are unique for the particular case of
a nitroxide dissolved in solution and offer no general method for studying local water
interactions. The FFHS model remains the most widely used model describing dipolar
relaxation due to translational diffusion [37, 42, 43, 77, 80, 81]. So even though the
FFHS model is known to be an approximation, given the lack of experimental
techniques, Overhauser DNP is still a promising method to study local hydration
dynamics whose applicability can be widened with improved dynamic models.
It has been proposed that NMRD should be used to calculate 𝜌 instead of DNP
due to complications with the saturation factor [76]. Our work on the saturation factor
above shows that s can be quantified, and DNP should be used for calculating 𝜌. Most
importantly, determining 𝜌 with DNP enhancements does not require a dynamic
model to invoked, unlike NMRD. Due to the discrepancy already discussed, NMRD
is unlikely to report an accurate coupling factor. Also, in situations where the FFHS
model is known to fail, DNP can still be used to gain qualitative information about
local dynamics. Further, NMRD usually requires milli-molar concentrations, so it is
not a viable technique for many proteins. Lastly, NMRD experiments are time
consuming, especially at low concentrations, and so cannot be used to monitor
46
changes in dynamics with time resolution as has been done with our DNP method
[25].
Molecular Dynamics Simulations
Our DNP and NMRD experimental results show that 4-oxo-TEMPO and proxyl
are very similar, and suggest that results from experiments using either 6-membered
or 5-membered ring nitroxide structures can be compared. However, a few questions
remain: does water near the radical have the same translational dynamics as the bulk,
is there significant hydrogen bonding of water to the nitroxide, and is the distance of
closest approach similar between the two nitroxide structures? To answer these
questions, MD simulations were performed on the two radicals, and the results are
summarized in Table 2.2. Our findings for proxyl are in are excellent agreement with
previous MD simulations carried out by Pavone and colleagues who used MD to
study the EPR properties of proxyl [82, 83]. There are small differences in the results
depending on the water model used (a 3-site SPC-E model and a 4-site TIP4P model;
see Materials and Methods at the end of this chapter), but the results for 4-oxo-
TEMPO and proxyl are within their estimated error, agreeing with our experimental
data. On average, two 1H nuclei are hydrogen bound to the nitroxide (from two
different water molecules, as shown in Fig. 2.3) but the lifetime is only on the order
of 4-6 ps. The rotational tumbling time of the molecule is ~ 26 ps [68, 71], so we are
justified in ignoring bound water when modeling the relaxation behavior as
mentioned above. The distance between the 1H of water and the center of mass
(COM) of the N-O bond (where the electron probability is highest) is the same for
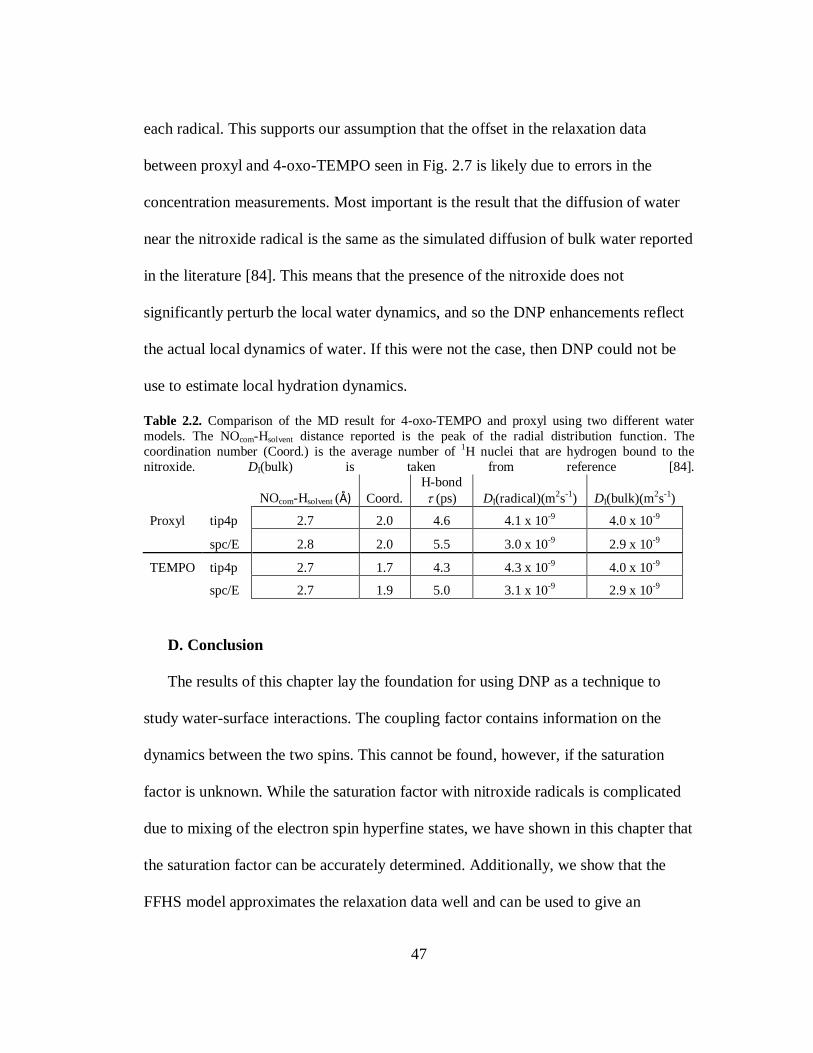
47
each radical. This supports our assumption that the offset in the relaxation data
between proxyl and 4-oxo-TEMPO seen in Fig. 2.7 is likely due to errors in the
concentration measurements. Most important is the result that the diffusion of water
near the nitroxide radical is the same as the simulated diffusion of bulk water reported
in the literature [84]. This means that the presence of the nitroxide does not
significantly perturb the local water dynamics, and so the DNP enhancements reflect
the actual local dynamics of water. If this were not the case, then DNP could not be
use to estimate local hydration dynamics.
Table 2.2. Comparison of the MD result for 4-oxo-TEMPO and proxyl using two different water
models. The NOcom-Hsolvent distance reported is the peak of the radial distribution function. The
coordination number (Coord.) is the average number of 1H nuclei that are hydrogen bound to the
nitroxide. DI(bulk) is taken from reference [84].
NOcom-Hsolvent (Å) Coord.
H-bond
(ps) DI(radical)(m2s-1) DI(bulk)(m2s-1)
Proxyl tip4p 2.7 2.0 4.6 4.1 x 10⁻⁹ 4.0 x 10⁻⁹
spc/E 2.8 2.0 5.5 3.0 x 10⁻⁹ 2.9 x 10⁻⁹
TEMPO tip4p 2.7 1.7 4.3 4.3 x 10⁻⁹ 4.0 x 10⁻⁹
spc/E 2.7 1.9 5.0 3.1 x 10⁻⁹ 2.9 x 10⁻⁹
D. Conclusion
The results of this chapter lay the foundation for using DNP as a technique to
study water-surface interactions. The coupling factor contains information on the
dynamics between the two spins. This cannot be found, however, if the saturation
factor is unknown. While the saturation factor with nitroxide radicals is complicated
due to mixing of the electron spin hyperfine states, we have shown in this chapter that
the saturation factor can be accurately determined. Additionally, we show that the
FFHS model approximates the relaxation data well and can be used to give an
48
estimate of the timescale modulation the 1H—e
- dipolar interaction. There remains an
unresolved discrepancy between the results obtained from DNP and NMRD. Given
the lack of experimental techniques available to study hydration water, we still expect
DNP to be a valuable tool in these studies. Rough estimates of the timescale of the
dipolar interaction can be obtained for systems such as spin labeled lipids and protein
surfaces where the FFHS model describes the data well. However, determining the
coupling factor from DNP does not rely on a dynamic model and can therefore give
qualitative information on hydration dynamics with site specificity even if the
dynamic model is not known. Lastly, our MD simulations show that the nitroxide
radical does not disturb the diffusion of local water molecules. This implies our DNP
enhancements will accurately reflect changes in local dynamics and are not affected
by the nitroxide spin probe. Further, the MD simulations show that hydrogen bonding
of water to the nitroxide probe is not significant and we are justified ignoring its
contribution when modeling DNP signal enhancements.
E. Materials and Methods
3-carbamoyl-2,2,5,5-tetramethyl-3-pyrrolin-1-oxyl (proxyl), and 4-oxo-2,2,6,6-
tetramethyl-1-piperidinyloxy (4-oxo-TEMPO) were purchased from Sigma-Aldrich.
4-oxo-TEMPO was initially dissolved at a high concentration in DMSO and then
diluted into water, the final solution containing at most 5% DMSO by volume. Proxyl
was dissolved directly into water. For DNP and EPR measurements, ~ 5 𝜇L of sample
was loaded into a 0.7 mm id capillary and sealed in beeswax. The sample was loaded
into a homebuilt NMR probe and placed inside a commercial Bruker TE102 X-band
49
cavity. NMR measurements were made with a Bruker Avance 300 NMR
spectrometer at a magnetic field of ~ 0.35 T. The center electron resonance was
irradiated with a high power, home built microwave amplifier described in the next
chapter. Cooling air was flowed over the sample to minimize heating. Maximum
enhancements were determined by fitting the enhancement vs. power data to
𝐸 = 𝐼0 +𝐴𝑃
1 + 𝐵𝑃 (2.11)
where I0, A, and B are fit parameters containing all the constants in Eq. 2.6. 𝐸max =
𝐼0 − 𝐴/𝐵. Igor Pro data analysis software was used to estimate errors in the fits.
For EPR linewidth analysis, the samples were prepared in the same way as for
DNP experiments, only the sample was not loaded into an NMR probe to avoid
possible linewidth distortions. 1H T1 inversion-recovery experiments were performed
at 0.35 T using a commercial Bruker BBFO 5 mm probe with ~ 200 𝜇L of sample to
determine the leakage factors for the different samples. NMRD measurements were
performed at the Technical University of Illmenau on a Stelar FFC 2000-1T field
cycling relaxometer and the data was fit in Mathematica. The electron spin relaxation
time, T1e, was measured on an ELEXYS pulsed X-band EPR spectrometer at Bruker
Biospin with inversion recovery and a 𝜋 pulse of 4 ns. The estimated error of 10% for
T1e arises from incomplete inversion off all three of the nitroxide hyperfine lines.
MD simulations were performed with the GROMACS.x software package [84,
85]. The all-atom OPLS force field [86, 87] was used to describe the solute and tip4p
[88] and spc/e [89], were used to model the solvent. The temperature and pressure
were maintained near 300K and 1 bar by weak coupling to an external bath [90] with
50
a coupling constant of 0.1 ps for temperature and 1.0 ps for pressure. The LINCS [91]
algorithm was used to constrain bond lengths within the solute. The SETTLE [92]
algorithm was used to constrain bond lengths and the bond angle in water. A 2 fs
integration times step was used. A smooth particle mesh Ewald method [93] was used
to evaluate Coulomb interactions with a real-space cut-off of 0.9 nm, grid spacing of
0.12, and quadratic interpolation. van der Waals interactions were evaluated using a
cut-off method, with a cut-off distance of 0.9 nm. Neighbors lists were updated every
five steps. The structure of each solute was initially generated with Molden [94] and
then optimized at the level of HF/6-13G* using Gaussian03 [95]. Partial charges on
the atoms were obtained by fitting the gas phase electrostatic potential calculated at
the HF/6-13G* level using RESP [96]. The solute molecule was initially solvated in a
periodic 21.45 nm3 box. Initial velocities were assigned from a Maxwellian
distribution at 300K. Cartesian coordinates were stored every 100 fs. For data
acquisition in each solvent model, an initial 2 ns trajectory was generated. Then ten
snapshots from this trajectory were chosen to initiate 10 independent 2 ns trajectories,
of which the first 200 ps were disregarded for analysis. Values are reported after
averaging over the 10 independent trajectories.
51
III. Portable DNP and Improved Hardware
A. Introduction
In this chapter we report two advances in improving Overhauser DNP signal
enhancements. Using a custom built, high power microwave amplifier we were able
to increase our measured 1H of water NMR signal enhancements, E, by nearly a
factor of three. This microwave amplifier has become the standard equipment used in
our lab for DNP experiments, and two similar systems have since been built in our
lab. As both the microwave source and amplifiers are compact, we also developed a
fully portable DNP system at 0.35 T. As portable NMR systems operate at low
magnetic fields due to the limited field strength of small permanent magnets, so the
sensitivity gain from DNP may be advantageous [97]. Also, a portable system has
proved useful in applying DNP to imaging experiments developed in our lab [75].
Instead of dedicating an MRI instrument for use with DNP imaging experiments, the
microwave equipment can be taken to a MRI facility for imaging experiments [98].
The main challenge in designing a portable DNP setup at 0.35 T is efficiently
irradiating the electron spin resonant transition. Resonant cavities are preferred, but
have a narrow bandwidth available for exciting the electron transition. In a fixed field
permanent magnet, a resonant cavity will not have much flexibility since the field
cannot be varied to match the resonance of the cavity. To overcome this difficulty, we
employed two different techniques: (1) A commercial TE102 cavity was modified with
a movable wall, providing a tuning range of nearly 400 MHz for use in a fixed field
permanent magnet. (2) A variable field Halbach permanent magnet was used to match
52
the magnetic field to the resonance of a commercial TE102 cavity. This last method
resulted in larger signal enhancements, but at the time these experiments were
performed a variable field Halbach magnet was not commercially available [20]. We
characterize the DNP efficiency of our custom source under ideal conditions using a
commercial resonator and sweepable electromagnet and compare these results to
those obtained in our two portable setups. The field homogeneity of the variable
Halbach magnet is characterized in the Materials and methods section.
B. Results and Discussion
Characterization of high power microwave amplifier
A circuit diagram of our microwave amplifier is shown in Fig 3.1. A yttrium-iron-
garnet (YIG) oscillator outputs ~ 27.5 mW with a tunable frequency range of 8-10
GHz. After amplification by four solid state power amplifiers (SSPAs) in parallel, the
output power is ~ 23 W. Two step attenuators allow the power to be varied from ~ 23
W to 370 mW. An EIP 548A frequency counter equipped with a power meter was
used to measure the forward power after 30 dB of attenuation. However, this
measurement is the power exiting the amplifier and not the actual power being
delivered to the sample. The source was characterized by measuring the 1H of water
NMR signal enhancements, with different nitroxide radical solutions (see Table 3.1).
To estimate the power delivered the sample, DNP enhancements with our custom
microwave amplifier were compared to those measured using a commercial Bruker
EMX spectrometer that displays the power under leveled and matched conditions. For
example, the measured 1H of water NMR signal enhancement for a sample of 4-oxo-
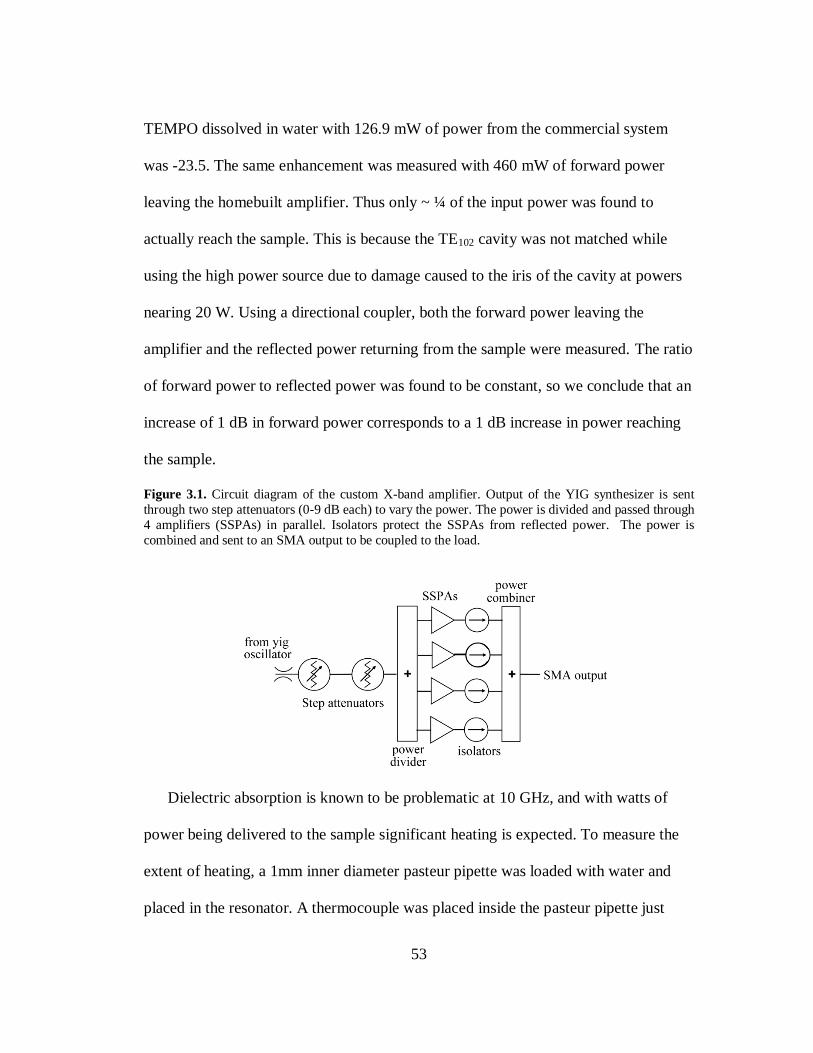
53
TEMPO dissolved in water with 126.9 mW of power from the commercial system
was -23.5. The same enhancement was measured with 460 mW of forward power
leaving the homebuilt amplifier. Thus only ~ ¼ of the input power was found to
actually reach the sample. This is because the TE102 cavity was not matched while
using the high power source due to damage caused to the iris of the cavity at powers
nearing 20 W. Using a directional coupler, both the forward power leaving the
amplifier and the reflected power returning from the sample were measured. The ratio
of forward power to reflected power was found to be constant, so we conclude that an
increase of 1 dB in forward power corresponds to a 1 dB increase in power reaching
the sample.
Figure 3.1. Circuit diagram of the custom X-band amplifier. Output of the YIG synthesizer is sent
through two step attenuators (0-9 dB each) to vary the power. The power is divided and passed through
4 amplifiers (SSPAs) in parallel. Isolators protect the SSPAs from reflected power. The power is
combined and sent to an SMA output to be coupled to the load.
Dielectric absorption is known to be problematic at 10 GHz, and with watts of
power being delivered to the sample significant heating is expected. To measure the
extent of heating, a 1mm inner diameter pasteur pipette was loaded with water and
placed in the resonator. A thermocouple was placed inside the pasteur pipette just
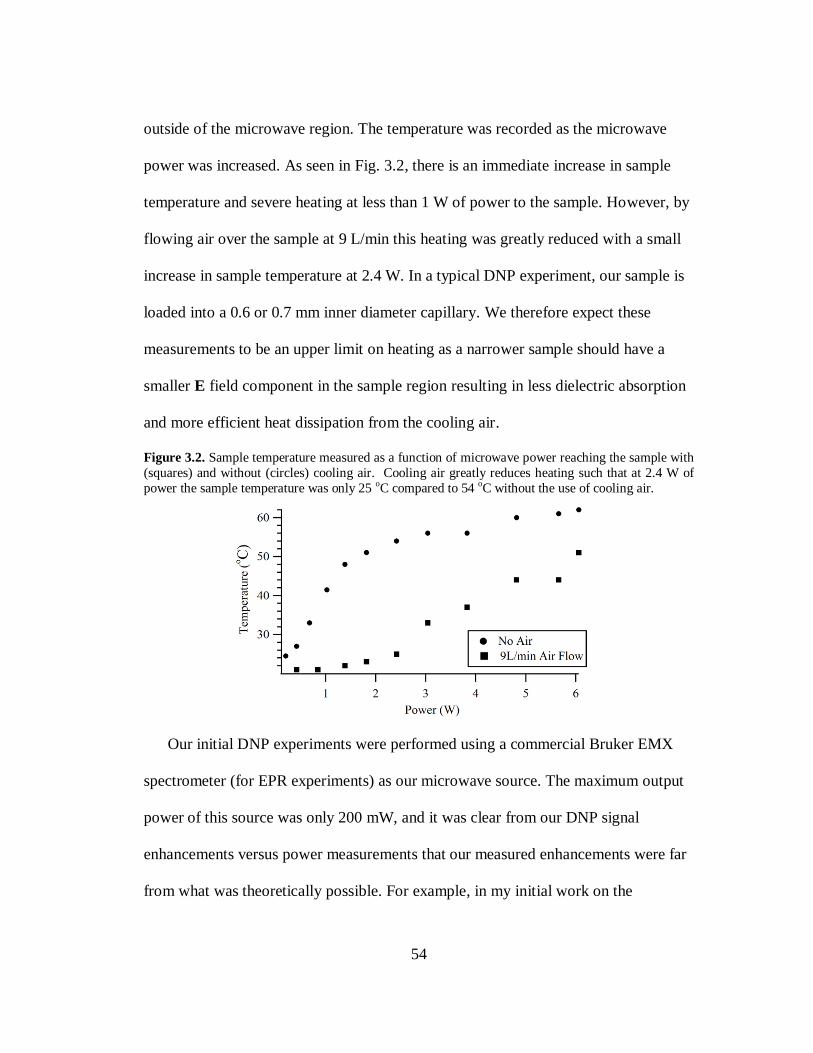
54
outside of the microwave region. The temperature was recorded as the microwave
power was increased. As seen in Fig. 3.2, there is an immediate increase in sample
temperature and severe heating at less than 1 W of power to the sample. However, by
flowing air over the sample at 9 L/min this heating was greatly reduced with a small
increase in sample temperature at 2.4 W. In a typical DNP experiment, our sample is
loaded into a 0.6 or 0.7 mm inner diameter capillary. We therefore expect these
measurements to be an upper limit on heating as a narrower sample should have a
smaller E field component in the sample region resulting in less dielectric absorption
and more efficient heat dissipation from the cooling air.
Figure 3.2. Sample temperature measured as a function of microwave power reaching the sample with
(squares) and without (circles) cooling air. Cooling air greatly reduces heating such that at 2.4 W of
power the sample temperature was only 25 oC compared to 54 oC without the use of cooling air.
Our initial DNP experiments were performed using a commercial Bruker EMX
spectrometer (for EPR experiments) as our microwave source. The maximum output
power of this source was only 200 mW, and it was clear from our DNP signal
enhancements versus power measurements that our measured enhancements were far
from what was theoretically possible. For example, in my initial work on the
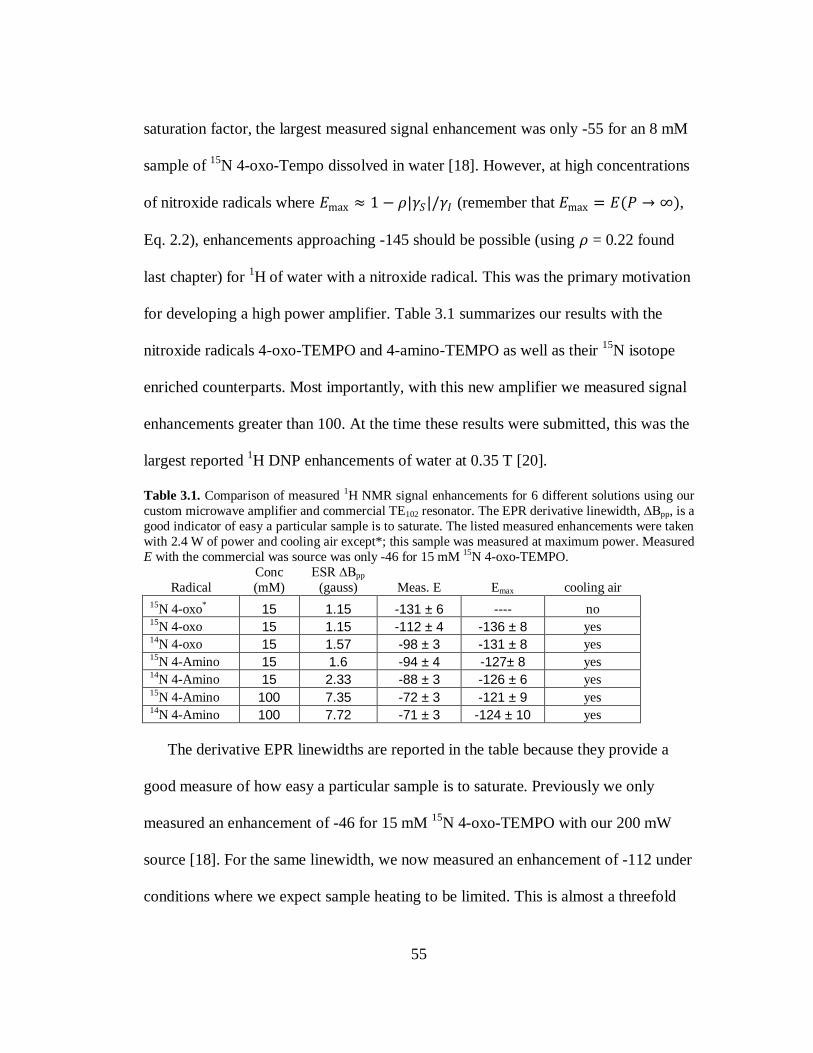
55
saturation factor, the largest measured signal enhancement was only -55 for an 8 mM
sample of 15
N 4-oxo-Tempo dissolved in water [18]. However, at high concentrations
of nitroxide radicals where 𝐸max ≈ 1 − 𝜌|𝛾𝑆|/𝛾𝐼 (remember that 𝐸max = 𝐸(𝑃 → ∞),
Eq. 2.2), enhancements approaching -145 should be possible (using 𝜌 = 0.22 found
last chapter) for 1H of water with a nitroxide radical. This was the primary motivation
for developing a high power amplifier. Table 3.1 summarizes our results with the
nitroxide radicals 4-oxo-TEMPO and 4-amino-TEMPO as well as their 15
N isotope
enriched counterparts. Most importantly, with this new amplifier we measured signal
enhancements greater than 100. At the time these results were submitted, this was the
largest reported 1H DNP enhancements of water at 0.35 T [20].
Table 3.1. Comparison of measured 1H NMR signal enhancements for 6 different solutions using our
custom microwave amplifier and commercial TE102 resonator. The EPR derivative linewidth, ∆Bpp, is a
good indicator of easy a particular sample is to saturate. The listed measured enhancements were taken
with 2.4 W of power and cooling air except*; this sample was measured at maximum power. Measured
E with the commercial was source was only -46 for 15 mM 15N 4-oxo-TEMPO.
Radical
Conc
(mM)
ESR ∆Bpp
(gauss) Meas. E Emax cooling air
15N 4-oxo* 15 1.15 -131 ± 6 ---- no 15N 4-oxo 15 1.15 -112 ± 4 -136 ± 8 yes 14N 4-oxo 15 1.57 -98 ± 3 -131 ± 8 yes 15N 4-Amino 15 1.6 -94 ± 4 -127± 8 yes 14N 4-Amino 15 2.33 -88 ± 3 -126 ± 6 yes 15N 4-Amino 100 7.35 -72 ± 3 -121 ± 9 yes 14N 4-Amino 100 7.72 -71 ± 3 -124 ± 10 yes
The derivative EPR linewidths are reported in the table because they provide a
good measure of how easy a particular sample is to saturate. Previously we only
measured an enhancement of -46 for 15 mM 15
N 4-oxo-TEMPO with our 200 mW
source [18]. For the same linewidth, we now measured an enhancement of -112 under
conditions where we expect sample heating to be limited. This is almost a threefold
56
improvement in our DNP efficiency and the measured enhancement is nearing the
predicted maximum for this sample. As the linewidth of the sample increases, our
measured DNP enhancements decreased, but even for 100 mM radical concentrations
large signal enhancements were measured. Also, the Emax values for all samples are
nearly identical. This again provides more evidence that e- spin exchange must be
effectively mixing the electron hyperfine states as the 15
N nitroxide sample would be
expected to have ~ 50% larger signal enhancements in the absence of mixing of the
hyperfine states due to having only two hyperfine lines instead of three.
It is interesting that our largest measured enhancement factor of -131 compared to
room temperature thermal polarization was measured under conditions where
significant sample heating is expected (6 W of power, and no cooling air). This effect
can partially be explained by examining the expected changes of thermal polarization
and 𝜌 with increasing temperature. An increase in temperature from 20 to 60° C (Fig.
3.2) corresponds to a loss of thermal polarization of about 17%. The increase in
temperature also causes a decrease in the viscosity of water by approximately 50%
[99]. We can use this change in solvent viscosity to estimate the change in 𝜌 using the
FFHS model; the result giving 𝜌 ~ 0.3. This increase in 𝜌 more than offsets the loss in
thermal polarization, and thus results in a larger measured signal enhancement. It
should be pointed out that this is not a general result and is specific to this case. Since
both f and smax are both close to 1 and changing slowly at 15 mM nitroxide
concentration, I have ignored any changes in these parameters. However, with heating
f is expected to change (Eq. 1.15) and smax will increase due to more rapid e- spin
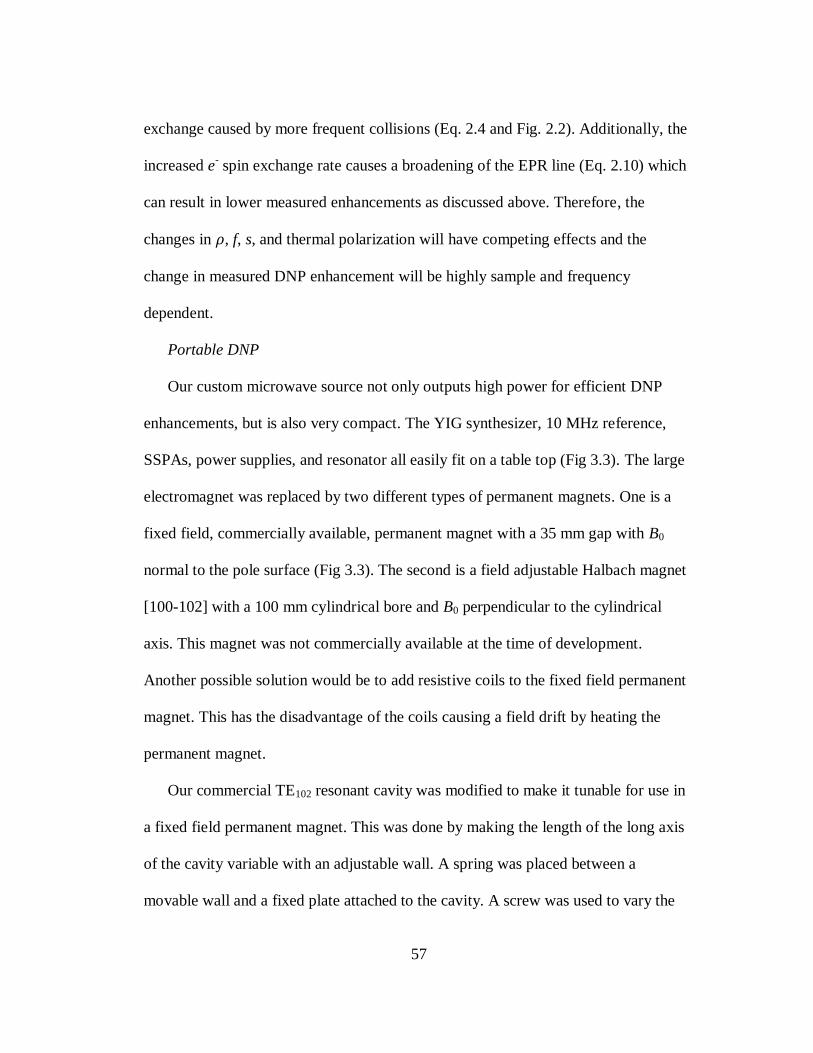
57
exchange caused by more frequent collisions (Eq. 2.4 and Fig. 2.2). Additionally, the
increased e- spin exchange rate causes a broadening of the EPR line (Eq. 2.10) which
can result in lower measured enhancements as discussed above. Therefore, the
changes in 𝜌, f, s, and thermal polarization will have competing effects and the
change in measured DNP enhancement will be highly sample and frequency
dependent.
Portable DNP
Our custom microwave source not only outputs high power for efficient DNP
enhancements, but is also very compact. The YIG synthesizer, 10 MHz reference,
SSPAs, power supplies, and resonator all easily fit on a table top (Fig 3.3). The large
electromagnet was replaced by two different types of permanent magnets. One is a
fixed field, commercially available, permanent magnet with a 35 mm gap with B0
normal to the pole surface (Fig 3.3). The second is a field adjustable Halbach magnet
[100-102] with a 100 mm cylindrical bore and B0 perpendicular to the cylindrical
axis. This magnet was not commercially available at the time of development.
Another possible solution would be to add resistive coils to the fixed field permanent
magnet. This has the disadvantage of the coils causing a field drift by heating the
permanent magnet.
Our commercial TE102 resonant cavity was modified to make it tunable for use in
a fixed field permanent magnet. This was done by making the length of the long axis
of the cavity variable with an adjustable wall. A spring was placed between a
movable wall and a fixed plate attached to the cavity. A screw was used to vary the
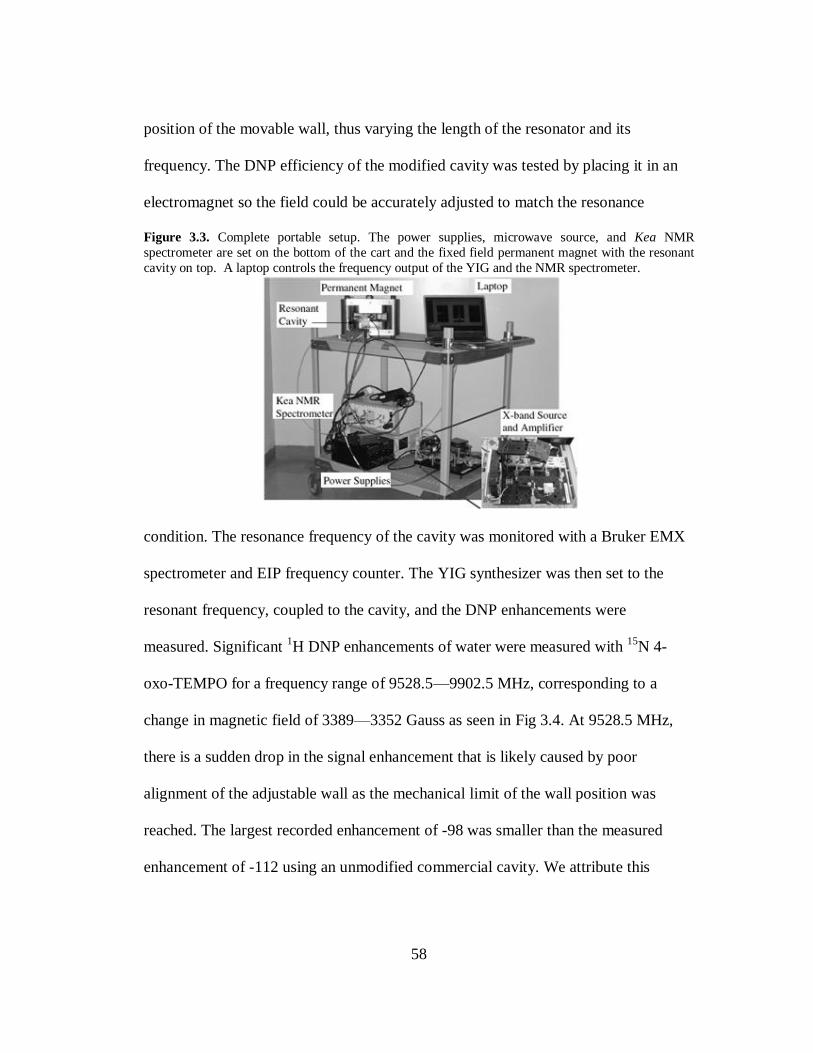
58
position of the movable wall, thus varying the length of the resonator and its
frequency. The DNP efficiency of the modified cavity was tested by placing it in an
electromagnet so the field could be accurately adjusted to match the resonance
Figure 3.3. Complete portable setup. The power supplies, microwave source, and Kea NMR
spectrometer are set on the bottom of the cart and the fixed field permanent magnet with the resonant
cavity on top. A laptop controls the frequency output of the YIG and the NMR spectrometer.
condition. The resonance frequency of the cavity was monitored with a Bruker EMX
spectrometer and EIP frequency counter. The YIG synthesizer was then set to the
resonant frequency, coupled to the cavity, and the DNP enhancements were
measured. Significant 1H DNP enhancements of water were measured with
15N 4-
oxo-TEMPO for a frequency range of 9528.5—9902.5 MHz, corresponding to a
change in magnetic field of 3389—3352 Gauss as seen in Fig 3.4. At 9528.5 MHz,
there is a sudden drop in the signal enhancement that is likely caused by poor
alignment of the adjustable wall as the mechanical limit of the wall position was
reached. The largest recorded enhancement of -98 was smaller than the measured
enhancement of -112 using an unmodified commercial cavity. We attribute this
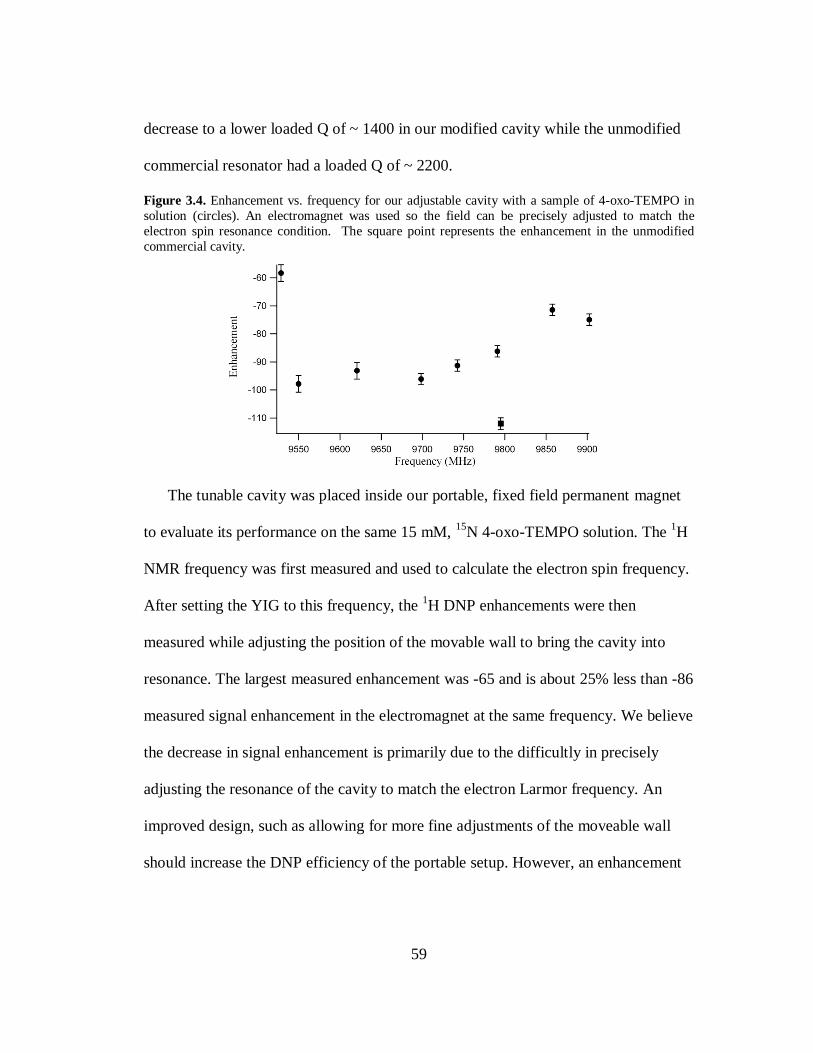
59
decrease to a lower loaded Q of ~ 1400 in our modified cavity while the unmodified
commercial resonator had a loaded Q of ~ 2200.
Figure 3.4. Enhancement vs. frequency for our adjustable cavity with a sample of 4-oxo-TEMPO in
solution (circles). An electromagnet was used so the field can be precisely adjusted to match the
electron spin resonance condition. The square point represents the enhancement in the unmodified
commercial cavity.
The tunable cavity was placed inside our portable, fixed field permanent magnet
to evaluate its performance on the same 15 mM, 15
N 4-oxo-TEMPO solution. The 1H
NMR frequency was first measured and used to calculate the electron spin frequency.
After setting the YIG to this frequency, the 1H DNP enhancements were then
measured while adjusting the position of the movable wall to bring the cavity into
resonance. The largest measured enhancement was -65 and is about 25% less than -86
measured signal enhancement in the electromagnet at the same frequency. We believe
the decrease in signal enhancement is primarily due to the difficultly in precisely
adjusting the resonance of the cavity to match the electron Larmor frequency. An
improved design, such as allowing for more fine adjustments of the moveable wall
should increase the DNP efficiency of the portable setup. However, an enhancement
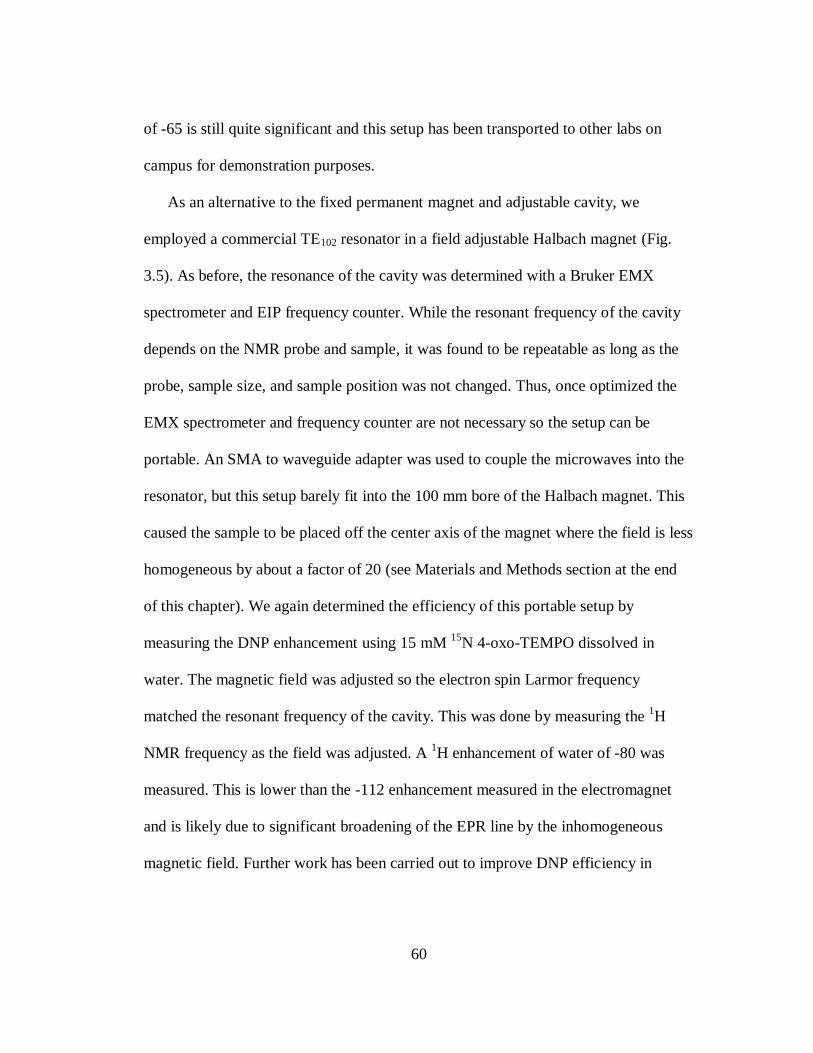
60
of -65 is still quite significant and this setup has been transported to other labs on
campus for demonstration purposes.
As an alternative to the fixed permanent magnet and adjustable cavity, we
employed a commercial TE102 resonator in a field adjustable Halbach magnet (Fig.
3.5). As before, the resonance of the cavity was determined with a Bruker EMX
spectrometer and EIP frequency counter. While the resonant frequency of the cavity
depends on the NMR probe and sample, it was found to be repeatable as long as the
probe, sample size, and sample position was not changed. Thus, once optimized the
EMX spectrometer and frequency counter are not necessary so the setup can be
portable. An SMA to waveguide adapter was used to couple the microwaves into the
resonator, but this setup barely fit into the 100 mm bore of the Halbach magnet. This
caused the sample to be placed off the center axis of the magnet where the field is less
homogeneous by about a factor of 20 (see Materials and Methods section at the end
of this chapter). We again determined the efficiency of this portable setup by
measuring the DNP enhancement using 15 mM 15
N 4-oxo-TEMPO dissolved in
water. The magnetic field was adjusted so the electron spin Larmor frequency
matched the resonant frequency of the cavity. This was done by measuring the 1H
NMR frequency as the field was adjusted. A 1H enhancement of water of -80 was
measured. This is lower than the -112 enhancement measured in the electromagnet
and is likely due to significant broadening of the EPR line by the inhomogeneous
magnetic field. Further work has been carried out to improve DNP efficiency in
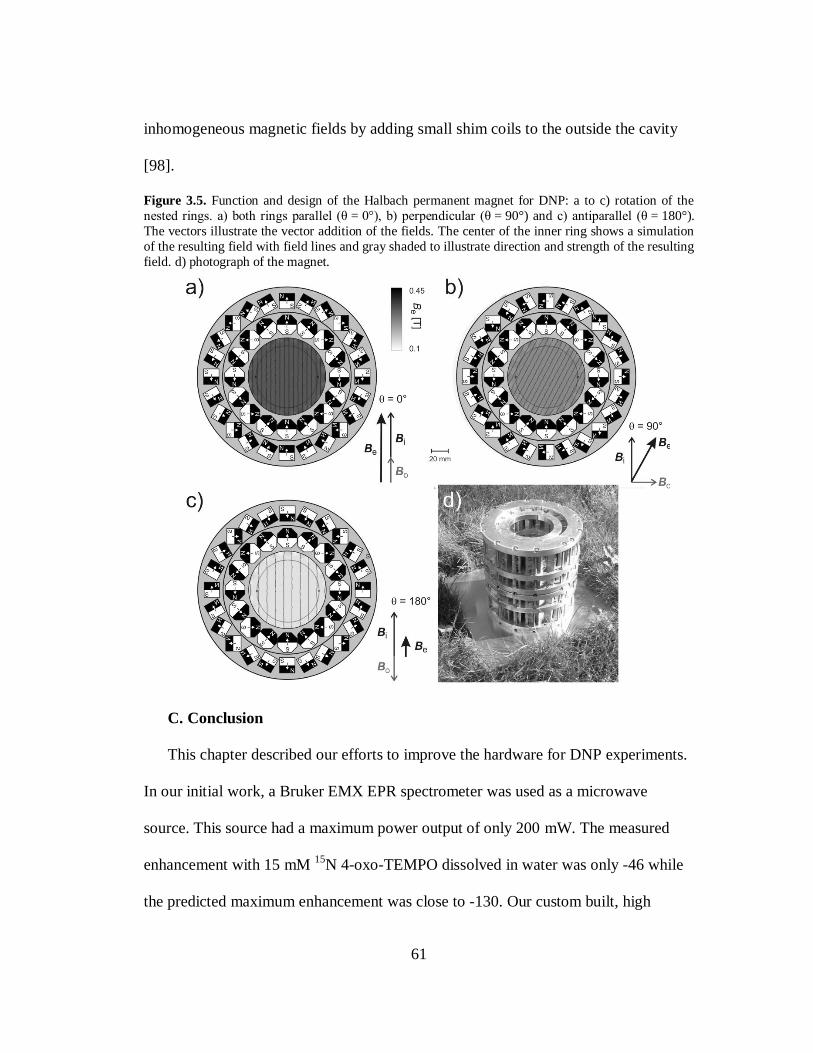
61
inhomogeneous magnetic fields by adding small shim coils to the outside the cavity
[98].
Figure 3.5. Function and design of the Halbach permanent magnet for DNP: a to c) rotation of the
nested rings. a) both rings parallel (θ = 0°), b) perpendicular (θ = 90°) and c) antiparallel (θ = 180°).
The vectors illustrate the vector addition of the fields. The center of the inner ring shows a simulation
of the resulting field with field lines and gray shaded to illustrate direction and strength of the resulting
field. d) photograph of the magnet.
C. Conclusion
This chapter described our efforts to improve the hardware for DNP experiments.
In our initial work, a Bruker EMX EPR spectrometer was used as a microwave
source. This source had a maximum power output of only 200 mW. The measured
enhancement with 15 mM 15
N 4-oxo-TEMPO dissolved in water was only -46 while
the predicted maximum enhancement was close to -130. Our custom built, high
62
power microwave source resulted in a measured enhancement of -112 for this sample,
approaching the theoretical maximum. Further, as our microwave source and
amplifier is compact, we developed two portable systems. Using a fixed field
permanent magnet and a tunable cavity, we achieved a DNP signal enhancement of -
65 using the same 15
N 4-oxo-TEMPO sample. Replacing the fixed field magnet with
a variable field Halbach magnet and using a commercial resonator, an enhancement
factor of -80 was measured. While neither portable system performed as well as the
large electromagnet, improvements in cavity design should improve performance.
D. Materials and Methods
Sample Preparation
The free radicals 4-oxo-TEMPO and 4-amino-2,2,6,6-tetramethyl-1-
piperidinyloxy (4-amino-TEMPO) were purchased from Sigma-Aldrich. Isotope
enriched 15
N labeled 4-oxo-TEMPO was purchased from Cambridge Isotope
Laboratories. 15
N labeled ammonia and D6-acetone were also purchased from
Cambridge Isotope Laboratories and used to synthesize 15
N labeled 4-Amino-
TEMPO following previously published procedures [74]. 4-Amino-Tempo was
dissolved directly into de-ionized water while 4-oxo-TEMPO was initially dissolved
at a high concentration into DMSO and then diluted into de-ionized water, the final
solution containing no more than 5% DMSO by volume. Volumes of approximately 5
μL were loaded into 0.7 mm inner diameter silica capillaries and sealed with beeswax
and used for both ESR and NMR measurements.
63
DNP and EPR measurements
ESR experiments were performed at 0.35 T in an field adjustable electromagnet
(0—1.5 T) using a Bruker TE102 rectangular resonant cavity operating at 9.8 GHz and
a Bruker EMX spectrometer. A home built NMR probe for 14.85 MHz 1H detection
was inserted into the microwave cavity under tuned and matched conditions. The
NMR experiments were carried out with a Bruker Avance 300 spectrometer when
using the electromagnet and Kea NMR spectrometer (Magritek Limited, Wellington,
New Zealand) was used with the portable magnets. DNP experiments were preformed
while continuously irradiating the sample at ~ 9.8 GHz using our custom built
microwave amplifier. The frequency source is a phase-locked YIG synthesizer
(Microlambda Wireless) with 27.5 mW output, tunable between 8-10 GHz with an f
accuracy of 100 Hz. The microwave output is sent through two step attenuators
(Narda), split with Wilkinson power dividers (Minicircuits), directed through four
solid state power amplifiers (Advanced Microwave Inc.) in parallel, protected against
reflected power using coaxial isolators with at least 25 dB protection (UTE
Microwave Inc), recombined again with a Wilkinson power combiner (MIDISCO),
and directed into an SMA output with a measured output power of 23 W. A circuit
diagram of this transmission device is shown in Fig. 3.1. The YIG oscillator requires
a 10 MHz reference frequency input along with two voltage sources (5V, 0A and
15V, 0.34A) and a computer for adjusting the frequency via a parallel interface, with
the supplied program (Microlambda Wireless). For these purposes, we employed an
Instek PST-3201 triple output power supply and a Stanford Research Systems SC-10
64
as a 10 MHz reference source. A SMA to waveguide connector is used to couple the
microwave output to the Bruker TE102 cavity. The precise frequency for setting the
YIG oscillator can be found by monitoring the DNP enhancement while adjusting the
frequency or by monitoring the frequency at which the TE102 cavity resonates when
coupled to the Bruker X-band bridge (ER 041 MR; a Gunn diode source) using a
frequency counter. This resonance frequency is accurately reproducible when using
the same sample holder and NMR coil, but can vary significantly if either of these
conditions is changed. For experiments using the fixed field magnet portable DNP
setup, a 0.3487 Tesla (at 22.5o C with temperature variance of ~ 0.025%/
oC)
permanent magnet was purchased from Aster Enterprises, Inc. This magnet is
relatively small in size and has a 35 mm gap to comfortably place the X-band
microwave equipment.
For our portable DNP setup with a variable magnetic field, the custom built
permanent magnet consists of two Halbach dipoles [100] realized by 2 nested
MANDHALA rings [102] that can be turned relative to each other in order to change
the resulting magnetic field manually [101]. The inner ring (ID 100 mm, OD 156
mm) is a stack of 8 layers each made from 16 octagonal permanent magnets
(dimensions 24 × 24 ×22.2 mm) while the outer ring (ID 158 mm, OD 224 mm)
consists of 6 layers of 24 quadratic permanent magnets (dimensions 18.6 × 18.6 ×
32.1 mm). The principal design is shown in Fig. 3.5. All layers in both rings have
individual distances optimized for maximal homogeneity using BEM software
(AMPERES, Integrated Engineering Software, Winnipeg, Canada). Each layer
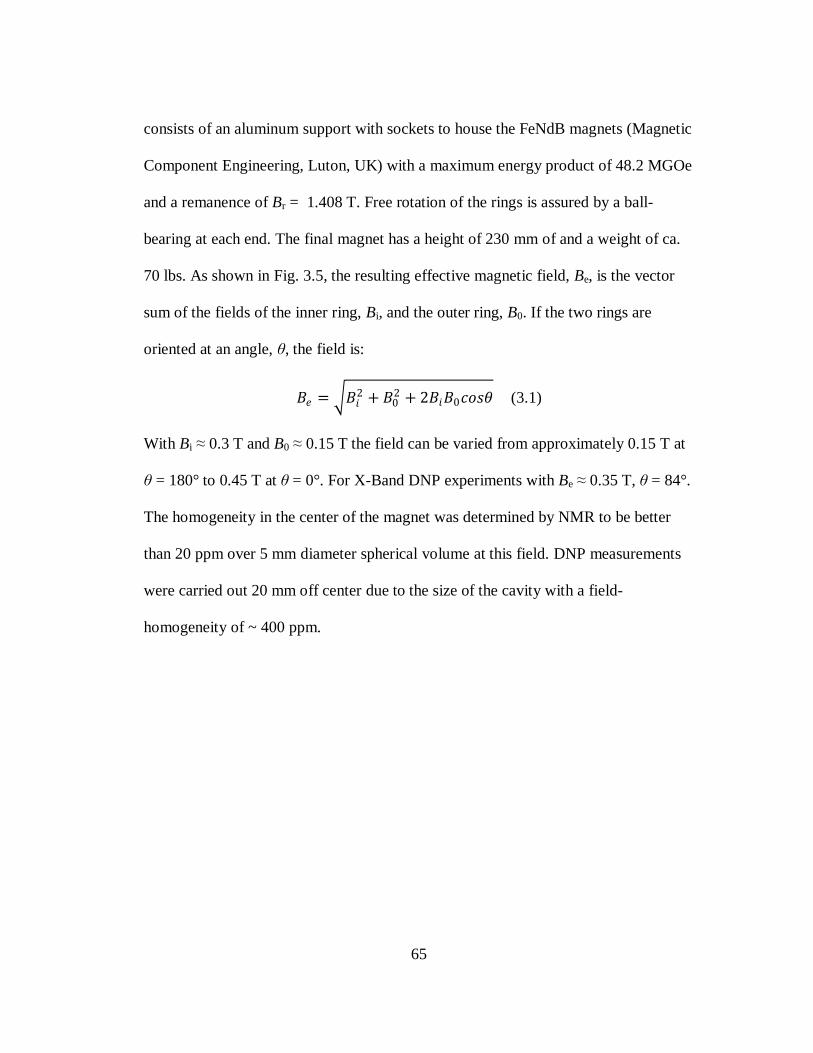
65
consists of an aluminum support with sockets to house the FeNdB magnets (Magnetic
Component Engineering, Luton, UK) with a maximum energy product of 48.2 MGOe
and a remanence of Br = 1.408 T. Free rotation of the rings is assured by a ball-
bearing at each end. The final magnet has a height of 230 mm of and a weight of ca.
70 lbs. As shown in Fig. 3.5, the resulting effective magnetic field, Be, is the vector
sum of the fields of the inner ring, Bi, and the outer ring, B0. If the two rings are
oriented at an angle, θ, the field is:
𝐵𝑒 = 𝐵𝑖2 + 𝐵0
2 + 2𝐵𝑖𝐵0𝑐𝑜𝑠𝜃 (3.1)
With Bi ≈ 0.3 T and B0 ≈ 0.15 T the field can be varied from approximately 0.15 T at
θ = 180° to 0.45 T at θ = 0°. For X-Band DNP experiments with Be ≈ 0.35 T, θ = 84°.
The homogeneity in the center of the magnet was determined by NMR to be better
than 20 ppm over 5 mm diameter spherical volume at this field. DNP measurements
were carried out 20 mm off center due to the size of the cavity with a field-
homogeneity of ~ 400 ppm.
66
IV. Site Specific Hydration Dynamics of Apomyoglobin
A. Introduction
In the previous two chapters we developed a new theory for the saturation factor
necessary for spin labeled biomolecules and improved our DNP efficiency with a
custom microwave amplifier. In this chapter we apply Overhauser DNP to answer a
question of biological relevance: is the hydrophobic core of a protein folding
intermediate hydrated?
It is well appreciated that the hydrophobic effect is one of the dominant forces in
protein folding [103-106]. However, the virtual absence of experimental evidence
regarding the location and dynamics of disordered water has severely limited a
quantitative assessment of the role of hydrophobic interactions to protein folding.
Many proteins are known to fold via a rapid collapse of a hydrophobic core, followed
by a slower search for the native state. The initial collapsed state is often identifiable
as a discrete kinetic intermediate, and typically fits the description of a molten
globule (MG). The exact nature of a MG is elusive as they are often unstable and lack
significant structure. Generally however, a MG is compact, highly dynamic, and lacks
a significant fraction of the native secondary structure. Whether MG folding
intermediates bear a hydrated (i.e., wet) or dry nonpolar core, or whether any core-
associated water is dynamic or motionally confined are current subjects of intense
debate [107-112]. Experimental evidence on the nature of water interacting with the
protein core is sorely needed given its fundamental relevance to the molecular nature
of the hydrophobic effect and the putative mechanistic role of core-water extrusion in
67
protein folding. More generally, hydration water—defined as water whose dynamics
are perturbed by the surface and extending up to 3 water layers—is increasingly
recognized to play a direct role in equilibrium protein dynamics [44, 113], thus
regulating protein function, activity, and binding events, in addition to folding. There
is also disagreement on the timescale, nature, and role of this water [15; 16; 114-116],
but experimental reports are lagging behind theoretical predictions. In order to obtain
clarity on these fundamental questions, new techniques and more experimental
studies are needed.
The experimental challenge is that hydration water of dilute protein solutions is
difficult to detect since it has a spectroscopic signature largely indistinguishable from
the more highly populated bulk water. Additionally, the landscape of protein
hydration dynamics is extremely heterogeneous on the temporal (e.g. bound versus
disordered water) as well as spatial (residue to domain) scale, requiring tools that can
access hydration dynamics within a well defined timescale of interest as well as with
site-specific resolution. Despite the availability of a number of techniques to study
protein hydration water, including nuclear magnetic resonance relaxation dispersion
[117-120], quasi-elastic neutron scattering [44; 121-123], inelastic neutron scattering
[115, 124, 125], microwave dielectric spectroscopy [126, 127] and terahertz
absorption spectroscopy [128], only femtosecond fluorescence spectroscopy [15, 16,
129-131] on (natural and substituted) tryptophan residues has been reported to map
out protein hydration dynamics with site specificity.
68
In this chapter we apply the Overhauser DNP technique developed in the first
three chapters of this dissertation to probe, with site-specific resolution, the
translational dynamics of hydration water interacting with sperm whale
apomyoglobin (apoMb) in its native (N-state), pH-unfolded (U-state), and MG states.
The Overhauser DNP approach overcomes the above mentioned experimental
challenges by amplifying the 1H NMR signal of water within ~10 Å around protein
residues labeled with nitroxide radical spin labels [17]. As discussed in chapters one
and two, the size of the signal enhancement at 0.35 T is sensitive to the translational
(or rotational) dynamics of hydration water with correlation times between 10-500 ps.
Also, as the same nitroxide spin label employed for DNP is used electron EPR, we
conducted EPR measurements to gain information on the local environment, packing,
and protein backbone dynamics around the spin label.
Apomyoglobin (apoMb; the prefix apo indicates the heme normally present as
part of the structure is missing) is an eight 𝛼-helix globular protein that offers a
unique chance to study the role of hydration water in protein folding since it
populates a stable MG intermediate at ~ pH 4.1. While this species is clearly distinct
from the apoMb kinetic folding intermediate, they have been shown to share key
structural features [108, 132-136]. There exist several literature reports that
investigate hydration dynamics in apoMb [44, 107, 117], but only time resolved
femto-second fluorescence spectroscopy has reported water dynamics with site
specific resolution [15, 16]. Figure 4.1 shows the native structure of apoMb and the
sites chosen for site directed spin labeling (SDSL) with the nitroxide spin label
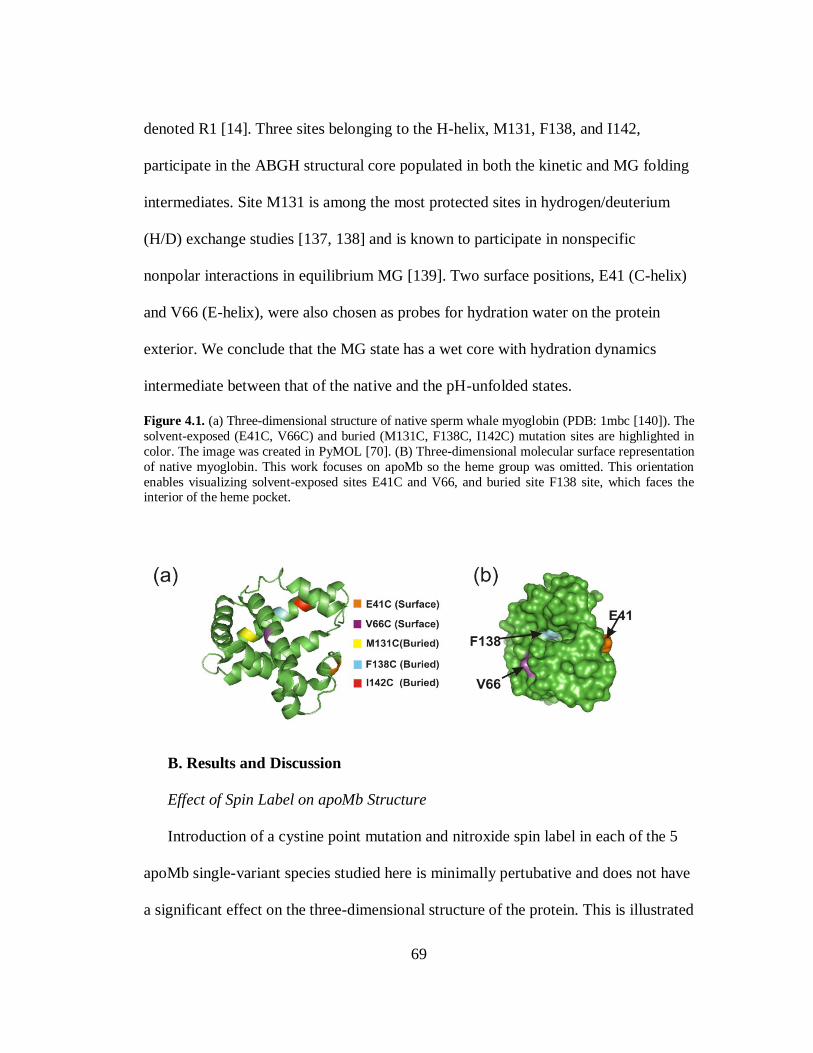
69
denoted R1 [14]. Three sites belonging to the H-helix, M131, F138, and I142,
participate in the ABGH structural core populated in both the kinetic and MG folding
intermediates. Site M131 is among the most protected sites in hydrogen/deuterium
(H/D) exchange studies [137, 138] and is known to participate in nonspecific
nonpolar interactions in equilibrium MG [139]. Two surface positions, E41 (C-helix)
and V66 (E-helix), were also chosen as probes for hydration water on the protein
exterior. We conclude that the MG state has a wet core with hydration dynamics
intermediate between that of the native and the pH-unfolded states.
Figure 4.1. (a) Three-dimensional structure of native sperm whale myoglobin (PDB: 1mbc [140]). The
solvent-exposed (E41C, V66C) and buried (M131C, F138C, I142C) mutation sites are highlighted in
color. The image was created in PyMOL [70]. (B) Three-dimensional molecular surface representation
of native myoglobin. This work focuses on apoMb so the heme group was omitted. This orientation
enables visualizing solvent-exposed sites E41C and V66, and buried site F138 site, which faces the interior of the heme pocket.
B. Results and Discussion
Effect of Spin Label on apoMb Structure
Introduction of a cystine point mutation and nitroxide spin label in each of the 5
apoMb single-variant species studied here is minimally pertubative and does not have
a significant effect on the three-dimensional structure of the protein. This is illustrated
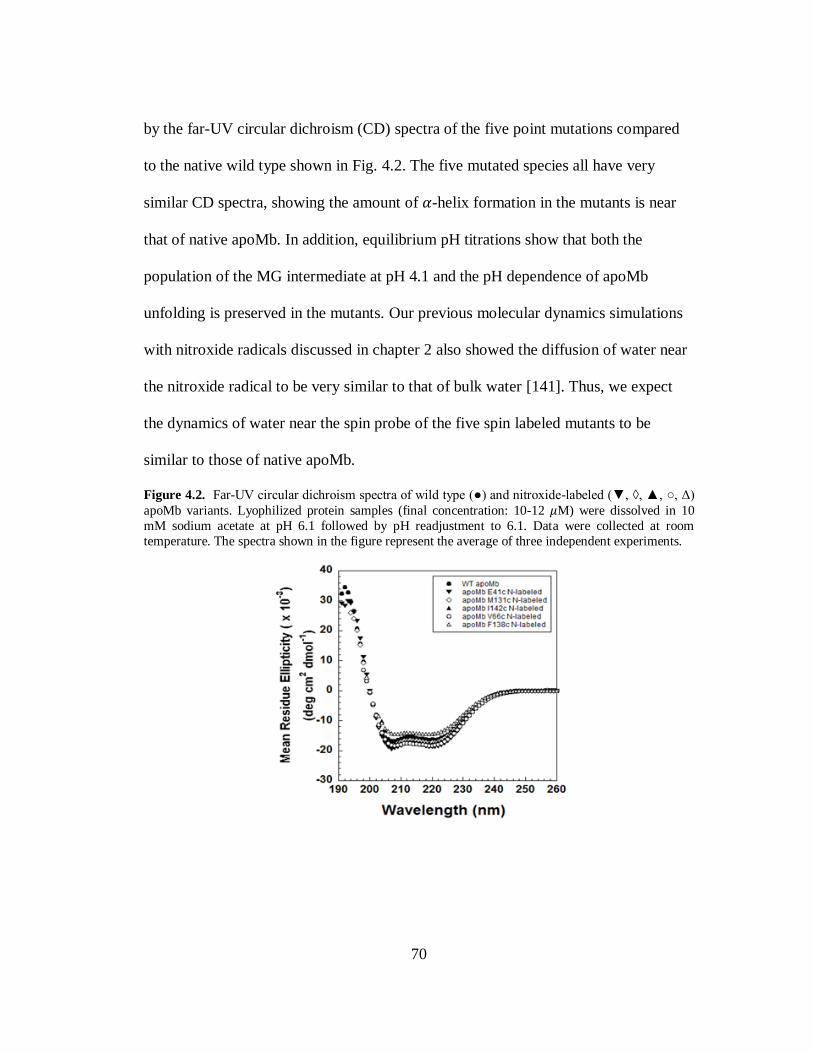
70
by the far-UV circular dichroism (CD) spectra of the five point mutations compared
to the native wild type shown in Fig. 4.2. The five mutated species all have very
similar CD spectra, showing the amount of 𝛼-helix formation in the mutants is near
that of native apoMb. In addition, equilibrium pH titrations show that both the
population of the MG intermediate at pH 4.1 and the pH dependence of apoMb
unfolding is preserved in the mutants. Our previous molecular dynamics simulations
with nitroxide radicals discussed in chapter 2 also showed the diffusion of water near
the nitroxide radical to be very similar to that of bulk water [141]. Thus, we expect
the dynamics of water near the spin probe of the five spin labeled mutants to be
similar to those of native apoMb.
Figure 4.2. Far-UV circular dichroism spectra of wild type (●) and nitroxide-labeled (▼, ◊, ▲, ○, Δ)
apoMb variants. Lyophilized protein samples (final concentration: 10-12 𝜇M) were dissolved in 10
mM sodium acetate at pH 6.1 followed by pH readjustment to 6.1. Data were collected at room
temperature. The spectra shown in the figure represent the average of three independent experiments.
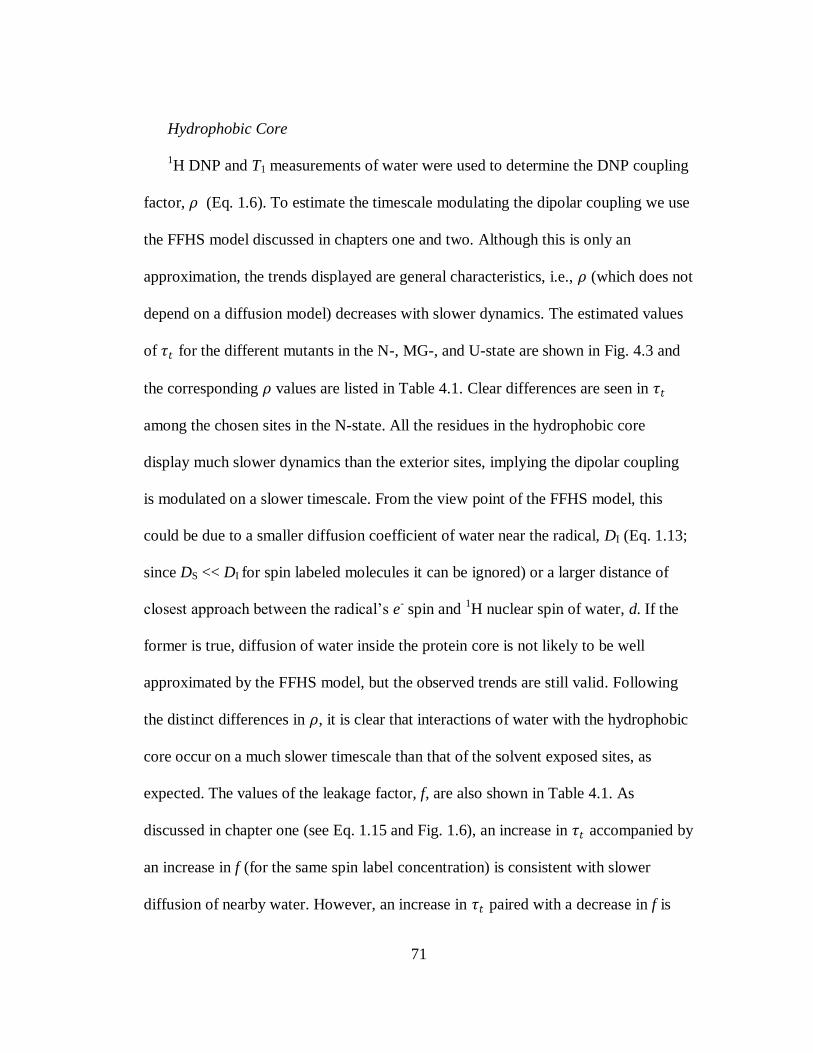
71
Hydrophobic Core
1H DNP and T1 measurements of water were used to determine the DNP coupling
factor, 𝜌 (Eq. 1.6). To estimate the timescale modulating the dipolar coupling we use
the FFHS model discussed in chapters one and two. Although this is only an
approximation, the trends displayed are general characteristics, i.e., 𝜌 (which does not
depend on a diffusion model) decreases with slower dynamics. The estimated values
of 𝜏𝑡 for the different mutants in the N-, MG-, and U-state are shown in Fig. 4.3 and
the corresponding 𝜌 values are listed in Table 4.1. Clear differences are seen in 𝜏𝑡
among the chosen sites in the N-state. All the residues in the hydrophobic core
display much slower dynamics than the exterior sites, implying the dipolar coupling
is modulated on a slower timescale. From the view point of the FFHS model, this
could be due to a smaller diffusion coefficient of water near the radical, DI (Eq. 1.13;
since DS << DI for spin labeled molecules it can be ignored) or a larger distance of
closest approach between the radical‘s e- spin and
1H nuclear spin of water, d. If the
former is true, diffusion of water inside the protein core is not likely to be well
approximated by the FFHS model, but the observed trends are still valid. Following
the distinct differences in 𝜌, it is clear that interactions of water with the hydrophobic
core occur on a much slower timescale than that of the solvent exposed sites, as
expected. The values of the leakage factor, f, are also shown in Table 4.1. As
discussed in chapter one (see Eq. 1.15 and Fig. 1.6), an increase in 𝜏𝑡 accompanied by
an increase in f (for the same spin label concentration) is consistent with slower
diffusion of nearby water. However, an increase in 𝜏𝑡 paired with a decrease in f is
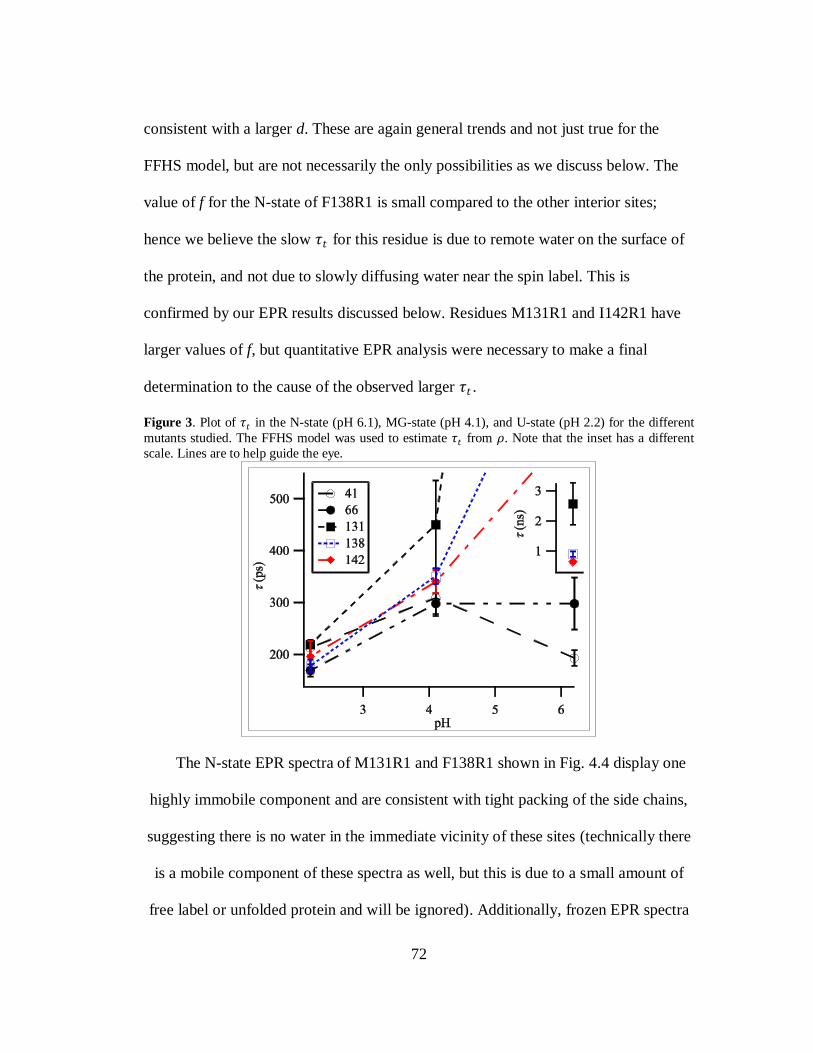
72
consistent with a larger d. These are again general trends and not just true for the
FFHS model, but are not necessarily the only possibilities as we discuss below. The
value of f for the N-state of F138R1 is small compared to the other interior sites;
hence we believe the slow 𝜏𝑡 for this residue is due to remote water on the surface of
the protein, and not due to slowly diffusing water near the spin label. This is
confirmed by our EPR results discussed below. Residues M131R1 and I142R1 have
larger values of f, but quantitative EPR analysis were necessary to make a final
determination to the cause of the observed larger 𝜏𝑡 .
Figure 3. Plot of 𝜏𝑡 in the N-state (pH 6.1), MG-state (pH 4.1), and U-state (pH 2.2) for the different
mutants studied. The FFHS model was used to estimate 𝜏𝑡 from 𝜌. Note that the inset has a different
scale. Lines are to help guide the eye.
The N-state EPR spectra of M131R1 and F138R1 shown in Fig. 4.4 display one
highly immobile component and are consistent with tight packing of the side chains,
suggesting there is no water in the immediate vicinity of these sites (technically there
is a mobile component of these spectra as well, but this is due to a small amount of
free label or unfolded protein and will be ignored). Additionally, frozen EPR spectra
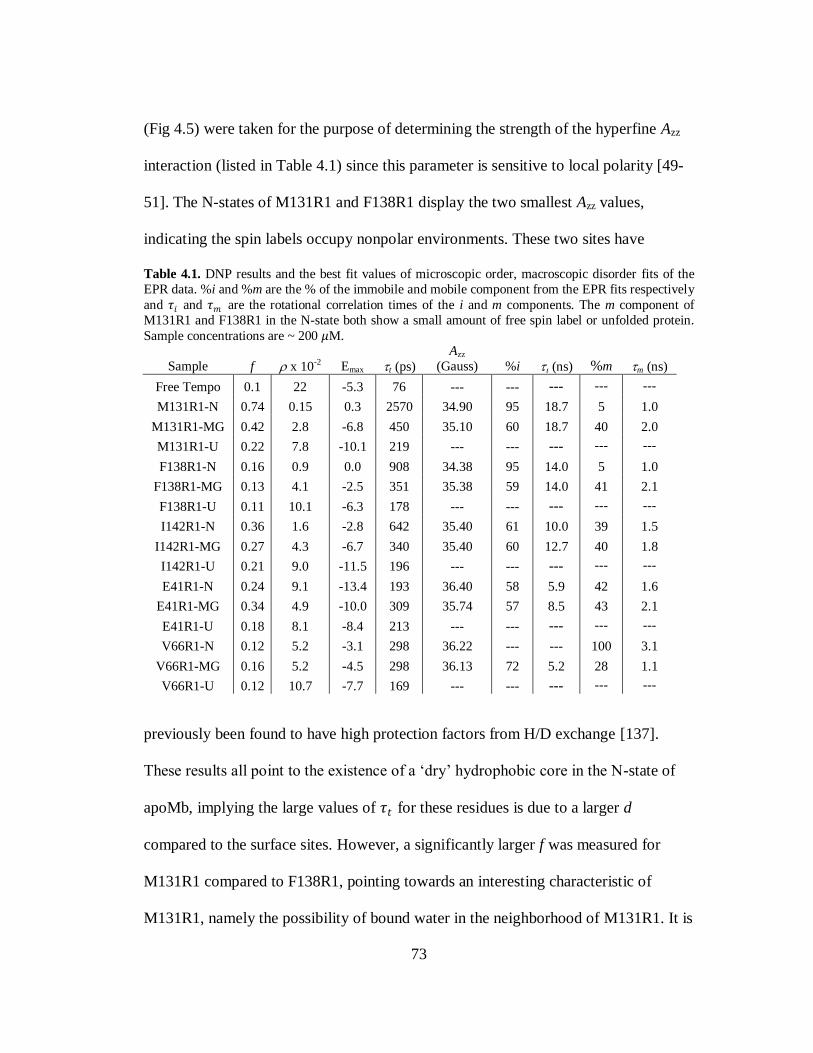
73
(Fig 4.5) were taken for the purpose of determining the strength of the hyperfine Azz
interaction (listed in Table 4.1) since this parameter is sensitive to local polarity [49-
51]. The N-states of M131R1 and F138R1 display the two smallest Azz values,
indicating the spin labels occupy nonpolar environments. These two sites have
Table 4.1. DNP results and the best fit values of microscopic order, macroscopic disorder fits of the
EPR data. %i and %m are the % of the immobile and mobile component from the EPR fits respectively
and 𝜏𝑖 and 𝜏𝑚 are the rotational correlation times of the i and m components. The m component of
M131R1 and F138R1 in the N-state both show a small amount of free spin label or unfolded protein.
Sample concentrations are ~ 200 𝜇M.
Sample f x 10-2 Emax t(ps) Azz
(Gauss) %i (ns) %m m(ns)
Free Tempo 0.1 22 -5.3 76 --- --- --- --- ---
M131R1-N 0.74 0.15 0.3 2570 34.90 95 18.7 5 1.0
M131R1-MG 0.42 2.8 -6.8 450 35.10 60 18.7 40 2.0
M131R1-U 0.22 7.8 -10.1 219 --- --- --- --- ---
F138R1-N 0.16 0.9 0.0 908 34.38 95 14.0 5 1.0
F138R1-MG 0.13 4.1 -2.5 351 35.38 59 14.0 41 2.1
F138R1-U 0.11 10.1 -6.3 178 --- --- --- --- ---
I142R1-N 0.36 1.6 -2.8 642 35.40 61 10.0 39 1.5
I142R1-MG 0.27 4.3 -6.7 340 35.40 60 12.7 40 1.8
I142R1-U 0.21 9.0 -11.5 196 --- --- --- --- ---
E41R1-N 0.24 9.1 -13.4 193 36.40 58 5.9 42 1.6
E41R1-MG 0.34 4.9 -10.0 309 35.74 57 8.5 43 2.1
E41R1-U 0.18 8.1 -8.4 213 --- --- --- --- ---
V66R1-N 0.12 5.2 -3.1 298 36.22 --- --- 100 3.1
V66R1-MG 0.16 5.2 -4.5 298 36.13 72 5.2 28 1.1
V66R1-U 0.12 10.7 -7.7 169 --- --- --- --- ---
previously been found to have high protection factors from H/D exchange [137].
These results all point to the existence of a ‗dry‘ hydrophobic core in the N-state of
apoMb, implying the large values of 𝜏𝑡 for these residues is due to a larger d
compared to the surface sites. However, a significantly larger f was measured for
M131R1 compared to F138R1, pointing towards an interesting characteristic of
M131R1, namely the possibility of bound water in the neighborhood of M131R1. It is
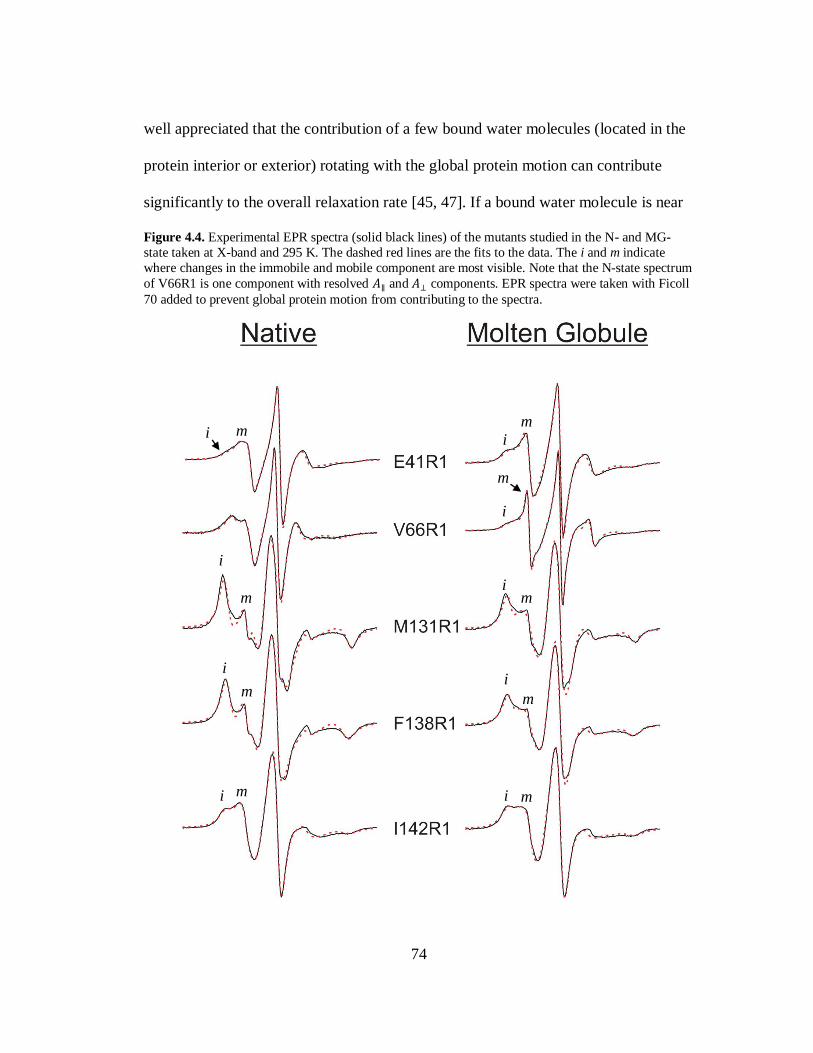
74
well appreciated that the contribution of a few bound water molecules (located in the
protein interior or exterior) rotating with the global protein motion can contribute
significantly to the overall relaxation rate [45, 47]. If a bound water molecule is near
Figure 4.4. Experimental EPR spectra (solid black lines) of the mutants studied in the N- and MG-
state taken at X-band and 295 K. The dashed red lines are the fits to the data. The i and m indicate
where changes in the immobile and mobile component are most visible. Note that the N-state spectrum
of V66R1 is one component with resolved 𝐴∥ and 𝐴⊥ components. EPR spectra were taken with Ficoll
70 added to prevent global protein motion from contributing to the spectra.
i
i
i
i i
i
i
i
i m
m
m
m
m
m
m
m
m
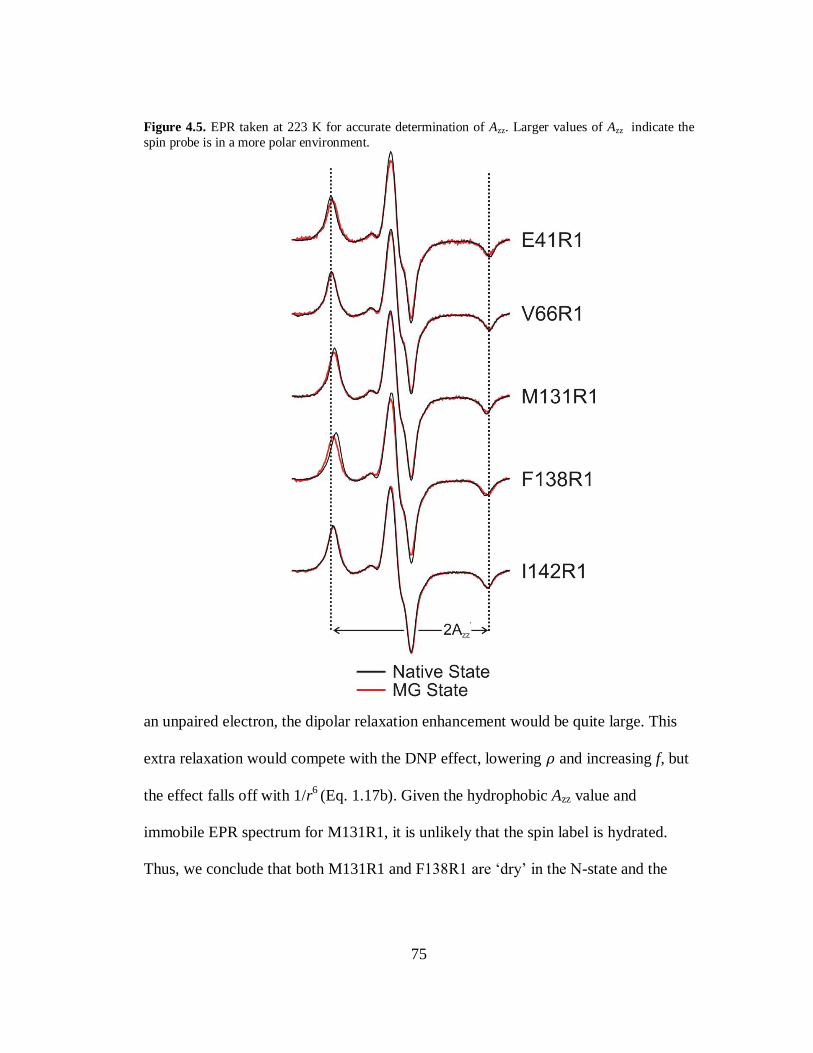
75
Figure 4.5. EPR taken at 223 K for accurate determination of Azz. Larger values of Azz indicate the
spin probe is in a more polar environment.
an unpaired electron, the dipolar relaxation enhancement would be quite large. This
extra relaxation would compete with the DNP effect, lowering 𝜌 and increasing f, but
the effect falls off with 1/r6
(Eq. 1.17b). Given the hydrophobic Azz value and
immobile EPR spectrum for M131R1, it is unlikely that the spin label is hydrated.
Thus, we conclude that both M131R1 and F138R1 are ‗dry‘ in the N-state and the
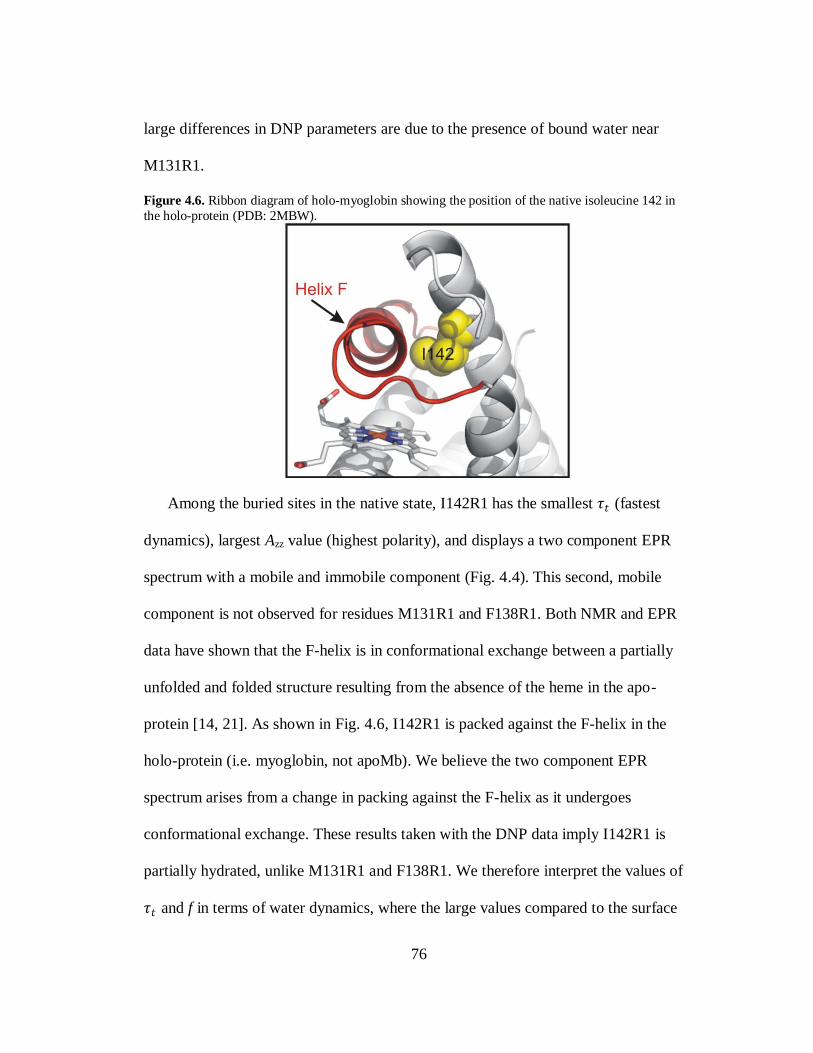
76
large differences in DNP parameters are due to the presence of bound water near
M131R1.
Figure 4.6. Ribbon diagram of holo-myoglobin showing the position of the native isoleucine 142 in
the holo-protein (PDB: 2MBW).
Among the buried sites in the native state, I142R1 has the smallest 𝜏𝑡 (fastest
dynamics), largest Azz value (highest polarity), and displays a two component EPR
spectrum with a mobile and immobile component (Fig. 4.4). This second, mobile
component is not observed for residues M131R1 and F138R1. Both NMR and EPR
data have shown that the F-helix is in conformational exchange between a partially
unfolded and folded structure resulting from the absence of the heme in the apo-
protein [14, 21]. As shown in Fig. 4.6, I142R1 is packed against the F-helix in the
holo-protein (i.e. myoglobin, not apoMb). We believe the two component EPR
spectrum arises from a change in packing against the F-helix as it undergoes
conformational exchange. These results taken with the DNP data imply I142R1 is
partially hydrated, unlike M131R1 and F138R1. We therefore interpret the values of
𝜏𝑡 and f in terms of water dynamics, where the large values compared to the surface
77
sites imply a slow apparent diffusion coefficient for the hydration water instead of a
larger d.
In the MG-state, all three buried sites have a two component EPR spectrum with
an immobile component of ~ 60% and a mobile component contributing ~ 40%
(Table 4.1). The more mobile spectra for M131R1 and F138R1 in the MG compared
to the N-state suggest reduced packing of the side chains. Also, a measured increase
in Azz for F138R1, indicates this side chain is in a more polar environment in the MG-
state than in the N-state. This is not unexpected as the A, B, G, and H helices making
up the hydrophobic core are known to be mostly formed in the MG, but with some
fraying at the ends [21] along with a decrease of H/D protection factors for all buried
sites [137]. Taken together, these results point towards the hydrophobic core of
apoMb being hydrated in the MG-state. This is consistent with the DNP
measurements that display dynamic water with 𝜏𝑡 ~350-450 ps for the buried sites in
the MG state. Yet, the 𝜏𝑡 values for the buried sites in the MG-state are still larger
than those of the exterior sites (𝜏𝑡 ~ 300 ps), consistent with the picture of a ‗looser‘
hydrophobic core that is largely, but not completely formed.
While both the 𝜏𝑡 and f values of all interior sites significantly decrease in the MG
compared to the N state, M131R1 again displays the largest 𝜏𝑡 and f values, and most
immobile EPR spectrum. This could be due to the motion of water near M131R1
being more restricted compared to F138R1 and I142R1. It is also possible, that bound
water continues to play a role in the MG-state (as assumed to be the case in the N-
state), although to a lesser extent due to the more dynamic nature of the MG. It is
78
interesting that the EPR spectrum for I142R1 in the MG-state is similar to the N-state,
while the DNP results show a significant decrease in 𝜏𝑡 and f, implying faster water
dynamics near in the MG-state for this residue. This shows that hydration dynamics
around protein residues can be distinctly different, while the local protein dynamics
are similar. Lastly, it is important to note that the estimated 𝜏𝑡 of 350-450 ps
represents a weighted average between the different conformations that the MG state
is probing, as presented by the two EPR components.
Solvent Exposed Residues
The large differences in 𝜏𝑡 observed between the buried sites versus those
exposed to the solvent (E41R1 and V66R1) in the folded state confirm that water is
able to more freely diffuse on the exterior of the protein. The observation of
heterogeneous surface hydration dynamics, especially in the N state, emphasizes the
importance of employing site-specific probes as the charge, polarity and local
topology may all contribute to variations of local water dynamics [15, 16, 142]. The
N-state values for 𝜏𝑡 of 190 and 300 ps for E41R1 and V66R1 respectively are about
2-4 times slower than our measured 𝜏𝑡 of 76 ps for bulk water [19]. This is in
agreement with previous results that found surface hydration water is slowed by a
factor of 2-4 compared to bulk water [44, 45, 117, 123, 142]. The EPR spectrum for
both surface sites also display much higher mobility compared to the buried sites, as
expected (Fig. 4.4 and Table 4.1).
A dramatic increase in 𝜏𝑡 is observed for E41R1 in the MG-state compared to the
N-state, which is an unexpected result. The EPR spectrum of E41R1 in the MG- as
79
well as in the N-state has two components, but the mobility of the side chain is
reduced in the MG-state. The Azz value of E41R1 also decreases, suggesting reduced
polarity at this site in the MG- compared to the N-state. We propose the decreased
mobility, polarity, and the increase in 𝜏𝑡 and f are due to the MG sampling non-native
conformations in which E41R1 gets partially buried in more hydrophobic regions.
This is consistent with NMR data on apoMb that implied stabilization of the C-helix
was due to packing against the hydrophobic core, although this region undergoes
considerable conformational averaging [21]. A previous study using time resolved
fluorescence spectroscopy also mapped out hydration dynamics around site E41, but
found faster hydration dynamics in the MG- compared to the N-state for this residue
[16]. This study also found that the hydration dynamics of E41 were similar to those
of buried sites—a trend clearly not observed with DNP nor generally expected. As
mentioned for MG interior sites, our DNP results report on hydration dynamics
averaged over different confirmations. It is possible that tryptophan fluorescence
spectroscopy is not equally sensitive to conformations with distinctly different
exposure to water, which may explain the conflicting observations.
The DNP results for V66R1 in the MG-state are very similar to that of the N-state,
but the EPR spectrum is quite different and now presents two components. The two
component spectrum is likely due to conformational averaging in the E-helix as
previously reported [21]. The Azz value for V66R1 does not change much in the MG
compared to the N-state, suggesting the polarity of the local environment remains
similarly high. Although the backbone dynamics around 66R1 differ significantly
80
between the N and MG-state, the DNP results suggest the dynamics of hydration
water is similarly fast between the two states. However, it is possible that the
hydration dynamics of the two conformations of the MG-state differ significantly and
their weighted average coincidentally happens to be the same as the N-state. Given
that the N-state is already hydrated with dynamic water, we consider this scenario
unlikely.
Acid Unfolded State
All residues studied display characteristics of full solvent exposure with 𝜏𝑡
between 169-219 ps in the U-state and mobile single component EPR spectra. The
dispersion in 𝜏𝑡 is much smaller than observed in the MG and N-states, but small
differences are still observed. The dramatic decrease in the dispersion of 𝜏𝑡 suggest
that the local topology, charge, hydrophobicity, and polarity upon formation of the
secondary or tertiary structure is a stronger determinant of local hydration dynamics
than the characteristics of the primary protein sequence. The small dispersion that
persists in the U-state may arise from non-negligible polar or charge effects in the
primary amino acid sequence, or from some remaining helical structure known to
persist in the U-state [21].
C. Conclusion
We find the hydration dynamics of the native state of apomyoglobin to be vastly
heterogeneous, with clear differences observed for each site investigated. In the N-
state, the interior residue I142R1 directly interacts with dynamic water, but on a much
slower timescale than the solvent exposed residues. This is likely due the disordered
81
F-helix of the apo-protein, while the interior residues, M131R1 and F138R1 display
characteristics of a ‗dry‘ hydrophobic core. The two surface sites, E41R1 and V66R1,
in the N state both display fast hydration dynamics that are only 2-4 times slower than
bulk water dynamics. The EPR spectra of the molten globule agree with previous
studies showing the H-helix is mostly formed. However, all sites studied show two
component EPR spectra with a more mobile conformation, suggesting reduced
packing of the side chains and some conformational averaging. The DNP experiments
found significantly faster hydration dynamics for the buried sites in the MG-state
compared to the N-state. Taking the DNP and EPR observations together, we
conclude that the interior of the molten globule is hydrated with dynamic water. Still,
the hydration dynamics of these buried sites are measurably slower than the surface
sites in the MG-state. A peculiar observation was made for, E41R1, which displayed
greatly slowed dynamics compared to the N-state; in contrast to a previous study [16].
We attribute this slowing down to the protein side chain sampling non-native
conformations in which the spin label becomes somewhat buried in the MG state. The
large dispersion for 𝜏𝑡 observed in the N-state is reduced in the MG-state, and further
reduced in the acid unfolded state, implying that the local topology determined by the
protein structure significantly impacts the hydration dynamics landscape and amino
acid sequence specific effect play a secondary role.
82
D. Materials and Methods
Protein expression, purification and general characterization.
A modified pET-17b vector (Novagen, Madison, WI) carrying the gene for wild
type sperm whale myoglobin was a generous gift from Steven Boxer (Stanford
University, CA). Five mutagenic plasmid DNAs, each carrying one of the apoMb
cysteine (Cys) point mutations E41C, V66C, M131C, F138C and I142C were
generated via the QuickChange kit (Stratagene, La Jolla, CA), as described [14]. Each
plasmid was transformed into E. coli BL21 DE3 cells (Novagen, Madison, WI). In
vivo protein expression was carried out in LB medium at 37˚C. ApoMb
overexpression was induced upon addition of isopropyl--D-thiogalactopyranoside (1
mM) at OD600 = 0.8. Cells were harvested at OD600 ≈ 1.8. Cell lysis, inclusion body
resuspension and HPLC purification were performed according to published
procedures [143, 144]. Protein purity and identity were verified by reverse phase
analytical HPLC and either electrospray ionization or MALDI mass spectrometry.
Generation of nitroxide-labeled apoMb.
Lyophilized apoMb was solubilized in 6 M urea and 10 mM sodium acetate at pH
6.1 for 30 min at 4˚C. For mutants carrying surface Cys (E41C and V66C), the
solubilized protein was diluted seven-fold in 10 mM sodium acetate at pH 6.1. A 10-
fold molar excess of 1-oxyl-2,2,5,5-tetramethyl-3-pyrroline-3-methyl
methanethiosulfonate (MTSL, R1; Toronto Research Chemicals, North York,
Ontario) was added under gentle stirring at 4˚C. For mutants carrying buried Cys,
(M131C, F138C and I142C) the solubilized protein was diluted 2.1-fold with 10 mM
83
sodium acetate at pH 6.1 to a final 2.8 M urea concentration before rapid addition of a
10-fold molar excess of MTSL under stirring at 4˚C. Both reactions were allowed to
proceed for 18 hrs at 4˚C. The reaction mixture for the mutants carrying the buried
Cys was diluted 3.3-fold with 10 mM sodium acetate at pH 6.1 and incubated for 30
min at 4˚C under gentle stirring, to promote refolding. After the above treatment, each
protein solution was dialyzed extensively against 10 mM sodium acetate at pH 6.1 at
4˚C to eliminate urea and excess MTSL. Spin-labeled protein solutions were then
independently concentrated with an Amicon Ultra device (3,000 MWCO; Millipore,
Billerica, MA) and flash-frozen in separate aliquots. Protein concentrations were
assessed by absorption spectroscopy (280 = 15,200 cm-1
M-1
). Labeling efficiencies
were assessed by reverse phase analytical HPLC on a C18 column (Grace, Deerfield).
Labeling efficiencies for the E41R1 and V66R1 mutants were >95%, and labeling
efficiencies for the M131R1, F138R1 and I142R1 mutants varied between 61 and
90%. Successful apoMb spin labeling was confirmed by electrospray ionization or
MALDI mass spectrometry and electron spin resonance.
Sample preparation for DNP measurements
In preparation for DNP experiments, frozen sample aliquots were thawed in an ice
bath and kept cold until ready for DNP data collection. The pH of the samples was
adjusted using 0.1 M HCl or NaOH for the pH 4.1 and 6.1 samples and 1 M HCl was
used to decrease the pH to 2.2 for the unfolded samples. Samples were then passed
through a Sephadex G-25 column to remove any aggregated species [134]. Prior to
loading the sample on the spin column, the column was equilibrated by repeated
84
washes with buffer at the sample pH as the sample. The concentration of protein was
checked after the spin column by measuring the absorbance at 280 nm. Samples were
slightly more dilute after the spin column with typical concentrations of ~ 200 𝜇M.
Far-UV circular dichroism (CD): spectral data collection
Far-UV CD experiments were carried out at equilibrium on a MOS-450
spectropolarimeter (Bio-Logic Science Instruments, Claix, France) with a 1 mm
pathlength cuvette (Hellma, Müllheim, Germany). CD scans were performed at room
temperature in 1 nm steps, with 20 s signal averaging per step. Mean residue
ellipticity (MRE; deg cm2 dmol
-1) was determined according to the relation 𝑀𝑅𝐸 =
𝜃10𝐶𝑁𝐴𝑙
where 𝜃 denotes the experimental ellipticity (in mdeg), C is the molar
concentration of the protein, NA is the number of amino acids (NA = 153 for apoMb),
and l is the cuvette path length (in cm).
Far-UV circular dichroism (CD): pH titrations
Equilibrium pH titrations on all the nitroxide-labeled apoMb variants were
performed by far-UV CD at 222 nm quartz cuvettes with 10-mm path length at room
temperature. A concentrated protein stock solution (ca. 300 µM in 10 mM sodium
acetate, pH 6.1) was diluted into 1 mM sodium acetate at pH 6.1 to generate ~ 20 µM
protein solutions. The pH of these starting solutions was progressively lowered upon
addition of either 0.1 M or 1 M acetic acid (to pH down to ~ 3) or concentrated HCl
(to pH < 3). Samples were allowed to equilibrate at the desired pH for ≥ 10 min.,
prior to data acquisition, and data were collected in sequence on the same sample.
Independent duplicate pH titrations were performed on each apoMb variant.
85
DNP and EPR Experiments
DNP experiments were performed at 0.35 T in a Bruker TE102 rectangular cavity
using a homebuilt NMR probe and a Bruker Avance 300 NMR spectrometer.
Experiments were performed at room temperature and air was continuously flowed
through the cavity to minimize sample heating. Also, only ~ 3 𝜇L of sample was
loaded into a 0.64 mm inner diameter quartz capillary to minimize the electric field
component of the microwave radiation at the sample, and thus heating. Further details
of the DNP hardware were previously described in chapter three. Prior to each DNP
experiment an EPR spectrum of the same sample was taken, and the magnetic field
set to the position of the center line. To determine the leakage factor, T1
measurements were performed in a wide bore Oxford superconducting magnet
charged to 0.35 T. The broadband channel of a commercial Bruker probe was used to
perform an inversion recovery pulse sequence and the data fit to Iz = I0 -2Aexp(-t/T1)
where I0, A¸ and T1 were fit parameters.
The EPR spectra were recorded at 295 K in a Bruker ELEXSYS 580 fitted with a
high-sensitivity resonator using an incident microwave power of 20 mW and
modulation amplitude of 1 Gauss. Samples of at least 6 μl were loaded in sealed
capillary tubes (0.6 ID X 0.84 OD; VitroCom, Inc., NJ). Spectra were recorded at X-
band frequency with a scan width of 100 Gauss. The spectra were recorded in 25%
(w/w) Ficoll 70 in order to increase the solution viscosity, and thereby minimize the
contribution from protein rotational diffusion to the EPR spectral line shape [14]. The
final protein concentration for EPR measurements was ~ 200-400 μM. To obtain the
86
experimental hyperfine splitting values (2Azz) in the absence of motion, the EPR
spectra were recorded at 223 K using an incident microwave power of 0.2 mW and a
modulation amplitude of 2 Gauss. The hyperfine splittings were determined by
individually fitting the low- and high-field peaks to a mixture of Lorentzian and
Gaussian lineshapes using the Xepr program (Bruker, Germany) and by measuring
the magnetic field separation between the low- and high-field peaks to obtain 2Azz.
Single- and multiple- component EPR spectra were simulated with the NLSL
program assuming a two-component MOMD (microscopic order, macroscopic
disorder) model to describe the anisotropic motion of the nitroxide [53]; the software
is available at ftp://ftp.ccmr.cornell.edu/pub/freed. For all simulations the starting
values for the A and g magnetic tensors were taken as gxx = 2.0078, gyy = 2.0058, gzz =
2.0022, and Ax = 6.2, Ay = 5.9. The Az value for each residue was obtained as
described above (223 K) and was kept constant during the fitting procedure. The
log10 of the three components of the rotational diffusion tensor are given in a
modified spherical form as <R> = ⅓(Rx+Ry+Rz), N = Rz - ½(Rx+Ry), and Nxy = (Rx-
Ry), where Rx, Ry, and Rz are the principal components in Cartesian form. The
immobile states of E41R1, V66R1 (MG-state), and I142R1 are taken to have isotropic
motion with N=Nxy=0, while the other states have axially symmetric z-axis
anisotropic motion with tilt angles of the diffusion tensor αD= 0˚,βD= 36˚,γD=0˚, and
subject to an ordering potential described by the coefficient C20 from which the order
parameter is computed. Least-square fits were obtained by variation of <R>, N, C20.
After these parameters were optimized, the principal values of A and g magnetic
87
tensor (except Azz) were allowed to vary slightly to obtain the final best fit. From the
final fits, the effective correlation time was calculated as τ = 1/6<R> [53] and
reported in Table 1.
88
V. A 200 GHz Quasi-Optical DNP and EPR Spectrometer
A. Introduction
As mentioned in chapter one, most NMR experiments are carried out high
magnetic fields due to greater sensitivity and spectral resolution. These same
advantages can be taken advantage of in DNP experiments at high field, although this
is experimentally much more challenging as the e- spin resonance frequency is
already 95 GHz at 3.35 T (still a small magnetic field compared to standard NMR
magnets). However, recent years have seen a resurgence in the use of high field DNP
detected by both NMR and EPR with applications including structure and dynamics
of biological molecules [145-147], reaction monitoring, [148, 149] imaging, [150,
151] and the study of electron-nuclei interactions [12; 152- 154]. Much of this is due
to advances in methods [155, 156] and technology [26, 27] resulting in improved
DNP efficiency, increasing the range of samples that can be studied, and wider
availability of instrumentation. These developments have led to a number of
commercial instruments, for instance a 9 T gyrotron-based system by Bruker Biospin
and diode-based 3.35 T dissolution systems by GE and Oxford. As impressive as
these achievements are, the fact remains that commercial instruments are expensive
and require significant lab space, while building a gyrotron-based microwave source
or a sub-1.5 K cryogenic system with rapid melting and sample shuttling is beyond
the expertise of most groups. We pursue to bridge this gap by building a
comparatively inexpensive and compact DNP and EPR spectrometer based on a solid
89
state 200 GHz source and a quasi-optical, millimeter-wave bridge. This system was
added onto an existing 7 T, vertical bore magnet.
Quasi-optical techniques have been employed in EPR experiments for over two
decades at frequencies ranging from 95 to 420 GHz [157-165]. Quasi-optical
transmission has several advantages over waveguides for millimeter-wave
propagation. As the radiation propagates through free space guided by mirrors and
wire-grid polarizers, the quasi-optical bridge is nearly lossless. Another key feature of
our bridge is that the only components that are frequency dependent are the source
and detector, giving the potential to perform EPR and DNP experiments over a wide
range of frequencies. Finally, optical techniques allow the polarization of the beam to
be used as a means to separate the EPR signal returning from the sample from the
reflected background signal, enabling up to 60 dB of isolation [166]. The capability
of manipulating the polarization of light can be further utilized to excite electron spin
resonance transitions using circularly, as opposed to linearly, polarized radiation that
results in an up to two-fold gain in effective power [158, 162] as only the handedness
of polarization in the direction of the e- precession can excite e
- spin transitions. Solid
state sources only have tens of milli-watts of power at 200 GHz, and many high field
DNP experiments require high microwave power, particularly at higher temperatures
where enhancements are often power limited. We propose to employ circularly
polarized 200 GHz radiation for DNP experiments to make the most efficient use of
available power.
90
In this chapter we describe our unique experimental setup that is capable of
performing both DNP and EPR experiments and report on our initial results. The
main components of this instrument are a quasi-optical bridge equipped with a
frequency-tunable and switchable solid state 200 GHz diode source. A Martin-Puplett
interferometer [162, 167] is built into the quasi-optical bride to allow for easy
adjustment from circularly polarized radiation for DNP experiments to linearly
polarized radiation for induction mode EPR detection. The bridge is mounted on an
optical table and aluminum stand, and guides the beam into a corrugated waveguide
placed within a cryostat inside the vertical bore of a 7 T magnet. The entire setup
does not require significant space around the magnet, can be added to existing
standard or wide bore magnets, and is an order of magnitude less expensive than
commercial instruments. Few systems exist above 5 T that can make both NMR-
detected DNP and EPR measurements [168], and ours is unique as field swept EPR
detection is built in as a permanent part of the setup. This bridge design has since
been copied by other groups for DNP experiments [169]
DNP and EPR experiments were carried out at 4 K on a sample of 13
C labeled
urea with 40 mM trityl radical dissolved in a deuterated glycerol/water solution.
Unlike nitroxide radicals, the unpaired electron of a trityl radical belongs to a carbon
nucleus that is 99% 12
C which is spin 0. Therefore, the trityl radical has only as a
single, narrow EPR line. For these sample conditions DNP signal enhancements were
not limited by the power of our diode source. We also demonstrate that when
operating in a power-limited regime, utilizing circularly polarized radiation increased
91
the DNP signal enhancements by 28% compared to linear polarization. The ability to
manipulate the polarization of light demonstrates the value of using quasi-optical
techniques. Further improvement is expected at higher temperatures or when
saturating broader EPR spectrum where limited power becomes more problematic.
B. Experimental
Quasi-Optical bridge
A figure of the reflection mode, quasi-optical EPR bridge is shown in figure 5.1.
The diode source, purchased from Virginia Diodes Inc., is tunable in the range of
193-201 GHz, and consists of a 12 – 12.5 GHz yttrium-iron-garnet (YIG) oscillator
(from Microlambda Wireless) that passes through a voltage-controlled attenuator
before being multiplied up 16 times by 4 doublers. The peak power of the source is ~
70 mW. The setup currently operates in continuous wave (cw) mode, but it is possible
to implement pulse operation in the future with the addition of a pin switch. The
source connects to a feed horn that outputs a Gaussian beam with a waist radius of 4
mm. The output horn, quasi-optical bridge, and a corrugated waveguide for
propagation of the microwaves into the magnet were purchased from Thomas Keating
Ltd. (with a corrugated waveguide extension purchased from Bridge 12 Technologies
Inc.). All optical components are mounted onto an aluminum plate, patterned so that
pieces can be easily moved for different applications.
In configuration A (defined in Fig. 5.1) the source is mounted so that the
polarization of the beam is 45° to the normal of the page. The beam reflects off an
elliptical mirror (all elliptical mirrors have a focal length of 25 cm), planar mirror,
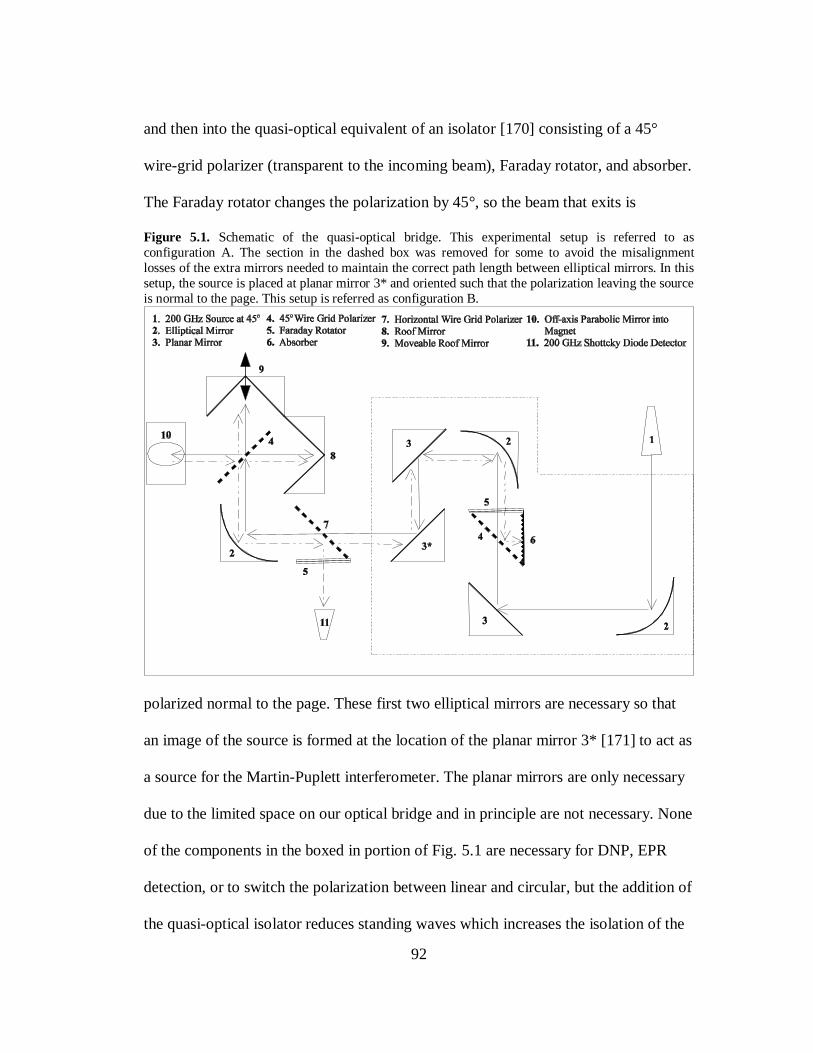
92
and then into the quasi-optical equivalent of an isolator [170] consisting of a 45°
wire-grid polarizer (transparent to the incoming beam), Faraday rotator, and absorber.
The Faraday rotator changes the polarization by 45°, so the beam that exits is
Figure 5.1. Schematic of the quasi-optical bridge. This experimental setup is referred to as
configuration A. The section in the dashed box was removed for some to avoid the misalignment
losses of the extra mirrors needed to maintain the correct path length between elliptical mirrors. In this
setup, the source is placed at planar mirror 3* and oriented such that the polarization leaving the source
is normal to the page. This setup is referred as configuration B.
polarized normal to the page. These first two elliptical mirrors are necessary so that
an image of the source is formed at the location of the planar mirror 3* [171] to act as
a source for the Martin-Puplett interferometer. The planar mirrors are only necessary
due to the limited space on our optical bridge and in principle are not necessary. None
of the components in the boxed in portion of Fig. 5.1 are necessary for DNP, EPR
detection, or to switch the polarization between linear and circular, but the addition of
the quasi-optical isolator reduces standing waves which increases the isolation of the
93
EPR signal, and also helps to protect the source from reflected power. The Faraday
rotator has a small loss of ~ 2 dB but this loss is usually offset by gains from the
elimination of standing waves. Misalignments of the extra mirrors needed for the
isolator (discussed below) however resulted in larger losses. Therefore, some DNP
experiments presented were done with this section removed, and the source placed at
the location of the planar mirror 3*, oriented such that the polarization leaving the
source was normal to the page (referred to as configuration B). It is important to
mention that more careful and accurate alignment should reduce the observed power
losses significantly.
From the third planar mirror, the beam passes through a horizontal wire-grid
polarizer and into the Martin-Puplett interferometer. There, a 45° wire-grid polarizer
acts as a beam splitter, creating two separate path lengths. The two roof mirrors rotate
the polarization 90° upon reflection. The recombined beam leaving the beam splitter
will have a polarization that is a function of the path length difference, , between the
two roof mirrors. When = 0 ± 2n or ± 2n, where n is an integer, the
polarization of the beam is linear, while for = ± 2n or 3 ± 2n the
polarization is left or right circularly polarized respectively [167]. Note that for all
other path length differences, the polarization exiting the interferometer will be
elliptical.
When on resonance with linear polarization irradiating the sample, a small cross
polarized EPR signal is reflected back up the corrugated waveguide along with a
large background signal [162]. In the ideal situation, only the EPR signal (dashed line
94
in Fig. 5.1) is reflected by the horizontal wire-grid polarizer and into the 200 GHz
Schottky diode detector (Virginia Diodes Inc.). The remaining background signal
(dotted-dashed line in Fig. 5.1) will travel back to the quasi-optical isolator and
dumped into the absorber. If circularly polarized radiation is incident upon the sample
(as is done for DNP experiments), the opposite is true and most of the reflected power
from the sample will be directed into the detector. Typically a 15-20 dB of isolation
was measured between the forward power and power reflected into the detector when
linear polarization was used. Inclusion of the isolator in configuration A increased the
isolation an additional 6-10 dB through the elimination of standing waves. Currently,
our EPR detection has limited sensitivity as we lack homodyne or heterodyne
detection. This is not a fundamental impediment however, and can be added to the
bridge by adding a local oscillator reference arm to the bridge.
The optical bridge is held above the magnet with an aluminum stand (homebuilt)
that allows for adjustment of the bridge in all three dimensions as well as the angle
for accurate alignment of the microwave beam into the waveguide. As the wavelength
is only 1.5 mm, the ability to adjust the height, position, and angle of the quasi-optical
bridge above the magnet is crucial as coupling of the microwaves into the corrugated
waveguide is sensitive to small misalignments [172]. The alignment was checked
with a pyroelectric detector at the end of the corrugated waveguide inside the magnet
to measure the relative power that is coupled into the waveguide.
EPR/DNP Probe
95
From the quasi-optical bridge, the microwaves are coupled into a 12.5 mm
diameter corrugated waveguide that is placed into the 89 mm bore of a 7 T Bruker
magnet. As the waveguide approaches the center of the magnetic field, it tapers to 5.3
mm. Figure 5.2 shows a schematic of the combination EPR/DNP probe.
Approximately 50 𝜇L of sample is placed in a polyethylene sample holder that rests
on a mirror, and is placed against the exit of the corrugated waveguide. A 75.5 MHz
copper wire saddle coil was built around a 12 mm OD/10 mm ID pyrex glass tube,
that encloses the sample and is held in place from the bottom by a support attached to
the waveguide. No effort was made to contain the microwaves between the end of the
waveguide and the mirror below the sample. This certainly results in a loss of
sensitivity in our EPR detection and may also reduce our isolation due to scattering of
radiation. The tuning circuit for the NMR coil was a simple parallel LC circuit made
with non-magnetic fixed chip capacitors (American Technical Ceramics) that were
mounted near the coil. A 3.8 cm OD solenoid modulation coil (magnetic field parallel
to B0) for EPR was wrapped around a teflon cylinder and placed just below the
sample and outside the NMR coil. Semi-rigid coaxial cables were used to connect the
modulation coil to the output of a Stanford Research Systems lock-in amplifier and
the NMR coil to a Bruker Avance 300 MHz (2 channel) NMR spectrometer. A
resistive sweep coil, generously provided to us by R. David Britt at UC-Davis [173],
was placed inside the bore of the 7 T magnet. An Agilent 120 V, 18 A power supply
provides the sweep coil with a maximum field of ±380 Gauss. A Janis STVP-200-
NMR cryostat was custom designed to fit inside the resistive sweep coil and used to
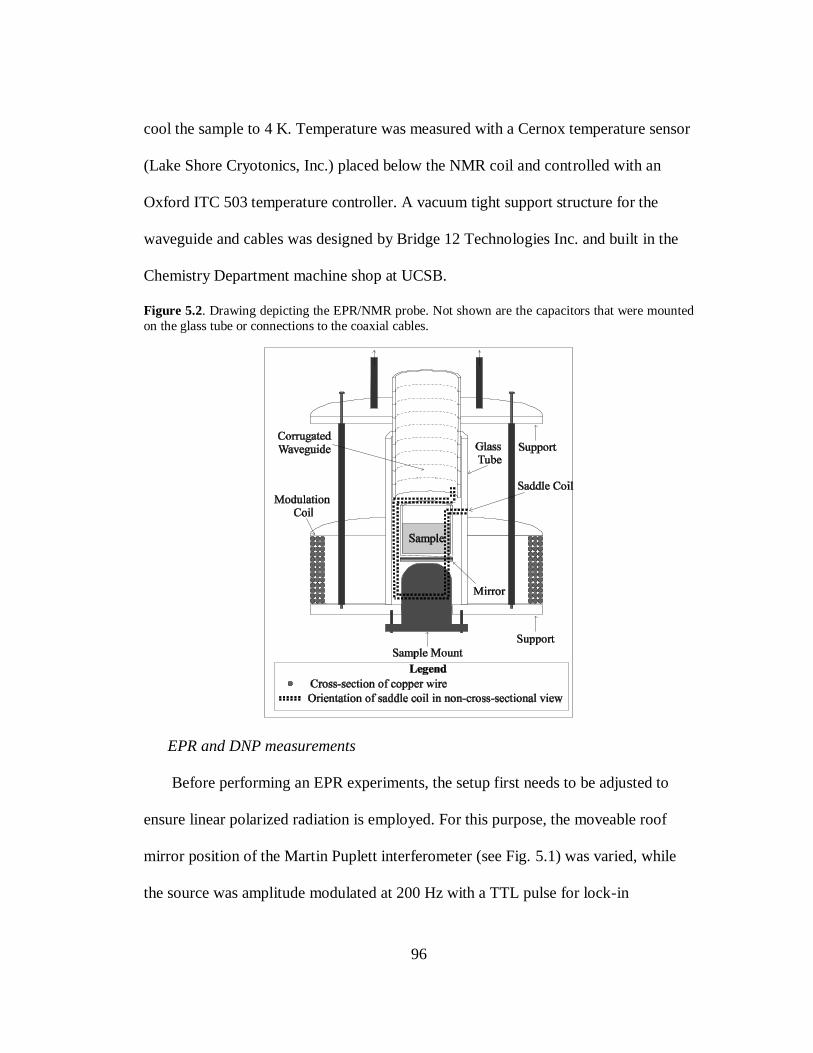
96
cool the sample to 4 K. Temperature was measured with a Cernox temperature sensor
(Lake Shore Cryotonics, Inc.) placed below the NMR coil and controlled with an
Oxford ITC 503 temperature controller. A vacuum tight support structure for the
waveguide and cables was designed by Bridge 12 Technologies Inc. and built in the
Chemistry Department machine shop at UCSB.
Figure 5.2. Drawing depicting the EPR/NMR probe. Not shown are the capacitors that were mounted
on the glass tube or connections to the coaxial cables.
EPR and DNP measurements
Before performing an EPR experiments, the setup first needs to be adjusted to
ensure linear polarized radiation is employed. For this purpose, the moveable roof
mirror position of the Martin Puplett interferometer (see Fig. 5.1) was varied, while
the source was amplitude modulated at 200 Hz with a TTL pulse for lock-in
97
detection. The reflected power on the detector was measured as a function of mirror
position. The minimum of this curve corresponds to linear polarization, and this
position was used for induction-mode EPR detection. During an EPR experiment, the
B0 field was swept using the resistive sweep coil. A lock-in amplifier was used to
drive a solenoid B0 modulation coil at 35 kHz and detect the signal from the 200 GHz
Schottky diode detector. The source power and modulation amplitude were chosen to
minimize line broadening of the EPR signal. The program Labview was used to
control the resistive coil and record the signal from the lock-in amplifier, as well as
control the position of the moveable roof mirror. Since our current setup does not
allow for coherent detection, data was exported into Mathematica and a Hilbert
transform was applied to adjust the phase of the EPR spectra [174].
Except where noted, DNP experiments were done with maximum microwave
power (~70 mW). The NMR saddle coil was measured to have a 𝜋/2 pulse of 8 𝜇s at
75.48 MHz. A DNP experiment began by applying a series of saturation pulses of 25
ms duration to destroy the 13
C z-magnetization. This was followed by a delay time,
during which the sample was irradiated with microwaves. The resulting 13
C z-
magnetization was read out using a 𝜋/2 excitation pulse. The only exception to this
sequence was when measuring the decay of magnetization after irradiating the sample
with microwaves for ~ 2 hours. In this experiment the microwaves were turned off
and 1° rf excitation pulses applied at various times to measure the decay of the DNP-
enhanced NMR signal without substantially depleting the z-magnetization.
C. Results and Discussion
98
To characterize our setup, we performed DNP and EPR experiments on a sample
of 12 M 13
C labeled urea dissolved in a 50/50 by volume mixture of D2O and d-
glycerol with 40 mM of the trityl radical Oxo 63 at 4 K (the structure of this radical
can be found in ref. [175]). Ardenkjaer-Larsen et. al. used a similar sample in their
pioneering work, and although they noticed a decrease in NMR signal enhancements
above 15 mM trityl concentrations, there was also a significant shortening of the DNP
build up and T1 relaxation times [26]. The 40 mM trityl concentration was thus
chosen to shorten the experimental time, while still obtaining high DNP polarization.
Figure 5.3 shows the 13
C NMR spectra with and without microwave irradiation after a
build up time of 3,500 s using configuration B (Fig. 5.1). The measured enhancement
factor is 225. The DNP enhancement was not observed to vary with decreasing
microwave power until ~ 7 dB of attenuation was applied (i.e. ~15 mW output power)
in this setup. Even though the Faraday rotator was measured to have only 2 dB of
insertion loss, its inclusion as part of configuration A decreased the enhancement
values further than what is expected from the 2 dB decrease in power. We estimate
that the effective attenuation amounts to ~10 dB when switching from configuration
B to A. We attribute this to misalignment of the five extra mirrors in configuration A
that must be included with the quasi-optical isolator in order to maintain the correct
path length to image the source on the corrugated waveguide [171, 176]. It is a known
problem that at higher microwave frequencies, as employed here, that misalignment
of optical components results in greater losses than at lower frequencies [172]. We
observed decreases in power to the sample as large as 50% with misalignments of
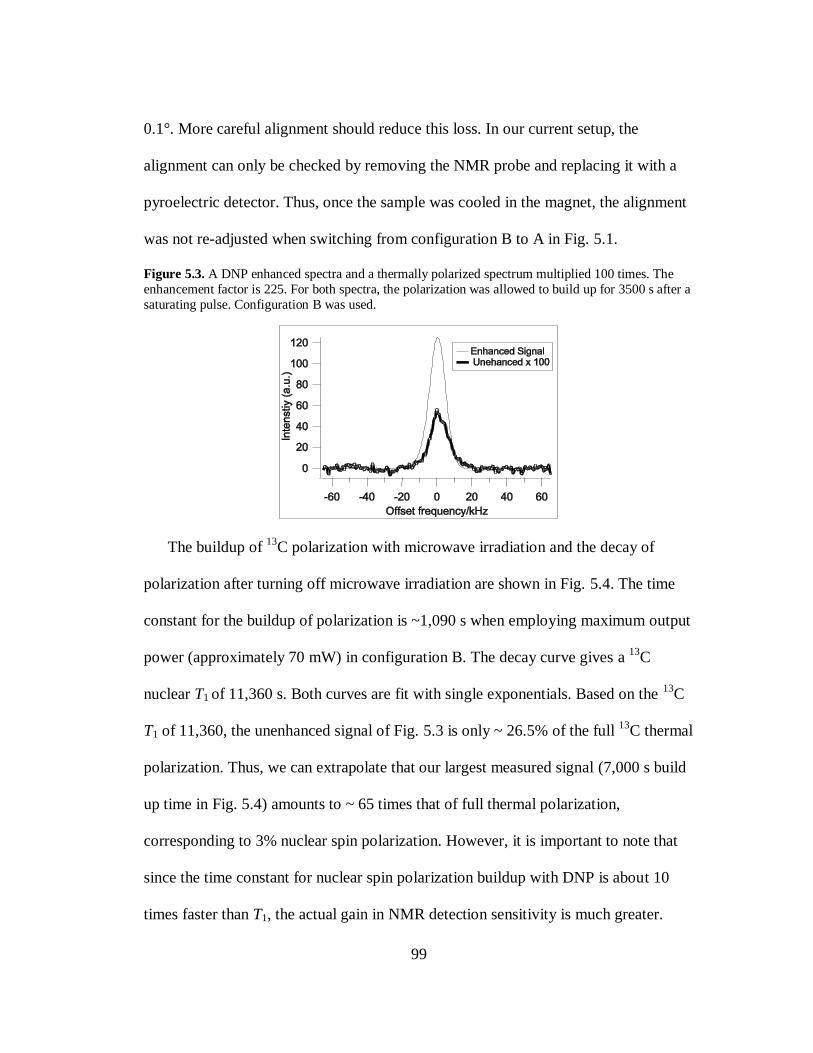
99
0.1°. More careful alignment should reduce this loss. In our current setup, the
alignment can only be checked by removing the NMR probe and replacing it with a
pyroelectric detector. Thus, once the sample was cooled in the magnet, the alignment
was not re-adjusted when switching from configuration B to A in Fig. 5.1.
Figure 5.3. A DNP enhanced spectra and a thermally polarized spectrum multiplied 100 times. The
enhancement factor is 225. For both spectra, the polarization was allowed to build up for 3500 s after a
saturating pulse. Configuration B was used.
The buildup of 13
C polarization with microwave irradiation and the decay of
polarization after turning off microwave irradiation are shown in Fig. 5.4. The time
constant for the buildup of polarization is ~1,090 s when employing maximum output
power (approximately 70 mW) in configuration B. The decay curve gives a 13
C
nuclear T1 of 11,360 s. Both curves are fit with single exponentials. Based on the 13
C
T1 of 11,360, the unenhanced signal of Fig. 5.3 is only ~ 26.5% of the full 13
C thermal
polarization. Thus, we can extrapolate that our largest measured signal (7,000 s build
up time in Fig. 5.4) amounts to ~ 65 times that of full thermal polarization,
corresponding to 3% nuclear spin polarization. However, it is important to note that
since the time constant for nuclear spin polarization buildup with DNP is about 10
times faster than T1, the actual gain in NMR detection sensitivity is much greater.
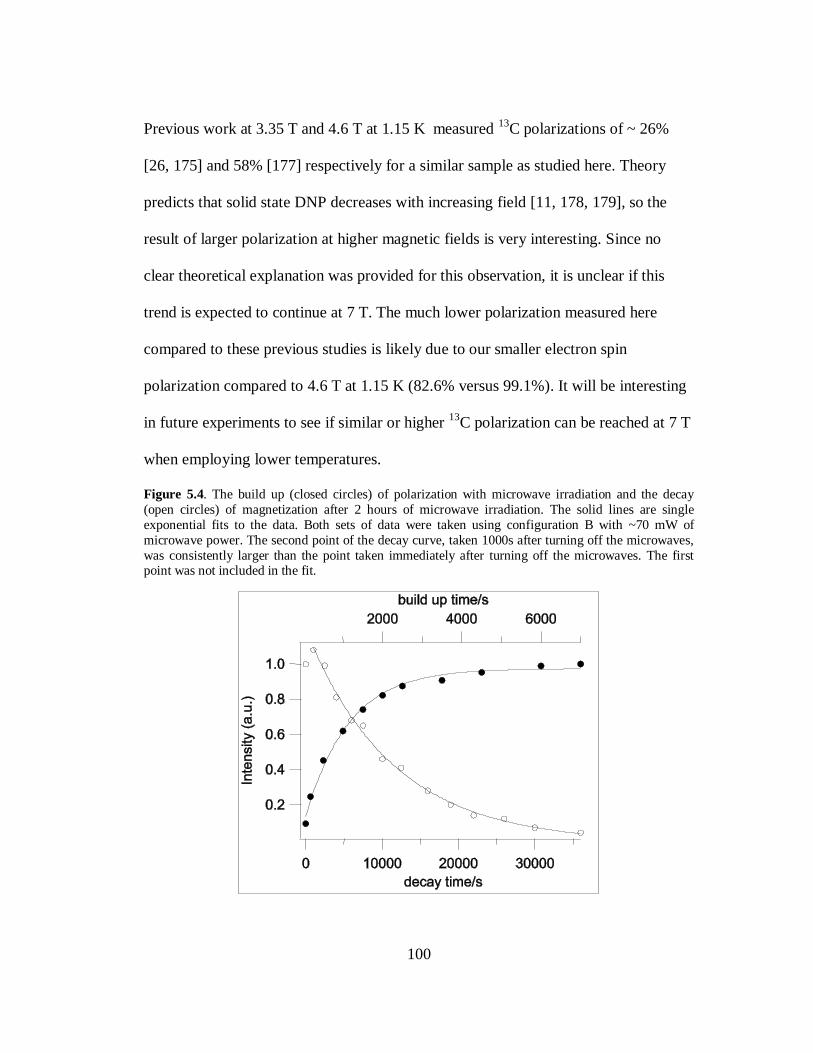
100
Previous work at 3.35 T and 4.6 T at 1.15 K measured 13
C polarizations of ~ 26%
[26, 175] and 58% [177] respectively for a similar sample as studied here. Theory
predicts that solid state DNP decreases with increasing field [11, 178, 179], so the
result of larger polarization at higher magnetic fields is very interesting. Since no
clear theoretical explanation was provided for this observation, it is unclear if this
trend is expected to continue at 7 T. The much lower polarization measured here
compared to these previous studies is likely due to our smaller electron spin
polarization compared to 4.6 T at 1.15 K (82.6% versus 99.1%). It will be interesting
in future experiments to see if similar or higher 13
C polarization can be reached at 7 T
when employing lower temperatures.
Figure 5.4. The build up (closed circles) of polarization with microwave irradiation and the decay
(open circles) of magnetization after 2 hours of microwave irradiation. The solid lines are single
exponential fits to the data. Both sets of data were taken using configuration B with ~70 mW of
microwave power. The second point of the decay curve, taken 1000s after turning off the microwaves,
was consistently larger than the point taken immediately after turning off the microwaves. The first point was not included in the fit.
101
When irradiating a sample, only the component of radiation rotating in the same
direction as the precession frequency can cause a spin transition. Thus, the correct
handedness of circularly polarized light should give a gain of two in effective power
compared to linearly polarized light. To test the extent that the use of circularly
polarized radiation increases DNP efficiency, the path length between the two roof
mirrors of the Martin-Puplett interferometer was varied in increments of 70 𝜇m, and
the DNP-amplified NMR signal was recorded after 5 minutes of microwave
irradiation. The results are shown in Fig 5.5. Using configuration B and employing
maximum microwave power, the signal was not found to vary significantly with
mirror position (open circles). However, when the Faraday rotator was included
(configuration A), reducing our power to the sample as mentioned above, the
expected cosine pattern was observed with a period equal to the wavelength of 1.51
mm (closed circles in Fig. 5.5) [167]. The maximum of this curve corresponds to the
correct handedness of circular polarization irradiating the sample, the minimum to the
opposite direction of circularly polarized microwaves, and the inflection points to
linear polarization. A gain in signal of 28% was observed for circular versus linear
polarization. To verify that this was not due to changes in average power to the
sample (which also increases with circular polarization), the path length between the
two roof mirrors was varied, and the power at the end of the waveguide measured
with a pyroelectric detector. The power reaching the sample had the expected cosine
squared pattern [167]. Thus, we conclude that the observed changes in DNP signal
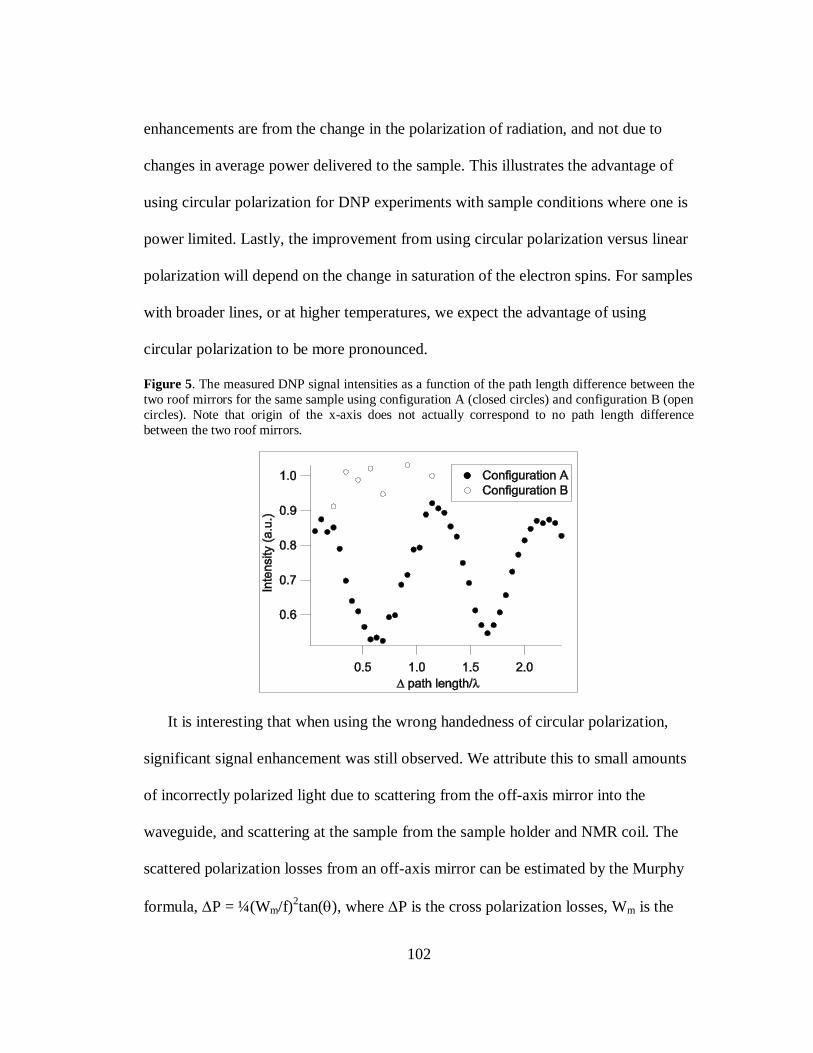
102
enhancements are from the change in the polarization of radiation, and not due to
changes in average power delivered to the sample. This illustrates the advantage of
using circular polarization for DNP experiments with sample conditions where one is
power limited. Lastly, the improvement from using circular polarization versus linear
polarization will depend on the change in saturation of the electron spins. For samples
with broader lines, or at higher temperatures, we expect the advantage of using
circular polarization to be more pronounced.
Figure 5. The measured DNP signal intensities as a function of the path length difference between the
two roof mirrors for the same sample using configuration A (closed circles) and configuration B (open
circles). Note that origin of the x-axis does not actually correspond to no path length difference
between the two roof mirrors.
It is interesting that when using the wrong handedness of circular polarization,
significant signal enhancement was still observed. We attribute this to small amounts
of incorrectly polarized light due to scattering from the off-axis mirror into the
waveguide, and scattering at the sample from the sample holder and NMR coil. The
scattered polarization losses from an off-axis mirror can be estimated by the Murphy
formula, P = ¼(Wm/f)2tan(), where P is the cross polarization losses, Wm is the
103
beam waist at the mirror, f is the mirror focal length, and is angle of incidence
[180]. With = 45° and (Wm/f)2 ~ 0.015, the losses due the off-axis mirror is
approximately 0.4% or 24 dB. This represents a lower bound as scattering from the
saddle coil and sample are also likely to cause additional polarization losses.
Significant enhancements were measured when the source power was attenuated by ~
25 dB in configuration A, comparable to the enhancement recorded when the wrong
handedness of circular polarization is employed. Thus, we believe the enhancements
with the wrong handedness of circular polarization shown in Fig. 5.5 are consistent
with polarization losses from the off-axis mirror and scattering from the NMR coil
and sample.
Our setup also enables the detection of a high field EPR spectrum of the same
sample without changes to the setup used for DNP. Only the position of the roof
mirror needs to be adjusted so that a linearly polarized beam is incident upon the
sample for induction mode detection [158, 162]. The solid line in Fig. 5.6 shows a
single scan EPR spectrum of the same sample used for DNP experiments with a
single scan signal to noise of ~ 80. Larger signal to noise ratios were achieved with
greater applied power and modulation amplitude, but at the expense of EPR line
broadening. The full width at half max linewidth is 38 Gauss, and is comparable to
previous measurements of the trityl radical [175, 181, 182]. A small g-anisotropy is
observed as reported by others [175], and indicated by the dashed arrow in Fig. 5.6.
Homodyne or heterodyne detection can be added into our current setup with little cost
to the DNP efficiency as only a small amount of source power needs to be directed to
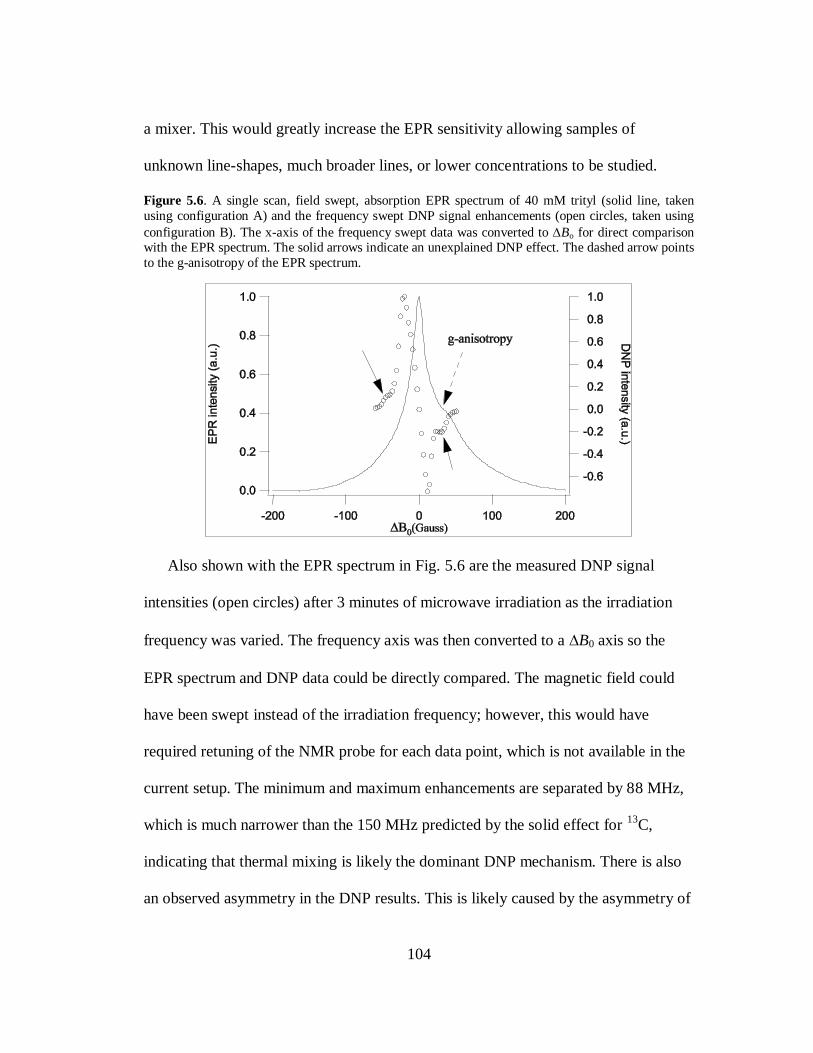
104
a mixer. This would greatly increase the EPR sensitivity allowing samples of
unknown line-shapes, much broader lines, or lower concentrations to be studied.
Figure 5.6. A single scan, field swept, absorption EPR spectrum of 40 mM trityl (solid line, taken
using configuration A) and the frequency swept DNP signal enhancements (open circles, taken using
configuration B). The x-axis of the frequency swept data was converted to Bo for direct comparison with the EPR spectrum. The solid arrows indicate an unexplained DNP effect. The dashed arrow points
to the g-anisotropy of the EPR spectrum.
Also shown with the EPR spectrum in Fig. 5.6 are the measured DNP signal
intensities (open circles) after 3 minutes of microwave irradiation as the irradiation
frequency was varied. The frequency axis was then converted to a B0 axis so the
EPR spectrum and DNP data could be directly compared. The magnetic field could
have been swept instead of the irradiation frequency; however, this would have
required retuning of the NMR probe for each data point, which is not available in the
current setup. The minimum and maximum enhancements are separated by 88 MHz,
which is much narrower than the 150 MHz predicted by the solid effect for 13
C,
indicating that thermal mixing is likely the dominant DNP mechanism. There is also
an observed asymmetry in the DNP results. This is likely caused by the asymmetry of
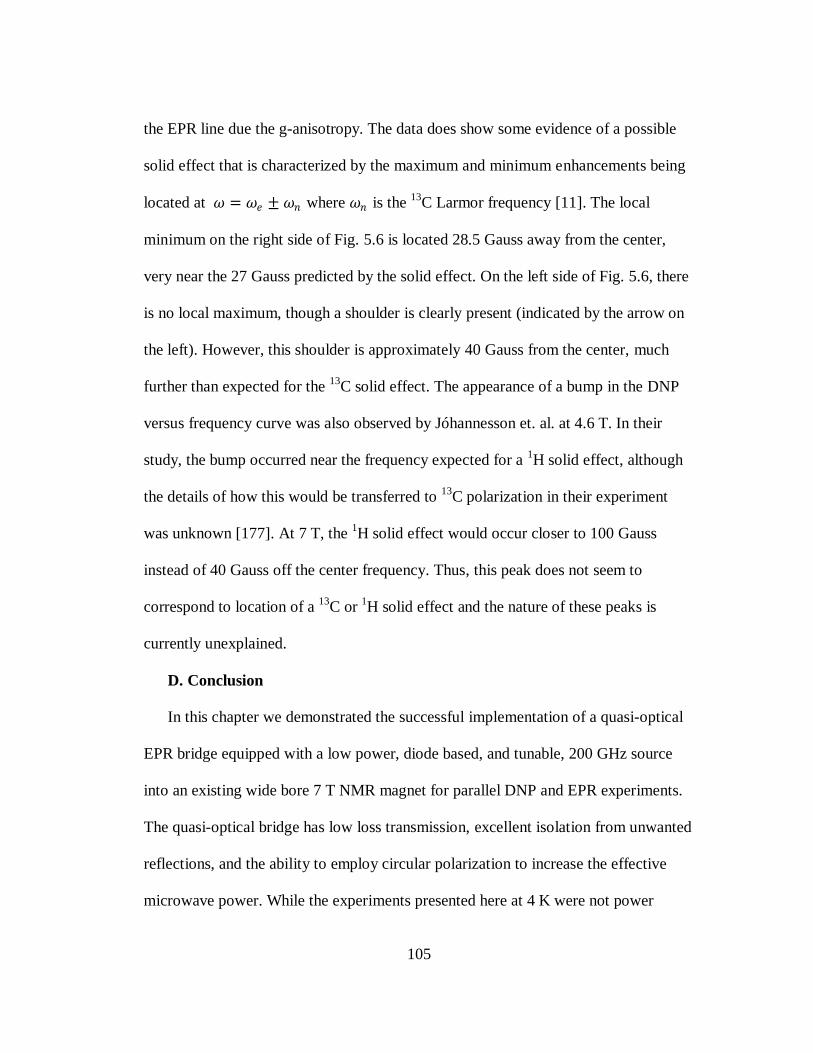
105
the EPR line due the g-anisotropy. The data does show some evidence of a possible
solid effect that is characterized by the maximum and minimum enhancements being
located at 𝜔 = 𝜔𝑒 ± 𝜔𝑛 where 𝜔𝑛 is the 13
C Larmor frequency [11]. The local
minimum on the right side of Fig. 5.6 is located 28.5 Gauss away from the center,
very near the 27 Gauss predicted by the solid effect. On the left side of Fig. 5.6, there
is no local maximum, though a shoulder is clearly present (indicated by the arrow on
the left). However, this shoulder is approximately 40 Gauss from the center, much
further than expected for the 13
C solid effect. The appearance of a bump in the DNP
versus frequency curve was also observed by Jóhannesson et. al. at 4.6 T. In their
study, the bump occurred near the frequency expected for a 1H solid effect, although
the details of how this would be transferred to 13
C polarization in their experiment
was unknown [177]. At 7 T, the 1H solid effect would occur closer to 100 Gauss
instead of 40 Gauss off the center frequency. Thus, this peak does not seem to
correspond to location of a 13
C or 1H solid effect and the nature of these peaks is
currently unexplained.
D. Conclusion
In this chapter we demonstrated the successful implementation of a quasi-optical
EPR bridge equipped with a low power, diode based, and tunable, 200 GHz source
into an existing wide bore 7 T NMR magnet for parallel DNP and EPR experiments.
The quasi-optical bridge has low loss transmission, excellent isolation from unwanted
reflections, and the ability to employ circular polarization to increase the effective
microwave power. While the experiments presented here at 4 K were not power
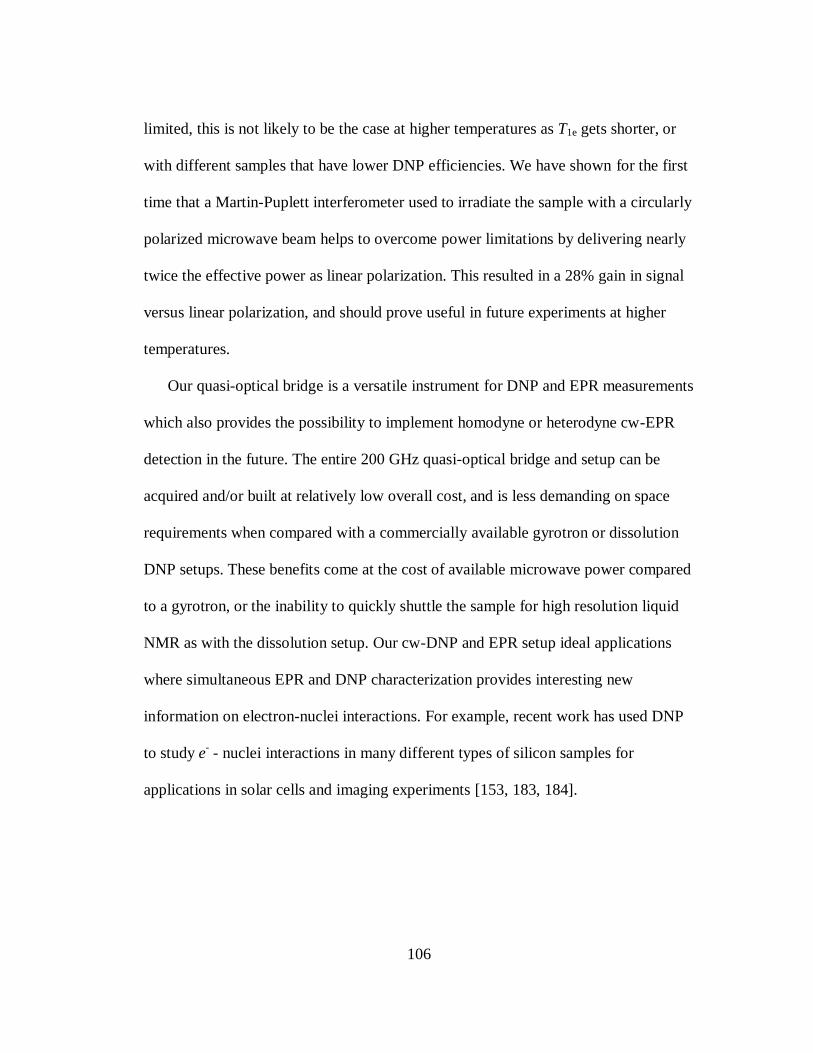
106
limited, this is not likely to be the case at higher temperatures as T1e gets shorter, or
with different samples that have lower DNP efficiencies. We have shown for the first
time that a Martin-Puplett interferometer used to irradiate the sample with a circularly
polarized microwave beam helps to overcome power limitations by delivering nearly
twice the effective power as linear polarization. This resulted in a 28% gain in signal
versus linear polarization, and should prove useful in future experiments at higher
temperatures.
Our quasi-optical bridge is a versatile instrument for DNP and EPR measurements
which also provides the possibility to implement homodyne or heterodyne cw-EPR
detection in the future. The entire 200 GHz quasi-optical bridge and setup can be
acquired and/or built at relatively low overall cost, and is less demanding on space
requirements when compared with a commercially available gyrotron or dissolution
DNP setups. These benefits come at the cost of available microwave power compared
to a gyrotron, or the inability to quickly shuttle the sample for high resolution liquid
NMR as with the dissolution setup. Our cw-DNP and EPR setup ideal applications
where simultaneous EPR and DNP characterization provides interesting new
information on electron-nuclei interactions. For example, recent work has used DNP
to study e- - nuclei interactions in many different types of silicon samples for
applications in solar cells and imaging experiments [153, 183, 184].
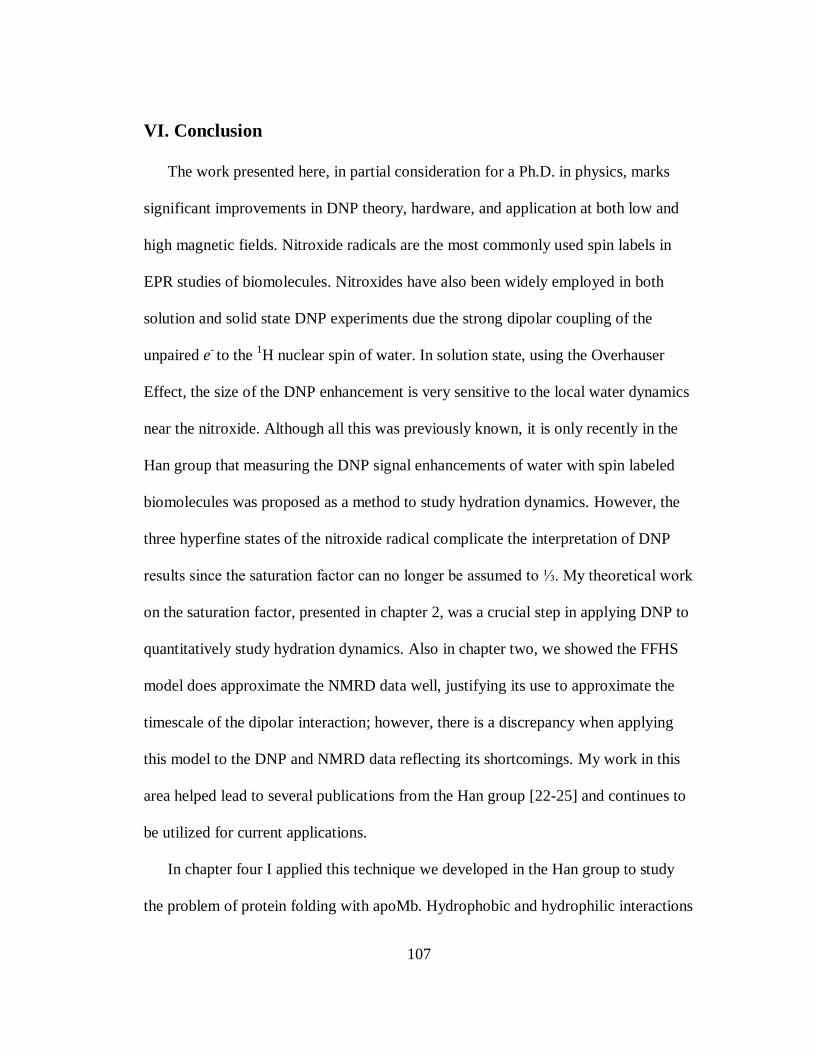
107
VI. Conclusion
The work presented here, in partial consideration for a Ph.D. in physics, marks
significant improvements in DNP theory, hardware, and application at both low and
high magnetic fields. Nitroxide radicals are the most commonly used spin labels in
EPR studies of biomolecules. Nitroxides have also been widely employed in both
solution and solid state DNP experiments due the strong dipolar coupling of the
unpaired e- to the
1H nuclear spin of water. In solution state, using the Overhauser
Effect, the size of the DNP enhancement is very sensitive to the local water dynamics
near the nitroxide. Although all this was previously known, it is only recently in the
Han group that measuring the DNP signal enhancements of water with spin labeled
biomolecules was proposed as a method to study hydration dynamics. However, the
three hyperfine states of the nitroxide radical complicate the interpretation of DNP
results since the saturation factor can no longer be assumed to ⅓. My theoretical work
on the saturation factor, presented in chapter 2, was a crucial step in applying DNP to
quantitatively study hydration dynamics. Also in chapter two, we showed the FFHS
model does approximate the NMRD data well, justifying its use to approximate the
timescale of the dipolar interaction; however, there is a discrepancy when applying
this model to the DNP and NMRD data reflecting its shortcomings. My work in this
area helped lead to several publications from the Han group [22-25] and continues to
be utilized for current applications.
In chapter four I applied this technique we developed in the Han group to study
the problem of protein folding with apoMb. Hydrophobic and hydrophilic interactions
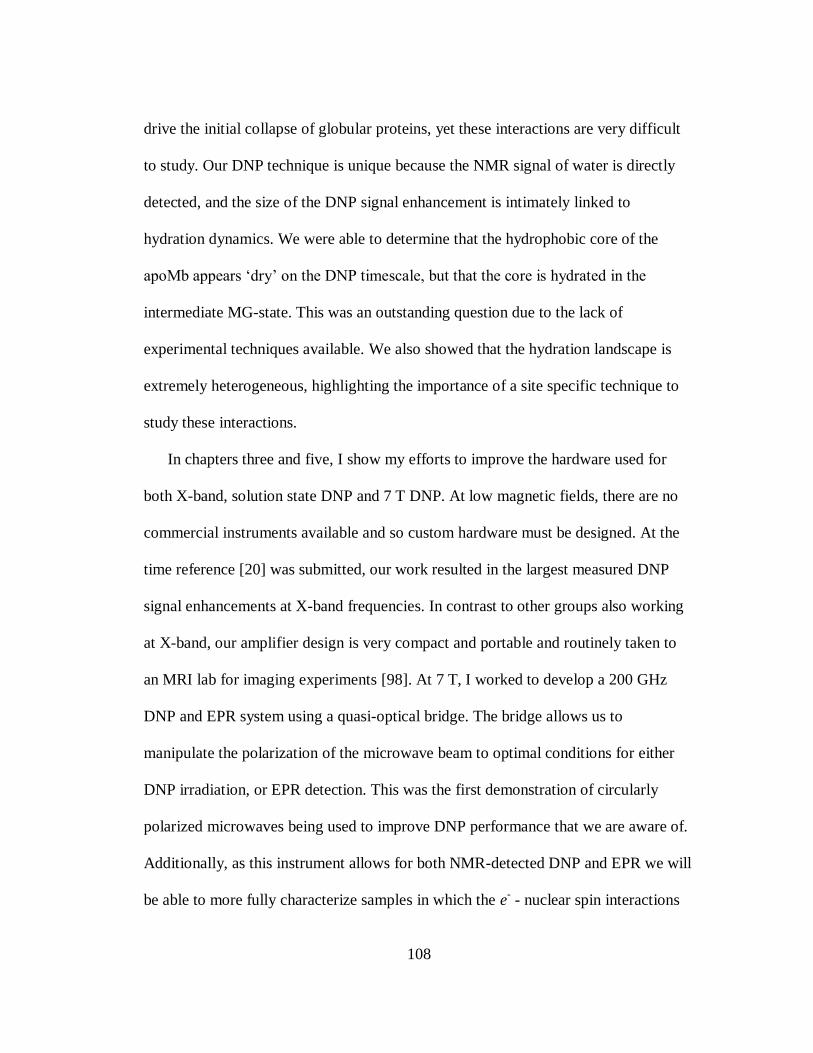
108
drive the initial collapse of globular proteins, yet these interactions are very difficult
to study. Our DNP technique is unique because the NMR signal of water is directly
detected, and the size of the DNP signal enhancement is intimately linked to
hydration dynamics. We were able to determine that the hydrophobic core of the
apoMb appears ‗dry‘ on the DNP timescale, but that the core is hydrated in the
intermediate MG-state. This was an outstanding question due to the lack of
experimental techniques available. We also showed that the hydration landscape is
extremely heterogeneous, highlighting the importance of a site specific technique to
study these interactions.
In chapters three and five, I show my efforts to improve the hardware used for
both X-band, solution state DNP and 7 T DNP. At low magnetic fields, there are no
commercial instruments available and so custom hardware must be designed. At the
time reference [20] was submitted, our work resulted in the largest measured DNP
signal enhancements at X-band frequencies. In contrast to other groups also working
at X-band, our amplifier design is very compact and portable and routinely taken to
an MRI lab for imaging experiments [98]. At 7 T, I worked to develop a 200 GHz
DNP and EPR system using a quasi-optical bridge. The bridge allows us to
manipulate the polarization of the microwave beam to optimal conditions for either
DNP irradiation, or EPR detection. This was the first demonstration of circularly
polarized microwaves being used to improve DNP performance that we are aware of.
Additionally, as this instrument allows for both NMR-detected DNP and EPR we will
be able to more fully characterize samples in which the e- - nuclear spin interactions
109
of interest. Currently investigations are being carried in our out on amorphous silicon
samples to study the nature of defects sites, while work is also continuing to be done
to improve the instrumentation further. In many ways, if I may take a sentence to
interject my personal opinion, it is sad to be leaving at this moment as I expect many
interesting applications to come from this instrument that I spent much time working
on. I will watch with great interest the work that comes from it.
110
References
[1] A. Durazo, and M.M. Abu-Omar, "Deuterium NMR spectroscopy is a versatile
and economical tool for monitoring reaction kinetics in ionic liquids." Chem.
Commun. (2002) 66-67.
[2] H. Koskela, M.L. Rapinoja, M.L. Kuitunen, and P. Vanninen, "Determination of
Trace Amounts of Chemical Warfare Agent Degradation Products in
Decontamination Solutions with NMR Spectroscopy." Anal. Chem. 79 (2007)
9098-9106.
[3] K. Wuethrich, "Protein structure determination in solution by NMR
spectroscopy." J. Biol. Chem. 265 (1990) 22059-22062.
[4] I.L. Pykett, J.H. Newhouse, F.S. Buonanno, T.J. Brady, M.R. Goldman, J.P.
Kistler, and G.M. Pohost, "Principles of nuclear magnetic resonance
imaging." Radiology 143 (1982) 157-168.
[5] L.M.K. Vandersypen, M. Steffen, G. Breyta, C.S. Yannoni, M.H. Sherwood, and
I.L. Chuang, "Experimental realization of Shor's quantum factoring algorithm
using nuclear magnetic resonance." Nature 414 (2001) 883-887.
[6] A.W. Overhauser, "Polarization of Nuclei in Metals." Phys. Rev. 92 (1953) 411-
415.
[7] T.R. Carver, and C.P. Slichter, "Polarization of Nuclear Spins in Metals." Phys.
Rev. 92 (1953) 212.
[8] A. Abragam, "Overhauser Effect in Nonmetals." Phys. Rev. 98 (1955) 1729.
[9] A. Abragam, and M. Borghini, "Dynamic polarization of nuclear targets." Progr.
Low Temp. Phys. (C. J. Gorter, Ed.) 4 (1964) 384-449.
[10] A. Abragam, and M. Goldman, "Principles of Dynamic Nuclear-Polarization."
Rep. Prog.Phys. 41 (1978) 395-467.
[11] R.A. Wind, M.J. Duijvestijn, C. van der Lugt, A. Manenschijn, and J. Vriend,
"Applications of dynamic nuclear polarization in 13
C NMR in solids." Prog.
Nucl. Magn. Reson. Spec. 7 (1985) 33-67.
111
[12] C.T. Farrar, D.A. Hall, G.J. Gerfen, S.J. Inati, and R.G. Griffin, "Mechanism of
dynamic nuclear polarization in high magnetic fields." J. Chem. Phys. 114
(2001) 4922-4933.
[13] Z. Guo, D. Cascio, K. Hideg, T. Kálái, and W.L. Hubbell, "Structural
determinants of nitroxide motion in spin-labeled proteins: Tertiary contact and
solvent-inaccessible sites in helix G of T4 lysozyme." Protein Sci. 16 (2007)
1069-1086.
[14] C.J. López, M.R. Fleissner, Z. Guo, A.K. Kusnetzow, and W.L. Hubbell,
"Osmolyte perturbation reveals conformational equilibria in spin-labeled
proteins." Protein Sci. 18 (2009) 1637-1652.
[15] L. Zhang, L. Wang, Y.T. Kao, W. Qiu, Y. Yang, O. Okobiah, and D. Zhong,
"Mapping hydration dynamics around a protein surface." Proc. Nat. Acad. Sci.
U.S.A. 104 (2007) 18461-18466.
[16] L. Zhang, Y. Yang, Y.-T. Kao, L. Wang, and D. Zhong, "Protein Hydration
Dynamics and Molecular Mechanism of Coupled Water-Protein
Fluctuations." J. Am. Chem. Soc. 31 (2009) 10677-10691.
[17] B. Halle, "Cross-relaxation between macromolecular and solvent spins: The role
of long-range dipole couplings." J. Chem. Phys. 119 (2003) 12372-12385.
[18] B.D. Armstrong, and S. Han, "A new model for Overhauser enhanced nuclear
magnetic resonance using nitroxide radicals." J. Chem. Phys. 127 (2007)
104508-10.
[19] B.D. Armstrong, and S. Han, "Overhauser Dynamic Nuclear Polarization To
Study Local Water Dynamics." J. Am. Chem. Soc. 131 (2009) 4641-4647.
[20] B.D. Armstrong, M.D. Lingwood, E.R. McCarney, E.R. Brown, P. Blümler, and
S. Han, "Portable X-band system for solution state dynamic nuclear
polarization." J. Magn. Reson. 191 (2008) 273-281.
[21] D. Eliezer, J. Yao, H.J. Dyson, and P.E. Wright, "Structural and dynamic
characterization of partially folded states of apomyoglobin and implications
for protein folding." Nat. Struct. Mol. Biol. 18 (1998) 148-155.
[22] R. Kausik, and S. Han, "Ultrasensitive Detection of Interfacial Water Diffusion
on Lipid Vesicle Surfaces at Molecular Length Scales." J. Am. Chem. Soc.
131 (2009) 18254-18256.
112
[23] E.R. McCarney, B.D. Armstrong, R. Kausik, and S. Han, "Dynamic Nuclear
Polarization Enhanced Nuclear Magnetic Resonance and Electron Spin
Resonance Studies of Hydration and Local Water Dynamics in Micelle and
Vesicle Assemblies." Langmuir 24 (2008) 10062-10072.
[24] R. Kausik, A. Srivastava, P.A. Korevaar, G. Stucky, J.H. Waite, and S. Han,
"Local Water Dynamics in Coacervated Polyelectrolytes Monitored through
Dynamic Nuclear Polarization-Enhanced 1H NMR." Macromolecules 42
(2009) 7404-7412.
[25] A. Pavlova, E.R. McCarney, D.W. Peterson, F.W. Dahlquist, J. Lew, and S. Han,
"Site-specific dynamic nuclear polarization of hydration water as a generally
applicable approach to monitor protein aggregation." Phys. Chem. Chem.
Phys. 11 (2009) 6833-6839.
[26] J.H. Ardenkjaer-Larsen, B. Fridlund, A. Gram, G. Hansson, L. Hansson, M.H.
Lerche, R. Servin, M. Thaning, and K. Golman, "Increase in signal-to-noise
ratio of > 10,000 times in liquid-state NMR." Proc. Nat. Acad. Sci. U.S.A. 100
(2003) 10158-10163.
[27] V.S. Bajaj, C.T. Farrar, I. Mastovsky, J. Vieregg, J. Bryant, B. Elena, K.E.
Kreischer, R.J. Temkin, and R.G. Griffin, "Dynamic nuclear polarization at
9T using a novel 250 GHz gyrotron microwave source." J. Magn. Reson. 160
(2003) 85-90.
[28] C.P. Slichter, Principles of magnetic resonance, Springer-Verlag, Berlin; New
York , 1990.
[29] K.H. Hausser, and D. Stehlik, "Dynamic nuclear polarization in liquids."Advan.
Magn. Reson. 3 (1968) 79-139.
[30] I. Solomon, "Relaxation Processes in a System of 2 Spins." Phys. Rev. 99 (1955)
559-565.
[31] F. Bloch, "Nuclear Induction." Phys. Rev. 70 (1946) 460.
[32] A. Abragam, The principles of nuclear magnetism, Clarendon Press, Oxford,
England, 1961.
[33] G.M. Clore, C. Tang, and J. Iwahara, "Elucidating transient macromolecular
interactions using paramagnetic relaxation enhancement." Curr. Opin. Struc.
Biol. 17 (2007) 603-616.
113
[34] B. Liang, J.H. Bushweller, and L.K. Tamm, "Site-Directed Parallel Spin-
Labeling and Paramagnetic Relaxation Enhancement in Structure
Determination of Membrane Proteins by Solution NMR Spectroscopy." J. Am.
Chem. Soc. 128 (2006) 4389-4397.
[35] C.S. Sheng Cai, Z. Kovacs, A.D. Sherry, and Y. Chen, "Sensitivity Enhancement
of Multidimensional NMR Experiments by Paramagnetic Relaxation Effects."
J. Am. Chem. Soc. 128 (2006) 13474-13478.
[36] J.H. Freed, "Dynamic effects of pair correlation functions on spin relaxation by
translational diffusion in liquids. II. Finite jumps and independent T1
processes." J. Chem. Phys. 68 (1978) 4034-4037.
[37] L. Helm, "Relaxivity in paramagnetic systems: Theory and mechanisms." Prog.
Nucl. Magn. Reson. Spec. 49 (2006) 45-64.
[38] L.-P. Hwang, and J.H. Freed, "Dynamic effects of pair correlation functions on
spin relaxation by translational diffusion in liquids." J. Chem. Phys. 63 (1975)
4017-4025.
[39] J.-P. Korb, and R.G. Bryant, "The physical basis for the magnetic field
dependence of proton spin-lattice relaxation rates in proteins." J. Chem. Phys.
15 (2001) 10964-10974.
[40] J.-P. Korb, and R.G. Bryant, "Magnetic field dependence of proton spin-lattice
relaxation times." Magn. Reson. Med. 48 (2002) 21-26.
[41] D. Kruk, T. Nilsson, and J. Kowalewski, "Outer-sphere nuclear spin relaxation in
paramagnetic systems: a low-field theory," Mol. Phys. 99 (2001), pp. 1435 -
1445.
[42] É. Tóth, L. Helm, and A. Merbach, "Relaxivity of MRI Contrast Agents."
Contrast Agents I, 2002, pp. 61-101.
[43] M.W. Hodges, D.S. Cafiso, C.F. Polnaszek, C.C. Lester, and R.G. Bryant,
"Water translational motion at the bilayer interface: an NMR relaxation
dispersion measurement." Biophys. J. 73 (1997) 2575-2579.
[44] H. Jansson, F. Kargl, F. Fernandez-Alonso, and J. Swenson, "Dynamics of a
protein and its surrounding environment: A quasielastic neutron scattering
study of myoglobin in water and glycerol mixtures." J. Chem. Phys. 130
(2009) 205101-13.
114
[45] J. Qvist, E. Persson, C. Mattea, and B. Halle, "Time scales of water dynamics at
biological interfaces: peptides, proteins and cells." Faraday Discuss. 141
(2009) 131-144.
[46] D. Russo, G. Hura, and T. Head-Gordon, "Hydration Dynamics Near a Model
Protein Surface." Biophys. J. 86 (2004) 1852-1862.
[47] S. Kiihne, and R.G. Bryant, "Protein-Bound Water Molecule Counting by
Resolution of 1H Spin-Lattice Relaxation Mechanisms." Biophys. J. 78 (2000)
2163-2169.
[48] W.L. Hubbell, A. Gross, R. Langen, and M.A. Lietzow, "Recent advances in
site-directed spin labeling of proteins." Curr. Opin. Struc. Biol. 8 (1998) 649-
656.
[49] D. Marsh, Electron spin resonance: spin labels. in: E. Grell (Ed.), Membrane
Spectroscopy. Molecular Biology, Biochemistry, and Biophysics, Springer-
Verlag, Berlin, 1981, pp. 51-142.
[50] O.H. Griffith, P.J. Dehlinger, and S.P. Van, "Shape of the hydrophobic barrier of
phospholipid bilayers (Evidence for water penetration in biological
membranes)." J. Membrane Biol. 15 (1974) 159-192.
[51] D. Kurad, G. Jeschke, and D. Marsh, "Lipid Membrane Polarity Profiles by
High-Field EPR." Biophys. J. 85 (2003) 1025-1033.
[52] S. Stoll, and A. Schweiger, "EasySpin, a comprehensive software package for
spectral simulation and analysis in EPR." J. Magn. Reson. 178 (2006) 42-55.
[53] D.E. Budil, S. Lee, S. Saxena, and J.H. Freed, "Nonlinear-Least-Squares
Analysis of Slow-Motion EPR Spectra in One and Two Dimensions Using a
Modified Levenberg-Marquardt Algorithm." J. Magn. Reson. A 120 (1996)
155-189.
[54] K.A. Earle, and D.E. Budil, "Calculating Slow-Motion ESR Spectra of Spin-
Labeled Polymers." in: S. Dr. Shulamith, (Ed.), Advanced ESR Methods in
Polymer Research, 2006, pp. 53-83.
[55] J.H. Freed, "Theory of Slow Tumbling ESR Spectra for Nitroxides." in: L.J.
Berliner, (Ed.), Spin Labeling Theory and Applications, Academic Press,
N.Y., 1976, pp. 53-132.
115
[56] D.J. Schneider, and J.H. Freed, "Calculating Slo Motional Magnetic Resonance
Spectra: A User's Guide." in: L.J. Berliner, and J. Reuben, (Eds.), Biological
Magnetic Resonance, Plenum, NY, 1989, pp. 1-76.
[57] R. Owenius, M. Osterlund, M. Lindgren, M. Svensson, O.H. Olsen, E. Persson,
P.O. Freskgard, and U. Carlsson, "Properties of spin and fluorescent labels at
a receptor-ligand interface." Biophys. J. 77 (1999) 2237-2250.
[58] M. Alecci, I. Seimenis, S.J. McCallum, D.J. Lurie, and M.A. Foster, "Nitroxide
free radical clearance in the live rat monitored by radio-frequency CW-EPR
and PEDRI." Phys. Med. Biol. 43 (1998) 1899-1905.
[59] W. Barros, and M. Engelsberg, "Enhanced Overhauser contrast in proton-
electron double-resonance imaging of the formation of an alginate hydrogel."
J. Magn. Reson. 184 (2007) 101-107.
[60] D.J. Lurie, "Proton-electron double-resonance imaging (PEDRI)." Biol. Magn.
Reson. 18 (2003) 547-578.
[61] D.J. Lurie, D.M. Bussell, L.H. Bell, and J.R. Mallard, "Proton-electron double
magnetic resonance imaging of free radical solutions." J. Magn. Reson. 76
(1988) 366-70.
[62] D.J. Lurie, G.R. Davies, M.A. Foster, and J.M.S. Hutchison, Field-cycled PEDRI
imaging of free radicals with detection at 450 mT. Magnetic Resonance
Imaging 23 (2005) 175-181.
[63] D.J. Lurie, M.A. Foster, D. Yeung, and J.M. Hutchison, "Design, construction
and use of a large-sample field-cycled PEDRI imager." Phys. Med. Biol. 43
(1998) 1877-86.
[64] D.J. Lurie, H. Li, S. Petryakov, and .J. L. Zweier, "Development of a PEDRI
free-radical imager using a 0.38 T clinical MRI system." Magn. Reson. Med.
47 (2002) 181-6.
[65] A.M.F. Benial, K. Ichikawa, R. Murugesan, K. Yamada, and H. Utsumi,
"Dynamic nuclear polarization properties of nitroxyl radicals used in
Overhauser-enhanced MRI for simultaneous molecular imaging." J. Magn.
Reson. 182 (2006) 273-282.
[66] D. Grucker, T. Guiberteau, B. Eclancher, J. Chambron, R. Chiarelli, A. Rassat,
G. Subra, and B. Gallez, "Dynamic Nuclear-Polarization with Nitroxides
Dissolved in Biological-Fluids." J. Magn. Reson. B 106 (1995) 101-109.
116
[67] I. Nicholson, D.J. Lurie, and F.J.L. Robb, "The Application of Proton-Electron
Double-Resonance Imaging Techniques to Proton Mobility Studies." J. Magn.
Reson. B 104 (1994) 250-255.
[68] B.H. Robinson, D.A. Haas, and C. Mailer, "Molecular-Dynamics in Liquids -
Spin-Lattice Relaxation of Nitroxide Spin Labels." Science 263 (1994) 490-
493.
[69] R.D. Bates, and W.S. Drozdoski, "Use of Nitroxide Spin Labels in Studies of
Solvent-Solute Interactions." J. Chem. Phys. 67 (1977) 4038-4044.
[70] W.L. DeLano, The PyMOL Molecular Graphics System. DeLano Scientific LLC
Palo Alto, CA (2008).
[71] D. Sezer, M. Gafurov, M.J. Prandolini, V.P. Denysenkov, and T.F. Prisner,
"Dynamic nuclear polarization of water by a nitroxide radical: rigorous
treatment of the electron spin saturation and comparison with experiments at
9.2 Tesla." Phys. Chem. Chem. Phys. 11 (2009) 6638-6653.
[72] J.A. Weil, J.R. Bolton, and J.E. Wertz, Electron paramagnetic resonance:
elementary theory and practical applications, Wiley, New York, 1994.
[73] D.W. Peterson, H. Zhou, F.W. Dahlquist, and J. Lew, "A Soluble Oligomer of
Tau Associated with Fiber Formation Analyzed by NMR." Biochemistry. 47
(2008) 7393-7404.
[74] E.R. McCarney, and S. Han, "Spin-labeled gel for the production of radical-free
dynamic nuclear polarization enhanced molecules for NMR spectroscopy and
imaging." J. Magn. Reson. 190 (2008) 307-315.
[75] E.R. McCarney, B.D. Armstrong, M.D. Lingwood, and S. Han, "Hyperpolarized
water as an authentic magnetic resonance imaging contrast agent." Proc. Nat.
Acad. Sci. U.S.A. 104 (2007) 1754-1759.
[76] P. Hofer, G. Parigi, C. Luchinat, P. Carl, G. Guthausen, M. Reese, T.
Carlomagno, C. Griesinger, and M. Bennati, "Field Dependent Dynamic
Nuclear Polarization with Radicals in Aqueous Solution." J. Am. Chem. Soc.
130 (2008), pp. 3254-3255.
[77] C.F. Polnaszek, and R.G. Bryant, "Nitroxide radical induced solvent proton
relaxation: Measurement of localized translational diffusion." J. Chem. Phys.
81 (1984) 4038-4045.
[78] C.L. Teng, S. Martini, and R.G. Bryant, "Local Measures of Intermolecular Free
Energies in Solution." J. Am. Chem. Soc. 126 (2004) 15253-15257.
117
[79] D. Sezer, M.J. Prandolini, and T.F. Prisner, "Dynamic nuclear polarization
coupling factors calculated from molecular dynamics simulations of a
nitroxide radical in water." Phys. Chem. Chem. Phys. 11 (2009) 6626-6637.
[80] C.C. Lester, and R.G. Bryant, "Outer coordination sphere: characterization by
nuclear magnetic relaxation dispersion." J. Phys. Chem. 94 (1990), pp. 2843-
2847.
[81] C.F. Polnaszek, and R.G. Bryant, "Self-diffusion of water at the protein surface:
a measurement." J. Am. Chem. Soc. 106 (1984) 428-429.
[82] M. Pavone, P. Cimino, O. Crescenzi, A. Sillanpaa, and V. Barone, "Interplay of
Intrinsic, Environmental, and Dynamic Effects in Tuning the EPR Parameters
of Nitroxides: Further Insights from an Integrated Computational Approach."
J. Phys. Chem. B 111 (2007) 8928-8939.
[83] M. Pavone, A. Sillanpaa, P. Cimino, O. Crescenzi, and V. Barone, "Evidence of
Variable H-Bond Network for Nitroxide Radicals in Protic Solvents." J. Phys.
Chem. B 110 (2006) 16189-16192.
[84] D. van der Spoel, P.J. van Maaren, and H.J.C. Berendsen, "A systematic study of
water models for molecular simulation: Derivation of water models optimized
for use with a reaction field." J. Chem. Phys. 108 (1998) 10220-10230.
[85] H.J.C. Berendsen, D. van der Spoel, and R. van Drunen, "GROMACS: A
message-passing parallel molecular dynamics implementation." Comput.
Phys. Commun. 91 (1995) 43-56.
[86] W.L. Jorgensen, and J. Tirado-Rives, "The OPLS [optimized potentials for liquid
simulations] potential functions for proteins, energy minimizations for crystals
of cyclic peptides and crambin." J. Am. Chem. Soc. 110 (1988) 1657-1666.
[87] G.A. Kaminski, R.A. Friesner, J. Tirado-Rives, and W.L. Jorgensen, "Evaluation
and Reparametrization of the OPLS-AA Force Field for Proteins via
Comparison with Accurate Quantum Chemical Calculations on Peptides." J.
Phys. Chem. B 105 (2001) 6474-6487.
[88] W.L. Jorgensen, J. Chandrasekhar, J.D. Madura, R.W. Impey, and M.L. Klein,
"Comparison of simple potential functions for simulating liquid water." J
Chem. Phys. 79 (1983) 926-935.
[89] H.J.C. Berendsen, J.R. Grigera, and T.P. Straatsma, "The missing term in
effective pair potentials." J. Phys. Chem. 91 (1987) 6269-6271.
118
[90] H.J.C. Berendsen, J.P.M. Postma, W.F. van Gunsteren, A. DiNola, and J.R.
Haak, "Molecular dynamics with coupling to an external bath." J Chem. Phys.
81 (1984) 3684-3690.
[91] B. Hess, H. Bekker, H.J.C. Berendsen, and J.G.E.M. Fraaije, "LINCS: A linear
constraint solver for molecular simulations." J. Comput. Chem. 18 (1997)
1463-1472.
[92] S. Miyamoto, and P.A. Kollman, "Settle: An analytical version of the SHAKE
and RATTLE algorithm for rigid water models." J. Comput. Chem. 13 (1992)
952-962.
[93] U. Essmann, L. Perera, M.L. Berkowitz, T. Darden, H. Lee, and L.G. Pedersen,
"A smooth particle mesh Ewald method." J. Chem. Phys. 103 (1995) 8577-
8593.
[94] G. Schaftenaar, and J.H. Noordik, "Molden: a pre- and post-processing program
for molecular and electronic structures." J. Comput. Aid. Mol. Des. 14 (2000)
123-134.
[95] M.J. Frisch, and et. al, Gaussian 03, Revision D.02. Gaussian, Inc. Wallingford,
CT. (2004).
[96] C.I. Bayly, P. Cieplak, W. Cornell, and P.A. Kollman, "A well-behaved
electrostatic potential based method using charge restraints for deriving
atomic charges: the RESP model." J. Phys. Chem. 97 (1993) 10269-10280.
[97] M.D. Lingwood, I.A. Ivanov, A.R. Cote, and S. Han, "Heisenberg spin exchange
effects of nitroxide radicals on Overhauser dynamic nuclear polarization in the
low field limit at 1.5 mT." J. Magn. Reson. 204 (2010) 56-63.
[98] M.D. Lingwood, T.A. Siaw, N. Sailasuta, B.D. Ross, P. Bhattacharya, and S.
Han, "Continous flow Overhauser dynamics nuclear polarization of water in
the fringe field of a clinical magnetic resonance imaging system for authentic
image contrast." J. Magn. Reson. under review (2010).
[99] W.E. Forsythe, Smithsonian Physical Tables, 9th revised ed., Knovel,
1954/2003, pp. 319.
[100] K. Halbach, "Strong rare earch cobalt quadrupoles." IEEE Trans. Nucl. Sci.26
(1979) 3882-3884.
119
[101] T.R. Ni Mhiochain, J.M.D. Coey, D.L. Weaire, and S.M. McMurry, "Torque in
nested Halbach cylinders." IEEE Trans. Magn. 35 (1999) 3968-3970.
[102] H. Raich, and P. Blümler, "Design and construction of a dipolar Halbach array
with a homogeneous field from identical bar magnets: NMR Mandhalas."
Concept. Magn. Reson. B 23B (2004) 16-25.
[103] D. Chandler, "Interfaces and the driving force of hydrophobic assembly."
Nature 437 (2005) 640-647.
[104] M.S. Cheung, A.E. Garcia, and J.N. Onuchic, "Protein folding mediated by
solvation: Water expulsion and formation of the hydrophobic core occur after
the structural collapse." Proc. Nat. Acad. Sci. U.S.A. 99 (2002) 685-690.
[105] R. Zhou, X. Huang, C.J. Margulis, and B.J. Berne, "Hydrophobic Collapse in
Multidomain Protein Folding." Science 305 (2004) 1605-1609.
[106] K.A. Dill, "Dominant Forces in Protein Folding." Biochemistry 29 (1990) 7133-
7155.
[107] T. Kamei, M. Oobatake, and M. Suzuki, "Hydration of Apomyoglobin in
Native, Molten Globule, and Unfolded States by Using Microwave Dielectric
Spectroscopy." Biophys. J. 82 (2002) 418-425.
[108] V.P. Denisov, B.H. Jonsson, B. Halle, "Hydration of denatured and molten
globule proteins." Nat. Struct. Biol. 6 (1999) 253-260.
[109] S.K. Jha, and J.B. Udgaonkar, "Direct evidence for a dry molten globule
intermediate during the unfolding of a small protein." Proc. Nat. Acad. Sci.
U.S.A. 106 (2009) 12289-12294.
[110] A. Onufriev, D.A. Case, and D. Bashford, "Structural details, pathways, and
energetics of unfolding apomyoglobin." J. Mol. Biol. 325 (2003) 555-567.
[111] B.R. Rami, and J.B. Udgaonkar, "Mechanism of formation of a productive
molten globule form of barstar." Biochemistry 41 (2002) 1710-1716.
[112] O.B. Ptitsyn, D.A. Dolgikh, R.I. Gilmanshin, E.I. Shakhnovich, and A.V.
Finkelshtein, "Oscillating State of the Protein Globule." Mol. Biol. 17 (1983)
451-456.
[113] P.W. Fenimore, H. Frauenfelder, B.H. McMahon, and R.D. Young, "Bulk-
solvent and hydration-shell fluctuations, similar to α- and β-fluctuations in
glasses, control protein motions and functions." Proc. Nat. Acad. Sci.
U.S.A.101 (2004) 14408-14413.
120
[114] B. Halle, and L. Nilsson, "Does the Dynamic Stokes Shift Report on Slow
Protein Hydration Dynamics?" J. Phys. Chem. B 113 (2009) 8210-8213.
[115] M.E. Johnson, Malardier-Jugroot, C., Murarka, R. K., Head-Gordon, T.,
"Hydration water dynamics near biological interfaces." J. Phys. Chem. B 113
(2009) 4082-4092.
[116] J.M. Sorenson, G. Hura, A.K. Soper, A. Pertsemlidis, and T. Head-Gordon,
"Determining the role of hydration forces in protein folding." J. Phys. Chem.
B 103 (1999) 5413-5426.
[117] M. Davidovic, C. Mattea, J. Qvist, and B. Halle, "Protein Cold Denaturation as
Seen From the Solvent." J. Am. Chem. Soc. 131 (2008) 1025-1036.
[118] V.P. Denisov, B.H. Jonsson, and B. Halle, "Hydration of denatured and molten
globule proteins." Nat. Struct. Biol. 6 (1999) 253-260.
[119] E. Persson, and B. Halle, "Cell water dynamics on multiple time scales." Proc.
Nat. Acad. Sci. U.S.A. 105 (2008) 6266-6271.
[120] K. Venu, L. Anders Svensson, and B. Halle, "Orientational Order and
Dynamics of Hydration Water in a Single Crystal of Bovine Pancreatic
Trypsin Inhibitor." Biophys. J. 77 (1999) 1074-1085.
[121] H. Nakagawa, Joti, Y., Kitao, A., Kataoka, M., "Hydration affects both
harmonic and anharmonic nature of protein dynamics." Biophys. J. 95 (2008)
2916-2923.
[122] D. Russo, G.L. Hura, J.R.D.Copley, "Effects of hydration water on protein
methyl group dynamics in solution." Phys. Rev. E 75 (2007) 040902-1-3.
[123] D. Russo, G. Hura, and T. Head-Gordon," Hydration Dynamics Near a Model
Protein Surface." Biophys. J. 86 (2004) 1852-1862.
[124] J.C. Smith, "Protein dynamics: comparison of simulations with inelastic
neutron scattering experiments." Q. Rev. Biophys. 24 (1991) 227-291.
[125] J.M. Zanotti, G. Hervé, and M.C. Bellissent-Funel, "Picosecond dynamics of T
and R forms of aspartate transcarbamylase: A neutron scattering study." BBA -
Proteins Proteom. 1764 (2006) 1527-1535.
121
[126] J.J. Dwyer, A.G. Gittis, D.A. Karp, E.E. Lattman, D.S. Spencer, W.E. Stites,
and B. García-Moreno E, "High Apparent Dielectric Constants in the Interior
of a Protein Reflect Water Penetration." Biophys. J. 79 (2000) 1610-1620.
[127] T. Kamei, M. Oobatake, and M. Suzuki, "Hydration of Apomyoglobin in
Native, Molten Globule, and Unfolded States by Using Microwave Dielectric
Spectroscopy." Biophys. J. 82 (2002) 418-425.
[128] U. Heugen, Schwaab, G., Bruendermann, E., Heyden, M., Yu, X., Leitner, D.
M., Havenith, M., "Solute-induced retardation of water dynamics probed
directly by terahertz spectroscopy." Proc. Nat. Acad. Sci. U.S.A. 103 (2006)
12301-123-6.
[129] S.K. Pal, Peon, J., Zewail, A. H., "Biological water at the protein surface:
dynamical solvation probed directly with femtosecond resolution." Proc. Nat.
Acad. Sci. U.S.A. 99 (2002) 1763-1768.
[130] S.K. Pal, Peon, J., Zewail, A. H., "Ultrafast surface hydration dynamics and
expression of protein functionaliy: -Chymotrypsin." Proc. Nat. Acad. Sci.
U.S.A. 99 (2002) 15297-15302.
[131] T. Li, A.A. Hassanali, Y.-T. Kao, D. Zhong, and S.J. Singer, "Hydration
Dynamics and Time Scales of Coupled Water-Protein Fluctuations." J. Am.
Chem. Soc. 129 (2007) 3376-3382.
[132] S. Cavagnero, C. Nishimura, S. Schwarzinger, H.J. Dyson, and P.E. Wright,
"Conformational and Dynamic Characterization of the Molten Globule State
of an Apomyoglobin Mutant with an Altered Folding Pathway." Biochemistry
40 (2001) 14459-14467.
[133] D. Eliezer, J. Chung, H.J. Dyson, and P.E. Wright, "Native and Non-native
Secondary Structure and Dynamics in the pH 4 Intermediate of
Apomyoglobin." Biochemistry 39 (2000) 2894-2901.
[134] D. Eliezer, P.A. Jennings, H.J. Dyson, and P.E. Wright, "Populating the
equilibrium molten globule state of apomyoglobin under conditions suitable
for structural characterization by NMR." FEBS Lett. 417 (1997) 92-96.
[135] D. Eliezer, and P.E. Wright, Is Apomyoglobin a Molten Globule? "Structural
Characterization by NMR." J. Mol. Biol. 263 (1996) 531-538.
122
[136] V. Tsui, C. Garcia, S. Cavagnero, G. Siuzdak, H.J. Dyson, and P.E. Wright,
"Quench-flow experiments combined with mass spectrometry show
apomyoglobin folds through an obligatory intermediate." Protein Science 8
(1999) 45-49.
[137] C. Nishimura, H.J. Dyson, and P.E. Wright, "Enhanced picture of protein-
folding intermediates using organic solvents in H/D exchange and quench-
flow experiments." Proc. Nat. Acad. Sci. U.S.A 102 (2005) 4765-4770.
[138] T. Uzawa, C. Nishimura, S. Akiyama, K. Ishimori, S. Takahashi, H.J. Dyson,
and P.E. Wright, "Hierarchical folding mechanism of apomyoglobin revealed
by ultra-fast H/D exchange coupled with 2D NMR." Proc. Nat. Acad. Sci.
U.S.A. 105 (2008) 13859-13864.
[139] A.M. Bertagna, and D. Barrick, Nonspecific hydrophobic interactions stabilize
an equilibrium intermediate of apomyoglobin at a key position within the
AGH region. Proc. Nat. Acad. Sci. U.S.A. 101 (2004) 12514-12519.
[140] J. Kuriyan, S. Wilz, M. Karplus, and G.A. Petsko, "X-Ray Structure and
Refinement of Carbon-Monoxy (Fe-Ii)-Myoglobin at 1.5-a Resolution." J.
Mol. Biol. 192 (1986) 133-154.
[141] B.D. Armstrong, P. Soto, J.-E. Shea, and S. Han, "Overhauser dynamic nuclear
polarization and molecular dynamics simulations using pyrroline and
piperidine ring nitroxide radicals." J. Magn. Reson. 200 (2009) 137-141.
[142] V.A. Makarov, B.K. Andrews, P.E. Smith, and B.M. Pettitt, "Residence Times
of Water Molecules in the Hydration Sites of Myoglobin." Biophys. J. 79
(2000) 2966-2974.
[143] C.C. Chow, C. Chow, V. Raghunathan.,T.J. Huppert, E.B. Kimball, and C. S.
Cavagnero, "Chain length dependence of apomyoglobin folding: structural
evolution from misfolded sheets tonative helices." Biochemistry 42 (2003).
[144] P.A. Jennings, M.J. Stone, and P.E. Wright, "Overexpression of myoglobin and
assignment of its amide, c-alpha and c-beta resonances." J. Biomol. NMR 6
(1995) 271-276.
[145] V.S. Bajaj, M.L. Mak-Jurkauskas, M. Belenky, J. Herzfeld, and R.G. Griffin,
"Functional and shunt states of bacteriorhodopsin resolved by 250 GHz
dynamic nuclear polarization enhanced solid-state NMR." Proc. Nat. Acad.
Sci. U.S.A. 106 (2009) 9244-9249.
123
[146] M. Rosay, A.C. Zeri, N.S. Astrof, S.J. Opella, J. Herzfeld, and R.G. Griffin,
"Sensitivity-enhanced NMR of biological solids: dynamic nuclear polarization
of Y21M fd bacteriophage and purple membrane." J. Am. Chem. Soc. 123
(2001) 1010-1011.
[147] C. Hilty, G. Wider, C. Fernandez, and K. Wuethrich, "Membrane protein - lipid
interactions in mixed micelles studied by NMR spectroscopy with the use of
paramagnetic reagents." ChemBioChem 5 (2004) 467-473.
[148] S. Bowen, and C. Hilty, "Temporal Chemical Shift Correlations in Reactions
Studied by Hyperpolarized Nuclear Magnetic Resonance." Anal. Chem. 81
(2009) 4543-4547.
[149] S. Bowen, and C. Hilty, "Time-Resolved Dynamic Nuclear Polarization
Enhanced NMR Spectroscopy." Angew. Chem. Int. Ed. 47 (2008) 5235-5237.
[150] K. Golman, R. Zandt, and M. Thaning, "Real-time metabolic imaging." Proc.
Nat. Acad. Sci. U.S.A. 103 (2006) 11270-11275.
[151] L. Frydman, and D. Blazina, "Ultrafast two-dimensional nuclear magnetic
resonance spectroscopy of hyperpolarized solutions." Nat. Phys. 3 (2007) 415-
419.
[152] V. Weis, and R.G. Griffin, "Electron-nuclear cross polarization." Solid State
Nucl. Magn. Reson. 29 (2006) 66-78.
[153] D.R. McCamey, J. van Tol, G.W. Morley, and C. Boehme, "Fast Nuclear Spin
Hyperpolarization of Phosphorus in Silicon." Phys. Rev. Lett. 102 (2009)
027601.
[154] G.W. Morley, J. van Tol, A. Ardavan, K. Porfyrakis, J. Zhang, and G.A.D.
Briggs, "Efficient Dynamic Nuclear Polarization at High Magnetic Fields."
Phys. Rev. Lett. 98 (2007) 220501.
[155] K.N. Hu, H.h. Yu, T.M. Swager, and R.G. Griffin, "Dynamic Nuclear
Polarization with Biradicals." J. Am. Chem. Soc. 126 (2004) 10844-10845.
[156] Y. Matsuki, T. Maly, O. Ouari, H. Karoui, F. Le Moigne, E. Rizzato, S.
Lyubenova, J. Herzfeld, T. Prisner, P. Tordo, and Robert G. Griffin,
"Dynamic Nuclear Polarization with a Rigid Biradical." Angew. Chem. Int.
Ed. 48 (2009) 4996-5000.
124
[157] H. Blok, J.A.J.M. Disselhorst, S.B. Orlinskii, and J. Schmidt, "A continuous-
wave and pulsed electron spin resonance spectrometer operating at 275 GHz."
J. Magn. Reson. 166 (2004) 92-99.
[158] K.A. Earle, Freed, J.H., "Quasioptical Hardware for a Flexible FIR-EPR
Spectrometer." App. Magn. Reson. 16 (1999) 26.
[159] K.A. Earle, D.E. Budil, J.H. Freed, and S.W. Warren, "Millimeter wave
electron spin resonance using quasioptical techniques." Advan. Magn. Opt.
Reson. Academic Press (1996) 253-323.
[160] W. Hofbauer, K.A. Earle, C.R. Dunnam, J.K. Moscicki, and J.H. Freed, "High-
power 95 GHz pulsed electron spin resonance spectrometer." Rev. Sci.
Instrum. 75 (2004) 1194-1208.
[161] B. Náfrádi, R. Gaál, A. Sienkiewicz, T. Fehér, and L. Forró, "Continuous-wave
far-infrared ESR spectrometer for high-pressure measurements." J. Magn.
Reson. 195 (2008) 206-210.
[162] G.M. Smith, J.C.G. Lesurf, R.H. Mitchell, and P.C. Riedi, "Quasi-optical cw
mm-wave electron spin resonance spectrometer." Rev. Sci. Instrum. 69 (1998)
3924-3937.
[163] S. Takahashi, D.G. Allen, J. Seifter, G. Ramian, M.S. Sherwin, L.-C. Brunel,
and J. van Tol, "Pulsed EPR spectrometer with injection-locked UCSB free-
electron laser." Infrared Phys. Techn. 51 (2008) 426-428.
[164] J. van Tol, L.C. Brunel, and R.J. Wylde, "A quasioptical transient electron spin
resonance spectrometer operating at 120 and 240 GHz." Rev. Sci. Instrum. 76
(2005) 074101-8.
[165] W.B. Lynch, K.A. Earle, and J.H. Freed, "1-mm wave ESR spectrometer." Rev.
Sci. Instrum. 59 (1988) 1345-1351.
[166] P.A.S. Cruickshank, D.R. Bolton, D.A. Robertson, R.I. Hunter, R.J. Wylde, and
G.M. Smith, "A kilowatt pulsed 94 GHz electron paramagnetic resonance
spectrometer with high concentration sensitivity, high instantaneous
bandwidth, and low dead time." Rev. Sci. Instrum. 80 (2009) 103102-15.
[167] D.H. Martin, and E. Puplett, "Polarised interferometric spectrometry for the
millimetre and submillimetre spectrum." Infrared Phys. 10 (1969) 105-109.
125
[168] M.J. Prandolini, V.P. Denysenkov, M. Gafurov, B. Endeward, and T.F. Prisner,
"High-Field Dynamic Nuclear Polarization in Aqueous Solutions." J. Am.
Chem. Soc. 131 (2009) 6090-6092.
[169] K.R. Thurber, W.-M. Yau, and R. Tycko, "Low-Temperature Dynamic Nuclear
Polarization at 9.4 Tesla With a 30 Milliwatt Microwave Source." J. Magn.
Reson. 10.1016/j.jmr.2010.01.016 (2010).
[170] D.H. Martin, and R.J. Wylde, "Wideband Circulators for Use at Frequencies
Above 100 GHz to Beyond 350 GHz." IEEE Trans. Microw. Theory 57
(2009) 99-108.
[171] H. Kogelnik, and T. Li, "Laser Beams and Resonators." Appl. Optics 5 (1966)
1550-1567.
[172] A. Balkcum, R. Ellis, D. Boyd, and S. Guharay, "Generation of millimeter
wave Gaussian beams and their propagation in a dielectric waveguide." Int. J.
Infrared Milli. 13 (1992) 1321-1340.
[173] T. Stich, S. Lahiri, G. Yeagle, M. Dicus, M. Brynda, A. Gunn, C. Aznar, V.
DeRose, and R. Britt, "Multifrequency pulsed EPR studies of biologically
relevant manganese(II) complexes." Appl. Magn. Reson. 31 (2007) 321-341.
[174] R.R. Ernst, "Numerical Hilbert transform and automatic phase correction in
magnetic resonance spectroscopy." J. Magn. Reson. 1 (1969) 7-26.
[175] J.H. Ardenkjaer-Larsen, S. Macholl, and H. Jóhannesson, "Dynamic Nuclear
Polarization with Trityls at 1.2 K." Appl. Magn. Reson. 34 (2008) 509-522.
[176] P. Belland, and J.P. Crenn, "Matching of a Gaussian beam into hollow
oversized circular waveguides." Int. J. Infrared Milli. 10 (1989) 1279-1287.
[177] H. Jóhannesson, S. Macholl, and J.H. Ardenkjaer-Larsen, "Dynamic Nuclear
Polarization of [1-13C]pyruvic acid at 4.6 tesla." J. Magn. Reson. 197 (2009)
167-175.
[178] L.R. Becerra, G.J. Gerfen, R.J. Temkin, D.J. Singel, and R.G. Griffin,
"Dynamic nuclear polarization with a cyclotron resonance maser at 5 T."
Phys. Rev. Lett. 71 (1993) 3561.
[179] G.J. Gerfen, L.R. Becerra, D.A. Hall, R.G. Griffin, R.J. Temkin, and D.J.
"Singel, High frequency (140 GHz) dynamic nuclear polarization: polarization
transfer to a solute in frozen aqueous solution." J. Chem. Phys. 102 (1995)
9494-7.
126
[180] J.A. Murphy, "Distortion of a simple Gaussian beam on reflection from off-axis
ellipsoidal mirrors." Int. J. Infrared Milli. 8 (1987) 1165-1187.
[181] J. Granwehr, J. Leggett, and W. Köckenberger, "A low-cost implementation of
EPR detection in a dissolution DNP setup." J. Magn. Reson. 187 (2007) 266-
276.
[182] K.N. Hu, V.S. Bajaj, M. Rosay, and R.G. Griffin, "High-frequency dynamic
nuclear polarization using mixtures of TEMPO and trityl radicals." J. Chem.
Phys. 126 (2007) 044512.
[183] J.W. Aptekar, M.C. Cassidy, A.C. Johnson, R.A. Barton, M. Lee, A.C. Ogier,
C. Vo, M.N. Anahtar, Y. Ren, S.N. Bhatia, C. Ramanathan, D.G. Cory, A.L.
Hill, R.W. Mair, M.S. Rosen, R.L. Walsworth, and C.M. Marcus, "Silicon
Nanoparticles as Hyperpolarized Magnetic Resonance Imaging Agents." ACS
Nano 3 (2009) 4003-4008.
[184] A.E. Dementyev, D.G. Cory, and C. Ramanathan, Dynamic Nuclear
Polarization in Silicon Microparticles. Phys. Rev. Lett. 100 (2008) 127601.