Embed Size (px)
Citation preview
University of Colorado
2014-15 Diversity Report
Prepared by the University of Colorado System Office of Institutional Research May 2015
https://www.cu.edu/office-academic-affairs/reports-highlights
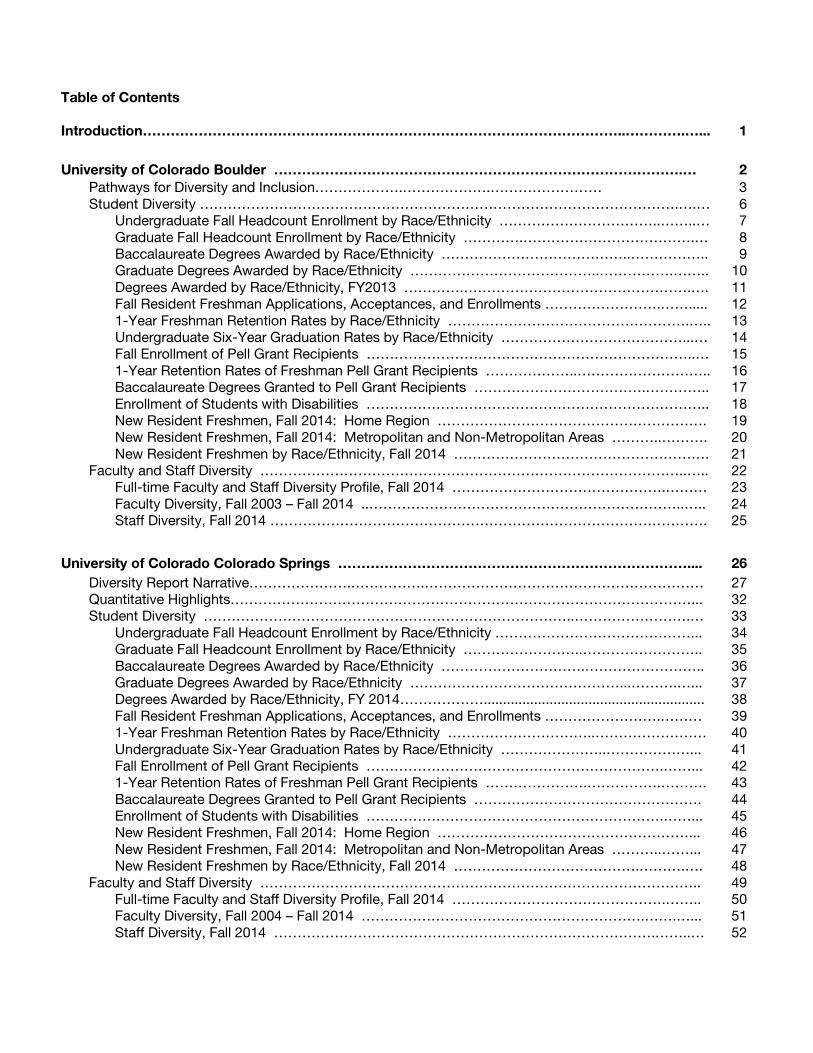
Table of Contents Introduction…………………………………………………………………………………………..………….…... 1 University of Colorado Boulder …………………………………………………………………………….… 2 Pathways for Diversity and Inclusion……………….……………….…………………… 3 Student Diversity ………………………………………………………………………………………….….… 6 Undergraduate Fall Headcount Enrollment by Race/Ethnicity ……………………………..……..… 7 Graduate Fall Headcount Enrollment by Race/Ethnicity ………….……………………………….… 8 Baccalaureate Degrees Awarded by Race/Ethnicity …………………………………..…………….. 9 Graduate Degrees Awarded by Race/Ethnicity …………………………………..…………….…….. 10 Degrees Awarded by Race/Ethnicity, FY2013 ………….………………………………………….…. 11 Fall Resident Freshman Applications, Acceptances, and Enrollments …………………….……..... 12 1-Year Freshman Retention Rates by Race/Ethnicity …………………………………………….….. 13 Undergraduate Six-Year Graduation Rates by Race/Ethnicity …………………………………...… 14 Fall Enrollment of Pell Grant Recipients ……………………………………………………………..… 15 1-Year Retention Rates of Freshman Pell Grant Recipients ………………..……………………….. 16 Baccalaureate Degrees Granted to Pell Grant Recipients ……………………………….………….. 17 Enrollment of Students with Disabilities ……………………………………………………………….. 18 New Resident Freshmen, Fall 2014: Home Region …………………………………………………. 19 New Resident Freshmen, Fall 2014: Metropolitan and Non-Metropolitan Areas ………..………. 20 New Resident Freshmen by Race/Ethnicity, Fall 2014 ………………………………………………. 21 Faculty and Staff Diversity ………………………………………………………………………………..….. 22 Full-time Faculty and Staff Diversity Profile, Fall 2014 ……………………………………….……… 23 Faculty Diversity, Fall 2003 – Fall 2014 ..…………………………………………………………..….. 24 Staff Diversity, Fall 2014 …………………………………………………………………………………. 25
University of Colorado Colorado Springs ………………………………………………………………….... 26 Diversity Report Narrative………………….…………….…………………………………………………… 27 Quantitative Highlights………………………………………………………………………………………... 32 Student Diversity ……………………………………………………………………..…………………….… 33 Undergraduate Fall Headcount Enrollment by Race/Ethnicity ……………………………………... 34 Graduate Fall Headcount Enrollment by Race/Ethnicity ……………………..…………………….. 35 Baccalaureate Degrees Awarded by Race/Ethnicity ………………………….…………………….. 36 Graduate Degrees Awarded by Race/Ethnicity ………………………………………...……….…... 37 Degrees Awarded by Race/Ethnicity, FY 2014………………......................................................... 38 Fall Resident Freshman Applications, Acceptances, and Enrollments …………………….……… 39 1-Year Freshman Retention Rates by Race/Ethnicity …………………………..…………………… 40 Undergraduate Six-Year Graduation Rates by Race/Ethnicity …………………..………………... 41 Fall Enrollment of Pell Grant Recipients ……………………………………………………….……... 42 1-Year Retention Rates of Freshman Pell Grant Recipients ………………….…………….………. 43 Baccalaureate Degrees Granted to Pell Grant Recipients …………………………………………. 44 Enrollment of Students with Disabilities ……………………………………………………….……... 45 New Resident Freshmen, Fall 2014: Home Region ………………………………………………... 46 New Resident Freshmen, Fall 2014: Metropolitan and Non-Metropolitan Areas ………..……... 47 New Resident Freshmen by Race/Ethnicity, Fall 2014 ………………………………….……….…. 48 Faculty and Staff Diversity ………………………………………………………………………………….. 49 Full-time Faculty and Staff Diversity Profile, Fall 2014 ……………………………………….…….. 50 Faculty Diversity, Fall 2004 – Fall 2014 …………………………………………………….…….…... 51 Staff Diversity, Fall 2014 ……………………………………………………………………….……..… 52
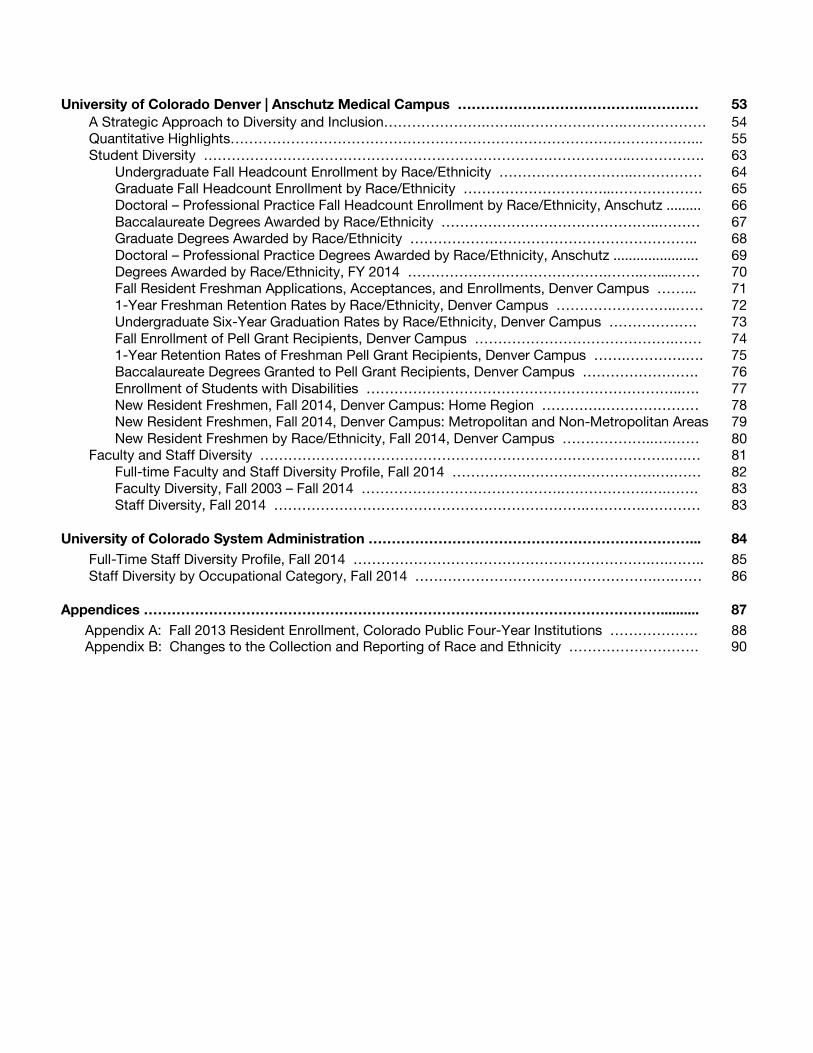
University of Colorado Denver | Anschutz Medical Campus ………………………………….………… 53 A Strategic Approach to Diversity and Inclusion………………….……..………………….……………… 54 Quantitative Highlights………………………………………………………………………………………... 55 Student Diversity ………………………………………………………………………………..……………. 63 Undergraduate Fall Headcount Enrollment by Race/Ethnicity ………………………..…………… 64 Graduate Fall Headcount Enrollment by Race/Ethnicity …………………………...………………. 65 Doctoral – Professional Practice Fall Headcount Enrollment by Race/Ethnicity, Anschutz ......... 66 Baccalaureate Degrees Awarded by Race/Ethnicity ………………………………………..……… 67 Graduate Degrees Awarded by Race/Ethnicity …………………………………………………….. 68 Doctoral – Professional Practice Degrees Awarded by Race/Ethnicity, Anschutz ...................... 69 Degrees Awarded by Race/Ethnicity, FY 2014 …………………………………….……..…....…… 70 Fall Resident Freshman Applications, Acceptances, and Enrollments, Denver Campus ……... 71 1-Year Freshman Retention Rates by Race/Ethnicity, Denver Campus ……………………..…… 72 Undergraduate Six-Year Graduation Rates by Race/Ethnicity, Denver Campus ………………. 73 Fall Enrollment of Pell Grant Recipients, Denver Campus …………………………………….…… 74 1-Year Retention Rates of Freshman Pell Grant Recipients, Denver Campus …….………….…. 75 Baccalaureate Degrees Granted to Pell Grant Recipients, Denver Campus ……………………. 76 Enrollment of Students with Disabilities …………………………………………………………..…. 77 New Resident Freshmen, Fall 2014, Denver Campus: Home Region ………….………………… 78 New Resident Freshmen, Fall 2014, Denver Campus: Metropolitan and Non-Metropolitan Areas 79 New Resident Freshmen by Race/Ethnicity, Fall 2014, Denver Campus ………………..….…… 80 Faculty and Staff Diversity …………………………………………………………………………….….… 81 Full-time Faculty and Staff Diversity Profile, Fall 2014 …………….……………………….….…… 82 Faculty Diversity, Fall 2003 – Fall 2014 …………………………………….……………….….……. 83 Staff Diversity, Fall 2014 ………………………………………………………….………….………… 83 University of Colorado System Administration ……………………………………………………………... 84 Full-Time Staff Diversity Profile, Fall 2014 ……………………………………………………….….…….. 85 Staff Diversity by Occupational Category, Fall 2014 …………………………………………….….…… 86 Appendices ………………………………………………………………………………………………….......... 87 Appendix A: Fall 2013 Resident Enrollment, Colorado Public Four-Year Institutions ………………. 88 Appendix B: Changes to the Collection and Reporting of Race and Ethnicity ………………………. 90
Introduction
Diversity is a core value of the University of Colorado. CU believes all students—regardless of ethnic, racial, political, gender, religious, intellectual, and geographical background—will have a more enriching college experience when they are exposed to a plurality of ideas, viewpoints, life experiences, and rapidly evolving perspectives on national identity. The university continually seeks to create a more inclusive university community—one that fosters an academic climate that is productive, positive, safe, and respectful of all viewpoints.
The diversity report is an important mechanism for campus officials to share information with the Board of Regents, campus community, and the public about efforts to increase campus diversity and provide an environment that allows all students to succeed. It includes the following information for each CU campus:
• An overview of campus efforts to support diversity and inclusiveness
• Undergraduate and graduate enrollment by race/ethnicity
• Baccalaureate, master’s, doctoral, and professional degrees awarded by race/ethnicity
• Resident freshmen applications, acceptances, and enrollments by race/ethnicity
• Freshmen retention rates by race/ethnicity • Graduation rates by race/ethnicity • Enrollment of, retention rates for, and degrees awarded to Pell Grant recipients • Enrollment of undergraduate students registered with their campus disability
services office • Home region of resident freshmen • Race/ethnicity of resident freshmen • Faculty race/ethnicity and gender diversity by rank and tenure status • Staff race/ethnicity and gender diversity by occupational category • CU student enrollment in the context of higher education in Colorado
Data are also provided on the race/ethnic and gender diversity of system administration staff.
Diversity Data Online! View and interact with data from the 2014-15 Diversity Report using our new data visualization tool. Click here for our data visualizations or visit our website for more information. http://www.cu.edu/ir/
1
2
3
4
5
University of Colorado BoulderStudent Diversity
Data provided by the CU-Boulder Office of Planning, Budget, and Analysiswww.colorado.edu/pba/ia/
6
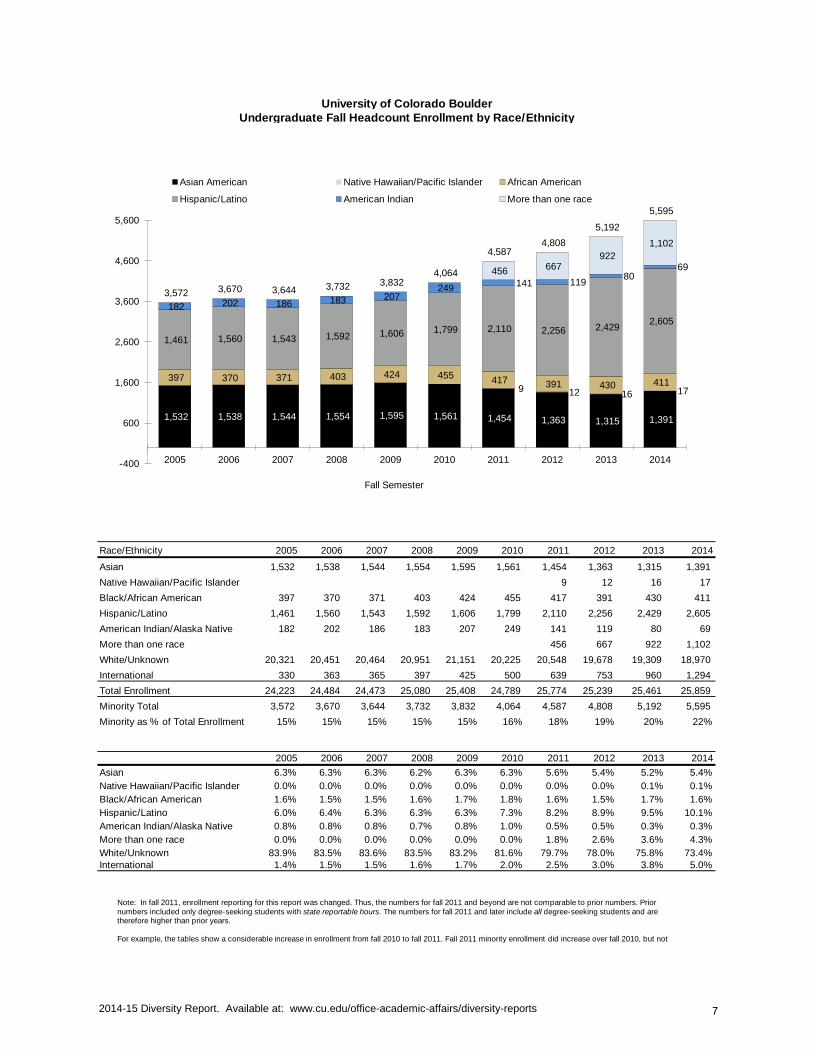
University of Colorado BoulderUndergraduate Fall Headcount Enrollment by Race/Ethnicity
Race/Ethnicity 2005 2006 2007 2008 2009 2010 2011 2012 2013 2014
Asian 1,532 1,538 1,544 1,554 1,595 1,561 1,454 1,363 1,315 1,391
Native Hawaiian/Pacific Islander 9 12 16 17
Black/African American 397 370 371 403 424 455 417 391 430 411
Hispanic/Latino 1,461 1,560 1,543 1,592 1,606 1,799 2,110 2,256 2,429 2,605
American Indian/Alaska Native 182 202 186 183 207 249 141 119 80 69
More than one race 456 667 922 1,102
White/Unknown 20,321 20,451 20,464 20,951 21,151 20,225 20,548 19,678 19,309 18,970
International 330 363 365 397 425 500 639 753 960 1,294
Total Enrollment 24,223 24,484 24,473 25,080 25,408 24,789 25,774 25,239 25,461 25,859
Minority Total 3,572 3,670 3,644 3,732 3,832 4,064 4,587 4,808 5,192 5,595
Minority as % of Total Enrollment 15% 15% 15% 15% 15% 16% 18% 19% 20% 22%
2005 2006 2007 2008 2009 2010 2011 2012 2013 2014
Asian 6.3% 6.3% 6.3% 6.2% 6.3% 6.3% 5.6% 5.4% 5.2% 5.4%
Native Hawaiian/Pacific Islander 0.0% 0.0% 0.0% 0.0% 0.0% 0.0% 0.0% 0.0% 0.1% 0.1%
Black/African American 1.6% 1.5% 1.5% 1.6% 1.7% 1.8% 1.6% 1.5% 1.7% 1.6%
Hispanic/Latino 6.0% 6.4% 6.3% 6.3% 6.3% 7.3% 8.2% 8.9% 9.5% 10.1%
American Indian/Alaska Native 0.8% 0.8% 0.8% 0.7% 0.8% 1.0% 0.5% 0.5% 0.3% 0.3%
More than one race 0.0% 0.0% 0.0% 0.0% 0.0% 0.0% 1.8% 2.6% 3.6% 4.3%
White/Unknown 83.9% 83.5% 83.6% 83.5% 83.2% 81.6% 79.7% 78.0% 75.8% 73.4%International 1.4% 1.5% 1.5% 1.6% 1.7% 2.0% 2.5% 3.0% 3.8% 5.0%
1,532 1,538 1,544 1,554 1,595 1,561 1,454 1,363 1,315 1,391
9 12 16 17
397 370 371 403 424 455 417 391 430 411
1,461 1,560 1,543 1,592 1,606 1,799 2,110 2,256 2,429 2,605
182 202 186 183 207 249
141 119 80
69 456 667 922
1,102
3,572 3,670 3,644 3,732 3,832 4,064
4,587 4,808
5,192
5,595
-400
600
1,600
2,600
3,600
4,600
5,600
2005 2006 2007 2008 2009 2010 2011 2012 2013 2014
Fall Semester
Asian American Native Hawaiian/Pacific Islander African American
Hispanic/Latino American Indian More than one race
Note: In fall 2011, enrollment reporting for this report was changed. Thus, the numbers for fall 2011 and beyond are not comparable to prior numbers. Prior numbers included only degree-seeking students with state reportable hours. The numbers for fall 2011 and later include all degree-seeking students and are therefore higher than prior years. For example, the tables show a considerable increase in enrollment from fall 2010 to fall 2011. Fall 2011 minority enrollment did increase over fall 2010, but not
2014-15 Diversity Report. Available at: www.cu.edu/office-academic-affairs/diversity-reports 7
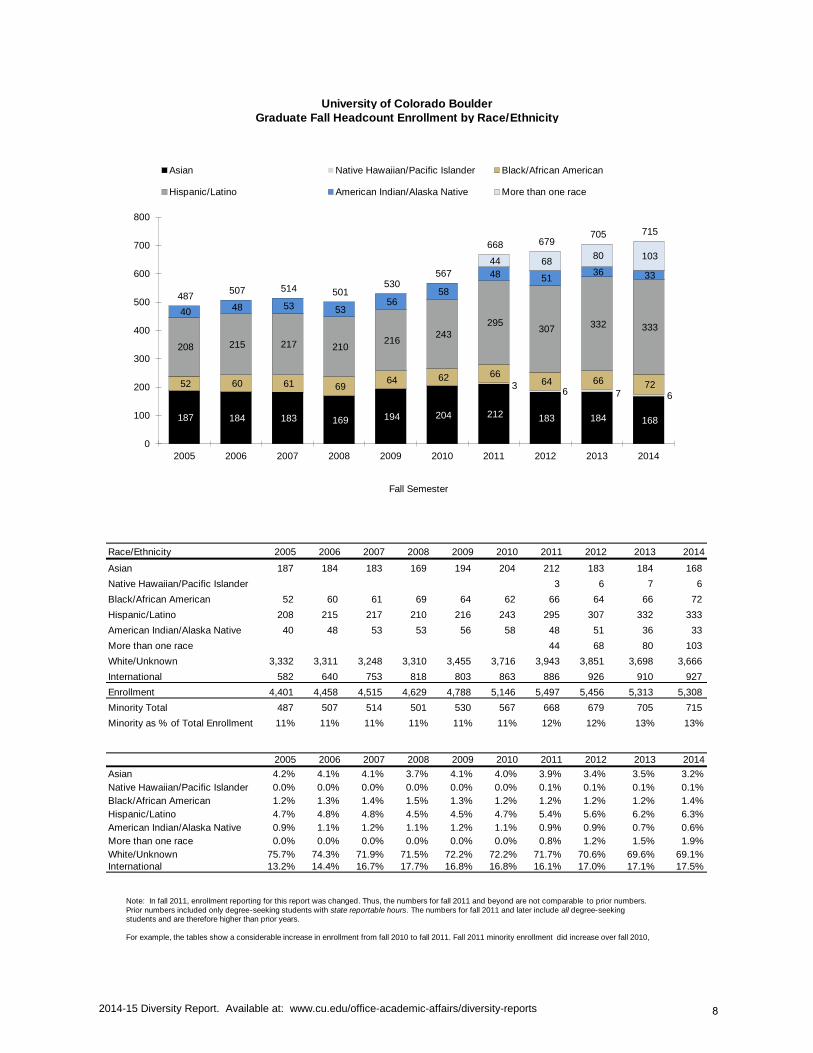
University of Colorado BoulderGraduate Fall Headcount Enrollment by Race/Ethnicity
Race/Ethnicity 2005 2006 2007 2008 2009 2010 2011 2012 2013 2014
Asian 187 184 183 169 194 204 212 183 184 168
Native Hawaiian/Pacific Islander 3 6 7 6
Black/African American 52 60 61 69 64 62 66 64 66 72
Hispanic/Latino 208 215 217 210 216 243 295 307 332 333
American Indian/Alaska Native 40 48 53 53 56 58 48 51 36 33
More than one race 44 68 80 103
White/Unknown 3,332 3,311 3,248 3,310 3,455 3,716 3,943 3,851 3,698 3,666
International 582 640 753 818 803 863 886 926 910 927
Enrollment 4,401 4,458 4,515 4,629 4,788 5,146 5,497 5,456 5,313 5,308
Minority Total 487 507 514 501 530 567 668 679 705 715
Minority as % of Total Enrollment 11% 11% 11% 11% 11% 11% 12% 12% 13% 13%
2005 2006 2007 2008 2009 2010 2011 2012 2013 2014
Asian 4.2% 4.1% 4.1% 3.7% 4.1% 4.0% 3.9% 3.4% 3.5% 3.2%
Native Hawaiian/Pacific Islander 0.0% 0.0% 0.0% 0.0% 0.0% 0.0% 0.1% 0.1% 0.1% 0.1%
Black/African American 1.2% 1.3% 1.4% 1.5% 1.3% 1.2% 1.2% 1.2% 1.2% 1.4%
Hispanic/Latino 4.7% 4.8% 4.8% 4.5% 4.5% 4.7% 5.4% 5.6% 6.2% 6.3%
American Indian/Alaska Native 0.9% 1.1% 1.2% 1.1% 1.2% 1.1% 0.9% 0.9% 0.7% 0.6%
More than one race 0.0% 0.0% 0.0% 0.0% 0.0% 0.0% 0.8% 1.2% 1.5% 1.9%
White/Unknown 75.7% 74.3% 71.9% 71.5% 72.2% 72.2% 71.7% 70.6% 69.6% 69.1%International 13.2% 14.4% 16.7% 17.7% 16.8% 16.8% 16.1% 17.0% 17.1% 17.5%
187 184 183 169 194 204 212 183 184 168
3 6 7 6
52 60 61 69 64 62 66
64 66 72
208 215 217 210 216
243 295
307 332 333
40 48 53 53 56
58
48 51 36 33
44 68 80 103
487 507 514 501
530 567
668 679 705 715
0
100
200
300
400
500
600
700
800
2005 2006 2007 2008 2009 2010 2011 2012 2013 2014
Fall Semester
Asian Native Hawaiian/Pacific Islander Black/African American
Hispanic/Latino American Indian/Alaska Native More than one race
Note: In fall 2011, enrollment reporting for this report was changed. Thus, the numbers for fall 2011 and beyond are not comparable to prior numbers. Prior numbers included only degree-seeking students with state reportable hours. The numbers for fall 2011 and later include all degree-seeking students and are therefore higher than prior years. For example, the tables show a considerable increase in enrollment from fall 2010 to fall 2011. Fall 2011 minority enrollment did increase over fall 2010,
2014-15 Diversity Report. Available at: www.cu.edu/office-academic-affairs/diversity-reports 8
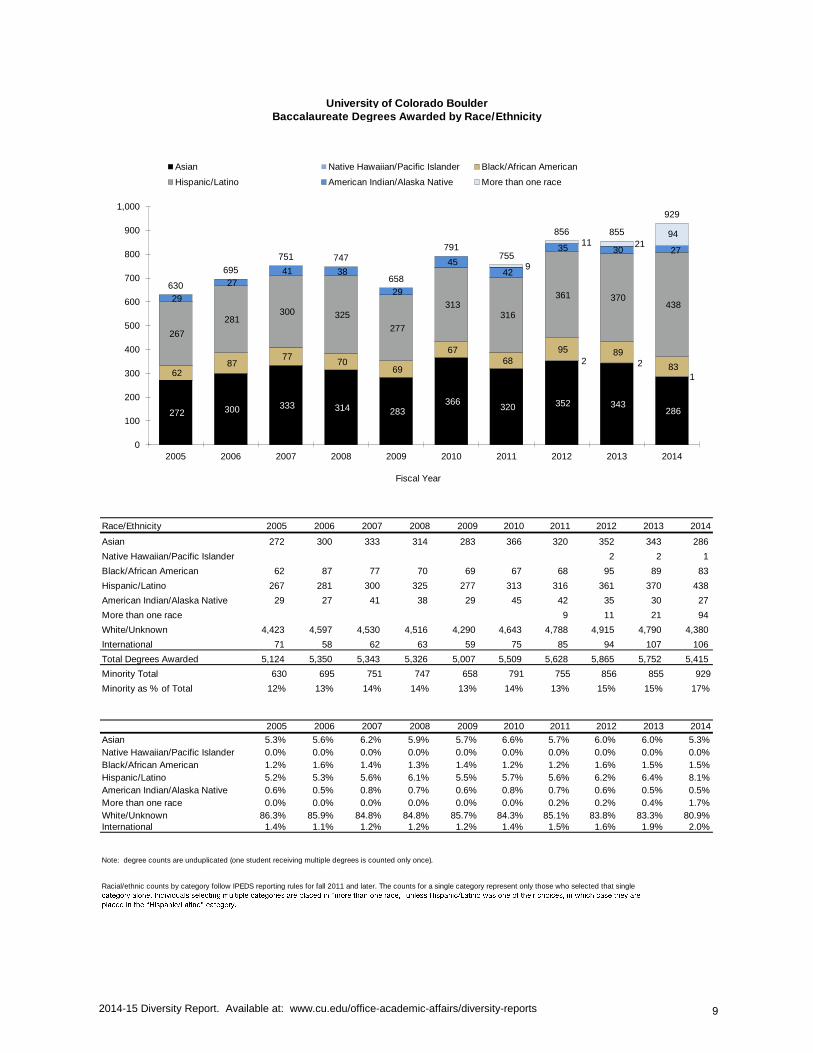
University of Colorado BoulderBaccalaureate Degrees Awarded by Race/Ethnicity
Race/Ethnicity 2005 2006 2007 2008 2009 2010 2011 2012 2013 2014
Asian 272 300 333 314 283 366 320 352 343 286
Native Hawaiian/Pacific Islander 2 2 1
Black/African American 62 87 77 70 69 67 68 95 89 83
Hispanic/Latino 267 281 300 325 277 313 316 361 370 438
American Indian/Alaska Native 29 27 41 38 29 45 42 35 30 27
More than one race 9 11 21 94
White/Unknown 4,423 4,597 4,530 4,516 4,290 4,643 4,788 4,915 4,790 4,380
International 71 58 62 63 59 75 85 94 107 106
Total Degrees Awarded 5,124 5,350 5,343 5,326 5,007 5,509 5,628 5,865 5,752 5,415
Minority Total 630 695 751 747 658 791 755 856 855 929
Minority as % of Total 12% 13% 14% 14% 13% 14% 13% 15% 15% 17%
2005 2006 2007 2008 2009 2010 2011 2012 2013 2014
Asian 5.3% 5.6% 6.2% 5.9% 5.7% 6.6% 5.7% 6.0% 6.0% 5.3%
Native Hawaiian/Pacific Islander 0.0% 0.0% 0.0% 0.0% 0.0% 0.0% 0.0% 0.0% 0.0% 0.0%
Black/African American 1.2% 1.6% 1.4% 1.3% 1.4% 1.2% 1.2% 1.6% 1.5% 1.5%
Hispanic/Latino 5.2% 5.3% 5.6% 6.1% 5.5% 5.7% 5.6% 6.2% 6.4% 8.1%
American Indian/Alaska Native 0.6% 0.5% 0.8% 0.7% 0.6% 0.8% 0.7% 0.6% 0.5% 0.5%
More than one race 0.0% 0.0% 0.0% 0.0% 0.0% 0.0% 0.2% 0.2% 0.4% 1.7%
White/Unknown 86.3% 85.9% 84.8% 84.8% 85.7% 84.3% 85.1% 83.8% 83.3% 80.9%International 1.4% 1.1% 1.2% 1.2% 1.2% 1.4% 1.5% 1.6% 1.9% 2.0%
Note: degree counts are unduplicated (one student receiving multiple degrees is counted only once).
Racial/ethnic counts by category follow IPEDS reporting rules for fall 2011 and later. The counts for a single category represent only those who selected that single
272 300 333 314 283 366
320 352 343 286
2 2
1 62 87
77 70
69
67 68
95 89
83
267
281 300 325
277
313 316
361 370 438
29
27
41 38
29
45 42
35 30 27
9
11 21 94
630
695
751 747
658
791 755
856 855
929
0
100
200
300
400
500
600
700
800
900
1,000
2005 2006 2007 2008 2009 2010 2011 2012 2013 2014
Fiscal Year
Asian Native Hawaiian/Pacific Islander Black/African American
Hispanic/Latino American Indian/Alaska Native More than one race
2014-15 Diversity Report. Available at: www.cu.edu/office-academic-affairs/diversity-reports 9
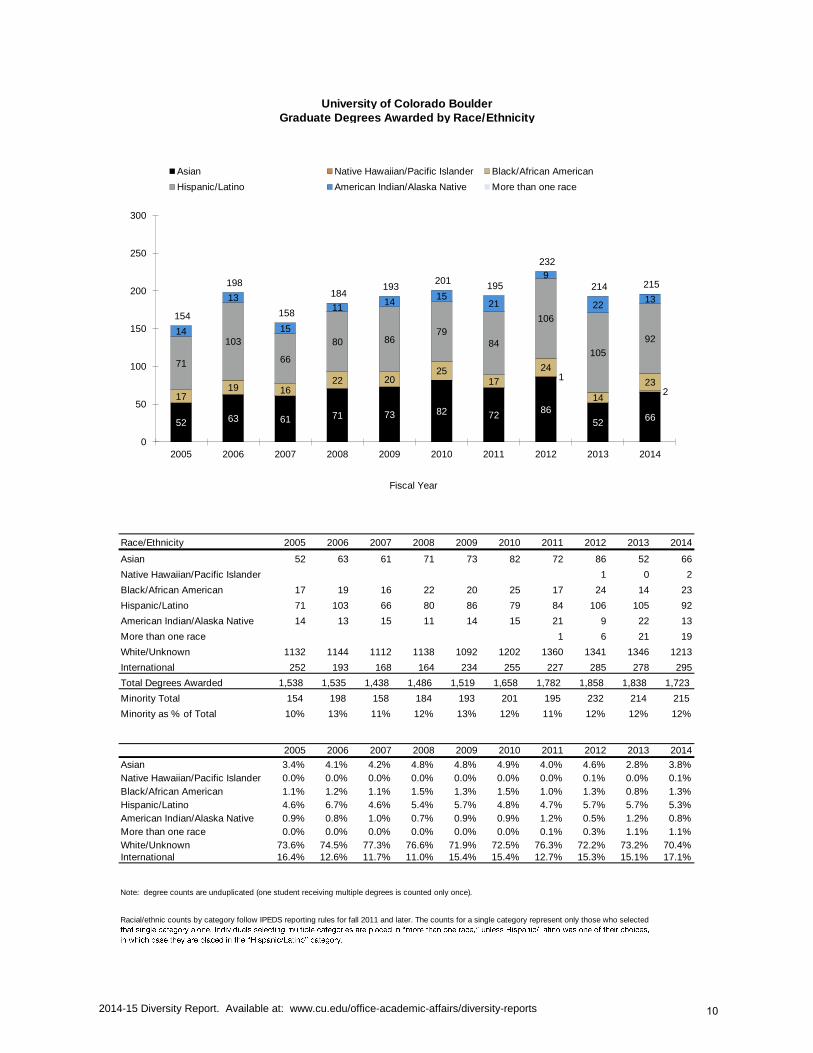
University of Colorado BoulderGraduate Degrees Awarded by Race/Ethnicity
Race/Ethnicity 2005 2006 2007 2008 2009 2010 2011 2012 2013 2014
Asian 52 63 61 71 73 82 72 86 52 66
Native Hawaiian/Pacific Islander 1 0 2
Black/African American 17 19 16 22 20 25 17 24 14 23
Hispanic/Latino 71 103 66 80 86 79 84 106 105 92
American Indian/Alaska Native 14 13 15 11 14 15 21 9 22 13
More than one race 1 6 21 19
White/Unknown 1132 1144 1112 1138 1092 1202 1360 1341 1346 1213
International 252 193 168 164 234 255 227 285 278 295
Total Degrees Awarded 1,538 1,535 1,438 1,486 1,519 1,658 1,782 1,858 1,838 1,723
Minority Total 154 198 158 184 193 201 195 232 214 215
Minority as % of Total 10% 13% 11% 12% 13% 12% 11% 12% 12% 12%
2005 2006 2007 2008 2009 2010 2011 2012 2013 2014
Asian 3.4% 4.1% 4.2% 4.8% 4.8% 4.9% 4.0% 4.6% 2.8% 3.8%
Native Hawaiian/Pacific Islander 0.0% 0.0% 0.0% 0.0% 0.0% 0.0% 0.0% 0.1% 0.0% 0.1%
Black/African American 1.1% 1.2% 1.1% 1.5% 1.3% 1.5% 1.0% 1.3% 0.8% 1.3%
Hispanic/Latino 4.6% 6.7% 4.6% 5.4% 5.7% 4.8% 4.7% 5.7% 5.7% 5.3%
American Indian/Alaska Native 0.9% 0.8% 1.0% 0.7% 0.9% 0.9% 1.2% 0.5% 1.2% 0.8%
More than one race 0.0% 0.0% 0.0% 0.0% 0.0% 0.0% 0.1% 0.3% 1.1% 1.1%
White/Unknown 73.6% 74.5% 77.3% 76.6% 71.9% 72.5% 76.3% 72.2% 73.2% 70.4%International 16.4% 12.6% 11.7% 11.0% 15.4% 15.4% 12.7% 15.3% 15.1% 17.1%
Note: degree counts are unduplicated (one student receiving multiple degrees is counted only once).
Racial/ethnic counts by category follow IPEDS reporting rules for fall 2011 and later. The counts for a single category represent only those who selected
52 63 61 71 73 82 72 86
52 66
1
2 17
19 16 22 20
25 17
24
14
23
71
103
66
80 86 79
84
106
105
92 14
13
15
11 14
15 21
9
22 13
154
198
158
184 193
201 195
232
214 215
0
50
100
150
200
250
300
2005 2006 2007 2008 2009 2010 2011 2012 2013 2014
Fiscal Year
Asian Native Hawaiian/Pacific Islander Black/African American
Hispanic/Latino American Indian/Alaska Native More than one race
2014-15 Diversity Report. Available at: www.cu.edu/office-academic-affairs/diversity-reports 10
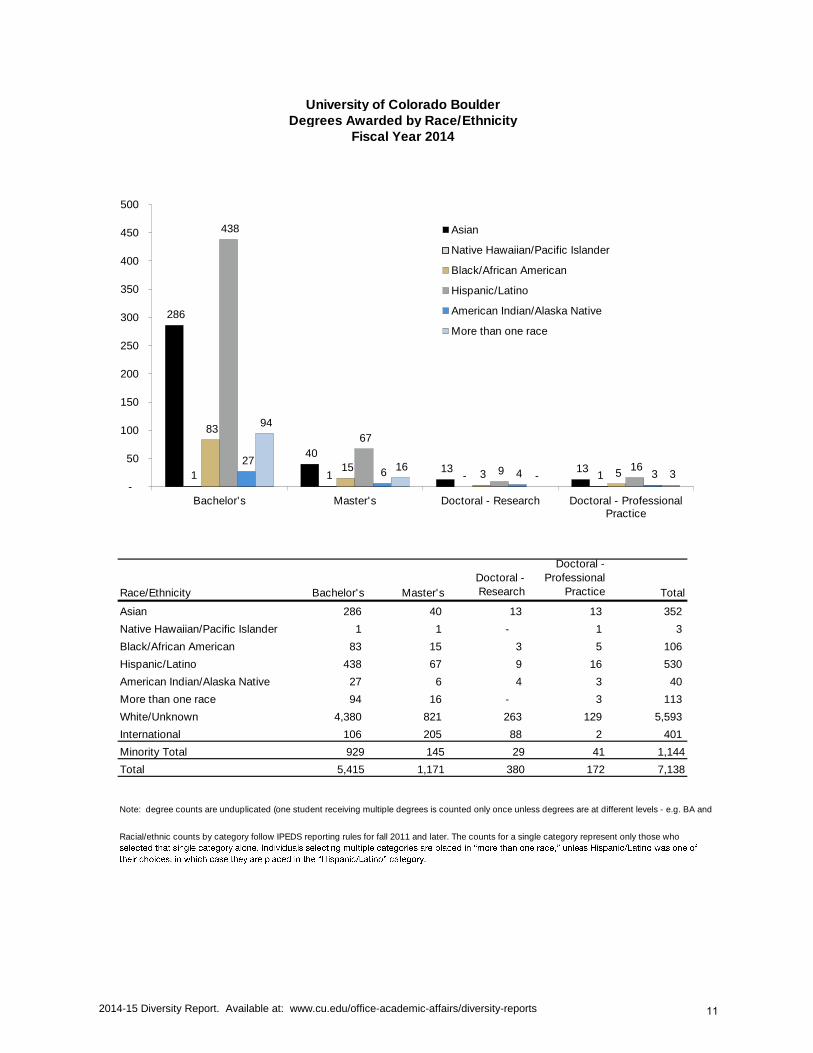
University of Colorado BoulderDegrees Awarded by Race/Ethnicity
Fiscal Year 2014
Race/Ethnicity Bachelor's Master's
Doctoral -
Research
Doctoral -
Professional
Practice Total
Asian 286 40 13 13 352
Native Hawaiian/Pacific Islander 1 1 - 1 3
Black/African American 83 15 3 5 106
Hispanic/Latino 438 67 9 16 530
American Indian/Alaska Native 27 6 4 3 40
More than one race 94 16 - 3 113
White/Unknown 4,380 821 263 129 5,593
International 106 205 88 2 401
Minority Total 929 145 29 41 1,144
Total 5,415 1,171 380 172 7,138
Note: degree counts are unduplicated (one student receiving multiple degrees is counted only once unless degrees are at different levels - e.g. BA and MA).
Racial/ethnic counts by category follow IPEDS reporting rules for fall 2011 and later. The counts for a single category represent only those who
286
40
13 13 1 1 - 1
83
15 3 5
438
67
9 16 27
6 4 3
94
16 - 3
-
50
100
150
200
250
300
350
400
450
500
Bachelor's Master's Doctoral - Research Doctoral - ProfessionalPractice
Asian
Native Hawaiian/Pacific Islander
Black/African American
Hispanic/Latino
American Indian/Alaska Native
More than one race
2014-15 Diversity Report. Available at: www.cu.edu/office-academic-affairs/diversity-reports 11
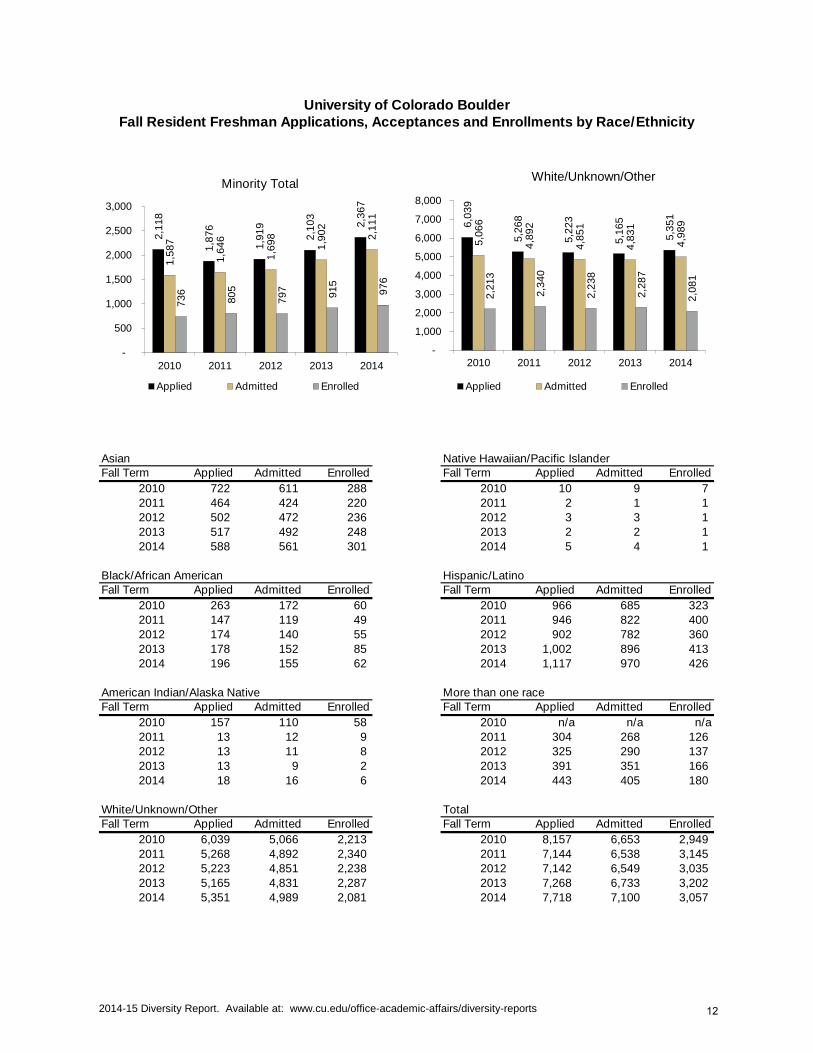
University of Colorado BoulderFall Resident Freshman Applications, Acceptances and Enrollments by Race/Ethnicity
Asian Native Hawaiian/Pacific IslanderFall Term Applied Admitted Enrolled Fall Term Applied Admitted Enrolled
2010 722 611 288 2010 10 9 7 2011 464 424 220 2011 2 1 1 2012 502 472 236 2012 3 3 1 2013 517 492 248 2013 2 2 1 2014 588 561 301 2014 5 4 1
Black/African American Hispanic/LatinoFall Term Applied Admitted Enrolled Fall Term Applied Admitted Enrolled
2010 263 172 60 2010 966 685 323 2011 147 119 49 2011 946 822 400 2012 174 140 55 2012 902 782 360 2013 178 152 85 2013 1,002 896 413 2014 196 155 62 2014 1,117 970 426
American Indian/Alaska Native More than one raceFall Term Applied Admitted Enrolled Fall Term Applied Admitted Enrolled
2010 157 110 58 2010 n/a n/a n/a2011 13 12 9 2011 304 268 126 2012 13 11 8 2012 325 290 137 2013 13 9 2 2013 391 351 166
2014 18 16 6 2014 443 405 180
White/Unknown/Other TotalFall Term Applied Admitted Enrolled Fall Term Applied Admitted Enrolled
2010 6,039 5,066 2,213 2010 8,157 6,653 2,949 2011 5,268 4,892 2,340 2011 7,144 6,538 3,145 2012 5,223 4,851 2,238 2012 7,142 6,549 3,035 2013 5,165 4,831 2,287 2013 7,268 6,733 3,202 2014 5,351 4,989 2,081 2014 7,718 7,100 3,057
2,1
18
1,8
76
1,9
19
2,1
03
2,3
67
1,5
87
1,6
46
1,6
98
1,9
02
2,1
11
73
6
80
5
79
7
91
5
97
6
-
500
1,000
1,500
2,000
2,500
3,000
2010 2011 2012 2013 2014
Minority Total
Applied Admitted Enrolled
6,0
39
5,2
68
5,2
23
5,1
65
5,3
51
5,0
66
4,8
92
4,8
51
4,8
31
4,9
89
2,2
13
2,3
40
2,2
38
2,2
87
2,0
81
-
1,000
2,000
3,000
4,000
5,000
6,000
7,000
8,000
2010 2011 2012 2013 2014
White/Unknown/Other
Applied Admitted Enrolled
2014-15 Diversity Report. Available at: www.cu.edu/office-academic-affairs/diversity-reports 12
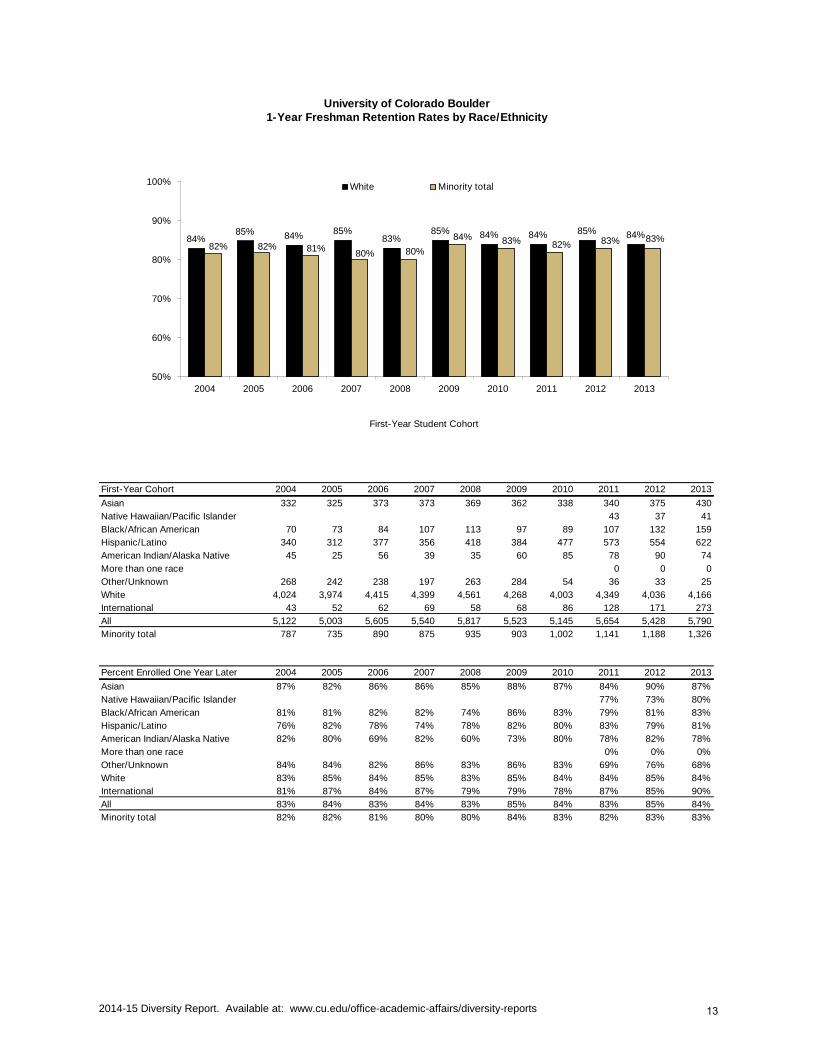
University of Colorado Boulder1-Year Freshman Retention Rates by Race/Ethnicity
First-Year Cohort 2004 2005 2006 2007 2008 2009 2010 2011 2012 2013
Asian 332 325 373 373 369 362 338 340 375 430
Native Hawaiian/Pacific Islander 43 37 41
Black/African American 70 73 84 107 113 97 89 107 132 159
Hispanic/Latino 340 312 377 356 418 384 477 573 554 622
American Indian/Alaska Native 45 25 56 39 35 60 85 78 90 74
More than one race 0 0 0
Other/Unknown 268 242 238 197 263 284 54 36 33 25
White 4,024 3,974 4,415 4,399 4,561 4,268 4,003 4,349 4,036 4,166
International 43 52 62 69 58 68 86 128 171 273
All 5,122 5,003 5,605 5,540 5,817 5,523 5,145 5,654 5,428 5,790
Minority total 787 735 890 875 935 903 1,002 1,141 1,188 1,326
Percent Enrolled One Year Later 2004 2005 2006 2007 2008 2009 2010 2011 2012 2013
Asian 87% 82% 86% 86% 85% 88% 87% 84% 90% 87%
Native Hawaiian/Pacific Islander 77% 73% 80%
Black/African American 81% 81% 82% 82% 74% 86% 83% 79% 81% 83%
Hispanic/Latino 76% 82% 78% 74% 78% 82% 80% 83% 79% 81%
American Indian/Alaska Native 82% 80% 69% 82% 60% 73% 80% 78% 82% 78%
More than one race 0% 0% 0%
Other/Unknown 84% 84% 82% 86% 83% 86% 83% 69% 76% 68%
White 83% 85% 84% 85% 83% 85% 84% 84% 85% 84%
International 81% 87% 84% 87% 79% 79% 78% 87% 85% 90%
All 83% 84% 83% 84% 83% 85% 84% 83% 85% 84%
Minority total 82% 82% 81% 80% 80% 84% 83% 82% 83% 83%
84% 85% 84%
85% 83%
85% 84% 84% 85% 84% 82% 82% 81%
80% 80%
84% 83% 82% 83% 83%
50%
60%
70%
80%
90%
100%
2004 2005 2006 2007 2008 2009 2010 2011 2012 2013
First-Year Student Cohort
White Minority total
2014-15 Diversity Report. Available at: www.cu.edu/office-academic-affairs/diversity-reports 13
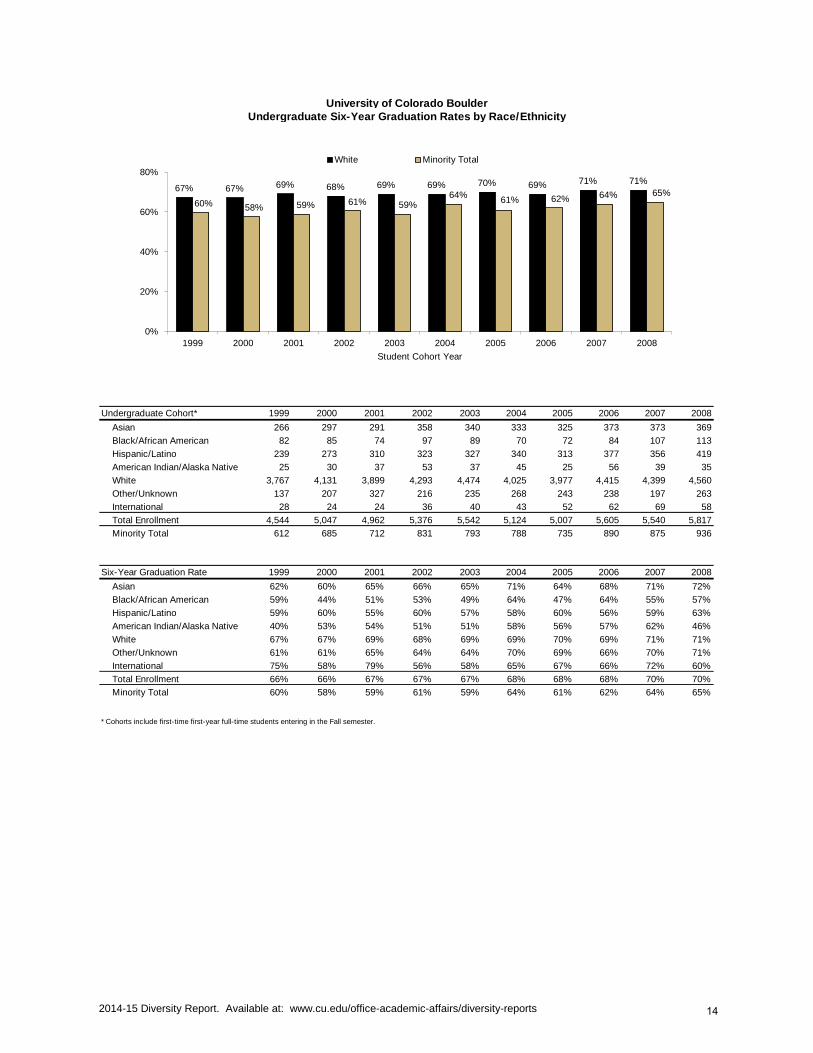
University of Colorado BoulderUndergraduate Six-Year Graduation Rates by Race/Ethnicity
Undergraduate Cohort* 1999 2000 2001 2002 2003 2004 2005 2006 2007 2008
Asian 266 297 291 358 340 333 325 373 373 369
Black/African American 82 85 74 97 89 70 72 84 107 113
Hispanic/Latino 239 273 310 323 327 340 313 377 356 419
American Indian/Alaska Native 25 30 37 53 37 45 25 56 39 35
White 3,767 4,131 3,899 4,293 4,474 4,025 3,977 4,415 4,399 4,560
Other/Unknown 137 207 327 216 235 268 243 238 197 263
International 28 24 24 36 40 43 52 62 69 58
Total Enrollment 4,544 5,047 4,962 5,376 5,542 5,124 5,007 5,605 5,540 5,817
Minority Total 612 685 712 831 793 788 735 890 875 936
Six-Year Graduation Rate 1999 2000 2001 2002 2003 2004 2005 2006 2007 2008
Asian 62% 60% 65% 66% 65% 71% 64% 68% 71% 72%
Black/African American 59% 44% 51% 53% 49% 64% 47% 64% 55% 57%
Hispanic/Latino 59% 60% 55% 60% 57% 58% 60% 56% 59% 63%
American Indian/Alaska Native 40% 53% 54% 51% 51% 58% 56% 57% 62% 46%
White 67% 67% 69% 68% 69% 69% 70% 69% 71% 71%
Other/Unknown 61% 61% 65% 64% 64% 70% 69% 66% 70% 71%
International 75% 58% 79% 56% 58% 65% 67% 66% 72% 60%
Total Enrollment 66% 66% 67% 67% 67% 68% 68% 68% 70% 70%
Minority Total 60% 58% 59% 61% 59% 64% 61% 62% 64% 65%
* Cohorts include first-time first-year full-time students entering in the Fall semester.
67% 67% 69% 68% 69% 69% 70% 69% 71% 71%
60% 58% 59% 61% 59% 64%
61% 62% 64% 65%
0%
20%
40%
60%
80%
1999 2000 2001 2002 2003 2004 2005 2006 2007 2008
Student Cohort Year
White Minority Total
2014-15 Diversity Report. Available at: www.cu.edu/office-academic-affairs/diversity-reports 14
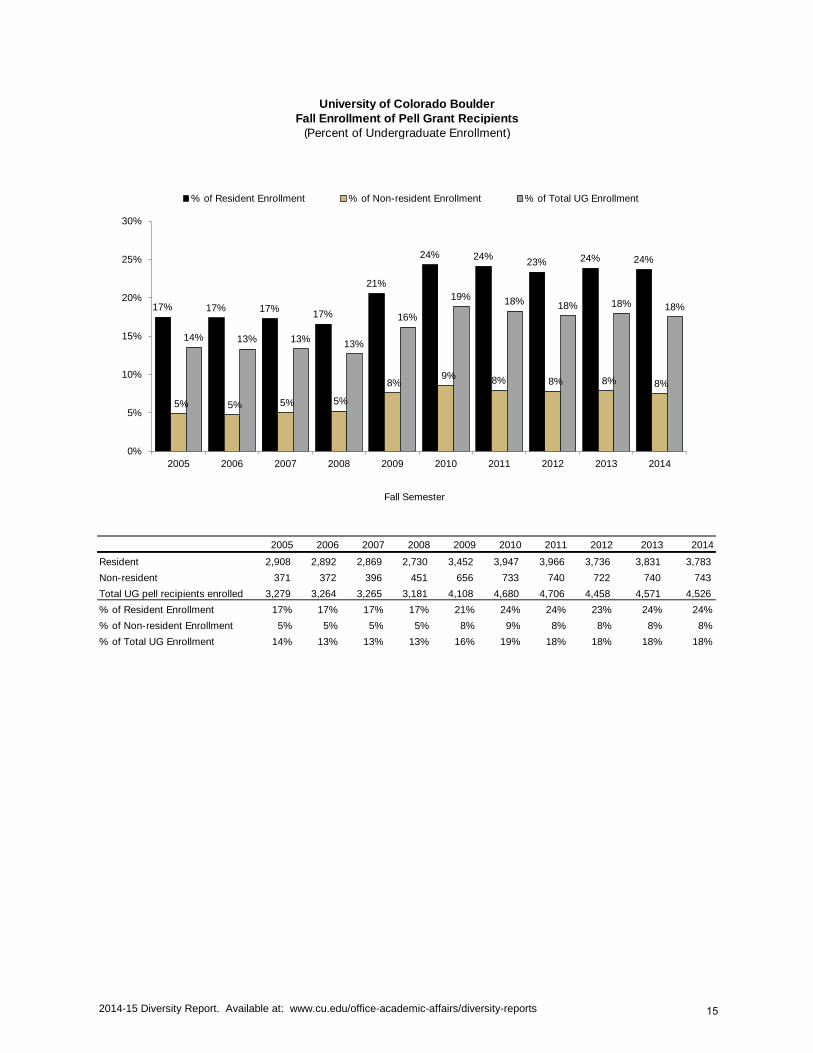
University of Colorado BoulderFall Enrollment of Pell Grant Recipients
(Percent of Undergraduate Enrollment)
2005 2006 2007 2008 2009 2010 2011 2012 2013 2014
Resident 2,908 2,892 2,869 2,730 3,452 3,947 3,966 3,736 3,831 3,783
Non-resident 371 372 396 451 656 733 740 722 740 743
Total UG pell recipients enrolled 3,279 3,264 3,265 3,181 4,108 4,680 4,706 4,458 4,571 4,526
% of Resident Enrollment 17% 17% 17% 17% 21% 24% 24% 23% 24% 24%
% of Non-resident Enrollment 5% 5% 5% 5% 8% 9% 8% 8% 8% 8%
% of Total UG Enrollment 14% 13% 13% 13% 16% 19% 18% 18% 18% 18%
17% 17% 17% 17%
21%
24% 24% 23% 24% 24%
5% 5% 5% 5%
8% 9% 8% 8% 8% 8%
14% 13% 13% 13%
16%
19% 18% 18% 18% 18%
0%
5%
10%
15%
20%
25%
30%
2005 2006 2007 2008 2009 2010 2011 2012 2013 2014
Fall Semester
% of Resident Enrollment % of Non-resident Enrollment % of Total UG Enrollment
2014-15 Diversity Report. Available at: www.cu.edu/office-academic-affairs/diversity-reports 15
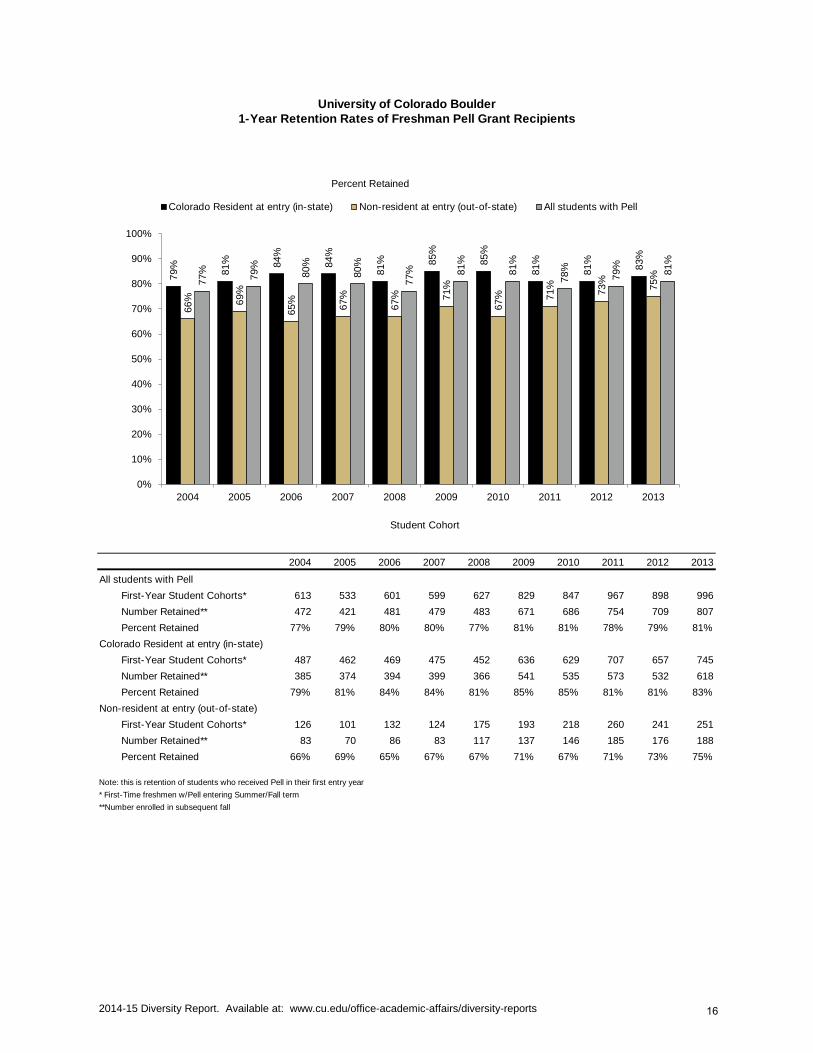
University of Colorado Boulder1-Year Retention Rates of Freshman Pell Grant Recipients
2004 2005 2006 2007 2008 2009 2010 2011 2012 2013
All students with Pell
First-Year Student Cohorts* 613 533 601 599 627 829 847 967 898 996
Number Retained** 472 421 481 479 483 671 686 754 709 807
Percent Retained 77% 79% 80% 80% 77% 81% 81% 78% 79% 81%
Colorado Resident at entry (in-state)
First-Year Student Cohorts* 487 462 469 475 452 636 629 707 657 745
Number Retained** 385 374 394 399 366 541 535 573 532 618
Percent Retained 79% 81% 84% 84% 81% 85% 85% 81% 81% 83%
Non-resident at entry (out-of-state)
First-Year Student Cohorts* 126 101 132 124 175 193 218 260 241 251
Number Retained** 83 70 86 83 117 137 146 185 176 188
Percent Retained 66% 69% 65% 67% 67% 71% 67% 71% 73% 75%
Note: this is retention of students who received Pell in their first entry year
* First-Time freshmen w/Pell entering Summer/Fall term
**Number enrolled in subsequent fall
79%
81%
84%
84%
81%
85%
85%
81%
81%
83%
66%
69%
65%
67%
67%
71%
67%
71%
73%
75%
77%
79%
80%
80%
77%
81%
81%
78%
79%
81%
0%
10%
20%
30%
40%
50%
60%
70%
80%
90%
100%
2004 2005 2006 2007 2008 2009 2010 2011 2012 2013
Student Cohort
Colorado Resident at entry (in-state) Non-resident at entry (out-of-state) All students with Pell
Percent Retained
2014-15 Diversity Report. Available at: www.cu.edu/office-academic-affairs/diversity-reports 16
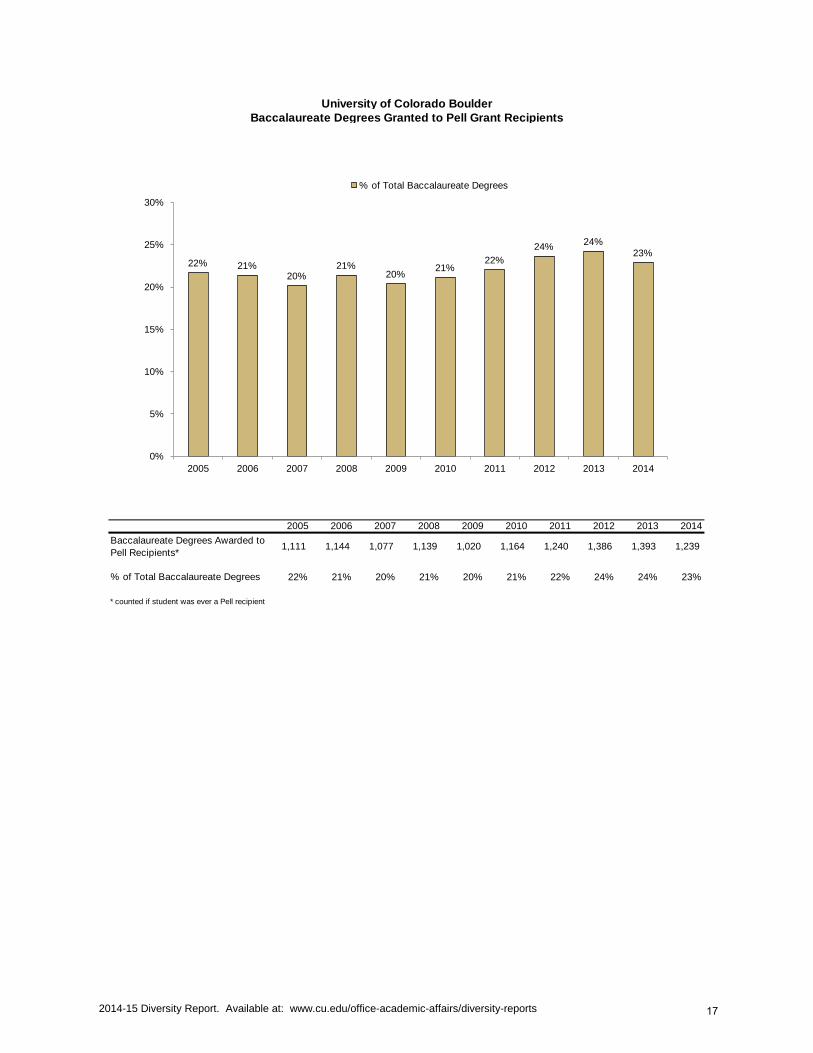
University of Colorado BoulderBaccalaureate Degrees Granted to Pell Grant Recipients
2005 2006 2007 2008 2009 2010 2011 2012 2013 2014
Baccalaureate Degrees Awarded to
Pell Recipients*1,111 1,144 1,077 1,139 1,020 1,164 1,240 1,386 1,393 1,239
% of Total Baccalaureate Degrees 22% 21% 20% 21% 20% 21% 22% 24% 24% 23%
* counted if student was ever a Pell recipient
22% 21% 20%
21% 20%
21% 22%
24% 24%
23%
0%
5%
10%
15%
20%
25%
30%
2005 2006 2007 2008 2009 2010 2011 2012 2013 2014
% of Total Baccalaureate Degrees
2014-15 Diversity Report. Available at: www.cu.edu/office-academic-affairs/diversity-reports 17
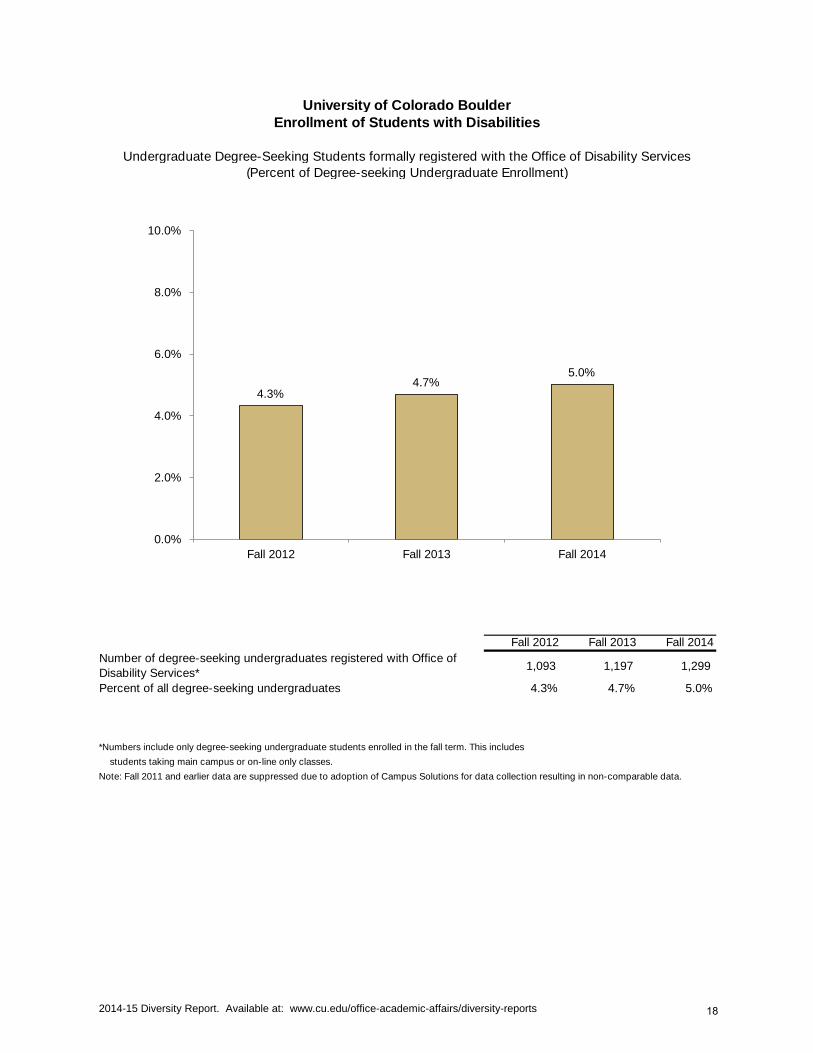
University of Colorado BoulderEnrollment of Students with Disabilities
Undergraduate Degree-Seeking Students formally registered with the Office of Disability Services(Percent of Degree-seeking Undergraduate Enrollment)
Fall 2012 Fall 2013 Fall 2014
1,093 1,197 1,299
Percent of all degree-seeking undergraduates 4.3% 4.7% 5.0%
*Numbers include only degree-seeking undergraduate students enrolled in the fall term. This includes
students taking main campus or on-line only classes.
Note: Fall 2011 and earlier data are suppressed due to adoption of Campus Solutions for data collection resulting in non-comparable data.
Number of degree-seeking undergraduates registered with Office of
Disability Services*
4.3% 4.7%
5.0%
0.0%
2.0%
4.0%
6.0%
8.0%
10.0%
Fall 2012 Fall 2013 Fall 2014
2014-15 Diversity Report. Available at: www.cu.edu/office-academic-affairs/diversity-reports 18
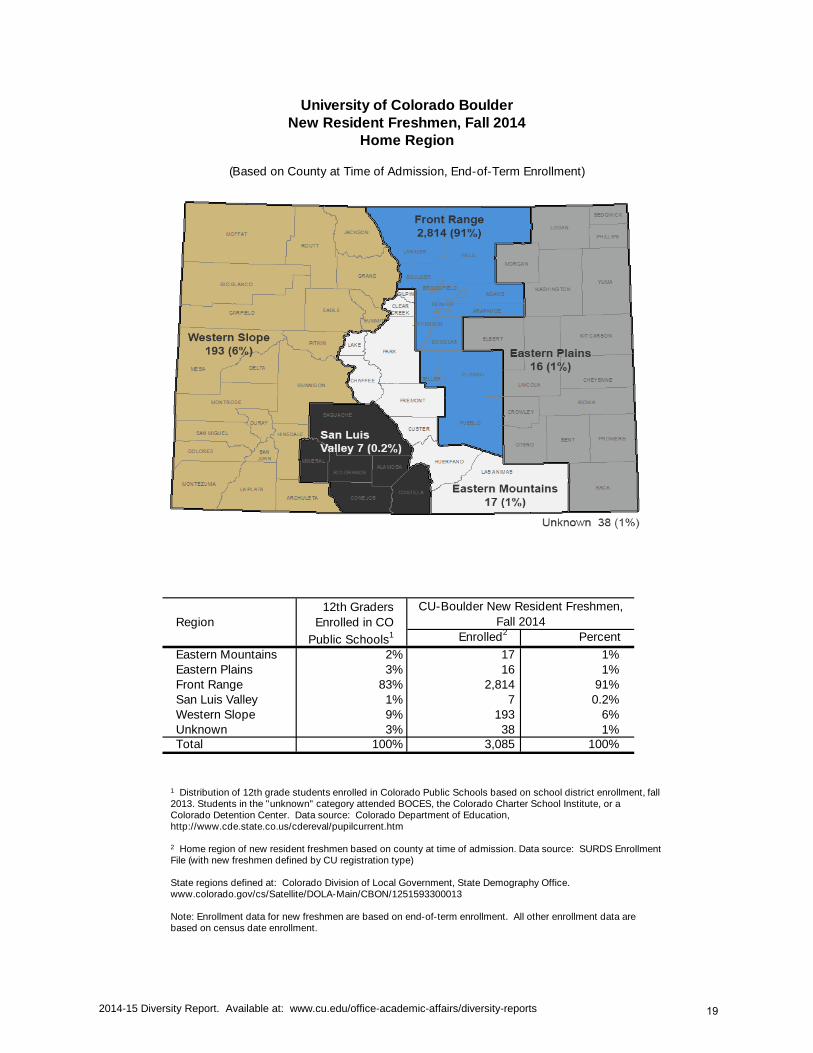
CU-Boulder New Resident Freshmen,
Fall 2014Enrolled2 Percent
Eastern Mountains 2% 17 1%Eastern Plains 3% 16 1%Front Range 83% 2,814 91%San Luis Valley 1% 7 0.2%Western Slope 9% 193 6%Unknown 3% 38 1%Total 100% 3,085 100%
Region12th Graders
Enrolled in CO
Public Schools1
University of Colorado BoulderNew Resident Freshmen, Fall 2014
Home Region
(Based on County at Time of Admission, End-of-Term Enrollment)
1 Distribution of 12th grade students enrolled in Colorado Public Schools based on school district enrollment, fall 2013. Students in the "unknown" category attended BOCES, the Colorado Charter School Institute, or a Colorado Detention Center. Data source: Colorado Department of Education, http://www.cde.state.co.us/cdereval/pupilcurrent.htm
2 Home region of new resident freshmen based on county at time of admission. Data source: SURDS Enrollment File (with new freshmen defined by CU registration type) State regions defined at: Colorado Division of Local Government, State Demography Office. www.colorado.gov/cs/Satellite/DOLA-Main/CBON/1251593300013 Note: Enrollment data for new freshmen are based on end-of-term enrollment. All other enrollment data are based on census date enrollment.
2014-15 Diversity Report. Available at: www.cu.edu/office-academic-affairs/diversity-reports 19
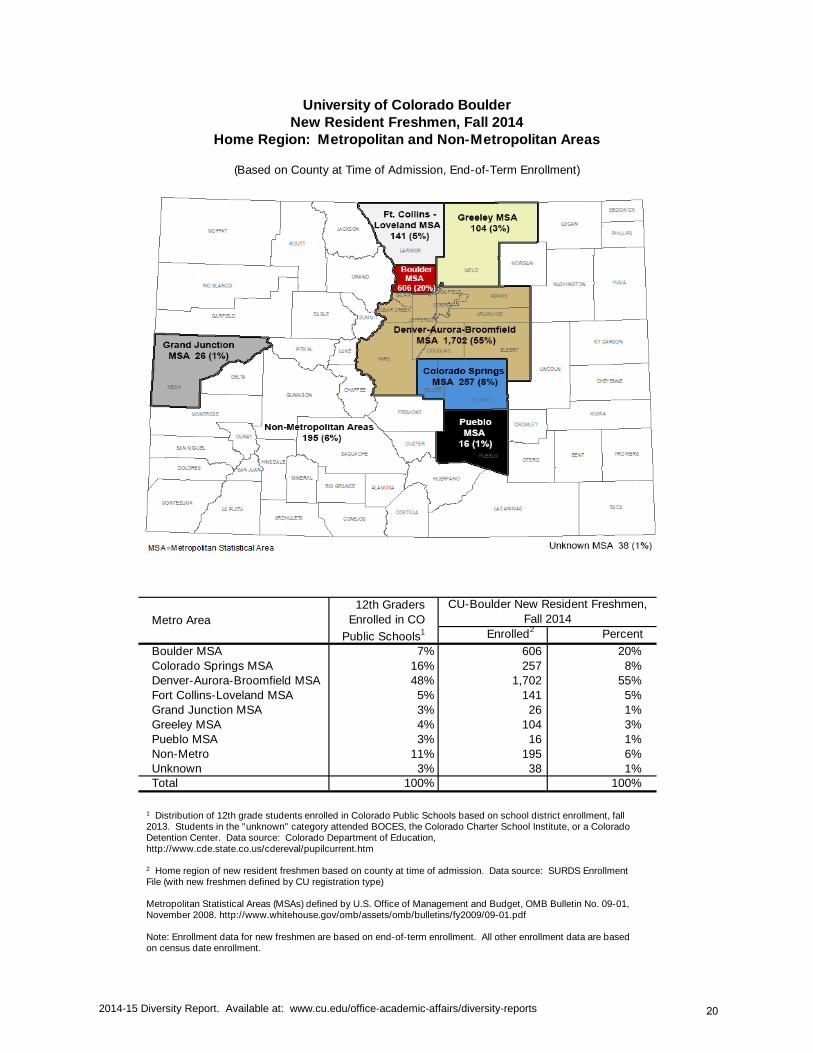
CU-Boulder New Resident Freshmen,
Fall 2014
Enrolled2 Percent
Boulder MSA 7% 606 20%Colorado Springs MSA 16% 257 8%Denver-Aurora-Broomfield MSA 48% 1,702 55%Fort Collins-Loveland MSA 5% 141 5%Grand Junction MSA 3% 26 1%Greeley MSA 4% 104 3%Pueblo MSA 3% 16 1%Non-Metro 11% 195 6%Unknown 3% 38 1%Total 100% 100%
Metro Area
12th Graders
Enrolled in CO
Public Schools1
University of Colorado Boulder
(Based on County at Time of Admission, End-of-Term Enrollment)
Home Region: Metropolitan and Non-Metropolitan AreasNew Resident Freshmen, Fall 2014
1 Distribution of 12th grade students enrolled in Colorado Public Schools based on school district enrollment, fall 2013. Students in the "unknown" category attended BOCES, the Colorado Charter School Institute, or a Colorado Detention Center. Data source: Colorado Department of Education, http://www.cde.state.co.us/cdereval/pupilcurrent.htm 2 Home region of new resident freshmen based on county at time of admission. Data source: SURDS Enrollment File (with new freshmen defined by CU registration type) Metropolitan Statistical Areas (MSAs) defined by U.S. Office of Management and Budget, OMB Bulletin No. 09-01, November 2008. http://www.whitehouse.gov/omb/assets/omb/bulletins/fy2009/09-01.pdf Note: Enrollment data for new freshmen are based on end-of-term enrollment. All other enrollment data are based on census date enrollment.
2014-15 Diversity Report. Available at: www.cu.edu/office-academic-affairs/diversity-reports 20
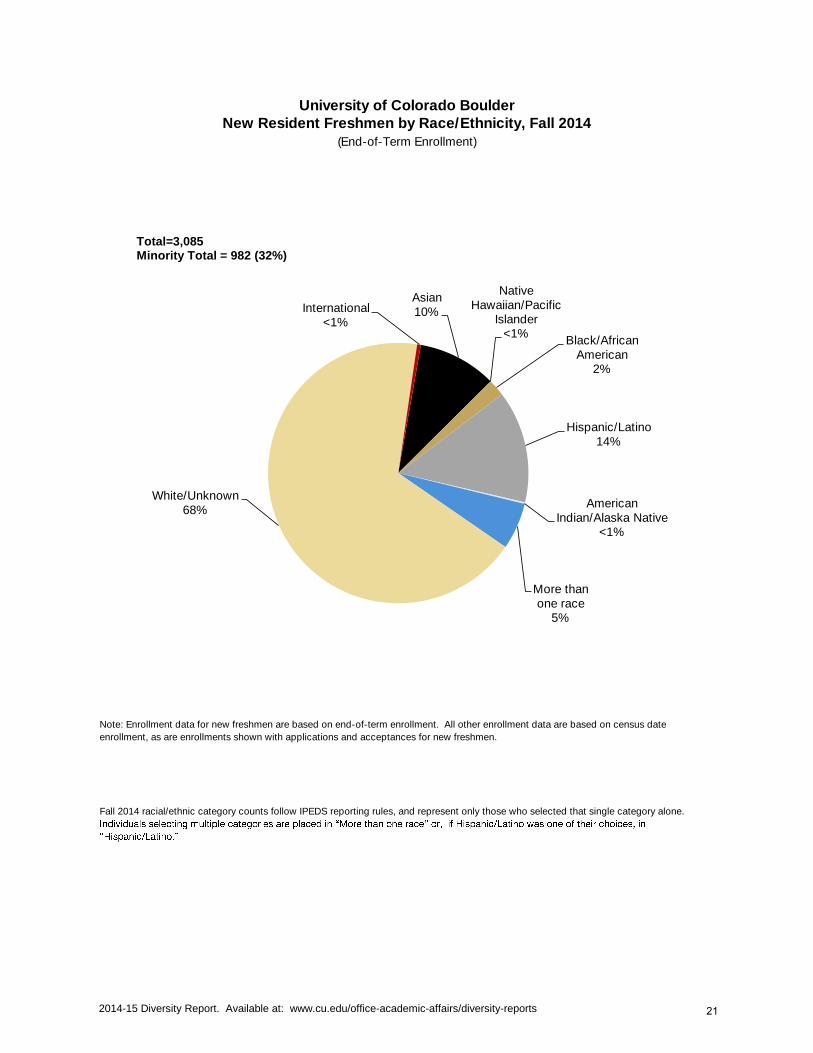
University of Colorado BoulderNew Resident Freshmen by Race/Ethnicity, Fall 2014
(End-of-Term Enrollment)
Note: Enrollment data for new freshmen are based on end-of-term enrollment. All other enrollment data are based on census date
enrollment, as are enrollments shown with applications and acceptances for new freshmen.
Fall 2014 racial/ethnic category counts follow IPEDS reporting rules, and represent only those who selected that single category alone.
Asian 10%
Native Hawaiian/Pacific
Islander <1%
Black/African American
2%
Hispanic/Latino 14%
American Indian/Alaska Native
<1%
More than one race
5%
White/Unknown 68%
International <1%
Total=3,085 Minority Total = 982 (32%)
2014-15 Diversity Report. Available at: www.cu.edu/office-academic-affairs/diversity-reports 21
University of Colorado BoulderFaculty and Staff Diversity
Data provided by the CU-Boulder Office of Planning, Budget, and Analysiswww.colorado.edu/pba/ia/
22
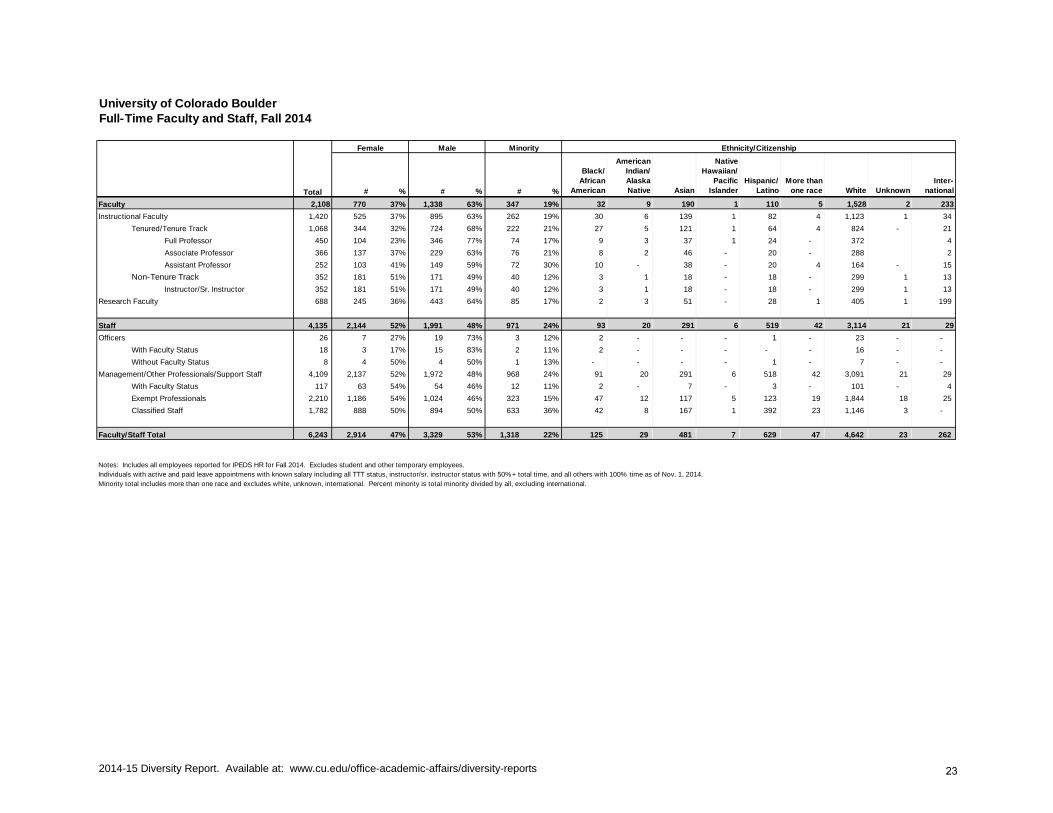
University of Colorado BoulderFull-Time Faculty and Staff, Fall 2014
Ethnicity/Citizenship
# % # % # %
Black/
African
American
American
Indian/
Alaska
Native Asian
Native
Hawaiian/
Pacific
Islander
Hispanic/
Latino
More than
one race White Unknown
Inter-
national
Faculty 2,108 770 37% 1,338 63% 347 19% 32 9 190 1 110 5 1,528 2 233
Instructional Faculty 1,420 525 37% 895 63% 262 19% 30 6 139 1 82 4 1,123 1 34
Tenured/Tenure Track 1,068 344 32% 724 68% 222 21% 27 5 121 1 64 4 824 - 21
Full Professor 450 104 23% 346 77% 74 17% 9 3 37 1 24 - 372 4
Associate Professor 366 137 37% 229 63% 76 21% 8 2 46 - 20 - 288 2
Assistant Professor 252 103 41% 149 59% 72 30% 10 - 38 - 20 4 164 - 15
Non-Tenure Track 352 181 51% 171 49% 40 12% 3 1 18 - 18 - 299 1 13
Instructor/Sr. Instructor 352 181 51% 171 49% 40 12% 3 1 18 - 18 - 299 1 13
Research Faculty 688 245 36% 443 64% 85 17% 2 3 51 - 28 1 405 1 199
Staff 4,135 2,144 52% 1,991 48% 971 24% 93 20 291 6 519 42 3,114 21 29
Officers 26 7 27% 19 73% 3 12% 2 - - - 1 - 23 - -
With Faculty Status 18 3 17% 15 83% 2 11% 2 - - - - - 16 - -
Without Faculty Status 8 4 50% 4 50% 1 13% - - - - 1 - 7 - -
Management/Other Professionals/Support Staff 4,109 2,137 52% 1,972 48% 968 24% 91 20 291 6 518 42 3,091 21 29
With Faculty Status 117 63 54% 54 46% 12 11% 2 - 7 - 3 - 101 - 4
Exempt Professionals 2,210 1,186 54% 1,024 46% 323 15% 47 12 117 5 123 19 1,844 18 25
Classified Staff 1,782 888 50% 894 50% 633 36% 42 8 167 1 392 23 1,146 3 -
Faculty/Staff Total 6,243 2,914 47% 3,329 53% 1,318 22% 125 29 481 7 629 47 4,642 23 262
Notes: Includes all employees reported for IPEDS HR for Fall 2014. Excludes student and other temporary employees.
Individuals with active and paid leave appointmens with known salary including all TTT status, instructor/sr. instructor status with 50%+ total time, and all others with 100% time as of Nov. 1, 2014.
Minority total includes more than one race and excludes white, unknown, international. Percent minority is total minority divided by all, excluding international.
Total
Female Male Minority
2014-15 Diversity Report. Available at: www.cu.edu/office-academic-affairs/diversity-reports 23
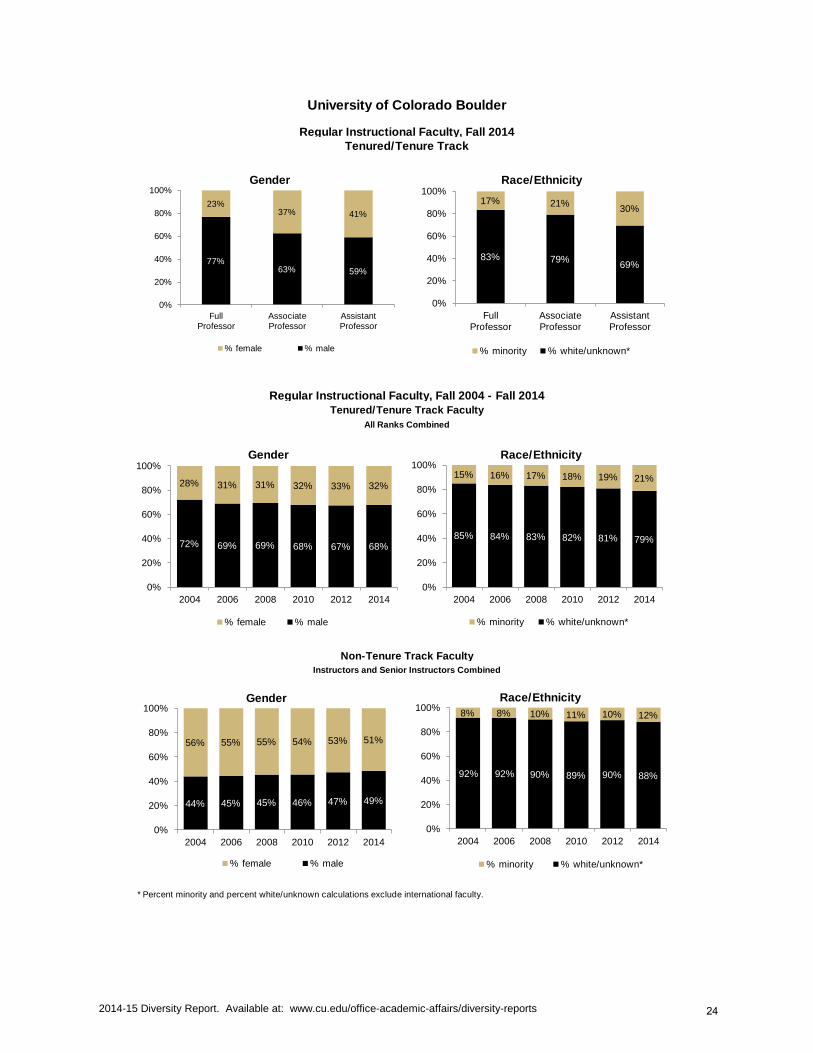
University of Colorado Boulder
Regular Instructional Faculty, Fall 2014Tenured/Tenure Track
Regular Instructional Faculty, Fall 2004 - Fall 2014Tenured/Tenure Track Faculty
All Ranks Combined
Non-Tenure Track Faculty
Instructors and Senior Instructors Combined
* Percent minority and percent white/unknown calculations exclude international faculty.
72% 69% 69% 68% 67% 68%
28% 31% 31% 32% 33% 32%
0%
20%
40%
60%
80%
100%
2004 2006 2008 2010 2012 2014
Gender
% female % male
85% 84% 83% 82% 81% 79%
15% 16% 17% 18% 19% 21%
0%
20%
40%
60%
80%
100%
2004 2006 2008 2010 2012 2014
Race/Ethnicity
% minority % white/unknown*
44% 45% 45% 46% 47% 49%
56% 55% 55% 54% 53% 51%
0%
20%
40%
60%
80%
100%
2004 2006 2008 2010 2012 2014
Gender
% female % male
92% 92% 90% 89% 90% 88%
8% 8% 10% 11% 10% 12%
0%
20%
40%
60%
80%
100%
2004 2006 2008 2010 2012 2014
Race/Ethnicity
% minority % white/unknown*
77% 63% 59%
23% 37% 41%
0%
20%
40%
60%
80%
100%
FullProfessor
AssociateProfessor
AssistantProfessor
Gender
% female % male
83% 79% 69%
17% 21% 30%
0%
20%
40%
60%
80%
100%
FullProfessor
AssociateProfessor
AssistantProfessor
Race/Ethnicity
% minority % white/unknown*
2014-15 Diversity Report. Available at: www.cu.edu/office-academic-affairs/diversity-reports 24
University of Colorado Boulder
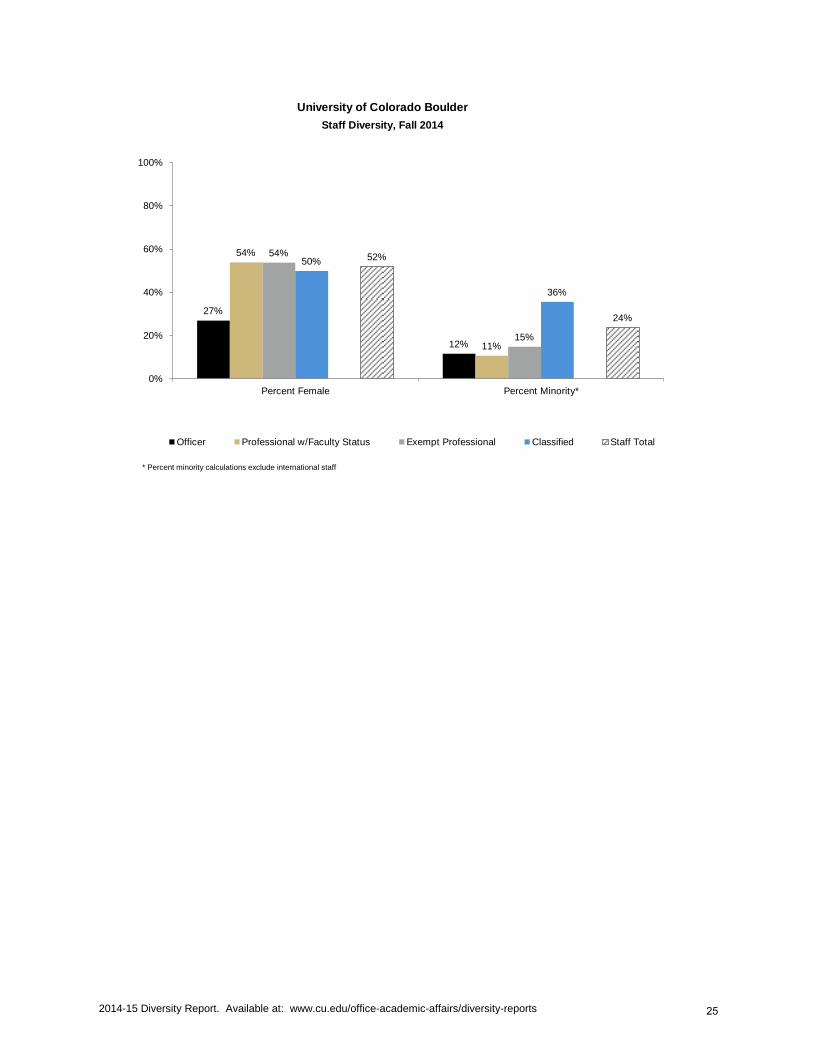
Staff Diversity, Fall 2014
27%
12%
54%
11%
54%
15%
50%
36%
52%
24%
0%
20%
40%
60%
80%
100%
Percent Female Percent Minority*
Officer Professional w/Faculty Status Exempt Professional Classified Staff Total
* Percent minority calculations exclude international staff
2014-15 Diversity Report. Available at: www.cu.edu/office-academic-affairs/diversity-reports 25
26
27

28
29
30
31
32
University of Colorado Colorado SpringsStudent Diversity
Data provided by the UCCS Office of Institutional Researchhttp://www.uccs.edu/~ir/
33
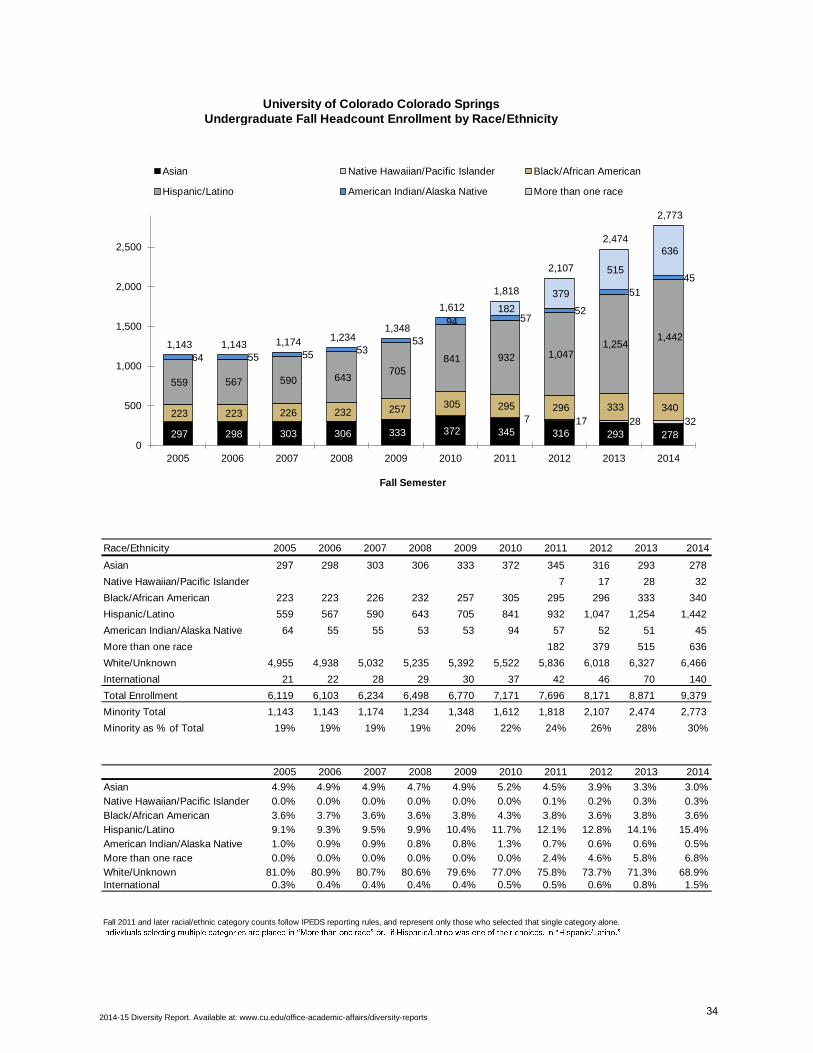
University of Colorado Colorado SpringsUndergraduate Fall Headcount Enrollment by Race/Ethnicity
Race/Ethnicity 2005 2006 2007 2008 2009 2010 2011 2012 2013 2014
Asian 297 298 303 306 333 372 345 316 293 278
Native Hawaiian/Pacific Islander 7 17 28 32
Black/African American 223 223 226 232 257 305 295 296 333 340
Hispanic/Latino 559 567 590 643 705 841 932 1,047 1,254 1,442
American Indian/Alaska Native 64 55 55 53 53 94 57 52 51 45
More than one race 182 379 515 636
White/Unknown 4,955 4,938 5,032 5,235 5,392 5,522 5,836 6,018 6,327 6,466
International 21 22 28 29 30 37 42 46 70 140
Total Enrollment 6,119 6,103 6,234 6,498 6,770 7,171 7,696 8,171 8,871 9,379
Minority Total 1,143 1,143 1,174 1,234 1,348 1,612 1,818 2,107 2,474 2,773
Minority as % of Total 19% 19% 19% 19% 20% 22% 24% 26% 28% 30%
2005 2006 2007 2008 2009 2010 2011 2012 2013 2014
Asian 4.9% 4.9% 4.9% 4.7% 4.9% 5.2% 4.5% 3.9% 3.3% 3.0%
Native Hawaiian/Pacific Islander 0.0% 0.0% 0.0% 0.0% 0.0% 0.0% 0.1% 0.2% 0.3% 0.3%
Black/African American 3.6% 3.7% 3.6% 3.6% 3.8% 4.3% 3.8% 3.6% 3.8% 3.6%
Hispanic/Latino 9.1% 9.3% 9.5% 9.9% 10.4% 11.7% 12.1% 12.8% 14.1% 15.4%
American Indian/Alaska Native 1.0% 0.9% 0.9% 0.8% 0.8% 1.3% 0.7% 0.6% 0.6% 0.5%
More than one race 0.0% 0.0% 0.0% 0.0% 0.0% 0.0% 2.4% 4.6% 5.8% 6.8%
White/Unknown 81.0% 80.9% 80.7% 80.6% 79.6% 77.0% 75.8% 73.7% 71.3% 68.9%International 0.3% 0.4% 0.4% 0.4% 0.4% 0.5% 0.5% 0.6% 0.8% 1.5%
Fall 2011 and later racial/ethnic category counts follow IPEDS reporting rules, and represent only those who selected that single category alone.
297 298 303 306 333 372 345 316 293 278
7 17 28 32 223 223 226 232 257 305 295 296 333 340
559 567 590 643 705
841 932 1,047 1,254
1,442
64 55 55 53 53
94 57 52
51
45
182
379
515
636
1,143 1,143 1,174 1,234 1,348
1,612
1,818
2,107
2,474
2,773
0
500
1,000
1,500
2,000
2,500
2005 2006 2007 2008 2009 2010 2011 2012 2013 2014
Fall Semester
Asian Native Hawaiian/Pacific Islander Black/African American
Hispanic/Latino American Indian/Alaska Native More than one race
2014-15 Diversity Report. Available at: www.cu.edu/office-academic-affairs/diversity-reports34
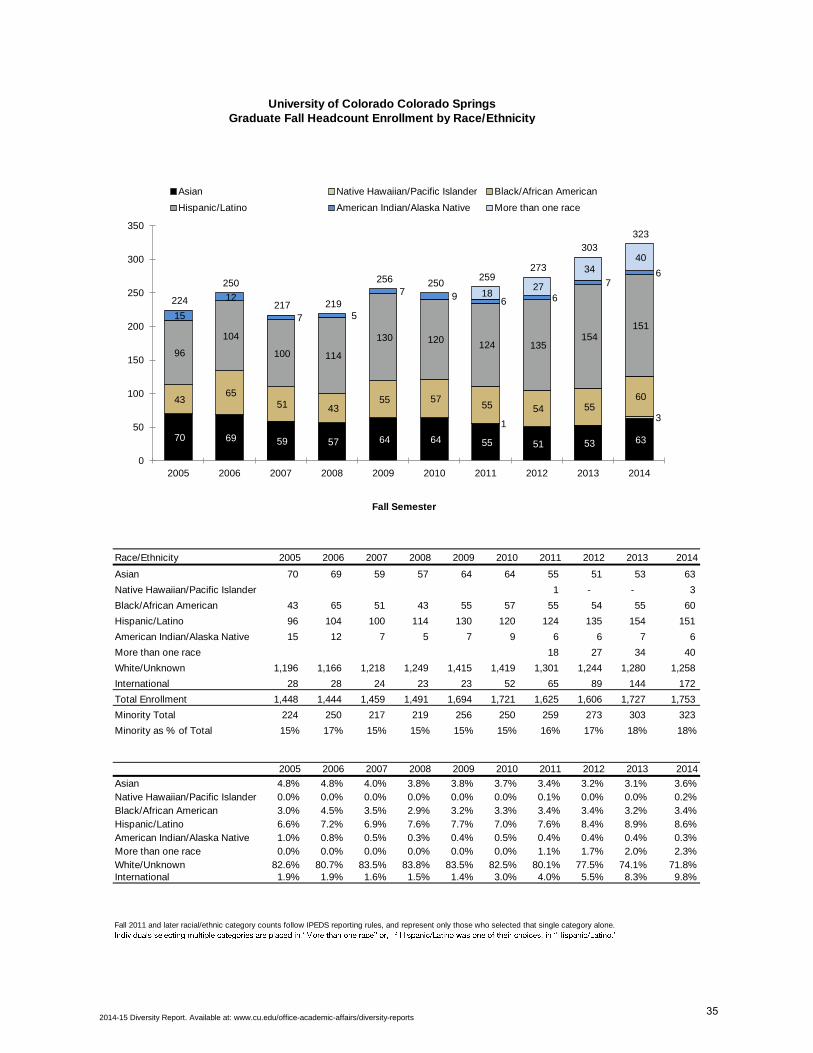
University of Colorado Colorado SpringsGraduate Fall Headcount Enrollment by Race/Ethnicity
Race/Ethnicity 2005 2006 2007 2008 2009 2010 2011 2012 2013 2014
Asian 70 69 59 57 64 64 55 51 53 63
Native Hawaiian/Pacific Islander 1 - - 3
Black/African American 43 65 51 43 55 57 55 54 55 60
Hispanic/Latino 96 104 100 114 130 120 124 135 154 151
American Indian/Alaska Native 15 12 7 5 7 9 6 6 7 6
More than one race 18 27 34 40
White/Unknown 1,196 1,166 1,218 1,249 1,415 1,419 1,301 1,244 1,280 1,258
International 28 28 24 23 23 52 65 89 144 172
Total Enrollment 1,448 1,444 1,459 1,491 1,694 1,721 1,625 1,606 1,727 1,753
Minority Total 224 250 217 219 256 250 259 273 303 323
Minority as % of Total 15% 17% 15% 15% 15% 15% 16% 17% 18% 18%
2005 2006 2007 2008 2009 2010 2011 2012 2013 2014
Asian 4.8% 4.8% 4.0% 3.8% 3.8% 3.7% 3.4% 3.2% 3.1% 3.6%
Native Hawaiian/Pacific Islander 0.0% 0.0% 0.0% 0.0% 0.0% 0.0% 0.1% 0.0% 0.0% 0.2%
Black/African American 3.0% 4.5% 3.5% 2.9% 3.2% 3.3% 3.4% 3.4% 3.2% 3.4%
Hispanic/Latino 6.6% 7.2% 6.9% 7.6% 7.7% 7.0% 7.6% 8.4% 8.9% 8.6%
American Indian/Alaska Native 1.0% 0.8% 0.5% 0.3% 0.4% 0.5% 0.4% 0.4% 0.4% 0.3%
More than one race 0.0% 0.0% 0.0% 0.0% 0.0% 0.0% 1.1% 1.7% 2.0% 2.3%
White/Unknown 82.6% 80.7% 83.5% 83.8% 83.5% 82.5% 80.1% 77.5% 74.1% 71.8%International 1.9% 1.9% 1.6% 1.5% 1.4% 3.0% 4.0% 5.5% 8.3% 9.8%
Fall 2011 and later racial/ethnic category counts follow IPEDS reporting rules, and represent only those who selected that single category alone.
70 69 59 57 64 64 55 51 53 63
1 - - 3
43 65
51 43 55 57
55 54 55 60
96
104
100 114
130 120 124 135
154 151
15
12
7 5
7 9 6 6
7 6
18 27
34 40
224
250
217 219
256 250 259
273
303
323
0
50
100
150
200
250
300
350
2005 2006 2007 2008 2009 2010 2011 2012 2013 2014
Fall Semester
Asian Native Hawaiian/Pacific Islander Black/African American
Hispanic/Latino American Indian/Alaska Native More than one race
2014-15 Diversity Report. Available at: www.cu.edu/office-academic-affairs/diversity-reports35
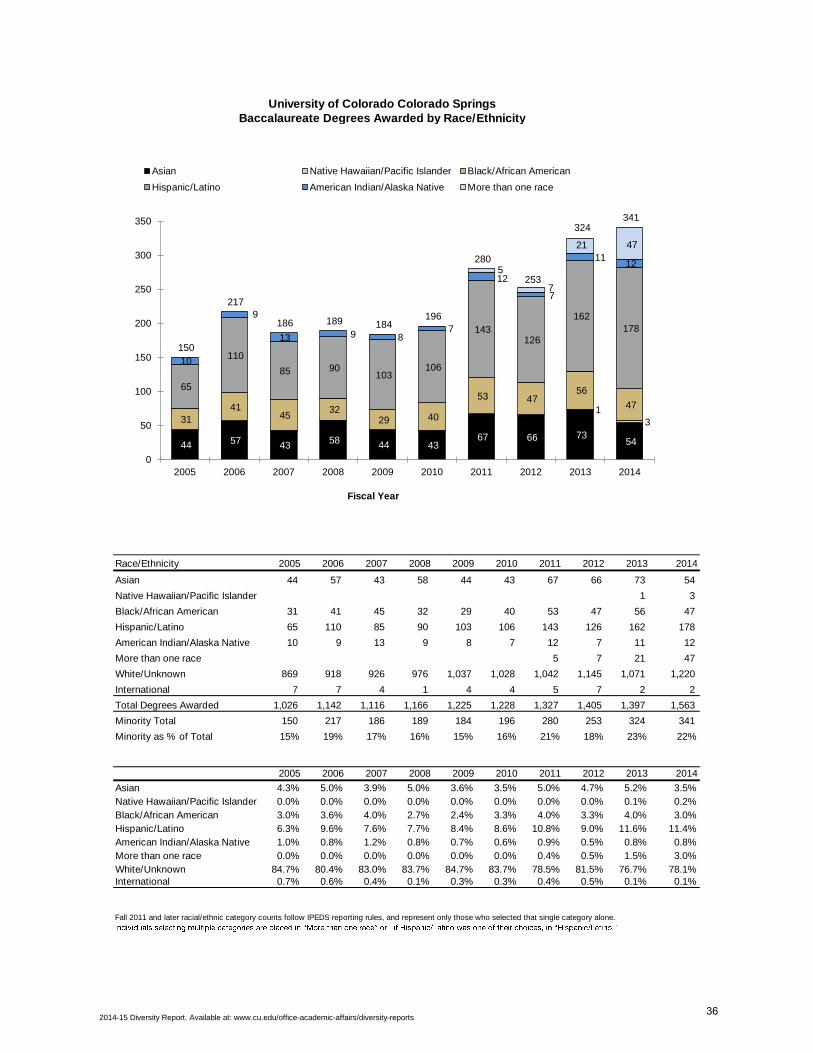
University of Colorado Colorado SpringsBaccalaureate Degrees Awarded by Race/Ethnicity
Race/Ethnicity 2005 2006 2007 2008 2009 2010 2011 2012 2013 2014
Asian 44 57 43 58 44 43 67 66 73 54
Native Hawaiian/Pacific Islander 1 3
Black/African American 31 41 45 32 29 40 53 47 56 47
Hispanic/Latino 65 110 85 90 103 106 143 126 162 178
American Indian/Alaska Native 10 9 13 9 8 7 12 7 11 12
More than one race 5 7 21 47
White/Unknown 869 918 926 976 1,037 1,028 1,042 1,145 1,071 1,220
International 7 7 4 1 4 4 5 7 2 2
Total Degrees Awarded 1,026 1,142 1,116 1,166 1,225 1,228 1,327 1,405 1,397 1,563
Minority Total 150 217 186 189 184 196 280 253 324 341
Minority as % of Total 15% 19% 17% 16% 15% 16% 21% 18% 23% 22%
2005 2006 2007 2008 2009 2010 2011 2012 2013 2014
Asian 4.3% 5.0% 3.9% 5.0% 3.6% 3.5% 5.0% 4.7% 5.2% 3.5%
Native Hawaiian/Pacific Islander 0.0% 0.0% 0.0% 0.0% 0.0% 0.0% 0.0% 0.0% 0.1% 0.2%
Black/African American 3.0% 3.6% 4.0% 2.7% 2.4% 3.3% 4.0% 3.3% 4.0% 3.0%
Hispanic/Latino 6.3% 9.6% 7.6% 7.7% 8.4% 8.6% 10.8% 9.0% 11.6% 11.4%
American Indian/Alaska Native 1.0% 0.8% 1.2% 0.8% 0.7% 0.6% 0.9% 0.5% 0.8% 0.8%
More than one race 0.0% 0.0% 0.0% 0.0% 0.0% 0.0% 0.4% 0.5% 1.5% 3.0%
White/Unknown 84.7% 80.4% 83.0% 83.7% 84.7% 83.7% 78.5% 81.5% 76.7% 78.1%International 0.7% 0.6% 0.4% 0.1% 0.3% 0.3% 0.4% 0.5% 0.1% 0.1%
Fall 2011 and later racial/ethnic category counts follow IPEDS reporting rules, and represent only those who selected that single category alone.
44 57 43 58 44 43
67 66 73 54
1
3 31
41 45
32 29 40
53 47 56
47
65
110
85 90 103
106
143 126
162
178
10
9
13 9 8 7
12
7
11 12
5
7
21 47
150
217
186 189 184 196
280
253
324 341
0
50
100
150
200
250
300
350
2005 2006 2007 2008 2009 2010 2011 2012 2013 2014
Fiscal Year
Asian Native Hawaiian/Pacific Islander Black/African American
Hispanic/Latino American Indian/Alaska Native More than one race
2014-15 Diversity Report. Available at: www.cu.edu/office-academic-affairs/diversity-reports36
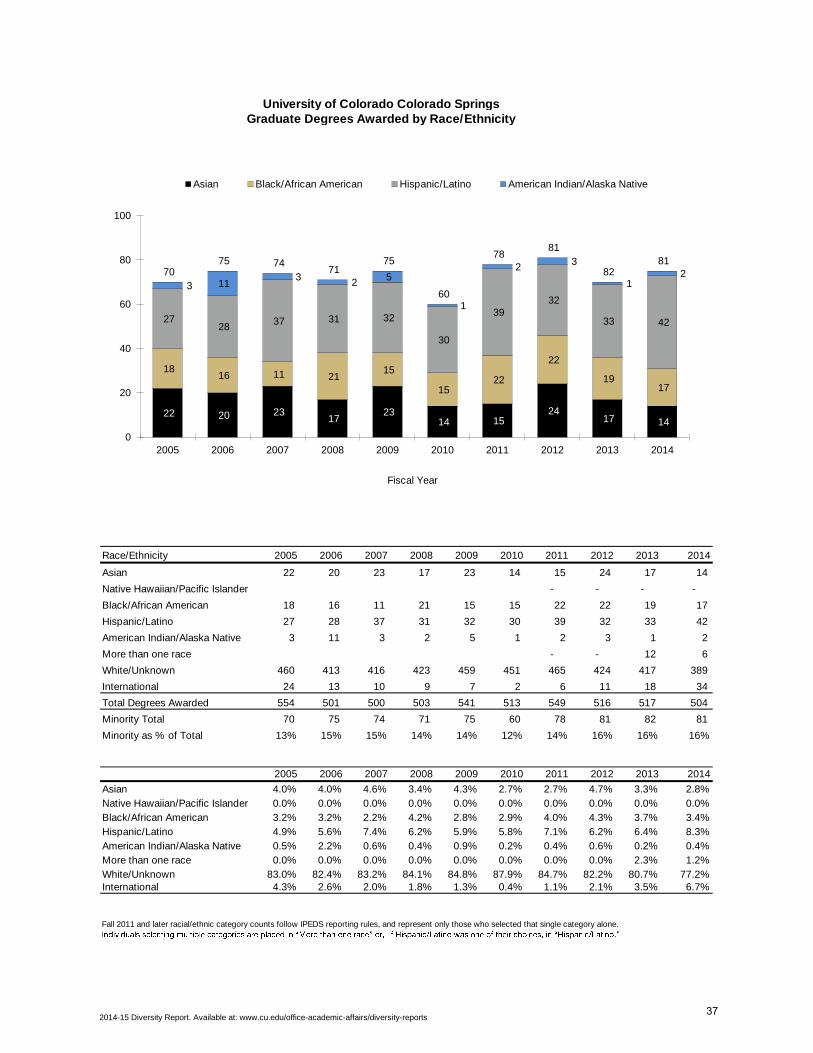
University of Colorado Colorado SpringsGraduate Degrees Awarded by Race/Ethnicity
Race/Ethnicity 2005 2006 2007 2008 2009 2010 2011 2012 2013 2014
Asian 22 20 23 17 23 14 15 24 17 14
Native Hawaiian/Pacific Islander - - - -
Black/African American 18 16 11 21 15 15 22 22 19 17
Hispanic/Latino 27 28 37 31 32 30 39 32 33 42
American Indian/Alaska Native 3 11 3 2 5 1 2 3 1 2
More than one race - - 12 6
White/Unknown 460 413 416 423 459 451 465 424 417 389
International 24 13 10 9 7 2 6 11 18 34
Total Degrees Awarded 554 501 500 503 541 513 549 516 517 504
Minority Total 70 75 74 71 75 60 78 81 82 81
Minority as % of Total 13% 15% 15% 14% 14% 12% 14% 16% 16% 16%
2005 2006 2007 2008 2009 2010 2011 2012 2013 2014
Asian 4.0% 4.0% 4.6% 3.4% 4.3% 2.7% 2.7% 4.7% 3.3% 2.8%
Native Hawaiian/Pacific Islander 0.0% 0.0% 0.0% 0.0% 0.0% 0.0% 0.0% 0.0% 0.0% 0.0%
Black/African American 3.2% 3.2% 2.2% 4.2% 2.8% 2.9% 4.0% 4.3% 3.7% 3.4%
Hispanic/Latino 4.9% 5.6% 7.4% 6.2% 5.9% 5.8% 7.1% 6.2% 6.4% 8.3%
American Indian/Alaska Native 0.5% 2.2% 0.6% 0.4% 0.9% 0.2% 0.4% 0.6% 0.2% 0.4%
More than one race 0.0% 0.0% 0.0% 0.0% 0.0% 0.0% 0.0% 0.0% 2.3% 1.2%
White/Unknown 83.0% 82.4% 83.2% 84.1% 84.8% 87.9% 84.7% 82.2% 80.7% 77.2%International 4.3% 2.6% 2.0% 1.8% 1.3% 0.4% 1.1% 2.1% 3.5% 6.7%
Fall 2011 and later racial/ethnic category counts follow IPEDS reporting rules, and represent only those who selected that single category alone.
22 20 23 17
23 14 15
24 17 14
18 16 11 21
15
15 22
22
19 17
27 28
37 31 32
30
39 32
33 42
3 11 3
2 5
1
2 3
1 2 70
75 74 71
75
60
78 81
82 81
0
20
40
60
80
100
2005 2006 2007 2008 2009 2010 2011 2012 2013 2014
Fiscal Year
Asian Black/African American Hispanic/Latino American Indian/Alaska Native
2014-15 Diversity Report. Available at: www.cu.edu/office-academic-affairs/diversity-reports37
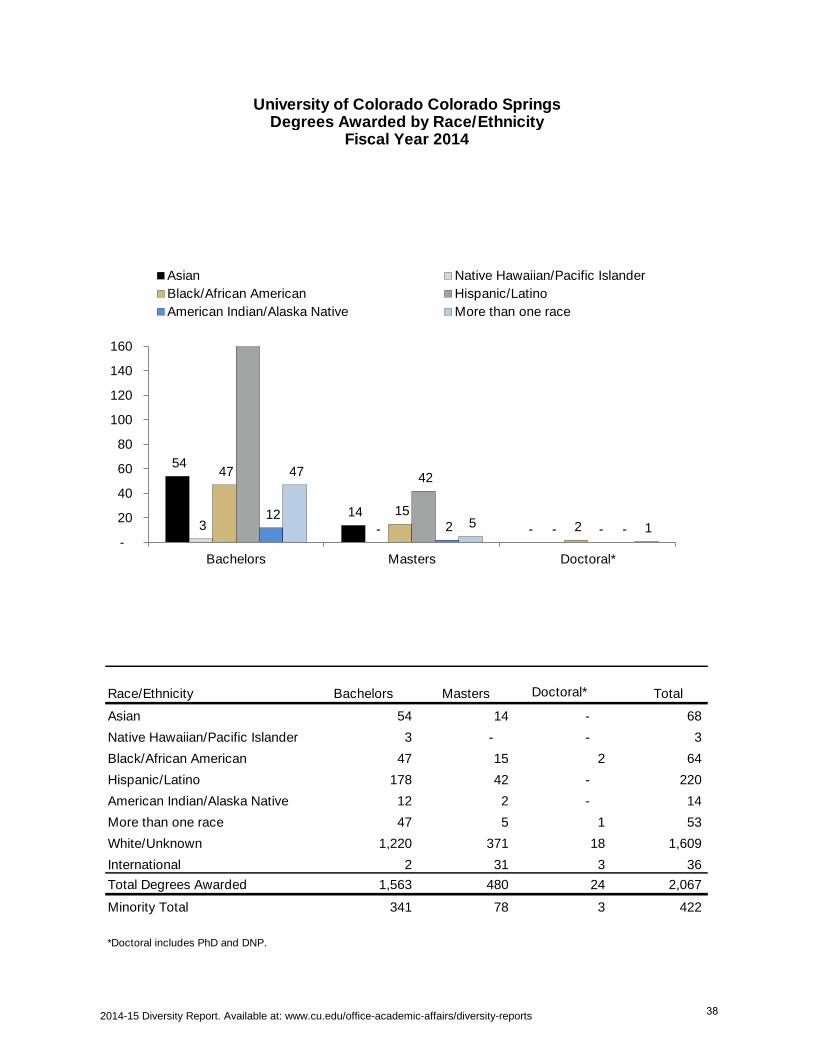
University of Colorado Colorado SpringsDegrees Awarded by Race/Ethnicity
Fiscal Year 2014
Race/Ethnicity Bachelors Masters Doctoral* Total
Asian 54 14 - 68
Native Hawaiian/Pacific Islander 3 - - 3
Black/African American 47 15 2 64
Hispanic/Latino 178 42 - 220
American Indian/Alaska Native 12 2 - 14
More than one race 47 5 1 53
White/Unknown 1,220 371 18 1,609
International 2 31 3 36
Total Degrees Awarded 1,563 480 24 2,067
Minority Total 341 78 3 422
*Doctoral includes PhD and DNP.
54
14
- 3 - -
47
15 2
42
- 12
2 -
47
5 1 -
20
40
60
80
100
120
140
160
Bachelors Masters Doctoral*
Asian Native Hawaiian/Pacific Islander
Black/African American Hispanic/Latino
American Indian/Alaska Native More than one race
2014-15 Diversity Report. Available at: www.cu.edu/office-academic-affairs/diversity-reports 38
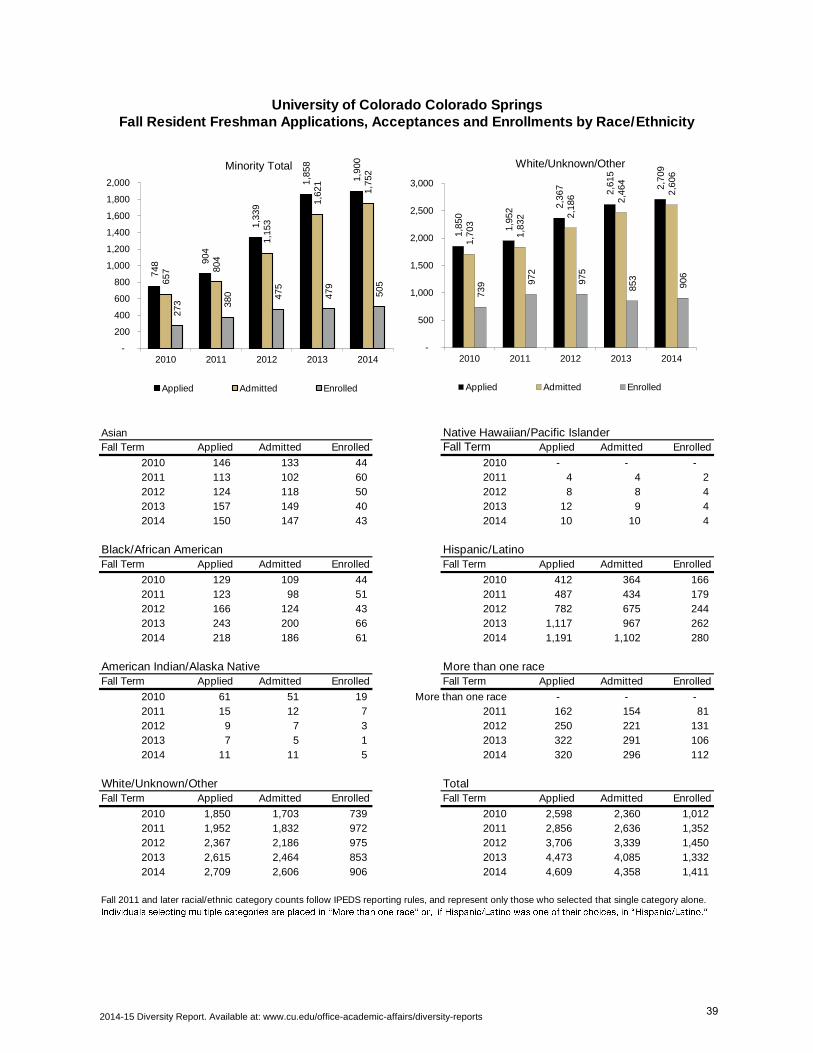
Asian Native Hawaiian/Pacific IslanderFall Term Applied Admitted Enrolled Fall Term Applied Admitted Enrolled
2010 146 133 44 2010 - - -
2011 113 102 60 2011 4 4 2
2012 124 118 50 2012 8 8 4
2013 157 149 40 2013 12 9 4
2014 150 147 43 2014 10 10 4
Black/African American Hispanic/LatinoFall Term Applied Admitted Enrolled Fall Term Applied Admitted Enrolled
2010 129 109 44 2010 412 364 166
2011 123 98 51 2011 487 434 179
2012 166 124 43 2012 782 675 244
2013 243 200 66 2013 1,117 967 262
2014 218 186 61 2014 1,191 1,102 280
American Indian/Alaska Native More than one raceFall Term Applied Admitted Enrolled Fall Term Applied Admitted Enrolled
2010 61 51 19 More than one race - - -
2011 15 12 7 2011 162 154 81
2012 9 7 3 2012 250 221 131
2013 7 5 1 2013 322 291 106
2014 11 11 5 2014 320 296 112
White/Unknown/Other TotalFall Term Applied Admitted Enrolled Fall Term Applied Admitted Enrolled
2010 1,850 1,703 739 2010 2,598 2,360 1,012
2011 1,952 1,832 972 2011 2,856 2,636 1,352
2012 2,367 2,186 975 2012 3,706 3,339 1,450
2013 2,615 2,464 853 2013 4,473 4,085 1,332
2014 2,709 2,606 906 2014 4,609 4,358 1,411
Fall 2011 and later racial/ethnic category counts follow IPEDS reporting rules, and represent only those who selected that single category alone.
University of Colorado Colorado SpringsFall Resident Freshman Applications, Acceptances and Enrollments by Race/Ethnicity
748
904
1,3
39
1,8
58
1,9
00
657
804
1,1
53
1,6
21
1,7
52
273
380
475
479
505
-
200
400
600
800
1,000
1,200
1,400
1,600
1,800
2,000
2010 2011 2012 2013 2014
Minority Total
Applied Admitted Enrolled
1,8
50
1,9
52 2,3
67
2,6
15
2,7
09
1,7
03
1,8
32
2,1
86
2,4
64
2,6
06
739
972
975
853
906
-
500
1,000
1,500
2,000
2,500
3,000
2010 2011 2012 2013 2014
White/Unknown/Other
Applied Admitted Enrolled
2014-15 Diversity Report. Available at: www.cu.edu/office-academic-affairs/diversity-reports39
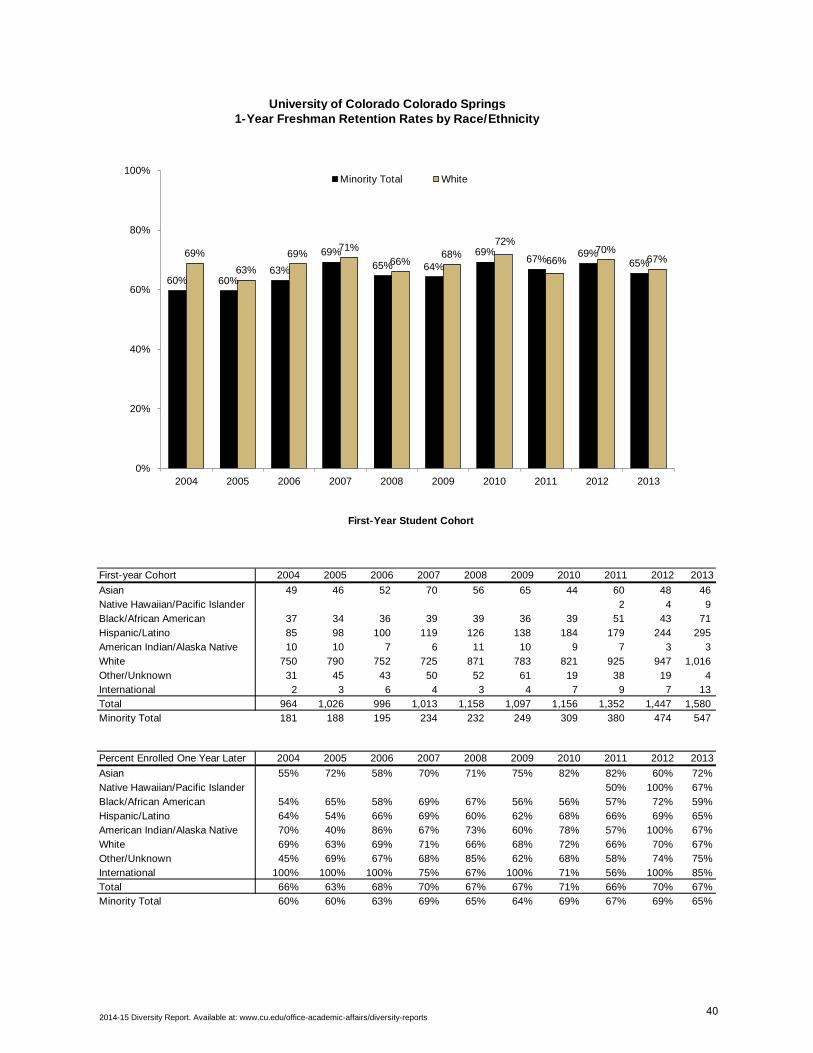
University of Colorado Colorado Springs1-Year Freshman Retention Rates by Race/Ethnicity
First-year Cohort 2004 2005 2006 2007 2008 2009 2010 2011 2012 2013
Asian 49 46 52 70 56 65 44 60 48 46
Native Hawaiian/Pacific Islander 2 4 9
Black/African American 37 34 36 39 39 36 39 51 43 71
Hispanic/Latino 85 98 100 119 126 138 184 179 244 295
American Indian/Alaska Native 10 10 7 6 11 10 9 7 3 3
White 750 790 752 725 871 783 821 925 947 1,016
Other/Unknown 31 45 43 50 52 61 19 38 19 4
International 2 3 6 4 3 4 7 9 7 13
Total 964 1,026 996 1,013 1,158 1,097 1,156 1,352 1,447 1,580
Minority Total 181 188 195 234 232 249 309 380 474 547
Percent Enrolled One Year Later 2004 2005 2006 2007 2008 2009 2010 2011 2012 2013
Asian 55% 72% 58% 70% 71% 75% 82% 82% 60% 72%
Native Hawaiian/Pacific Islander 50% 100% 67%
Black/African American 54% 65% 58% 69% 67% 56% 56% 57% 72% 59%
Hispanic/Latino 64% 54% 66% 69% 60% 62% 68% 66% 69% 65%
American Indian/Alaska Native 70% 40% 86% 67% 73% 60% 78% 57% 100% 67%
White 69% 63% 69% 71% 66% 68% 72% 66% 70% 67%
Other/Unknown 45% 69% 67% 68% 85% 62% 68% 58% 74% 75%
International 100% 100% 100% 75% 67% 100% 71% 56% 100% 85%
Total 66% 63% 68% 70% 67% 67% 71% 66% 70% 67%
Minority Total 60% 60% 63% 69% 65% 64% 69% 67% 69% 65%
60% 60% 63%
69%
65% 64%
69% 67%
69% 65%
69%
63%
69% 71%
66% 68%
72%
66% 70%
67%
0%
20%
40%
60%
80%
100%
2004 2005 2006 2007 2008 2009 2010 2011 2012 2013
First-Year Student Cohort
Minority Total White
2014-15 Diversity Report. Available at: www.cu.edu/office-academic-affairs/diversity-reports40
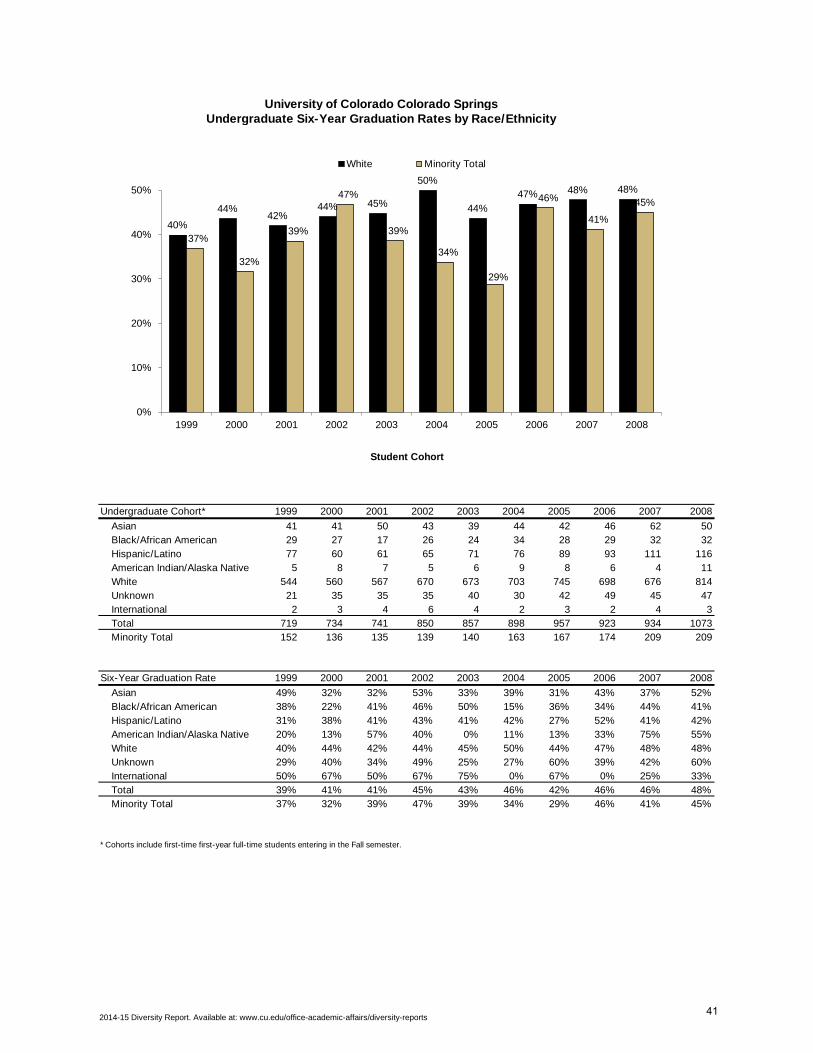
University of Colorado Colorado SpringsUndergraduate Six-Year Graduation Rates by Race/Ethnicity
Undergraduate Cohort* 1999 2000 2001 2002 2003 2004 2005 2006 2007 2008
Asian 41 41 50 43 39 44 42 46 62 50
Black/African American 29 27 17 26 24 34 28 29 32 32
Hispanic/Latino 77 60 61 65 71 76 89 93 111 116
American Indian/Alaska Native 5 8 7 5 6 9 8 6 4 11
White 544 560 567 670 673 703 745 698 676 814
Unknown 21 35 35 35 40 30 42 49 45 47
International 2 3 4 6 4 2 3 2 4 3
Total 719 734 741 850 857 898 957 923 934 1073
Minority Total 152 136 135 139 140 163 167 174 209 209
Six-Year Graduation Rate 1999 2000 2001 2002 2003 2004 2005 2006 2007 2008
Asian 49% 32% 32% 53% 33% 39% 31% 43% 37% 52%
Black/African American 38% 22% 41% 46% 50% 15% 36% 34% 44% 41%
Hispanic/Latino 31% 38% 41% 43% 41% 42% 27% 52% 41% 42%
American Indian/Alaska Native 20% 13% 57% 40% 0% 11% 13% 33% 75% 55%
White 40% 44% 42% 44% 45% 50% 44% 47% 48% 48%
Unknown 29% 40% 34% 49% 25% 27% 60% 39% 42% 60%
International 50% 67% 50% 67% 75% 0% 67% 0% 25% 33%
Total 39% 41% 41% 45% 43% 46% 42% 46% 46% 48%
Minority Total 37% 32% 39% 47% 39% 34% 29% 46% 41% 45%
* Cohorts include first-time first-year full-time students entering in the Fall semester.
40%
44% 42%
44% 45%
50%
44%
47% 48% 48%
37%
32%
39%
47%
39%
34%
29%
46%
41%
45%
0%
10%
20%
30%
40%
50%
1999 2000 2001 2002 2003 2004 2005 2006 2007 2008
Student Cohort
White Minority Total
2014-15 Diversity Report. Available at: www.cu.edu/office-academic-affairs/diversity-reports41
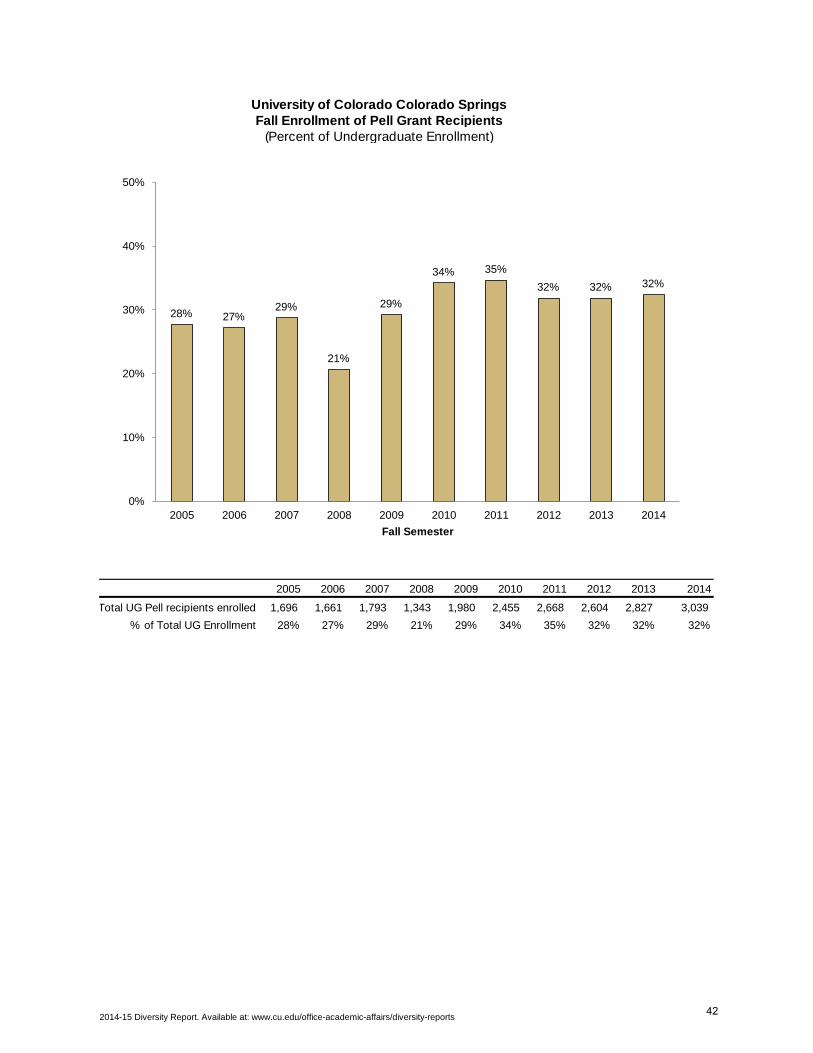
University of Colorado Colorado SpringsFall Enrollment of Pell Grant Recipients
(Percent of Undergraduate Enrollment)
2005 2006 2007 2008 2009 2010 2011 2012 2013 2014
Total UG Pell recipients enrolled 1,696 1,661 1,793 1,343 1,980 2,455 2,668 2,604 2,827 3,039
% of Total UG Enrollment 28% 27% 29% 21% 29% 34% 35% 32% 32% 32%
28% 27% 29%
21%
29%
34% 35%
32% 32% 32%
0%
10%
20%
30%
40%
50%
2005 2006 2007 2008 2009 2010 2011 2012 2013 2014
Fall Semester
2014-15 Diversity Report. Available at: www.cu.edu/office-academic-affairs/diversity-reports42
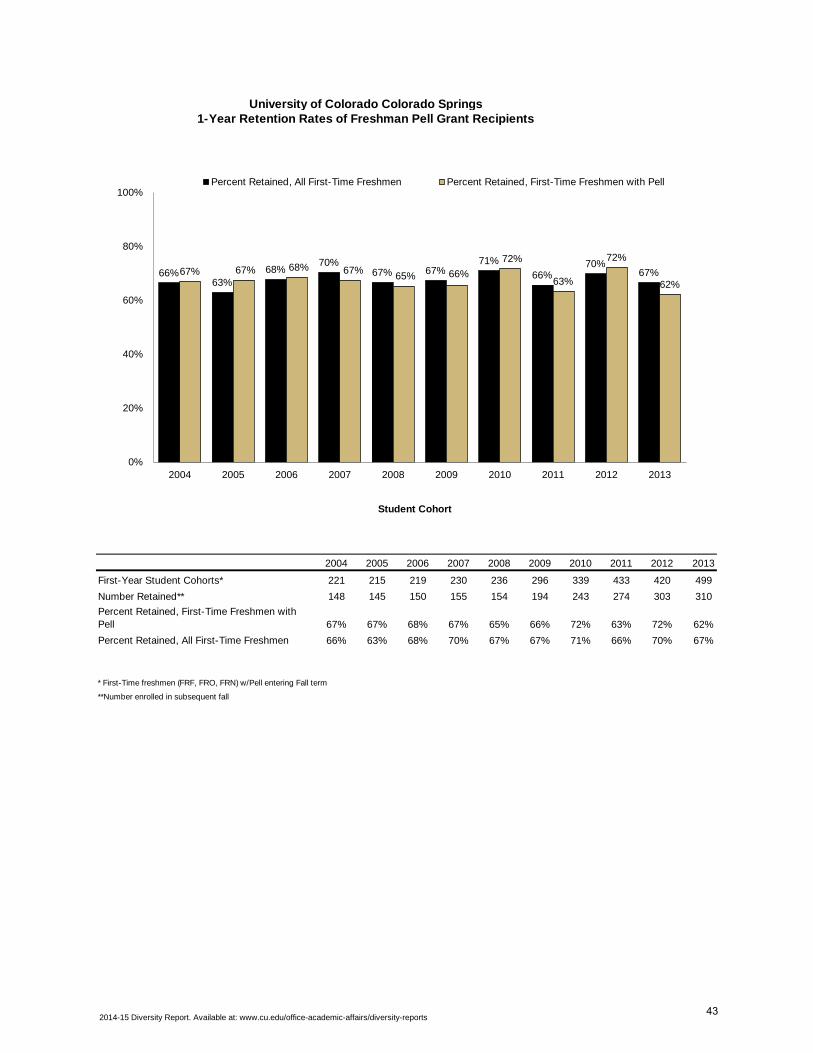
University of Colorado Colorado Springs1-Year Retention Rates of Freshman Pell Grant Recipients
2004 2005 2006 2007 2008 2009 2010 2011 2012 2013
First-Year Student Cohorts* 221 215 219 230 236 296 339 433 420 499
Number Retained** 148 145 150 155 154 194 243 274 303 310
Percent Retained, First-Time Freshmen with
Pell 67% 67% 68% 67% 65% 66% 72% 63% 72% 62%
Percent Retained, All First-Time Freshmen 66% 63% 68% 70% 67% 67% 71% 66% 70% 67%
* First-Time freshmen (FRF, FRO, FRN) w/Pell entering Fall term
**Number enrolled in subsequent fall
66% 63%
68% 70%
67% 67% 71%
66% 70%
67% 67% 67% 68% 67% 65% 66%
72%
63%
72%
62%
0%
20%
40%
60%
80%
100%
2004 2005 2006 2007 2008 2009 2010 2011 2012 2013
Student Cohort
Percent Retained, All First-Time Freshmen Percent Retained, First-Time Freshmen with Pell
2014-15 Diversity Report. Available at: www.cu.edu/office-academic-affairs/diversity-reports43
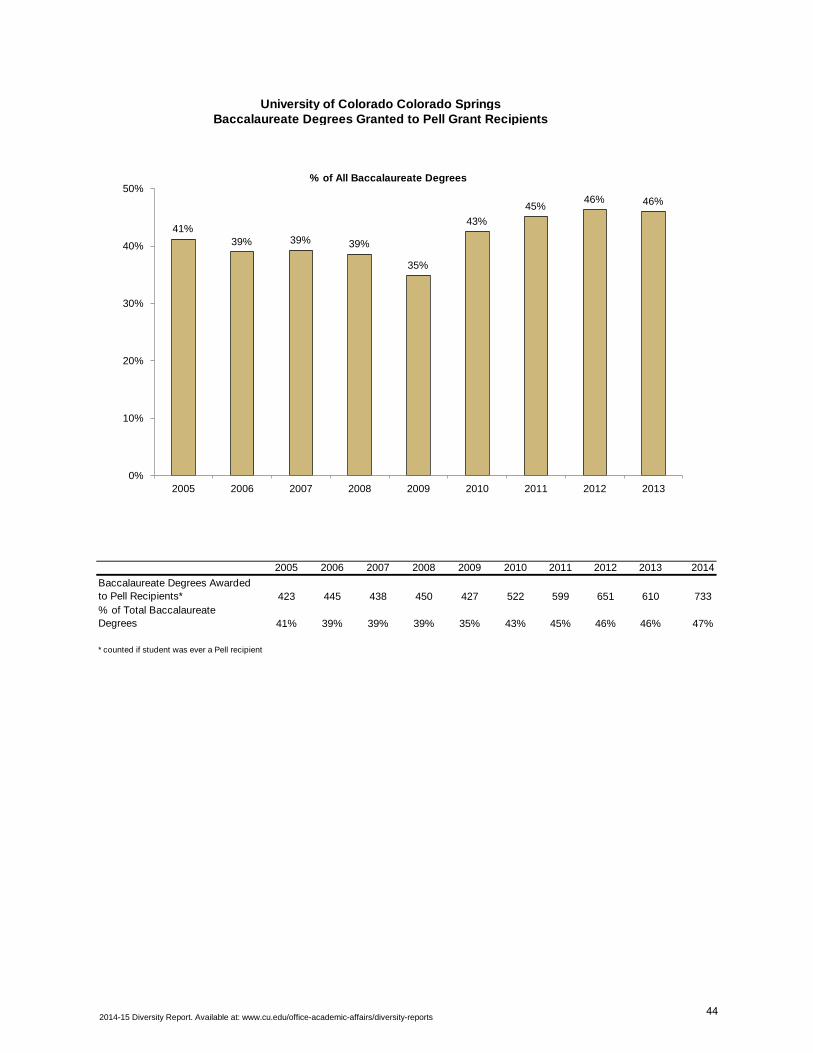
University of Colorado Colorado SpringsBaccalaureate Degrees Granted to Pell Grant Recipients
2005 2006 2007 2008 2009 2010 2011 2012 2013 2014
Baccalaureate Degrees Awarded
to Pell Recipients* 423 445 438 450 427 522 599 651 610 733
% of Total Baccalaureate
Degrees 41% 39% 39% 39% 35% 43% 45% 46% 46% 47%
* counted if student was ever a Pell recipient
41%
39% 39% 39%
35%
43%
45% 46% 46%
0%
10%
20%
30%
40%
50%
2005 2006 2007 2008 2009 2010 2011 2012 2013
% of All Baccalaureate Degrees
2014-15 Diversity Report. Available at: www.cu.edu/office-academic-affairs/diversity-reports44
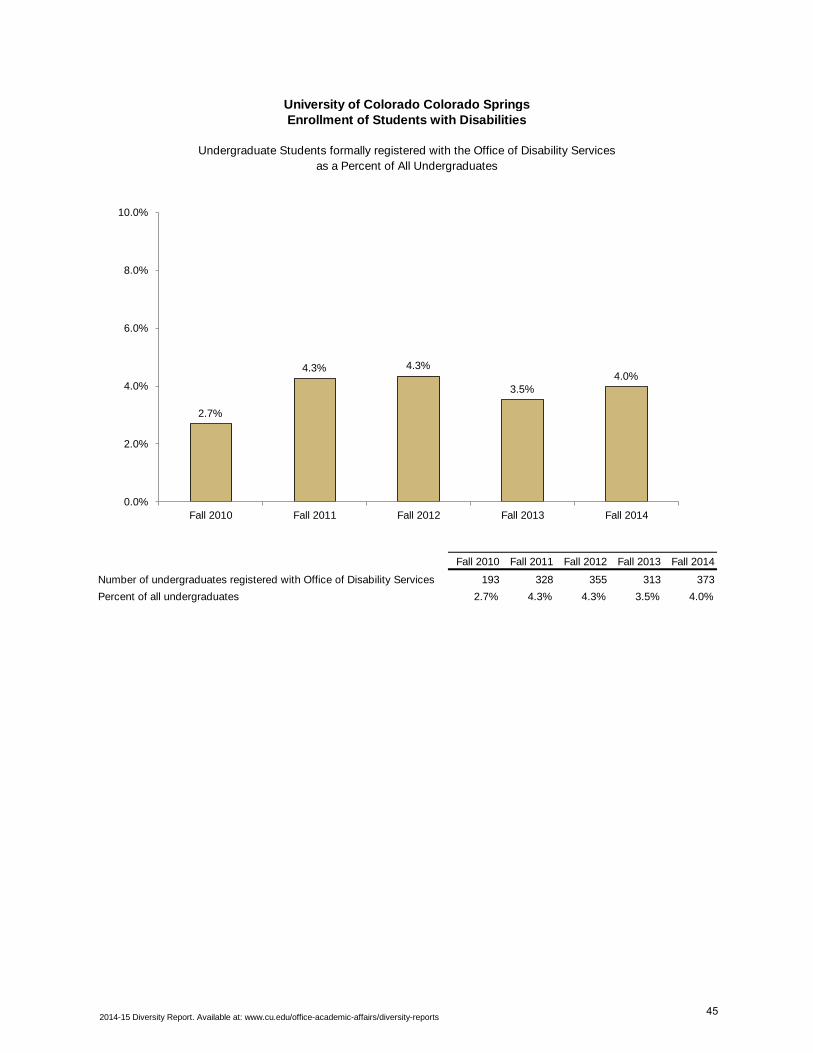
University of Colorado Colorado SpringsEnrollment of Students with Disabilities
Undergraduate Students formally registered with the Office of Disability Services
as a Percent of All Undergraduates
Fall 2010 Fall 2011 Fall 2012 Fall 2013 Fall 2014
Number of undergraduates registered with Office of Disability Services 193 328 355 313 373
Percent of all undergraduates 2.7% 4.3% 4.3% 3.5% 4.0%
2.7%
4.3% 4.3%
3.5% 4.0%
0.0%
2.0%
4.0%
6.0%
8.0%
10.0%
Fall 2010 Fall 2011 Fall 2012 Fall 2013 Fall 2014
2014-15 Diversity Report. Available at: www.cu.edu/office-academic-affairs/diversity-reports45
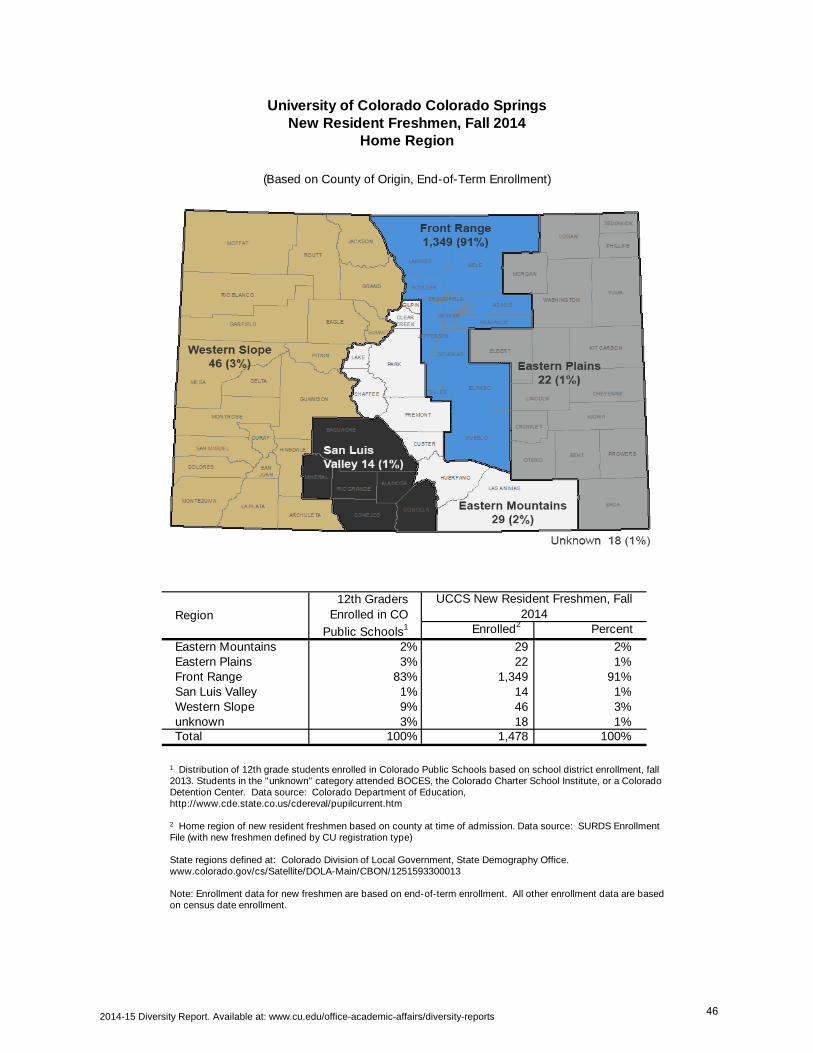
University of Colorado Colorado SpringsNew Resident Freshmen, Fall 2014
Home Region
(Based on County of Origin, End-of-Term Enrollment)
UCCS New Resident Freshmen, Fall
2014Enrolled2 Percent
Eastern Mountains 2% 29 2%Eastern Plains 3% 22 1%Front Range 83% 1,349 91%San Luis Valley 1% 14 1%Western Slope 9% 46 3%unknown 3% 18 1%Total 100% 1,478 100%
Region
12th Graders
Enrolled in CO
Public Schools1
1 Distribution of 12th grade students enrolled in Colorado Public Schools based on school district enrollment, fall 2013. Students in the "unknown" category attended BOCES, the Colorado Charter School Institute, or a Colorado Detention Center. Data source: Colorado Department of Education, http://www.cde.state.co.us/cdereval/pupilcurrent.htm
2 Home region of new resident freshmen based on county at time of admission. Data source: SURDS Enrollment File (with new freshmen defined by CU registration type) State regions defined at: Colorado Division of Local Government, State Demography Office. www.colorado.gov/cs/Satellite/DOLA-Main/CBON/1251593300013 Note: Enrollment data for new freshmen are based on end-of-term enrollment. All other enrollment data are based on census date enrollment.
2014-15 Diversity Report. Available at: www.cu.edu/office-academic-affairs/diversity-reports46
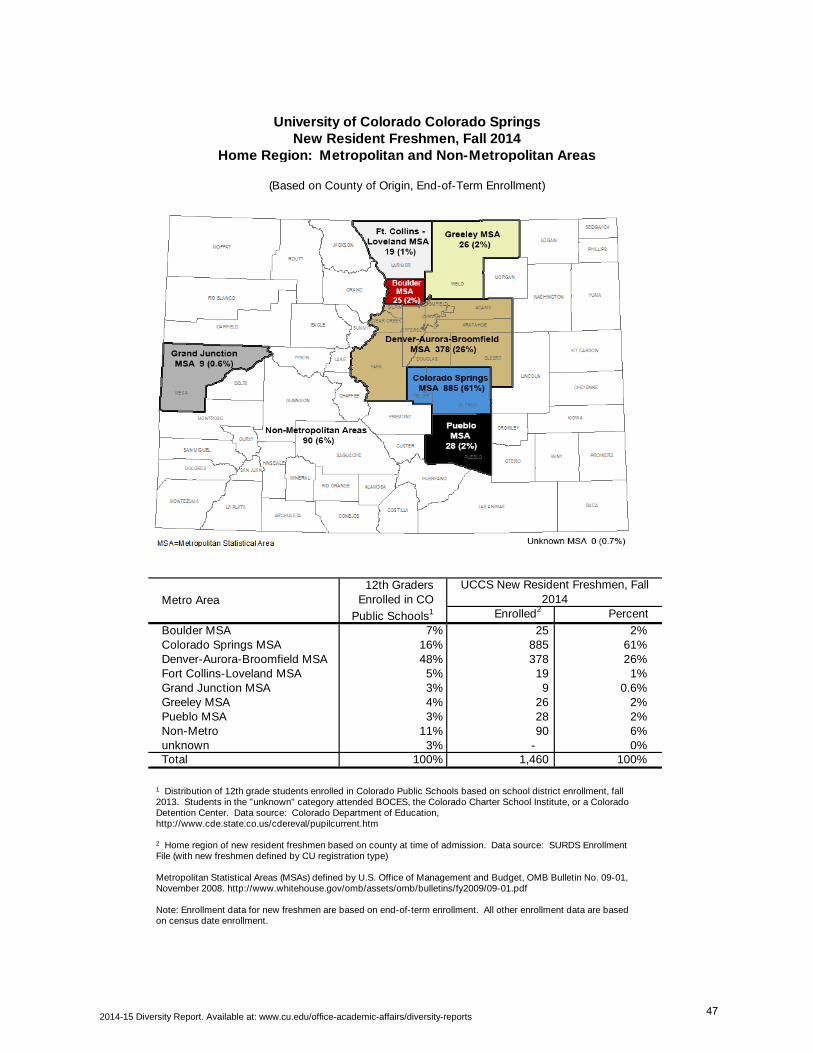
University of Colorado Colorado SpringsNew Resident Freshmen, Fall 2014
Home Region: Metropolitan and Non-Metropolitan Areas
(Based on County of Origin, End-of-Term Enrollment)
UCCS New Resident Freshmen, Fall 2014
Enrolled2 Percent
Boulder MSA 7% 25 2%Colorado Springs MSA 16% 885 61%Denver-Aurora-Broomfield MSA 48% 378 26%Fort Collins-Loveland MSA 5% 19 1%Grand Junction MSA 3% 9 0.6%Greeley MSA 4% 26 2%Pueblo MSA 3% 28 2%Non-Metro 11% 90 6%unknown 3% - 0%Total 100% 1,460 100%
Metro Area
12th Graders Enrolled in CO
Public Schools1
1 Distribution of 12th grade students enrolled in Colorado Public Schools based on school district enrollment, fall 2013. Students in the "unknown" category attended BOCES, the Colorado Charter School Institute, or a Colorado Detention Center. Data source: Colorado Department of Education, http://www.cde.state.co.us/cdereval/pupilcurrent.htm 2 Home region of new resident freshmen based on county at time of admission. Data source: SURDS Enrollment File (with new freshmen defined by CU registration type) Metropolitan Statistical Areas (MSAs) defined by U.S. Office of Management and Budget, OMB Bulletin No. 09-01, November 2008. http://www.whitehouse.gov/omb/assets/omb/bulletins/fy2009/09-01.pdf Note: Enrollment data for new freshmen are based on end-of-term enrollment. All other enrollment data are based on census date enrollment.
2014-15 Diversity Report. Available at: www.cu.edu/office-academic-affairs/diversity-reports47
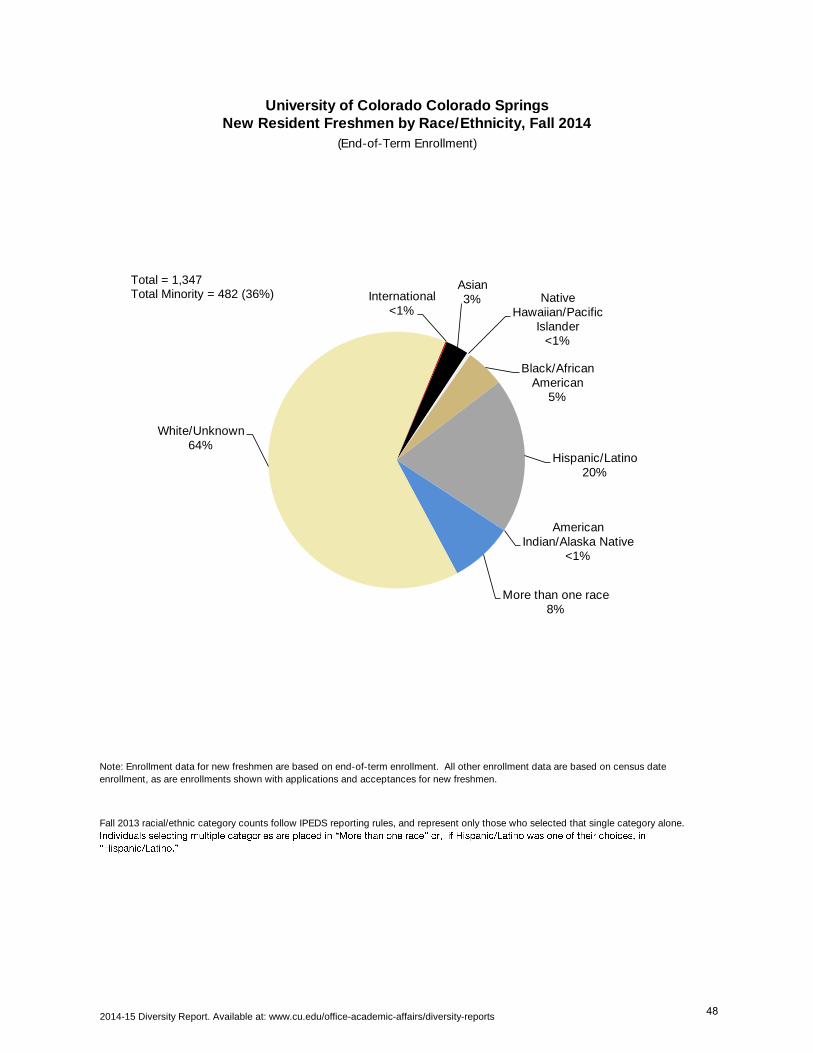
University of Colorado Colorado SpringsNew Resident Freshmen by Race/Ethnicity, Fall 2014
(End-of-Term Enrollment)
Asian
Hispanic/Latino
More than one race
White/Unknown
Note: Enrollment data for new freshmen are based on end-of-term enrollment. All other enrollment data are based on census date
enrollment, as are enrollments shown with applications and acceptances for new freshmen.
Fall 2013 racial/ethnic category counts follow IPEDS reporting rules, and represent only those who selected that single category alone.
Asian 3% Native
Hawaiian/Pacific Islander
<1%
Black/African American
5%
Hispanic/Latino 20%
American Indian/Alaska Native
<1%
More than one race 8%
White/Unknown 64%
International <1%
Total = 1,347 Total Minority = 482 (36%)
2014-15 Diversity Report. Available at: www.cu.edu/office-academic-affairs/diversity-reports48
University of Colorado Colorado SpringsFaculty and Staff Diversity
Data provided by the UCCS Office of Institutional Researchhttp://www.uccs.edu/~ir/
49
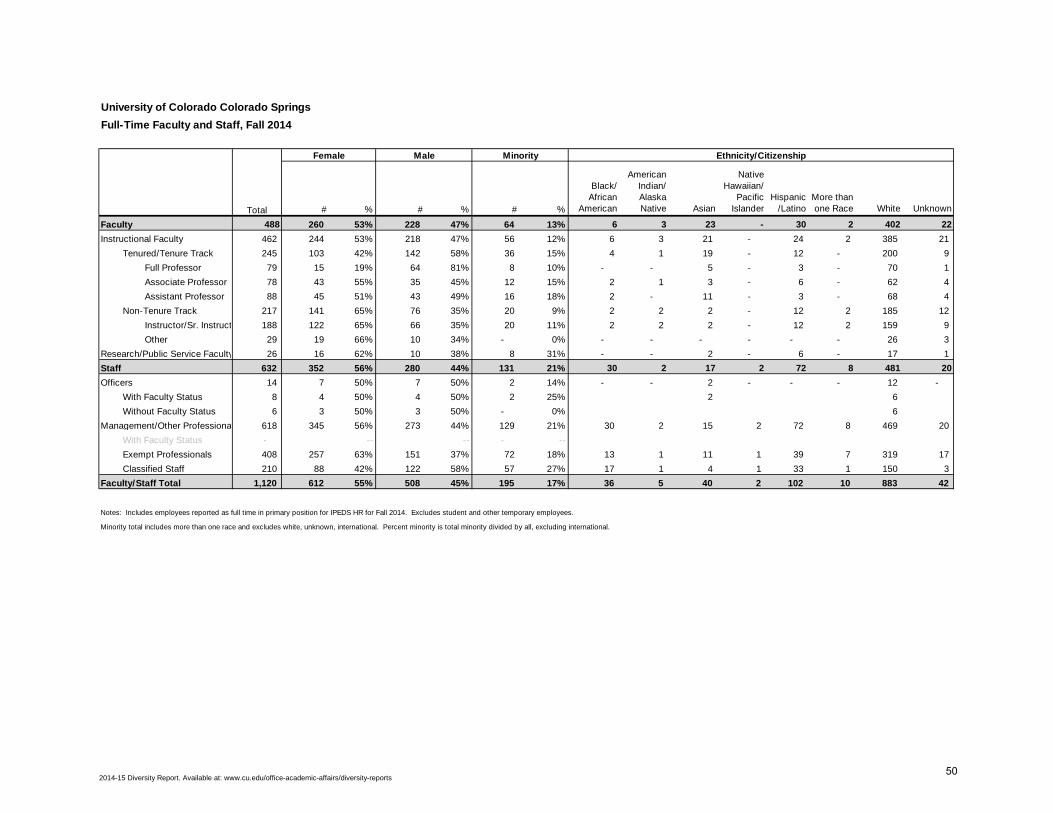
University of Colorado Colorado Springs
Full-Time Faculty and Staff, Fall 2014
Ethnicity/Citizenship
# % # % # %
Black/African
American
American Indian/Alaska Native Asian
Native Hawaiian/
Pacific Islander
Hispanic/Latino
More than one Race White Unknown
Faculty 488 260 53% 228 47% 64 13% 6 3 23 - 30 2 402 22
Instructional Faculty 462 244 53% 218 47% 56 12% 6 3 21 - 24 2 385 21
Tenured/Tenure Track 245 103 42% 142 58% 36 15% 4 1 19 - 12 - 200 9
Full Professor 79 15 19% 64 81% 8 10% - - 5 - 3 - 70 1
Associate Professor 78 43 55% 35 45% 12 15% 2 1 3 - 6 - 62 4
Assistant Professor 88 45 51% 43 49% 16 18% 2 - 11 - 3 - 68 4
Non-Tenure Track 217 141 65% 76 35% 20 9% 2 2 2 - 12 2 185 12
Instructor/Sr. Instructor 188 122 65% 66 35% 20 11% 2 2 2 - 12 2 159 9
Other 29 19 66% 10 34% - 0% - - - - - - 26 3
Research/Public Service Faculty 26 16 62% 10 38% 8 31% - - 2 - 6 - 17 1
Staff 632 352 56% 280 44% 131 21% 30 2 17 2 72 8 481 20
Officers 14 7 50% 7 50% 2 14% - - 2 - - - 12 -
With Faculty Status 8 4 50% 4 50% 2 25% 2 6
Without Faculty Status 6 3 50% 3 50% - 0% 6
Management/Other Professionals/Support Staff618 345 56% 273 44% 129 21% 30 2 15 2 72 8 469 20
With Faculty Status - -- -- - --
Exempt Professionals 408 257 63% 151 37% 72 18% 13 1 11 1 39 7 319 17
Classified Staff 210 88 42% 122 58% 57 27% 17 1 4 1 33 1 150 3
Faculty/Staff Total 1,120 612 55% 508 45% 195 17% 36 5 40 2 102 10 883 42
Notes: Includes employees reported as full time in primary position for IPEDS HR for Fall 2014. Excludes student and other temporary employees.
Minority total includes more than one race and excludes white, unknown, international. Percent minority is total minority divided by all, excluding international.
Male Minority
Total
Female
2014-15 Diversity Report. Available at: www.cu.edu/office-academic-affairs/diversity-reports50
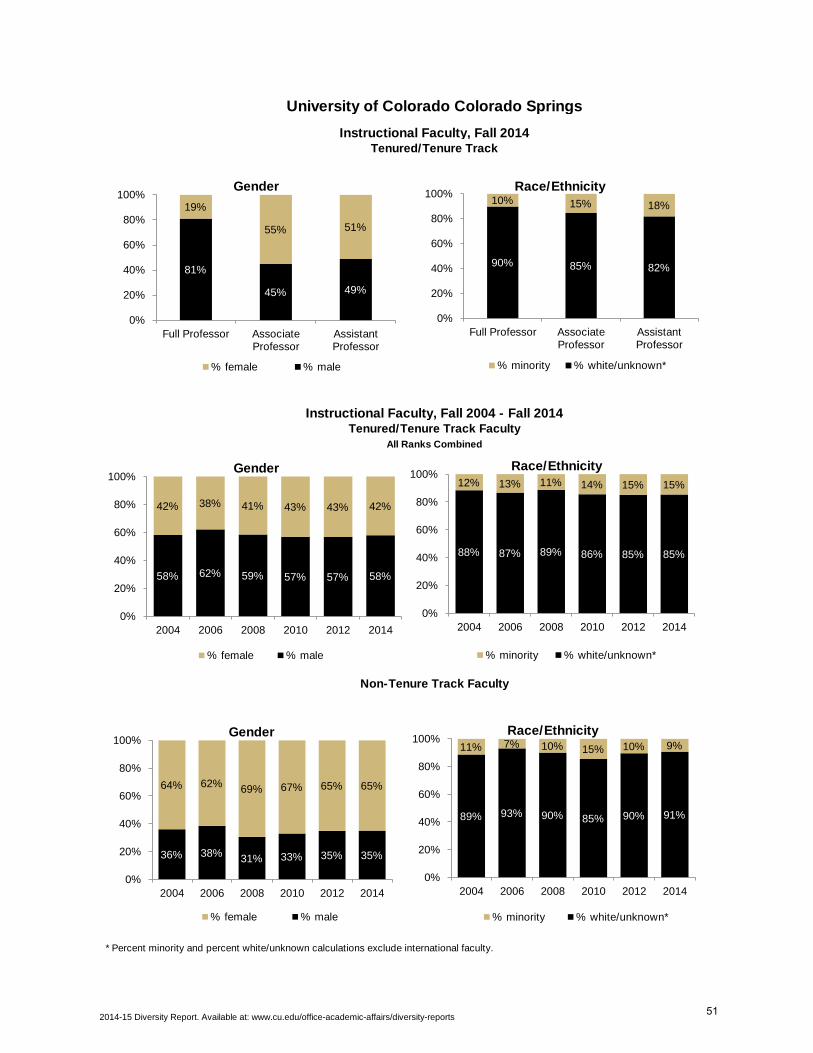
University of Colorado Colorado Springs
Instructional Faculty, Fall 2014Tenured/Tenure Track
Instructional Faculty, Fall 2004 - Fall 2014Tenured/Tenure Track Faculty
All Ranks Combined
Non-Tenure Track Faculty
* Percent minority and percent white/unknown calculations exclude international faculty.
58% 62% 59% 57% 57% 58%
42% 38% 41% 43% 43% 42%
0%
20%
40%
60%
80%
100%
2004 2006 2008 2010 2012 2014
Gender
% female % male
88% 87% 89% 86% 85% 85%
12% 13% 11% 14% 15% 15%
0%
20%
40%
60%
80%
100%
2004 2006 2008 2010 2012 2014
Race/Ethnicity
% minority % white/unknown*
36% 38% 31% 33% 35% 35%
64% 62% 69% 67% 65% 65%
0%
20%
40%
60%
80%
100%
2004 2006 2008 2010 2012 2014
Gender
% female % male
89% 93% 90% 85% 90% 91%
11% 7% 10% 15% 10% 9%
0%
20%
40%
60%
80%
100%
2004 2006 2008 2010 2012 2014
Race/Ethnicity
% minority % white/unknown*
81%
45% 49%
19%
55% 51%
0%
20%
40%
60%
80%
100%
Full Professor AssociateProfessor
AssistantProfessor
Gender
% female % male
90% 85% 82%
10% 15% 18%
0%
20%
40%
60%
80%
100%
Full Professor AssociateProfessor
AssistantProfessor
Race/Ethnicity
% minority % white/unknown*
2014-15 Diversity Report. Available at: www.cu.edu/office-academic-affairs/diversity-reports51
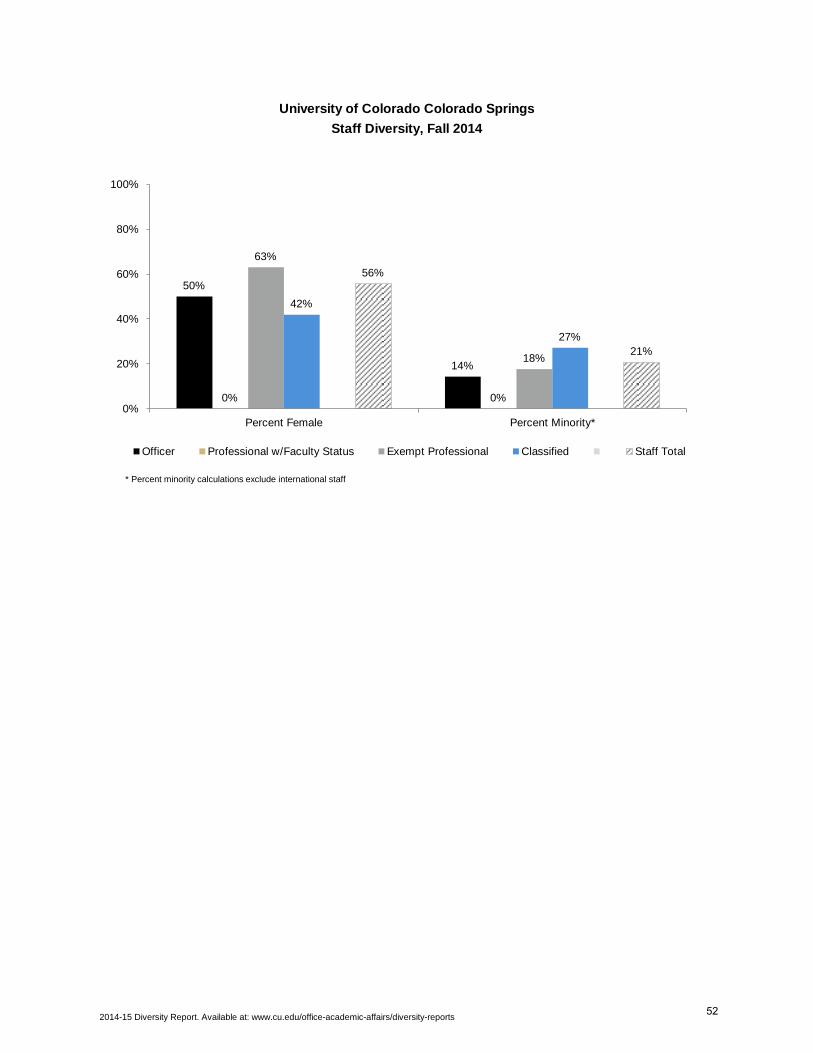
University of Colorado Colorado Springs
Staff Diversity, Fall 2014
50%
14%
0% 0%
63%
18%
42%
27%
56%
21%
0%
20%
40%
60%
80%
100%
Percent Female Percent Minority*
Officer Professional w/Faculty Status Exempt Professional Classified Staff Total
* Percent minority calculations exclude international staff
2014-15 Diversity Report. Available at: www.cu.edu/office-academic-affairs/diversity-reports52
2014 - 2015 Report on Diversity
Prepared by the University of Colorado Denver
Office of Diversity & Inclusion May 2015
53
2014-15 Diversity Report. Available at: www.cu.edu/office-academic-affairs/diversity-reports Narrative prepared by the University of Colorado Denver | Anschutz Medical Campus Office of Diversity and Inclusion, May 2015.
A Strategic Approach to Diversity and Inclusion The University of Colorado Denver | Anschutz Medical Campus is committed to diversity and inclusion, as stated in our Strategic Plan (2008-2020), priority #5: to enhance diversity university-wide and to foster a culture of inclusion. Our approach to diversity encompasses numerous aspects of identity, including gender, race, ethnicity, sexual orientation, ability status, veteran status, nationality, religion, and socioeconomic background. Goals and objectives of this priority address multiple elements of campus life, including recruiting and retaining diverse students, faculty, and staff; maintaining an institutional climate of inclusiveness, respect and understanding for everyone; and expanding community-based programs to reduce health and educational disparities. Helping the campus to achieve this priority is the primary responsibility of the Office of Diversity and Inclusion (ODI), where Dr. Brenda J. Allen (Professor of Communication) was hired as the Associate Vice Chancellor for Diversity and Inclusion in August 2012. The Office of Diversity and Inclusion is taking a strategic, systemic, and sustainable approach to achieving the diversity priority by collaborating with and supporting a wide range of offices, initiatives, and programs focusing on diversity and inclusion. This report provides an overview of some of those efforts. The Office of Diversity and Inclusion oversees the Educational Opportunity Programs (EOP) Office on the Denver campus and the Office of Inclusion and Outreach (OIO) on the Anschutz Medical campus.
• The Educational Opportunity Programs (EOP) Office is a vital source for helping underrepresented students to persist, thrive, and graduate. EOP was established in 1969 for Black and Hispanic students, and later added programs for Asian American and American Indian students. EOP provides services: a) to support underrepresented students and b) to promote a diverse and inclusive campus for all students, faculty, and staff. For example, EOP offers orientation, holistic advising, scholarship information, cultural programs, leadership development, and advocacy.
• The Office of Inclusion and Outreach (OIO) serves students, faculty and staff at the Anschutz Medical Campus. Its mission is to promote and support a diverse community that acknowledges, values, fosters, and benefits from unique qualities, rich histories, and wide variety of cultural values and beliefs that mirror and fulfill the university’s mission of education, healthcare, research, and community service. OIO provides courses, workshops and events related to
54
2014-15 Diversity Report. Available at: www.cu.edu/office-academic-affairs/diversity-reports Narrative prepared by the University of Colorado Denver | Anschutz Medical Campus Office of Diversity and Inclusion, May 2015.
health care professions. Its programs span middle school, high school, undergraduate, and graduate levels.
Campus Quantitative Highlights
The proportion of undergraduate students of color at the combined Denver Campus and Anschutz Medical Campus has increased each year since 2005, reaching 38% for Fall 2014.
The numbers and proportions of graduate students of color have consistently increased over the last several years, peaking at 1001 and 17% in Fall 2014.
In the fall semesters of 2007 through 2009, the percentage of health professional students of color at the Anschutz Medical Campus remained steady at 21%. Recent years have seen greater numbers and percentages of students of color, with 481 (26%) enrolled Fall 2014.
The percent of baccalaureate degrees awarded to students of color at the combined Denver Campus and Anschutz Medical Campus was 27% in 2014. Concurrently, the number of degrees awarded to that group has generally increased every year since 2006 to reach 581 in fiscal year 2014.
The proportion of doctoral professional practice degrees conferred to students of color at the Anschutz Medical Campus has remained fairly consistent since 2005. The number of degrees conferred to students of color reached an all-time high of 144 (27% of the total degrees conferred) in fiscal year 2014.
More than 1/4 of the baccalaureate degrees awarded in FY2014 were earned by students of color. However, just 13% of the master’s degrees were awarded to students of color. Of the 647 degrees awarded at the doctoral level, more than 23% were conferred to students of color.
We continue to see higher persistence rates for students of color (except for American Indian/Alaska Native) than for white students (with the exception of the 2005 cohort).
The proportion of Pell grant recipients on the Denver Campus reached a high of 36% in Fall 2014. This is encouraging, as students receiving Pell grants tend to persist at higher rates than those who do not.
The percentage of Denver Campus students receiving baccalaureate degrees who were Pell grant recipients was 50% in fiscal year 2014.
Over the last five fall semesters, the proportion of undergraduate students that have registered with the Office of Disability Services has increased from 2.6% in Fall 2009 to 7.2% in Fall 2014. The latter represents 750 students from the combined Denver Campus and Anschutz Medical Campus.
55
2014-15 Diversity Report. Available at: www.cu.edu/office-academic-affairs/diversity-reports Narrative prepared by the University of Colorado Denver | Anschutz Medical Campus Office of Diversity and Inclusion, May 2015.
Campus Qualitative Highlights Student Success Efforts to increase the retention rate and promote student success include providing services and addressing diversity across various social identity categories and their intersections. New and established programs and strategies strive to improve the success of all students during the first year and throughout their academic careers. Such programs include:
• TRiO Student Support Services (SSS): A federally funded program that supports up to 165 low income, first generation and disabled students in the achievement of their academic goals. Participants in the TRiO-SSS program have higher retention and six-year graduation rates than the total undergraduate population.
• The Office of Disability Resources and Services (DRS) continues to expand the number of students served. Over the last five fall semesters, the proportion of undergraduate students that have registered with the Office of Disability Services has steadily increased.
• Women’s Resource Center: The Women’s Resource Center provides resources, advocacy, services, and programs, which promote awareness of women’s issues and equality for all students. The WRC is a safe and nurturing space that enables women, especially underrepresented women, in the university community to thrive.
• Office of Veteran Student Services: represents Active Duty, Reservist, National Guard, Veteran and VA dependent students, and serves as a resource for students, faculty and staff by providing outreach and educational service. The University of Colorado Denver | Anschutz Medical Campus was recognized by “G.I. Jobs” magazine as a “military friendly” university, committed to providing servicemen and women from all backgrounds with a high-quality education catered to their distinct needs. The university recently launched the “Boots to Suits” program that provides mentorships, internships and job opportunities to help veterans transition to a civilian career.
• Office of International Affairs: is partnering with TRiO, EOP, and other offices to recruit students for study abroad and to assist them with acquiring scholarships. Thanks to their efforts, underrepresented students have received scholarships to travel to India, Morocco, Spain, China, Korea, and Tunisia.
• Early Alert: A web-based system allows faculty to identify students who are experiencing weak academic performance or who are struggling with participation. These students are referred to academic advisers who guide the students to appropriate resources. EOP directors are providing names of students whom they serve (e.g., the Summer Bridge cohort); Early Alert will also
56
2014-15 Diversity Report. Available at: www.cu.edu/office-academic-affairs/diversity-reports Narrative prepared by the University of Colorado Denver | Anschutz Medical Campus Office of Diversity and Inclusion, May 2015.
contact them to reach out to any of those students who are on the Early Alert list.
• First-year Seminars: The Denver First-Year Seminar courses are designed to support high school graduates transitioning to the university. Many of those courses focus on issues related to diversity and inclusion.
• Student Organizations: Organizations focused on diversity issues make up approximately 30% of the total number of student organizations on campus. There are over 50 groups focused on some aspect of diversity.
P-20 and Pipeline Initiatives Pre-collegiate Programs. Both campuses have continued their strong efforts in P-20 pipeline initiatives that provide pre-collegiate preparation programs for high school and middle school students. These programs include:
• The CU Succeed Silver and Gold Programs collaborate with more than 90 high schools in Colorado to offer students an opportunity to get a head start on their college careers by taking UC Denver courses for both high school and college credit, during the school day, at their high school.
• Denver School of Science and Technology (DSST) teachers collaborate with university faculty on instruction for math and science classes. Selected DSST students undertake projects at the university during the summer.
• Saturday Academies (OIO) is a program in which students from four middle schools from Denver Public School (Cole, Lake, Rishel, and Skinner) explore health science careers. The students have a 3.5 GPA or higher; 90% are minority, first-generation.
• Health Professions Opportunity Day (hPod) (OIO): seeks to lead a statewide collaboration for recruiting and retaining youth of color in the health professions by partnering with the Anschutz Medical Campus’s Office of Inclusion and Outreach and the University of Colorado Denver’s Center for Pre-Collegiate and Academic Outreach programs to provide pre-health profession seminars for over 250 diverse middle school and high school students from the Denver metro area.
Programs for Undergraduate Students
• The Undergraduate Pre-Health Program (UPP) is a partnership between the Office of Inclusion and Outreach and Kaiser Permanente of Colorado. UPP provides a 13-month program which includes summer internships for undergraduate students interested in pursuing a career in healthcare. The program targets highly qualified students from historically underrepresented backgrounds. Since the program’s inception in 2006, 100% of the participants have completed their undergraduate education and received college degrees. Of
57
2014-15 Diversity Report. Available at: www.cu.edu/office-academic-affairs/diversity-reports Narrative prepared by the University of Colorado Denver | Anschutz Medical Campus Office of Diversity and Inclusion, May 2015.
the eligible program graduates who applied to graduate and professional programs, 71% have matriculated into professional programs and 76% of those attend the Anschutz Medical Campus.
• BA/BS-MD Program. To maintain a pipeline of diverse students in the health profession programs at the Anschutz Medical campus, the University of Colorado Denver's College of Liberal Arts and Sciences and the School of Medicine formed a BA/BS-MD program in 2010. This combined-degree program offers students from a variety of academic, economic, geographical, and cultural backgrounds a continuous path to obtain a baccalaureate degree and a medical degree within eight years: four years of undergraduate work and four years of medical school. The program has attracted highly qualified students from broadly diverse backgrounds who are committed to serving the health care needs of Colorado. The School of Dental Medicine is developing a BA/BS-DDS program.
• The Summer Bridge Program (EOP) focuses on the success of incoming freshmen by providing them with the necessary skills to achieve their academic endeavors. Students are exposed to campus resources, college success strategies and participate in team building activities. By participating in this program, students connect with a support team that will assist them throughout their college careers.
• Graduate Experiences for Multicultural Students (GEMS). This program introduces undergraduate students from diverse and traditionally under-represented groups to biomedical research career opportunities offered at the graduate level. Students enroll in a ten-week summer research internship course conducted by distinguished science faculty which consists of lectures, demonstrations, and laboratory research assignments.
• The Undergraduate Laboratory Research Experience program was established by the Colorado Clinical and Translational Sciences Institute in 2011 to provide undergraduate students with paid experiences in clinical or translational research laboratory settings at the Anschutz Medical Campus. The goal of the program is to increase diversity and inclusion in these research areas.
• The Summer Undergraduate Minority Mentoring in Translational Science (SUMMiT) program was established by the CCTSI in 2009, to bring together African American, Hispanic, and Native American undergraduate students in a collaborative series designed to enhance their summer research experience. A partnership with Dine College (the first tribal college in the United States) helps support the summer research program.
• Community College Transfer Programs. Many of the community colleges in the Denver metropolitan region serve a high proportion of students of color, and the Denver Campus has always been regarded as “transfer friendly” for students
58
2014-15 Diversity Report. Available at: www.cu.edu/office-academic-affairs/diversity-reports Narrative prepared by the University of Colorado Denver | Anschutz Medical Campus Office of Diversity and Inclusion, May 2015.
from these community colleges. Recent initiatives at both the Denver and the Anschutz Campus have enhanced this reputation for excellence. They include: o Partnerships between the College of Nursing and the Community College of
Denver and the Community College of Aurora, to develop curricula that enable students from these community colleges to enter the final two years of the baccalaureate nursing program.
o In Fall 2011 the Denver campus implemented the Denver Admission Promise Program, which guarantees admission for qualified students from community colleges in the front-range area into the baccalaureate programs at the Denver Campus. The CC to CU Denver Admission Promise is the first matriculation program of its kind in metro Denver.
Faculty and Staff Support and Development A variety of resources exist to recruit, retain, and advocate for underrepresented faculty. These include:
• The Faculty Assembly on the Downtown Campus has a Diversity Committee with four Subcommittees: Disabilities Committee; Gay Lesbian, Bisexual, Transgender, and Intersex Committee; Minority Affairs Committee; Women’s Issues Committee.
• In 2013, the AVC for Diversity and Inclusion established a fund for which all faculty and staff are eligible to propose projects that aim to retain faculty of color (funded by the Chancellor, Provost, and CDO).
• The Denver campus has a Black Staff and Faculty Affinity Group which serves as a support group and provides cultural programming for the campus.
• President’s Diversity Awards support traditional and innovative projects that enhance ethnic, cultural, and gender diversity among the University of Colorado’s students.
• CU System Diversity and Excellence Grants (up to $3,000) are designed to provide assistance for projects initiated by staff and/or faculty that promote diversity, inclusion and excellence on the campuses.
• The Faculty and Staff Multicultural Affairs Committee (FaSMAC) at the Anschutz Medical Campus addresses the concerns of multicultural faculty and staff. This committee assesses the cultural climate of the university as it pertains to opportunities for multicultural faculty and staff for academic advancement and productivity and offers recommendations for creating an academic environment that fosters the academic success of multicultural faculty and staff.
59
2014-15 Diversity Report. Available at: www.cu.edu/office-academic-affairs/diversity-reports Narrative prepared by the University of Colorado Denver | Anschutz Medical Campus Office of Diversity and Inclusion, May 2015.
Teaching and Scholarship At the Denver Campus, cultural competency is included as part of the curriculum of several graduate programs such as those offered by the School of Education and Human Development. The Office of Diversity and Inclusion offered scholarships for faculty and staff to attend UCCS’ annual Knapsack Institute, a three-day event focused on inclusive pedagogy. At the Anschutz Medical Campus, cultural competency is an integral part of courses in professionalism, as well as clinical experiences, in the health sciences programs. For example, the School of Medicine has developed the Culturally Effective Medicine Thread curriculum to help students understand the role of culture in health and healthcare disparities. Curricular efforts target physician-patient interaction and the role of culture in these interactions. The Office of Diversity and Inclusion is compiling a resource list of faculty at both campuses whose scholarship, teaching, research, and/or creative work focuses on any aspect of diversity detailed in the university’s strategic plan. Health Disparities The university has an established record of serving traditionally underserved, rural or ethnic minority, and at-risk communities in Colorado and around the world, including:
• More than 3,500 clinical visits are provided annually through the College of Nursing’s school-based clinic for children and families in the Sheridan School District 12, one of the poorest and most medically underserved in Colorado. The clinic provides pediatric, adult, midwifery, and mental health care.
• Several programs in the School of Dental Medicine provide clinical care to uninsured or underserved communities.
• Several centers within the School of Public Health have established tele-health and tele-education programs that have significantly enhanced the delivery of health care to Native Americans living in rural communities.
• Almost every county in rural Colorado is designated as a medically underserved area. The School of Medicine created the rural health track to increase the number of physicians who enter and remain in practice in rural Colorado.
• The School of Dental Medicine has a track for students, who upon obtaining licensure, are interested in practicing in rural areas in Colorado.
• The student and community counseling center in the Office of Student Affairs provides free and low-cost professional therapy to community members with a special focus on children and families in Denver Public Schools who have free access to 10 counseling sessions per year. Therapy takes place year-round, and is staffed by psychologists, professional psychotherapists, and graduate-level
60
2014-15 Diversity Report. Available at: www.cu.edu/office-academic-affairs/diversity-reports Narrative prepared by the University of Colorado Denver | Anschutz Medical Campus Office of Diversity and Inclusion, May 2015.
practicum students who are enrolled in the School of Education and Human Development.
Community Engagement The university strives to create partnerships in the community that reflect the needs and values of both the community and the university. To do this, the university relies on ongoing conversation and feedback, community liaisons, and mechanisms that insure the services it provides are truly needed and valued. Additionally, these connections allow the university to provide extraordinary learning experiences for students. Examples include:
• The Center for American Indian and Alaska Native Health cultivates close ties with members of tribes in the United States. University representatives have visited many tribal reservations and hosted visits of tribal members to the university.
• The Latino/a Research and Policy Center conducts research, policy analysis, and disseminates information about Latinos in Colorado and the national Latino population. Faculty in several schools and colleges conduct research that focuses on the Latino community, including work with breast cancer detection and other health-related issues. The Latino/a Resource and Policy Center has recently been revamped with the hiring of a new director, Dr. Evelinn Borrayo, and has renewed its focus on health disparities.
• The Colorado Clinical and Translational Sciences Institute solicits and funds grant proposals that originate in the community and involve community members who act as liaisons between the community and the university. The institute has eleven liaisons representing seven communities with diverse geographic or ethnic constituents. The liaisons bring the issues from the community to the university and they communicate to the community on behalf of the university.
• The Rocky Mountain Prevention Research Center in the Colorado School of Public Health was awarded a five-year grant from the Centers for Disease Control to work with community partners to identify local health priorities in the San Luis Valley in southern Colorado. Researchers from the University of Colorado Denver have worked with this rural, low income, Latino, and non-Latino population—where 43 percent of middle school students are obese or overweight—on epidemiologic and health-promotion studies related to Type 2 diabetes for more than 20 years.
The university embraces the contributions that volunteer activities can bring to the overall education of its students. Many of its schools and colleges require student
61
2014-15 Diversity Report. Available at: www.cu.edu/office-academic-affairs/diversity-reports Narrative prepared by the University of Colorado Denver | Anschutz Medical Campus Office of Diversity and Inclusion, May 2015.
engagement with underserved communities as a requirement for graduation, including: • Stop & Serve: was started in 2009 in an effort to engage students in a variety of
service projects that directly impact local communities. This monthly event sponsored by the UC Denver Experiential Learning Center provides brief, on-campus volunteer opportunities for students to work on service projects focused on social issues.
• Each winter the university participates in the CU in the Community Campaign in an effort to allow the campus community an opportunity to further engage with community interests. Faculty, staff and students select an organization of their choice for their volunteer efforts.
• At the Stout Street Clinic for the Homeless in Denver, the Skaggs School of Pharmacy serves as the pharmacy director, overseeing students who provide pharmacy services to hundreds of patients daily, including care clinics such as diabetes care management.
• Fall Fest/Spring Fling is an opportunity for a wide variety of student organizations to market their club and events to students on campus. Diverse student organizations promote their activities to those who may not otherwise know they exist.
• The Alternative Breaks program through the Experiential Learning Center exposes students to complex social and cultural issues through direct service, experiential learning, group discussion, and personal reflection. The vision is to transform students into advocates of social change on issues affecting our communities.
• Campus Volunteer Fair: each semester the Experiential Learning Center and CU Denver Student Life co-host the CU Denver Volunteer Fair to introduce students, faculty, and staff to local community-based organizations offering volunteer and internship positions.
62
University of Colorado Denver | Anschutz Medical CampusStudent Diversity
Data provided by the CU Denver | Anschutz Medical Campus Office of Institutional Research and Effectivenesswww.ucdenver.edu/ir
63
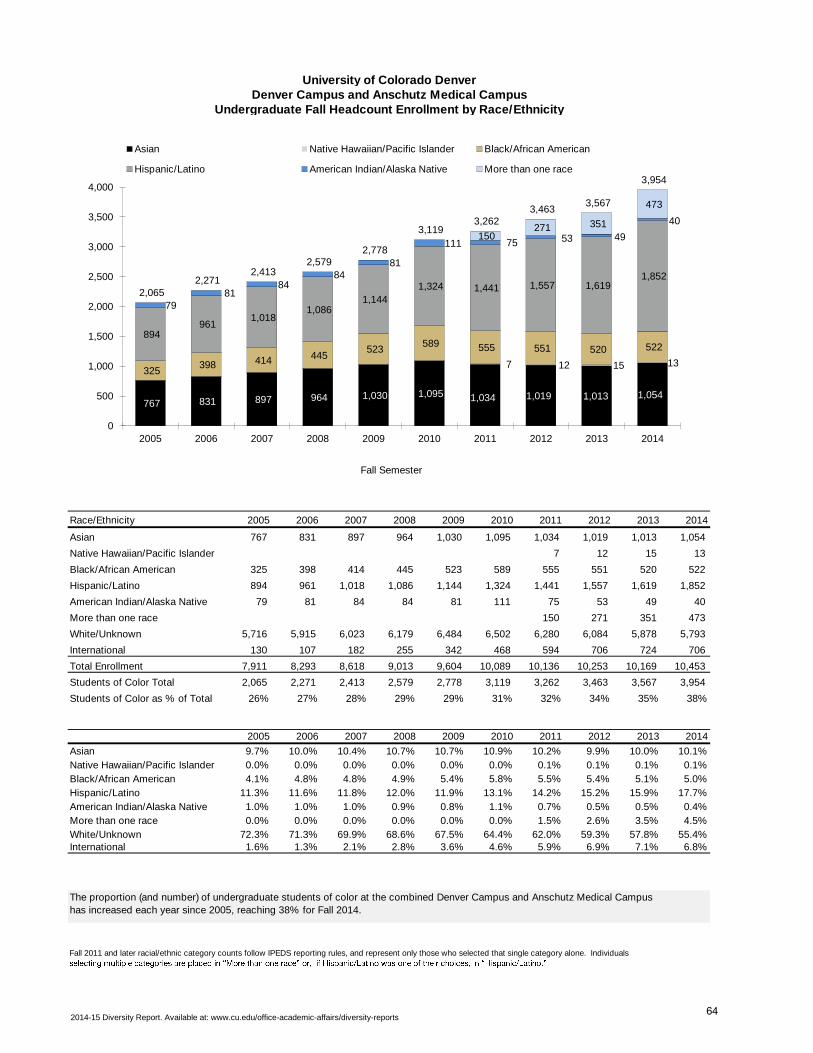
University of Colorado DenverDenver Campus and Anschutz Medical Campus
Undergraduate Fall Headcount Enrollment by Race/Ethnicity
Race/Ethnicity 2005 2006 2007 2008 2009 2010 2011 2012 2013 2014
Asian 767 831 897 964 1,030 1,095 1,034 1,019 1,013 1,054
Native Hawaiian/Pacific Islander 7 12 15 13
Black/African American 325 398 414 445 523 589 555 551 520 522
Hispanic/Latino 894 961 1,018 1,086 1,144 1,324 1,441 1,557 1,619 1,852
American Indian/Alaska Native 79 81 84 84 81 111 75 53 49 40
More than one race 150 271 351 473
White/Unknown 5,716 5,915 6,023 6,179 6,484 6,502 6,280 6,084 5,878 5,793
International 130 107 182 255 342 468 594 706 724 706
Total Enrollment 7,911 8,293 8,618 9,013 9,604 10,089 10,136 10,253 10,169 10,453
Students of Color Total 2,065 2,271 2,413 2,579 2,778 3,119 3,262 3,463 3,567 3,954
Students of Color as % of Total 26% 27% 28% 29% 29% 31% 32% 34% 35% 38%
2005 2006 2007 2008 2009 2010 2011 2012 2013 2014
Asian 9.7% 10.0% 10.4% 10.7% 10.7% 10.9% 10.2% 9.9% 10.0% 10.1%
Native Hawaiian/Pacific Islander 0.0% 0.0% 0.0% 0.0% 0.0% 0.0% 0.1% 0.1% 0.1% 0.1%
Black/African American 4.1% 4.8% 4.8% 4.9% 5.4% 5.8% 5.5% 5.4% 5.1% 5.0%
Hispanic/Latino 11.3% 11.6% 11.8% 12.0% 11.9% 13.1% 14.2% 15.2% 15.9% 17.7%
American Indian/Alaska Native 1.0% 1.0% 1.0% 0.9% 0.8% 1.1% 0.7% 0.5% 0.5% 0.4%
More than one race 0.0% 0.0% 0.0% 0.0% 0.0% 0.0% 1.5% 2.6% 3.5% 4.5%
White/Unknown 72.3% 71.3% 69.9% 68.6% 67.5% 64.4% 62.0% 59.3% 57.8% 55.4%International 1.6% 1.3% 2.1% 2.8% 3.6% 4.6% 5.9% 6.9% 7.1% 6.8%
The proportion (and number) of undergraduate students of color at the combined Denver Campus and Anschutz Medical Campus
has increased each year since 2005, reaching 38% for Fall 2014.
Fall 2011 and later racial/ethnic category counts follow IPEDS reporting rules, and represent only those who selected that single category alone. Individuals
767 831 897 964 1,030 1,095 1,034 1,019 1,013 1,054
7 12 15 13 325
398 414 445 523
589 555 551 520 522
894 961
1,018 1,086
1,144
1,324 1,441 1,557 1,619 1,852
79 81
84 84
81
111 75 53 49
40
150 271 351
473
2,065 2,271
2,413 2,579
2,778
3,119 3,262
3,463 3,567
3,954
0
500
1,000
1,500
2,000
2,500
3,000
3,500
4,000
2005 2006 2007 2008 2009 2010 2011 2012 2013 2014
Fall Semester
Asian Native Hawaiian/Pacific Islander Black/African American
Hispanic/Latino American Indian/Alaska Native More than one race
2014-15 Diversity Report. Available at: www.cu.edu/office-academic-affairs/diversity-reports64
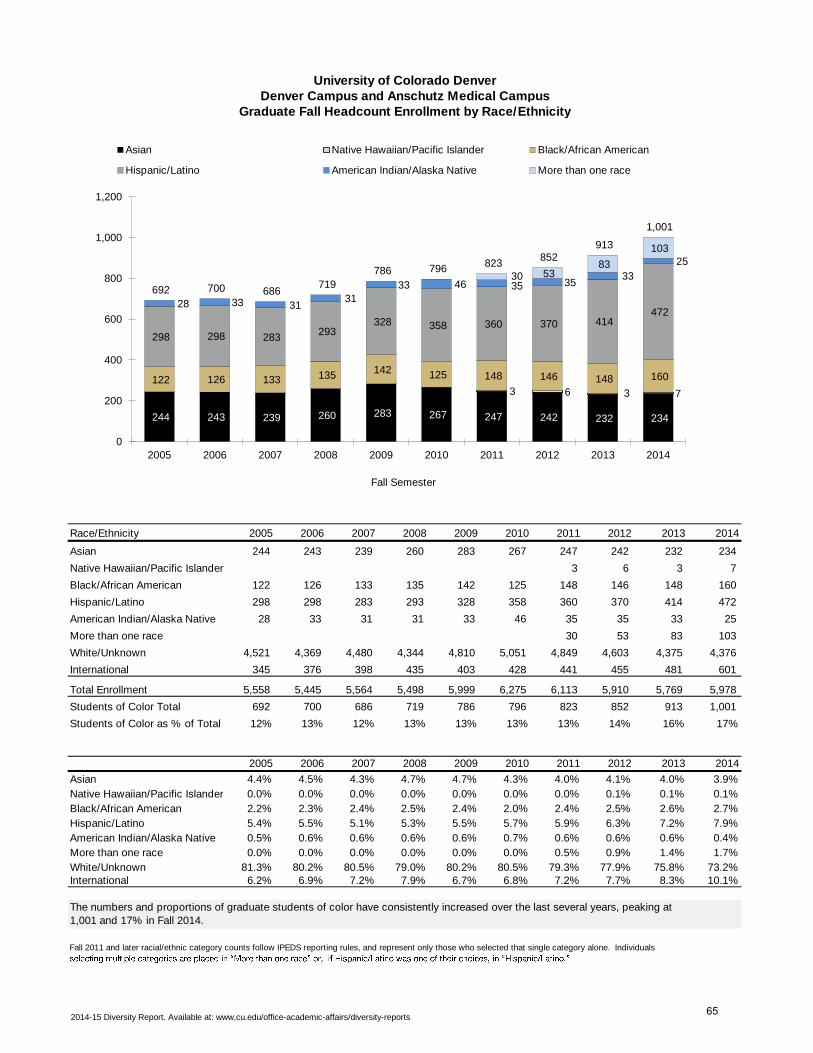
University of Colorado DenverDenver Campus and Anschutz Medical Campus
Graduate Fall Headcount Enrollment by Race/Ethnicity
Race/Ethnicity 2005 2006 2007 2008 2009 2010 2011 2012 2013 2014
Asian 244 243 239 260 283 267 247 242 232 234
Native Hawaiian/Pacific Islander 3 6 3 7
Black/African American 122 126 133 135 142 125 148 146 148 160
Hispanic/Latino 298 298 283 293 328 358 360 370 414 472
American Indian/Alaska Native 28 33 31 31 33 46 35 35 33 25
More than one race 30 53 83 103
White/Unknown 4,521 4,369 4,480 4,344 4,810 5,051 4,849 4,603 4,375 4,376
International 345 376 398 435 403 428 441 455 481 601
Total Enrollment 5,558 5,445 5,564 5,498 5,999 6,275 6,113 5,910 5,769 5,978
Students of Color Total 692 700 686 719 786 796 823 852 913 1,001
Students of Color as % of Total 12% 13% 12% 13% 13% 13% 13% 14% 16% 17%
2005 2006 2007 2008 2009 2010 2011 2012 2013 2014
Asian 4.4% 4.5% 4.3% 4.7% 4.7% 4.3% 4.0% 4.1% 4.0% 3.9%
Native Hawaiian/Pacific Islander 0.0% 0.0% 0.0% 0.0% 0.0% 0.0% 0.0% 0.1% 0.1% 0.1%
Black/African American 2.2% 2.3% 2.4% 2.5% 2.4% 2.0% 2.4% 2.5% 2.6% 2.7%
Hispanic/Latino 5.4% 5.5% 5.1% 5.3% 5.5% 5.7% 5.9% 6.3% 7.2% 7.9%
American Indian/Alaska Native 0.5% 0.6% 0.6% 0.6% 0.6% 0.7% 0.6% 0.6% 0.6% 0.4%
More than one race 0.0% 0.0% 0.0% 0.0% 0.0% 0.0% 0.5% 0.9% 1.4% 1.7%
White/Unknown 81.3% 80.2% 80.5% 79.0% 80.2% 80.5% 79.3% 77.9% 75.8% 73.2%International 6.2% 6.9% 7.2% 7.9% 6.7% 6.8% 7.2% 7.7% 8.3% 10.1%
The numbers and proportions of graduate students of color have consistently increased over the last several years, peaking at
1,001 and 17% in Fall 2014.
Fall 2011 and later racial/ethnic category counts follow IPEDS reporting rules, and represent only those who selected that single category alone. Individuals
244 243 239 260 283 267 247 242 232 234
3 6 3 7
122 126 133 135 142 125 148 146 148 160
298 298 283 293
328 358 360 370 414 472
28 33 31 31
33 46 35 35 33
25
30 53 83
103
692 700 686 719
786 796 823
852 913
1,001
0
200
400
600
800
1,000
1,200
2005 2006 2007 2008 2009 2010 2011 2012 2013 2014
Fall Semester
Asian Native Hawaiian/Pacific Islander Black/African American
Hispanic/Latino American Indian/Alaska Native More than one race
2014-15 Diversity Report. Available at: www.cu.edu/office-academic-affairs/diversity-reports65
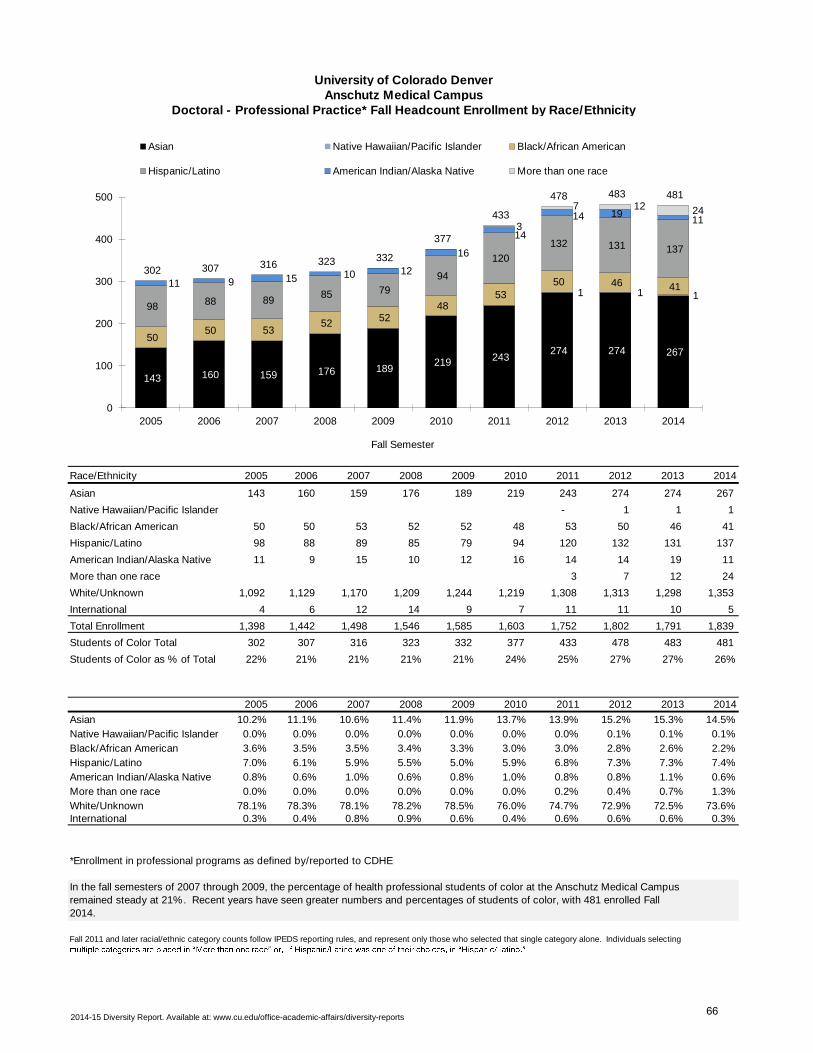
University of Colorado DenverAnschutz Medical Campus
Doctoral - Professional Practice* Fall Headcount Enrollment by Race/Ethnicity
Race/Ethnicity 2005 2006 2007 2008 2009 2010 2011 2012 2013 2014
Asian 143 160 159 176 189 219 243 274 274 267
Native Hawaiian/Pacific Islander - 1 1 1
Black/African American 50 50 53 52 52 48 53 50 46 41
Hispanic/Latino 98 88 89 85 79 94 120 132 131 137
American Indian/Alaska Native 11 9 15 10 12 16 14 14 19 11
More than one race 3 7 12 24
White/Unknown 1,092 1,129 1,170 1,209 1,244 1,219 1,308 1,313 1,298 1,353
International 4 6 12 14 9 7 11 11 10 5
Total Enrollment 1,398 1,442 1,498 1,546 1,585 1,603 1,752 1,802 1,791 1,839
Students of Color Total 302 307 316 323 332 377 433 478 483 481
Students of Color as % of Total 22% 21% 21% 21% 21% 24% 25% 27% 27% 26%
2005 2006 2007 2008 2009 2010 2011 2012 2013 2014
Asian 10.2% 11.1% 10.6% 11.4% 11.9% 13.7% 13.9% 15.2% 15.3% 14.5%
Native Hawaiian/Pacific Islander 0.0% 0.0% 0.0% 0.0% 0.0% 0.0% 0.0% 0.1% 0.1% 0.1%
Black/African American 3.6% 3.5% 3.5% 3.4% 3.3% 3.0% 3.0% 2.8% 2.6% 2.2%
Hispanic/Latino 7.0% 6.1% 5.9% 5.5% 5.0% 5.9% 6.8% 7.3% 7.3% 7.4%
American Indian/Alaska Native 0.8% 0.6% 1.0% 0.6% 0.8% 1.0% 0.8% 0.8% 1.1% 0.6%
More than one race 0.0% 0.0% 0.0% 0.0% 0.0% 0.0% 0.2% 0.4% 0.7% 1.3%
White/Unknown 78.1% 78.3% 78.1% 78.2% 78.5% 76.0% 74.7% 72.9% 72.5% 73.6%International 0.3% 0.4% 0.8% 0.9% 0.6% 0.4% 0.6% 0.6% 0.6% 0.3%
*Enrollment in professional programs as defined by/reported to CDHE
In the fall semesters of 2007 through 2009, the percentage of health professional students of color at the Anschutz Medical Campus
remained steady at 21%. Recent years have seen greater numbers and percentages of students of color, with 481 enrolled Fall
2014.
Fall 2011 and later racial/ethnic category counts follow IPEDS reporting rules, and represent only those who selected that single category alone. Individuals selecting
143 160 159 176 189 219 243
274 274 267
-
1 1 1
50 50 53
52 52
48 53
50 46 41
98 88 89 85 79
94
120
132 131 137
11 9 15 10 12
16
14
14 19 11
3
7 12 24
302 307 316 323 332
377
433
478 483 481
0
100
200
300
400
500
2005 2006 2007 2008 2009 2010 2011 2012 2013 2014
Fall Semester
Asian Native Hawaiian/Pacific Islander Black/African American
Hispanic/Latino American Indian/Alaska Native More than one race
2014-15 Diversity Report. Available at: www.cu.edu/office-academic-affairs/diversity-reports66
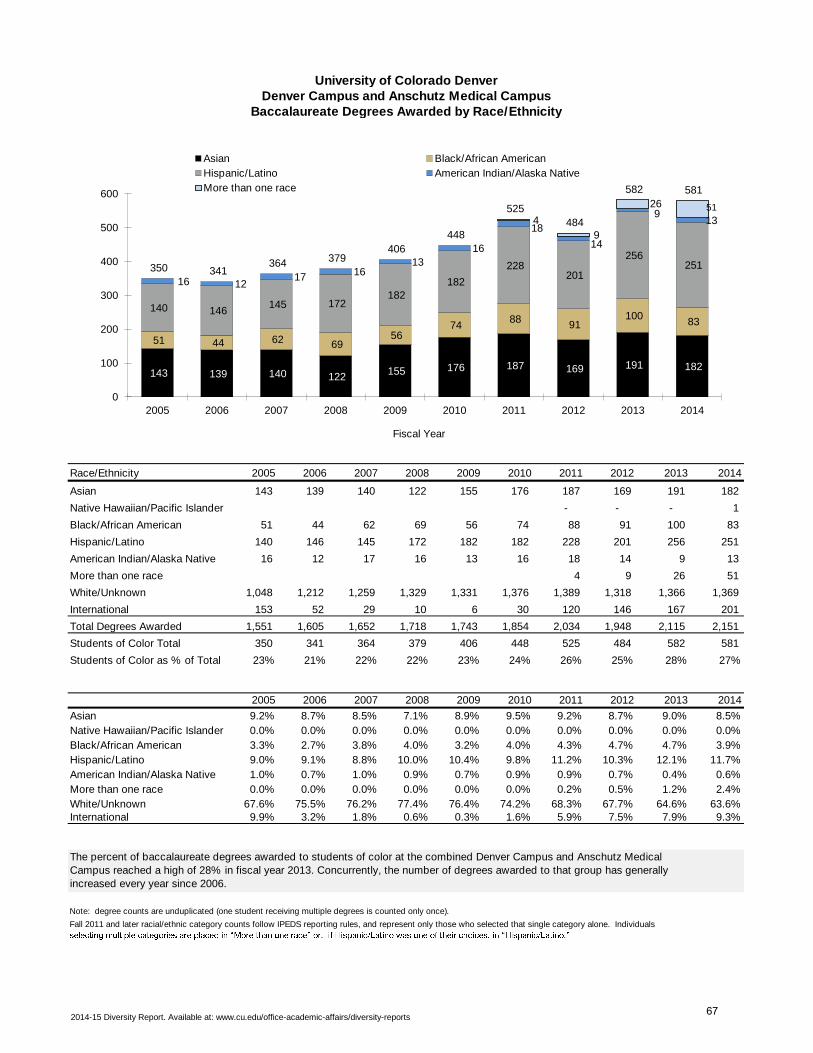
University of Colorado DenverDenver Campus and Anschutz Medical Campus
Baccalaureate Degrees Awarded by Race/Ethnicity
Race/Ethnicity 2005 2006 2007 2008 2009 2010 2011 2012 2013 2014
Asian 143 139 140 122 155 176 187 169 191 182
Native Hawaiian/Pacific Islander - - - 1
Black/African American 51 44 62 69 56 74 88 91 100 83
Hispanic/Latino 140 146 145 172 182 182 228 201 256 251
American Indian/Alaska Native 16 12 17 16 13 16 18 14 9 13
More than one race 4 9 26 51
White/Unknown 1,048 1,212 1,259 1,329 1,331 1,376 1,389 1,318 1,366 1,369
International 153 52 29 10 6 30 120 146 167 201
Total Degrees Awarded 1,551 1,605 1,652 1,718 1,743 1,854 2,034 1,948 2,115 2,151
Students of Color Total 350 341 364 379 406 448 525 484 582 581
Students of Color as % of Total 23% 21% 22% 22% 23% 24% 26% 25% 28% 27%
2005 2006 2007 2008 2009 2010 2011 2012 2013 2014
Asian 9.2% 8.7% 8.5% 7.1% 8.9% 9.5% 9.2% 8.7% 9.0% 8.5%
Native Hawaiian/Pacific Islander 0.0% 0.0% 0.0% 0.0% 0.0% 0.0% 0.0% 0.0% 0.0% 0.0%
Black/African American 3.3% 2.7% 3.8% 4.0% 3.2% 4.0% 4.3% 4.7% 4.7% 3.9%
Hispanic/Latino 9.0% 9.1% 8.8% 10.0% 10.4% 9.8% 11.2% 10.3% 12.1% 11.7%
American Indian/Alaska Native 1.0% 0.7% 1.0% 0.9% 0.7% 0.9% 0.9% 0.7% 0.4% 0.6%
More than one race 0.0% 0.0% 0.0% 0.0% 0.0% 0.0% 0.2% 0.5% 1.2% 2.4%
White/Unknown 67.6% 75.5% 76.2% 77.4% 76.4% 74.2% 68.3% 67.7% 64.6% 63.6%International 9.9% 3.2% 1.8% 0.6% 0.3% 1.6% 5.9% 7.5% 7.9% 9.3%
Note: degree counts are unduplicated (one student receiving multiple degrees is counted only once).
The percent of baccalaureate degrees awarded to students of color at the combined Denver Campus and Anschutz Medical
Campus reached a high of 28% in fiscal year 2013. Concurrently, the number of degrees awarded to that group has generally
increased every year since 2006.
Fall 2011 and later racial/ethnic category counts follow IPEDS reporting rules, and represent only those who selected that single category alone. Individuals
143 139 140 122 155 176 187 169 191 182
51 44 62 69 56
74 88
91 100
83
140 146 145 172
182 182
228 201
256 251
16 12 17 16
13
16
18
14
9 13 4
9
26 51
350 341 364 379
406
448
525
484
582 581
0
100
200
300
400
500
600
2005 2006 2007 2008 2009 2010 2011 2012 2013 2014
Fiscal Year
Asian Black/African American
Hispanic/Latino American Indian/Alaska Native
More than one race
2014-15 Diversity Report. Available at: www.cu.edu/office-academic-affairs/diversity-reports67
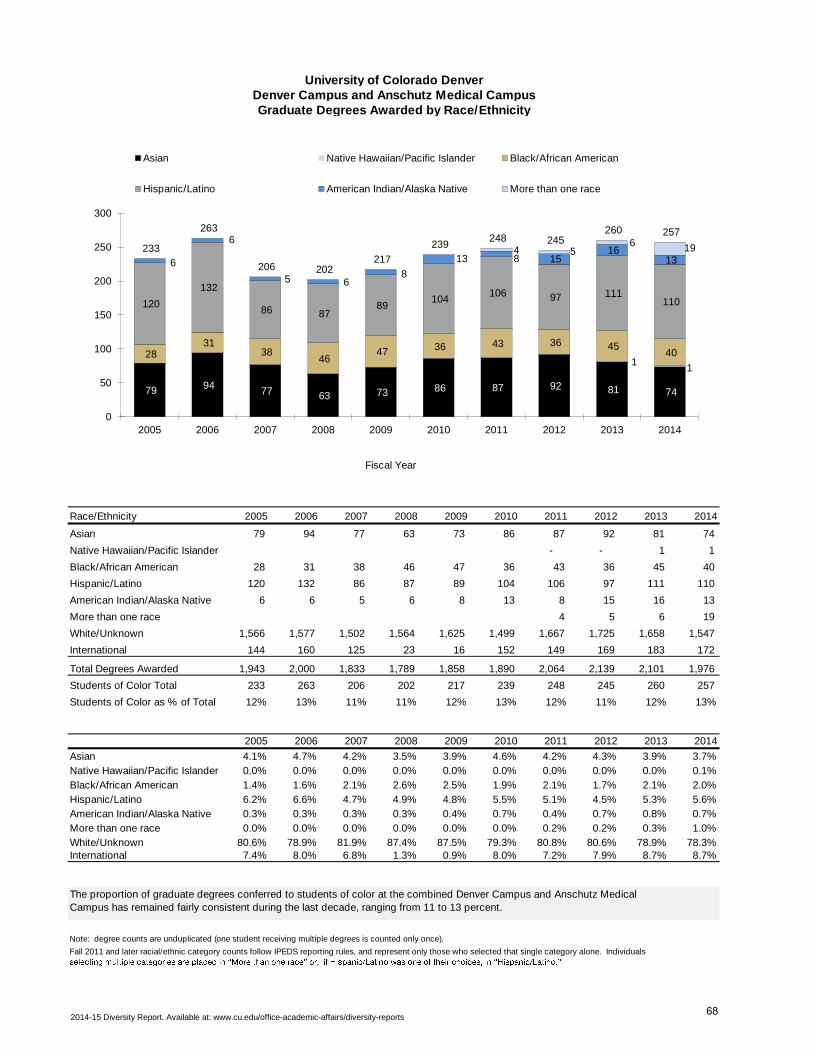
University of Colorado DenverDenver Campus and Anschutz Medical CampusGraduate Degrees Awarded by Race/Ethnicity
Race/Ethnicity 2005 2006 2007 2008 2009 2010 2011 2012 2013 2014
Asian 79 94 77 63 73 86 87 92 81 74
Native Hawaiian/Pacific Islander - - 1 1
Black/African American 28 31 38 46 47 36 43 36 45 40
Hispanic/Latino 120 132 86 87 89 104 106 97 111 110
American Indian/Alaska Native 6 6 5 6 8 13 8 15 16 13
More than one race 4 5 6 19
White/Unknown 1,566 1,577 1,502 1,564 1,625 1,499 1,667 1,725 1,658 1,547
International 144 160 125 23 16 152 149 169 183 172
Total Degrees Awarded 1,943 2,000 1,833 1,789 1,858 1,890 2,064 2,139 2,101 1,976
Students of Color Total 233 263 206 202 217 239 248 245 260 257
Students of Color as % of Total 12% 13% 11% 11% 12% 13% 12% 11% 12% 13%
2005 2006 2007 2008 2009 2010 2011 2012 2013 2014
Asian 4.1% 4.7% 4.2% 3.5% 3.9% 4.6% 4.2% 4.3% 3.9% 3.7%
Native Hawaiian/Pacific Islander 0.0% 0.0% 0.0% 0.0% 0.0% 0.0% 0.0% 0.0% 0.0% 0.1%
Black/African American 1.4% 1.6% 2.1% 2.6% 2.5% 1.9% 2.1% 1.7% 2.1% 2.0%
Hispanic/Latino 6.2% 6.6% 4.7% 4.9% 4.8% 5.5% 5.1% 4.5% 5.3% 5.6%
American Indian/Alaska Native 0.3% 0.3% 0.3% 0.3% 0.4% 0.7% 0.4% 0.7% 0.8% 0.7%
More than one race 0.0% 0.0% 0.0% 0.0% 0.0% 0.0% 0.2% 0.2% 0.3% 1.0%
White/Unknown 80.6% 78.9% 81.9% 87.4% 87.5% 79.3% 80.8% 80.6% 78.9% 78.3%International 7.4% 8.0% 6.8% 1.3% 0.9% 8.0% 7.2% 7.9% 8.7% 8.7%
Note: degree counts are unduplicated (one student receiving multiple degrees is counted only once).
The proportion of graduate degrees conferred to students of color at the combined Denver Campus and Anschutz Medical
Campus has remained fairly consistent during the last decade, ranging from 11 to 13 percent.
Fall 2011 and later racial/ethnic category counts follow IPEDS reporting rules, and represent only those who selected that single category alone. Individuals
79 94 77 63 73 86 87 92 81 74
- - 1
1
28 31
38 46
47 36 43 36 45 40
120
132
86 87 89
104 106 97 111
110
6
6
5 6 8
13 8 15 16
13 4 5
6 19 233
263
206 202 217
239 248 245
260 257
0
50
100
150
200
250
300
2005 2006 2007 2008 2009 2010 2011 2012 2013 2014
Fiscal Year
Asian Native Hawaiian/Pacific Islander Black/African American
Hispanic/Latino American Indian/Alaska Native More than one race
2014-15 Diversity Report. Available at: www.cu.edu/office-academic-affairs/diversity-reports68
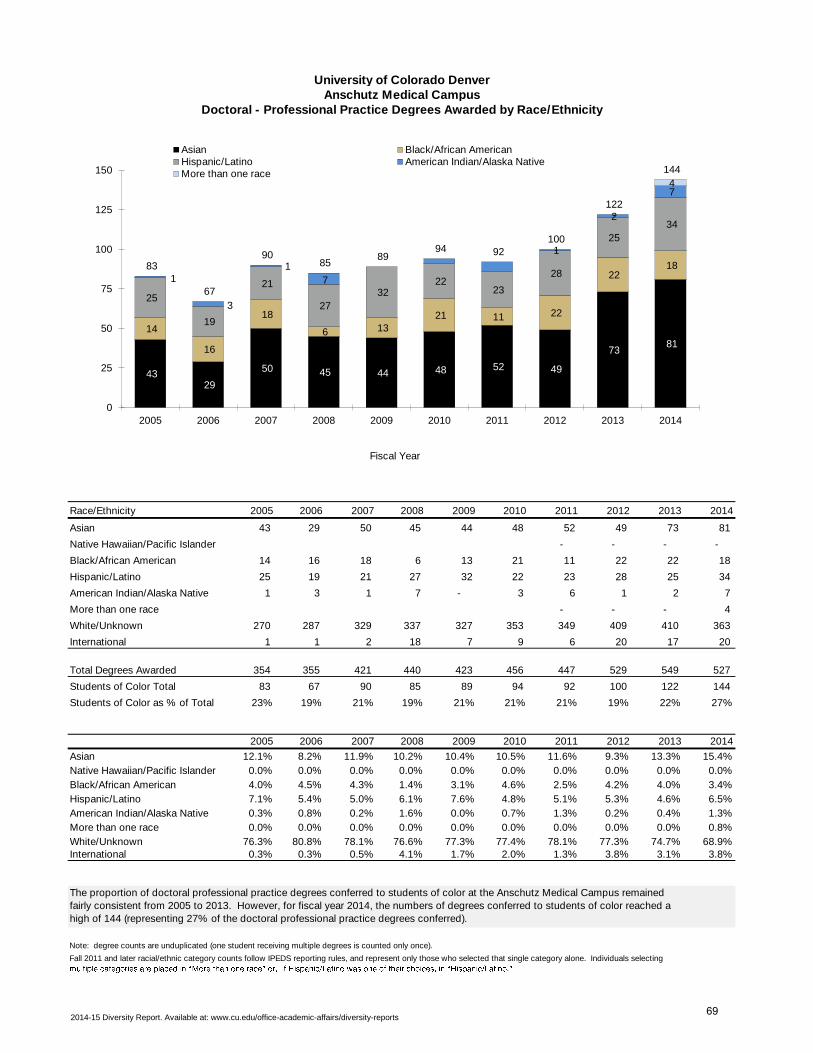
University of Colorado DenverAnschutz Medical Campus
Doctoral - Professional Practice Degrees Awarded by Race/Ethnicity
Race/Ethnicity 2005 2006 2007 2008 2009 2010 2011 2012 2013 2014
Asian 43 29 50 45 44 48 52 49 73 81
Native Hawaiian/Pacific Islander - - - -
Black/African American 14 16 18 6 13 21 11 22 22 18
Hispanic/Latino 25 19 21 27 32 22 23 28 25 34
American Indian/Alaska Native 1 3 1 7 - 3 6 1 2 7
More than one race - - - 4
White/Unknown 270 287 329 337 327 353 349 409 410 363
International 1 1 2 18 7 9 6 20 17 20
Total Degrees Awarded 354 355 421 440 423 456 447 529 549 527
Students of Color Total 83 67 90 85 89 94 92 100 122 144
Students of Color as % of Total 23% 19% 21% 19% 21% 21% 21% 19% 22% 27%
2005 2006 2007 2008 2009 2010 2011 2012 2013 2014
Asian 12.1% 8.2% 11.9% 10.2% 10.4% 10.5% 11.6% 9.3% 13.3% 15.4%
Native Hawaiian/Pacific Islander 0.0% 0.0% 0.0% 0.0% 0.0% 0.0% 0.0% 0.0% 0.0% 0.0%
Black/African American 4.0% 4.5% 4.3% 1.4% 3.1% 4.6% 2.5% 4.2% 4.0% 3.4%
Hispanic/Latino 7.1% 5.4% 5.0% 6.1% 7.6% 4.8% 5.1% 5.3% 4.6% 6.5%
American Indian/Alaska Native 0.3% 0.8% 0.2% 1.6% 0.0% 0.7% 1.3% 0.2% 0.4% 1.3%
More than one race 0.0% 0.0% 0.0% 0.0% 0.0% 0.0% 0.0% 0.0% 0.0% 0.8%
White/Unknown 76.3% 80.8% 78.1% 76.6% 77.3% 77.4% 78.1% 77.3% 74.7% 68.9%International 0.3% 0.3% 0.5% 4.1% 1.7% 2.0% 1.3% 3.8% 3.1% 3.8%
Note: degree counts are unduplicated (one student receiving multiple degrees is counted only once).
Fall 2011 and later racial/ethnic category counts follow IPEDS reporting rules, and represent only those who selected that single category alone. Individuals selecting
The proportion of doctoral professional practice degrees conferred to students of color at the Anschutz Medical Campus remained
fairly consistent from 2005 to 2013. However, for fiscal year 2014, the numbers of degrees conferred to students of color reached a
high of 144 (representing 27% of the doctoral professional practice degrees conferred).
43 29
50 45 44 48 52 49
73 81
14
16
18
6 13 21 11 22
22 18
25
19
21
27
32 22
23
28
25
34
1
3
1
7
1
2
7
-
-
4
83
67
90 85
89 94 92
100
122
144
0
25
50
75
100
125
150
2005 2006 2007 2008 2009 2010 2011 2012 2013 2014
Fiscal Year
Asian Black/African AmericanHispanic/Latino American Indian/Alaska NativeMore than one race
2014-15 Diversity Report. Available at: www.cu.edu/office-academic-affairs/diversity-reports69
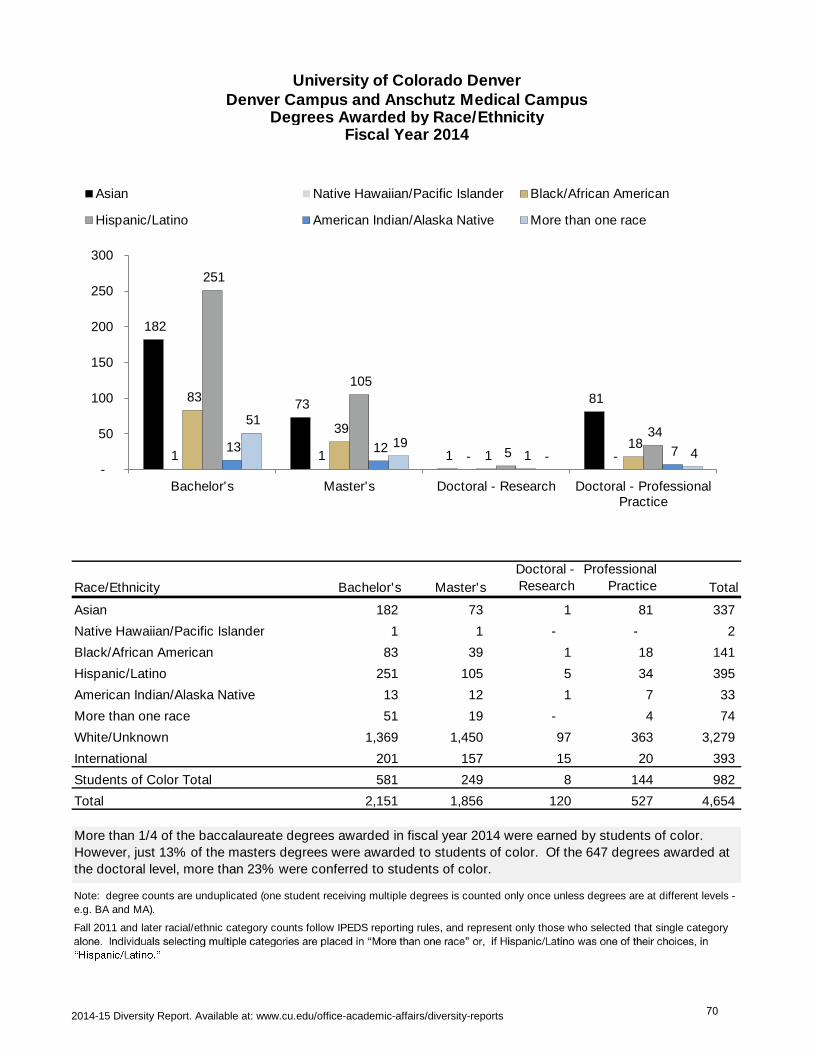
University of Colorado DenverDenver Campus and Anschutz Medical Campus
Degrees Awarded by Race/EthnicityFiscal Year 2014
Race/Ethnicity Bachelor's Master's
Doctoral -
Research
Doctoral -
Professional
Practice Total
Asian 182 73 1 81 337
Native Hawaiian/Pacific Islander 1 1 - - 2
Black/African American 83 39 1 18 141
Hispanic/Latino 251 105 5 34 395
American Indian/Alaska Native 13 12 1 7 33
More than one race 51 19 - 4 74
White/Unknown 1,369 1,450 97 363 3,279
International 201 157 15 20 393
Students of Color Total 581 249 8 144 982
Total 2,151 1,856 120 527 4,654
More than 1/4 of the baccalaureate degrees awarded in fiscal year 2014 were earned by students of color.
However, just 13% of the masters degrees were awarded to students of color. Of the 647 degrees awarded at
the doctoral level, more than 23% were conferred to students of color.
Fall 2011 and later racial/ethnic category counts follow IPEDS reporting rules, and represent only those who selected that single category
Note: degree counts are unduplicated (one student receiving multiple degrees is counted only once unless degrees are at different levels -
e.g. BA and MA).
182
73
1
81
1 1 - -
83
39
1 18
251
105
5
34 13 12
1 7
51
19 - 4
-
50
100
150
200
250
300
Bachelor's Master's Doctoral - Research Doctoral - ProfessionalPractice
Asian Native Hawaiian/Pacific Islander Black/African American
Hispanic/Latino American Indian/Alaska Native More than one race
2014-15 Diversity Report. Available at: www.cu.edu/office-academic-affairs/diversity-reports 70
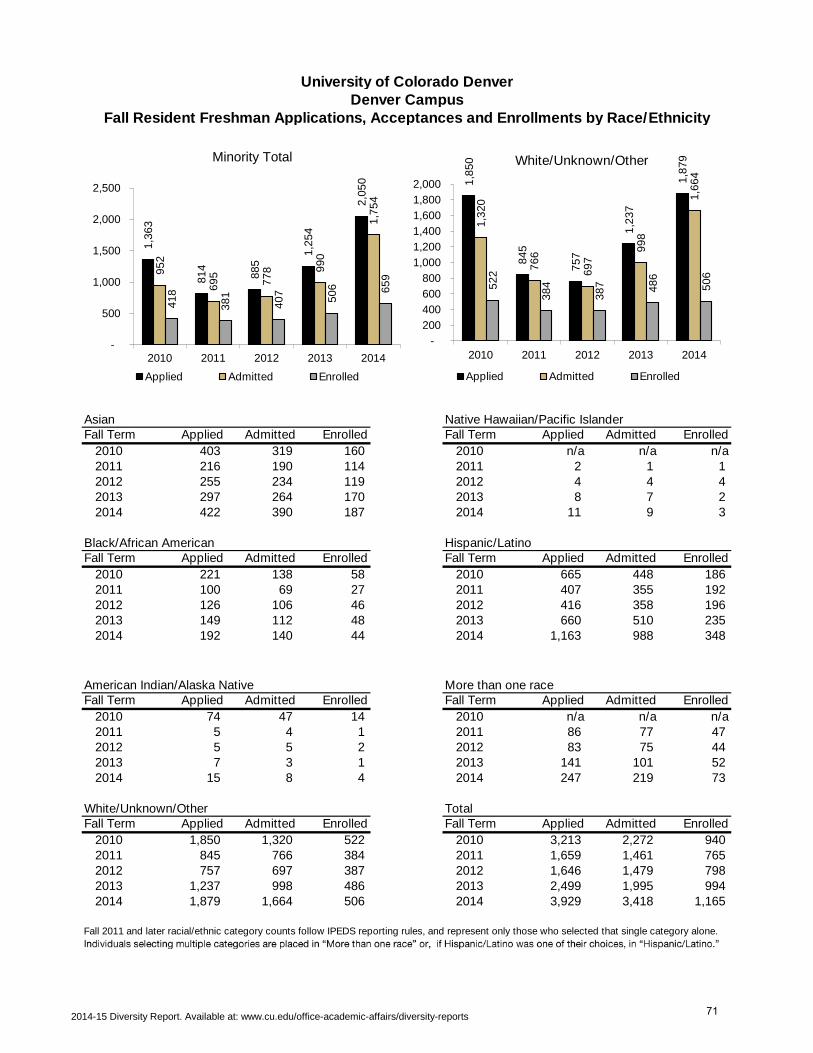
University of Colorado DenverDenver Campus
Fall Resident Freshman Applications, Acceptances and Enrollments by Race/Ethnicity
Asian Native Hawaiian/Pacific IslanderFall Term Applied Admitted Enrolled Fall Term Applied Admitted Enrolled
2010 403 319 160 2010 n/a n/a n/a2011 216 190 114 2011 2 1 1 2012 255 234 119 2012 4 4 4 2013 297 264 170 2013 8 7 2 2014 422 390 187 2014 11 9 3
Black/African American Hispanic/LatinoFall Term Applied Admitted Enrolled Fall Term Applied Admitted Enrolled
2010 221 138 58 2010 665 448 186 2011 100 69 27 2011 407 355 192 2012 126 106 46 2012 416 358 196 2013 149 112 48 2013 660 510 235 2014 192 140 44 2014 1,163 988 348
American Indian/Alaska Native More than one raceFall Term Applied Admitted Enrolled Fall Term Applied Admitted Enrolled
2010 74 47 14 2010 n/a n/a n/a2011 5 4 1 2011 86 77 47 2012 5 5 2 2012 83 75 44 2013 7 3 1 2013 141 101 52 2014 15 8 4 2014 247 219 73
White/Unknown/Other TotalFall Term Applied Admitted Enrolled Fall Term Applied Admitted Enrolled
2010 1,850 1,320 522 2010 3,213 2,272 940 2011 845 766 384 2011 1,659 1,461 765 2012 757 697 387 2012 1,646 1,479 798 2013 1,237 998 486 2013 2,499 1,995 994 2014 1,879 1,664 506 2014 3,929 3,418 1,165
Fall 2011 and later racial/ethnic category counts follow IPEDS reporting rules, and represent only those who selected that single category alone.
1,3
63
81
4
88
5 1
,25
4
2,0
50
95
2
69
5
77
8
99
0
1,7
54
41
8
38
1
40
7
50
6
65
9
-
500
1,000
1,500
2,000
2,500
2010 2011 2012 2013 2014
Minority Total
Applied Admitted Enrolled
1,8
50
84
5
75
7
1,2
37
1,8
79
1,3
20
76
6
69
7 9
98
1,6
64
52
2
38
4
38
7
48
6
50
6
-
200
400
600
800
1,000
1,200
1,400
1,600
1,800
2,000
2010 2011 2012 2013 2014
White/Unknown/Other
Applied Admitted Enrolled
2014-15 Diversity Report. Available at: www.cu.edu/office-academic-affairs/diversity-reports71
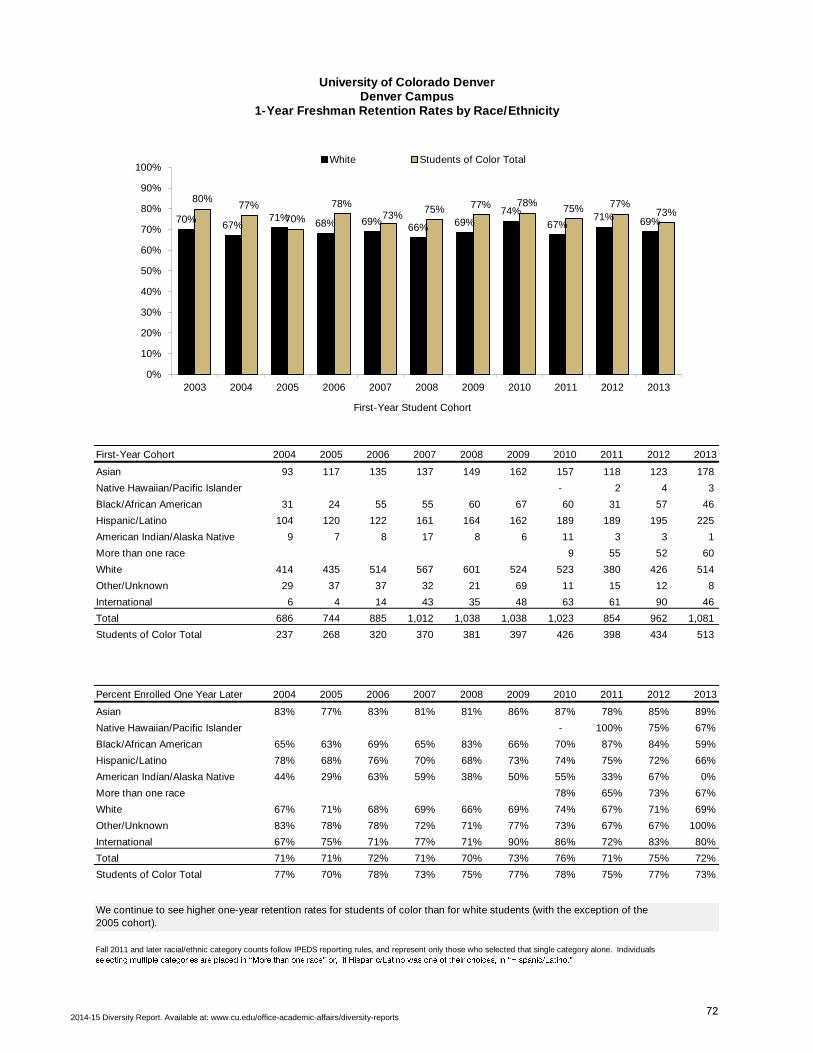
University of Colorado DenverDenver Campus
1-Year Freshman Retention Rates by Race/Ethnicity
First-Year Cohort 2004 2005 2006 2007 2008 2009 2010 2011 2012 2013
Asian 93 117 135 137 149 162 157 118 123 178
Native Hawaiian/Pacific Islander - 2 4 3
Black/African American 31 24 55 55 60 67 60 31 57 46
Hispanic/Latino 104 120 122 161 164 162 189 189 195 225
American Indian/Alaska Native 9 7 8 17 8 6 11 3 3 1
More than one race 9 55 52 60
White 414 435 514 567 601 524 523 380 426 514
Other/Unknown 29 37 37 32 21 69 11 15 12 8
International 6 4 14 43 35 48 63 61 90 46
Total 686 744 885 1,012 1,038 1,038 1,023 854 962 1,081
Students of Color Total 237 268 320 370 381 397 426 398 434 513
Percent Enrolled One Year Later 2004 2005 2006 2007 2008 2009 2010 2011 2012 2013
Asian 83% 77% 83% 81% 81% 86% 87% 78% 85% 89%
Native Hawaiian/Pacific Islander - 100% 75% 67%
Black/African American 65% 63% 69% 65% 83% 66% 70% 87% 84% 59%
Hispanic/Latino 78% 68% 76% 70% 68% 73% 74% 75% 72% 66%
American Indian/Alaska Native 44% 29% 63% 59% 38% 50% 55% 33% 67% 0%
More than one race 78% 65% 73% 67%
White 67% 71% 68% 69% 66% 69% 74% 67% 71% 69%
Other/Unknown 83% 78% 78% 72% 71% 77% 73% 67% 67% 100%
International 67% 75% 71% 77% 71% 90% 86% 72% 83% 80%
Total 71% 71% 72% 71% 70% 73% 76% 71% 75% 72%
Students of Color Total 77% 70% 78% 73% 75% 77% 78% 75% 77% 73%
Fall 2011 and later racial/ethnic category counts follow IPEDS reporting rules, and represent only those who selected that single category alone. Individuals
We continue to see higher one-year retention rates for students of color than for white students (with the exception of the
2005 cohort).
70% 67%
71% 68% 69%
66% 69% 74%
67% 71% 69%
80% 77%
70%
78% 73%
75% 77% 78% 75% 77%
73%
0%
10%
20%
30%
40%
50%
60%
70%
80%
90%
100%
2003 2004 2005 2006 2007 2008 2009 2010 2011 2012 2013
First-Year Student Cohort
White Students of Color Total
2014-15 Diversity Report. Available at: www.cu.edu/office-academic-affairs/diversity-reports72
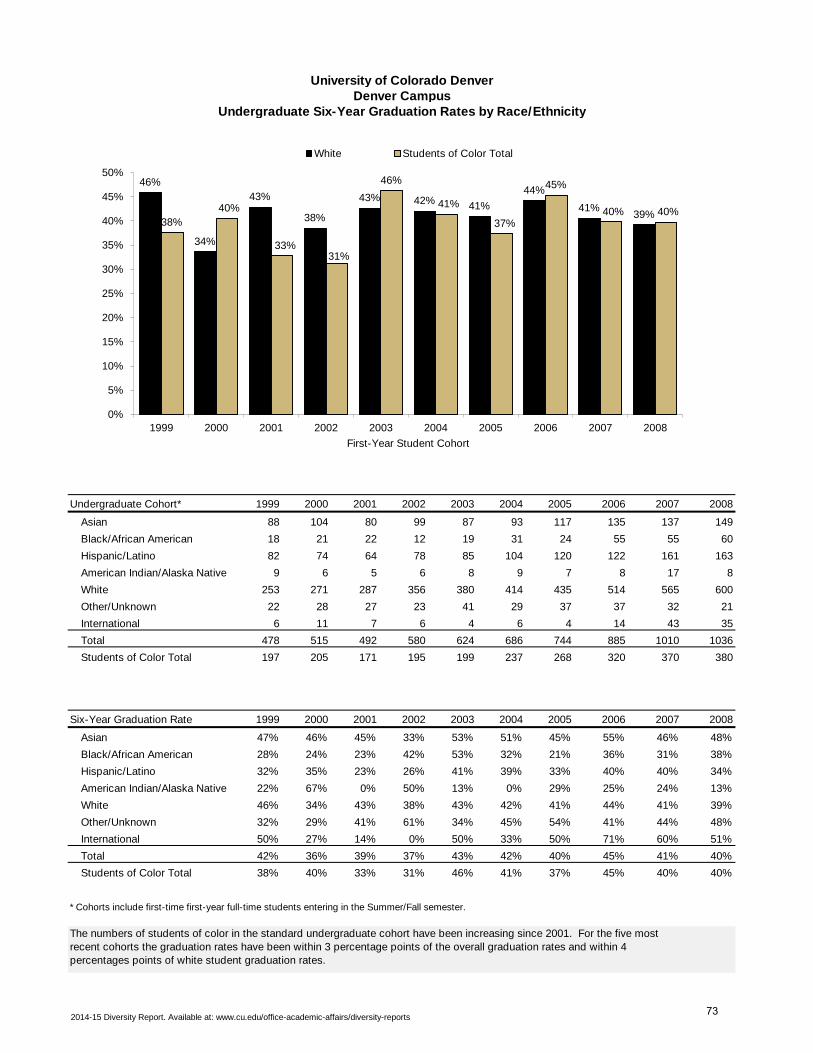
University of Colorado DenverDenver Campus
Undergraduate Six-Year Graduation Rates by Race/Ethnicity
Undergraduate Cohort* 1999 2000 2001 2002 2003 2004 2005 2006 2007 2008
Asian 88 104 80 99 87 93 117 135 137 149
Black/African American 18 21 22 12 19 31 24 55 55 60
Hispanic/Latino 82 74 64 78 85 104 120 122 161 163
American Indian/Alaska Native 9 6 5 6 8 9 7 8 17 8
White 253 271 287 356 380 414 435 514 565 600
Other/Unknown 22 28 27 23 41 29 37 37 32 21
International 6 11 7 6 4 6 4 14 43 35
Total 478 515 492 580 624 686 744 885 1010 1036
Students of Color Total 197 205 171 195 199 237 268 320 370 380
Six-Year Graduation Rate 1999 2000 2001 2002 2003 2004 2005 2006 2007 2008
Asian 47% 46% 45% 33% 53% 51% 45% 55% 46% 48%
Black/African American 28% 24% 23% 42% 53% 32% 21% 36% 31% 38%
Hispanic/Latino 32% 35% 23% 26% 41% 39% 33% 40% 40% 34%
American Indian/Alaska Native 22% 67% 0% 50% 13% 0% 29% 25% 24% 13%
White 46% 34% 43% 38% 43% 42% 41% 44% 41% 39%
Other/Unknown 32% 29% 41% 61% 34% 45% 54% 41% 44% 48%
International 50% 27% 14% 0% 50% 33% 50% 71% 60% 51%
Total 42% 36% 39% 37% 43% 42% 40% 45% 41% 40%
Students of Color Total 38% 40% 33% 31% 46% 41% 37% 45% 40% 40%
* Cohorts include first-time first-year full-time students entering in the Summer/Fall semester.
The numbers of students of color in the standard undergraduate cohort have been increasing since 2001. For the five most
recent cohorts the graduation rates have been within 3 percentage points of the overall graduation rates and within 4
percentages points of white student graduation rates.
46%
34%
43%
38%
43% 42% 41%
44%
41% 39%
38%
40%
33% 31%
46%
41%
37%
45%
40% 40%
0%
5%
10%
15%
20%
25%
30%
35%
40%
45%
50%
1999 2000 2001 2002 2003 2004 2005 2006 2007 2008
First-Year Student Cohort
White Students of Color Total
2014-15 Diversity Report. Available at: www.cu.edu/office-academic-affairs/diversity-reports73
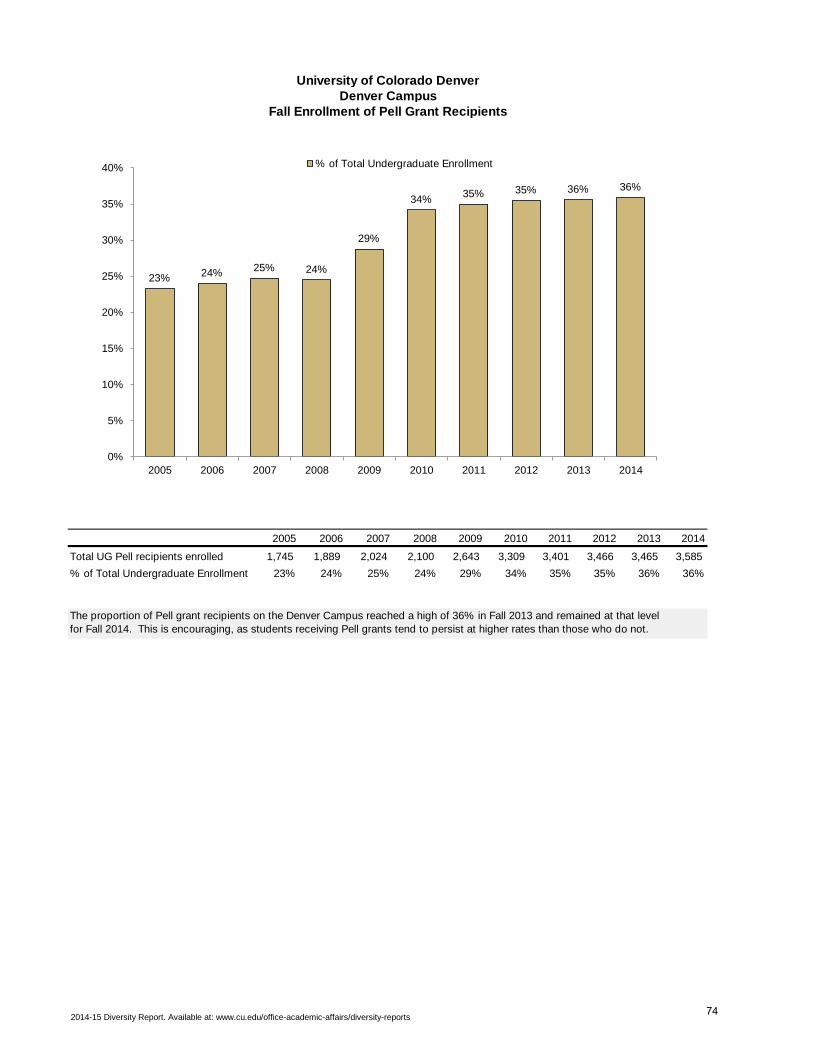
University of Colorado DenverDenver Campus
Fall Enrollment of Pell Grant Recipients
2005 2006 2007 2008 2009 2010 2011 2012 2013 2014
Total UG Pell recipients enrolled 1,745 1,889 2,024 2,100 2,643 3,309 3,401 3,466 3,465 3,585
% of Total Undergraduate Enrollment 23% 24% 25% 24% 29% 34% 35% 35% 36% 36%
The proportion of Pell grant recipients on the Denver Campus reached a high of 36% in Fall 2013 and remained at that level
for Fall 2014. This is encouraging, as students receiving Pell grants tend to persist at higher rates than those who do not.
23% 24% 25% 24%
29%
34% 35% 35% 36% 36%
0%
5%
10%
15%
20%
25%
30%
35%
40%
2005 2006 2007 2008 2009 2010 2011 2012 2013 2014
% of Total Undergraduate Enrollment
2014-15 Diversity Report. Available at: www.cu.edu/office-academic-affairs/diversity-reports74
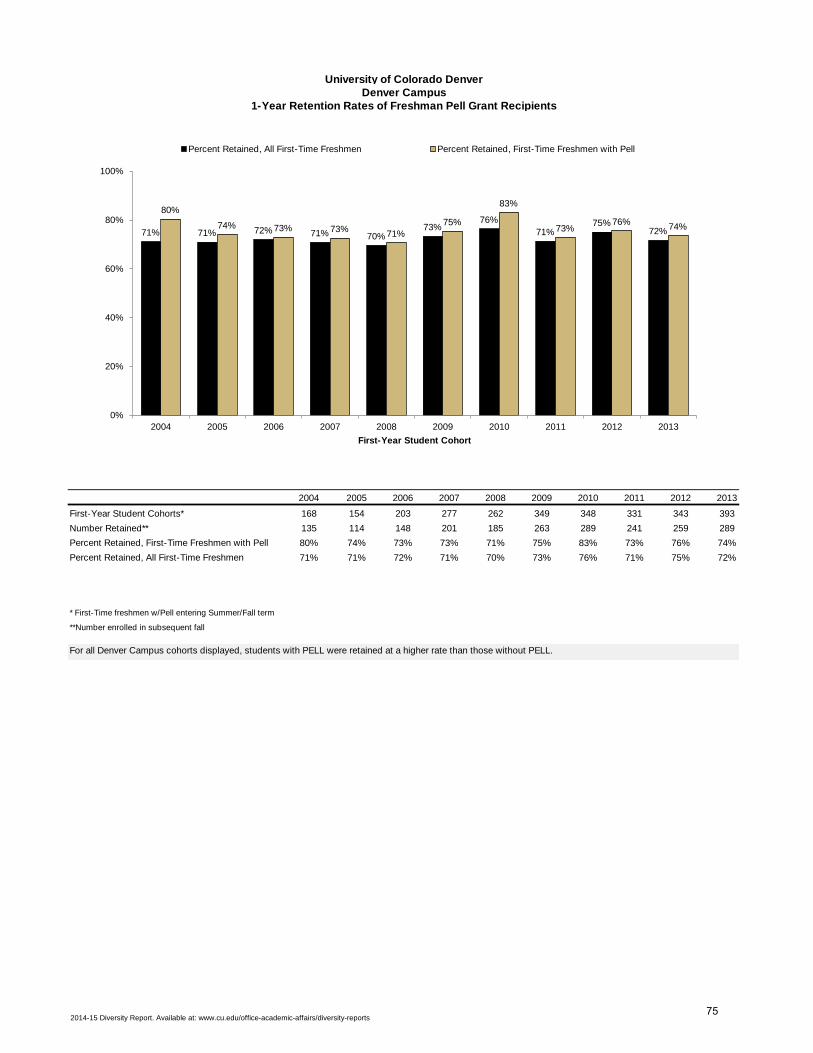
University of Colorado DenverDenver Campus
1-Year Retention Rates of Freshman Pell Grant Recipients
2004 2005 2006 2007 2008 2009 2010 2011 2012 2013
First-Year Student Cohorts* 168 154 203 277 262 349 348 331 343 393
Number Retained** 135 114 148 201 185 263 289 241 259 289
Percent Retained, First-Time Freshmen with Pell 80% 74% 73% 73% 71% 75% 83% 73% 76% 74%
Percent Retained, All First-Time Freshmen 71% 71% 72% 71% 70% 73% 76% 71% 75% 72%
* First-Time freshmen w/Pell entering Summer/Fall term
**Number enrolled in subsequent fall
For all Denver Campus cohorts displayed, students with PELL were retained at a higher rate than those without PELL.
71% 71% 72% 71% 70% 73%
76%
71% 75%
72%
80%
74% 73% 73% 71%
75%
83%
73% 76%
74%
0%
20%
40%
60%
80%
100%
2004 2005 2006 2007 2008 2009 2010 2011 2012 2013
First-Year Student Cohort
Percent Retained, All First-Time Freshmen Percent Retained, First-Time Freshmen with Pell
2014-15 Diversity Report. Available at: www.cu.edu/office-academic-affairs/diversity-reports75
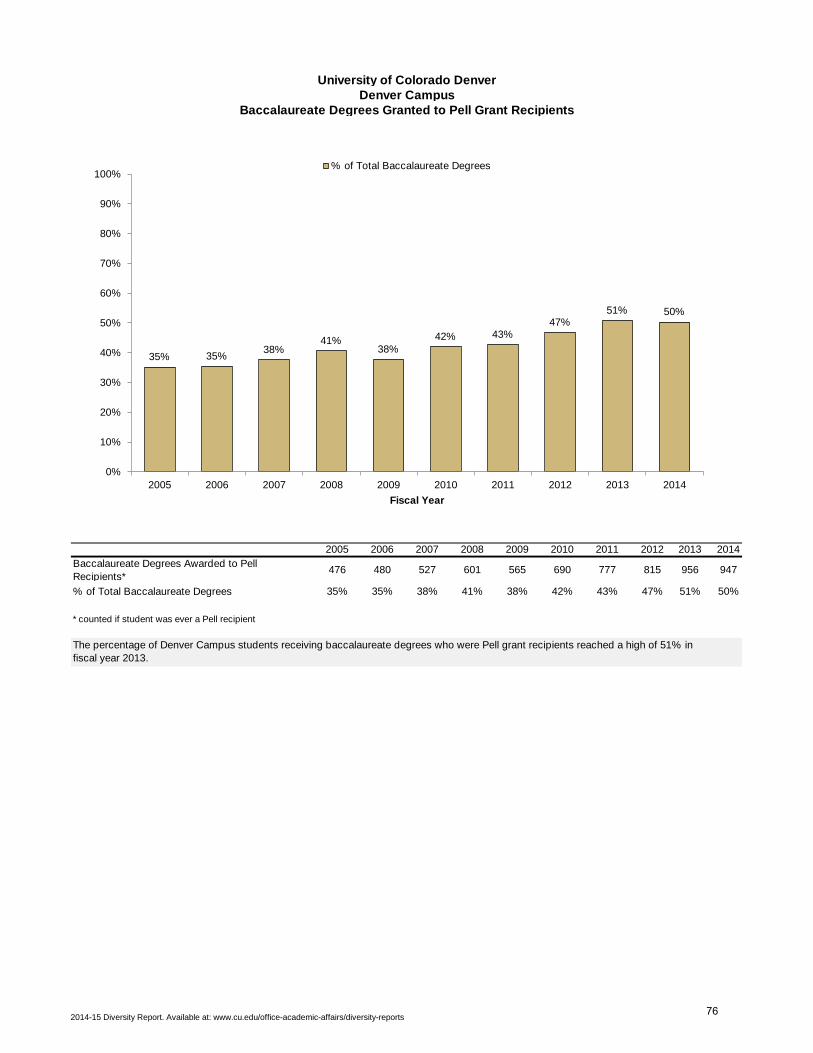
University of Colorado DenverDenver Campus
Baccalaureate Degrees Granted to Pell Grant Recipients
2005 2006 2007 2008 2009 2010 2011 2012 2013 2014
Baccalaureate Degrees Awarded to Pell
Recipients*476 480 527 601 565 690 777 815 956 947
% of Total Baccalaureate Degrees 35% 35% 38% 41% 38% 42% 43% 47% 51% 50%
* counted if student was ever a Pell recipient
The percentage of Denver Campus students receiving baccalaureate degrees who were Pell grant recipients reached a high of 51% in
fiscal year 2013.
35% 35% 38%
41% 38%
42% 43% 47%
51% 50%
0%
10%
20%
30%
40%
50%
60%
70%
80%
90%
100%
2005 2006 2007 2008 2009 2010 2011 2012 2013 2014
Fiscal Year
% of Total Baccalaureate Degrees
2014-15 Diversity Report. Available at: www.cu.edu/office-academic-affairs/diversity-reports76
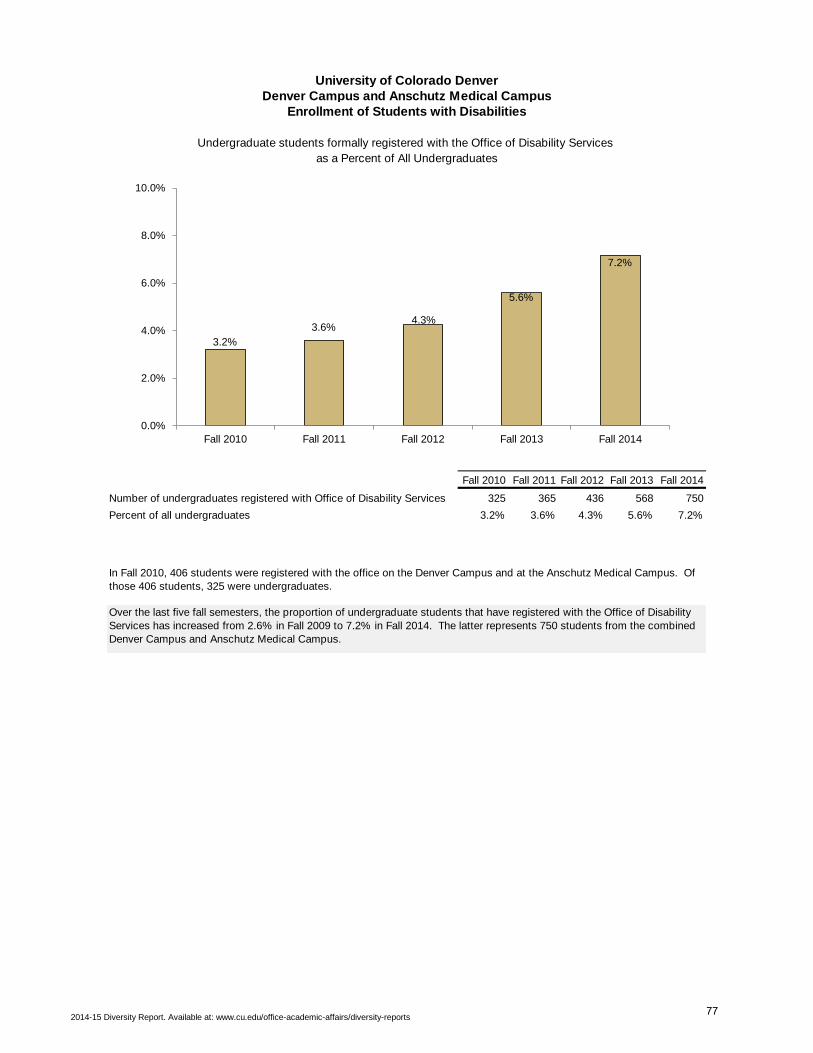
University of Colorado DenverDenver Campus and Anschutz Medical Campus
Enrollment of Students with Disabilities
Undergraduate students formally registered with the Office of Disability Services
as a Percent of All Undergraduates
Fall 2010 Fall 2011 Fall 2012 Fall 2013 Fall 2014
Number of undergraduates registered with Office of Disability Services 325 365 436 568 750
Percent of all undergraduates 3.2% 3.6% 4.3% 5.6% 7.2%
In Fall 2010, 406 students were registered with the office on the Denver Campus and at the Anschutz Medical Campus. Of
those 406 students, 325 were undergraduates.
Over the last five fall semesters, the proportion of undergraduate students that have registered with the Office of Disability
Services has increased from 2.6% in Fall 2009 to 7.2% in Fall 2014. The latter represents 750 students from the combined
Denver Campus and Anschutz Medical Campus.
3.2%
3.6% 4.3%
5.6%
7.2%
0.0%
2.0%
4.0%
6.0%
8.0%
10.0%
Fall 2010 Fall 2011 Fall 2012 Fall 2013 Fall 2014
2014-15 Diversity Report. Available at: www.cu.edu/office-academic-affairs/diversity-reports77
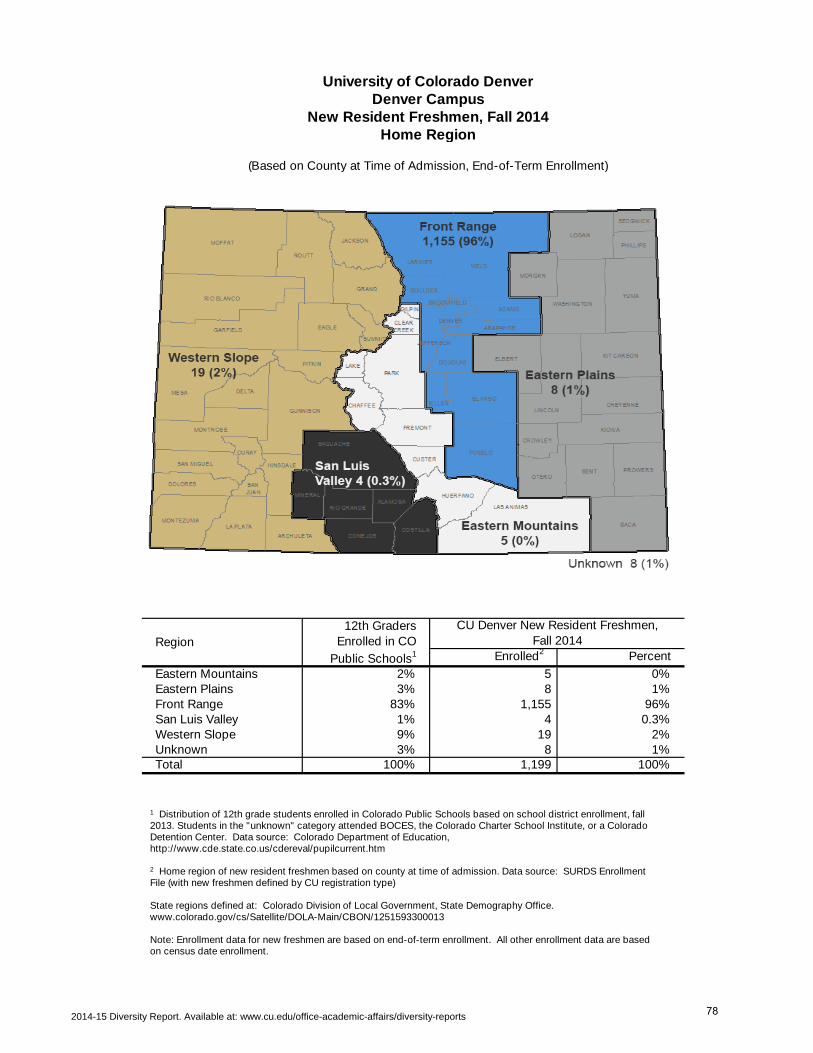
University of Colorado DenverDenver Campus
New Resident Freshmen, Fall 2014Home Region
(Based on County at Time of Admission, End-of-Term Enrollment)
CU Denver New Resident Freshmen,
Fall 2014
Enrolled2 Percent
Eastern Mountains 2% 5 0%Eastern Plains 3% 8 1%Front Range 83% 1,155 96%San Luis Valley 1% 4 0.3%Western Slope 9% 19 2%Unknown 3% 8 1%Total 100% 1,199 100%
Region
12th Graders
Enrolled in CO
Public Schools1
1 Distribution of 12th grade students enrolled in Colorado Public Schools based on school district enrollment, fall 2013. Students in the "unknown" category attended BOCES, the Colorado Charter School Institute, or a Colorado Detention Center. Data source: Colorado Department of Education, http://www.cde.state.co.us/cdereval/pupilcurrent.htm
2 Home region of new resident freshmen based on county at time of admission. Data source: SURDS Enrollment File (with new freshmen defined by CU registration type) State regions defined at: Colorado Division of Local Government, State Demography Office. www.colorado.gov/cs/Satellite/DOLA-Main/CBON/1251593300013 Note: Enrollment data for new freshmen are based on end-of-term enrollment. All other enrollment data are based on census date enrollment.
2014-15 Diversity Report. Available at: www.cu.edu/office-academic-affairs/diversity-reports78
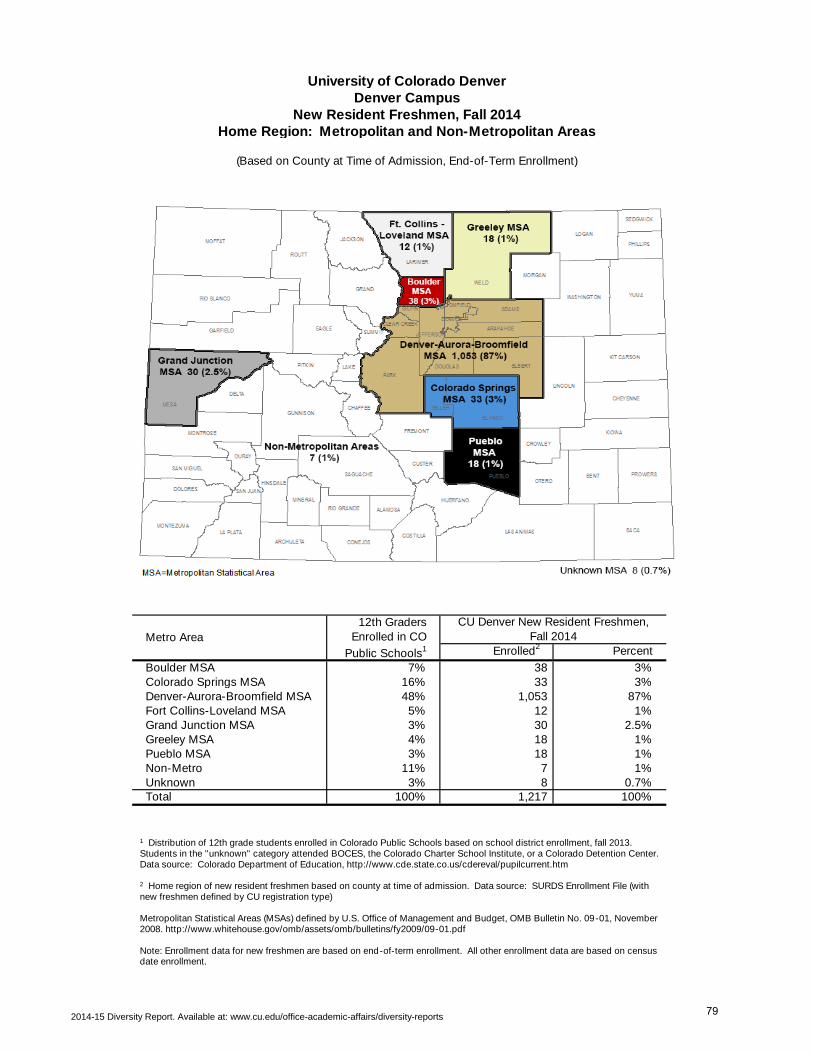
University of Colorado DenverDenver Campus
New Resident Freshmen, Fall 2014Home Region: Metropolitan and Non-Metropolitan Areas
(Based on County at Time of Admission, End-of-Term Enrollment)
CU Denver New Resident Freshmen,Fall 2014
Enrolled2 Percent
Boulder MSA 7% 38 3%Colorado Springs MSA 16% 33 3%Denver-Aurora-Broomfield MSA 48% 1,053 87%Fort Collins-Loveland MSA 5% 12 1%Grand Junction MSA 3% 30 2.5%Greeley MSA 4% 18 1%Pueblo MSA 3% 18 1%Non-Metro 11% 7 1%Unknown 3% 8 0.7%Total 100% 1,217 100%
Metro Area
12th Graders Enrolled in CO
Public Schools1
1 Distribution of 12th grade students enrolled in Colorado Public Schools based on school district enrollment, fall 2013. Students in the "unknown" category attended BOCES, the Colorado Charter School Institute, or a Colorado Detention Center. Data source: Colorado Department of Education, http://www.cde.state.co.us/cdereval/pupilcurrent.htm 2 Home region of new resident freshmen based on county at time of admission. Data source: SURDS Enrollment File (with new freshmen defined by CU registration type) Metropolitan Statistical Areas (MSAs) defined by U.S. Office of Management and Budget, OMB Bulletin No. 09-01, November 2008. http://www.whitehouse.gov/omb/assets/omb/bulletins/fy2009/09-01.pdf Note: Enrollment data for new freshmen are based on end-of-term enrollment. All other enrollment data are based on census date enrollment.
2014-15 Diversity Report. Available at: www.cu.edu/office-academic-affairs/diversity-reports79
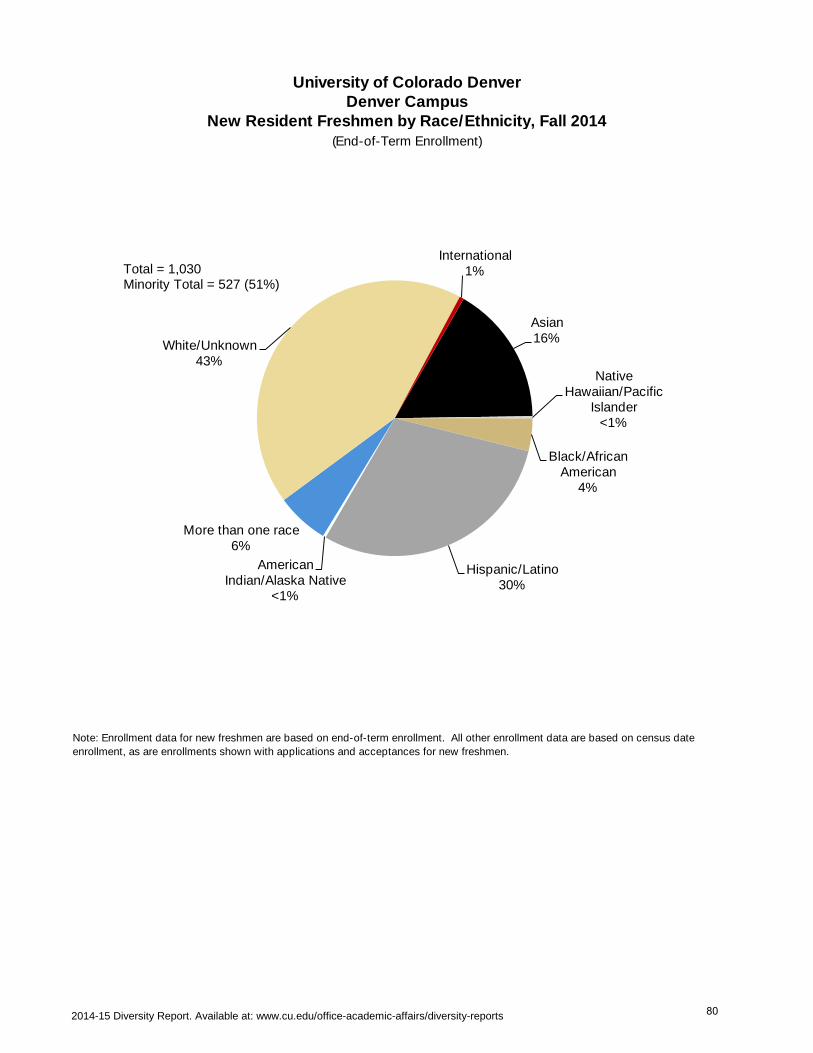
University of Colorado DenverDenver Campus
New Resident Freshmen by Race/Ethnicity, Fall 2014(End-of-Term Enrollment)
Note: Enrollment data for new freshmen are based on end-of-term enrollment. All other enrollment data are based on census date
enrollment, as are enrollments shown with applications and acceptances for new freshmen.
Asian 16%
Native Hawaiian/Pacific
Islander <1%
Black/African American
4%
Hispanic/Latino 30%
American Indian/Alaska Native
<1%
More than one race 6%
White/Unknown 43%
International 1% Total = 1,030
Minority Total = 527 (51%)
2014-15 Diversity Report. Available at: www.cu.edu/office-academic-affairs/diversity-reports 80
University of Colorado Denver | Anschutz Medical CampusFaculty and Staff Diversity
Data provided by the CU Denver | Anschutz Medical Campus Office of Institutional Research and Effectivenesswww.ucdenver.edu/ir
81
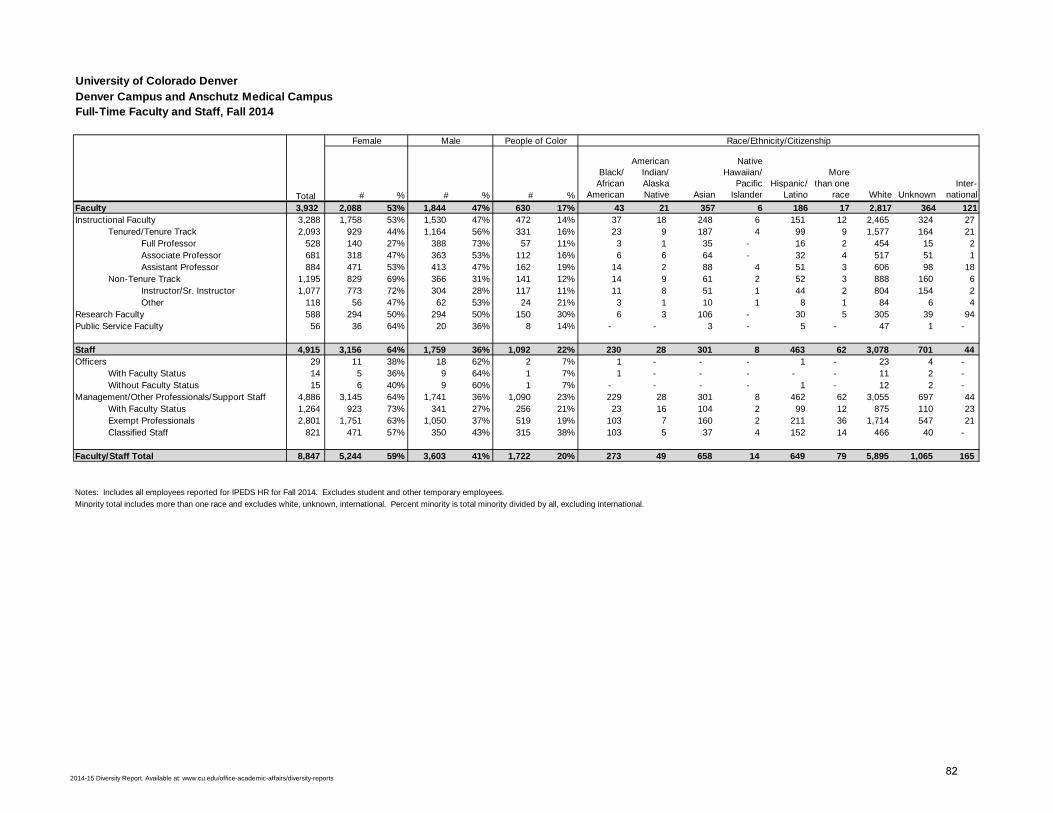
University of Colorado Denver
Denver Campus and Anschutz Medical Campus
Full-Time Faculty and Staff, Fall 2014
Female Male People of Color Race/Ethnicity/Citizenship
# % # % # %
Black/African
American
American Indian/Alaska Native Asian
Native Hawaiian/
Pacific Islander
Hispanic/Latino
More than one
race White UnknownInter-
national
Faculty 3,932 2,088 53% 1,844 47% 630 17% 43 21 357 6 186 17 2,817 364 121
Instructional Faculty 3,288 1,758 53% 1,530 47% 472 14% 37 18 248 6 151 12 2,465 324 27
Tenured/Tenure Track 2,093 929 44% 1,164 56% 331 16% 23 9 187 4 99 9 1,577 164 21
Full Professor 528 140 27% 388 73% 57 11% 3 1 35 - 16 2 454 15 2
Associate Professor 681 318 47% 363 53% 112 16% 6 6 64 - 32 4 517 51 1
Assistant Professor 884 471 53% 413 47% 162 19% 14 2 88 4 51 3 606 98 18
Non-Tenure Track 1,195 829 69% 366 31% 141 12% 14 9 61 2 52 3 888 160 6
Instructor/Sr. Instructor 1,077 773 72% 304 28% 117 11% 11 8 51 1 44 2 804 154 2
Other 118 56 47% 62 53% 24 21% 3 1 10 1 8 1 84 6 4
Research Faculty 588 294 50% 294 50% 150 30% 6 3 106 - 30 5 305 39 94
Public Service Faculty 56 36 64% 20 36% 8 14% - - 3 - 5 - 47 1 -
Staff 4,915 3,156 64% 1,759 36% 1,092 22% 230 28 301 8 463 62 3,078 701 44
Officers 29 11 38% 18 62% 2 7% 1 - - - 1 - 23 4 -
With Faculty Status 14 5 36% 9 64% 1 7% 1 - - - - - 11 2 -
Without Faculty Status 15 6 40% 9 60% 1 7% - - - - 1 - 12 2 -
Management/Other Professionals/Support Staff 4,886 3,145 64% 1,741 36% 1,090 23% 229 28 301 8 462 62 3,055 697 44
With Faculty Status 1,264 923 73% 341 27% 256 21% 23 16 104 2 99 12 875 110 23
Exempt Professionals 2,801 1,751 63% 1,050 37% 519 19% 103 7 160 2 211 36 1,714 547 21
Classified Staff 821 471 57% 350 43% 315 38% 103 5 37 4 152 14 466 40 -
Faculty/Staff Total 8,847 5,244 59% 3,603 41% 1,722 20% 273 49 658 14 649 79 5,895 1,065 165
Notes: Includes all employees reported for IPEDS HR for Fall 2014. Excludes student and other temporary employees.
Minority total includes more than one race and excludes white, unknown, international. Percent minority is total minority divided by all, excluding international.
Total
2014-15 Diversity Report. Available at: www.cu.edu/office-academic-affairs/diversity-reports82
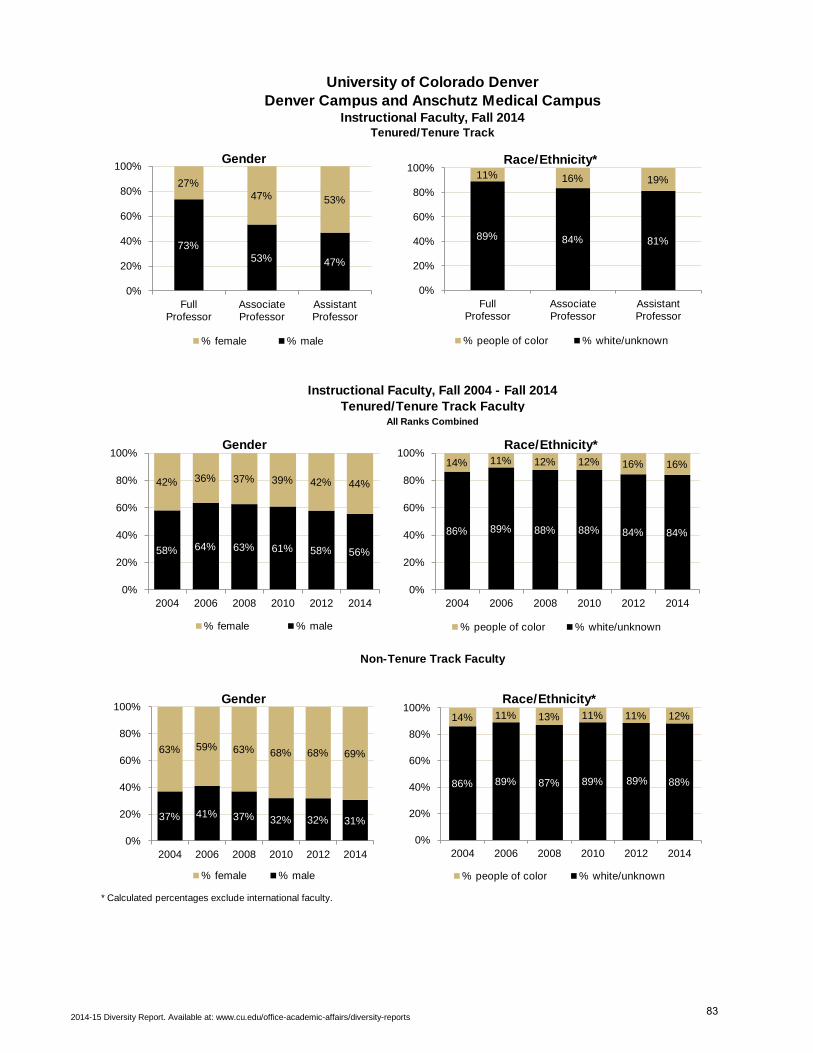
University of Colorado DenverDenver Campus and Anschutz Medical Campus
Instructional Faculty, Fall 2014Tenured/Tenure Track
Instructional Faculty, Fall 2004 - Fall 2014Tenured/Tenure Track Faculty
All Ranks Combined
Non-Tenure Track Faculty
* Calculated percentages exclude international faculty.
58% 64% 63% 61% 58% 56%
42% 36% 37% 39% 42% 44%
0%
20%
40%
60%
80%
100%
2004 2006 2008 2010 2012 2014
Gender
% female % male
86% 89% 88% 88% 84% 84%
14% 11% 12% 12% 16% 16%
0%
20%
40%
60%
80%
100%
2004 2006 2008 2010 2012 2014
Race/Ethnicity*
% people of color % white/unknown
37% 41% 37% 32% 32% 31%
63% 59% 63% 68% 68% 69%
0%
20%
40%
60%
80%
100%
2004 2006 2008 2010 2012 2014
Gender
% female % male
86% 89% 87% 89% 89% 88%
14% 11% 13% 11% 11% 12%
0%
20%
40%
60%
80%
100%
2004 2006 2008 2010 2012 2014
Race/Ethnicity*
% people of color % white/unknown
73% 53% 47%
27% 47% 53%
0%
20%
40%
60%
80%
100%
FullProfessor
AssociateProfessor
AssistantProfessor
Gender
% female % male
89% 84% 81%
11% 16% 19%
0%
20%
40%
60%
80%
100%
FullProfessor
AssociateProfessor
AssistantProfessor
Race/Ethnicity*
% people of color % white/unknown
2014-15 Diversity Report. Available at: www.cu.edu/office-academic-affairs/diversity-reports83
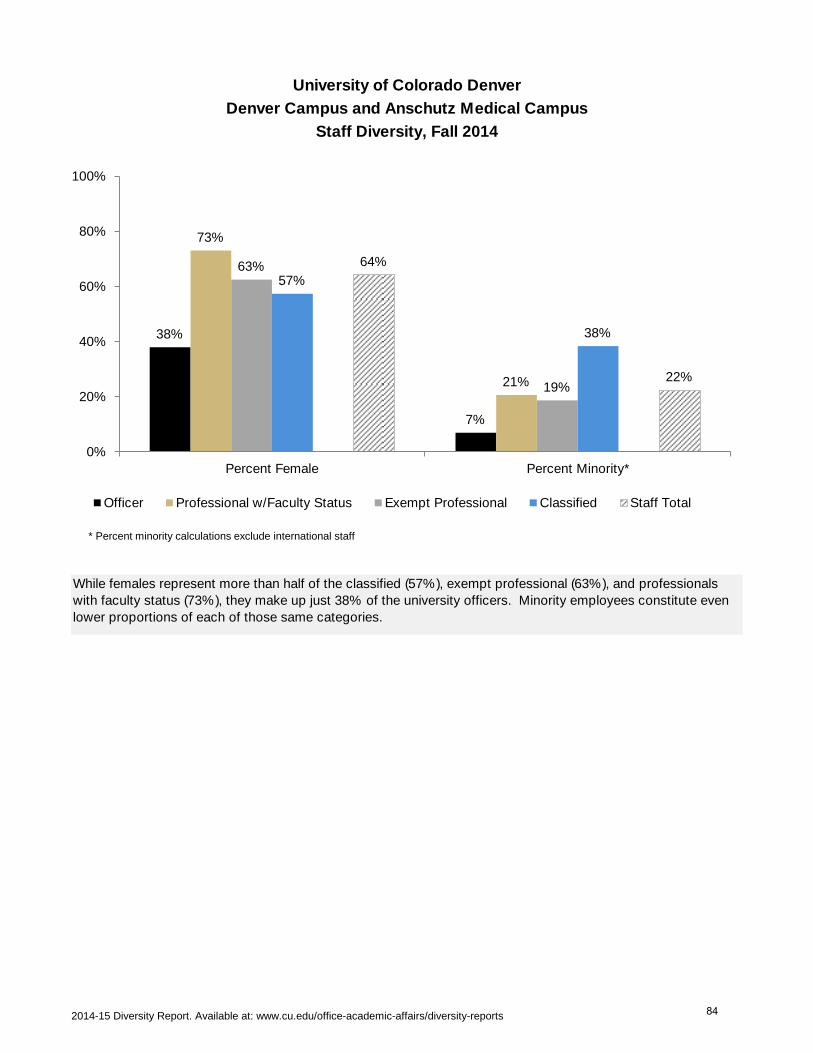
University of Colorado Denver
Denver Campus and Anschutz Medical Campus
Staff Diversity, Fall 2014
While females represent more than half of the classified (57%), exempt professional (63%), and professionals
with faculty status (73%), they make up just 38% of the university officers. Minority employees constitute even
lower proportions of each of those same categories.
38%
7%
73%
21%
63%
19%
57%
38%
64%
22%
0%
20%
40%
60%
80%
100%
Percent Female Percent Minority*
Officer Professional w/Faculty Status Exempt Professional Classified Staff Total
* Percent minority calculations exclude international staff
2014-15 Diversity Report. Available at: www.cu.edu/office-academic-affairs/diversity-reports 84
University of Colorado System AdministrationStaff Diversity
Data provided by the CU System Office of Institutional Researchhttp://www.cu.edu/ir/
85
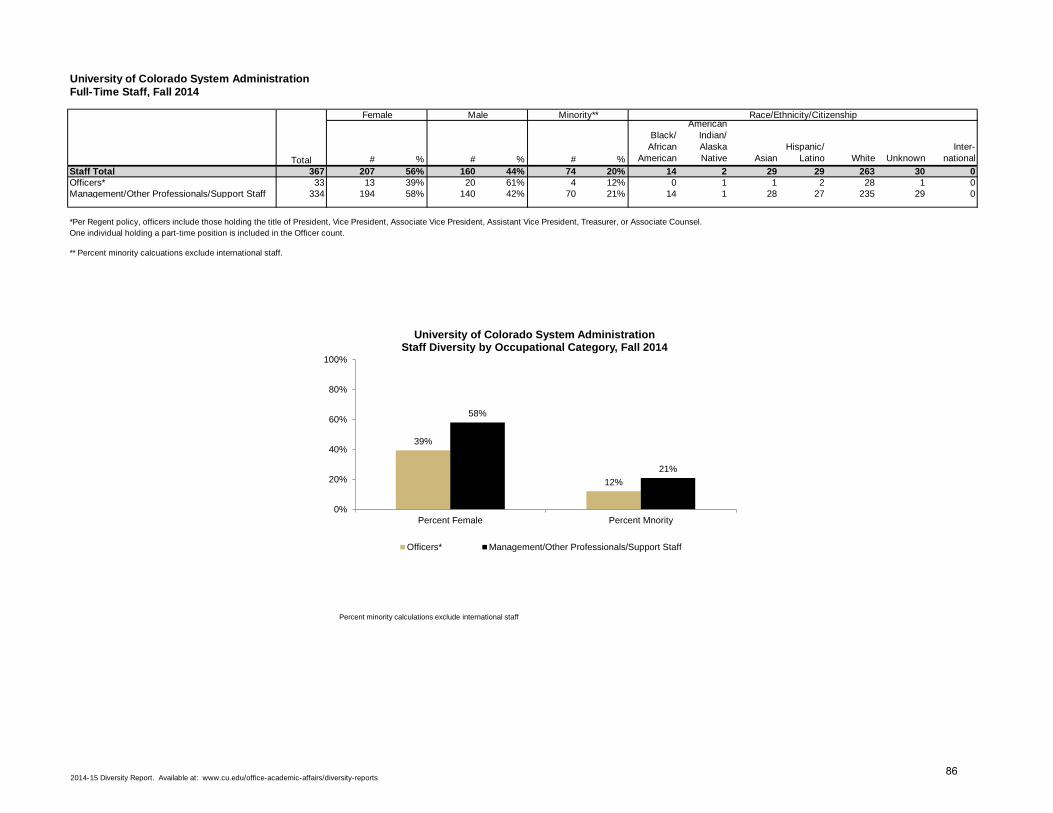
University of Colorado System AdministrationFull-Time Staff, Fall 2014
# % # % # %
Black/ African
American
American Indian/ Alaska Native Asian
Hispanic/Latino White Unknown
Inter-national
Staff Total 367 207 56% 160 44% 74 20% 14 2 29 29 263 30 0Officers* 33 13 39% 20 61% 4 12% 0 1 1 2 28 1 0Management/Other Professionals/Support Staff 334 194 58% 140 42% 70 21% 14 1 28 27 235 29 0
*Per Regent policy, officers include those holding the title of President, Vice President, Associate Vice President, Assistant Vice President, Treasurer, or Associate Counsel.
One individual holding a part-time position is included in the Officer count.
** Percent minority calcuations exclude international staff.
Race/Ethnicity/Citizenship
Total
Female Male Minority**
39%
12%
58%
21%
0%
20%
40%
60%
80%
100%
Percent Female Percent Mnority
University of Colorado System Administration Staff Diversity by Occupational Category, Fall 2014
Officers* Management/Other Professionals/Support Staff
Percent minority calculations exclude international staff
2014-15 Diversity Report. Available at: www.cu.edu/office-academic-affairs/diversity-reports86
Appendices
Appendix A: Fall 2013 Resident Enrollment, Colorado Public Four-Year Institutions
Appendix B: Changes to the Collection and Reporting of Race and Ethnicity
87
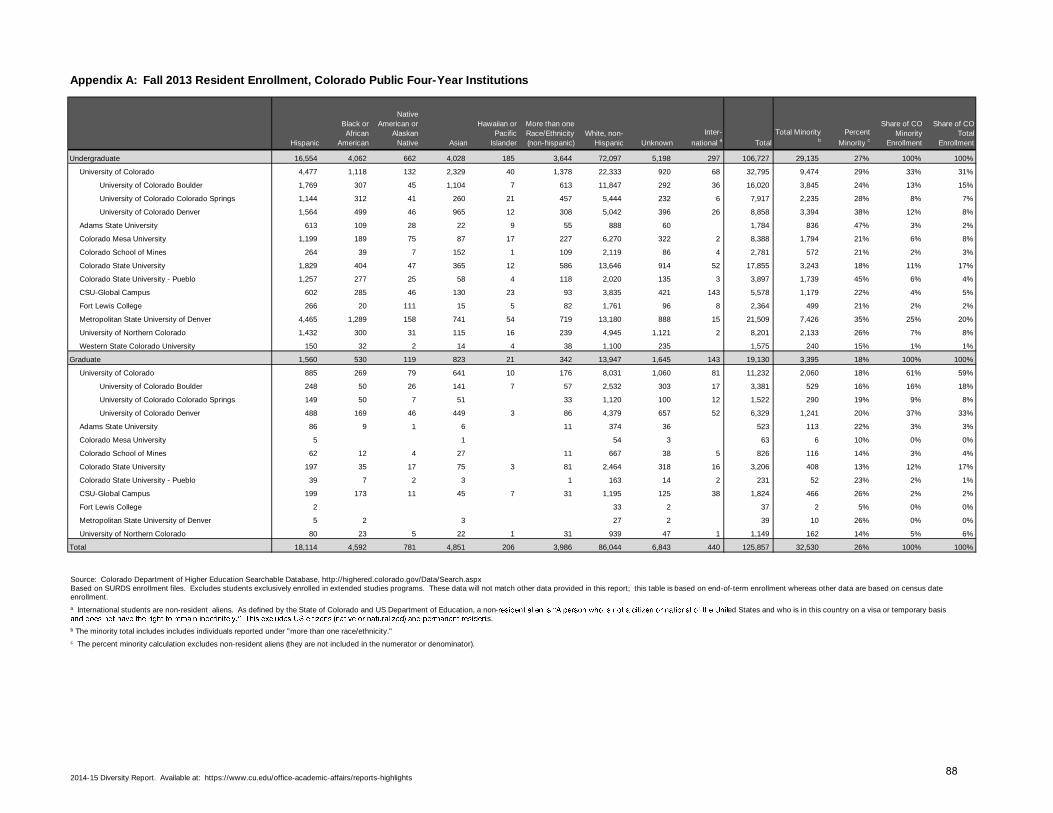
Appendix A: Fall 2013 Resident Enrollment, Colorado Public Four-Year Institutions
Hispanic
Black or
African
American
Native
American or
Alaskan
Native Asian
Hawaiian or
Pacific
Islander
More than one
Race/Ethnicity
(non-hispanic)
White, non-
Hispanic Unknown
Inter-
national a Total
Total Minority b
Percent
Minority c
Share of CO
Minority
Enrollment
Share of CO
Total
Enrollment
Undergraduate 16,554 4,062 662 4,028 185 3,644 72,097 5,198 297 106,727 29,135 27% 100% 100%
University of Colorado 4,477 1,118 132 2,329 40 1,378 22,333 920 68 32,795 9,474 29% 33% 31%
University of Colorado Boulder 1,769 307 45 1,104 7 613 11,847 292 36 16,020 3,845 24% 13% 15%
University of Colorado Colorado Springs 1,144 312 41 260 21 457 5,444 232 6 7,917 2,235 28% 8% 7%
University of Colorado Denver 1,564 499 46 965 12 308 5,042 396 26 8,858 3,394 38% 12% 8%
Adams State University 613 109 28 22 9 55 888 60 1,784 836 47% 3% 2%
Colorado Mesa University 1,199 189 75 87 17 227 6,270 322 2 8,388 1,794 21% 6% 8%
Colorado School of Mines 264 39 7 152 1 109 2,119 86 4 2,781 572 21% 2% 3%
Colorado State University 1,829 404 47 365 12 586 13,646 914 52 17,855 3,243 18% 11% 17%
Colorado State University - Pueblo 1,257 277 25 58 4 118 2,020 135 3 3,897 1,739 45% 6% 4%
CSU-Global Campus 602 285 46 130 23 93 3,835 421 143 5,578 1,179 22% 4% 5%
Fort Lewis College 266 20 111 15 5 82 1,761 96 8 2,364 499 21% 2% 2%
Metropolitan State University of Denver 4,465 1,289 158 741 54 719 13,180 888 15 21,509 7,426 35% 25% 20%
University of Northern Colorado 1,432 300 31 115 16 239 4,945 1,121 2 8,201 2,133 26% 7% 8%
Western State Colorado University 150 32 2 14 4 38 1,100 235 1,575 240 15% 1% 1%
Graduate 1,560 530 119 823 21 342 13,947 1,645 143 19,130 3,395 18% 100% 100%
University of Colorado 885 269 79 641 10 176 8,031 1,060 81 11,232 2,060 18% 61% 59%
University of Colorado Boulder 248 50 26 141 7 57 2,532 303 17 3,381 529 16% 16% 18%
University of Colorado Colorado Springs 149 50 7 51 33 1,120 100 12 1,522 290 19% 9% 8%
University of Colorado Denver 488 169 46 449 3 86 4,379 657 52 6,329 1,241 20% 37% 33%
Adams State University 86 9 1 6 11 374 36 523 113 22% 3% 3%
Colorado Mesa University 5 1 54 3 63 6 10% 0% 0%
Colorado School of Mines 62 12 4 27 11 667 38 5 826 116 14% 3% 4%
Colorado State University 197 35 17 75 3 81 2,464 318 16 3,206 408 13% 12% 17%
Colorado State University - Pueblo 39 7 2 3 1 163 14 2 231 52 23% 2% 1%
CSU-Global Campus 199 173 11 45 7 31 1,195 125 38 1,824 466 26% 2% 2%
Fort Lewis College 2 33 2 37 2 5% 0% 0%
Metropolitan State University of Denver 5 2 3 27 2 39 10 26% 0% 0%
University of Northern Colorado 80 23 5 22 1 31 939 47 1 1,149 162 14% 5% 6%
Total 18,114 4,592 781 4,851 206 3,986 86,044 6,843 440 125,857 32,530 26% 100% 100%
Source: Colorado Department of Higher Education Searchable Database, http://highered.colorado.gov/Data/Search.aspx Based on SURDS enrollment files. Excludes students exclusively enrolled in extended studies programs. These data will not match other data provided in this report; this table is based on end-of-term enrollment whereas other data are based on census date enrollment.
a International students are non-resident aliens. As defined by the State of Colorado and US Department of Education, a non- ed States and who is in this country on a visa or temporary basis ts.
b The minority total includes includes individuals reported under "more than one race/ethnicity."
c The percent minority calculation excludes non-resident aliens (they are not included in the numerator or denominator).
2014-15 Diversity Report. Available at: https://www.cu.edu/office-academic-affairs/reports-highlights88
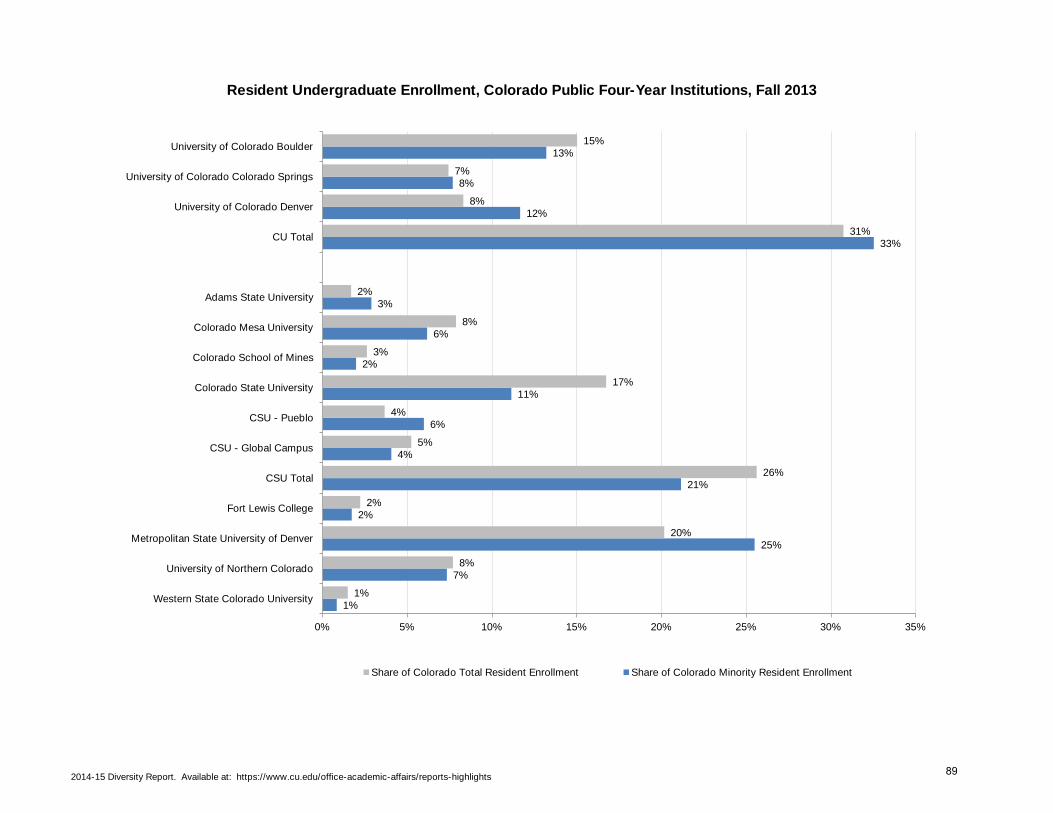
1%
7%
25%
2%
21%
4%
6%
11%
2%
6%
3%
33%
12%
8%
13%
1%
8%
20%
2%
26%
5%
4%
17%
3%
8%
2%
31%
8%
7%
15%
0% 5% 10% 15% 20% 25% 30% 35%
Western State Colorado University
University of Northern Colorado
Metropolitan State University of Denver
Fort Lewis College
CSU Total
CSU - Global Campus
CSU - Pueblo
Colorado State University
Colorado School of Mines
Colorado Mesa University
Adams State University
CU Total
University of Colorado Denver
University of Colorado Colorado Springs
University of Colorado Boulder
Resident Undergraduate Enrollment, Colorado Public Four-Year Institutions, Fall 2013
Share of Colorado Total Resident Enrollment Share of Colorado Minority Resident Enrollment
2014-15 Diversity Report. Available at: https://www.cu.edu/office-academic-affairs/reports-highlights89
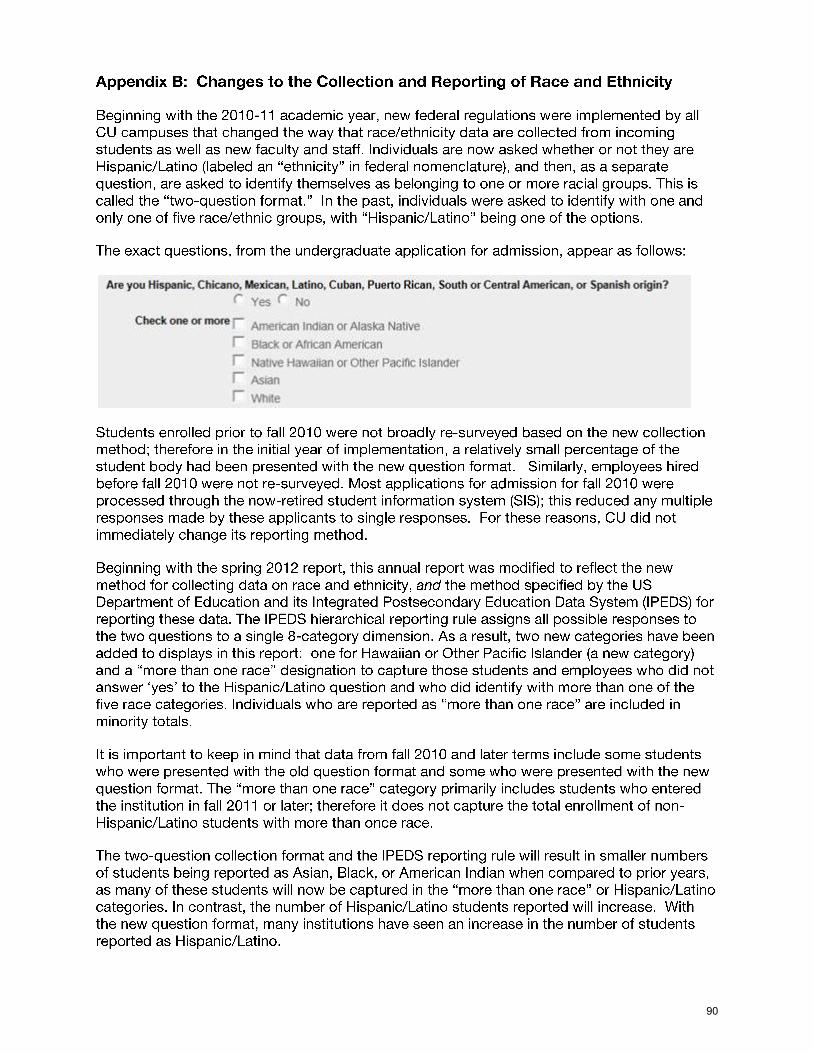
90
91