Embed Size (px)
Citation preview

University of DelawareDecember 10, 2007
Senior Design Team 15
Anthony Brazen IVNick HirannetSam Holland
Megan Keenan

To improve the robustness and reliability of the tablet feeding process.◦ This can be done through prevention and
detection

The tablets are moved along the tracks with the aid of a linear vibrator creating backpressure


The tablets drop through the holes and chutes into the flex
Sensors are currently placed at the top of the chute to detect that a tablet has fallen


What?◦ A flex does not receive a tablet◦ Entire lot must be opened and inspected
Happens 45 out of 8 million tablet drops

Why? Tablet breaks top sensor and may get
stuck in the chute◦ Tablet bounces off side walls causing delayed
drop◦ Tablet never exits the chute
Possibility for erroneous test result Loss of time and money due to product re-inspection
◦ Hand inspection is currently used to ensure that the correct amount of tablets are in each flex Expensive Time consuming
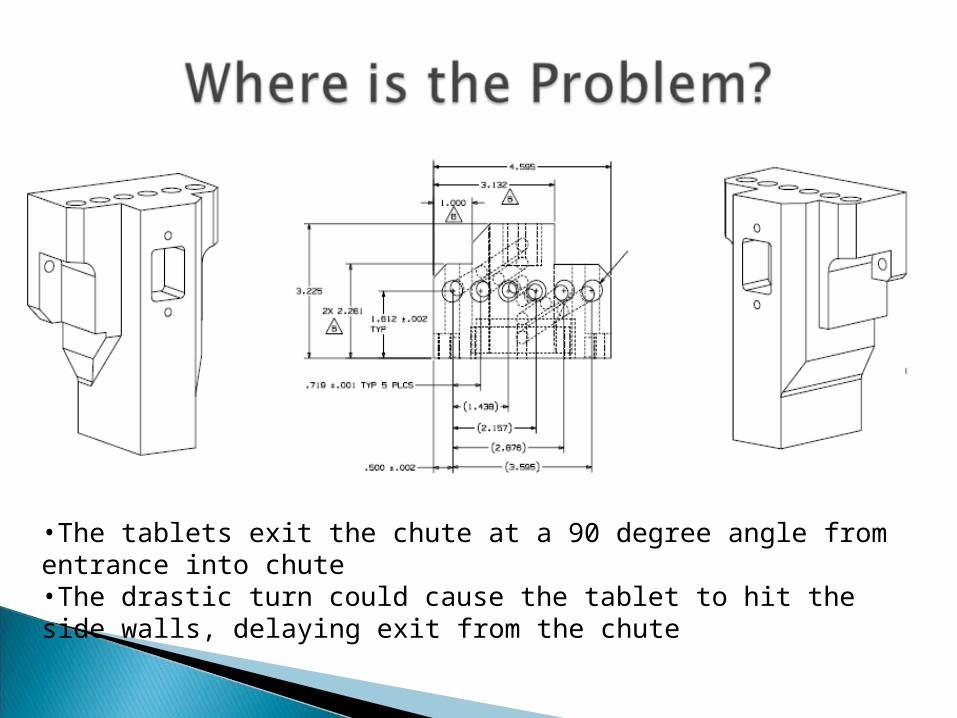
•The tablets exit the chute at a 90 degree angle from entrance into chute•The drastic turn could cause the tablet to hit the side walls, delaying exit from the chute


Top 10 WantsFinal
RankingWants Rate of
Importance
1 Quality control 37
2 Reliability 18
3 Robustness 15
4 Ease of Integration 13
5 Justifiable Cost 9
ConstraintsConstraints
Size
Cleanable
Removable
Compatibility
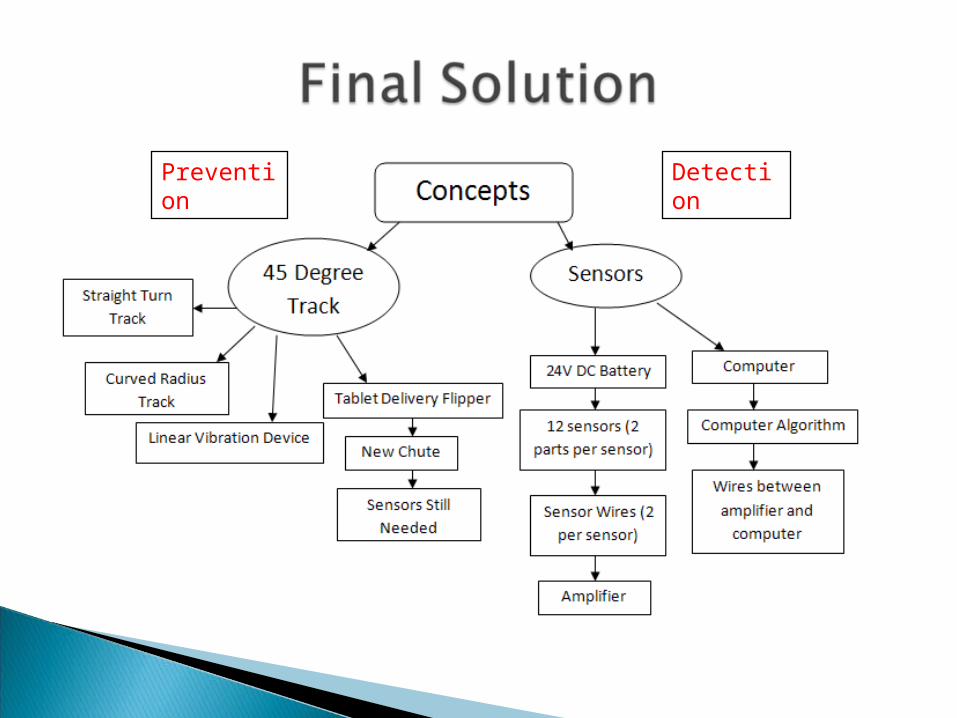
Prevention Detection

Too many modifications to the chute would cause Siemens to redesign the entire process◦ Too expensive and time consuming
New Feature: Add sensors to the bottom of the chute◦ Sensor detection in current process is placed at
the top, which provides knowledge of the tablet entry, but problem arises upon tablet exitMetrics Performance Value
Process Time >= 1.1 tablets per second
Impact <= a one second greater process time
Cost Less than $60,000 for one working line

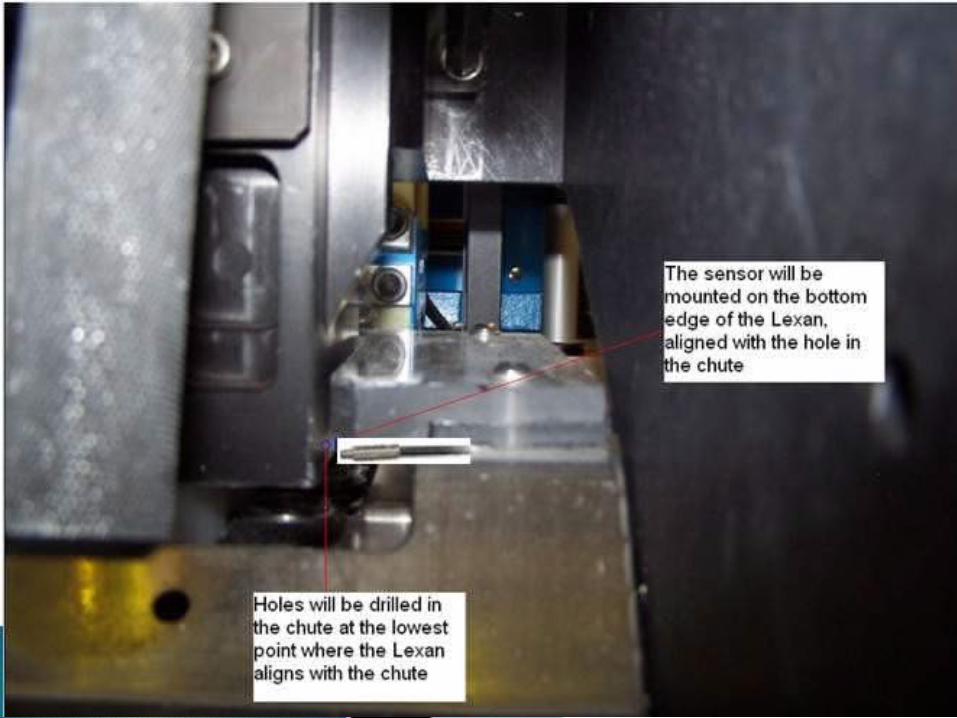
Holes will be drilled into the sides of the chutes and the lowest point where the chutes and Lexan meetTwelve sets of visual sensors will be attached to the bottom surface of the Lexan guard Will utilize same communication software that Siemens currently uses

Met with Keyence Sales Rep.4 sensors were ordered Two were able to be eliminated immediately based on visual inspection
FU-12 and FU-51TZThe FU-50 and FU-59 were tested

Test station set-up
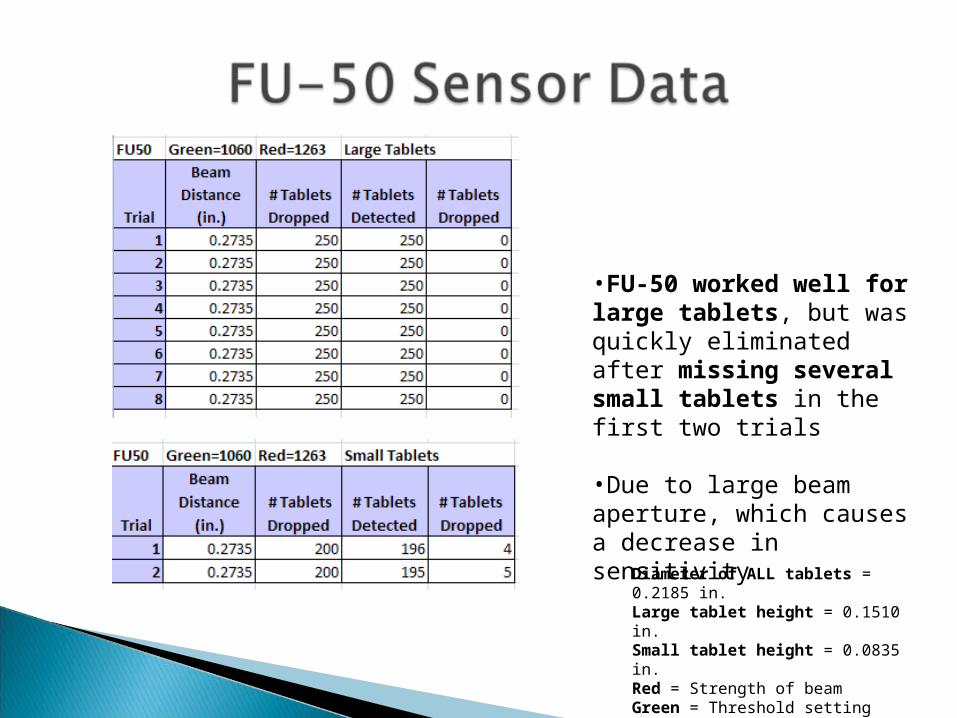
Diameter of ALL tablets = 0.2185 in.Large tablet height = 0.1510 in.Small tablet height = 0.0835 in.Red = Strength of beamGreen = Threshold setting
•FU-50 worked well for large tablets, but was quickly eliminated after missing several small tablets in the first two trials
•Due to large beam aperture, which causes a decrease in sensitivity


2000 tablets were dropped Eight trials of 250 tablets were tested ALL tablets were detected
SMALL TabletsLARGE Tablets
Diameter of ALL tablets = 0.2185 in.Large tablet height = 0.1510 in.Small tablet height = 0.0835 in.Red = Strength of beamGreen = Threshold setting

Diameter of ALL tablets = 0.2185 in.Large tablet height = 0.1510 in.Small tablet height = 0.0835 in.Red = Strength of beamGreen = Threshold setting

4 modes of failure for detection have been identified◦ 2 create undesirable risk levels
Sensor gets blocked by an object Sensor becomes unaligned
◦ Both potential effects are that sensor detects a non-existent tablet
◦ HMI and PLC controls will identify a blocked beam or misalignment

Cutting an existing tablet track and adding a 90° turn
• Desired chute drops tablets straight down•Eliminates current chute
2 ways to achieve this• 2- 45° straight angle turn• Curved radius turn
Current StateDesired State
Metrics Performance ValueProbability of Error 0 Errors for 250 Tablets
Impact <= a one second greater process time
TimeLess than 2 mins configuration time
on chute change
CostLess than $60,000 for one working
line

2 aluminum tracks were milled Tracks were mounted on linear vibrator
◦ Test to determine what prototype allows: Tablets to reach the end of the track Tablets get to end of track fastest
VibrationVibration

Tracks without flipper mechanism

• Radius Track has ability
to move tablets faster
• Current system rate =
1.1 tablets/sec
•Both new designs
exceed this rate
•Angle track moved Large
tablets faster

If Siemens decides to replace their current tracks with our 45 degree turned tracks◦ May not allow required space for vacuum
mechanism Alternative to vacuum – flipper mechanism

Full circle rotation

Half rotation

Aluminum cylindrical flipper placed at end of track◦ Six slots cut along the cylinder to receive tablets
from track◦ Upon loading, cylinder will rotate CW allowing
tablets to be released
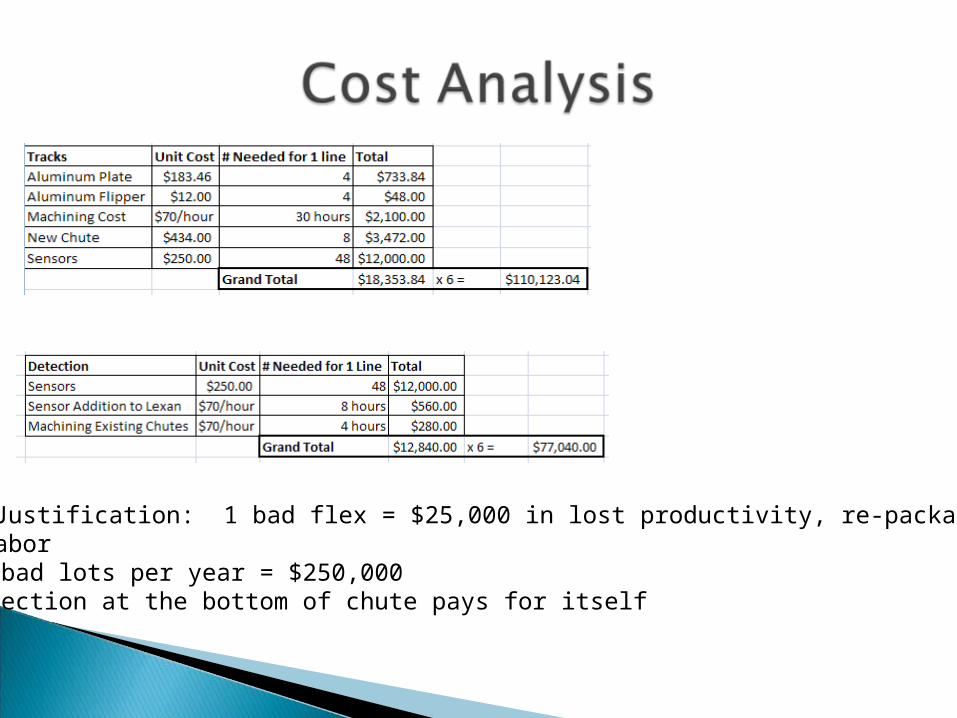
Cost Justification: 1 bad flex = $25,000 in lost productivity, re-packaging,and labor• 10 bad lots per year = $250,000• Detection at the bottom of chute pays for itself
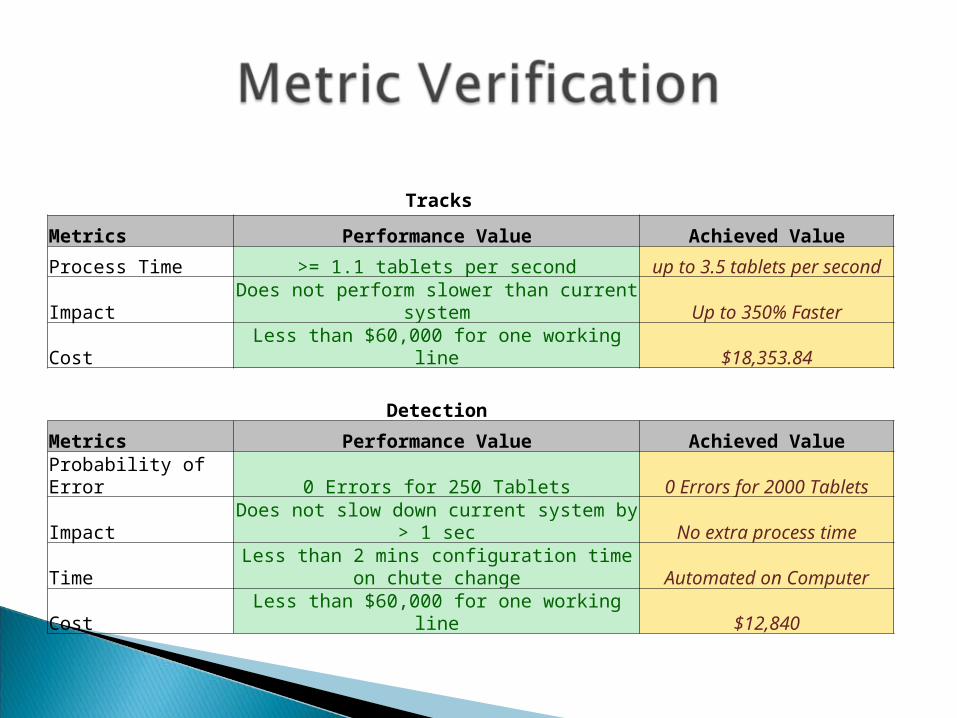
Metrics Performance Value Achieved Value
Process Time >= 1.1 tablets per second up to 3.5 tablets per second
Impact Does not perform slower than current system Up to 350% Faster
Cost Less than $60,000 for one working line $18,353.84
Detection
Metrics Performance Value Achieved Value
Probability of Error 0 Errors for 250 Tablets 0 Errors for 2000 Tablets
Impact Does not slow down current system by > 1 sec No extra process time
Time Less than 2 mins configuration time on chute change Automated on Computer
Cost Less than $60,000 for one working line $12,840
Tracks


0 defects in a sample of 250 tablets is considered acceptable by Siemens statistical analysis◦ We tested 8 samples of 250 tablets to validate
this acceptance

The number of samples (n) to be taken can be calculated by the following expression:
Z(A) = standard normal variant value for error Z(B) = standard normal variant value for β error = AQL (Average Quality Level) = LTPD (Lot Tolerance Percent Defective)
nz A z B
( ) ( )
* arcsin * arcsin2 20 1
2
01

The acceptance number (c) (number of “defects” per sample permitted) can be determined by the following expression:
= Producer’s Risk = Consumer’s Risk = AQL (Average Quality Level) = LTPD (Lot Tolerance Percent Defective) n = Required Sample Size c = Acceptance Number (Number of Defects Permitted in Sample)
2
c =
01
]2/)(sin[arcsin* 0 nAnc