Embed Size (px)
Citation preview
University of Dundee
Predicting the capacity of push and rotate piles using offshore design techniques andCPT testsBrown, Michael; Ishihara, Y
Publication date:2021
Licence:No Licence / Unknown
Document VersionPeer reviewed version
Link to publication in Discovery Research Portal
Citation for published version (APA):Brown, M., & Ishihara, Y. (2021). Predicting the capacity of push and rotate piles using offshore designtechniques and CPT tests. 133. Paper presented at Second International Conference on Press-in Engineering,Kochi, Japan.
General rightsCopyright and moral rights for the publications made accessible in Discovery Research Portal are retained by the authors and/or othercopyright owners and it is a condition of accessing publications that users recognise and abide by the legal requirements associated withthese rights.
• Users may download and print one copy of any publication from Discovery Research Portal for the purpose of private study or research. • You may not further distribute the material or use it for any profit-making activity or commercial gain. • You may freely distribute the URL identifying the publication in the public portal.
Take down policyIf you believe that this document breaches copyright please contact us providing details, and we will remove access to the work immediatelyand investigate your claim.
Download date: 15. Dec. 2021

1 INTRODUCTION
Background
Design of the more advanced push and rotate piles is often undertaken using methodologies designed to predict the capacity of cast insitu piles or full dis-placement piles (i.e. driven piles). Such approaches though do not reflect the differences in installation approaches between the different pile installation techniques and the likely affect installation may have on in service capacity.
Refinement of a design and reduction in conserva-tism for push and rotate piles is an ongoing area of research. Although this is being looked into specifi-cally, it was also decided to look to other pile design methodologies from the offshore sector which have much greater reliance on insitu test measurement (e.g. CPT rather than onshore SPT). It was decided to look to this sector not only for the use of insitu tests but also because this is an area that sees continuous re-finement and development of approaches and there has been significant advances in capturing installation effects and how they affect in service capacity (e.g. Lehane et al. 2005, Jardine et al. 2005 and as outlined in API RP2 Geo, 2011).
Approach
The approach used here was to take the results of site investigation (CPT and SPT only), pile installation and subsequent load testing for three field test sites at different locations in Japan (Giken test sites Akaoka,
Nunoshida, Takasu). These particular sites were cho-sen due to the presence of CPT test which may not be all that common in Japan with SPT normally being used in design. They were also chosen because they included instrumentation on the piles allowing sepa-ration of skin and tip resistance.
This information was then used to retrospectively calculate the pile capacity using offshore techniques which in the main use CPT data as their input and compare this with the empirically based classical API offshore design technique and previously developed SPT approaches (IPA, 2014) for RCP piles. The de-sign methods used are referred to herein as Sand 05 (Kolk et al. 2005), Sand ICP (Jardine et al. 2005), Sand UWA (Lehane et al. 2005) and Sand API (API RP2 GEO, 2007). The approach to design was to fol-low what might be considered an industry based de-signed approach based purely on the codes and as out-lined in the help manual of the OPile software developed by Cathie (Cathie, 2020). For example, the API code takes a simplified approach to design and assumes pure coring throughout installation such that the incremental filling ratio (IFR) equals 1. Which in the case studies used here seems appropriate as the piles appeared to core throughout and have final fill-ing ratios (FFR) close to one. Although the OPile software is referred to above, the actual calculations were undertaken in a spreadsheet form rather than us-ing proprietary software.
Predicting the Capacity of Push and Rotate Piles Using Offshore Design Techniques and CPT Tests
M.J. BrownUniversity of Dundee, Dundee, Scotland, UK
Y. IshiharaGiken Limited, Kochi, Japan
ABSTRACT: Design methods for pile installation e.g. cast insitu or full displacement driven piles are often used as the basis for the design of more advanced installation approaches such as push and rotate piles with cutting shoes (RCP). These approaches, though, do not reflect the variation in installation and the effects it may have on capacity when applied to RCP piles. Although continuous development and improvement of RCP pile design is ongoing, it was seen as valuable to explore current insitu test based design of offshore piles. This paper compares offshore CPT based pile design techniques with field measurements of pile performance. Re-sults suggest improved prediction of shaft capacity when compared to SPT based methods but with mixed performance for end bearing prediction. Attempts to predict installation torque using a method developed from DEM modelling showed some success irrespective of the complexity of installation using water injection and surging.
Brown, M & Ishihara, Y 2021, 'Predicting the capacity of push and rotate piles using offshore design techniques and CPT tests', Paper presented at Second International Conference on Press-in Engineering, Kochi, Japan, 19/06/21 - 20/06/21 pp. 133. https://icpe-ipa.org/

2 CASE STUDY SITES AND INPUT DATA
Case study site A2016
A typical site profile for the site A2016 is shown in Figure 1. As well as a description of the encountered stratigraphy. Figure 1 also shows the result of SPT testing. Details of the pile installation and other key information is shown in Table 1.
It can be seen that this pile was only installed to a shallow depth of 4.8 m below ground level and has been included to contrast the results with those of the longer piles of the other sites. Also, the methods de-veloped for offshore pile design considered are in the main intended for longer piles than those considered here although the origins of the API method appear to come from short onshore piles. The pile included shaft strain gauges that were installed at 0, 0.5, 1.0, 2.0, 3.0 and 4.3 mbgl (meters below ground level). The lower gauges for each pile were used to infer the pile base resistance and it is acknowledged that there will be some influence of the short shaft zone on these values which may have resulted in slightly enhanced tip resistance values. Corrections were applied to the tip resistance values to remove the affects of the ad-ditional skin friction zone based upon the shaft re-sistances determined above. Installation was unusual in that the pile was pushed and rotated to 2 mbgl and then purely pushed or jacked to the final installation depth. The pile was also “surged” to reduce installa-tion requirements (maintained below a pre decided vertical force and torque during installation). This in-volved effectively lifting the pile up under load con-trol during installation. The pile incorporated 4 teeth at the base resulting in a cutting action which is obvi-ously different to an offshore driven pile. Water in-jection was not used during installation.
Figure 1. Soil stratigraphy and results of SPT and CPT testing for site A2016.
Table 1. Details of pile installation and key site information, A2016. ______________________________________________ Parameter Value ______________________________________________ Pile outer diameter, Do (m) 0.800 Pile outer diameter, Di (m) 0.776 Installed length, L (mbgl) 4.8 Groundwater table (mbgl) 0.06 Assumed interface friction angle, δ (°) 24 __________________________________________________________________________________________
A static axial maintained load test was conducted based on JGS (Japanese Geotechnical Society) stand-ard (JGS, 2002), except for the condition of the wait period prior to testing. JGS (2002) requires tLT to be greater than 7 days for sands and 14 days for clays. In this load test, tLT was 26 hours, as one of the objec-tives of this load test was to confirm the short-term performance of the pile. The piles were observed to be fully coring throughout with internal soil material at the same level throughout or close to this.
Case study site N2017
Again, the site profiles for this case study site are shown in Figure 2 with key information in Table 2. In this case the pile was pushed and rotated throughout installation. Shaft strain gauges were installed at 0, 4.0, 10.5, 22.0 and 23.0 mbgl. The pile tip incorpo-rated 6 cutting teeth and water injection of 15 litres per minute was used at the base although this was minimized on approaching the final pile installation depth (0.9Do). Water injection was used rather than jetting where the injection rate was 1/5th of that asso-ciated with jetting (greater than 300 liters/minute) which may lead to soil transport.
Figure 2. Soil stratigraphy and results of SPT and CPT testing for site N2017.

Table 2. Details of pile installation and key site information, N2017. ______________________________________________ Parameter Value ______________________________________________ Pile outer diameter, Do (m) 1.000 Pile outer diameter, Di (m) 0.976 Installed length, L (mbgl) 24.1 Groundwater table (mbgl) 1.6 Assumed interface friction angle, δ (°) 24 _____________________________________________ The pile was also “surged” to reduce installation re-quirements. Pile testing was carried out in a similar manner to A2016 with a period of 57 days between installation and testing.
Case study site T2007
As per pile N2017, pile T2007 was installed to far greater depth than A2016 with these two deeper case studies more aligned with the depth that the offshore pile designed methods were developed for. In the case of both pile N2017 and T2007, the piles were de-signed to generate significant capacity through tips founded in competent sand and gravel layers (Fig. 2-3). Above this relatively little bearing capacity would be developed due the presence of low density silt and sand layers. Shaft strain gauges were again incorpo-rated at 0, 2.3, 3.0, 5.2, 9.6, 14.7, 15.8 and 16.7 mbgl. Water injection of 18 to 24 litres per minute at the tip was used although this was minimized over the final 0.5Do. Rotation was also stopped about 4 mm above the final installation depth and the pile only pushed or jacked into final position. The pile tip incorporated 4 cutting teeth to aid installation.
Figure 3. Soil stratigraphy and results of SPT and CPT testing for site T2007.
Table 3. Details of pile installation and key site information, T2007. ______________________________________________ Parameter Value ______________________________________________ Pile outer diameter, Do (m) 0.8 Pile outer diameter, Di (m) 0.768 Installed length, L (mbgl) 17.5 Groundwater table (mbgl) 1.1 Assumed interface friction angle, δ (°) 24 _____________________________________________
CPT data
The CPT data used for the three case study sites is shown in Figures 1, 2 and 3. Unfortunately, the CPTs for N2017 and T2007 did not extend to sufficient depth to allow for continuous design based upon CPT. In this case the missing CPT results were inferred from the SPT results using the conversion from SPT to CPT proposed by Jefferies & Davies (1993). Soil unit weight was determined based upon the method proposed by Robertson & Cabal (2010). The relative density of the soil to allow parameter selection as part of the API methodology was determined based upon the approach set out by Jamiolkowski et al. (2001). All CPT results used to determine pile end bearing were average 1.5Do above and below the tip position but no specific averaging was applied for pile shaft resistance determination (although some of the meth-ods used may propose this). It is noted that due to the low strength/density of the soil over the some of the pile lengths, CPT derived relative density was not ap-propriate and SPT readings were converted to deter-mine input parameters for the API method.
3 CALCULATION OF PILE CAPACITY
Offshore CPT based methods
The offshore CPT based pile capacity design method-ologies are those as outlined in API RP2 GEO (2007): Sand 05 (Kolk et al. 2005), Sand ICP (Jardine et al. 2005), Sand UWA (Lehane et al. 2005). To aid con-sistent design and aid comparison within spreadsheet, approaches to design the methods have been summa-rized by a single equation (Equation 1) for shaft re-sistance where parameters are varied depending on the specific methodology used (Table 4).
𝜏 𝑢. 𝑞𝜎𝑝
.𝐴 . max𝐿 𝑧𝐷
, 𝑣 . 𝑡𝑎𝑛 𝛿
𝑚𝑖𝑛 . , 1 (1)
Where qc is the cone resistance, pa is the atmospheric pressure (taken as 100 kPa), Ar is an area ratio (1-Di
2/Do2), L is the final embedded length of the pile, z
is the depth of the pile during installation, δcv is the pile interface friction angle and all other symbols are defined in Table 4.

Table 4. Parameter values for Equation 1. ______________________________________________ Parameter Method Sand05 SandUWA Sand ICP ______________________________________________ a 0.05 0 0.1 b 0.45 0.3 0.2 c 0.90 0.5 0.4 d 0 1 1 e 1 0 0 u 0.043 0.030 0.023 v Ar
0.5 2 Ar0.25 _____________________________________________
Although the shaft friction determination for the
methods is based upon a semi-unified approach, the end bearing resistance varies from method to method. For example, the base resistance for the Sand 05 method is represented by Equation 2:
𝑞 8.5. 𝑝 ...𝐴 . (2)
The Sand UWA method uses:
𝑞 𝑞 . 0.15 0.45.𝐴 (3)
For the ICP method the pile was considered
plugged or unplugged. Where the pile was considered to be coring the base resistance was calculated based upon the cone resistance multiplied by the annular base area. When plugged Equation 4 was used:
𝑞 𝑞 . 0.5 0.25. 𝑙𝑜𝑔 , 10 (4)
Where DCPT is the diameter of the CPT taken here as 36 mm.
Results from the CPT based methodologies
The results for the analysis applied to pile A2016 are shown in Figure 4-6 for total capacity, shaft resistance and end bearing capacity respectively. Where Figures 5, 8 & 11 refer to coring this means that both internal and external skin friction are considered and that the tip resistance was calculated using the annular area. When plugged, only the external skin friction was considered with a fully plugged base (total base area). The UWA method was assumed to be coring during installation and plugged during testing (external shaft friction only) with the full base area used in Equation 3 (as this is modified by Ar and IFR). Figures 5, 8 & 10, plugged refers to external skin friction only, x2 means this has been doubled to show the effect of the coring state where in both cases Ar is unmodified by the IFR i.e. IFR is set at 1 throughout. In this case internal and external skin friction are calculated in the same manner.
Pile A2016 is obviously relatively short at 4.8m installed final length compared with the other two piles and the length of piles the offshore design meth-ods were designed for. It would appear that the Sand 05 method significantly overpredicts the total pile ca-pacity (Fig. 5) with a similar result for pile N2017 (Fig. 8) although the over prediction is less significant for pile T2007 (Fig. 11). This appears to be attributed to overprediction of end bearing resistance. The Fig-ures show capacity measured from the pile tests for the first yield, Qyield (if present or easily identifiable) and at a displacement of 10% of diameter, Q0.2Do where piles are assumed to be rigid.
Figure 4. Total pile capacity calculated and compared to that measured after installation for Pile A2016.
Figure 5. Shaft resistance calculated and compared to that meas-ured after installation for Pile A2016.

Figure 6. Base resistance calculated and compared to that meas-ured after installation for Pile A2016.
In terms of shaft resistance for A2016, all of the
methods appear to underpredict capacity for this short pile (Fig. 5) even where allowance has been made for the piles to be coring (by doubling the calculated shaft resistance). Only the Sand 05 method appears close when doubled up but manages to overpredict slightly. It is noted though that as well as being a very short pile the pile was also tested relatively quickly after installation which may have had an influence on the effective stress state at the shaft. Again, this may re-flect the origins of the offshore methods for longer piles. Comparison with the SPT based design method as outlined in IPA (2014) is shown on the shaft (qs = 2N) and base resistance figures (qb = 60Nb), where N is the SPT number and Nb the average one diameter above the base or tip. In both cases the SPT based ap-proach underpredicts capacity (by 39% & 29% re-spectively) as it was originally designed to be con-servative (to give results lower than the lower limit of the small testing database).
Due to the relatively low skin friction developed for the three piles here based upon the nature of the ground i.e. low density upper layers (Figures 1-3) and substantial layers (Fig. 1 & 3) of silt, the end bearing resistance developed is probably of most interest here. Figure 6 shows best performance for the Sand UWA method with good prediction at large pile de-formation whereas Sand 05 and Sand API signifi-cantly overpredict capacity.
Considering pile N2017, which is installed to 24.1 m, in terms of total capacity, the UWA (assumed plugged), ICP plugged and the API plugged methods do a relatively good job of predicting total capacity whereas the Sand05 method seems to significantly overpredict again (Fig. 7). Better predictions of final shaft resistance are achieved if the methods are ap-plied to the internal and external shaft (Fig. 8) which is consistent with the full coring behavior noted in the field for all piles (FFR generally close to 1). Again, the UWA method performs well when doubled for
coring and so does the ICP and API method which is surprising (not directly CPT
Figure 7. Total resistance calculated and compared to that meas-ured after installation for Pile N2017.
Figure 8. Shaft resistance calculated and compared to that meas-ured after installation for Pile N2017.
Figure 9. Base resistance calculated and compared to that meas-ured after installation for Pile N2017.

derived). The SPT based method seems to again un-derpredict shaft resistance by 28% suggesting there is potentially better performance for the offshore meth-ods. Unfortunately, again, though end bearing predic-tions are not particularly satisfactory in that in general quite significant over prediction is encountered (Fig. 9), whereas the SPT method again underpredicts by 24%. Based upon the shaft resistances predicted for piles N2017 and T2007 (Fig. 11) it would appear that the ICP and UWA methods do a good job of predict-ing shaft resistance if they are allowed to core and the shaft resistance is doubled internally and externally. It is not clear if the shaft friction fatigue they were derived for was designed to be applied internally and externally but it appears to work well here. Maybe it is also surprising that the RCP installed piles with wa-ter injection appear to have such similar shaft perfor-mance to that predicted for long offshore driven piles. This may be particularly remarkable where the RCP piles effectively have a cutting shoe and water injec-tion during installation is used. This may be as a result of the nature of the soil where significant depths of silt are encountered although it is unlikely that sand-based methods used here where exposed to significant data from silt sites during their development. The re-sults, though, would suggest that there is potential for further development and investigation of the CPT based shaft resistance methods outlined where RCP piles have significant length and rely on this compo-nent of pile resistance for capacity as these appear to be an improvement over SPT based approaches.
For pile T2007 the results are more mixed in terms of both total capacity and end bearing resistance there was also a tendency for reducing shaft capacity with displacement (Fig. 11) as the final resistance was lower than that at the yield point (not shown herein). The total capacity results tend to span the difference in capacity measured at yield and at a displacement equivalent to 10% of the pile diameter (0.1Do) with the API and Sand05 methods closest to the ultimate resistance and the ICP and
Figure 10. Total resistance calculated and compared to that measured after installation for Pile T2007.
Figure 11. Shaft resistance calculated and compared to that measured after installation for Pile T2007.
Figure 12. Base resistance calculated and compared to that measured after installation for Pile T2007.
UWA method close to yield. For tip resistance the UWA method underpredicts whilst the Sand 05 and API approaches overpredict to a similar degree.
Again, the SPT methods underpredict capacity in terms of shaft and tip capacity by 42% & 63% respec-tively. The SPT based performance of based re-sistance seems particular poor here due to averaging of the SPT values above the pile tip where it would seem more appropriate to consider the SPT resistance above and below the tip as adopted in the CPT meth-ods.
Discussion of results
Based upon the results presented and discussed above, it would appear based upon the limited data set that there is some potential in using the UWA and ICP based CPT methods to predict pile shaft capacity for RCP piles in the sand/silt horizons encountered, alt-hough some apparent scatter is created with site A2016 (short pile). White & Deeks (2007) and Okada & Ishihara (2012) have suggested reducing the mag-nitude of term c in Table 4 which would reduce the effects of friction fatigue which has been observed for push and rotate piles. This would not seem necessary

for sites considered here except maybe site A2016 but this is most likely due to the relatively short nature of this pile i.e. any cycles leading to friction fatigue are limited. Further reduction may also not be seen to be required as the piles here are not only push and rotate but also have cutting teeth and surged during installa-tion which has led to considerable numbers of cycles of stress reversal on the shaft such that these piles may behave more like long driven piles (White & Lehane, 2004). In all cases interface friction angles were kept constant for all of the analysis and set at 24° based upon the author’s experience of lab characterization of sand-steel interfaces. This assumption though is also in line with the guidance in API RP2GEO. It is noted that pile shaft resistance may be sensitive to this value but that as the paper focuses on relative perfor-mance, and the piles here are more reliant on end bearing resistance, this would seem a lesser concern in this situation although accurate interface friction angles should be determined for the specific case un-der consideration where possible.
Final end bearing capacity prediction, which is po-tentially more important for the sites considered, is less satisfactory and further investigation of other methods (CPT based outside of those considered here) is suggested. It is noted, though, that White & Deeks (2007) and Okada & Ishihara (2012) have pre-viously modified the stand UWA method (increasing the magnitude of the final term in Equation 3) in an attempt to improve the situation but that was not con-sidered directly here. It would in this case improve the results from sites A2016 and T2007 but increase the over prediction in N2017. The overall results may not be unsurprising in that the methods investigated in general have their origins in long slender driven off-shore piles where more recent development has gone into capturing the friction fatigue effects with respect to shaft resistance. Therefore, in an offshore environ-ment, more reliance may be placed on developing shaft capacity as significant pile deflection may be re-quired to mobilize large tip resistances which could lead to serviceability failure. For example, in Equa-tion 3 qb can only reach a maximum of 0.6qc which may be included to reduce the reliance on end bearing at serviceability level deflections (in Okada & Ishi-hara, 2012 this is increased to 0.9qc) whereas when coring the ICP method allows the use of full qc on the annulus only. On this basis it would seem appropriate to investigate other CPT based end bearing capacity methods and look at any previous variations proposed for RCP piles with a wider database of tests.
Performance of the existing SPT based methods consistently underpredict performance which ranges from 28-42% for shaft resistance and to a greater de-gree for tip resistance (39-63%) which in part seems attributable to how average N values are captured around the tip in the IPA (2014) method. This, though, has the potential to have a significant effect on efficiency and cost when design loads may be
Table 5. Simple comparison of performance. ______________________________________________ Method Site A2016 N2017 T2007 ______________________________________________ Sand 05 Base1 3.87Qb 1.84Qb 1.29Qb Shaft1 1.07Qs 1.39Qs 0.88Qs UWA Base1 0.85Qb 1.45Qb 0.82Qb Shaft2 0.68Qs 1.18Qs 0.98Qs ICP Base1 0.24Qb 1.19Qb 0.37Qb Shaft2 0.46Qs 1.04Qs 0.93Qs API Base1 2.67Qb 1.26Qb 1.25Qb Shaft2 0.28Qs 0.43Qs 1.02Qs IPA Base 0.71Qb 0.76Qb 0.37Qb Shaft 0.61Qs 0.72Qs 0.58Qs _____________________________________________ 1plugged,2coring, reduced by a further one third over ultimate capacity suggesting further work is required to refine the SPT based design approach for these pile types. A simple comparison of performance of the various methods is presented in Table 5 with Qs or Qb here referring to the ultimate capacity proven in static load testing.
It is noted that only a limited data set of RCP pile case studies have been compared with the offshore CPT based methods due to a lack of high-quality in-strumented field studies with the inclusion of instru-mentation and subsequent load testing. For more con-clusive analysis a wider data set in a variety of soils would be required.
Installation torque prediction
As well as investigating capacity prediction it was also decided to see if a recently developed CPT based methodology to predict installation torque based upon centrifuge modelling and DEM simulation (Sharif et al. 2020) was applicable for RCP piles. This method-ology (Eq. 5 & 9) has not been testing outside the la-boratory and was developed for solid or plugged piles with conical tips of different apex angles (Sharif et al. 2020).
𝑇 ∑ 𝑎𝑞∆∆ 𝑡𝑎𝑛𝛿𝜋∆𝐷 𝑓 (5)
𝑓 0.63𝐷 0.52 (6)
𝑎 (7)
𝑃 (8)
Where Ts is the torque developed on the shaft, f is a correction for the initial relative density (Dr), a is a stress drop index on the CPT, θ is the rate of angular rotation of the pile and w the rate of vertical displace-ment, Pi is the pitch of the rotating pile, δ is an inter-face friction angle.
The torque prediction compared with field meas-urements for pile N2007 is shown in Figure 13. The results of the prediction from Equation 5 are for the external shaft only (Ts) and do not consider soil inside the shaft. The results are also limited to 9.2 m in depth
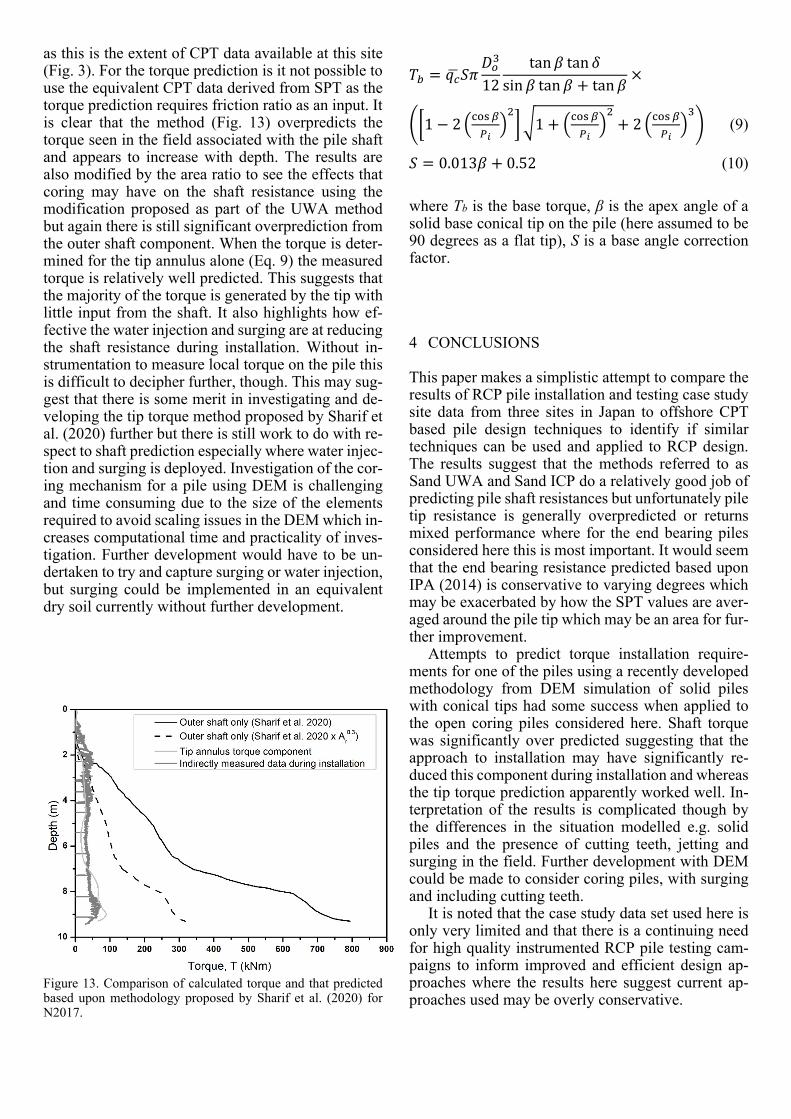
as this is the extent of CPT data available at this site (Fig. 3). For the torque prediction is it not possible to use the equivalent CPT data derived from SPT as the torque prediction requires friction ratio as an input. It is clear that the method (Fig. 13) overpredicts the torque seen in the field associated with the pile shaft and appears to increase with depth. The results are also modified by the area ratio to see the effects that coring may have on the shaft resistance using the modification proposed as part of the UWA method but again there is still significant overprediction from the outer shaft component. When the torque is deter-mined for the tip annulus alone (Eq. 9) the measured torque is relatively well predicted. This suggests that the majority of the torque is generated by the tip with little input from the shaft. It also highlights how ef-fective the water injection and surging are at reducing the shaft resistance during installation. Without in-strumentation to measure local torque on the pile this is difficult to decipher further, though. This may sug-gest that there is some merit in investigating and de-veloping the tip torque method proposed by Sharif et al. (2020) further but there is still work to do with re-spect to shaft prediction especially where water injec-tion and surging is deployed. Investigation of the cor-ing mechanism for a pile using DEM is challenging and time consuming due to the size of the elements required to avoid scaling issues in the DEM which in-creases computational time and practicality of inves-tigation. Further development would have to be un-dertaken to try and capture surging or water injection, but surging could be implemented in an equivalent dry soil currently without further development.
Figure 13. Comparison of calculated torque and that predicted based upon methodology proposed by Sharif et al. (2020) for N2017.
𝑇 𝑞 𝑆𝜋𝐷12
tan𝛽 tan 𝛿sin𝛽 tan𝛽 tan𝛽
1 2 1 2 (9)
𝑆 0.013𝛽 0.52 (10)
where Tb is the base torque, β is the apex angle of a solid base conical tip on the pile (here assumed to be 90 degrees as a flat tip), S is a base angle correction factor.
4 CONCLUSIONS
This paper makes a simplistic attempt to compare the results of RCP pile installation and testing case study site data from three sites in Japan to offshore CPT based pile design techniques to identify if similar techniques can be used and applied to RCP design. The results suggest that the methods referred to as Sand UWA and Sand ICP do a relatively good job of predicting pile shaft resistances but unfortunately pile tip resistance is generally overpredicted or returns mixed performance where for the end bearing piles considered here this is most important. It would seem that the end bearing resistance predicted based upon IPA (2014) is conservative to varying degrees which may be exacerbated by how the SPT values are aver-aged around the pile tip which may be an area for fur-ther improvement.
Attempts to predict torque installation require-ments for one of the piles using a recently developed methodology from DEM simulation of solid piles with conical tips had some success when applied to the open coring piles considered here. Shaft torque was significantly over predicted suggesting that the approach to installation may have significantly re-duced this component during installation and whereas the tip torque prediction apparently worked well. In-terpretation of the results is complicated though by the differences in the situation modelled e.g. solid piles and the presence of cutting teeth, jetting and surging in the field. Further development with DEM could be made to consider coring piles, with surging and including cutting teeth.
It is noted that the case study data set used here is only very limited and that there is a continuing need for high quality instrumented RCP pile testing cam-paigns to inform improved and efficient design ap-proaches where the results here suggest current ap-proaches used may be overly conservative.

5 REFFERENCES
API. 2007. Planning, designing and constructing fixed offshore plat-forms—working stress design (API RP2). USA, Ameri-can Petroleum Institute.
API. 2011. Geotechnical and foundation design considerations. ANSI/API recommended practice 2Geo (API RP2GEO). USA, American Petroleum Institute.
Cathie 2020. OPile user manual. Cathie, Belgium. International Press-in Association (IPA), 2014. design and con-
struction manual for earth retaining walls with tubular piles installed by Gyropress (rotary cutting press-in) method. 143p. (in Japanese)
Jamiolkowski, M. Lo Presti, D.C.F., & Manassero, M. 2001. Evaluation of relative density and shear strength of sands from CPT and DMT. In Germaine, J.T., Sheahan, T.C. & Whitman, R.V. (eds.), Soil Behavior and Soft Ground Con-struction, ASCE Geotechnical Special Publication, 119, American Society of Civil Engineers (ASCE), Reston, Vir-ginia: 201-238
Jardine, R., Chow, F., Overy, R. & Standing, J. 2005. ICP design methods for driven piles in sands and clays. Imperial Col-lege, London: Thomas Telford Publishing.
Jefferies, M.G., & Davies, M.P., 1993. Use of CPTU to estimate equivalent SPT N60. Geotechnical Testing Journal, ASTM, 16(4): 458-468.
Kolk, H. J., Baaijens, A. E. & Senders, M. 2005. Design criteria for pipe piles in silica sands. In Gourvenec, S. & Cassidy, M. (eds), ISFOG 2005: Proc. 1st Int. Symp. On Frontiers in Off-shore Geotechnics, University of Western Australia, Perth, 19–21 September 2005. London: Taylor & Francis: 711–716.
Lehane, B.M., Schneider, J.A. & Xu, X. 2005. The UWA-05 method for prediction of axial capacity of driven piles in sand. In Gourvenec, S. & Cassidy, M. (eds), ISFOG 2005: Proc. 1st Int. Symp. On Frontiers in Offshore Geotechnics, University of Western Australia, Perth, 19–21 September 2005. London: Taylor & Francis: 683–689.
Okada, K. & Ishihara, Y. 2012. Estimating bearing capacity and jacking force for rotary jacking. Testing and Design Methods for Deep Foundations. IS-Kanazawa, 2012: 605-614.
Robertson, P.K. & Cabal, K.L. 2010. Estimating soil unit weight from CPT. 2nd International Symposium on Cone Penetra-tion Testing, Huntington Beach, CA, USA, May 2010.
Sharif, Y.U., Brown, M.J., Ciantia, M.O., Cerfontaine. B., Knappett, J.A., Davidson, C., Meijer, G.J. & Ball, J. 2020. Using DEM to create a CPT based method to estimate the installation requirements of rotary installed piles in sand. Ca-nadian Geotechnical Journal. Published online 19/08/20. DOI: doi.org/10.1139/cgj-2020-0017.
The Japanese Geotechnical Society (JGS), 2002. Method for static axial compressive load test of single piles. Standards of Japanese Geotechnical Society for Vertical Load Tests of Piles: 49–53.
White, D.J. & Deeks A.D., 2007. Recent research into the be-haviour of jacked foundation piles. In Kikuchi, Y., Otani, J. Kimura, M., Morikawa, Y. (eds.), Advances in Deep Foun-dations: International Workshop on Recent Advances of Deep Foundations (IWDPF07), CRC Press, Japan: 3-26.
White, D.J. & Lehane, B.M. 2004. Friction fatigue on displace-ment piles in sand. Geotechnique 54, No. 10: 645–658.