Embed Size (px)
Citation preview
University of Groningen
Influence of nanomorphology on the photovoltaic action of polymer–fullerene compositesChirvase, D.; Parisi, J.; Hummelen, Jan; Dyakonov, V.
Published in:Nanotechnology
DOI:10.1088/0957-4484/15/9/035
IMPORTANT NOTE: You are advised to consult the publisher's version (publisher's PDF) if you wish to cite fromit. Please check the document version below.
Document VersionPublisher's PDF, also known as Version of record
Publication date:2004
Link to publication in University of Groningen/UMCG research database
Citation for published version (APA):Chirvase, D., Parisi, J., Hummelen, J. C., & Dyakonov, V. (2004). Influence of nanomorphology on thephotovoltaic action of polymer–fullerene composites. Nanotechnology, 15(9), 1317 - 1323. [PII S0957-4484(04)80470-7]. DOI: 10.1088/0957-4484/15/9/035
CopyrightOther than for strictly personal use, it is not permitted to download or to forward/distribute the text or part of it without the consent of theauthor(s) and/or copyright holder(s), unless the work is under an open content license (like Creative Commons).
Take-down policyIf you believe that this document breaches copyright please contact us providing details, and we will remove access to the work immediatelyand investigate your claim.
Downloaded from the University of Groningen/UMCG research database (Pure): http://www.rug.nl/research/portal. For technical reasons thenumber of authors shown on this cover page is limited to 10 maximum.
Download date: 10-02-2018
INSTITUTE OF PHYSICS PUBLISHING NANOTECHNOLOGY
Nanotechnology 15 (2004) 1317–1323 PII: S0957-4484(04)80470-7
Influence of nanomorphology on the photovoltaic action of polymer–fullerene composites D Chirvase1, J Parisi1, J C Hummelen2 and V Dyakonov1,3
1 Energy and Semiconductor Research Laboratory, Department of Physics, University of Oldenburg, D-26111 Oldenburg, Germany 2 Molecular Electronics, MSC+, University of Groningen, Nijenborgh 4, 9747 AG Groningen, The Netherlands
Received 11 May 2004, in final form 2 August 2004 Published 10 August 2004 Online at stacks.iop.org/Nano/15/1317 doi:10.1088/0957-4484/15/9/035
Abstract Composites of conjugated poly(3-hexylthiophene) (P3HT) and the fullerene derivative [6,6]-phenyl-C61 butyric acid methyl ester (PCBM) demonstrate an efficient photogeneration of mobile charge carriers. Thermal annealing of P3HT:PCBM based devices gives rise to a significant increase of the photovoltaic efficiency, as follows from measurements of the external quantum efficiency and the current-voltage characteristics. Upon annealing, the absorption spectrum of the P3HT:PCBM composite undergoes a strong modification, whereas in the pure components it remains unchanged. The absorption of the annealed blends becomes stronger and red shifted in the wavelength region ascribed to P3HT, while the absorption due to the PCBM contribution does not change. Atomic force microscope measurements on P3HT:PCBM disclose some variation in morphology due to the crystallization of PCBM. The concentration of the PCBM clusters and their size (up to 500 nm) were found to be correlated with the amount of PCBM in the blend. We have studied the performance of photovoltaic devices with different weight ratios of P3HT:PCBM, namely, 1:3, 1:2, 1:1.5, 1:1, 1:0.9, 1:0.8, and 1:0.7. The photocurrent and the power conversion efficiency showed a maximum between 1:1 and 1:0.9. We conclude the variation in the absorption spectrum and the red shift to result from molecular diffusion of PCBM out of the polymer matrix upon annealing. The growth of the PCBM clusters leads to formation of percolation paths and, therefore, improves the photocurrent. Above a certain concentration, the PCBM crystals provide mechanical stress on the metal electrode, therefore possibly damaging the interface. Optimization of the composite weight ratio reveals the important role played by morphology for the transport properties of bulk heterojunction P3HT:PCBM based solar cells.
1. Introduction
Polymer photovoltaic devices represent one promising and challenging alternative in the pursuit for new renewable sources of electrical energy. In recent years of research in the field of materials science, both conjugated polymer [1]
and small molecule [2] based solar cell concepts have been developed.
The operating principle of organic solar cells is based on the photoexcitation of the organic absorber material consisting of a donor/acceptor mixture, creating an exciton, which is subsequently dissociated at the donor/acceptor interface. The process takes place within an ultrashort time interval (approximately 45 fs in the case of poly(2-methoxy-
3 Author to whom any correspondence should be addressed.
0957-4484/04/091317+07$30.00 © 2004 IOP Publishing Ltd Printed in the UK 1317
D Chirvase et al
5-3´,7´-dimethyloctyloxy-p-phenylene-vinylene)(MDMO–PPV):PCBM blends [3]), by orders of magnitude elapsing faster than other competitive recombination processes like photoluminescence [4]. The highest energy conversion efficiency reported so far in the literature is between 2.5% and 3.5% [5, 6]. The optimum overall performance of a polymer solar cell can be achieved via balancing the various requirements on light absorption, photogeneration, transport, and extraction of charge carriers. Among the materials investigated so far, poly(3-hexylthiophene) has demonstrated promising physical properties, for example, a good stability, reasonably high hole mobility in the range of 10–3 cm2 V–1 s–1 [7] and a field effect mobility which can be as high as 0.1–0.2 cm2 V–1 s–1 in high quality samples [8–10].
The process of thermal annealing has been demonstrated to considerably increase the efficiency of P3HT based light emitting diodes [11] and solar cells [6]. As a result of heating, the morphological structure of the organic active layer can be improved by reducing the free volume and the density of defects at the interface during evaporation of the solvent [11] and by enhancing interchain interactions [12]. In a bilayer structure, interdiffusion between the donor and the acceptor was observed [13]. In this way, the acceptor molecule may enter the exciton diffusion radius of the polymer, resulting in a highly efficient charge separation. Thermal annealing of polymer–polymer donor–acceptor blends with subsequent exposure to solvent vapour led to a significant increase of the charge carrier photogeneration efficiency [14]. Lee et al [15] reported on the positive influence of subjecting the polymer film to heat treatment to enhance the quantum efficiency of charge generation due to the change of morphology at the interface between polymer and electrode.
The way thermal annealing has been applied varies in the literature, and different effects are reported. It is well known that P3HT crystallizes as a result of thermal annealing, which can have a positive effect on the transport of holes [16]. Other experimental investigations that refer to polythiophene copolymers indicate a strong increase in the external quantum efficiency of photogenerated charge carriers when performing thermal annealing under chloroform vapour [17]. Mild thermal treatment, i.e., for a period of 30 min at a temperature of 55 °C [18] subject to P3HT:fulleropyrrolidine based solar cells, leads to an overall power conversion efficiency of 0.6%, while in the case of P3HT:PCBM based solar cells a thermal treatment of 4 min at 75 °C, together with an applied voltage of 2.7 V, reportedly yielded an efficiency of 3.5% at a white light illumination intensity of 80 mW cm–2 [6]. Furthermore, at temperatures higher than 100°C, the content of O2 in P3HT could no longer be detected due to a dedoping process, and the organic absorber became protected against deterioration [19]. All those experiments clearly demonstrate that there is a demand for additional studies to clarify the effects of thermal annealing and the evaluation of an optimum set of the crucial treatment parameters, annealing time and temperature.
In the following, the influence of thermal annealing on P3HT based solar cells is looked at via interpreting the measurements of the absorption spectrum, the external quantum efficiency of photogenerated charge carriers (EQE), and the current density–voltage (J–V) characteristics. Based on results obtained from atomic force microscopy (AFM), the
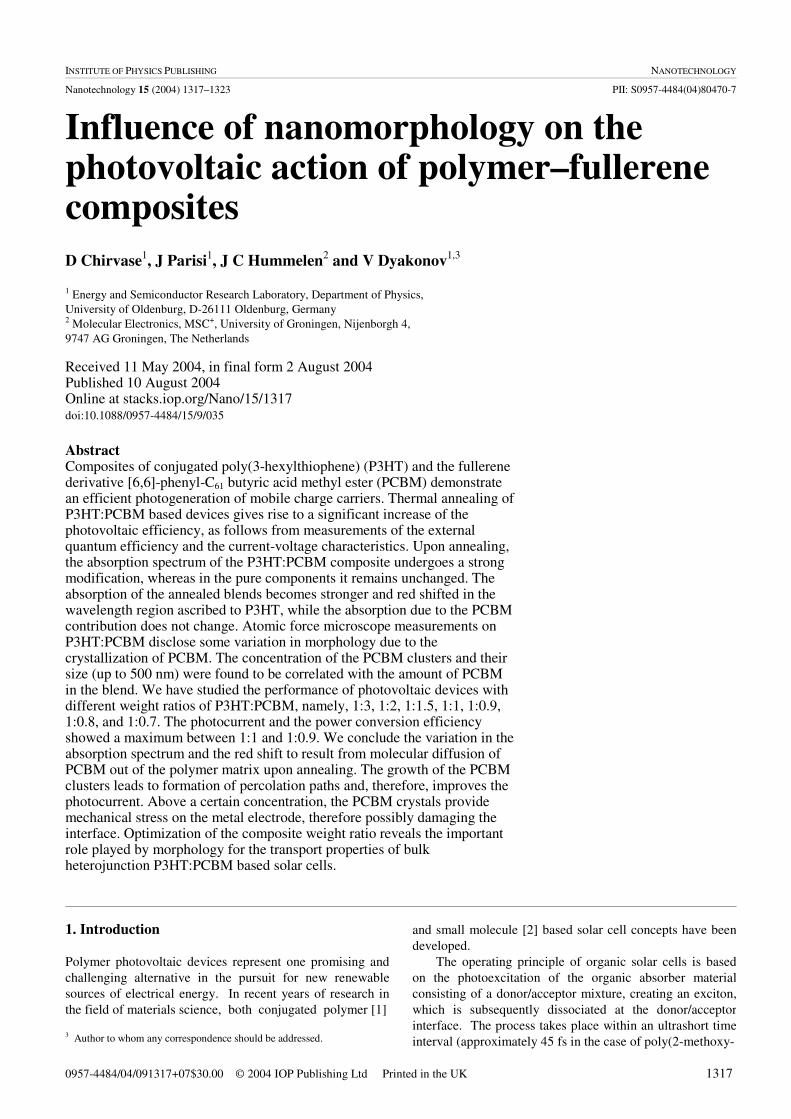
Figure 1. Chemical structure of the donor poly(3-hexylthiophene-2.5diyl) and the acceptor [6,6]-phenyl-C61 butyric acid methyl ester together with a schematic view of the electron transfer from donor to acceptor.
1318
role played by the acceptor PCBM in the morphology and the electrical performance of P3HT:PCBM based solar cells will be elucidated. In our studies, the optimum annealing temperature was found to be 130 °C with an annealing time of 20 s.
2. Experimental details
For the preparation of polymer solar cells, we have taken regioregular poly(3-hexylthiophene 2.5 diyl) (P3HT) as an electron donor, combined with the fullerene derivative [6,6]-phenyl-C61 butyric acid methyl ester (PCBM), a methanofullerene, as an acceptor, upon varying the P3HT:PCBM composite weight ratio from 1:0.7 through 1:0.8, 1:0.9, 1:1, 1:1.5, and 1:2 to 1:3. This corresponds to a PCBM weight percentage of 41%, 44%, 47%, 50%, 60%, 67%, and 75%, respectively. The chemical structures of the materials investigated and the mechanism of charge carrier generation are indicated in figure 1.
Regioregular P3HT synthesized following the Rieke procedure [20] was purchased from Rieke Met. Inc. The synthesis of the PCBM has been described elsewhere [21]. Those organic materials were used as received, without further purification. Bulk heterojunction ITO/PEDOT-PSS/P3HT:PCBM/Al solar cells were produced in the following way: the indium tin oxide (ITO) coated glass substrate (purchased from Merck AG with a surface resistance of 20 Ω sq–1) was cleaned in standard solvents and dried in a nitrogen flow. Afterwards, the O2 plasma etched ITO substrates were spin-coated with a thin layer of poly(3,4 ethylenedioxythiophene)poly(styrenesulfonate) (PEDOT-PSS) purchased from Bayer AG. After drying the PEDOT-PSS coated substrate for a period of about 30 min on a hot plate at a temperature of 100 °C, a thin layer of the active organic absorber P3HT:PCBM was applied on top of the substrate. The solution of P3HT:PCBM was prepared in chloroform, heated and stirred for more than one day at 50°C. Finally, Al electrodes (thickness 100 nm) were thermally evaporated on the organic active layer under high vacuum conditions at an evaporation rate of 0.2–0.5 nm s–1. The preparation of the active layers was performed in an inert gas atmosphere inside the glove box.
The thermal annealing procedure was accomplished by placing the solar cells on a hot plate at 130 °C for a period of 20 s under nitrogen atmosphere. The actual temperature of the hot plate was monitored by using a thermoresistor. According
Influence of nanomorphology on the photovoltaic action of polymer–fullerene composites
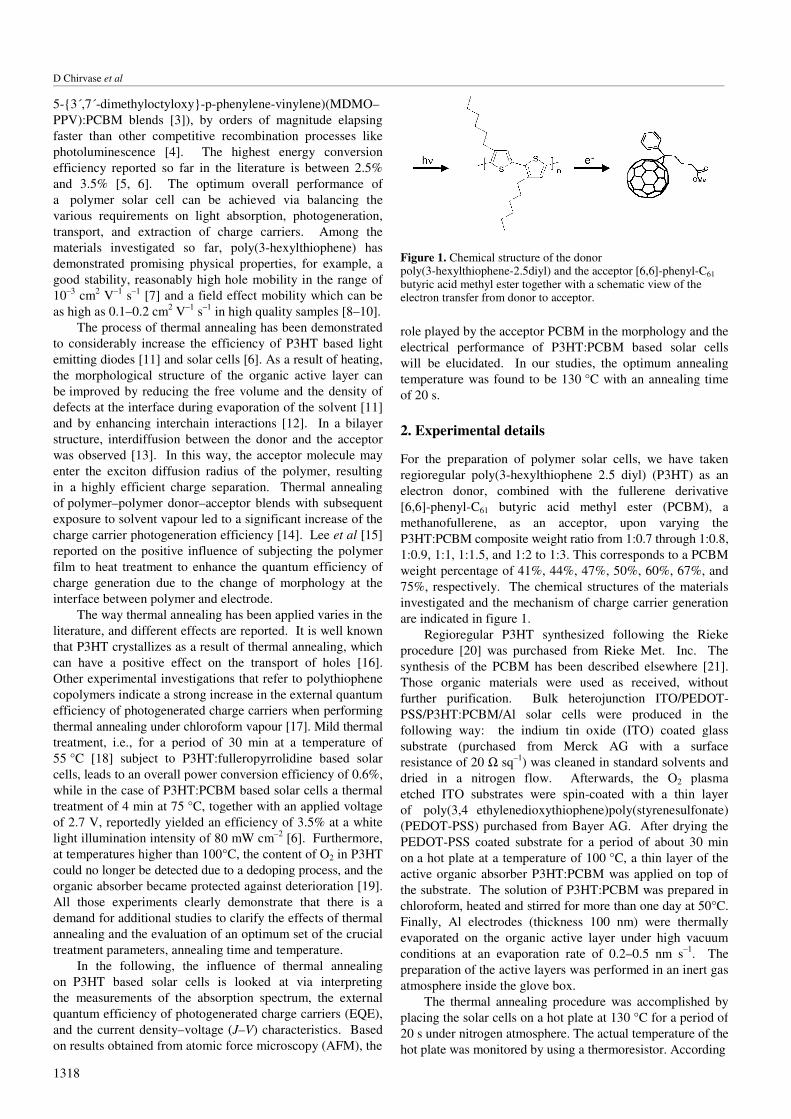
Figure 2. Absorption spectra of pure PCBM (a) and P3HT (b) films as cast (solid curves), annealed at TA = 130 °C for t = 20 s (dashed curves), and annealed for 1 h, TA = 130 °C (dotted curves).
to Zhao et al [22], the glass transition and the melting point temperatures of P3HT are 12 and 178°C, respectively, whereas Chen et al [20] determined a melting temperature of 240–245°C for head-to-tail regioregular P3HT, while no indication for a glass transition temperature was given. However, it is difficult to rely on a certain value without calorimetry measurements made on the particular material used. The effect of thermal annealing has been observed already at 75 °C in our case.
J–V curves of the P3HT:PCBM based solar cells were recorded by an Advantest TR 6143 source-monitor unit with the samples being placed in a liquid nitrogen cooled cryostat. A 150 W xenon lamp (Osram XB0 150 W/XBR) was utilized as an illumination source, with a water filter located inside the light path, in order to reduce the infrared part of the spectrum. The light intensity was calibrated at 100 mW cm–2 inside the cryostat at the sample position.
The absorption spectrum of the P3HT:PCBM organic layer taken before and after the annealing procedure was measured by a Varian Cary 5E UV–VIS spectrometer. Monochromatic incident photon conversion efficiency spectra (EQE) were recorded using a lock-in based set-up equipped with a calibrated Si/Ge photodiode as reference detector. The light originating from the halogen and xenon lamps was spectrally dispersed to cover the range of wavelength from 250 to 1000 nm.
AFM images have been taken with a Digital Instruments Vecco microscope operated in the tapping mode.
Figure 3. Absorption spectra of a P3HT:PCBM composite film as cast (solid curve) and after four successive thermal annealing steps, as indicated in the legend. The PCBM concentration is 67%.
3. Results and discussion
Absorption spectra of the pure components (P3HT, PCBM) and their mixture (P3HT:PCBM) were investigated before and after thermal annealing. As a result of the latter, almost no change was observed in the case of pure PCBM (figure 2(a)). Also in the case of pure P3HT (figure 2(b)), no change in absorption spectrum after annealing can be seen, just a small increase in the absorption intensity. In case of the P3HT:PCBM mixture (figure 3), two peaks are distinguished in the absorption spectrum of the nontreated film. The peak around 335 nm stems from PCBM, while the peak at 440 nm represents the contribution of P3HT. Upon annealing, the PCBM peak remains unchanged, whereas in the region of P3HT absorption a pronounced red shift becomes evident (the peak at 440 nm in the case of the nontreated cell shifts to 507 nm after 1 h of thermal annealing). The absorption band edge shift is even larger; it exceeds 100 nm. The apparent modification of the P3HT:PCBM absorption spectrum can be attributed to the particular thermochromic properties of P3HT and to the molecular diffusion of PCBM in the polymer matrix [23]. This issue will be addressed later on. After one hour of thermal annealing, the overall absorption spectrum of the P3HT:PCBM film looks different compared to the untreated case, i.e., the region around the absorption peak of P3HT extends towards longer wavelengths, and also the height of the peak increases. The absorption shoulder around 620 nm supposed to result from interchain interactions [12] becomes higher and more pronounced.
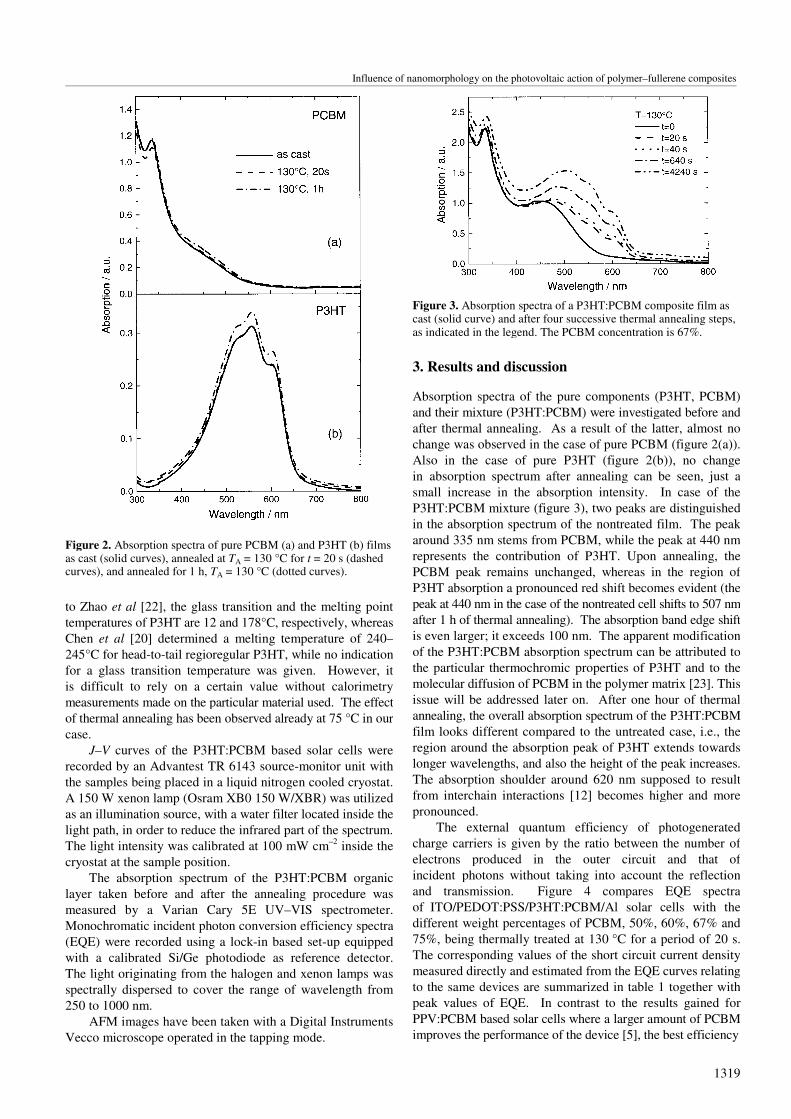
The external quantum efficiency of photogenerated charge carriers is given by the ratio between the number of electrons produced in the outer circuit and that of incident photons without taking into account the reflection and transmission. Figure 4 compares EQE spectra of ITO/PEDOT:PSS/P3HT:PCBM/Al solar cells with the different weight percentages of PCBM, 50%, 60%, 67% and 75%, being thermally treated at 130 °C for a period of 20 s. The corresponding values of the short circuit current density measured directly and estimated from the EQE curves relating to the same devices are summarized in table 1 together with peak values of EQE. In contrast to the results gained for PPV:PCBM based solar cells where a larger amount of PCBM improves the performance of the device [5], the best efficiency
1319
D Chirvase et al
Figure 4. External quantum efficiency spectra of ITO/PEDOT:PSS/P3HT:PCBM/Al solar cells with different PCBM concentrations, as indicated in the legend, TA = 130 °C, t = 20 s.
Table 1. Peak values of external quantum efficiency and short circuit current density both estimated from EQE and measured on ITO/PEDOT:PSS/P3HT:PCBM/Al solar cells fabricated with different PCBM concentrations.
Jsc (mA cm–2) estimated from
PCBM EQE maxim EQE Jsc (mA cm–2) concentration (%) (%) (320–800 nm) measured
50 61.7 8.93 7.8 60 55.48 7.39 5.51 67 26.63 2.1 2.99 75 14.94 1.42 1.64
is obtained for much lower concentration of the fullerene acceptor. Interestingly, the same tendency in the weight ratio dependence of the EQE spectra of treated and untreated P3HT:PCBM based cells can be observed (not shown).
So far, the following conclusion that is relevant for the effect of thermal annealing can be drawn: in all cases, EQE strongly increases after thermal annealing, the most pronounced enhancement being achieved for the P3HT:PCBM based solar cell with a PCBM weight percentage of 50%. To make clear that this effect is not simply due to increased fraction of the photosensitive component (in our case P3HT), we further decreased the concentration of PCBM (see below).
The question arises of the relevance of the morphology for the device performance. As previously mentioned for PPV:PCBM based devices, the most efficient cell was fabricated by taking a weight ratio of MDMO–PPV:PCBM = 1:4, i.e., with 80% PCBM [5]. Martens et al [24] and later on van Duren et al [25] have demonstrated that phase separation in MDMO–PPV:PCBM sets in at 50% PCBM, leading to an improved electron transport, a reduced recombination, and hence to an optimum performance at 80% PCBM. Above 50% PCBM, the domains of rather pure PCBM are formed in a matrix of a non-phase-separated blend. We note that no annealing has been applied to the blends discussed in the above mentioned papers. In the case of polythiophene:fullerene based solar cells, the optimum ratio of donor and acceptor is unclear. Dittmer et al [26], working on P3HT:perylene dye blend based solar cells, pointed out that perylene crystal domains are formed and become larger with increasing dye concentration. Thermal annealing of blends
1320
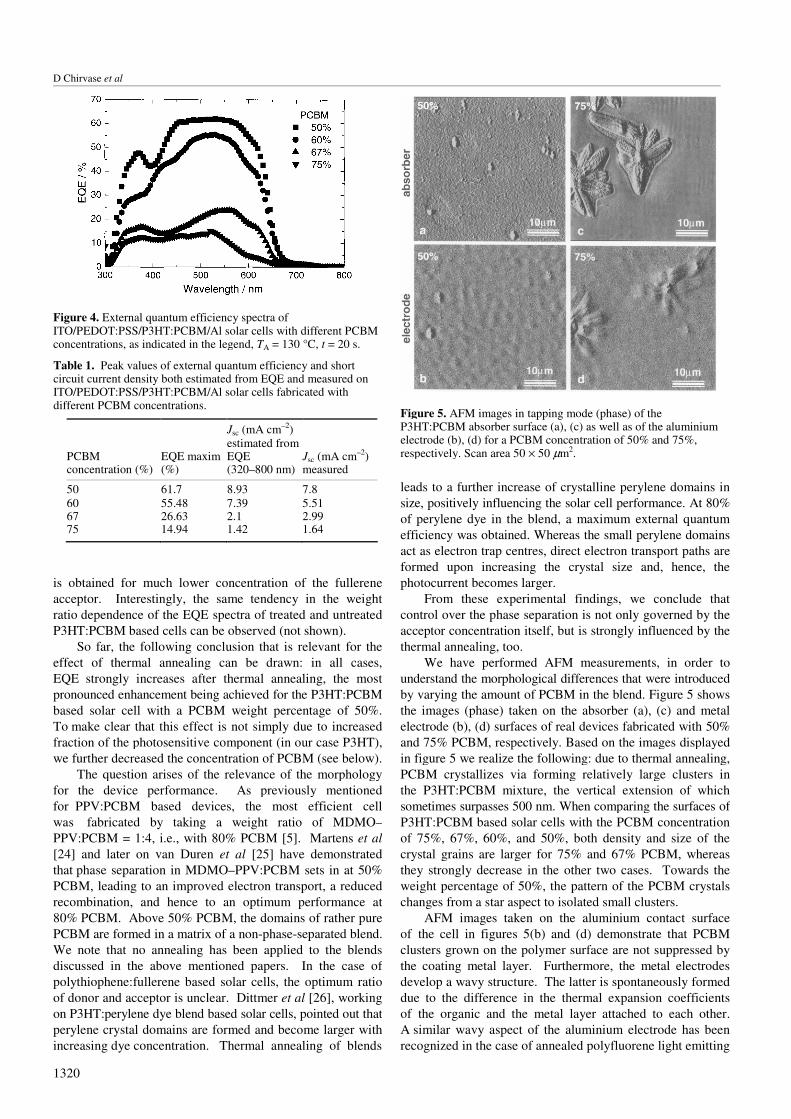
Figure 5. AFM images in tapping mode (phase) of the P3HT:PCBM absorber surface (a), (c) as well as of the aluminium electrode (b), (d) for a PCBM concentration of 50% and 75%, respectively. Scan area 50 × 50 µm2.
leads to a further increase of crystalline perylene domains in size, positively influencing the solar cell performance. At 80% of perylene dye in the blend, a maximum external quantum efficiency was obtained. Whereas the small perylene domains act as electron trap centres, direct electron transport paths are formed upon increasing the crystal size and, hence, the photocurrent becomes larger.
From these experimental findings, we conclude that control over the phase separation is not only governed by the acceptor concentration itself, but is strongly influenced by the thermal annealing, too.
We have performed AFM measurements, in order to understand the morphological differences that were introduced by varying the amount of PCBM in the blend. Figure 5 shows the images (phase) taken on the absorber (a), (c) and metal electrode (b), (d) surfaces of real devices fabricated with 50% and 75% PCBM, respectively. Based on the images displayed in figure 5 we realize the following: due to thermal annealing, PCBM crystallizes via forming relatively large clusters in the P3HT:PCBM mixture, the vertical extension of which sometimes surpasses 500 nm. When comparing the surfaces of P3HT:PCBM based solar cells with the PCBM concentration of 75%, 67%, 60%, and 50%, both density and size of the crystal grains are larger for 75% and 67% PCBM, whereas they strongly decrease in the other two cases. Towards the weight percentage of 50%, the pattern of the PCBM crystals changes from a star aspect to isolated small clusters.
AFM images taken on the aluminium contact surface of the cell in figures 5(b) and (d) demonstrate that PCBM clusters grown on the polymer surface are not suppressed by the coating metal layer. Furthermore, the metal electrodes develop a wavy structure. The latter is spontaneously formed due to the difference in the thermal expansion coefficients of the organic and the metal layer attached to each other. A similar wavy aspect of the aluminium electrode has been recognized in the case of annealed polyfluorene light emitting
Influence of nanomorphology on the photovoltaic action of polymer–fullerene composites
diodes; however, the annealing was done before evaporating the aluminium electrodes [27], and on heat-treated metal–polymer bilayers [28].
Generally, the phase separation within the blend starts already in the solution, but is interrupted for the moment by the film formation during the spin coating process. The spin coated film represents a frozen-in picture. The thermal annealing procedure allows for further modifications of the morphology of PCBM:P3HT blends, as the thermodynamically driven phase separation goes on. Heating at a certain annealing temperature above the glass transition point (Tg) of the polymer, the organic compounds (in our case fullerene) may diffuse in the polymer matrix, aided by the increasing of the free volume of the latter. By cooling down to the initial temperature, the free volume decreases, freezing in the morphology again. Depending on the duration and the concentration, PCBM crystal domains are built up. It should be emphasized that the above thermally induced diffusion does not involve a chemical reaction between P3HT and PCBM. The relevant effect we assume is the formation of the structurally better ordered P3HT phase with the stronger interchain interaction [12]. Evidence for the latter can be derived from the shape of the absorption spectrum of the P3HT:PCBM blend (see figure 3). There, we observe a clear and distinct red shift in the spectrum of the annealed mixture. Of particular note remains the significant increase in the absorption peak of P3HT following the course of annealing relative to the untreated case. Such an effect might be due to some modification of the ordering within the polythiophene phase. Before annealing, polythiophene is present in a less planar, so-called ‘yellow phase’ caused by a large amount of the ‘hindering’ fullerene in the blend, with an absorption maximum around 450 nm. (Note that the PCBM absorption contributes to the overall absorption in this range, too (figure 2(a)), however, it is much smaller.) During annealing, the more planar backbone structure of the P3HT is formed (‘red phase’) in the course of the molecular diffusion of PCBM. In the case of pure P3HT (figure 2(b)), the red phase with its characteristic absorption (maximum at 560 nm) and partially resolved vibronic structure is formed already during the spin coating procedure.
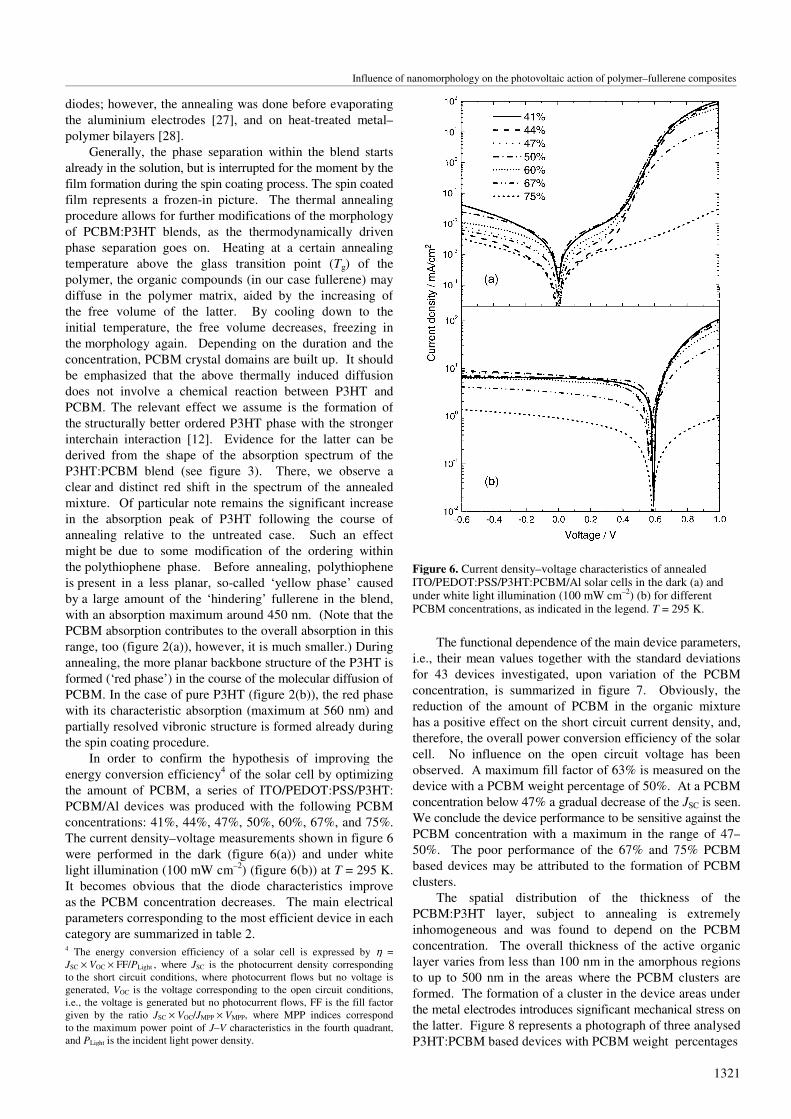
In order to confirm the hypothesis of improving the energy conversion efficiency4 of the solar cell by optimizing the amount of PCBM, a series of ITO/PEDOT:PSS/P3HT: PCBM/Al devices was produced with the following PCBM concentrations: 41%, 44%, 47%, 50%, 60%, 67%, and 75%. The current density–voltage measurements shown in figure 6 were performed in the dark (figure 6(a)) and under white light illumination (100 mW cm–2) (figure 6(b)) at T = 295 K. It becomes obvious that the diode characteristics improve as the PCBM concentration decreases. The main electrical parameters corresponding to the most efficient device in each category are summarized in table 2. 4 The energy conversion efficiency of a solar cell is expressed by η = JSC × VOC × FF/PLight , where JSC is the photocurrent density corresponding to the short circuit conditions, where photocurrent flows but no voltage is generated, VOC is the voltage corresponding to the open circuit conditions, i.e., the voltage is generated but no photocurrent flows, FF is the fill factor given by the ratio JSC × VOC/JMPP × VMPP, where MPP indices correspond to the maximum power point of J–V characteristics in the fourth quadrant, and PLight is the incident light power density.
Figure 6. Current density–voltage characteristics of annealed ITO/PEDOT:PSS/P3HT:PCBM/Al solar cells in the dark (a) and under white light illumination (100 mW cm–2) (b) for different PCBM concentrations, as indicated in the legend. T = 295 K.
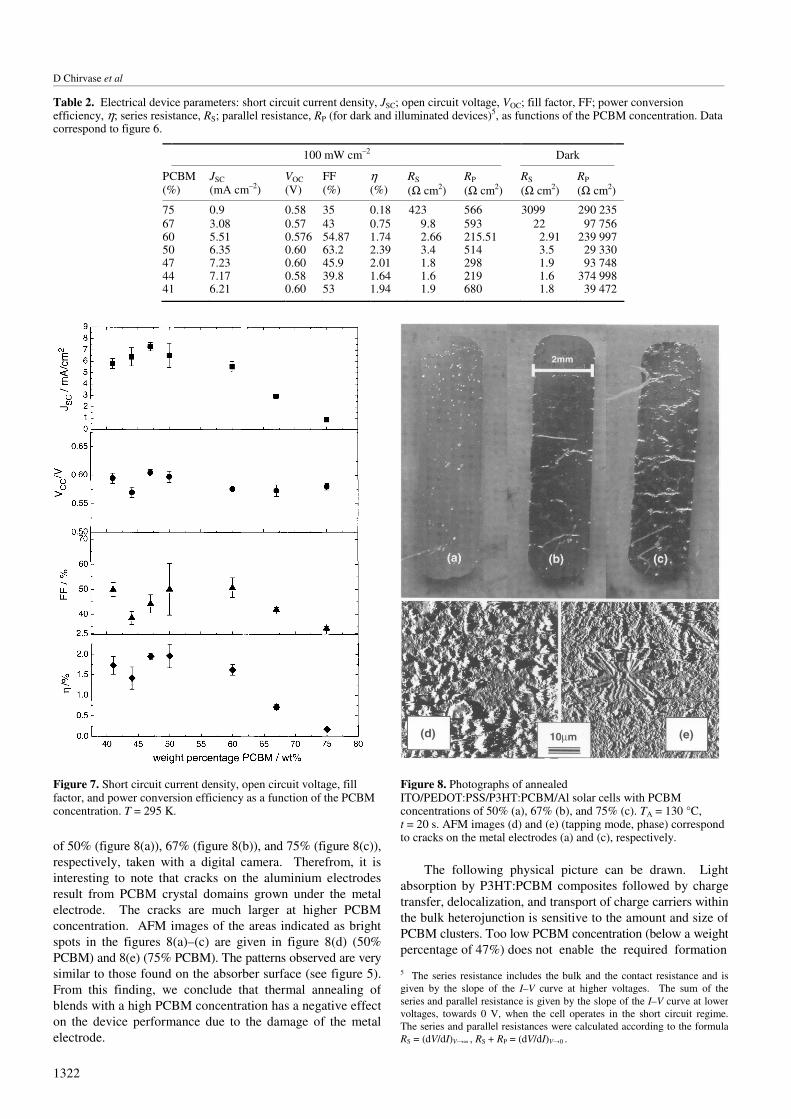
The functional dependence of the main device parameters, i.e., their mean values together with the standard deviations for 43 devices investigated, upon variation of the PCBM concentration, is summarized in figure 7. Obviously, the reduction of the amount of PCBM in the organic mixture has a positive effect on the short circuit current density, and, therefore, the overall power conversion efficiency of the solar cell. No influence on the open circuit voltage has been observed. A maximum fill factor of 63% is measured on the device with a PCBM weight percentage of 50%. At a PCBM concentration below 47% a gradual decrease of the JSC is seen. We conclude the device performance to be sensitive against the PCBM concentration with a maximum in the range of 47–50%. The poor performance of the 67% and 75% PCBM based devices may be attributed to the formation of PCBM clusters.
The spatial distribution of the thickness of the PCBM:P3HT layer, subject to annealing is extremely inhomogeneous and was found to depend on the PCBM concentration. The overall thickness of the active organic layer varies from less than 100 nm in the amorphous regions to up to 500 nm in the areas where the PCBM clusters are formed. The formation of a cluster in the device areas under the metal electrodes introduces significant mechanical stress on the latter. Figure 8 represents a photograph of three analysed P3HT:PCBM based devices with PCBM weight percentages
1321
D Chirvase et al
Table 2. Electrical device parameters: short circuit current density, JSC; open circuit voltage, VOC; fill factor, FF; power conversion efficiency, η; series resistance, RS; parallel resistance, RP (for dark and illuminated devices)5, as functions of the PCBM concentration. Data correspond to figure 6.
100 mW cm–2 Dark
PCBM JSC VOC FF η RS RP RS RP (%) (mA cm–2) (V) (%) (%) (Ω cm2) (Ω cm2) (Ω cm2) (Ω cm2)
75 0.9 0.58 35 0.18 423 566 3099 290 235 67 3.08 0.57 43 0.75 9.8 593 22 97 756 60 5.51 0.576 54.87 1.74 2.66 215.51 2.91 239 997 50 6.35 0.60 63.2 2.39 3.4 514 3.5 29 330 47 7.23 0.60 45.9 2.01 1.8 298 1.9 93 748 44 7.17 0.58 39.8 1.64 1.6 219 1.6 374 998 41 6.21 0.60 53 1.94 1.9 680 1.8 39 472
Figure 7. Short circuit current density, open circuit voltage, fill factor, and power conversion efficiency as a function of the PCBM concentration. T = 295 K.
of 50% (figure 8(a)), 67% (figure 8(b)), and 75% (figure 8(c)), respectively, taken with a digital camera. Therefrom, it is interesting to note that cracks on the aluminium electrodes result from PCBM crystal domains grown under the metal electrode. The cracks are much larger at higher PCBM concentration. AFM images of the areas indicated as bright spots in the figures 8(a)–(c) are given in figure 8(d) (50% PCBM) and 8(e) (75% PCBM). The patterns observed are very similar to those found on the absorber surface (see figure 5). From this finding, we conclude that thermal annealing of blends with a high PCBM concentration has a negative effect on the device performance due to the damage of the metal electrode.
1322
Figure 8. Photographs of annealed ITO/PEDOT:PSS/P3HT:PCBM/Al solar cells with PCBM concentrations of 50% (a), 67% (b), and 75% (c). TA = 130 °C, t = 20 s. AFM images (d) and (e) (tapping mode, phase) correspond to cracks on the metal electrodes (a) and (c), respectively.
The following physical picture can be drawn. Light absorption by P3HT:PCBM composites followed by charge transfer, delocalization, and transport of charge carriers within the bulk heterojunction is sensitive to the amount and size of PCBM clusters. Too low PCBM concentration (below a weight percentage of 47%) does not enable the required formation
5 The series resistance includes the bulk and the contact resistance and is given by the slope of the I–V curve at higher voltages. The sum of the series and parallel resistance is given by the slope of the I–V curve at lower voltages, towards 0 V, when the cell operates in the short circuit regime. The series and parallel resistances were calculated according to the formula RS = (dV/dI)V∞ , RS + RP = (dV/dI)V0 .
Influence of nanomorphology on the photovoltaic action of polymer–fullerene composites
of the percolated electron transport paths. In contrast, too high PCBM concentration (above 60%) leads to a partial damage of the absorber–metal interface due to the formation of voluminous PCBM clusters. The driving force and the physical mechanism behind the PCBM cluster growth are thermal annealing and molecular diffusion, respectively. We suggest that the optimum PCBM concentration in the blend is in the range of 50%. The fullerene surplus at higher concentrations is no longer homogeneously dispersed within the polymer matrix, but diffuses away and creates phase separated clusters. Apart from the PCBM concentration in the blend, further essential parameters, namely, the annealing temperature, the duration, and the solution concentration, are important. The conclusions of the present work are valid for the particular annealing and preparation conditions used.
4. Conclusion
We have analysed the consequences of thermal annealing on ITO/PEDOT:PSS/P3HT:PCBM/Al photovoltaic devices. The overall message resulting from these experiments is that, in spite of a considerable increase in the short circuit current density due to heat treatment, a large amount of PCBM in the P3HT:PCBM based devices does not automatically imply a higher energy conversion efficiency. In our experimental study, the PCBM concentration in the bulk heterojunction P3HT:PCBM composites has been optimized to approximately 50%, the critical value of which stems from the mutual interplay between an efficient generation of mobile charge carriers via photoinduced charge transfer, on the one hand, and an efficient carrier transport, less affected by recombination processes, on the other hand.
Acknowledgments
The authors would like to thank I Riedel, Z Chiguvare, and U Okoroanyanwu for fruitful discussions, G Wittstock, E Hassel-Schneider, and J Reemts for experimental support during the AFM measurements, H Holtorf, T Miesner, and H Koch for technical assistance, and, finally, the European Commission for financial support (EU-RTN Project EUROMAP under contract HPRN-CT-2000-00 127).
References [1] Yu G, Gao J, Hummelen J C, Wudl F and Heeger A J 1995
Science 270 1789 [2] Tang C W 1986 Appl. Phys. Lett. 48 183
[3] Brabec C, Zerza G, Cerullo G, de Silvestri S, Luzzati S, Hummelen J C and Sariciftci N S 2001 Chem. Phys. Lett. 340 232
[4] Suppan P 1994 Chemistry and Light (London: The Royal Society of Chemistry)
[5] Shaheen S E, Brabec C J, Padinger F, Fromherz T, Hummelen J C and Sariciftci N S 2001 Appl. Phys. Lett. 78 841
[6] Padinger F, Rittberger R and Sariciftci N S 2003 Adv. Funct. Mater. 13 1
[7] Pandey S S, Takashima W, Nagamatsu S, Endo T, Rikukawa M and Kaneto K 2000 Japan. J. Appl. Phys. 39 94
[8] Bao Z, Dodabalapur A and Lovinger A J 1996 Appl. Phys. Lett. 69 4108
[9] Sirringhaus H, Tessler N and Friend R H 1998 Science 280 1741
[10] Ullmann A, Ficker J, Fix W, Rost H, Clemens W, McCulloch I and Giles M 2002 Materials Research Society Symp. Proc. vol 665, ed G E Jabbour and N S Sariciftci (Pittsburgh, PA: Materials Research Society)
[11] Ahn T and Sein-Ho Ha H L 2002 Appl. Phys. Lett. 80 392 [12] Brown P J, Thomas D S, Köhler A, Wilson J, Kim J-S,
Ramsdale C, Sirringhaus H and Friend R H 2003 Phys. Rev. B 67 064203
[13] Drees M, Premaratne K, Graupner W, Heflin J R, Davis R M, Marciu D and Miller M 2002 Appl. Phys. Lett. 81 4607
[14] Pacios R and Bradley D D C 2001 Synth. Met. 9149 1 [15] Lee T W and Park O O 2000 Macromolecules 11 801 [16] Nakazono M, Kawai T and Yoshino K 1994 Chem. Mater. 6
864 [17] Zhang F, Svensson M, Andersson M, Maggini M, Bucella S,
Menna E and Inganäs O 2001 Adv. Mater. 13 1871 [18] Camaioni N, Ridolfi G, Casalbore-Miceli G, Possamai G and
Maggini M 2002 Adv. Mater. 14 1735 [19] Mattis B A, Chang P C and Subramarian V 2003 Mater. Res.
Soc. Symp. Proc. 771 L.10.35.1 [20] Chen T-A, Wu X and Rieke D 1995 J. Am. Chem. Soc. 117 233 [21] Hummelen J C, Knight B W, LePeq F, Wudl F. Yao J and
Wilkins C L 1995 J. Org. Chem. 60 532 [22] Zhao Y, Yuan G, Roche P and Leclerc M 1995 Polymer 36
2211 [23] Lucht B L, Euler W B and Gregory O J 2002 Polymer
Preprints 43 59 [24] Martens T, D’Haen J, Munters T, Beelen Z, Goris L, Manca J,
D’Olieslaeger M. Vanderzande D, De Schepper L and Andriessen R 2003 Synth. Met. 138 243
[25] van Duren J K J, Yang X, Loos J, Bulle-Lieuwma C W T, Sieval A B, Hummelen J C and Janssen R A J 2004 Adv. Funct. Mater. 14 425
[26] Dittmer J, Marseglia E and Friend R H 2000 Adv. Mater. 12 1270
[27] Kim J, Lee J, Han C W, Lee N Y and Chung I-J 2003 Appl. Phys. Lett. 82 4238
[28] Kim J and Lee H H 2001 J. Polym. Sci. B 39 1122
1323