Embed Size (px)
Citation preview
University of Groningen
Life courses of immigrants and their descendantsKleinepier, Tom
IMPORTANT NOTE: You are advised to consult the publisher's version (publisher's PDF) if you wish to cite fromit. Please check the document version below.
Document VersionPublisher's PDF, also known as Version of record
Publication date:2016
Link to publication in University of Groningen/UMCG research database
Citation for published version (APA):Kleinepier, T. (2016). Life courses of immigrants and their descendants. [Groningen]: University ofGroningen.
CopyrightOther than for strictly personal use, it is not permitted to download or to forward/distribute the text or part of it without the consent of theauthor(s) and/or copyright holder(s), unless the work is under an open content license (like Creative Commons).
Take-down policyIf you believe that this document breaches copyright please contact us providing details, and we will remove access to the work immediatelyand investigate your claim.
Downloaded from the University of Groningen/UMCG research database (Pure): http://www.rug.nl/research/portal. For technical reasons thenumber of authors shown on this cover page is limited to 10 maximum.
Download date: 27-03-2020
5Life paths of migrants:
A sequence analysis of Polish migrants’ family-life trajectories
This chapter was published as: Kleinepier, T., de Valk, H.A.G., & van Gaalen, R.I.A. (2015). Life paths of migrants: a sequence
analysis of Polish migrants’ family-life trajectories. European Journal of Population, 31(2):155-179.

121Life paths of migrants
5
5.1 Introduction
The family-life dynamics of international migrants have become a core topic in demo-
graphic studies over the past decades (Kulu & Gonzalez-Ferrer, 2014). These studies have
focused on different aspects of family-life behavior. For instance, previous research shows
that international migration and partner selection are frequently interrelated (Milewski,
2003), that moving over long distances influences the stability of a union (Boyle et al.,
2008; Frank & Wildsmith, 2005), and that migration may alter fertility behavior (Lindstrom
& Giorguli Saucedo, 2002; Milewski, 2007). Many of these studies have focused on the
impact of migration on a specific event in the life course. By focusing on events, however,
one may miss a deeper insight into the life course, which is unfortunate as life-course
theory emphasizes that different events in the life course are not separate experiences,
but are linked to one another (Giele & Elder, 1998).
The main research objective of this paper is to go beyond this event-oriented approach
and to provide a more integral picture of the link between migration and family behavior. We
develop an empirically grounded typology of partnership, fertility, and migration behavior
by applying sequence analysis. This technique can be seen as complementing to the often
applied techniques of event history analysis: whereas event history analysis concentrates
primarily on causal effects for transitions from one state to another, sequence analysis is an
approach aimed at exploring and describing actual life-course trajectories and has more
descriptive value (Aisenbrey & Fasang, 2010; Billari, 2001a). Although sequence analysis
has increasingly been used in life course research over the past decade (e.g., Aassve et
al., 2007; Billari et al., 2006; Bras et al., 2010; Elzinga & Liefbroer, 2007), the technique has
been relatively little applied in the migration literature. The application of sequence analysis
also in the field of migration studies is however a fruitful approach, as it offers a digestible
overview of the complex interrelationship between migration and family dynamics.
Our study focuses on young adult Polish migrants who have recently arrived in the
Netherlands. Polish migration to the Netherlands has increased sharply in the past decade
and Polish nationals are the largest migrant group settling in the country nowadays
(Dagevos, 2011; Statistics Netherlands, 2014). The majority of recent Polish migrants in
the Netherlands has migrated at the age of making the transition to adulthood (Statistics
Netherlands, 2014). Nevertheless, much research on the family dynamics of immigrants
in the Netherlands still focuses on the traditional origin groups (Turks, Moroccans,
Surinamese, and Antilleans), while knowledge on those of Polish origin in the country
Chapter 5122
remains rather limited (see Dagevos, 2011; Engbersen et al., 2013; Korf, 2009; Schothorst,
2009 for exceptions). Although there are some recent quantitative studies on Polish
migration to other European countries, such as the UK (Drinkwater et al., 2009; White,
2011; see also the papers in Burrell, 2009) and Germany (Nowicka, 2013), these papers
have mainly been focused on labor market integration whilst relatively few studies have
focused on the private (family) domain of these migrants. The family context of Polish
migrants in Europe has so far mainly been limited to qualitative research (e.g., Levrau et
al., 2014; Moskal, 2011; Ryan et al., 2009; Ryan & Sales, 2013).
Poland is part of the European Union (EU) since 2004 and Polish migrants are thus free
to settle in other EU member states (with some initial barriers on the labor market after EU
entry). In this regard, Polish migrants differ strongly from migrants from outside the EU for
whom it is much more difficult to travel back and forth between the Netherlands and their
country of origin due to compulsory visa requirements (Dagevos, 2011). A crucial question
of the relatively new intra-European migration flows is therefore whether these migrants
will stay temporarily or whether they will settle permanently. Besides economic reasons
for returning to the country of origin, the family context also plays a crucial role in the
return decisions of immigrants (Bijwaard & van Doeselaar, 2012; Dustmann, 2003). We will
pay specific attention to this and study the permanence of settlement in relation to family
trajectories. The trajectory-based approach applied in this study is particularly valuable
in this regard, as it allows us to distinguish between short-term circular migration and
more permanent return migration. The paper is guided by the following three research
questions: First, what types of family-life trajectories can be distinguished among young
adult Polish migrants in the Netherlands. Second, how do different trajectories relate
to return/circular migration? Third, to what extent are the various life course subtypes
related to individual background characteristics?
To address our research questions, we use unique longitudinal population register
data from the System of Social statistical Datasets (SSD) that cover the entire population
of the Netherlands (Bakker et al., 2014). The SSD provides detailed information on the
timing of migration and family life events, allowing to reconstruct the life-course trajectory
for each individual migrant. Our analyses focus on young adult (aged 20-30 at migration)
Polish migrants who have recently arrived in the Netherlands. The family trajectories of
these migrants are followed for a period of five years on a monthly time base. We thus
cover a dynamic period of the life course, in which many demographic family events may
occur within a condensed period of time (Rindfuss, 1991).
123Life paths of migrants
5
5.2 Background
5.2.1 Polish migrants in the Netherlands
Various groups of immigrants have come to the Netherlands since the middle of the
20th century. These immigration flows were initially dominated by migrants from (former)
colonies (e.g., Surinam and the Netherlands Antilles) and labor migrants from Medi-
terranean countries (e.g., Turkey and Morocco), followed by family reunification in the
1970s and 1980s. The number of asylum seekers increased significantly in the 1990s, but
this group still constitutes a relative small proportion of immigrants and covers a wide
variety of backgrounds. In the past decade, a large share of immigrants to the Netherlands
came from countries in Eastern Europe, in particular Poland (Statistics Netherlands, 2014).
Although Polish migration to the Netherlands is not solely a recent phenomenon, the
influx of Polish migrants to the country has increased sharply since Poland joined the
EU in May 2004 (Dagevos, 2011). The EU membership entitled Poles to settle freely in
other member state countries, but in the Netherlands an employment permit was still
required for labor migrants until May 2007 (Korf, 2009). In this study, we exclusively focus
on Polish migrants who have come to the Netherlands after Poland’s accession to the EU,
but before the obligation of an employment permit was abolished.
Since 2004, Polish nationals constitute the largest group of immigrants arriving in the
Netherlands. At the same time, a large share also returns to Poland: about 60% of those
who arrived in the past decade has left the country within seven years (Nicolaas, 2011;
Statistics Netherlands, 2014). The large majority (90%) returned to Poland, which implies
that there is no substantial onward migration to other EU countries (Dagevos, 2011).
Despite the relatively high levels of return migration, the net migration has been strongly
positive since 2004 and has varied between 5,000 to 11,000 persons per year (Statistics
Netherlands, 2014). As a result, the number of Polish residents in the Netherlands has
increased substantially over the past decade. As of 1 January 2014, 123,003 individuals
with a Polish background were entered in the population registers of the Netherlands (on
a total population of 16.7 million), compared to 35,542 in 2004 (Statistics Netherlands,
2014). Some 25% of the Polish community in the country nowadays is born in the
Netherlands, but has at least one parent who is born in Poland (second generation)
(Statistics Netherlands, 2014). The second generation is considerably smaller than that of
the traditional migrant groups in the Netherlands, which is connected to the fact that a
large share of first generation of Polish migrants only recently arrived in the Netherlands.
Chapter 5124
Nearly 70% of the registered Polish migrants in the Netherlands aged between 15 and
65 is in paid employment. This is comparable to the employment rate of the native Dutch
population and more favorable than that of many non-Western origin groups in the country
(Dagevos, 2011). The completed level of education of Polish migrants is lower than that of the
Dutch, but much higher than that of many non-Western and other Eastern European origin
groups (Dagevos, 2011). However, previous studies have shown that there is a clear mismatch
between Polish migrants’ qualifications and the jobs they carry out in the Netherlands (often
over-qualified) (Schothorst, 2009). Many Polish migrants are employed in low-skilled jobs in
industry, construction, and agriculture on temporary contracts and are thus susceptible to
unemployment. The Dutch minimum wage is nevertheless usually higher than the salary they
would earn in their own occupation in Poland (Korf, 2009). Finally, the majority of Polish mi-
grants has a rather poor command of the Dutch language, which is not surprising given their
relatively short time of residence in the Netherlands (Dagevos, 2011; Schothorst, 2009).
5.2.2 Family events in Poland
Starting in the 1960s, many countries in Northern and Western Europe underwent con-
siderable changes in the transition to adulthood. Young adults postponed marriage and
childbearing, while alternative living arrangements (living single, remaining childless,
non-marital cohabitation) became more common (Billari & Liefbroer, 2010; Corijn & Klijzing,
2001). Until the early 1990s, Central and Eastern European (CEE) countries had main-
tained their traditional patterns of fertility and partnership behavior (Lesthaeghe &
Surkyn, 2002). With the collapse of the communist political system in 1989, however, CEE
countries went from a state-controlled economy and society to a more democratic and
capitalist economic society, resulting in more freedom of individual choice and lifestyle
as well as new economic constraints (Sobotka, 2002). These shifts have resulted in rapid
changes in the pace and structure of the transition to adulthood in CEE as well.
One of the most striking demographic changes in Poland since 1990 has been the
dramatic decrease in the number of births. The total fertility rate (TFR) dropped from 2.07
in 1989 to 1.22 in 2003. In addition, the highest level of age-specific fertility shifted from
the 20-24 age group to the 25-29 age group, indicating that women have been delaying
childbearing (Kotowska et al., 2008). Similarly, the propensity to marry has decreased and
marriage has been postponed as well. Few marriages are nowadays contracted among
those in the early twenties; both men and women are more likely to marry in the mid late
twenties (Kotowska et al., 2008).
125Life paths of migrants
5
Regarding the incidence of unmarried cohabitation in Poland, various authors with
different sources of cross-sectional data have shown a rather low incidence of about 1 to
5% of all unions (Fihel, 2005; Kotowska et al., 2008). Using retrospective data Matysiak
(2009) shows that, despite its low incidence overall, there is strong upward trend in the
choice of cohabitation as a first-union type since the 1990s. In the 2004-2006 period, 33%
of all first unions were non-marital cohabiting relations (Matysiak, 2009). Nevertheless,
these consensual unions are of short duration and mainly function as a prelude to
marriage (Fihel, 2005; Mynarska & Bernardi, 2007). The majority of cohabiters in Poland
are thus young adults (aged 20-29) and have never been married (Fihel, 2005). Although
the number of out-of-wedlock births has increased since 1990 (Kotowska et al., 2008),
fertility in Poland is still strongly related to marriage (Matysiak, 2009).
Despite these changes in the past decades, patterns of union and family formation
in Poland are still relatively traditional compared to northwestern European countries
(Sobotka, 2008). For instance, in 2011, the mean age at first marriage in Poland was 28
years for men and 26 years among women (CSO, 2012), compared to respectively 33 for
men and 30 for women in the Netherlands (Statistics Netherlands, 2014). Furthermore,
cohabitation, out-of-wedlock births and divorces in Poland are still rare by European
standards (Sobotka, 2008).
5.3 Migration and family events: literature review
5.3.1 Migration as a predictor of family events
The ways in which migration may be related to the family life course has been subject
of a host of studies. In particular the fertility behavior of migrants after an (international)
migration move has been studied in great depth in both the United States (Carter, 2000;
Ford, 1990; Lindstrom & Giorguli Saucedo, 2002) and Europe (Kulu, 2005; Milewski, 2007,
2010). Other studies have considered the relationship between migration and partnership
behavior (Boyle et al., 2008; Frank & Wildsmith, 2005; Landale & Ogena, 1995). The foun-
dation of these studies is centered around theories of socialization, adaption, disruption,
and selection. Many authors emphasize the importance of the migrant’s socialization
process. Socialization theory (Glass et al., 1986; Inglehart & Baker, 2000) argues that
preferences are shaped by transmission of dominant norms and values during childhood
and it is often suggested that they remain rather stable over the life course. Following this
Chapter 5126
line of reasoning, migrants would continue the union and fertility patterns of the country
of origin where they were socialized, also when settling in a host society with different
patterns. Several studies in Western Europe (Andersson & Scott, 2005; Milewski, 2010)
and the U.S. (Massey, 1981) find support for this hypothesis regarding fertility behavior.
De Valk and Liefbroer (2007b) also find socialization effects with regard to the preferred
type of first union (cohabitation vs. marriage) among immigrants in the Netherlands.
In contrast, the adaption hypothesis emphasizes the importance of the destination
after the migration move, rather than the environment during childhood. This hypothesis
states that migrants adjust their family behavior according to the economic and cultural
environment of the destination country. Frank and Wildsmith (2005) attribute elevated
risks of union dissolution among Mexicans after moving to the U.S. partly to changes
in normative values and lower levels of social control. Other evidence for the adaption
hypothesis comes from studies that show a convergence in fertility levels between
the migrant and majority populations (Mayer & Riphahn, 2000; Milewski, 2007; Ram
& George, 1990). The theoretical foundation of the adaptation hypothesis is two-fold.
First, migrants’ demographic family behavior is expected to be influenced by the socio-
economic position in the destination country (Becker, 1981; Mulder, 2006). Second, the
resemblance of the migrants’ family behavior to that of the majority populations may also
be triggered by norms and values dominant in the destination country. The latter view
stems from classical assimilation theory (Alba & Nee, 1997; Gordon, 1964). Since it is hard
to separate the effect of cultural factors from that of socio-economic conditions, these
two views are often combined and covered under the label of adaption or assimilation
(c.f. Lindstrom & Giorguli Saucedo, 2002).
Whereas the two previous theories emphasize the importance of the environment
either at origin or destination, the disruption hypothesis focuses on the role of the
migration process itself. Migration is a stressful life event and often involves psychical
separation of spouses for extended periods of time (Frank & Wildsmith, 2005). Migration
may therefore lead to reduced fertility after the move (Carter, 2000; Lindstrom & Giorguli
Saucedo, 2002), a postponement of marriage (Carlson, 1985), and a higher risk of union
dissolution (Boyle et al., 2008; Frank & Wildsmith, 2005; Landale & Ogena, 1995). At the
same time, it has been argued that migration, marriage, and the start of childbearing are
closely connected. In the case of marriage-related migration, one would therefore expect
elevated rather than depressed fertility levels shortly after the move (shown by Andersson,
2004; Milewski, 2007; Lindstrom, 2003). In addition, studies in the U.S. suggest that
127Life paths of migrants
5
couples may be anxious to have a birth after migration in order to grant U.S. citizenship
to the child, which opens the route of a legal migration status for the parents (Lindstrom
& Giorguli Saucedo, 2007). The latter is however less relevant for Polish migrants in the
Netherlands, because freedom of movement is a fundamental right for EU citizens.
Finally, an important consideration when linking migration to subsequent family
behavior is selectivity. The selectivity assumption suggests that migrants are a selective
group in terms of their socio-demographic characteristics and intentions. Therefore, it is
not the migration move itself that explains subsequent union or fertility behavior, but the
migrants’ individual background characteristics (Frank & Wildsmith, 2005).
5.3.2 Migration as an outcome of family events
Migration, including return migration, has also been considered to be an outcome of
family-life events. Studies have analyzed the effect of having a partner and/or children on
migration behavior. These studies suggest differences between short and long distance
(international) moves. It is put forward that the presence of a (married) partner (Mulder
& Wagner, 1993; Sandefur & Scott, 1981) and children (Kulu, 2007; White et al., 1995)
reduces the wish and likelihood of moving over long distances. This decreased mobility
is linked to higher economic and psychological costs of relocating a larger family, in
particular when children are of school age (White et al., 1995).
The relationship between family events and return migration has hardly been ex plored,
but similar mechanisms can be expected. With regard to union formation it is furthermore
crucial where the partner is born: Those who find a partner in the host country are less
likely to return to the country of origin (Bijwaard & Wang, 2013; Zhao, 2002). Spousal
separation appears to be a dominant factor in causing a migrant to return (Zhao, 2002).
Finally, Bijwaard and van Doeselaar (2012) observe that divorce is an important trigger
of return migration among immigrants in the Netherlands. For the effect of the presence
of children on the likelihood of return migration mixed evidence is reported. A study by
Lindstrom and Giorguli Saucedo (2007) shows that Mexicans in the U.S. are significantly
more likely to return to Mexico briefly after the occurrence of the first birth. After the third
birth, however, the risk of return migration drops considerably. The authors suggest that this
may be due to the fact that the oldest child may be of school age by that time (c.f. White et
al., 1995). The analyses of Dustmann (2003) on the impact of children on return intentions
and realizations among migrants in Germany, reveal a negative association between the
presence of children and return migration regardless of the number of children.
Chapter 5128
5.4 Data and method
5.4.1 Data
In this paper we make use of unique data derived from the Dutch population registers:
the System of Social statistical Datasets (SSD). Population registers are widely recognized
for their high quality data, in particular for longitudinal studies (Billari, 2001a). The SSD
was constructed by Statistics Netherlands in the late 1990s, by linking several registers
to the Municipal Personal Records Database (Dutch acronym: GBA). All immigrants who
intend to stay in the Netherlands for more than 90 days are legally obliged to register
themselves at the GBA within five days of arrival. The data thus contain information on
the exact date of the migration move to the Netherlands. Note that immigrants who stay
for a short period (< 3 months) in the Netherlands are less well represented in the data.
According to the most recent estimates, the majority (77%) of Polish people living in the
Netherlands are registered (van der Heijden et al., 2013). The number of non-registered
Poles most likely fluctuates over the course of the year, peaking in the summer due to
seasonal influences (Dagevos, 2011).
Those who leave the Netherlands are deregistered from the GBA if the expected
stay abroad in the year following the departure is at least eight months. However, not
all emigrants inform the authorities of their intention to leave the Netherlands. When
authorities find out that a person is no longer living at the registered address or at another
address in the Netherlands, they are deregistered as an “administrative removal”.
The latter account for about 44% of all emigrations in our data. Since the exact date
of departure is unknown in these cases, we assume that these migrants have left the
Netherlands on the day that they were administratively removed from the register. We
conjecture that in general the time span between the actual date of emigration and the
date of administrative removal is relatively short: because the eligibility of many state-
provided benefits is based on information in the GBA, there are in case of doubt strict
controls on the address of an individual, varying from administrative research to actual
home visits. Nevertheless, the issue of non-registered emigrations remains a problem
in all registry-based datasets and it is most pronounced among young men without a
partner (Alders & Nicolaas, 2003).
In addition to the date of entry and exit, the data provide information on the migrant’s
marital status and household composition on a daily basis. For sake of simplicity, we use a
monthly time scale to construct a sequence-type representation of family life course and
129Life paths of migrants
5
migration events. The representation is based on the migrant’s union status, childbearing
events, and migration move(s). First of all, we treat cohabitation and marriage as different
states. Individuals who are not in a cohabiting or married relationship are classified as
single. Second, through the record linkage of parents and children, we can distinguish
married/cohabiting persons with and without children living in the household. Finally,
since migration may involve spousal separation (Lindstrom & Giorguli Saucedo, 2002,
2007), we further distinguish between those who are married and living at the same
address as their partner, and those who are married but living without their partner.
It is important to note that this information is only available for the time of residence in
the Netherlands and the data do not provide information on the household composition
prior to the migration move. This implies that, for example, those who are classified as
living single in the Netherlands may have an unmarried partner and/or children living
abroad. Similarly, changes in the family domain that occur after leaving the Netherlands
are unrecorded. However, if a migrant comes back to live in the Netherlands after a while,
re-entry in the GBA is possible due to a unique personal registration number. This allows
us to observe possible circular migration along with changes in the family domain in the
period between leaving and re-entry into the Netherlands.
We focus on young adult Polish migrants who have arrived in the Netherlands after
the expansion of the EU in May 2004. The analyses are restricted to those who were 20-
30 years old when they entered the Netherlands for the first time. Those who migrated
with their parents are excluded from the analyses, as we do not perceive this to be an
independent move. We follow each individual life trajectory for a period of five years
after the initial migration move, so that all sequences are of equal length. Because the
data were available until January 2012, the latest cohort we can observe for five years are
those who arrived in the Netherlands in January 2007. Hence, we focus on the migrants
that have arrived in the Netherlands between May 2004 and January 2007. In total, our
data include 11,492 Polish migrants (5,316 men and 6,176 women).
5.4.2 Method
We analyze the interplay between the Polish young adults’ migration and family life
careers by applying sequence analysis (Abbott & Tsay, 2000). In sequence analysis,
each individual life course trajectory is represented as a string of characters (states). We
distinguish between seven possible states: single (S), cohabitating (C), cohabitating and
child(ren) (CC), married, but living without partner (MS), married and living with partner
Chapter 5130
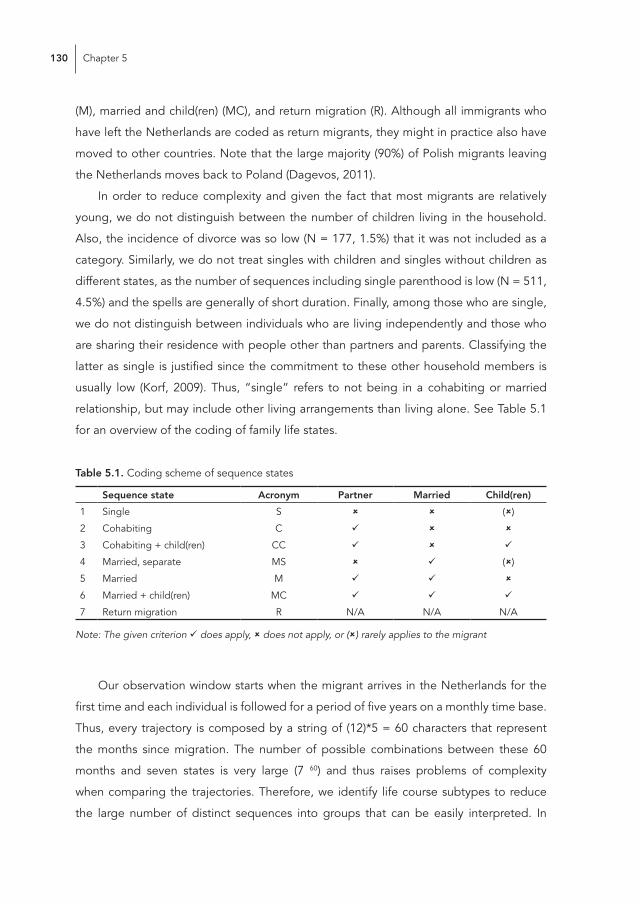
(M), married and child(ren) (MC), and return migration (R). Although all immigrants who
have left the Netherlands are coded as return migrants, they might in practice also have
moved to other countries. Note that the large majority (90%) of Polish migrants leaving
the Netherlands moves back to Poland (Dagevos, 2011).
In order to reduce complexity and given the fact that most migrants are relatively
young, we do not distinguish between the number of children living in the household.
Also, the incidence of divorce was so low (N = 177, 1.5%) that it was not included as a
category. Similarly, we do not treat singles with children and singles without children as
different states, as the number of sequences including single parenthood is low (N = 511,
4.5%) and the spells are generally of short duration. Finally, among those who are single,
we do not distinguish between individuals who are living independently and those who
are sharing their residence with people other than partners and parents. Classifying the
latter as single is justified since the commitment to these other household members is
usually low (Korf, 2009). Thus, “single” refers to not being in a cohabiting or married
relationship, but may include other living arrangements than living alone. See Table 5.1
for an overview of the coding of family life states.
Table 5.1. Coding scheme of sequence states
Sequence state Acronym Partner Married Child(ren)
1 Single S û û (û)
2 Cohabiting C ü û û
3 Cohabiting + child(ren) CC ü û ü
4 Married, separate MS û ü (û)
5 Married M ü ü û
6 Married + child(ren) MC ü ü ü
7 Return migration R N/A N/A N/A
Note: The given criterion ü does apply, û does not apply, or (û) rarely applies to the migrant
Our observation window starts when the migrant arrives in the Netherlands for the
first time and each individual is followed for a period of five years on a monthly time base.
Thus, every trajectory is composed by a string of (12)*5 = 60 characters that represent
the months since migration. The number of possible combinations between these 60
months and seven states is very large (7 60) and thus raises problems of complexity
when comparing the trajectories. Therefore, we identify life course subtypes to reduce
the large number of distinct sequences into groups that can be easily interpreted. In

131Life paths of migrants
5
order to arrive at this typology of sequences, we first compute distances between all
individual sequences. We opt for the optimal matching (OM) algorithm, which measures
the dissimilarity of two sequences by considering how much effort must be performed to
transform one sequence into the other (see Abbott & Tsay, 2000; Needleman & Wunsch,
1970). In this procedure, there are three basic operations available: insertion, deletion,
and substitution. The more operations necessary in order to arrive at two equal sequences,
the greater the dissimilarity between the sequences.
However, a substitution has a different meaning than an insertion/deletion operation
does, and not all substitutions really “cost” the same (Abbott & Hrycak, 1990). For
example, being married and having children (MC) is more similar to being married (M)
than to being single (S). There is no optimal solution for assigning the cost of these
operations and the literature is inconclusive about the best approach (see Abbott & Tsay,
2000, Wu, 2000 for discussion). We follow the commonly applied solution of using unitary
insertion/deletion costs and substitution costs based on transition rates in order to get
data-driven costs and thus avoiding subjectivity (Aassve et al., 2007; Piccarreta & Billari,
2007; Widmer & Ritschard, 2009).
The output of the OM metric is a symmetric distance matrix that contains the minimal
costs for transforming the sequences into each other. Based on this matrix, we identify
more-or-less homogeneous groups of trajectories by applying the PAM (Partitioning
Around Medoids) algorithm (Kaufman & Rousseeuw, 1990). In this clustering method,
it is necessary to specify the number of clusters in advance. Therefore, we test several
cluster solutions and use the ASW (Average Silhouette Width) criterion to determine the
clustering validity and to select the “optimal” number of clusters (Rousseeuw, 1987).
In addition, we did the cluster analyses for men and women separately and obtained
similar results. The gender-specific clusters and the clusters derived from the total sample
overlap for 97%. All calculations were made using the “TraMineR” and “WeightedCluster”
packages in R (Gabadinho et al., 2011; Studer, 2013).
Finally, to analyze how the clusters are related to the migrants’ background characte-
ristics, we run a series of binary logistic regression analyses. This replicates the approach
followed in previous studies (e.g., Bras et al., 2010; Schumacher et al., 2013). The back-
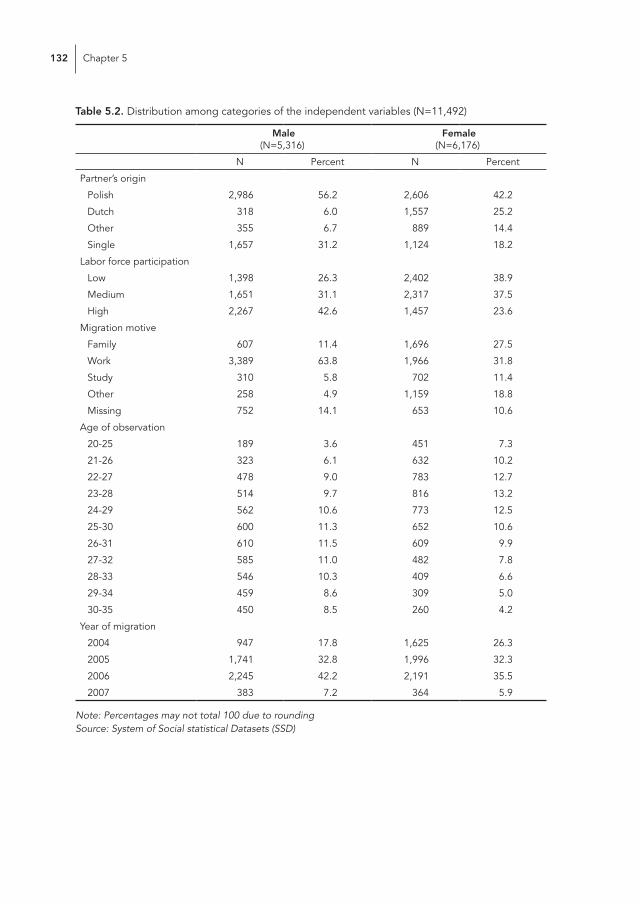
ground characteristics are measured as follows (see also Table 5.2).
Chapter 5132
Table 5.2. Distribution among categories of the independent variables (N=11,492)
Male (N=5,316).
Female (N=6,176).
N Percent N Percent
Partner’s origin
Polish 2,986 56.2 2,606 42.2
Dutch 318 6.0 1,557 25.2
Other 355 6.7 889 14.4
Single 1,657 31.2 1,124 18.2
Labor force participation
Low 1,398 26.3 2,402 38.9
Medium 1,651 31.1 2,317 37.5
High 2,267 42.6 1,457 23.6
Migration motive
Family 607 11.4 1,696 27.5
Work 3,389 63.8 1,966 31.8
Study 310 5.8 702 11.4
Other 258 4.9 1,159 18.8
Missing 752 14.1 653 10.6
Age of observation
20-25 189 3.6 451 7.3
21-26 323 6.1 632 10.2
22-27 478 9.0 783 12.7
23-28 514 9.7 816 13.2
24-29 562 10.6 773 12.5
25-30 600 11.3 652 10.6
26-31 610 11.5 609 9.9
27-32 585 11.0 482 7.8
28-33 546 10.3 409 6.6
29-34 459 8.6 309 5.0
30-35 450 8.5 260 4.2
Year of migration
2004 947 17.8 1,625 26.3
2005 1,741 32.8 1,996 32.3
2006 2,245 42.2 2,191 35.5
2007 383 7.2 364 5.9
Note: Percentages may not total 100 due to roundingSource: System of Social statistical Datasets (SSD)

133Life paths of migrants
5
Partner’s origin is based on the country of birth of the partner distinguishing Poland,
the Netherlands, other country, and those without a partner. Since the number of migrants
with a second-generation partner is low (N = 99), we do not distinguish between second-
generation partners and native-born, Dutch partners. In the case of multiple partners
during the five year observation window, we used the longest lasting relationship to
define the partner’s origin. Labor force participation is measured as the number of months
that the migrant was employed divided over the number of months he/she lived in the
Netherlands. The index is subsequently divided into three categories using the 33rd and
67th percentiles: low, medium, and high labor force participation. We used this categorical
division because the scores were skewed towards high values. Migration motive is based
on the immigrants’ reported motive upon registration in the population register. We
distinguish between migrants who came to the Netherlands for family reasons, work,
study, or other reasons (covering a wide variety of motives including medical treatment,
au pair, traineeship, etc.). Imputations for missing motives were carried out by Statistics
Netherlands on the basis of the migrant’s year of most recent arrival, country of birth,
age, gender, and marital status (Nicolaas & Sprangers, 2001). However, migrants who
leave the Netherlands in the same calendar year that they entered the country are not
imputed and are coded separately as “missing”. Age at migration ranges from 20 to 30
years. A separate dummy variable is included for each age at migration. Year of migration
is measured with a dummy variable for each year of migration to account for the different
years of arrival in the Netherlands. Since the relation between the clusters and some of
the background variables (e.g., age-patterns, labor force participation) is different for
men and women, we run the regression analyses for men and women separately.
5.5 Results
5.5.1 State distribution
First, we will focus on gender differences in family and migration behavior (see Figure
5.1). It is important to note that Figure 5.1 does not illustrate individual trajectories
longitudinally, but shows the aggregated state distribution at each time point (month). As
can be seen in the figure, almost 60% of the Polish men is single when they migrate to
the Netherlands, compared to about 40% of their female counterparts. In addition, one
quarter of the married men arrives in the Netherlands without their partner, while this is

Chapter 5134
very uncommon for women. Women are thus more likely to migrate with their partner
than men. The difference is in particular large for non-marital cohabitating unions: The
proportions for women are almost twice as large as those for men, while the gender
difference with regard to marriage is relatively small. Furthermore, we find that the majority
of both Polish men and women does not have children upon arrival in the Netherlands. At
the end of our observation window, however, almost 60% of married Poles has children
living in the household. Children are less common in non-marital unions. In line with
previous studies (Nicolaas, 2011), we find that a large share of Polish migrants lives only
temporarily in the Netherlands. Men are more likely to return to Poland than women are:
about 50% of men has left the country at the end of our observation window, compared
to about 35% among women.
Male Female
Single Cohabit Cohabit + child Married separate Married Married + child Return
Figure 5.1. Transversal distribution of family states and return migration, by gender
5.5.2 Typology of trajectories
Since the number of possible combinations of sequences is extremely large, we used PAM
cluster analysis to reduce complexity. Several cluster solutions were tested, of which the
6-cluster solution showed the highest average silhouette width (ASW=.44). We therefore
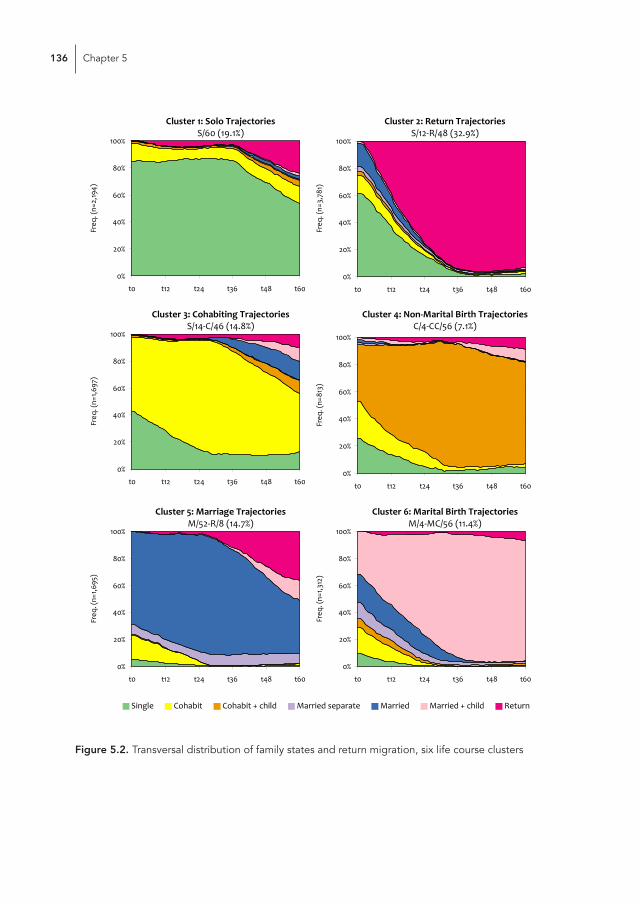
specify six groups of trajectories. The state distribution within each of these six clusters
is shown in Figure 5.2. The figure furthermore provides information on the number and
percentage of migrants who are classified within the clusters along with the ‘medoid
sequence’ for each cluster. The medoid sequence is the individual sequence with the
135Life paths of migrants
5
minimum average pairwise distance to all other individual sequences in the cluster (see
Aassve et al., 2007).
Cluster 1 accounts for 19% of the sample and has the medoid sequence S/60, which
stands for a trajectory in which a person lives in the Netherlands without a partner during
the complete observation window of five years. Some Poles in this group live together with
an unmarried partner for a while, but generally for only a very short period. Furthermore,
some of the sequences in this cluster include return migration. These return migrants
either leave the Netherlands towards the end of our observation window, or only for a
short period (circular migration). The sequences in this cluster are thus all characterized
by living single in the Netherlands for a relatively long time.
Cluster 2, which comprises the largest group of the sample (33%), differs from the
first in that these migrants all leave the Netherlands early within our five year observation
window. This is reflected in the medoid sequence of S/12–R/48. A person in this type of
trajectory lived for a year without a partner in the Netherlands, has then left the country
and did not return to the Netherlands for the remaining four years of observation.
The majority of the migrants in this cluster does not have a partner during the time of
residence in the Netherlands (see Figure 5.2). Those with a partner are about equally
divided between married and cohabiting individuals. It is interesting to see that hardly
any of the migrants in this cluster have coresidential children.
The trajectories in cluster 3, reflecting 15% of the sample, are characterized by the
medoid sequence S/14–C/46. This means that the migrant is single upon arrival in the
Netherlands and starts cohabiting with an unmarried partner after 14 months until the end
of our observation window. Although some individuals in cluster 3 become married and/
or have children living in the household towards the end of the five years of observation
(see Figure 5.2), all of these trajectories include a long period of non-marital cohabitation.
Cluster 4 is also characterized by a long period of non-marital cohabitation, but this
is combined with children living in the household. This group is characterized by the
medoid C/4–CC/56, which stands for a trajectory of cohabiting for four months, followed
by parenthood. This cluster is the smallest cluster of the sample (7%).
Chapter 5136
Cluster 1: Solo Trajectories S/60 (19.1%)
Cluster 2: Return Trajectories S/12-R/48 (32.9%)
Cluster 3: Cohabiting Trajectories S/14-C/46 (14.8%)
Cluster 4: Non-Marital Birth Trajectories
C/4-CC/56 (7.1%)
Cluster 5: Marriage Trajectories M/52-R/8 (14.7%)
Cluster 6: Marital Birth Trajectories
M/4-MC/56 (11.4%)
Single Cohabit Cohabit + child Married separate Married Married + child Return
0%
20%
40%
60%
80%
100%
t0 t12 t24 t36 t48 t60
Freq
. (n=
2,19
4)
0%
20%
40%
60%
80%
100%
t0 t12 t24 t36 t48 t60
Freq
. (n=
3,78
1)
0%
20%
40%
60%
80%
100%
t0 t12 t24 t36 t48 t60
Freq
. (n=
1,697
)
0%
20%
40%
60%
80%
100%
t0 t12 t24 t36 t48 t60
Freq
. (n=
813)
0%
20%
40%
60%
80%
100%
t0 t12 t24 t36 t48 t60
Freq
. (n=
1,695
)
0%
20%
40%
60%
80%
100%
t0 t12 t24 t36 t48 t60
Freq
. (n=
1,312
)
Figure 5.2. Transversal distribution of family states and return migration, six life course clusters
137Life paths of migrants
5
The sequences in cluster 5 are characterized by a relatively long period of living
with a married partner in the Netherlands. The medoid sequence of this group is
M/52–R/8, which means that the migrant lives with a married partner for 52 months
and then leaves the Netherlands until the end of our observation. Cluster 5 (marriage)
and cluster 3 (cohabitation) are about equal in size (15%), but there are two interesting
differences between the two partnership types. First, the vast majority of the married
Poles migrates with their partner to the Netherlands, while the cohabiting Poles often
arrive single in the Netherlands. Second, a large share of the married cluster leaves the
Netherlands within five years, whilst return migration is uncommon in the cohabiting
cluster (see also Table 5.3).
The last cluster (6) contains trajectories that are characterized by the medoid
sequence M/4–MC/56, which means that the migrant has lived with a married partner
for four months and then becomes a parent and remains in the Netherlands for another
56 months. This cluster thus represents sequences that are marked by a long period
of living with a married partner and children in the household. The cluster comprises
around 11% of the sample and is therewith larger than cluster 4 (7%), which includes long
periods of non-marital parenthood. However, clusters 6 and 4 are similar in the sense that
return migration is uncommon in both, suggesting that the presence of children in the
household decreases the propensity to leave the Netherlands (cf. Dustmann, 2003).
5.5.3 Background characteristics
In the last step of the analyses we test how and to what extent different factors (individual
and partner characteristics) are related to different paths as reflected in the clusters
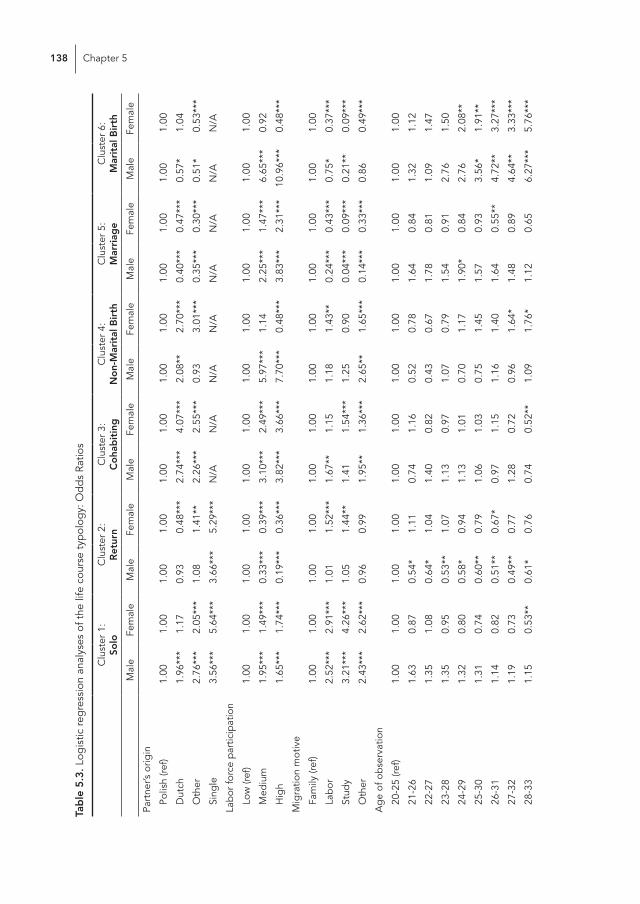
by a series of logistic regression analyses (Table 5.3). It is important to note that these
analyses do not imply causation. For instance, the relationship between women’s labor
force participation and their family life trajectories is complex, multi-faceted and multi-
directional (Andersson & Scott, 2005). The goal here is therefore only to identify patterns
and associations between the migrants’ background characteristics and their family life
trajectories. Analyses were carried out for men and women separately.
Chapter 5138
Tab
le 5
.3. L
ogis
tic re
gre
ssio
n an
alys
es o
f the
life
cou
rse
typ
olog
y: O
dd
s Ra
tios
Clu
ster
1:
Solo
Clu
ster
2:
Ret
urn
Clu
ster
3:
Co
hab
itin
gC
lust
er 4
:N
on-
Mar
ital
Bir
thC
lust
er 5
:M
arri
age
Clu
ster
6:
Mar
ital
Bir
th
Mal
eFe
mal
eM
ale
Fem
ale
Mal
eFe
mal
eM
ale
Fem
ale
Mal
eFe
mal
eM
ale
Fem
ale
Part
ner’s
orig
in
Po
lish
(ref)
1.00
1.00
1.00
1.00
1.00
1.00
1.00
1.00
1.00
1.00
1.00
1.00
D
utch
1.96
***
1.17
0.93
0.48
***
2.74
***
4.07
***
2.08
**2.
70**
*0.
40**
*0.
47**
*0.
57*
1.04
O
ther
2.76
***
2.05
***
1.08
1.41
**2.
26**
*2.
55**
*0.
933.
01**
*0.
35**
*0.
30**
*0.
51*
0.53
***
Si
ngle
3.56
***
5.64
***
3.66
***
5.29
***
N/A
N/A
N/A
N/A
N/A
N/A
N/A
N/A
Lab
or fo
rce
par
ticip
atio
n
Lo
w (r
ef)
1.00
1.00
1.00
1.00
1.00
1.00
1.00
1.00
1.00
1.00
1.00
1.00
M
ediu
m1.
95**
*1.
49**
*0.
33**
*0.
39**
*3.
10**
*2.
49**
*5.
97**
*1.
142.
25**
*1.
47**
*6.
65**
*0.
92
H
igh
1.65
***
1.74
***
0.19
***
0.36
***
3.82
***
3.66
***
7.70
***
0.48
***
3.83
***
2.31
***
10.9
6***
0.48
***
Mig
ratio
n m
otiv
e
Fa
mily
(ref
)1.
001.
001.
001.
001.
001.
001.
001.
001.
001.
001.
001.
00
La
bor
2.52
***
2.91
***
1.01
1.52
***
1.67
**1.
151.
181.
43**
0.24
***
0.43
***
0.75
*0.
37**
*
St
udy
3.21
***
4.26
***
1.05
1.44
**1.
411.
54**
*1.
250.
900.
04**
*0.
09**
*0.
21**
0.09
***
O
ther
2.43
***
2.62
***
0.96
0.99
1.95
**1.
36**
*2.
65**
1.65
***
0.14
***
0.33
***
0.86
0.49
***
Ag
e of
ob
serv
atio
n
20
-25
(ref)
1.00
1.00
1.00
1.00
1.00
1.00
1.00
1.00
1.00
1.00
1.00
1.00
21
-26
1.63
0.87
0.54
*1.
110.
741.
160.
520.
781.
640.
841.
321.
12
22
-27
1.35
1.08
0.64
*1.
041.
400.
820.
430.
671.
780.
811.
091.
47
23
-28
1.35
0.95
0.53
**1.
071.
130.
971.
070.
791.
540.
912.
761.
50
24
-29
1.32
0.80
0.58
*0.
941.
131.
010.
701.
171.
90*
0.84
2.76
2.08
**
25
-30
1.31
0.74
0.60
**0.
791.
061.
030.
751.
451.
570.
933.
56*
1.91
**
26
-31
1.14
0.82
0.51
**0.
67*
0.97
1.15
1.16
1.40
1.64
0.55
**4.
72**
3.27
***
27
-32
1.19
0.73
0.49
**0.
771.
280.
720.
961.
64*
1.48
0.89
4.64
**3.
33**
*
28
-33
1.15
0.53
**0.
61*
0.76
0.74
0.52
**1.
091.
76*
1.12
0.65
6.27
***
5.76
***
139Life paths of migrants
5
Clu
ster
1:
Solo
Clu
ster
2:
Ret
urn
Clu
ster
3:
Co
hab
itin
gC
lust
er 4
:N
on-
Mar
ital
Bir
thC
lust
er 5
:M
arri
age
Clu
ster
6:
Mar
ital
Bir
th
Mal
eFe
mal
eM
ale
Fem
ale
Mal
eFe
mal
eM
ale
Fem
ale
Mal
eFe
mal
eM
ale
Fem
ale
29
-34
0.87
0.65
0.55
**0.
761.
220.
990.
911.
671.
360.
56**
6.74
***
4.40
***
30
-35
1.00
0.73
0.65
*0.
59*
0.71
0.79
1.02
3.14
***
1.44
0.27
***
6.11
**4.
54**
*
Year
of m
igra
tion
20
04 (r
ef)
1.00
1.00
1.00
1.00
1.00
1.00
1.00
1.00
1.00
1.00
1.00
1.00
20
050.
75**
0.84
1.79
***
1.19
0.73
*0.
860.
43**
*0.
991.
251.
34**
0.95
0.91
20
060.
881.
051.
59**
*0.
70*
0.75
**1.
080.
881.
131.
53**
1.46
**0.
941.
08
20
070.
921.
032.
14**
*1.
110.
891.
050.
501.
270.
58*
0.64
*1.
061.
17
No.
of o
bse
rvat
ions
1,26
393
12,
054
1,72
756
61,
131
207
606
739
956
487
825
Nag
elke
rke
R20.
150.
130.
510.
370.
140.
220.
120.
140.
230.
180.
190.
21
Not
e: C
oeffi
cien
ts fo
r m
issi
ng m
otiv
es n
ot re
por
ted
. *p
< .0
5; *
*p <
.01;
***
p <
.001
So
urce
: Sys
tem
of S
ocia
l sta
tistic
al D
atas
ets
(SSD
)
Chapter 5140
As can be seen in Table 5.3, we compare those with a Polish partner to those with a
Dutch partner, other partner, and individuals without a partner. The dummy variable for
not having a partner is omitted in the analyses of clusters 3-6, since all trajectories in these
clusters include a period of living with a partner. Having no partner obviously increases
the likelihood of being in cluster 1 (solo), but also the likelihood of return migration
(cluster 2) among both men and women (see Table 5.3). With regard to the partner’s
origin, Table 5.3 shows that having a Dutch partner decreases the likelihood of return
migration (cluster 2), but this effect is only significant for women. Furthermore, Polish
migrants with a Polish partner are less likely to cohabit (clusters 3 and 4) and more likely to
be married than those with a Dutch or partner from another migrant origin. An exception
here is that women who are married and have children (cluster 6) more often have a Dutch
partner than a Polish partner. Finally, Table 5.3 shows that having a Dutch or other migrant
origin partner increases the likelihood of being in cluster 1 (solo), as a result of the fact
that this cluster contains short periods of cohabitation (see Figure 5.2).
With regard to labor force participation, our findings show marked differences be-
tween men and women. Unemployment is related to a higher likelihood of return migration
(cluster 2) among both men and women, but the relationship is much stronger for men.
Additional analyses (not in Table) show that this difference in effect size is significant.
Furthermore, it can be seen that a high labor force participation is strongly positively
related to clusters 4 (non-marital parenthood) and 6 (marital parenthood) among men,
whereas this relationship is obviously reversed among women: mothers are less often
employed.
Furthermore, the migration motive is strongly related to the found family life path for
both men and women. Those who come to the Netherlands for work or study reasons are
more likely to remain single (cluster 1) and less likely to be in clusters 5 (marriage) and 6
(marital births) than those who have migrated for family reasons. In addition, labor and
student migrants more often leave the Netherlands (cluster 2) and cohabit (clusters 3 and
4) than family migrants, although differences are smaller and often not significant. Those
who migrate for ‘other’ reasons to the Netherlands constitute a very heterogeneous group
of people that came for many different reasons. Nevertheless, their overall behavior
tends to be rather similar to labor and student migrants: they are more likely to remain
single and to cohabit than to be married. The estimates for those who have an unknown
migration motive are omitted from Table 5.3, as they all leave the country shortly after
arrival (see method section).
141Life paths of migrants
5
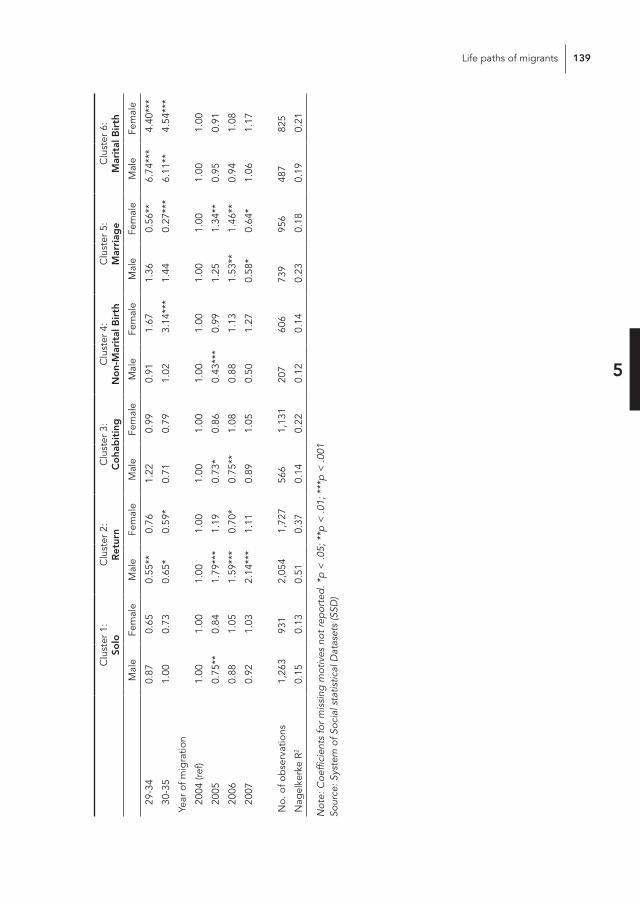
Age at immigration marks migrants’ life stages at the time of entry into the Netherlands
and the period of observation. As can be seen in Table 5.3, among men, we do not find
a strong association between the age of observation for the majority of the clusters.
Although in cluster 2 (return migration) all ages of observation differ significantly from the
reference category (20-25), we see no further age-pattern. The only age-pattern among
men we find is that older men are more likely to live with a married partner and children
(cluster 6). Among women, it can be seen that those who are older when they migrate
are less likely to leave the Netherlands (cluster 2) and to be married without children
(cluster 5). Older women are more likely to have children in both non-marital (cluster
4) and marital unions (cluster 6). In line with previous studies, we see that non-marital
parenthood is most common in the 30-35 age group (Szukalski, 2001) In addition, women
who were observed from age 28-33 seem to be a specific group. Only this category is
significantly less likely be single (cluster 1) or cohabiting without a child (cluster 3). This
seems to be related to the fact that this group has the highest likelihood to be a married
mother (cluster 6).
Finally, we control for the migrant’s year of arrival in the Netherlands. Most of these
estimates do not show a clear pattern and are therefore hard to interpret. An interesting
finding, however, is that men who arrived more recently, in particular in 2007, are more
likely to leave the Netherlands (cluster 2). This could be related to the fact that a work
permission for Polish labor migrants was no longer required after May 2007, and hence,
making it easier for Polish migrants to travel back and forth between Poland and the
Netherlands for work. Among women, however, we do not observe this pattern. We
suspect that this may be due to the fact that migrating for work purposes is less common
among women (see Table 5.2).
5.6 Discussion
After Poland became a member of the EU in May 2004, Polish migration within Europe has
increased substantially to among others the UK and Germany but also the Netherlands.
Despite a growing body of literature on recent Polish migrants in Western Europe,
quantitative studies have largely overlooked the family dynamics of this relatively new
group of immigrants. It is, however, essential to know more about family life decisions in
relation to patterns of settlement and return in order to gain a better understanding of the
Chapter 5142
drivers of the growing intra-European migration faced by most EU countries. In this paper
we applied sequence analysis in order to empirically construct a typology of life-course
trajectories in which we simultaneously considered partnership, fertility, and migration
behavior on the basis of rich panel data from the Dutch population registers. The analyses
revealed a wide variety of ways in which migration and family choices are connected for
Polish migrants in the Netherlands. We found six clusters of “ideal-type” sequences. In
different ideal types return migration played an important role and the cluster determined
by return migration was even the most common as it applied to almost one-third of the
sample.
Return migration is thus an important feature of Polish migration, which is in sharp
contrast with the very low levels of overall return migration among many other immigrant
groups in the Netherlands (e.g. Turks and Moroccans). The high levels of return migration
are at least partly attributable to the free movement of persons across the EU (cf. Nicolaas,
2008). The finding that return migration occurs more often among Polish migrants who
entered the Netherlands more recently, suggests that the abolishment of a labor permit
for Polish nationals in 2007 may also have influenced return decisions. This finding is
in line with recent debates about the fact that migration controls may actually have a
counterfactual effect: by having strong regulations, return migration is prohibited since
the risks of losing residence and permit are at stake, whereas a situation of few migration
rules facilitates return migration.
Return migration thus occurs more frequently in a context with few institutional
migration barriers, which makes the family domain an even more important factor in
migration decision-making. Our analyses showed that the majority of Polish migrants that
left the Netherlands were single and hardly any of these individuals had children living
in the household. Similarly, return migration was found to be very unlikely among those
who were in the cluster ‘(non)marital birth’ (meaning that they had a child either in a
unmarried or married union in the Netherlands). These results are in line with previous
studies showing that those who have more family obligations are the least mobile (White
et al., 1995). On the one hand this implies that those who have children in Poland already
are less likely to migrate. On the other hand, those who migrated and had children in
the destination country are less likely to return (cf. Dustmann, 2003; Lindstrom & Giorguli
Saucedo, 2007). Qualitative research among Polish migrants showed that concerns
about the children’s education is the most important factor in this (Levrau et al., 2014).
It is therefore important to provide sufficient attention to and create opportunities for
143Life paths of migrants
5
children of these migrants in the educational system. So far, debates have potentially
overlooked the more permanent character of these children and their parents in society.
Since integration policies, that apply for ‘third country’ nationals (i.e. those who arrive
from outside the EU to the Union), are not in place for European migrants, it is important
to facilitate the process of integration for those European migrants who do stay more
permanently (Vogels et al., 2014).
Finally, contrary to the more traditional patterns of family formation among Polish
nonmigrants from similar birth cohorts (Matysiak, 2009), we found an equal share of Polish
migrants in the cluster typified as ‘cohabiting’ versus the ‘marriage’ cluster (both cover
around 15% of the sample). The relatively high incidence of cohabitation among Polish
immigrants in the Netherlands may be the result of different underlying mechanisms. First,
it could be that processes of adaption or assimilation (to Dutch society where unmarried
cohabitation is much more common) have occurred within a relative short time span.
This conjecture is strengthened by the finding that Poles who cohabited mainly stayed in
the Netherlands, whereas the prevalence of return migration was found to be relatively
high among those in the marriage trajectories. Also for other demographic behavior
like fertility (Mayer & Riphahn, 2000; Milewski, 2007) and union dissolution (Frank &
Wildsmith, 2005), a rather rapid adaptation has been shown for different migrant groups
in previous work. Second, an international migration may also have short-term disruption
effects on family formation in which marriage is postponed and a period of unmarried
cohabitation is more common and for a longer period of time (cf. Carlson, 1985). We
should however realize that in our analyses we only observed the short-term relation
between migration and family behaviour, as we observe individuals for a maximum of
five years only. It is therefore difficult to assess whether it is a disruption or assimilation
process that is taking place. Although currently still impossible with the data and for our
study group, following individuals over a longer period of time could shed more light on
the long-term impact of migration on family life trajectories and perhaps observe more
diverse life paths. Finally, differences between migrants and nonmigrants may also be
the result of selection effects, in which Polish who are more open minded also in terms
of union formation are more likely to migrate (cf. Frank & Wildsmith, 2005). Unmarried
cohabitation may thus have very different meanings for individuals as is also shown for the
majority population (Hiekel et al., 2014). However, our data is limited in the sense that we
have no information on nonmigrants and, thus, the impact of migration cannot be directly
assessed. Previous data collection efforts in Europe (e.g., the recent MAFE project) have
Chapter 5144
acknowledged the quest for including also nonmigrants. To our knowledge, however, no
similar data collections have been carried out among EU migrants even though these are
needed to understand the complexities underlying their behavior.
With regard to gender differences, our findings show that men more often remain
single and leave the Netherlands, whereas the incidence of unmarried cohabitation was
found to be much higher among women. Polish women seem thus to be more likely to
shift their orientation towards the Netherlands, while the migration of Polish men is more
often temporary and economically driven. The fact that Polish women are more often
in a unmarried union than their male counterparts seems to be related to the fact that
women more often find a partner in the Netherlands: roughly a quarter of Polish women
has a Dutch partner, compared to about six percent for men. Indeed, our findings indicate
that individuals with a partner outside one’s own origin group were more likely to opt for
cohabitation. Having a Dutch partner was also found to decrease the likelihood of return
migration, but only among women (cf. Bijwaard & Wang, 2013). The latter finding concurs
with previous studies showing substantial differences in migration experience between
men and women (Dhar, 2010).
The data we used for our analyses are derived from unique population register data
that, contrary to many surveys, do not suffer from important problems like recall error
and small numbers. Nevertheless, our data also entail several disadvantages that should
be noted. Residence and stay in the Netherlands have to be reported by the persons
themselves making migration data always prone to underreporting. In contrast to the
classical immigration waves, recent intra-EU migrants tend to be highly mobile which
makes their behavior more difficult to capture in population registers. First, registration in
the population registers is obligatory only for those who intend to stay in the Netherlands
for more than three months. Not every Polish migrant will thus be recorded in the
population registers, implying that we underestimate the number of short-term Polish
immigrants who may potentially show high levels of circular migration. Furthermore, in
particular deregistration from the population registers when leaving the Netherlands is
prone to underreporting, because there are no clear advantages of reporting the move.
The registered time in the population data of the Netherlands is thus for some individuals
larger than the true duration of stay in the country. Similarly, because EU migrants do
not face any visa restrictions, the migration motive of EU migrants is based on self-
reported information, leading to more missing information than is the case for non-EU
migrants. Other research on Polish immigrants in the Netherlands has applied strategies

145Life paths of migrants
5
of snowball sampling to also include non-registered Polish migrants in their survey (e.g.,
Engbersen et al., 2013). The limitations of the different types of data clearly show that
various complementary data collection strategies are needed to better capture the highly
mobile EU migration flows.
Despite the limitations, this paper contributes to our knowledge on Polish migrants
residing in North-Western Europe. Our results show the importance of focusing on the
family behavior of these migrants also in order to understand their migration behavior.
The application of sequence analysis to construct an empirical typology of family and
migration events is an interesting avenue to capture the large diversity among migrants
also from other origins. The link between family and migration decisions may be
particularly important for EU migrants as there are few to no institutional restrictions on
mobility between EU member states. Our study indicated that the relation between both
domains may also be very different for men and women. In light of increasing intra-EU
migration and the effects this might have on the individual, the family, and societies at
origin and destination, more work is needed on how different life domains and decisions
are interrelated. Only in this way we can truly capture the individual life course and
pinpoint relevant policies.