Embed Size (px)
Citation preview
University of Groningen
Technology in practiceLexmond, Anne
IMPORTANT NOTE: You are advised to consult the publisher's version (publisher's PDF) if you wish to cite fromit. Please check the document version below.
Document VersionPublisher's PDF, also known as Version of record
Publication date:2014
Link to publication in University of Groningen/UMCG research database
Citation for published version (APA):Lexmond, A. (2014). Technology in practice: The importance of matching purpose, patient, and product inpulmonary aerosol delivery. [S.n.].
CopyrightOther than for strictly personal use, it is not permitted to download or to forward/distribute the text or part of it without the consent of theauthor(s) and/or copyright holder(s), unless the work is under an open content license (like Creative Commons).
The publication may also be distributed here under the terms of Article 25fa of the Dutch Copyright Act, indicated by the “Taverne” license.More information can be found on the University of Groningen website: https://www.rug.nl/library/open-access/self-archiving-pure/taverne-amendment.
Take-down policyIf you believe that this document breaches copyright please contact us providing details, and we will remove access to the work immediatelyand investigate your claim.
Downloaded from the University of Groningen/UMCG research database (Pure): http://www.rug.nl/research/portal. For technical reasons thenumber of authors shown on this cover page is limited to 10 maximum.
Download date: 12-02-2022

CHAPTER 2
CHALLENGING THE TWO-MINUTE TIDAL BREATHING CHALLENGE TEST
Anne J. Lexmond, Paul Hagedoorn, Henderik W. Frijlink, Anne H. de Boer
Journal of Aerosol Medicine and Pulmonary Drug Delivery 2013, 26(6): 380–386
52
Chapter 2
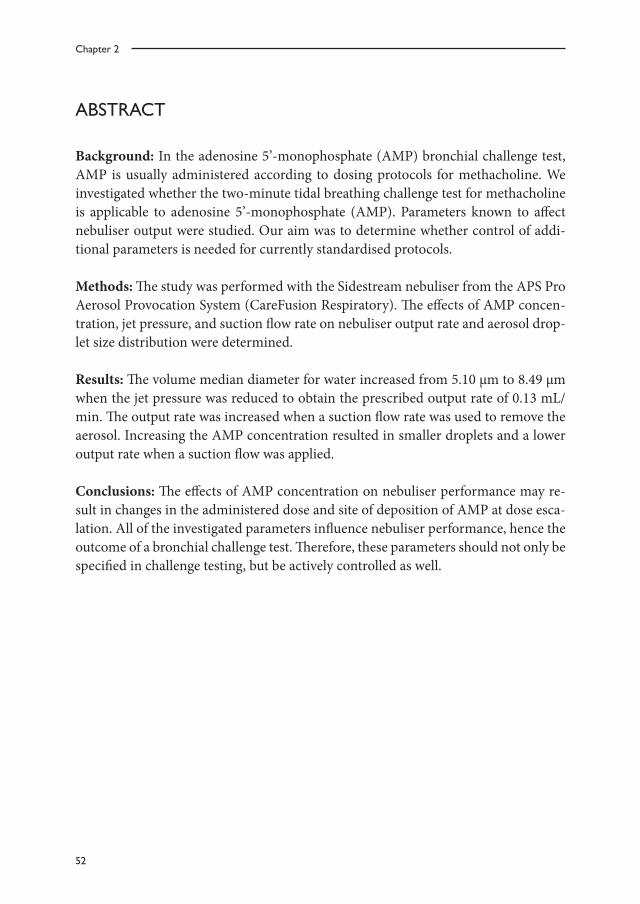
ABSTRACT
Background: In the adenosine 5’-monophosphate (AMP) bronchial challenge test, AMP is usually administered according to dosing protocols for methacholine. We investigated whether the two-minute tidal breathing challenge test for methacholine is applicable to adenosine 5’-monophosphate (AMP). Parameters known to affect nebuliser output were studied. Our aim was to determine whether control of addi-tional parameters is needed for currently standardised protocols.
Methods: The study was performed with the Sidestream nebuliser from the APS Pro Aerosol Provocation System (CareFusion Respiratory). The effects of AMP concen-tration, jet pressure, and suction flow rate on nebuliser output rate and aerosol drop-let size distribution were determined.
Results: The volume median diameter for water increased from 5.10 µm to 8.49 µm when the jet pressure was reduced to obtain the prescribed output rate of 0.13 mL/min. The output rate was increased when a suction flow rate was used to remove the aerosol. Increasing the AMP concentration resulted in smaller droplets and a lower output rate when a suction flow was applied.
Conclusions: The effects of AMP concentration on nebuliser performance may re-sult in changes in the administered dose and site of deposition of AMP at dose esca-lation. All of the investigated parameters influence nebuliser performance, hence the outcome of a bronchial challenge test. Therefore, these parameters should not only be specified in challenge testing, but be actively controlled as well.
53
Challenging the bronchial challenge test
INTRODUCTION
In a bronchial challenge test, a bronchoconstrictor stimulus is administered to the airways to quantify bronchial hyperresponsiveness. Most commonly, methacholine is used, which acts directly on muscarinic receptors of smooth muscle cells (36), but various indirect stimuli, such as adenosine, have been investigated as well. It has been argued that the response to adenosine better reflects bronchial inflammation than the response to methacholine (43,44). Bronchial challenge with adenosine in humans was first described in 1983 by Cushley et al. (37) and it has been used in various other studies since then (37–40,42,45,46,221). It is usually administered by nebulisation as adenosine 5’-monophosphate (AMP). AMP has a distinctly higher aqueous solubili-ty than adenosine itself (approx. 400 g/L versus 8 g/L at room temperature). This is a desirable property because adenosine is much less potent than methacholine (222), so higher doses are needed.
AMP is often administered following the dosing protocols described for methacho-line, such as the two-minute tidal breathing method (223,224). Both the Europe-an Respiratory Society (ERS) and American Thoracic Society (ATS) adopted the two-minute tidal breathing method as one of the preferred methods for methacho-line challenge testing in their official guidelines of 1993 and 1999 respectively (26,35). In 2003, the ERS Task Force on Indirect Airway Challenges published their report, which included adenosine (AMP) as a challenge agent. The report stated that dos-ing protocols with doubling concentrations (such as the two-minute tidal breathing method) are recommended for AMP (225). Both the 1993 and 1999 guidelines for methacholine aim to standardise the parameters that are of critical importance to the test results. With such standardisation the consistency of test results is aimed to be independent of the location of testing. For the two-minute tidal breathing meth-od, the prescribed parameters are droplet size (mass median aerodynamic diameter (MMAD) 1.0–3.6 µm (ATS) or 1–4 µm (ERS)), output rate (0.13 mL/min) and nebu-lisation time (2 min). Especially the ATS statement offers detailed practical guide-lines and suggestions for methacholine challenge testing (35). Factors that may affect the test results are described, and the authors stress the importance of accuracy in order to obtain valid test results.
Remarkably, it has never been thoroughly investigated whether such dosing proto-cols are indeed suitable for AMP. Therefore, the aim of our study was to evaluate the applicability of the two-minute tidal breathing method for AMP, according to the ATS guideline for methacholine. We investigated whether it is possible to use the

54
Chapter 2
guideline as a universal dosing protocol, regardless of the compound, or whether separate protocols should be developed for the specific compounds used in bronchial challenge testing.
In addition, the variables that are known to affect nebuliser output were investigated. As many critical parameters in this test are not only inherent to the specific stimu-lus that was investigated (AMP), but also to challenging by nebulisation in general, findings of this study may apply to other compounds, i.e. methacholine, and to oth-er dosing protocols, i.e. the five-breath dosimeter method, as well. Our aim was to determine if better control of prescribed and essential parameters is necessary for currently standardised protocols.
MATERIALS AND METHODS
Nebulisers and AMP
The APS Pro Aerosol Provocation System manufactured by CareFusion Respiratory (Yorba Linda, CA, USA) was used with the MedicAid Sidestream nebuliser that is supplied with this system. For comparison purposes, a second Sidestream nebulis-er was obtained from Romedic BV (Meerssen, The Netherlands). The sodium salt of AMP (product no. A1752) was purchased from Sigma-Aldrich (Zwijndrecht, the Netherlands), which is the product the ERS advises to use in AMP challenge testing (225). Sodium chloride (Ph. Eur.), used for the preparation of 0.9% saline, was pur-chased from BUFA/Spruyt Hillen (IJsselstein, the Netherlands).
Characterisation of the AMP solutions
Aqueous AMP solutions of 1.25, 2.5, 5, 10, 20, 40, 80, 160 and 320 mg/mL were pre-pared. Concentrations of the AMP solutions were determined by UV spectroscopy at 254 nm (UNICAM UV 500, ThermoSpectronic, Cambridge, UK) and the relative viscosities of the solutions compared to water were measured using a Ubbelohde viscometer. The refractive indices were obtained with a Refractometer RL (Varimex, Warsaw, Poland). All measurements were performed in triplicate. The refractive in-dex of the solutions as function of the AMP concentration was found to be linear in concentrations between 1 and 300 mg/mL (R2 0.9996, 18 data points).
55
Challenging the bronchial challenge test
Experimental setup
The test setup used in the laboratory experiments consisted of the nebuliser, a filter, and the socket of the APS Pro system that holds the nebuliser and filter. The nebuliser was connected to a compressed air supply system (mains). Jet pressure was adjust-ed with a digital pressure gauge (DigiGauge, Rototherm, Port Talbot, UK). A timer controlled solenoid valve was included to adjust nebulisation times to exactly two minutes. A suction flow was created using a vacuum pump that was connected to the socket. Suction flow rate was set using a calibrated venturi meter and flow controller.
Measurement of the nebuliser output rate
The nebuliser output rate (in mL/min) without suction was determined for the AMP solutions as described in the ATS guideline (35) (jet pressure 1.5 bar). The guideline mentions that the English Wright nebuliser (Roxon Medi-Tech, Montreal, PQ, Can-ada) is generally used for this method, but that the use of other brands of nebulisers with similar characteristics is acceptable as well. The English Wright nebuliser has never been available in many countries and nowadays it is not manufactured any-more. Therefore, we conducted our experiments with the Sidestream nebuliser that is supplied with the Aerosol Provocation System, a system that has been developed specifically for (methacholine) challenge testing and that is widely used in this re-spect. 3 mL of room temperature solution was nebulised during exactly two minutes. The output rate was calculated from the pre- and post-nebulisation weight of the nebuliser.
Subsequently, the nebuliser was connected to the vacuum pump to remove the aero-sol from the nebuliser at a stationary suction flow rate of 30 L/min and the measure-ment of the output rate was repeated. The suction flow rate of 30 L/min was chosen as representative average flow rate through a nebuliser based on the range of peak inhalation flow rates of adult healthy volunteers (25–48 L/min) and asthma patients (23–90 L/min) as measured during normal breathing (226). All measurements, un-less stated otherwise, were performed in triplicate. All measured data for the nebu-liser output rate based on weight were corrected for the differences in density of the AMP solutions to obtain the output rate in mL/min.

56
Chapter 2
Measurement of the aerosol droplet size distribution
The droplet size distribution of the generated aerosol of water was measured inter-mittently during two minutes of nebulisation with a HELOS BR laser diffraction ap-paratus (Sympatec, Clausthal-Zellerfeld, Germany) using an inhaler adapter simi-lar to INHALER 2000 (Sympatec) (227) and a 100 mm (R3) lens (measuring size range 0.5–175 µm). A stationary suction flow rate of 30 L/min was applied to direct the aerosol from the nebuliser through the laser beam. During each two minutes of nebulisation, four measurements were conducted. The measurements lasted 10 s and the first measurement was synchronised with the start of nebulisation process. Inter-val times between the measurements were set to 20 s to cover the entire nebulisation time of 2 min. This measurement scheme was duplicated for each solution yielding mean values of eight measurements per drug concentration. Calculations were based on the Mie theory using a value of 1.333 for the refractive index and a value of 0 for the imaginary part of this index.
The aerosol droplet size distributions of the AMP solutions were measured following the same procedure. For the calculations, measured values were used for the refrac-tive index of the AMP solutions and a value of 0 for the imaginary part of this index.
Measurement of the effects of jet pressure on nebuliser output rate and aerosol droplet size distribution
Jet pressure was adjusted to 0.5, 1.0 and 1.5 bar to determine its effects on the output rate (for 0.9% saline and water) and the aerosol droplet size distribution (for water). Measurements were performed according to the methods described above. Water and saline were used for the measurements, not the AMP solutions, to allow us to allocate the effects to jet pressure, and eliminate the possibility of effects caused by changes in AMP concentration.
Measurement of evaporative water losses
Evaporative water losses were determined indirectly by measuring the difference in AMP concentration before and after nebulisation. AMP concentrations were mea-sured by refractive index analysis of the solutions.
57
Challenging the bronchial challenge test
Data analysis
The volume median diameter (VMD) was derived from the cumulative volume dis-tribution curve as function of the laser diffraction diameter. Data for the VMD (in µm) and output rate (in mL/min) are presented as means (± standard deviation). Un-paired Student’s t tests (two-sided) were performed for statistical analysis. Probability values (p) < 0.05 were considered statistically significant.
RESULTS
Characterisation of the nebulisers
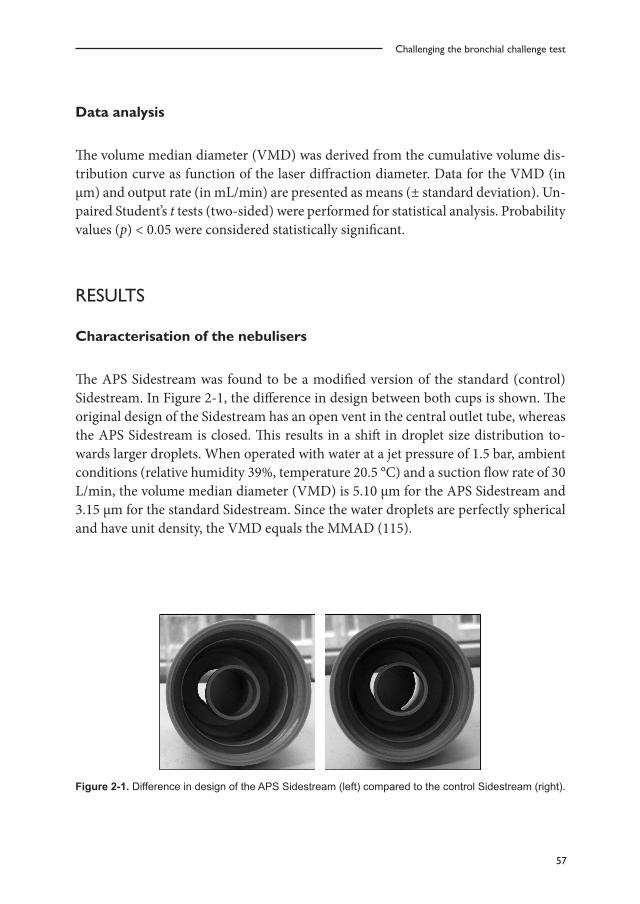
The APS Sidestream was found to be a modified version of the standard (control) Sidestream. In Figure 2-1, the difference in design between both cups is shown. The original design of the Sidestream has an open vent in the central outlet tube, whereas the APS Sidestream is closed. This results in a shift in droplet size distribution to-wards larger droplets. When operated with water at a jet pressure of 1.5 bar, ambient conditions (relative humidity 39%, temperature 20.5 °C) and a suction flow rate of 30 L/min, the volume median diameter (VMD) is 5.10 µm for the APS Sidestream and 3.15 µm for the standard Sidestream. Since the water droplets are perfectly spherical and have unit density, the VMD equals the MMAD (115).
Figure 2-1. Difference in design of the APS Sidestream (left) compared to the control Sidestream (right).

58
Chapter 2
Influence of jet pressure on the nebuliser output
The effect of varying the jet pressure on the output rate of the APS Sidestream is pre-sented in Table 2-1. Measurements were performed with both 0.9% saline and water to verify that these liquids show comparable nebulisation behaviour. When the ATS procedure is followed, a jet pressure of about 0.5 bar results in the required output rate of 0.13 mL/min. When a stationary suction flow rate of 30 L/min is applied to remove the aerosol from the nebuliser, the output rate increases significantly to about 0.19 L/min (p < 0.001).
The effect of jet pressure on the aerosol droplet size distribution for water is shown in Figure 2-2. A significant increase in droplet size was observed when the jet pressure was reduced from 1.5 to 0.5 bar (p < 0.001). At 0.5 bar, the VMD (X50 in the chart) was 8.49 µm, whereas it was 5.10 µm at 1.5 bar.
Influence of AMP concentration on the nebuliser output
The effects of AMP concentration on the nebuliser output rate and VMD are sum-marized in Table 2-2. In this table, the 0 mg/mL AMP value is for water. No effect of AMP concentration on the output rate was found when determined according to the ATS procedure (no suction). However, the output rate increased when a suction flow was applied. This increase appeared to be concentration dependent. Up to 5 mg/mL AMP, the output rate was comparable to the output rate of water (and 0.9% saline). The output rate of the medium-concentration solutions (10 to 160 mg/mL) was sig-nificantly lower (7–12%) compared to water (p < 0.05). The output rate of the highest AMP concentration of 320 mg/mL was 20% lower compared to water (p < 0.001), which was also significantly lower compared to the other AMP solutions (p < 0.01).
Table 2-1. Influence of jet pressure on the output rate of the APS Sidestream.
Jet pressure (bar) Output rate (mL/min)
ATS 30 L/min Water Saline Water Saline
0.5 0.12 (±0.002) 0.12 (±0.001) 0.19 (±0.003) 0.18 (±0.006)
1.0 0.19 (±0.007) 0.19 (±0.003) 0.27 (±0.005) 0.27 (±0.012)
1.5 0.22 (±0.004) 0.23 (±0.002) 0.32 (±0.009) 0.33 (±0.015) ATS: determined according to the procedure in the ATS guideline; 30 L/min: determined using a station-ary suction flow rate of 30 L/min. n = 3 (mean ±SD).

59
Challenging the bronchial challenge test
Figure 2-2. Influence of the jet pressure on the droplet size distribution for water from the APS Sidestream, using a stationary suction flow rate of 30 L/min (n = 8, mean ±SD). The characteristic diameters X10, X50 and X90 represent the 10%, 50% and 90% values from the cumulative volume undersize curve. The X50 value equals the volume median diameter (VMD).
Table 2-2. Influence of AMP concentration on the output rate of the APS Sidestream.
AMP concentrationa
(mg/mL)
Output rate (mL/min)
ATS 30 L/min VMD (µm) RVwater
0 0.22 (±0.004) 0.32 (±0.009) 5.10 (±0.17) 1.00 (±0.001)
1.25 0.22 (0.22, 0.22)b 0.30 (±0.015) 5.01 (±0.09) 0.99 (±0.002)
2.5 0.23 (0.23, 0.23)b 0.32 (±0.013) 5.11 (±0.14) 1.00 (±0.002)
5 0.23 (0.23, 0.23)b 0.30 (±0.010) 5.01 (±0.13) 1.00 (±0.000)
10 0.23 (0.23, 0.23)b 0.29 (±0.006) 5.00 (±0.15) 1.01 (±0.000)
20 0.23 (0.23, 0.23)b 0.29 (±0.005) 4.70 (±0.16) 1.04 (±0.001)
40 0.24 (0.23, 0.24)b 0.29 (±0.011) 4.43 (±0.15) 1.08 (±0.001)
80 0.23 (0.22, 0.24)b 0.29 (±0.009) 3.92 (±0.22) 1.19 (±0.001)
160 0.24 (0.24, 0.24)b 0.28 (±0.009) 3.14 (±0.16) 1.51 (±0.001)
320 0.22 (±0.009) 0.25 (±0.003) 2.93 (±0.18) 3.50 (±0.010) ATS: determined according to the procedure in the ATS guideline; 30 L/min: determined using a station-ary suction flow rate of 30 L/min; VMD: volume median diameter, RVwater: relative viscosity compared to water. Jet pressure was 1.5 bar, n = 3 (mean ±SD). a Concentrations are by approximation for clarity; b n = 2, mean and individual data are shown.
0
4
8
12
16
0.5 1.0 1.5
Cha
ract
eris
tic d
iam
eter
s (µ
m)
Jet pressure (bar)
X10 X50 X90
60
Chapter 2
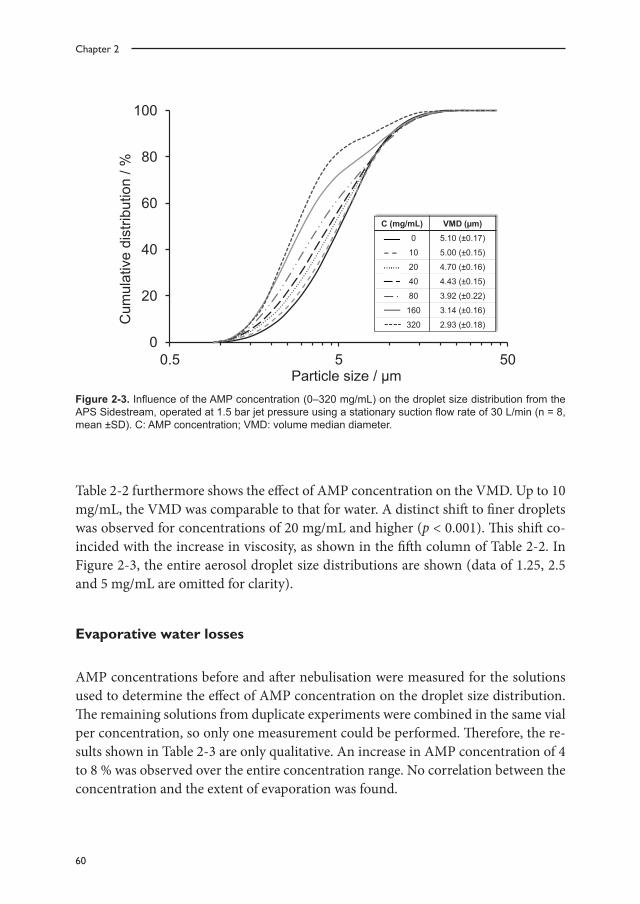
Table 2-2 furthermore shows the effect of AMP concentration on the VMD. Up to 10 mg/mL, the VMD was comparable to that for water. A distinct shift to finer droplets was observed for concentrations of 20 mg/mL and higher (p < 0.001). This shift co-incided with the increase in viscosity, as shown in the fifth column of Table 2-2. In Figure 2-3, the entire aerosol droplet size distributions are shown (data of 1.25, 2.5 and 5 mg/mL are omitted for clarity).
Evaporative water losses
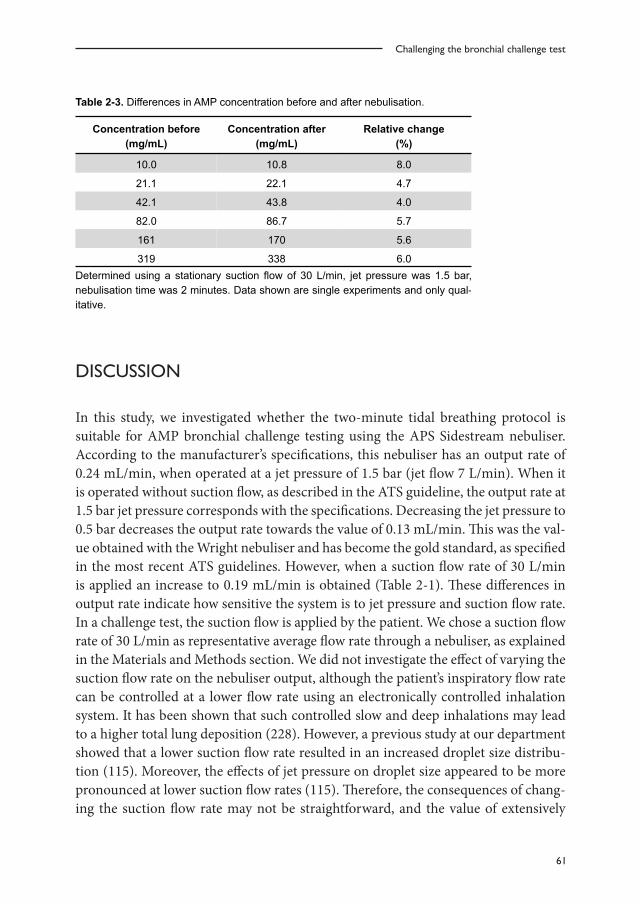
AMP concentrations before and after nebulisation were measured for the solutions used to determine the effect of AMP concentration on the droplet size distribution. The remaining solutions from duplicate experiments were combined in the same vial per concentration, so only one measurement could be performed. Therefore, the re-sults shown in Table 2-3 are only qualitative. An increase in AMP concentration of 4 to 8 % was observed over the entire concentration range. No correlation between the concentration and the extent of evaporation was found.
Figure 2-3. Influence of the AMP concentration (0–320 mg/mL) on the droplet size distribution from the APS Sidestream, operated at 1.5 bar jet pressure using a stationary suction flow rate of 30 L/min (n = 8, mean ±SD). C: AMP concentration; VMD: volume median diameter.
0
20
40
60
80
100
0.5 5 50
Cum
ulat
ive
dist
ribut
ion
/ %
Particle size / µm 0 10 20 40 80 160 320
C (mg/mL) VMD (µm) 0 5.10 (±0.17)
10 5.00 (±0.15)
20 4.70 (±0.16)
40 4.43 (±0.15)
80 3.92 (±0.22)
160 3.14 (±0.16)
320 2.93 (±0.18)
61
Challenging the bronchial challenge test
Table 2-3. Differences in AMP concentration before and after nebulisation.
Concentration before (mg/mL)
Concentration after (mg/mL)
Relative change (%)
10.0 10.8 8.0
21.1 22.1 4.7
42.1 43.8 4.0
82.0 86.7 5.7
161 170 5.6
319 338 6.0 Determined using a stationary suction flow of 30 L/min, jet pressure was 1.5 bar, nebulisation time was 2 minutes. Data shown are single experiments and only qual-itative.
DISCUSSION
In this study, we investigated whether the two-minute tidal breathing protocol is suitable for AMP bronchial challenge testing using the APS Sidestream nebuliser. According to the manufacturer’s specifications, this nebuliser has an output rate of 0.24 mL/min, when operated at a jet pressure of 1.5 bar (jet flow 7 L/min). When it is operated without suction flow, as described in the ATS guideline, the output rate at 1.5 bar jet pressure corresponds with the specifications. Decreasing the jet pressure to 0.5 bar decreases the output rate towards the value of 0.13 mL/min. This was the val-ue obtained with the Wright nebuliser and has become the gold standard, as specified in the most recent ATS guidelines. However, when a suction flow rate of 30 L/min is applied an increase to 0.19 mL/min is obtained (Table 2-1). These differences in output rate indicate how sensitive the system is to jet pressure and suction flow rate. In a challenge test, the suction flow is applied by the patient. We chose a suction flow rate of 30 L/min as representative average flow rate through a nebuliser, as explained in the Materials and Methods section. We did not investigate the effect of varying the suction flow rate on the nebuliser output, although the patient’s inspiratory flow rate can be controlled at a lower flow rate using an electronically controlled inhalation system. It has been shown that such controlled slow and deep inhalations may lead to a higher total lung deposition (228). However, a previous study at our department showed that a lower suction flow rate resulted in an increased droplet size distribu-tion (115). Moreover, the effects of jet pressure on droplet size appeared to be more pronounced at lower suction flow rates (115). Therefore, the consequences of chang-ing the suction flow rate may not be straightforward, and the value of extensively
62
Chapter 2
studying the influence of the suction flow rate on nebuliser output in a laboratory setting may be limited. We performed these measurements to test the robustness of the challenge test, and not to quantify all of the effects.
The manufacturer of the Sidestream nebuliser claims that it produces aerosol drop-lets with an MMAD of 3.2 µm. However, the results from our study showed that the design modification of the APS Sidestream led to an increase in the VMD from 3.15 to 5.10 µm (for water) at 1.5 bar jet pressure and a suction flow rate of 30 L/min com-pared to the standard Sidestream. Our study is not the first to report this deviation from the specifications. In another study with the APS Pro system an MMAD of 5.1 µm was found as well, although the authors did not discuss this difference (229). A third study reported an MMAD of 3.2 µm (230). Since no information is given on how this value was obtained, it could be that this was taken from the manufacturer’s specifications. Another explanation would be that both types of Sidestreams are ran-domly used for the APS Pro system. Either way, our results show that the special APS nebuliser cup cannot be replaced by the standard Sidestream without consequences.
The ATS guideline defines MMADs for the aerosol within the range of 1.0 to 3.6 µm. Decreasing the jet pressure, as would be necessary to meet the requirements for the output rate, increases the droplet size, as is shown in Figure 2-2. Additional effects of AMP concentration and suction flow on the nebuliser’s output rate (Table 2-2) and aerosol size distribution (Figure 2-3), make it virtually impossible to meet both requirements regarding output rate and MMAD simultaneously over the whole AMP concentration range.
The effect of various parameters on the output rate and aerosol size distribution of jet nebulisers is well known from literature. It has been shown that a reduction of the jet flow results in a lower output rate, but also in the release of larger droplets (115–117). Furthermore, the effects of the physicochemical characteristics of the solution have been subject of research. Viscosity (111) and surface tension (111–113) were found to be relevant to output rate and aerosol size distribution, although no clear overall cor-relations between surface tension and these output parameters could be established (111). Therefore, this characteristic was not investigated in this study. The solution’s characteristics depend on the concentration of the solute (114), which explains the differences in nebuliser performance at different AMP concentrations. The viscosity of the AMP solutions increases drastically and we found a reduction of both droplet size and output rate at increasing AMP concentration (Table 2-2). These results are in line with the results previously described by Le Brun et al. for tobramycin (114). Furthermore, it is important to realise that evaporated water is a part of the output.

63
Challenging the bronchial challenge test
Evaporative water losses result in an overestimation of the administered dose (128). The changes in concentration presented in Table 2-3 show that evaporation occurs, resulting in an increase of the concentration of the remaining solution. The relative change is of the same order of magnitude across the entire concentration range. How-ever, the absolute difference in concentration increases with increasing concentration and so does the deviation of the truly administered dose from the anticipated dose.
Many of the parameters that were shown to affect nebuliser performance, can be fair-ly well controlled or at least quantified during a bronchial challenge test. A highly rel-evant parameter that is most difficult to control is the patient’s breathing behaviour. We found that the output rate of the APS Sidestream increases when a suction flow is applied. This indicates that the patient’s inhalation has an effect on the adminis-tered dose. The AMP concentration influences the output rate when a suction flow is applied. Although this implies that the administered dose is not consistent over the concentration range, this variation may be of minor importance compared to the variation in droplet size at increasing AMP concentrations. A reduction of the drop-let size from 5 to 3 µm may significantly increase the (peripheral) lung deposition (22).
The deviation in aerosol size distribution from the manufacturer’s specifications, the differences found at different AMP concentrations and the differences found when a suction flow is applied, may have significant effects on the administered dose and site of deposition of AMP in a bronchial challenge test. Smaller aerosol droplets may result in a higher and/or more peripheral lung deposition (22), whereas variations in output rate may lead to significant deviations from the anticipated administered dose. The difference in response to two subsequent doses is, therefore, not merely caused by the duplication of the concentration. The response to AMP is expressed as the PC20, the concentration of AMP causing a 20% decrease in FEV1, which is calcu-lated by linear interpolation (225). However, our results show that such calculations are not correct, since more than one parameter changes at dose escalation.
In conclusion, we have demonstrated that the effects of the high AMP concentrations on nebuliser performance are so large that a straightforward dose comparison be-tween the lower and higher concentrations is impossible. These effects are inherent to nebulisation of the compound, so administering AMP according to the five-breath dosimeter method would not be different from the two-minute tidal breathing meth-od. It appears that a nebuliser might not be the right device to administer AMP/adenosine for bronchial challenge testing in escalating concentrations.

64
Chapter 2
Furthermore, our findings clearly show that all of the investigated parameters – con-centration, viscosity, jet pressure, suction flow rate and evaporation – influence the output of the nebuliser, and therefore, the outcome of a bronchial challenge test. We found that essential information on the influence of these parameters, especially the jet pressure (or flow), on nebuliser performance is lacking in the guideline. The rec-ommendation to adjust the jet flow to obtain the desired output rate (of 0.13 mL/min) may lead to dramatic shifts in the droplet size distribution, as shown in this study for the APS Pro system.
We recommend that instead of dictating fixed values for the output rate and nebuli-sation time, new guidelines should elaborate on adjusting the important parameters to obtain comparable outcomes. Jet pressure should be tuned to obtain the desired droplet size distribution, taking into account the effect of the concentration of the solution. Nebulisation time should be adjusted according to the nebuliser’s output rate to get the desired delivered dose. The patient should be instructed carefully on how to breathe, or nebulisation time should be adjusted according to the patient’s breathing behaviour.
Another interesting, albeit more expensive, approach would be to use an electron-ically controlled inhalation system, which regulates the inspiration volume and air flow, in order to minimise the influence of the patient as much as possible.
Finally, we are currently investigating whether nebulisation of AMP can successfully be replaced by dry powder adenosine.
ACKNOWLEDGEMENTS
We would like to thank M. Farenhorst from the Lung Function Laboratory of the University Medical Centre Groningen for the use of the APS Pro system and his technical assistance.

65
Challenging the bronchial challenge test