Embed Size (px)
Citation preview
University of Groningen
Understanding negative symptomsKlaasen, Nicky Gabriëlle
IMPORTANT NOTE: You are advised to consult the publisher's version (publisher's PDF) if you wish to cite fromit. Please check the document version below.
Document VersionPublisher's PDF, also known as Version of record
Publication date:2017
Link to publication in University of Groningen/UMCG research database
Citation for published version (APA):Klaasen, N. G. (2017). Understanding negative symptoms: Neuroimaging insights into the neurocognitivebasis of negative symptoms in schizophrenia. [Groningen]: Rijksuniversiteit Groningen.
CopyrightOther than for strictly personal use, it is not permitted to download or to forward/distribute the text or part of it without the consent of theauthor(s) and/or copyright holder(s), unless the work is under an open content license (like Creative Commons).
Take-down policyIf you believe that this document breaches copyright please contact us providing details, and we will remove access to the work immediatelyand investigate your claim.
Downloaded from the University of Groningen/UMCG research database (Pure): http://www.rug.nl/research/portal. For technical reasons thenumber of authors shown on this cover page is limited to 10 maximum.
Download date: 29-12-2019
Chapter 6
Apathy is related to reduced activation in cognitive control regions during set-shifting
Nicky G. KlaasenClaire KosAndré AlemanEsther M. Opmeer
Published in Human Brain Mapping, 2017; 38(5):2722-2733
100
AbstractApathy is a prominent and influential symptom in several neurological and psychiatric disorders, but it also occurs in the healthy population. It has considerable impact on daily life functioning, in clinical as well as healthy samples. Even though cognitive control is thought to be disrupted in people with apathy, the exact neural underpinnings of apathy remain unclear. Because flexible shifting between behaviors (set-shifting) is crucial for goal-directed behavior, disruptions in set-shifting may underlie apathy. In this study, the neural correlates of apathy during set-shifting were studied in 34 healthy participants with varying levels of apathy, measured by the Apathy Evaluation Scale (AES). During functional MRI scanning participants performed a set-shifting task, distinguishing between behavioral switches (a change in response to different stimuli), cognitive switches (a change in response rule), and salience decoupling (detecting a change in relevant stimuli). Regression analysis was used to assess the relationship between apathy and brain activation. Results showed that higher apathy scores were related to reduced activation in the medial superior frontal gyrus and cerebellum (Crus I/II) during cognitive set-shifting, but not behavioral shifting and salience decoupling. No relationship between apathy and accuracy or response time was found. These results support the idea that alterations in the neural basis of cognitive control, especially cognitive set-shifting, may contribute to apathy.
IntroductionApathy is a prominent symptom in several neurological and psychiatric disorders, including Alzheimer’s and Parkinson’s disease, traumatic brain injury, schizophrenia, and major depressive disorder (Andersson, Krogstad, & Finset, 1999; Cacciari et al., 2010; Dujardin et al., 2007; Foussias & Remington, 2010; Krishnan et al., 1995; Schooler et al., 2015; Spalletta et al., 2015). Apathy refers to a quantitative reduction of voluntary and purposeful behaviors (Levy & Dubois, 2006). It has been indicated as a predictor of worse functional outcome, for example reduced social, instrumental, and physical daily life abilities (Bobes et al., 2010; Kiang et al., 2003; Laatu et al., 2013; Pagonabarraga et al., 2015; Reekum et al., 2005). Despite the prominence of apathy in various disorders, the cognitive and neural underpinnings of apathy remain unclear. The number of studies on apathy in clinical populations has increased over the past years, but results may be influenced by factors like medication use, hospitalization, and comorbid symptoms. Apathy also occurs in a minority of the healthy people at subclinical to clinical levels (Fervaha et al., 2015b; Simon et al., 2015; Spalletta et al., 2013), and it can be considered to be part of the construct of subclinical negative symptoms (Fervaha et al., 2015b). Apathy in the healthy population is related to higher levels of distress (Fervaha et al., 2015b) and reduced quality of life (Pardini et al., 2016). Therefore, studying apathy in a healthy population may prove beneficial in order to assess the underlying cognitive and neural substrates.
Several affective and cognitive processes are suggested to play a role in goal-directed behavior and apathy might result from a disruption in any of these processes (Levy & Dubois, 2006; Stuss, Reekum, & Murphy, 2000). Goal-directed actions require a balance between flexible shifting between behaviors and maintaining current behavior despite distractions or competing behaviors (Goschke & Bolte, 2014). Therefore, reduced cognitive flexibility may play an important role in the occurrence of apathy (Levy &
APATHY AND SET-SHIFTING
101
6
Dubois, 2006).
Cognitive flexibility concerns the ability to switch between cognitive processes in response to a changing environment or internal goals and relies on intact salience detection and attention, working memory, inhibition, and shifting (Dajani & Uddin, 2015). A task that has previously been used to measure specific behavioral properties of cognitive flexibility, namely maintenance of a rule in mind, inhibition of an initial response, and periodically (overtly) changing the response rule, is the set-shifting task developed by Shafritz et al. (2005).This task distinguishes behavioral switches (a change in response to different stimuli) from cognitive switches (a change in response rule) and salience decoupling (detecting a change in relevant stimuli). Disturbances in all three processes could possibly underlie reduced goal-directed behavior and therefore lead to higher levels of apathy.
Brain areas that have been associated with both behavioral flexibility and cognitive set-shifting are the dorsolateral prefrontal cortex (DLPFC), anterior cingulate cortex (ACC), insula, and basal ganglia (Dajani & Uddin, 2015; Dosenbach et al., 2006; Leber, Turk-Browne, & Chun, 2008; Shafritz, Kartheiser, & Belger, 2005). Furthermore, there are indications that activation in the intraparietal sulcus (IPS) is specifically related to behavioral shifting, whereas activation in the ventrolateral prefrontal cortex (VLPFC) and posterior parietal cortex (PPC) are specific for cognitive set-shifting (Shafritz, Kartheiser, & Belger, 2005). Of these areas, the lateral PFC (including VLPFC, DLPFC, and frontopolar cortex), ACC, insula, and basal ganglia have also been implicated in apathy (Alzahrani & Venneri, 2015; Kirschner et al., 2016a; Knutson et al., 2014; Levy & Dubois, 2006; Stuss, Reekum, & Murphy, 2000; Zamboni et al., 2008). Therefore, differences in activation of these areas during behavioral and/or cognitive set-shifting might underlie apathy.
Besides behavioral and cognitive set-shifting, reduced sensitivity to salience of relevant stimuli could also play a role in the occurrence of apathy. If internal goals or external stimuli are not recognized as salient, motivation to respond to these stimuli may be lacking. Salience detection is associated with activation in the anterior insula and ACC (Seeley et al., 2007), an area that has shown altered activation in people with apathy (Bonnelle et al., 2015a; Knutson et al., 2014; Levy & Dubois, 2006; Njomboro, Deb, & Humphreys, 2012; Yuen et al., 2014).
To our knowledge, the direct relationship between apathy and behavioral shifting, cognitive set-shifting, and salience allocation has not been studied to date. In order to examine these processes, the current study used a set-shifting paradigm in healthy participants. We hypothesized that higher levels of apathy are associated with less accurate shifts in behavior or cognitive set according to task conditions and that this is related to altered activation in lateral prefrontal areas, basal ganglia, ACC, and insula. On the other hand, we hypothesized that apathy could also be related to reduced sensitivity for salience, possibly due to altered anterior insula and ACC activation.
102
Materials and MethodsParticipantsThree hundred students (from the University of Groningen and Hanze University for Applied Sciences) were screened on levels of apathy using the Apathy Scale (Starkstein et al., 1992) and the in- and exclusion criteria. Inclusion criteria were: age between 18 and 28 years old, right-handed, and native Dutch speaking. Exclusion criteria were: current or past presence of a neurological or psychiatric disorder (in the participant themselves; family history of psychiatric illness was not taken into account), use of medication that may influence brain activation, visual or hearing problems that could not be corrected, and MR-incompatibility. Subsequently, twenty students with the highest scores and twenty students with the lowest scores, who met the inclusion criteria, were invited to participate in the MRI session. All participants gave written informed consent after oral and written explanation of all study procedures. The study was approved by the Medical Ethics Committee of the University Medical Center Groningen and was carried out according to the Declaration of Helsinki.
QuestionnairesAt time of scanning, apathy was evaluated using the self-rated version of the Apathy Evaluation Scale (AES) (Marin, Biedrzycki, & Firinciogullari, 1991). Apathy was further characterized using the action initiation scale of the Lille Apathy Rating Scale (LARS) (Sockeel et al., 2006). The AES was used as the primary apathy measure because it was considered the most suitable for the population under investigation. Schizotypy was assessed using the Schizotypal Personality Questionnaire (SPQ) (Raine, 1991) and depressive symptoms were assessed using the Beck Depression Inventory (BDI) (Beck et al., 1961). A systematic review by Lako et al. (2012) showed that a substantial amount of items of the BDI may be identified as non-depressive symptoms, among others apathy, therefore a BDI depression score was calculated based on a pure depression factor defined by Shafer (2006). Although apathy and depression often co-occur, they are thought to reflect separate constructs (Levy et al., 1998). Therefore, we considered it not necessary to exclude participants based on BDI score to study the neural correlates of apathy, which may in fact limit generalizability of the results by selecting an overly homogeneous sample. Moreover, the role of depressive symptoms will be taken into account in the statistical analysis (see the section “fMRI analysis” for more information).
In order to further characterize the general psychological status of the participants, the Positive and Negative Affect Scale (PANAS) and the Symptom Checklist 90 (SCL-90) were administered. Finally, the Snaith-Hamilton pleasure scale (SHAPS) and Temporal Experience of Pleasure Scale (TEPS) were used to measure the ability to experience pleasure.
Set-shifting taskParticipants performed a set-shifting task adapted from Shafritz et al. (2005), which was presented in E-prime 2.0.10. This event-related task was scanned as part of an MRI protocol including 3 tasks and an anatomy scan. Before entering the scanner all participants received task instructions, followed by a short practice session. During scanning the task was introduced by a short recapitulation of the instructions to ensure
APATHY AND SET-SHIFTING
103
6
that the participant remembered the task instructions.
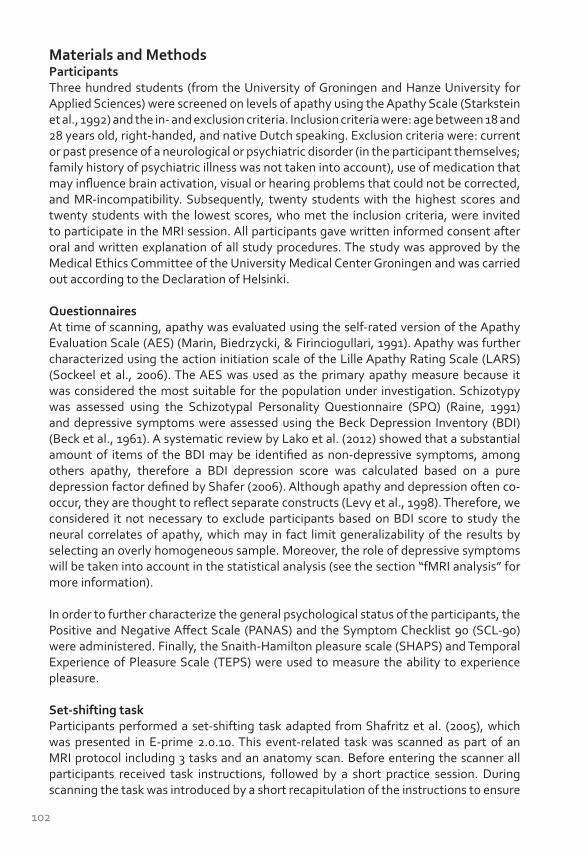
During the task, participants were presented with circles, triangles, and squares of different colors and sizes as stimuli (Figure 1). The task consisted of 14 epochs, each containing 40 pseudo-randomly presented trials, which contained one stimulus each. For each stimulus, participants were asked to determine whether it was a target shape or a different shape (non-target or standard). At the beginning of an epoch, either circles or triangles were appointed as the target stimulus, while the other shape became the non-target stimulus. Squares were standard stimuli and were never presented as a target.
Each epoch contained 4 target, 4 non-target, and 32 standard stimuli. The target changed every two epochs. This resulted in six epochs in which participants had to shift cognitive set (i.e., the target was different from the target in the previous epoch) and six epochs in which they had to maintain cognitive set (i.e., the target was the same as in the previous epoch). The first and last epoch were treated separately in the analysis, because the first epoch could not be classified as shift or maintain and the last epoch was excluded to maintain an equal number of maintain and shift epochs.
At the beginning of each epoch, the target shape (circle or triangle) for that epoch was presented for 2000ms. After this instruction stimuli were presented for 500ms, followed by a blank black screen with a jittered duration of 1000-2809 ms. This duration was pseudorandomly selected based on f(x)=2000 exp(-.1x)+1000, where x=[0, 100]. Participants were allowed to respond during the presentation of the stimulus and the first 1000ms of the following blank screen. They were instructed to respond by button presses using the right index finger for target stimuli and the right middle finger for the other stimuli (non-target and standard).
At the onset and end of the task a 16 s rest period was included. Furthermore, between the epochs there were rest periods of 8-9 s. The variation in duration of these rest periods were due to the programming in number of TRs, not in seconds, in order to obtain the exact TR for each participant. During all rest periods a fixation cross was presented. The total task duration was 19 minutes.
Stimuli of different colors and sizes were used to prevent habituation to physical stimulus characteristics (Kirino et al., 2000). However, to avoid confounding effects of stimulus appearance, color intensity was matched between conditions. Moreover, stimulus color and size, and their order of presentation during the task were the same for all participants, averaging out possible effects of color or shape.
104
Figure 1. Procedure of the set-shifting task. Stimuli were presented for 500ms; blank screens for 1000 - 2809 ms (jittered). The target stimulus changed every two epochs.
The task was used to examine neural activation during behavioral and cognitive set shifts as previously described in Shafritz et al. (2005). Behavioral shifts reflected an alteration of ongoing behavior. Specifically, all target trials required a shift in behavioral response, (i.e., response with the right index finger instead of the right middle finger). Consequently, the difference in activation during target versus non-target trials was calculated to assess the neural correlates of behavioral shifting. Shifting cognitive set was required to correctly respond to target stimuli during shift epochs. After all, the stimulus that was previously a target had become a non-target and vice versa. To examine neural underpinnings of cognitive set-shifting activation during targets in shift epochs was compared with targets during maintain epochs.
Related to this, but not previously examined in light of the current task, is salience decoupling. This process reflects detection of a change in relevance of a stimulus: if a stimulus that was previously salient (i.e., a target) is not salient anymore (i.e., a non-target), detection of this change is imperative for an appropriate change in behavior; hence neural activation during the presentation of non-target stimuli was compared between shift and maintain epochs.
Image acquisitionThe fMRI data were collected using a 3.0 Tesla Philips Intera MR-scanner scanner (Best, NL), equipped with a 32-channel SENSE head coil. During the task, whole-brain functional images were acquired using a T2*-weighted echo planar imaging sequence
APATHY AND SET-SHIFTING
105
6
(47 descending axial slices; slice thickness=3 mm; slice gap=0 mm; TR=2000 ms; TE=22 ms; FOV(ap,fh,rl)=192 x 141 x 192 mm; voxel size=3 mm isotropic, flip angle=90°, 583 volumes). For anatomical reference, a whole brain T1-weighted image was acquired (170 axial slices; TR=9 ms; TE=3.5 ms; FOV=232 x 170 x 256 mm; voxel size=1 mm isotropic; flip angle=8°). Images were tilted approximately 30° from the Anterior Commissure-Posterior Commissure (AC-PC) plane in order to prevent artifacts due to nasal cavities.
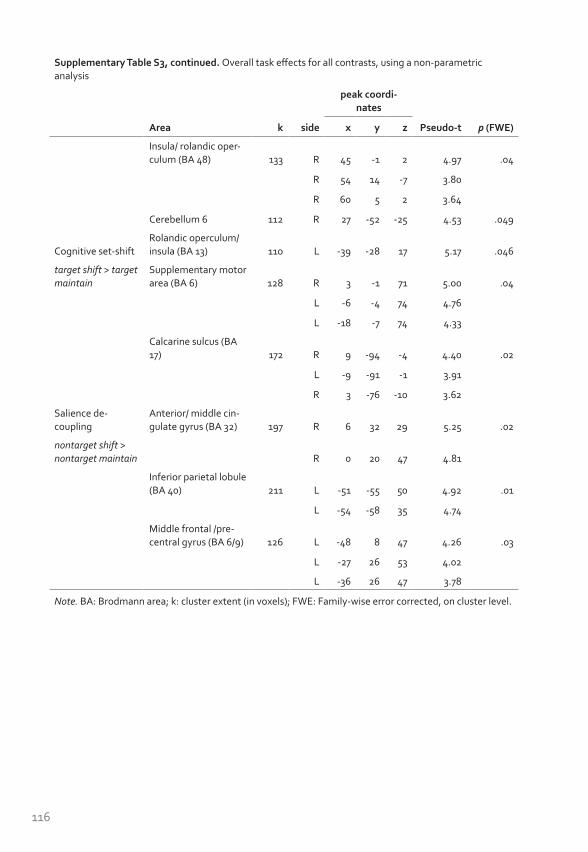
Clinical and behavioral analysisDemographic, clinical, and behavioral data were analyzed using IBM SPSS version 23.0 (IBM Corp, Armonk, NY, 2014) and MATLAB 2013a, (The MathWorks Inc., Natick, MA). Assessment of the distribution of AES scores (Supplementary Figure S1) indicated a unimodal distribution, confirmed by Hartigan’s Dip statistic (Hartigan & Hartigan, 1985), which showed no significant deviation from a unimodal distribution (D=.07, p=.160). Therefore, AES scores were treated as a continuous variable. This is in accordance with the idea that apathy is present along a continuum ranging from normal and subclinical levels the general population to clinical levels found in patients, a distribution similar to the continuum that has been proposed for the negative symptoms of schizophrenia (Kaiser, Heekeren, & Simon, 2011). Furthermore, this approach has been used in previous studies on the neural substrates of subclinical symptoms and personality traits in healthy subjects (Servaas et al., 2015; Vercammen & Aleman, 2010), including brain activation related to apathy (Simon et al., 2015). Bivariate relationships between apathy and demographic and clinical variables were examined. Because the assumption of bivariate normality was not met, Kendall’s Tau test was used.
In addition, mean accuracy was calculated per condition. Response times were summarized per condition using the median, as it is more robust to possible outliers and skewed distributions. For the assessment of possible differences on accuracy and response times between conditions, repeated measures analyses of covariance (ANCOVA) were used with condition as the within-subject factor and AES scores as covariate of interest. In case of a nonsignificant effect of AES scores, this analysis was repeated without this covariate in order to assess the main effect of condition. In case of a significant F-test, subsequent post-hoc pairwise Bonferroni-corrected comparisons were performed. For all tests, significance was set to p<.05.
fMRI analysisThe data were preprocessed and analyzed using Statistical Parametric Mapping (SPM12 version 6470) (http://www.fil.ion.ucl.ac.uk/spm) implemented in MATLAB 2013a. First, the PAR/REC-files were converted to NIfTI, using an in-house script. Both T1 and T2* images were reoriented manually to the AC-PC plane. Afterwards, slice time correction to the first slice was performed. Functional images were realigned to the mean image. The resulting motion parameters showed that motion was minimal for all participants (<3 mm translation and <3° rotation). In order to further detect possible motion artifacts, functional displacement (FD) was calculated. Motion was deemed excessive when FD>0.9 for a certain volume (Siegel et al., 2014). The amount of volumes with excessive motion was minimal (< 5%) for all participants, which we regarded acceptable. The T1-image was coregistered to the mean functional image. The data was then normalized to Montreal Neurological Institute (MNI) space. Finally, images were smoothed using
106
an 8 mm Full Width Half Maximum Gaussian kernel.
Hemodynamic changes related to the set-shifting task were calculated using a General Linear Model (GLM). For the first-level models, standard, non-target, and target trials were defined as regressors separately for shift and maintain epochs. Onsets were defined as the onset of the stimulus and durations were set to the response time for each individual trial. In addition, instruction periods and the first and last epoch were defined as separate regressors of no interest. Furthermore, motion parameters and their first temporal derivatives were added to the model as nuisance regressors. A high pass filter of twice the fundamental frequency (i.e., the longest period between two subsequent trials of the same condition), calculated per individual, was applied. For all participants, first-level contrasts for behavioral shift (target>non-target), cognitive set-shift (target shift>target maintain), and salience decoupling (non-target shift>non-target maintain) were defined and were taken to second level.
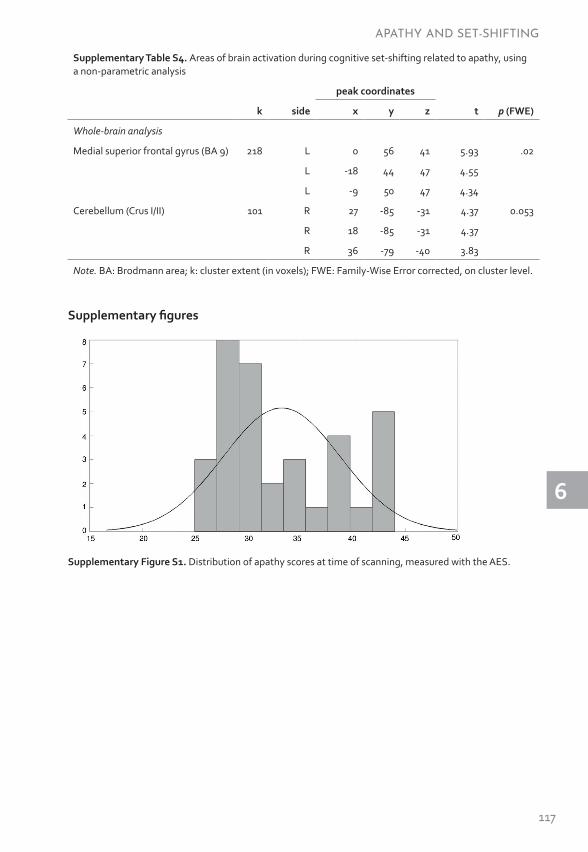
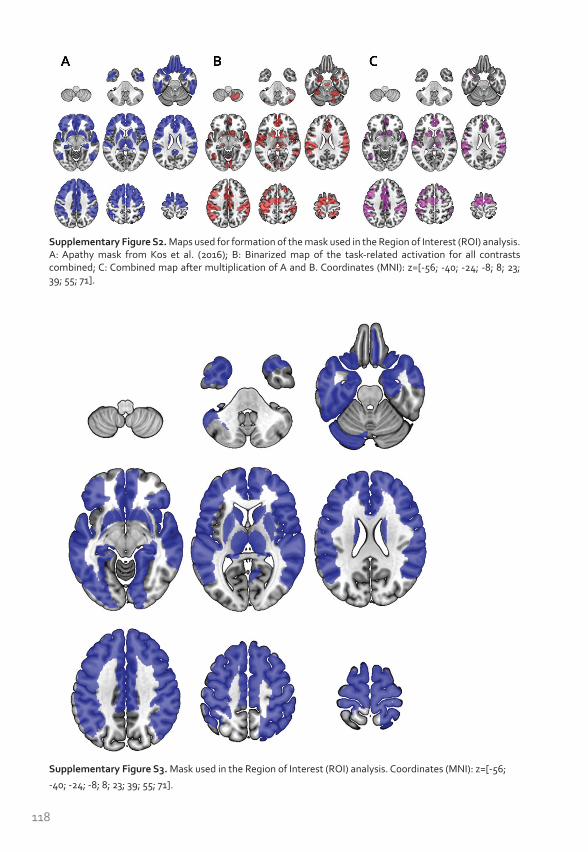
On second level, all contrasts were separately entered into one-sample t-tests to assess the main effects of task over all participants. Subsequently, a linear regression analysis was performed with AES scores as the independent variable, to assess the association between the level of apathy and neural activation. Significance was set to p<.05 family wise error (FWE) cluster-level corrected, with an initial threshold of p=.001, uncorrected. In order to be more sensitive to apathy-related brain activation differences, the multiple comparisons correction was small-volume corrected for a predefined mask of our regions-of-interest. This mask consisted of apathy-related brain areas that were relevant for the current task (i.e., a conjunction between an apathy mask and the current task activation). For the apathy mask, a map was used including brain areas related to apathy in various disorders (Kos et al., 2016). This map was multiplied with the binarized map of the combined task-related activation for all contrasts (Supplementary Figure S2). The final mask consisted of Automated Anatomical Labeling (AAL) areas that contained the overlapping areas (Supplementary Figure S3 and Supplementary ROI mask). Furthermore, all analyses were repeated for the whole brain in order to account for possible effects outside the ROI-mask (also p<.05 FWE cluster-level corrected with an initial threshold of p=.001).
Apathy is thought to be closely related to depression and positive schizotypy. Indeed, there were high correlations between the AES and the BDI depression and SPQ positive scale in our sample (Table 1). Because of these considerable correlations between AES and the BDI depression and SPQ positive subscales, any clusters of apathy-related activation were explored in more depth. Specifically, it was assessed whether the variance in these clusters was uniquely explained by AES-scores, or whether any variance explained by the AES was also explained by the BDI depression or the SPQ positive score. For this purpose, the first eigenvariates of the activation in the apathy-related clusters were extracted. These were entered into a stepwise linear regression analysis in which BDI depression, SPQ positive and AES were entered step-wise as independent variables, whereby the AES was entered last. To emphasize the exploratory nature of this analysis and in order to avoid the suggestion of circular analysis, only explained variances were reported. We did not test whether the beta-values were significantly different from zero, because this analysis was merely an exploration of the relationship
APATHY AND SET-SHIFTING
107
6
between AES scores and brain activation that was found in the main analysis.
ResultsDemographicsSix participants were excluded because of insufficient task performance (accuracy of <50% in one of the conditions). Demographic and clinical variables of the remaining 34 participants can be found in Table 1. Notably, whereas AES scores were found at the lower end of the clinical range (Kant, Duffy, & Pivovarnik, 1998), PANAS, SCL-90, TEPS, and SHAPS scores were within the normal ranges. AES scores correlated positively with scores on the LARS action initiation scale, the BDI depression factor, all subscales and total score of the SPQ, the PANAS positive subscale, the SCL-90, the TEPS, and the SHAPS. No relationships were found between AES scores and age, gender, or years of education. All participants reported occasional use of alcohol, except for one participant who reported no use of alcohol. Five participants reported occasional drug use. However, neither alcohol use nor drug use was excessive or could be classified as substance abuse in any of the participants. Moreover, alcohol use during the 24 hours before scanning was minimal and not related to AES scores and only one participant used marijuana in the 24 hours before the scan.
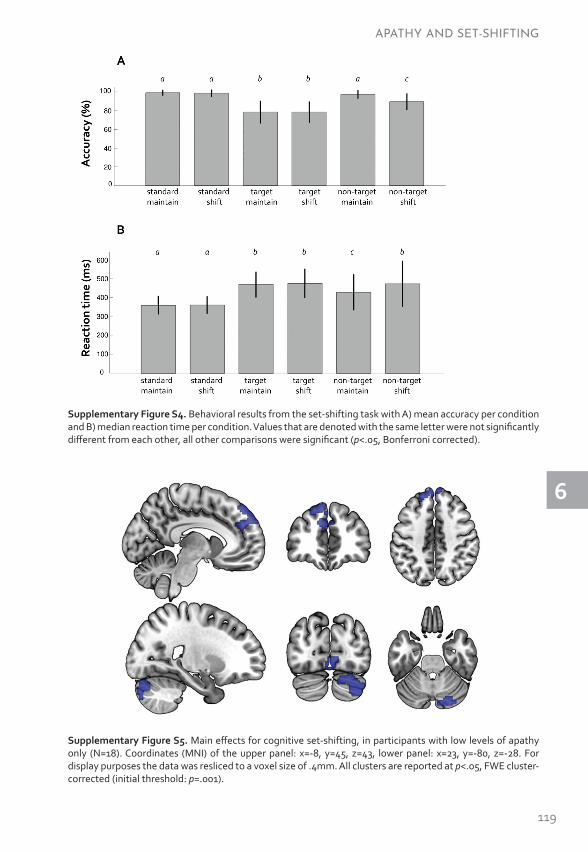
Behavioral resultsRegarding both accuracy and reaction times, Mauchley’s test of sphericity revealed that the assumption of sphericity was not met (χ2(14)=176.78, p<.001 and χ2(14)=141.81, p<.001, resp.). Therefore, the Greenhouse-Geisser correction was applied (ε=.56. and ε=.48, resp.). For both accuracy and reaction times there was no main effect of AES score (F(1, 32)=1.31, p=.26 and F(1, 32)=.38, p=.54, resp.), nor an interaction effect of condition and AES score (F(2.81, 89.95)=.18, p=.90 and F(2.15, 68.77)=.09, p=.93, resp.). Because there was no main or interaction effect of apathy, the analysis was repeated without the AES score as covariate. These results showed an effect of condition on both accuracy (F(2.81, 92.71)=69.09, p<.001) and reaction times (F(2.16, 71.16)=56.97, p<.001). Subsequent post-hoc pairwise comparisons revealed that accuracy in target trials was lower than in standard and non-target trials. Accuracy in non-target shift trials was lower than in non-target maintain trials. Reaction times were faster during standard trials than during the other conditions. During the non-target conditions, reaction times were faster during maintain trials compared to shift trials (Supplementary Figure S4).
fMRI resultsMain effects of taskBehavioral shifting was associated with activation in the postcentral/precentral gyrus, extending to the supplementary motor area (SMA), inferior parietal lobule, and supramarginal gyrus and furthermore in the anterior cingulate cortex (ACC), extending to the orbital medial and medial superior frontal gyrus. Cognitive set-shifting elicited activation in the rolandic operculum and the calcarine sulcus, extending to the lingual gyrus. Salience decoupling was associated with activation in the ACC and middle cingulate cortex, extending to the medial superior frontal gyrus and SMA, and in the inferior parietal lobule, extending to the angular gyrus and the supramarginal gyrus (Supplementary Table S1 and Figure 2A).
108
Table 1: Demographic and clinical variables
Possible range1 Mean (SD) Min/max τ AES total p
N - 34 - - -
Age - 22.68 (2.23) 18/27 .002 .99
N Male/female - 12/22 - .11 .48
Education (years2) - 17.38 (2.00) 14/24 -.06 .66
AES total 18/72 33.26 (5.55) 25/44 - -
LARS action initiation -4/4 -2.66 (1.33) -4/1.5 .53 <.001
SPQ positive 0/46 7.62 (6.09) 0/23 .37 .004
SPQ negative 0/43 7.50 (5.83) 0/22 .57 <.001
SPQ disorganization 0/19 5.12 (4.26) 0/15 .29 .025
BDI depression factor 0/33 3.26 (4.41) 0/19 .49 <.001
PANAS positive 10/50 33.32 (7.13) 18/46 -.36 .005
PANAS negative 10/50 14.24 (3.65) 10/25 .21 .098
SCL-90 total 90/450 121.38 (25.60) 92/179 .46 <.001
TEPS 18/108 81.56 (11.56) 55/102 -.46 <.001
SHAPS 0/14 1.21 (2.76) 0/14 .33 .02
Cigarettes3 - 1.39 (4.11) 0/20 -.23 .19
Alcohol4 - 0.85 (2.27) 0/12 -.23 .19
Note. AES: Apathy Evaluation Scale; LARS: Lille Apathy Rating Scale; SPQ; Schizotypal Personality Questionnaire; BDI: Beck Depression Inventory; PANAS: Positive and Negative Affect Schedule; SCL-90: Symptom Checklist 90; TEPS: Temporal Experience of Pleasure Scale; SHAPS: Snaith-Hamilton Pleasure Scale; 1Higher scores indicate stronger severity, except for PANAS positive. 2Including primary school.
3Number of cigarettes smoked in the 24 hours before scanning; 4Units of alcohol consumed in the 24 hours before scanning.
Relationship with apathyDuring cognitive set-shifting, higher apathy scores were associated with reduced activation in the (medial) superior frontal gyrus (mSFG), extending to the middle frontal gyrus (Table 2). A comparable cluster, but more extended to the middle frontal gyrus, was found in the whole brain analysis. Furthermore, the whole brain analysis supplemented the findings with an activation cluster in the cerebellum (Crus II, extending to Crus I) in which activation was reduced in relation to higher apathy scores (Table 2, Figure 2B).
Further exploration of the first eigenvariates of these clusters showed that a substantial part of their variance was uniquely explained by AES-scores (27.6% for the mSFG and 15.9% for the cerebellum), over and above the variance that was explained by BDI-depression and SPQ-positive scores (19.2% for the mSFG and 12.7% for the cerebellum).
There were no significant associations between apathy and brain activation for the other contrasts (i.e., behavioral shifting and salience decoupling), both small volume corrected and whole brain.
APATHY AND SET-SHIFTING
109
6
Figure 2. Brain activation during the set shifting task. A) Overall task activation (N=34). Green: main effects for behavioral shifting; blue: cognitive set-shifting; yellow: salience decoupling. Coordinates (MNI) of the upper panel: MNI x=-47, y=-24, z=16, lower panel: x=-6, y=-83, z=42. B) Areas related to apathy during cognitive set-shifting (N=34). Coordinates (MNI) of the upper panel: x=-8, y=45, z=43, lower panel: x=23, y=-80, z=-28. For display purposes the data was resliced to a voxel size of .4mm. All clusters are reported at p=.05, FWE cluster corrected (initial threshold: p=.001).
The fact that activation in the mSFG and cerebellum was not found in the main task effect of cognitive set-shifting could be due to an attenuation of the overall signal in these areas caused by the participants with high levels of apathy. In order to confirm this and to exclude the possibility that activation in these areas is not directly related to cognitive set-shifting, task effects were also assessed separately for participants with the lowest scores on the AES, based on a median split of the AES scores (Supplementary Table S2 and Supplementary Figure S5). This median split on AES scores was chosen over including the participants with the lowest AS scores obtained during initial screening,

110
because the AES was administered at moment of scanning and therefore more closely reflects the level of apathy at moment of the measured brain activation. The follow-up analysis confirmed the involvement of the medial superior frontal gyrus and cerebellum Crus I/II in cognitive set-shifting.
Table 2. Areas of brain activation during cognitive set-shifting related to apathy
peak coordinates
k side x y z t p (FWE)
ROI analysis
Medial superior frontal gyrus (BA 9) 91 L -3 53 44 4.77 0.018
L -21 41 44 4.70
R 0 56 41 4.44
R 6 56 41 4.41
L -33 35 41 3.58
L -9 38 53 3.56
Whole-brain analysis
Cerebellum (Crus I/II) 91 R 18 -85 -31 4.87 0.02
R 36 -79 -40 3.82
Medial superior frontal gyrus (BA 9) 95 L -3 53 44 4.77 0.017
L -21 41 44 4.70
L -33 35 41 3.58
Note. BA: Brodmann area; k: cluster extent (in voxels); FWE: Family-Wise Error corrected, on cluster level.
During the course of the current analysis, the study by Eklund et al. (2016) has shown that in some cases, the use of cluster inference may lead to inflated error rates. Furthermore, they showed that using non-parametric models to analyze fMRI data may prevent error rate inflation. Even though excessive inflation of error rates was not expected given the current design (using a cluster-forming threshold of p=.001, uncorrected, combined with a jittered event-related design), this recent development was taken into account. Specifically, in order to assess the robustness of the current results, all analyses were repeated using a nonparametric analysis (see Supplementary Methods). Using the non-parametric approach, all task activation clusters remained significant at FWE<.05, cluster corrected, with a cluster-forming threshold of p=.001, uncorrected (see Supplementary Table S3 for the results). Regarding the regression analysis, the association between AES scores and the cluster in the (medial) superior frontal gyrus remained significant, while the relationship with the cluster in the cerebellum was now at trend-level (p=.053; Supplementary Table S4).
DiscussionIn the current study we investigated cognitive flexibility in relation to apathy using a set-shifting task. Notably, higher levels of apathy were related to less activation during cognitive set-shifting in the medial superior frontal gyrus (mSFG) and, to a somewhat
APATHY AND SET-SHIFTING
111
6
lesser extent, the cerebellum (Crus I/II). There was no relationship between apathy severity and brain activation during behavioral shifts and salience decoupling.
Medial superior frontal gyrus To our knowledge, the current finding of reduced activation in the mSFG during cognitive set-shifting in relation to apathy is novel. This finding is in line with findings on the function of the mSFG and a relationship between the mSFG and apathy has previously been found in clinical samples using other paradigms. Cognitive functions like working memory, planning, rule-finding, and set-shifting are imperative for carrying out goal-directed actions and impairments in one or multiple of these domains may lead to higher levels of apathy (Levy & Dubois, 2006). Even though lateral prefrontal areas are often thought to be involved in these functions, the mSFG, through interactions with these lateral prefrontal areas, has been implicated in various cognitive control processes as well (Coutlee & Huettel, 2012; Taren, Venkatraman, & Huettel, 2011). These include overcoming prepotent responses and preparations for successful shifts in response (Horga et al., 2011), but also control over and preference for response strategies (Venkatraman et al., 2009a, 2009b), which are all important for cognitive set-shifting. In addition, the involvement of the mSFG in the occurrence of apathy is in line with previous findings on the neural correlates of apathy in clinical samples. A recent review by Kos et al. (2016) concluded that numerous studies have provided evidence of associations between apathy and alterations in prefrontal areas, among which the mSFG, in patients with neurodegenerative diseases. Moreover, it has been found that in patients with schizophrenia, atrophy in the mSFG is related to reduced cognitive flexibility as measured with the WCST (Bonilha et al., 2008). In addition to focal abnormalities in the mSFG, Alexopoulos et al. (2013) have shown that in patients with late-life depression, apathy is related to increased connectivity between the mSFG and the nucleus accumbens. Therefore, the current finding of a relationship between apathy and medial superior frontal activation during cognitive set-shifting may support the idea of disturbances in cognitive control in people with apathy.
Cerebellum (Crus I/II)Besides lower prefrontal activation, reduced activation in Crus I/II of the cerebellum was found in relation to apathy during cognitive set-shifting. When the analyses were repeated using a non-parametric analysis, this effect was reduced to trend-level. Whereas the cerebellum is classically thought to be involved in motion control, it has become apparent that cerebellar activation is also involved in executive functions (Koziol et al., 2014), in particular cerebellar Crus I/II (E et al., 2014; Niendam et al., 2012; Stoodley, 2012). Moreover, a study by Stoodley et al. (2012) has shown that Crus I and II are involved in cognitive rather than motor tasks. Crus I and II have been found to be a part of the executive control network during rest (Habas et al., 2009) and stronger connectivity between Crus I and II within a frontoparietal resting-state network has been found to predict better executive functioning in healthy people (Reineberg et al., 2015). Studies in non-human primates have shown Crus I and II projections from and to the dorsolateral prefrontal cortex, a key region for cognitive control (Buckner, 2013). Moreover, novelty seeking, a personality trait that is thought to be reduced in people with apathy (Marin, 1991; Sockeel et al., 2006) has been related to larger cerebellar white matter and cortical volume, as well as to microstructural grey matter changes in
112
the left Crus I of the cerebellum in healthy adults (Laricchiuta et al., 2014; Picerni et al., 2013). In addition, cerebellar Crus I and II dysfunction has been found in patients with Parkinson’s disease and apathy (Robert et al., 2012; Skidmore et al., 2013). Furthermore, impairments in flexibility on attentional performance tasks and goal-directed daily-life tasks have been found in patients with vascular cerebellar lesions (Manes et al., 2009). Together these results support a disturbance of the cerebellum Crus I and II during cognitive control as an underlying substrate for apathy. However some caution is warranted, as this was only partially replicated using the non-parametric approach.
Specificity of cognitive set-shiftingAlthough we hypothesized that shifts in cognitive set as well as in behavior and in salience decoupling were associated with apathy, reduced neural activation was only found during cognitive set-shifting. This could be related to the specificity of the underlying process. Shafritz et al. (2005) stated that a behavioral shift reflects either the alteration of ongoing behavior or the implementation of the appropriate response, while a cognitive set-shift reflects implementation of a new cognitive set. The current findings may therefore imply that apathy in a healthy sample is related to flexibly implementing a cognitive set rather than shifting behavior. Furthermore, based on our results we suggest that only brain activation during relatively more cognitively demanding tasks is related to apathy, whereas relatively less demanding processes like behavioral shifting and salience decoupling are unaffected. That we only found an effect of apathy during cognitive set-shifting and not lower-level processes might also be related to the high levels of education and relatively high functioning of the participants. Lower-level cognitive control processes like salience decoupling and behavioral shifting may be disrupted in apathy in lower educated or lower functioning populations. However, further investigation, using different paradigms and patient samples is warranted to explore these possibilities.
Strengths and limitationsThe apathy-related reduction in prefrontal and cerebellar brain activation during cognitive set-shifting supports the importance of cognitive flexibility as a substrate of reduced goal-directed behavior or apathy. Because the sample in the current study was psychiatrically and neurologically healthy and did not take any psychoactive medication, this effect seems independent of disease or medication status and may therefore be a more general apathy-related disturbance.
Several limitations of the current study should be taken into consideration. First, the high correlations between apathy and other psychopathology measures may give rise to the question whether the found disturbances are in fact apathy-related or a more general effect of subclinical psychopathology. However, the follow-up analysis showed that a considerable amount of variance was uniquely explained by apathy severity. This emphasizes the unique contribution of apathy levels to these findings. Secondly, there was no effect of apathy on behavioral measures during the task. However, this could be due to a lack of sensitivity of the behavioral measures that were employed, especially given the subtlety of the effect of apathy in a high-functioning healthy sample. Because the current task was specifically designed for use in an fMRI paradigm it was not optimized for the detection of subtle behavioral alterations.
APATHY AND SET-SHIFTING
113
6
Future researchDespite some subclinical symptoms, all participants in the current study were free of any lifetime neurological or psychiatric diagnoses and were all students in higher education. This could have resulted in an extraordinarily high functioning sample and therefore may reduce generalizability to the general population. Replication of these results in more general, neurological, and psychiatric samples could build upon these results towards a more general cognitive and neural substrate of apathy. Moreover, investigating the substrate of apathy in different healthy and patient samples could reveal similarities and dissimilarities between different groups, and increase the understanding of apathy.
Moreover, Levy and Dubois (2006) have proposed impairments in several cognitive, emotional/affective and auto-activation mechanisms as possible substrates for apathy. The current study provides insight in the neural correlates of apathy during one particular cognitive control process. Several recent studies have investigated possible neural substrates of apathy during planning (Liemburg et al., 2015) and reward and effort processing (Bonnelle et al., 2015a; Kirschner et al., 2016a; Simon et al., 2015). Future studies may add to this by focusing on the neural correlates of apathy using different paradigms. Clearly, further research into the full range of possible cognitive and neural substrates of apathy, in both healthy and in patient samples, will promote the understanding of apathy.
ConclusionTo conclude, apathy in healthy people was related to activation of the medial superior frontal gyrus and, somewhat less consistently, the cerebellum (Crus I/II) during cognitive set-shifting. However, apathy was not related to brain activation during behavioral shifting or salience decoupling. These results support the involvement of the neural substrates of cognitive control, especially cognitive set-shifting, in apathy.
FundingThis study was supported by a VICI grant from the Netherlands Organization for Scientific Research (grant number 453.11.004) and a European Research Council (ERC) consolidator grant (project number 312787), both awarded to AA.
AcknowledgementsThe authors would like to thank Lydia Datema and Mieke Geertsema for their help in participant recruitment and assessment, Anita Sibeijn-Kuiper and Judith Streurman for their assistance with MRI scanning, and Dr. Remco Renken and Dr. Jan-Bernard Marsman for their support during data processing.
114
Supplementary MaterialSupplementary methodsIn order to assess the robustness of the fMRI results, all analyses were repeated using a nonparametric analysis using SnPM13 (http://warwick.ac.uk/snpm). For the main task effects, all first-level contrasts from the parametric analysis (i.e., behavioral shift: target>non-target, cognitive set-shift: target shift>target maintain, and salience decoupling: non-target shift>non-target maintain) were entered in separate one-sample t-tests. For the association between AES scores and brain activation, a regression analysis was used, with AES scores as the covariate of interest. Variance smoothing was set to 8 mm FWHM kernel and 5000 permutations were computed. Significance was set to p<.05, FWE cluster-corrected, with a cluster-forming threshold of p=.001.
Supplementary tables
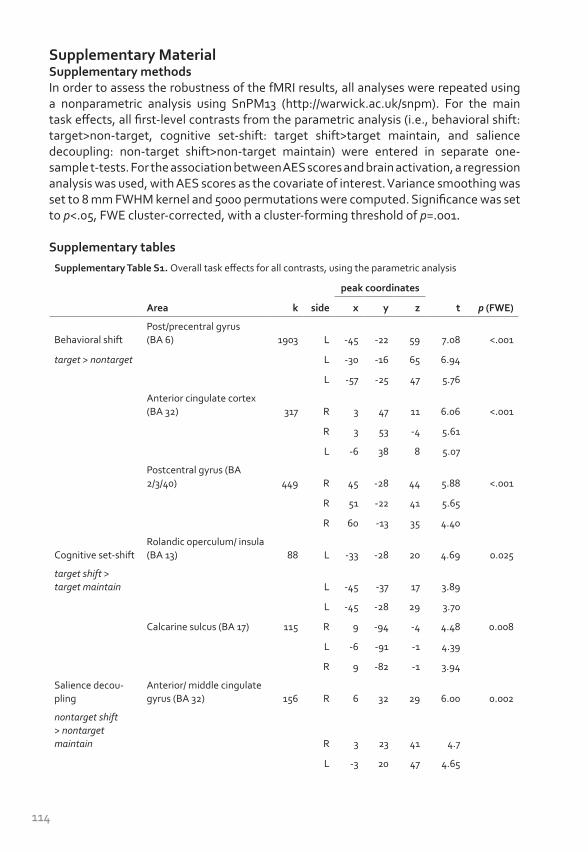
Supplementary Table S1. Overall task effects for all contrasts, using the parametric analysis
peak coordinates
Area k side x y z t p (FWE)
Behavioral shiftPost/precentral gyrus (BA 6) 1903 L -45 -22 59 7.08 <.001
target > nontarget L -30 -16 65 6.94
L -57 -25 47 5.76
Anterior cingulate cortex (BA 32) 317 R 3 47 11 6.06 <.001
R 3 53 -4 5.61
L -6 38 8 5.07
Postcentral gyrus (BA 2/3/40) 449 R 45 -28 44 5.88 <.001
R 51 -22 41 5.65
R 60 -13 35 4.40
Cognitive set-shiftRolandic operculum/ insula (BA 13) 88 L -33 -28 20 4.69 0.025
target shift > target maintain L -45 -37 17 3.89
L -45 -28 29 3.70
Calcarine sulcus (BA 17) 115 R 9 -94 -4 4.48 0.008
L -6 -91 -1 4.39
R 9 -82 -1 3.94
Salience decou-pling
Anterior/ middle cingulate gyrus (BA 32) 156 R 6 32 29 6.00 0.002
nontarget shift > nontarget maintain R 3 23 41 4.7
L -3 20 47 4.65
APATHY AND SET-SHIFTING
115
6
Supplementary Table S1, continued. Overall task effects for all contrasts, using the parametric analysis
peak coordinates
Area k side x y z t p (FWE)
Inferior parietal lobule (BA 40) 176 L -57 -58 35 5.28 0.001
L -54 -55 47 4.87
L -51 -49 23 3.74
Note. BA: Brodmann area; k: cluster extent (in voxels); FWE: Family-wise error corrected, on cluster level.
Supplementary Table S2. Task effects for cognitive set-shifting in participants with low apathy scores, using a parametric analysis
peak coordinates
k side x y z t p (FWE)
Cerebellum (Crus I/II) 201 R 18 -88 -31 5.43 <.001
R 33 -82 -43 5.22
R 30 -85 -34 4.98
Medial superior frontal gyrus (BA 9) 149 R 6 56 41 4.53 0.017
L -12 41 29 4.23
L -3 56 32 4.13
Lingual gyrus/calcarine sulcus (BA 18/17) 84 R 0 -82 -10 4.45 0.029
9 -94 -7 4.35
Note. BA: Brodmann area; k: cluster extent (in voxels); FWE: Family-Wise Error corrected, on cluster level.
Supplementary Table S3. Overall task effects for all contrasts, using a non-parametric analysis
peak coordi-nates
Area k side x y z Pseudo-t p (FWE)
Behavioral shiftPost/precentral gyrus (BA 6) 2164 L -39 -19 65 7.62 <.001
target > nontarget L -48 -34 59 6.07
L -27 -43 71 6.06
Postcentral gyrus (BA 2/3/40) 656 R 42 -31 44 5.94 .004
R 51 -28 53 5.38
R 60 -19 44 4.74
Anterior cingulate cortex (BA 32) 417 R 0 44 8 5.45 .007
R 3 50 -4 5.21
R 0 62 8 4.60
116
Supplementary Table S3, continued. Overall task effects for all contrasts, using a non-parametric analysis
peak coordi-nates
Area k side x y z Pseudo-t p (FWE)
Insula/ rolandic oper-culum (BA 48) 133 R 45 -1 2 4.97 .04
R 54 14 -7 3.80
R 60 5 2 3.64
Cerebellum 6 112 R 27 -52 -25 4.53 .049
Cognitive set-shiftRolandic operculum/ insula (BA 13) 110 L -39 -28 17 5.17 .046
target shift > target maintain
Supplementary motor area (BA 6) 128 R 3 -1 71 5.00 .04
L -6 -4 74 4.76
L -18 -7 74 4.33
Calcarine sulcus (BA 17) 172 R 9 -94 -4 4.40 .02
L -9 -91 -1 3.91
R 3 -76 -10 3.62
Salience de- coupling
Anterior/ middle cin-gulate gyrus (BA 32) 197 R 6 32 29 5.25 .02
nontarget shift > nontarget maintain R 0 20 47 4.81
Inferior parietal lobule (BA 40) 211 L -51 -55 50 4.92 .01
L -54 -58 35 4.74
Middle frontal /pre-central gyrus (BA 6/9) 126 L -48 8 47 4.26 .03
L -27 26 53 4.02
L -36 26 47 3.78
Note. BA: Brodmann area; k: cluster extent (in voxels); FWE: Family-wise error corrected, on cluster level.
APATHY AND SET-SHIFTING
117
6
Supplementary Table S4. Areas of brain activation during cognitive set-shifting related to apathy, using a non-parametric analysis
peak coordinates
k side x y z t p (FWE)
Whole-brain analysis
Medial superior frontal gyrus (BA 9) 218 L 0 56 41 5.93 .02
L -18 44 47 4.55
L -9 50 47 4.34
Cerebellum (Crus I/II) 101 R 27 -85 -31 4.37 0.053
R 18 -85 -31 4.37
R 36 -79 -40 3.83
Note. BA: Brodmann area; k: cluster extent (in voxels); FWE: Family-Wise Error corrected, on cluster level.
Supplementary figures
Supplementary Figure S1. Distribution of apathy scores at time of scanning, measured with the AES.
118
Supplementary Figure S2. Maps used for formation of the mask used in the Region of Interest (ROI) analysis. A: Apathy mask from Kos et al. (2016); B: Binarized map of the task-related activation for all contrasts combined; C: Combined map after multiplication of A and B. Coordinates (MNI): z=[-56; -40; -24; -8; 8; 23; 39; 55; 71].
Supplementary Figure S3. Mask used in the Region of Interest (ROI) analysis. Coordinates (MNI): z=[-56;
-40; -24; -8; 8; 23; 39; 55; 71].
APATHY AND SET-SHIFTING
119
6
Supplementary Figure S4. Behavioral results from the set-shifting task with A) mean accuracy per condition and B) median reaction time per condition. Values that are denoted with the same letter were not significantly different from each other, all other comparisons were significant (p<.05, Bonferroni corrected).
Supplementary Figure S5. Main effects for cognitive set-shifting, in participants with low levels of apathy only (N=18). Coordinates (MNI) of the upper panel: x=-8, y=45, z=43, lower panel: x=23, y=-80, z=-28. For display purposes the data was resliced to a voxel size of .4mm. All clusters are reported at p<.05, FWE cluster-corrected (initial threshold: p=.001).

120
Supplementary ROI mask. Mask used for the ROI analysis, may be found in the online version of this article: http://dx.doi.org/10.1002/hbm.23556

APATHY AND SET-SHIFTING
121
6