Embed Size (px)
Citation preview

University of Nigeria Research Publications
OLIOMOGBE, Thompson I
Aut
hor
PG/MBA/00/31124
Title
The Impact Of Inventory Management On Organizational Performance: A Study Of
Nigeria Breweries PLC And Nigeria Bottling Company PLC
Facu
lty
Business Administration
Dep
artm
ent
Management
Dat
e
October, 2002
Sign
atur
e

No. 27 Collcge Road, Ogui New Layout, Enugu MOTTO: YOUR CHOICE IS 01. JR TARGET

PRESENTED B'Y C>I;IOhIOGBE, THOMPSON I.
PGIMBA,~00/3 1 124
b PROJECT REPORT SUBMITTED TO THE
DEPARTMENT OF MANAGEIL?FNT FACULTY OF BUSINESS ADMINISTRATION SCHOOL OF POST - GRADUATE STUDIES
UNlVERSIT'r' OF NIGERIA ENUGU - CAMPUS

TITLE PAGE
"THE lM15r.r.. ,- OF INVENTORY MANAGEMENT ON
ORGAN!r ATIOFl,fl I i2E14FORMANCE".
(A STUDY OF NIGERIA BREWERIESS PLC AND NIGERIA
BOTTLING COMPANY PLC).

CERTIFICATION
Ol~omogbe, Thompson I., a post-graduate student rn the
department of management with r-egistrat~on number
FG/MBA/00/3? 124, has sat~sfactor~ly conipletcd the requ~rement
for the C O L I I S ~ and research work for the Post-graduate Master of
Business Admintstration (MBA) Degree in Management.
Thrs project is an embljdiment of orgnal work and has not . -
been subrn~tted In part or In full for any other D~ploma or Getgee -
of this or any 0th3i Untversity or Polytech~rc.
Y Head of ~epar tm&ht CHUKWU, C . 0 .
Supervisor CHIEF J.A. EZEH.

DEDICATION
T h ~ s project IS ded~cated to my spout; MRS G T
OLIOMOGBE, who dur-mg the perlsd the whole work was bemg
put together exercised a lot of p:~tlence and understandrny for
my not bemg ava~lable a good part of the trme
Above all, I w s h to thank the Lord for seeing me through
the entlre MBA programme
b

ACKNOWLEDGEMENT
I w ~ s h to thank Chief J 4 Eze my project supervisor for his
guldance throughout the per~od that the work was being put
to~~ , i~c r . HIS ~ o r d s of advice and suggest~on were very apt
and found to be very useful.
i also w s h to thank c;tl~zrs, too numerous to mention, who
in one w ~ y or the other contributed to the successful complet~on
of the project. @
Last but not the least, I wish to express my s ~ ~ ~ i e r e thanks
to Lady Justma Odoemenam who took great pains and care In
ensuring that the manuscr~pt was well typed and leglb!e

ABSTRACT
This is a research project carried out to identify and
determine the impact of inventory management and control on
organisationat performance (a study of Nigeria Breweries PLC
and Nigeria Bottling Company PLC).
A sanipie size of 200 respondents all random!y selected
fronl :he staff and management of both Nigeria Breweries PLC
and Nigeria Buttling Company ? L C ail at 9"' Mile. Ngwo. ~ n h g u ,
were used. Both primary and secondary data were collected and
analysed using the Chi-quart : test.
The researcher, based on the data coliecied and analysed,
found out that:
- The respondents from both organizations understand
what inventory management is all about;
- That the organizations go for and use first class raw
materials in the production of their fmished products,
- Inventory management make a great impact on the
organizations mar dactur iny process;
\ 11
7 he pronerly applied princ~ples of cyclrcal order quantrty
model of ~nventory control does not permit continuous flow
of pr-odi.rcts to customers, cont~nuous flow of product~on in
organ~sat~onal prof~ts;
S u ~ t m l y empioyed f~xed order quant~ty systi-m of inventory
control does not assure continuous flow of Input mater~als,
oprrat~ons and ensure opt~rnal lnvzntory levels
Appropr~ate adoptlor-I of the prrnc~ples of the
requirement planning method of ~rlvcntory contro
mate
decrease In overheads, check in abrupt halt rn product~on
b
rmls
not
reduce costs LAdsociatzd w ~ t h holding In overheads arid
checks In halt In product~on schedule
l does

LIST OF FIGURES
Figure 2 .1 : H~present ing thz believe that costs carrying
invzntory vary neal'ly directly with ths size ,f the
order guantity.
Fig: ire 2.2: Representing Economic order quanti~y
Figure 2.3: Representing t k relatinnship betwezn inventory
costs and level of customers services.
Figure 4. I : A pie cnar-t, rzprxent ing the believe that inventory
management has an impact on manufiicturing
process. B
Figure 4 .2 : A t-1istograr.n: r-epresenl,,ig the impact inventory
ma~agernent make in manufacturing process.
Figure 4.3: A Bar chart, representing the believe that there are
problerns encountered in the management of raw
materials invmtory it1 ine orgarii"atior~.

LIST OF TABLES
Table 4.1 :
Table 4.2:
Table 4.3:
Table 4.4:
Tabie 4 .5 :
Tablc 4.6:
Table 4.7:
Table 4.8:
Table 4.9:
Table 4.10:
I ab!? 4. I ' I :
Table 4.12.
Table 4.13:
Sex arid Age D~strtbut~on of Responuents
Total Number of Respcndents
!.lnder 5:mdlng of Inventory Management
Sources of Raw Materials
Quality of Raw rnater~als used in product~on
L e ~ g t h of time it takes to procure the materials
Storage method of the raw materials
Has inventory management any impact on your
manufacturing process? D
What impact does inventory management make in
management process?
Are there prohlems encountered in the inventory
management of raw materials in the organization?
What is the nature of the problem?
Dces principles of cyclical order quality model of
inventory control permit continuous flow of products to
customers, continuous flow of production in the
organisatiotxd profit?
Does the suitable employed fixed order quality system
of inventory assl.!re continuous flow of input material,
decrease in overheads, check in abrupt halt in
production operations and ensure optimal inventory level?

Table 4 .14 Does appropriate adoption of the principles of 'the
materials requirement planning method of inventory
control, reduce costs assc,~ated with holding
resources in inventory reserve, decrease in
overheads and checks in halt in production schedule?
Table 4.15: Chi-square Test:- The principle of cyclical order
quality model af inventory control does not permit
continuous flow of products to customers, continuous
flow of production in the organisational pr'ofit.
Table 4.16: Chi-square 7 est:- Suitable employed fixed order qualrty b
system of inventory control does not assure
continuocrs f lou of input materials, decrease in
overheads, check in abrupt halt in product operatrons
and ensure optimal inventory level.
Table 4.17: Chi-square Test - Appropriate adoption of the
principles of materials requirement planning method of
inventory control does not reduce costs associated
with holding resources in inventory reserve, decrease
in overheads and checks in halt in production
schedule.

TABLE OF CONTENTS
Title page
Certification
Dedication
Acknowlef.:'yement
Abswact
List of figures
Llst of Tables
Table o i contents
CHAPTER ONE
Introduction
Background of the study
Statement of problem
Objectives of the study
Research Questions
Significance of the study
Formulation of research hypotheses
Scope of the study
Limitation of the study
Profde of Nigeria Brewer~es (NB) PLC
Scope of 3peratlons
Profrle of Nigerra Bottling Company (NBC) PLC
Defmrtion of terms
References

CHAPTER TWO
Literature Review
Background to Literature Review 22
Inventory Management Conceptual Overview 23
Types of Inventory Management 25
Factors Influencing Inventory Level 26
l nventory Control Systemrrechniques 27
Reasons for Inventory Control in an Organisation 31
Economic Order Quantity 35
Derivation of Economic Order Quantity 41 B
GainJlmportance of lnventory Control Quantity Discount 47
Problem of Inventory Management 51
Functions of Inventory 53
2.1 1 : Merits of Inventory Management " 54
2.12: Demerits of inventory Management 57
2.13: Inventory Management and Control by Nigeria ~rewer ie 's
(NB) PLC. 60
2.14: lnventory Management and Control by Nigeria Bottling
Company {I'JBC,) PLC. 61
2.15: Summary of related literature 62
References 64
CHAPTER THREE
3.0: Research Design and Ivlethodoiogy 67

Research Method
Method and Source of Data Collection
Questionnaire
Interview Method
Libraries
Population for the study
Procedure for data gathering
Validity and reliability of data instrument
Determination of sample size 72
Method of data analysis
Test of Hypotheses
CHAPTER FOUR
Analysis and Interpretation of Data 77
Part A: Response Rate and Personal data analysis of 77
respondents
Part 8: Analysis of response based on 80
problems/objective
Test of hypotheses 93
References 102
CHAPTER FIVE
Summary of findings, conclusions and recommendations 103
Summary of findings 103

5.2: Conclusions
5.3: Recommendations
5.4: Areas for further research
Bibliography
Appendix I
Appendix I I
Appendix Ill

CHAPTER ONE
I .O INTRODUCTION 8 . i:
1 . BACKGROUND TO THE STUDY
S~irvival of any business concern depends to a very great
extent on the firm's ability to effectively manage and control its
invent.ory. The inability to achieve this feat has caused the failure of
man) industries. Inventory ttlerefore plays a central role in any
business. It is the main reason for the continuous existence of any B I
business organisation mostly those in ma~ufacturmg sector.
Generally, lnventory control, as a management tool, is the
method or methods employed in maintaining detailed lists, showing
quantities and values of raw materials, work - in - process, and
finished goods held in warehouse stock. I
However, many management practiuners and authors have
va r io~~s definitions of inventory control and management. For
instance, Johnson et al. (1 985: 21 2) define inventory management
as the use of various techniques to optimize levels of all types of
stock, raw materials, work -in -progress and finished goods. They

2
observe that inventory management and control take into
consideration such factors as
- Sales forecast,
- Economic batch quantities
- Product~on plann~ng
- Plant and equipment control and so on.
From another perspective, Lewis (1 995: 13) sees inventory
management and control as a science - based art of ensuring b '
that just enough inventory or stock is held by an organisation to
economically meet both its internal and external demand
commitments. As an essential component of any organisational
system, Lucey (1987: 132) observes that the boundary of
inventory management and control should encompass the
various elements which must work harmoniously for.,, the
achievement of the system's objective.
In addition to this, Fedire (1990: 35) notes that the ideology
of material management extends from an integrated approach to
planning, acquisition, conversion, flow and distribution of

production materials from the raw materials stage to the finished
goods stage.
Several statistics clearly point out the current significance of
the inventory control function. A study of corporate balance sheet 1 -
shows that a firm's inventory commonly constitute from 15 to 25
percent of its invented capit;?! Mags, 1996: 419). He emphasizes I
the cost element because the central objective is to ensure that a
minimum of residual stock is maintained while incurring the least
possible cost. He further reports that numerous studies conducted
by consultants and manufacturing firms reveal that a typical
manufacturer incurs inventory carrying cost of from 17% to 20%
of average inventory value.
? .2: STATEMENT OF PROBLEM
Inventory plays an essential role in any organization. The
larger the inventory size, the easier it is to reduce costs of
p~:rchdsing, manufacturing and shipping as well as provide prompt
customers service. However, a larger inventory stock requires a I
higher mvestment of money, higher carrying cost such asdorage.
handling risk of obsolescence# and data processing. These

costs must be balanced off against any advantages in holding
inventory. To what extent have N ~ g e r ~ a Breweries PLC and
Nigeria Bottling company PLC tried to achieve this balance?
What are the techniques of inventory management that are
employed by the companies in the pursuit of this equilibrium?
1.3 OBJECTIVES OF THE STUDY:
The objectives of the study are as follows:
( i ) The study of in rn to ry management practices in Nigenia
Breweries PLC and Nigeria Bottling Company PLC,
Enugu, as they relate to:
Sources, quality and availability of raw materials used in
production; the length of time it takes to procure the
materials and how the rai: materials are stored.
I I I (a) The Optimum inventory level of the organizations
(b ) Inventory control policy or policies
(c) lnventory control of organizations.
(iii) To find out the impact of inventory management on the
company's manufacturing processes.

(iv) To ascertain the problems encountered in the
management of the raw material inventory in the
organisation and make recommendations.
To facilitate the invest~gation of this study, the following
research questions will be addressed. 1
-3 RESEARCH QUESTIONS
( i ) What are the sources and quality of raw materials that
are available to Nigerra Breweries PLC and thg
Nigeria Bottling Company PLC?
(ii) How long does it take to procure the raw materials?
(iii) What storage techniques do the organizations use in
storing their raw materials?
(iv) Identify the inventory management practices and
policies that are being used by the organisation.
(v) What zre the inventory management problems of the
organisation?

1.5 SlGNlFlClANCE OF THE STUDY
The signif~cance of t h ~ s study cannot be over estimated
It IS sgn~f~cant because data so generated from the study IS
suff~cient to expand further f~elds of knowledge of t h ~ s top~c
from many other dimens~ons. The study also, present sufficient
challenges to academ~cs to increase their research interests in
the field of knowledge.
The government will also benefit from this research in
the sense that, they will learn of the eff~cacy of inventory
management and control and how it contributes to the growth
and development of an organization. This will therefore,
make the government to encourage the adequate production
and importation of raw materials and spare parts
It will also help other organizations and even house holds
, . I to appreciate the benefits accruable from the effective and
sufficient application/adoption of inventory management and
control.

1.6: FORMULATION OF RESEARCH HYPOTHESES
Modern researchers agree that research work, when-
ever feasible should proceed from hypotheses because
hypotheses serve as a powerful beacon that light the path for
the research work. Also hypotheses are necessary whenever
causes - and effect relationship are to be discovered. Thus,
formulating hypotheses, as framework for this study becomes
imperative. B
be lo\^ are the null and alternative nypotheses.
1 Ho: The ?ropesly applied principles of Cyclical order
quantity model of inventory control does not permit
continuous flow of products to customers,
continuous flow of production in organisational
profits.
H,: The properly applied principles of Cyclical order
quantity model of inventory control permit
continuous flow of products to customers,

continuous flow of production in organisational
profits.
2. Ho: Suitably employed fixed order quantity system of
mventory control does not assure continuous flow
of input materials, decrease in overheads, check in
abrupt halt in production operation and ensure
optional inventory levels.
HI: Suitably employed fixed order quantity systembof
inventory control assure continuous flow of input
rnateria!~, decrease in overheads, check in abrupt
halt in production operation and ensure optional
inventory levels.
3. Ho: Appropriate adoption of the principles of the materials
requirement planning method of inventory control
does not reduce costs associated with holding
resources in inventory reserve, decrease in
overheads and checks in halt production schedule.

HI: Appropriate adoption of the principles of the
materials requirement planning method of inventony
control certainly reduce costs associated with
holding resources in inventory reserve, decrease in
overheads and checks in halt in production
schedule.
1.7 SCOPE OF THE STUDY
In this study we are concentrating mainly on the
inventory management practices in the Nigeria Breweries PLC
and the Nigeria Bottling Company PLC, Enugu, as they relate
to sources, qmlity and availability of raw materials used in
production; the length of time it takes to procure the materials
and how the raw materials are stored.
1.8 LIMITATION OF THE STUDY I
This study is limited only to the populat~on that will be
sampled in the two organizations. Its research in Nigeria, and
indeed other developing countries. is still in the infant stage,
most of the background data (statistics) that form the bedrock

of research are not readily available. This forms one of the
major bottlenecks the writer encountered in carrying out this
study.
The sludy is also, hindered by time and financial
constraints. In order to meet with the deadline for the
submission of bound copies of this project, and bearing in mind
the lean purse of the researcher, a relatively extensive area of
the country cannot be covered. B
7.9 PROFILE OF NIGERIA BREWERIES (NB) PLC
SCOPE OF OPERATIONS
Nigeria Breweiies PLC, the pioneer and largest brewing
Company in Nigeria, was incorporated in 1946 and recorded a
landmark when the first bottle of STAR larger Beer rolled off the
bottling lines in its Lagos Brewery in June 1949 . This was
followed by Aba Brewery which was Commissioned in 1957 ,
Kaduna Brewery In 1963 and lbadan in 1982 .In September
1993, the fifth company in Enugu was acqulred by the
company. Thus from its humble beginning in 1946, the

cnmpany now has five breweries from which high quality
products are distributed to all parts of this great country.
COMPANY EQUITY
With about 55,000 shareholdersl the authorized share
capital of Nigeria Breweries PLC is N457m, sixty - five per
cent (6596) of the share is held by Nigerians amongst who are
co.i~lpany employees of various categories. The company's
turnover increased from N10.768 billion in 1995 to N12.256
billion in 1996, while a sum of N4.6 billion was paid to the
Federal and State Governments in various forms of taxes as
against N4.0 billion in the previous year.
In 1996, the company paid a dividend of N1.00 per
share, amounting to N915m. This level of dividend is better
appreciated if it is recalled that the company gave a h p t
issue of one for o m in 1995, thus increasing the equity
base of the company from 457.5m ordmdry shares to 915
million ordinary shares. The import of these developments
has been a corresponding growth in the prosperity of

company's shareholders whose funds have appreciated in
value far in excess of their original investments.
BRAND PORTFOLIO
Nigerizl Breweries PLC has a portfolio of six htgh
quality brands; Star larger Beer (1949): Gulder Larger Beer
(1 970); Maltina (1 976); Legend Extra stout (1 992); Amstel
Malta (1994) and the Schweppes range of carbuoated sbft
drinks (Schweppes Soda water) launched in December. 1996.
Together, the brands have facilitated a strong leadership
position in the total brewed products market in Nigeria. Their
outstanding quality and consumer franchise complement other
company values and capabilities to set Nigeria Breweries PLC
apart as the house of quality.

EXPORT
NRC PLC has an Increasing export business that dates back
to I986 Currently, ~t exports to the U K., U S A , Italy,
Netherlands, Germany and Ker \)A.
RESEARCH AND DEVELOPMENT
N~ge r~a Rrewerles PLC has kept pace with key
international development Thus ensurlng that its systems,
processes and operational procedure are always , ' in
conformity with proven best practices in most parts of the
world. It is in line with this policy that the company established
a Research and Development Centre in 1987 to enhance its
research act~vilies 01-1 all aspects of the brew~rlg operation. ;I
ANCILLARY INDUSTRIES I
,*
As a major brewering concern, the company encourages
the establishment of ancillary business Many of these
organ~zations and individuals depend largely on the company
for their m e a x of livelihood. These include manufacturers of
bottles, crown corks, labels, cartons, plastic crates and such
services as Hotels/ Clubs and Direct customers.
SOCIAL RESPONSIBILITY
Nigeria Breweries PLC is a socially responsible
corporate citizen with an enviable record of rendering corporate
philanthropy in the areas of education, sports, and health,
among others. The company recently established an Educatidn
Trust Fund of NlOO million to take more active part in rthe
funding of educational and research facilities in higher
institutions, 311 in an effort to provide and encourage academ'ic
excellence In Nigeria. This is in addition to its secondary
and University Scholarships' programme for children of its
employees.
Nigeria Breweries PLC is the foremcs: sponsor of spoits
by variety in the country with sponsorship covering Table
Tennis, Lawn Tennis, Cyclmg, Chess, Golf, Badminton, Dart,
Boat Race and Ayo. The aim is to develop Nigeria Sports
men and women to partic~pate in national and international
sports. In the health sector, the company is committing funds
to the building of the sickle cell centre in Nigeria, among
other health related and charity activities. I
CONCLUSION
Nigeria Breweries PLC is a model of success in the
private sector. The company's high profile, profitability and
s~~ccessful operations can be traced to good product quality;
efficient management of operations and strategic penetratfon
into market environment. Others are proper understanding
of consumer attitudes and habits and high social responsibility
profile at national and zonal levels (Source: Diary of NB PLC,
2000)
I 1 PROFILE OF NIGERIA BOTTLING COMPANY(NE3C) PLC
An Ice- cold bottle or glass of Coca - cola IS believed t~ I
! the best known taste in the world (source: Coca - cola
annual pamphlet titled "The fact you should know about coca I
cola") Coca - cola was first made in May, 8'". 1886. It was
first made by Dr. John Styth Pemberton, a pharmacist He

made coca - cola in his home in Atlanta, Georgia, USA. The
name Coca - cola was given to the product by frank M.
Robinson, Dr. Pemberton's partner and book keeper;. He also
designed the flowing script that distinguished the famous trade
mark.
Coca - cola contents remain a secret as they have been
for over 100 years. The formula known as MERCHANDISE
7X is kept in a special security vault in a bank in the United
States.
How is coca - cola made?
The first thing is to ~ A x t the bottles (both new and L
returned), and dispose of those with defccts. The bottles ar2
ttlen washed thoroughly. After this, the bottles are closely
scsut~nized to ensure they are hyyienrcaliy clean and not I
cn~pped. In another section of the plant, pure refined sugar
is added to pure drinkable water to produce a solution called
'simple syrup':

In the next stage, the syrup is passed through a filter tp
ensure its purity. This then flows to a poini where it is mixed
with the undiluted coca - cola solution known as concentrate.
Carbon dioxide gas (C02) is now added to give refreshing coca -
cola. At this step, coca - cola is now tr~easured into bottles
mechanically
People got to know about coca - cola t h r i ~ g h Dr. I
Pemberton's Advert~sing and Marketmg activities. Coca - cola b
came into Nigeria in 1953 when the Nigeria Bottling Company
opened its plant in Lagcs. About 7,000,000 bottles of Coca ,-
Cola are iaken in Nigeria annually. Other drinks made by NBC , ,
include; Fanta orange, Fanta Chapman, Sprite, Krest Bitter
Lemon, Schweppes Bitter Lemon, Soda, Tonic and Eva Ta e 81 1
Water.
SOCIAL RESPONSIBILITIES BY NBC FOR A BGTTER
NBC has helped developed other industries such as, Delta
Glass company which produces soft drink bottles; Grown
Products Limited which n~anufacture bottle crowns; Benin

plastic: company which makes plastic cases for bottles. These
are sources of employment for many N~gerians.
(a) NBC employs thousands of Nigerians
(b) NBC has several dealers for its products all over Nigeria,
all of whom are called on once a week.
(d) NBC has the largest privately owned fleet of dellvery
trucks, pick - ups and cars in Nigeria- all working to
bring delicious coca - cola to Nigerians. & I
What does NBC give back to the society ? NBC always
puts something back to the society as a reward for
patronizing its products mainly through Philanthrop~c activities.
For exatnple, the company is n leader in the crusade for
environtnental protect~on. It is conscious of its social
responsibilities. For this reason, it sponsors sporting events I
activities such as:
- Football, where it sponsors the national team and
local competition.
- Table tennis, the Nigeria (closed) championships;

- The conservation movement;
- Activities of thc disabled; and
- Many c~mmuna l events and pr
Pamphlet of NBC PLC, 2001)
A . A - 1 DEFINITION OF TERMS
ojects. (Source:
Econo!,. ic order quantity:
This is calculated ordering qclantity which minimizes the
. balance of costs between inventory holding costs and re8
order costs.
Carrying Costs: hclude such costs as interest on capital
invested in the stock, storage charges, lightening, heating,
refrigeration, rent, handling costs, aud~ting, stock taking or
perpetual inventory costs, insurance and security
deterioration, obsolescence and pilferage etc.
Finished goods: Consists of all stock that is ready for sale.
In a textile company for example: the finished product
comprises different types of textile . . . ..materials that are
already in bundles and can be disposed for sale in the market.

Conipor~ent parts: They are either nianufactured or purchased
units which are carried in stock.
Inventory: Pefers to the quantity of stock that is kept or stored
for m e as the need arises.
Re-order quantity: The quant~ty of the replen~shment order.
Safety stock: Also called buffer stock. A stock allowance to
cover errors in forecasting the lead time or the demand during the
lead time.
b Stock - out Cost: Include such costs as cost contribution through
the lost sale caused by the stock - out, loss of future sales because
customers go elsewhere, loss of customers good will etc.
Supplies: They are items which are not includeci in the
product, except in a way Such things as lubricating oil, r e p i r parts
of machines, cleaning arid polishing materials and similar indirect
cost items.
Work - in process: After the materials have started through the
steps of the process, it is considered as material in process.

2 1
REFERENCES
Fedire, N. (1990): Production, Plannmg and Co-ntrol, New York,
Pergaman press Inc.
Imaga, E. U. L. (1996): Theory and Practice of Production
Manaqement, Enugu, Gostak printing and publishing -
Co. Ltd.
t, al (1 985): Techniques for Production Efficrency,
London, Macniillan press Ltd. b
Lewis, D. (1995): Emerqinq Concepts rn Management, New York,
Macmillan Publishing Company.
Johnson, L
Lucey, T. (1 987)- An Introdi~ctign to CostingA London, EHB and DP
Publicstions.
Lyson, G. (1986): "Purchasing M and E" Handbook in Business
Management, London, Pitman p~~bl ishing Ltd.
Zen?, P. (1985): Basic Prociuctjon Manaclement, New York, John
Willey and Sons Inc.,
Diary of NB PLC, 2tidO.
Pamphet of NSC PLC, 2001.

CHAPTER TWO
2.0: LITERATURE REVIEW
2.1 BACKGROUND TO LITERATURE REVIEW
In any study, such as th~s, it is always imperative to
cr~tically review written opinions, views and statements of other
peqlle, materials and texts that have relevance and reference
to the topics of discussion. This chapter therefore, is aimed
at reviewing some of the most important l~terature OF the
topic - "The impact of inventory management on organisational
performance."
Before this is carried out however, the researcher will
attempt to carry out a conceptual overview, which will enable
us to understand the real concept of inventory management,
before analyzing the various management and control
methods in inventory that are capable of making a great
impact on organisatronal performance.

2.2: INVENTORY MANAGEMENT: CONCEPTUAL
OVERVIEW: I
One of the main functions of management in any system
is the management of inventory, modern business
organizations are increasingly aware :..f the impact of efficient
inventory management in ensuring prompt, effective and
efficient customer's services that result to profitability.
lnventory refers to the quantity of stock that is kept or
stored for use as the need arises. It includes raw materials.
materials - in - process, finished products, component parts, I
suppl~es 1 miscellaneous inventory
Inventory man~gement pertains to the development and ,
administration of policies concerning stock of inventory as well
as the system and procedure by which they are implemented.
The main objective of inventory management is to discover
and maintain the opt~mum level of investment in the inventory.
According to Achison (1 999: 136), "Inventory is the term
for the quantity of stock and lor its value and quality held by

the authority in an organization. It includes the tang~ble
materials /assets of a company other than the f~xed assets; it
comprises raw - materials, all the items to be incorporated into
the finished products, components, work in progress, finished
items or saleable products, that are stored for use as the
need ar~ses". I
Inventory management is synonymous with stock
control, which is a system whereby the levels of supplies in
stock are regulated to maintam quantities requred without
stock excess or stock deficiencies It also involves techniques
used to ensure that stocks are kept at levels that gliarantee
maximum service levels are "stock control coverage analysis" I
This is control technique which aims at maximizing the use of
capital invested In stock. This can be dune by making a
quantitative assessment of likely "carry through" of intakes to
minimize produciion. The techniques serve as a control
mechanism with which the stock balance is continuoilsly up
dated promptly.

2.3 TYPES OF INVENTORIES MANAGED IN AN
ORGANISATION
Before going into detail review of the literature specified
under the above subject heading, we shall first examine types
of invwtory maintained in various organization. I
(a) Raw Material Inventories:
These are those units of inputs which have been
purchased and stored for future prod~lction. They may be
purely extracted materials, half - produced products, or
completely produced ones which the firm does not produce , .
itself.
Their purpose is to differentiate the production function 1
from the purchasing function so as to make the functions
independent of each other. That is, assuming there is a delay
in the shipment of raw materials, ~t does not cause any delay in
the production process. In the event of or delay in procirrement
of raw materials by relying on its inventory.
(b) Work - i:~-proccss Inventory
This consists of partially finished goods requiring
additional work before they become complete finished goods
(c) .'JRO - Inventory Maintenance, Repair and Operating
Supplies
This consists of those consumed in the process of
production, but which do not become part of the product e.g
Lubrication oil, soap, machine repair parts. B
(d) Fio~ished Goods Inventory:
These are completed products ready for shipment as
required by customers. I ,
2.4 FACTORS INFLUENCING INVENTORY LEVEL. 1 '
Many factors combine to influence the level of inventory 'I I
kept i r l every organization. These factors include:- anticipated I
production, seasonality of production; reliability of sources of
supply; efficiency of scheduling purchase and efficiency of
operations. The length of production process determines the

work -in-process inventory while the level of finished - goods
inventories is a matter of coordinatiiig production and sales.
2.5: INVENTORY CONTROL SYSTEMITECHNIQUES ,
The approaches that I: rnanufact~lring firm may employ
for the purposes of inventory control can be grouped into two
broad categories:
a) Stock Replenishment (SR)
b) Material Requirement Plannmg (MRP: B
S t o c k Rep len i shmen t A p , , ~ o a c h
This is a!so called re-order level control method.. In
using this method a level of stock is maintained by setting a
re-order point. As soon as this point is reached it triggers or
\
signals the need for a replenishment of Lie stock of the item.
Orlicky defines stock replenishment as "a set of procedures,
decision rules and records intended to ensure continuous
physical availability of all items comprising an inventory in the
face of uncertain demand".

Material Requirement Planning (MRP)
Materials Requirement Planning is defined by Orlicky ,
In Achison (1999. 137) as "consisting of a set of logically
related procedures, decision rules and records designed to
translate a master production schedule into time - phased net
requirements". Quantities required are specified on the basis
of future demand, and it is precisely determined from the
original producticn schedule for product. Thus, orders for
items are placed when triggered by a time - based signal. The
"Schedule" defines when finished batches and items are *
needed for production. It encompasses scheduling 'and
provisioning activities associated w~ th production resour'ces
(raw materials or parts) to match output needed and supplies
available materials. Requirement Planning is a manufacturing
techriique which is most applicable where the demand for
items is dependent on other items. It is product oriented, and
in most large industries the procedure is computerized
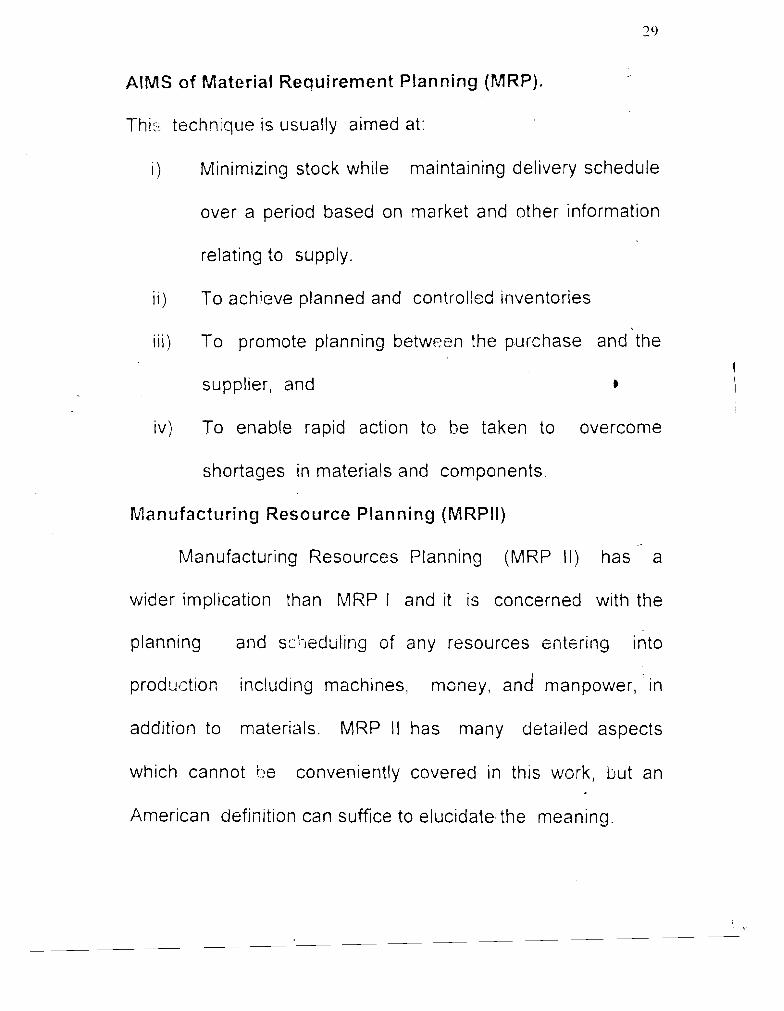
AIMS of FJlatcrial Requirement Planning (MRP).
Thi3 techrlique is usually aimed at:
1 )
ii)
iii)
iv)
Minimizing stock while maintaining delivery schedu
over a period based on market and other information
relating to supply.
To achieve planned and controlled inventories
To promote planning between the purchase and 'the
supplier, and B
To enab!e rapid action to be taken to overcome
shortages in materials and components.
hlanufacturing R e s o u r c e Planning (MRPII)
Manufacturing Resources Plannmg (MRP II) has a
wider impl~cation than MRP I and ~t 1s concerned w ~ t h the
plannmg and scl-~ed;rl~rig of any resources en t~r ing into
prodwtror, includmg machmes, money, and manpower, In
addrtron to materials MRP II has many cleta~led aspects
wh~ch cannot he conveniently covered In this work, but an
Amer~can defrn~t~on can suff~ce to elucidate the meanmg

Manufacturing Resource Planning (MRP 11) was defined
by the ,',merican Product~on inventory control society as:
A systern built around materials requirements planning,
and also including the additional planning function of production
scheduling and capacity requirements planning. Further, once
planning phase is cornplete and the plans have been accepted
as attainable, the execution functions come into play. These
include the shop floor control functions of input - output b
m~asuremeists, detailed scheduling and dispatching, plus
ant~c~pated delay reports from both the shop and the vendors,
pwchasing , follow up and control, e.t c Te term "closed loop"
~rnplies that, not only is each of these elements rncluded in
the overall system, but also there IS feedback from the
execution functions so that planning can be kept valid at all
times.

2.6 REASONS FOR INVENTORY CONTROL IN AN
ORL~.\NISATION
Firm may have various reasons for carrying the
inventory, Levels in his own views slates that the principal
reasons for carrying inventory are: , .
(a) To meet up anticipated demand. In other words to
avoid out of stock syndromes, Inventory control helps
to ensure that customer's demand will more ,often
than ilot be met. This will enable the organization to
satisfy customers demand ~ i ? d it will continue to
enable the organisation have stock of customers
demand.
(b) Price of stocks fluctuates as a result are in high I
demand at a particular period and gets - less demand I -
at other time. Raw materials inventory may be in
high supply at a particular season and scarcely
available at other period. Adequate inventory control

help firms take advantage of seasonal an3 other price
fluctuations.
(c) The advantages derived from discount allowances in
busmess undzrtaking cannot be over emphasized.
F~rms may decide to purchase more supplics than
immediate quantity requirement. This w~ l l earn the filrm
quantity discount a d v a n t a ~ , ~ On me othcr hand, they
will only incur the slightly higher holding and storpge
costs. If those increases in costs are more than offset
by the reduction in the firms unit cost as a result of
large quantity purchases, the firm stands the
chance of having economic gain. I I I
(d) Adequate ~nventory management , acts as an
insurance against longer - than - average supplier
delivery times. Customers demanding their usual
quota of goods are likely to be impressed if they c&n
obtain the same cgcjods elszwhere.

(e) Lack of parts and non - ava~lability of raw materials
bring disappoir-dment In meeting up with customers
order which affects the company's reputat~on and
performance Good inventory control help to mmimize
delay in product~on caused by lack of spare parts and
non-availab~lity of raw matsriais W ~ t h products
comprising many components and sub - assembl~es,
it is administratively nearly impossible to ensure that
one of each of all these parts arrive simultaneously at
a final assembly point. In this situation, stocks of
1 components and sub-assemblies at assembly points
1 act as a buffer within the production system to
1 absorb the demand that the system exerts on itself.
1 Other reasons for inventory control as suggested by
1 Morgan include:- , (i) To forecast against price fluctuation and cost
changes.
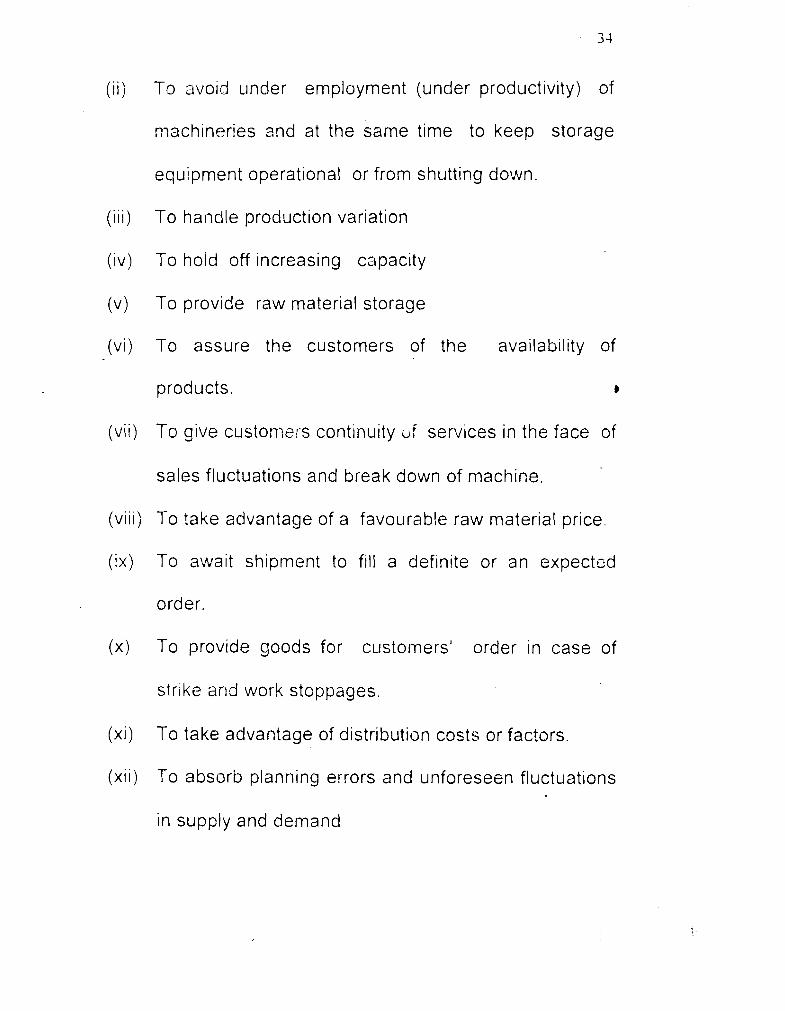
( i i ) To avoid under employment (under productivity
machineries and at the same time to keep sto
equipment operational or from shutting down.
( i i i ) To handle production variation
(iv) To hold off increasing capacity
(v) To provide raw material storage
(vi) To assure the customers of the availability of
products. b
(vii) To give customess continuity bf services in the face of
sales fluctuations and break down of machine.
(viii) To take advantage of a favourable raw material price.
(ix) To await shipnient to fill a definite or an expected
order.
(x) To provide goods for customers' order in case of
strike and work stoppages.
(xi) To take advantage of distribution costs or factors.
(xii) To absorb planning errors and unforeseen fluctuations
in supply and demand

(xiii) To facilitate smooth production and marketing
~ p e r a t m .
2.7.1 ECONOMIC ORDER QUANTITY
The carrying of materials in inventory is expensive.
Several studies conducted a number of years age, ,ndicate that
the annual cost of carrying a production inventory average
approximately 35% of value of the inventory.
Wetch (1990:36) notes that five major elements
inventory carrying ... . Costs.. in the following manner
Interest charges on the investment
Insurance costs
Property? Taxes
S i ~ r a g e costs
0; . 4escence and deteriorat~on.
Interest charges on the investment:
comprise
This has to do with the tying down of capital of the company.
When a firm purchases about N150,OOO worth of a production
material and keep its inventory, it simply has this much less

cash to spend for other purposes since money invested i~n
production equipment or in external securities earns a return
for the company. Conceptually, it is logical for the company to
charge all money invested in inventory a rate of interest equal
to that it could earn if invested in something else. That is the
opportunity cost associated with inventory investment.
l n s ~ ~ r a n c e Cost:
Most firlns insure their assets against possible logs
from fire or other firm's damage. Extra deposits worth of
inventory represents an additional assets on which insurance
premiums must be paid property taxes.
Property taxes are levied on the assets values of a firms
assets, the greater the inventory value, the greater the
assets value, and consequently the higher is the firm's tax, bill.
Storage Qist:
The Warehouse in which a firm stores its inventory is
associated by a certain amount of money per year over the

length of its life. The cost of the warehouse is conceptually
charged against inventory occupying the space
obsolescence a n d deterioration:
In most firms a reasonable percentage of a given
inventory stock spo~ls, damage, p~lfered and eventually
become obsolete. Its new product is been introduced
" ,
everyday, a cbrtain percentage of inventory gets obsolete.
Carrying costs rises and falls nearly proportionately w i h
the rise and fall of the inventory level. Furthermore, the
inventory level is directly related to the quantity in which
materials is ordmL;red The larger the order quantity. the higher
is the average inventu-y lwe i during the period covered by the
orders. Costs carrying inventory vary nearly directly with the
size of the order quantity, this is described in

Figure 2.1 :
When considering this group of acql~isition costs, we observe
they behave quite differrntly from carrying costs.
Acquisition cost unlike inventory size are function of the
number of order placed during a given period of time.
EOQ occurs wher: ^C= = AC
IQC = Q
Solving for Q = IQ = IQ' C = ZUA Q" = ZUA ----
IC

ReqLrisition Costs:
These are the actual prlces p a ~ d to suppher usually, total
acqursrt~on cost are not major concern in planning mventory
pol~cy Except where a quality discount IS ava~lable, these
costs do not change with the pattern rn which mventory items
are purchased.
The availability of the fund to be used In acqulrlng
. affects the quantity to be purchased and so influences tlfe
inventory levels.
Carrying Costs:
There are costs incurred because the raw materials are
in company's custody These could be grouped under the
following: 1 ~ 1
Insurance, personal property, taxes, cost of storage space,
breakage, obsolescence and the rate of return on the
investment in inventory des~red by the company. Furthermore,
the cost can be grouped into physical presence of goods and
the coct of capital tied up.

40
Shortage Costs:
These are penalties wh~ch the busmess pay when the
demand exceeds the supply. In other word they don't have
stock to meet the demand of customers.
A shortage of required products niay result In losing
customers apart f rn , rn the losses of the immediate sales.
These costs are the most diff~cult to assess and incorporate in
. mathetnatical inventory models, since they depend upon such
imponderable as loss of customers goodw~ll, reduct~on in future
orders, change In market share and so on.
To prevent cost caused by stock-out, a level of inventory
must be maintained.
Total carrying costs and total ordering , cost vary
inversely The greater the quantity of inventory in hand, the
greater the total carrying costs and the lower the total
orderirig cost.

4 I
Ivventory Costs:
Inventory costs are those variables used in determining
the economic order quantity (EOC!) which is used to
determine the optimum size of mate
rials to order. In most cases, the total costs of an inventory
is the sum of total ordering cost, total carrying costs and
total acqulsltion cost- Shortage cost is a type of inventpry
costs too. b
2.7.2: DERIVATION OF ECONOMIC ORDER QUANTlTY
The deviation of the basic Economic Order Quantity
(EOQ) model is quite easy in a situation where both the
amount of product needed during a grven period and the lead-
time for stock replenishment are known. If the time that
elapse between the placement of an order and its receipt.,,in
inventory is 10 days and daily usage rate is 20 units, the
order point according to Flippo and M~s inger , (1978:489)
should be set at any inventory level of 200 units.

In ordki words, when the stock is reduced to 200 units,
an order should be ,,laced. The unit on hand will meet daily
demand until the order is received. When lead time is nut
known with certainty, it can be treated as random variable and
an appropriate decision rule can be developed to spec~fy the
re-order level of stock.
Economic order Quantity
Source: Management by Flippo and rbl~smger(l978:489)

Let;
D - - Total annual demand
Economic order
Number or orders placed and ieceived during
the year
Average inventory
Cost of placing an order
Carrying cost per Unit of inventory durinpthe
year.
Total inventory cost IS defified as the sum of ordering cost and
carrying cost. To define total inventory cost in terms of the
controllable variables, order quantity (Q), we must express
both types of cost in terms of quantity. Total ordering cost can
be obtein?d by multiplyirlg the number cf orders DIQ by the
cost of placing an order (CO), hence:
Annual ordering Cost = DIQ CO
We can also find annual carrying cost by multiplying the
carrying cost per unit of inventory (CC) by the average number

of units in stock ((212). This exprexion for average rnventory
assumes a constant rate of demand throughout the year.
Annual carrying CoSi = Q/2 CC.
We shall remember that this variable can be manipulated by
management to yield the minimum cost for mventory during a
specific time per~od.
From the figure drawn above, we observed that optimum
solution IS that quantity (Q) that can therefore be obtained by
setting the equat~on for ordering cost equal to the equation
for carrying cost and solving for Q . i.e
Annual carrying cost = Annual ordering c o w
CC Q/2 = DCOIQ
CC ~ ~ 1 2 = DCC)
Q' = 2DCOICC
Q = - +\I2DCO/Cd 1
The optrmum solution is also obtained by differentiating the
total cost function to obtain an ecpatiori tnat expresses the rate
of change in total cost with respect to change in quantity when

the first derivative of the total cost function is set equal to zero, the
ecol?omic order quantity is obtained by solving for Q.
This is the following step order.
Step I: Take the first derivatives of total cost function.
Cost function.
TC = D/QCO + Q/2CC
d ( T C ) dQ = - DCO lQ2 + CCl2
Step 1 1 : b
Set the first derivative equal to zero and solve [or Q.
Q = poco 4 CC
Step Ill:
Test to determine the so l~~t ion in a minimum
dz (TC) dQz 2DC0 JQ30
Given the assumption of a fixed demand, the general
formula can be utilized in finding the economic order quantity
(Q). which iq equal to the square root of 2 times demand (D)
times ordering cost (CO) divided by carrying cost (CC).

For exa dple, assume the following problem:
D = 3000 units per annum
CC = N 2 per Unit per year.
To determine the economic order quantity, evaluzte the
basic equation using the values for the demand, ordering
cost and carryins cost.
QO = \ / 2 ~ 3 0 0 0 ~ 3 0 2 = \/90000
Q = 300 Units.
To obtain the order quantity is 300 units; observe that a
total of ten orders will be placed
For a total cost due to ordering of 300, average
inventory will be 150 units.

average inventory carrying cost will equal N300.
Therefore, total inventory cost will be equal to N600.00.
2.8: GAINIIMPORTANCE OF INVENTORY CONTROL
QUANTITY DISCOUNT: ,
0 : ~ e of the restrictions on the use of the general
economic lot size formula is that, in the case of a purchased
item, the unit purchased price is constant or that, in the case of
a manufactured item, the direct unrt manufacturing cost8 is
constant. When this condition is not satisfied, it becomes
necessary to modify the way in which the formulas are used
to obtain the economic order quantity.
In summary, when quantity discounts are available, the
analysis begin with a determination of the econon-tri lot size
for cash price level. For a given price level, this lot size is
ascertained by first substituting the corresponding carrying
cost in the economic lot size
It IS unan~mously agreed that lnvl n:or~es play a v~tal role
In the life of any organ~zat~on Inventory roles In an

-4 ti
organisation has made it to be considered as the blood bank of
the firms stock. Howard and Baltz (1989:15) supported this fact
when they asserted that inventory is the life blood of
prodc~ction and sales activities; if it were improperly managed,
production process would collapse.
Inventory also influences the working capital needs of
the firm from :he financial stand point. Fund tied up in
inventory are one step further removed from cash in the
working capital cycle. Since inventory is further removed
from cash than receivables are, it needs financial attention if b
the firm's liquidity is to be maintained.
According io Haddley and Whittin, (1963:8) the
fundamental reason for maintaining inventory is that it is
either physically impossible or economically unsound to have
goods arrive in a given system precisely when demnds for
them occur. To Samuel and Wilkes, (1978) there are two
main functions of stock, firstly, to enable production (or
ordering as the case may be) to take place in economic
quantities, and secondly to enable
4 9
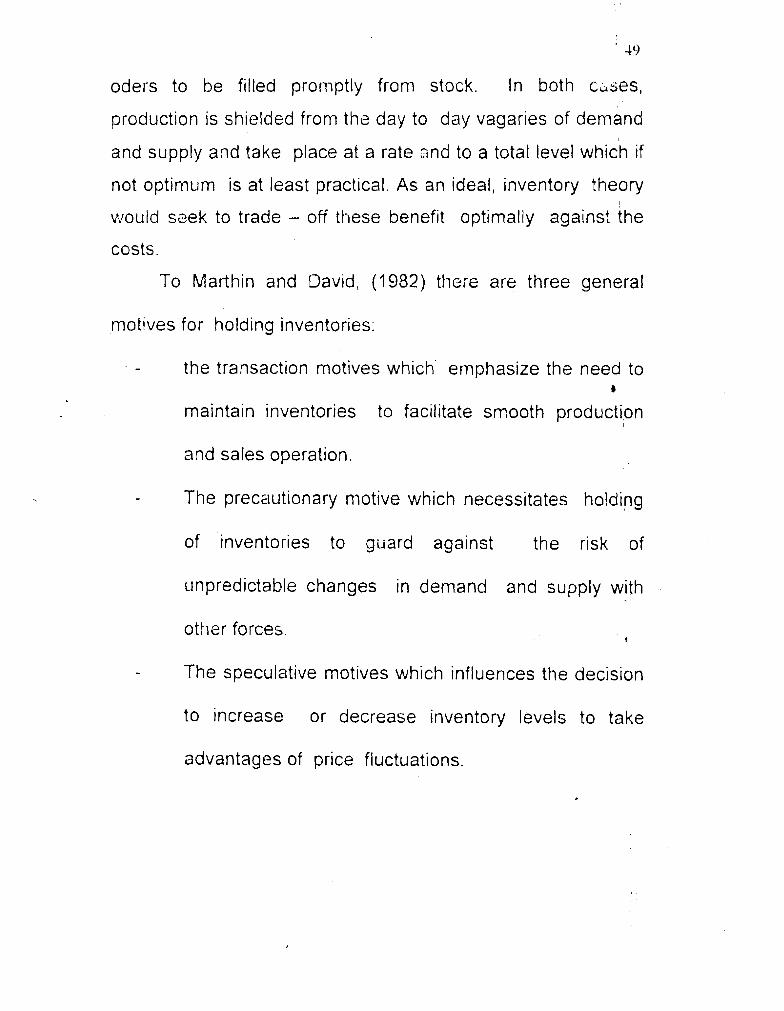
oders to be filled promptly from stock. In both C ~ S ~ S ,
production is shielded from the day to day vagaries of demend
and supply and take place at a rate and to a total level which if
not optimum is at least practical. As an ideal, inventory theory
v~ould seek to trade - off these benefit optimally against the
costs.
To Marthin and David, (1982) there are three general
motives for holding inventories:
- the transaction motives which' emphasize the need to 0
maintain inventories to facilitate smooth production
and sales operation.
- The precautionary motive which necessitates holdipg
of 'inventories to gilard against the risk of
unpredictable changes in demand and supply with . I
other forces. 1
- The speculative motives which influences the decision
to increase or decrease inventory levels to take
advantages of price fluctuations.

5 0
Amey and Eggiton (1973) shared the view with Martin
and David when they agreed that firms hold inventories for
transactory, precautionary and speculatory and speculative
motives. They went to assert that management should be
aware that optimum stock level do depend to a certain extent
on expected price movement.
To R~chard et al, (1988) inventories add an operating
flexi biliiy thar wouici not otherw~se exist. b
In manufacturing, work -in-process inventories are an
absolute necessity unless each individual part is to be carried
from machine to machine and those machines set up to
produce that single part. They enumerated the importance of
inventor~es as:-
(a) Filling the gap between supply and demand
(b) Making possible lower production costs
(c) Allo(...linq organisation to cope with perishable
materials.
(d) Storing labor.
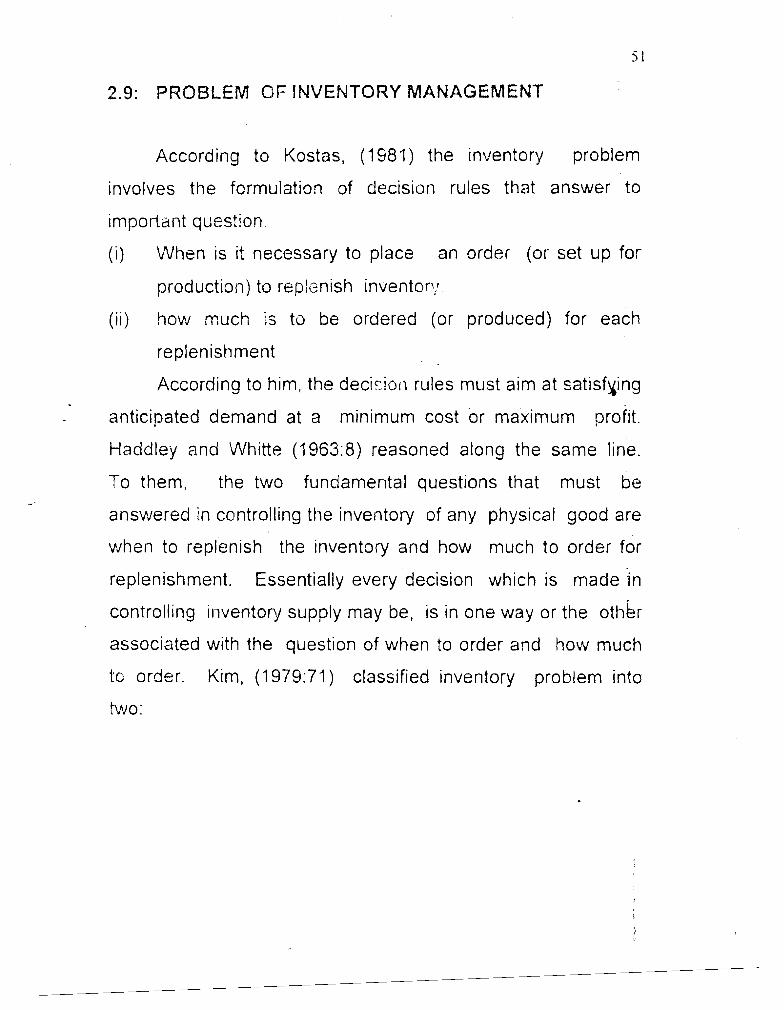
2.9: PROBLEM OF INVENTORY MANAGEMENT
According to Kostas, (1 981) the inventory problem
involves the formulation of decision rules that answer to
important question
(i) When is it necessary to place an order (or set up for
production) to repknish inventory
(ii) how much is to be ordered (or produced) for each
replenishment
According to him. the decic:iori rules must aim at satisfying
anticipated demand at a minimum cost or maximum profit.
Haddley and Whitte (1963:B) reasoned along the same line.
To them, the two fundamental questions that must be
answered in controlling the inventory of any physical good are
when to replenish the inventory and how much to order for
replenishment. Essentially every decision which is made in
controlling inventory supply may be, is in one way or the other
associated with the question of when to order and how much
to order. Kim, (1 979:i'I) classified inventory problem into
two:

Deterministic and probabilistic. Suppose that the demand for
an itcni during a specified period is known in advance and the
lead time is either zero or a known constant, then we have
what is called a determin~stic ~nventory management problem.
It is true that those assumed condit~ons do not qu~te obtain in
most actual inventory managemmt problem for which these
assumptionq are quite adequate. For example, when the item
in question in used as raw materials for a stable product~on b
proccss, furthermore, it has been found in practice that
deterministic inventory models are quite helpful in controlling
the stock of many regularly used low va!ue items
In many s i tuatws, our assumptions of known quantity,
and zero or constant lead time do not hold. Often the demand
and lead time are variable quantities, so that we know at best
only their probabil~ty distribution. If we assume that both
demand and lead time are random variables, the analysis of
inventory management problem will become very complex. It
has been found however, that reasonably good situation can

be obtained for many practical inventory management
problems by assuming that the lead time is a known constant.
2.10 FUNCTIONS OF INVENTORY
Inventories at all time require high cost and investment
commitments. Some organizations see inventory cost as an
unnecessary evil but they have not been able to analyse
cr~ticaliy the iota\ situation cjf the costs. Before critics ,can
argue unfavocrrably upon the size and costs of inventory, such
opinion must weigh the gain and contribution inventories
generate to the capital structure of the organisation holding
that inventory.
As a matter of fact, inventories make poss~ble smooth
and effic~ent operation of a manufacturing organisation by
decoupling individual segments of the total operation.
Inventories on the 'purchased parts perm~t activities of
purchasing department personnel to plan and conduct
independently of shop production operations. In doing this,

they allow flexibility for supplier in planning, producing, and
I , : :livering an order for a given part.
In some organizations, inventories of parts and components
are produced "In - House" dxoup le the many individual
machines and production processes from various sub-assembly
and assembly activit~es. This enables management to plan
production.
b
2.1 I: MERITS OF IiWENTORY MANAGEMENT
Inventories are accepted to be carried because
producing and w ing activities of inventories typically take
place at different times, in different rates. Moreso, in
manufacturing outfits, a lot of savings are generated from
holding inventories. Such savings cover the storage costs
over the period required for sales or shipment to take place.
Obviously, it was generally believed that two danger
points exist in inventory investment, carrying too little inventory
and carrying too much inventory. But the major goal of

inventory control is to discover and maintain the optimum level
of inventory investment and this optimal level lies between
these two danger points. P.lso, experiences of the business
managers have shown that kep ing inventories acts as an
insurance against higher than average demand and as well as
against longer than average supply delivery times.
tiowever, these forgone views were shared by Ammer
(1980:275) in his study that inventories are kept in or,der to
achieve advantages of quant~ty discount, seasonal price
fluctuation as well as minimize delay in production caused by
i :k of parts and other inp~l t materrals; He used weighted
average in analysis of the importance of inventory contrd, but
c o ~ ~ l d not properly determine the effect of time factor on the
seasonal and cyclical inventories.
Similarly, Kotier (lWO:l57) in his study opined that the
primary aim of carrying and holding inventories is because of
the fact that it is physically impossible and economically

impracticable for each stock item to arrive where it is needed at
exactly when it is wanted
In the same
inventories are kept
way, many people believe also that
n production w i t to have price advantages.
This is because bulk purchases usually attract quantity discount
thus providing cost advantage of inventories. In line with this,
Cushing (1978: 57) noted that the risk of production shut down
should be over come by holding inventories. He further added b
that inventories are kept for speculative forward buying
purposes. Iri the same manner, savage and small product by
reducing customer's delivery analysis but could not establish
the effects of inventory investment on the performances of the
sample companies. '
Lewi's (1990: 65) in his contribution noted that greater
flexibility to the prcduction department in planning production
runs as an advantage of holdlng inventories. According to him,
production shut downs result to increased costs and delays in
delivery time which leads to loss of customers. He applied

weighted average too in his statistical analysis, but lacked
homogeneit!f in the choice of his studied industries.
lmaga (1995377) noted two major reasons for keeping
inventories namely:- to keep the production operation
flowing smoothly and for prompt customer's services. He used
simple ratio and percentages in his statistical analysis.
Finally, it could be inferred from varlous contr~buttons so
- far that there exists uncertainty in the procurement of industrial
raw materials and this may be delayed because of such
factors as strike, transport disruption, short supply and hence
firms should maintain sufficient stock of raw materials at any
given time to streamline the production.
2.12: DEMERITS OF INVENTORY MANAGEMENT.
Studies had shown that firms need enough inventories
I
especially in the production and maintenance units to avoid
shut down of plants, loss of organisational profits, loss 'of
customers. But there are some perceived pitfalls arising from
keeping excessive inventory. For example, statistics has shown

that the laiyer the inventory carrying costs - interest charged on
capital, insurance, taxes, storage costs, obsolescence,
deterioration, depreciation, record keeping cost, holding and
handling costs, inspection costs ,ar,d distribution costs increases.
In the light of the above, Morgan (1983:57) stressed that
th, higher the value and levels of the iwentories, the greater
the property tax levied on the firm's asskls, and that the dangers
in carrying large inl-entory is that inventories are subject to b
pilferage losses, obsolescence and deterioration. He adopted 2
simple regressional analysis in determination of the relationship
between the inventory related costs and organisational
performance. ? .
AIL, another demerits of holding large stock as expressed
by Kotler (1980:83) co~ l ld be clearly viewed from a cost point of
view with emphasis on customer's servlce. He demonstrated in
fig 3 !. Aow that inventory costs increase at an increasrng rate as
the customers services level approaches 100%.

5 9
Fig. 3: Relationship Between Inventory Costs and Level of
Customers services.
9001
Service Level (percentage of orders that can be filled from
stock)
From the qraph of fig.3 :hove, Kotler (1980:87)
Illustrated that 85% of the total received orders from the existing
stock of the company's inventory is valued at N400,OOO. He
observed that where the firm raises the customer's services

, '
standard by 5 percent to 90 percent, the total value of
inventory investment will be increased by N100,OOO and also
if the standard of service is raised to 95 percent, investment
must be increased by N200,OOO. He conclusively believed
that increase in service indicates increase in inventory costs.
However, it is generally viewed that his argument is faulty. It
tends to ignore the capital basis of the sampled and studied
companies. @
2.13: INVENTORY MANAGEMENT AND CONTROL BY
NlGERlA BREWERIES (NB) PLC.
The following are the type of inventory management in
NB PLC.
(a) Raw material inventories:- They are those units of
input which have been purchased and stored for f
future production. 'They may be purely extracted
materials, half - produced products, or completely
produced ones which the firm does not produce itself.

6 1
Their purpose is to disintegrate the production
function from the pw-chasing function so as to make
the two functions independent of each other.
(b) Work - in --process inventory:- This m-isists of partially
finished goods requiring additional work before they
become complete finished goods.
(c) MRO - inventory maintenance, Repair and operating
supplies:- These are consumed in the proddct
process but which do not become part of the product
e.g lubrication oil, soap, machine repair parts.
(d) Finished Goods inventory:- This is completed products
ready for shipment as request by customers. ( source:
interview with the pr~duction manager)
234: INVENTORY MANAGEMENT AND CONTROL BY
NlGERlA BOTllNG COMPANY (NBC) PLC
In NBC, their sources of raw materials 1s 80% imported.
Thk raw materials order are made from the head office. The

one month. The raw materials storage method is FIFO method
(ie first in -first out).
There are problems encountered in the management of
the raw materials inventory in the NBC. And the nature of this
problem is hazardous and corrosive, as claimed by the
respci idents from the store, distribution and personnel
departments respectively. (Source: Interview with the Personnel
Officer)
2.15: SUMMARY OF LITERATURE REVIEW
b In this chapter (literature review), the background to the
study was carried out, then followed by the conceptual
overview of inventory management. The next that was
x- rayed was the types of inventories managed in an
organization, under this, the following were discussed:- Raw
materials inventories; work - in - process inventory; MRO -
inventory Maintenance, repair and operating supplies, finished
goods inventory.
The next that was discussed was the factors that
influence inventory level. Followed by the inventory control

system1 techniques which includes: stock replenishment (SR)
and Material requirement planning (MRP). Also, not left olut of
disci~ssion was the reasons for inventory control in an
organisation. This was followed by the economic order quantity
and derivation of ecvnomic order Qmrrt~iy, cost formula.
The gainslimportance of inventory control, which include
quantity discount e.t.c problem of inventory managemmt;
functions of inventory; Merits of inventory managemenh and
Demerits of inventory management were all discussed.
Finally in this chapter, was the brref x-ray of the inventory
management and control of both organizations (NBL and
NBC).

REFERENCES
Amey, L R 8. Egginton D N; Manqement Accountinq: a Conceptual Approach. Longman, 1373.
Arrow K J T Harries; "Optimum Inventory Policy", Econorne!rica, XIX '951 . --.-- ...- . -
Buyers, CI & Holmes GA; "Material Control" Principle of Cost Cost Accounting; cassed London; 4'" ed. 1984.
Dvorekzy, AJ Kiefer, and Wolfowitz; "This lnventory problem 1: Case of I .J~kncwn distribution"
b Econometrix XXI (1 95'3).
Edwin, B Flippo & Garry, M blusiilger: "Allocation and Control of resources", Manaqement, Allyn and Bacon, Inc., 1978 .
Hardley,G & T.M. Whitin: "The Nature of Inventory System," Analysis of lnventorv System. Prentice Hall, Eaglewood Cliff N J 1963.
Operation and Ccsts act$^ hilanaqernent Series) Chicago: A WShawCo 1915. 1 1

KIM "Economic order quantity" Quantitative Analysis for Managerial Decision, Addison - Wesely Publisl-mg Co. 1976 .
Kola Folayan, & Modupe Adegun: "The story of Excelling "
History of lever Brothers from - 1983.
Kostas, N. Dervitsiotis: " Inventcry System and Models" Operation Manaqement, McGraw- Hill book 1981.
Lewis, C D
Melnitsky Benjamine;
Scientific Inventory Control, ,Hiffe, London, (Forthcoming).
Manaqement of Industrial Inverltorv. Philadelphia, Chilfon Company, First ed. 195 1.
Pandey I M "Management of inventory". Financial management Vikas publishing House PVT Ltd "79.
Samuel JM&FM Wilkes; "Management of Inventory" Management of Company Finance. - Welson, 2fld ed~tion 1978.
Synder, Arthur: "Principle of Inventory Management". Financial Execitive X X U (April 1964).

Starr, Martin, K & David W Miller; Inventory Control: Theory and Practice. Englewood Cliff, N.J. Prentlce - tlall 1962 p. 17.
Van Hees, RN and N Monhemius; Introduction to Production and Inventory Control: ~heo ' r y and Practice. Macm~llan. 1972. ---.
Whitii-I, T M; The Theory of inventory Ivlanaqernent. Princeton, N J Princeton University Press

CHAPTER THREE
3.0: RESEARCH DESIGN AND METHODOLOGY
Th,is chapter presents the researcher's methodology and
processes involved in carrying out the research project. The
chapter is divided into subsections as presented below:
3.1 RESEARCH METHOD
The type of method to be used in any research
undertaking is determined substantially by the nature of the
research problem and purpose of the study, the use of
descriptive or normative method of research is regarded by the
researcher as logically sound and adequate for getting solution
to the problem posed by the study. i
3.2: METHOD AND SOURCE OF DATA COLLECTt3N
The researcher employed :he use of multiple data
gathering technique in order to adequately cover research
questions and hypotheses and to achieve precise and reliable
result

The exploratory survey method which embraces
quest~onnaire and interview was used as primary data gathering
~ns i run \~ ;-d. Since according to Busha (1986) researchers
consider it to be the most suitable technique for discerning
"the kind of information needed by users as well as i,re source
on which most researchers commonly rely". The researcher
used questionnaires and personal interview for the purpose of
primary data collection.
3.2.1 : QUESTlONNAlRE
The researcher made use of questionnaire to elicit
information from field research.
The questionnaires were admmistered on two categories
of respondents which include:
1. For respondents (i.e the management and staff of
Nigeria Breweries PLC;
2. For responuents (i.e the staff and Management of
Nigeria Bottling Company PLC.)

3.2.2: INTERVIEW METHOD
This .,thod was r~sed to extract responses to questions
that were not included in the questionnaire, but which are vital
to the research. Personal structured and unstructured
interv~ews were conducted wtth the consultants in the area of
management sciences and Business Administration.
3.2.3: L1B2ARIES
Materials from libraries and other research unlts whch
~ncli lde books, journals, weeklies, notes, unpubl~shed projects
leaflets, Pamphlets and dailies were used as the secondary
source of data collection. This was employed essentially to
prov~de a theoretical f ramt3~~~~ t -k for the study. Both private
and public libraries were consulted.
These in addit~on to personal interview compensated for
inherent weakness of the primary data gathering methods,
thereby, enhances research rel~ability.

3.3: THE POPULATION OF THE STUDY
The population for this study was mostly drawn from the t
management and staff of the Nigeria Breweries PI C and
Nigeria Bottling Company PLC, Enugu.
3.4: PROCEDURE FOR THE DATA GATHERING
Research questionnaires were given to the people
scientifically selected for this study. They were requested to
either circle or tick the option that best suited their choick and
also fill the blank spaces, with whatever they felt were the
answers.
In order to avoid delay and at the same time ensure high
percentage return of questionnaires, they were distributed by
hand and collected after they have been duly completed ,py I I h I ; I
the respondents.
3.5: VALIDITY AND RELIABILITY OF DATA INSTRUMENT
Validity as used here is the degree or extent to which an
instrument actually measures what it is intended to measure.
Therefore, an instrument is valid to the extent it is tailored to

achieve research objectives. Thus, the instrument used for
t h ~ s research was validated by ensuring that the questions
were structured in a manner that will enable the research
obtain information relevant to the purpose and objective of the
study. , .
In order to maximize reliability of the instrument used for
the research, the investigator ensured that questions were not I
ambiguously presented to respondents in a manner likely,to
cornniunicate different meaning that could generate inaccurate
and incorxistent responses.
The researcher also maintained objectivity by not fielding
leading questions A pilot survey using ti instrument was
earher carried out to ensure validity and reliability.
For pie-testing, ten (10) members each of the
mmagement and staff of Nigeria Breweries PLC and Nigeria
Bottling Company PLC, Enugu, were selected and had the
questionnaires administered on them. The respondents
answered the questions with ease. Though, in the process,

some errors were identified and suggestions were made.
These were corrected and adjustment effected.
This pre-testing method is for the following:
(a) To identify at the initial stage, any problem that might
be encountered in the course of the research.
(b) To let the responknts make their observations and
criticisms, and
(c) Ensure that further mistakes are eliminated. b
3.6 DETERMINATION OF SAMPLE SIZE
To determine the sample size, the researcher conducted
a pilot survey In wh~cl i 20 of the research questiorinair-e was
administered randomly on the management and staff of both
Nigeria Breweries PLC and N~geria Bottlmg Company PLC,
3u t ~f the number, 17 were correctly filled and returned.
It was therefore, taken as positive response. The remaining
3, represented the ones that were rejected. These were

regarded as ~egative responses. The percentage of response
therefore, is 05 and 15 respectively.
To calculate the optimum sample size, the researcher
applied the Fruend and W~lliams Model of sample size
determination, calculated at 95% confidence level and 5%
standard error, the : . ! w l a is:
N
Where:
N
P
Q
E
7 L
= Sample size
= Percentage of positive response
= Percentage of Negative response
= Percentage of error - - Normal variate for the desired level of
confidence.
Substituting and solving for "N"

With this outcome, the researcher decided, to
approximate the sample to 200 for easy administration. I
3.7 METHOD OF DATA ANALYSIS
Data collected wdl be coded, grouped into frequencies,
computed and arranged into tables for easy references and
analysis. Presentation methods to be used include simple
perceiitages, tables, pie- charts and bar charts and histogram.
b
3.5 TEST OF HYPOTHESES
The main method of analyzing data collected in this study
were the simpie percentage for testing the research questions
and chi - square for testing the hypotheses.
The tormu!a for percentage is given as
Where a = numerator (number of respondents to an item)
b = denominator (total respondents in sample)
100 = Percentage.

The acceptable criterion is 50%. Where the percentage
response is 50% and above, then the statement holds true or
otherv~isie. Where it is less than 50%, it holds as untrue or
otherwise.
The formula for chi - Square is:
WI-ere n,, = Observed frequencies
e,, = Expected frequencies b
The degree of freedom is determined with the following
formula:
df = ( r - l ) ( c - I )
Where r = the number of rows
C = the number of columns
df = ( 3 - 1 ) ( 2 - I ) - - 2 x 1 = 2
:. X' (2) 0.05 = 5.991
OR
df = (2-1) - -.- 1 x 1 = I
:. X' (1) 0.05 = 3.841

YEFERENCES I
Busha, E.F. (1986): "Method and source of data collection"
In Uzoh, S tan lq i.i.; An Unpublished
project report for the award of a
postgraduate Diploma (PGD) in
Business Administration I Marketing
(Public Relations) University of Nigeria,
Enugu Campus, Enugu, February, 2000.
Egbui Ikeagwu K. (1998): Groundwork of Research
Methodology and Procedures. Institute
for Development Studies, University of
Nigeria, Enugu Campus, Enugu. I
Fruend, E.F. and William, J.F.: "Model of sample
determmation": In Uzoh, Stanley I ! An
appra~sal of Public Relations inputs
(instrunients/strateg~es) In the awareness
creation of HIVIAIDS Pandemic in
Nigeria. September , 2001.

CHAPTER FOUR
4.0: ANALYSIS AND INTERPRETATION OF DATA
To arlsiyse tire data collected, this chapter is divided
into two sections viz, questionnaire administration and test of
hypotheses. These sections are hereby presented in a
chronological sequence in line with the research objective,
questions and hypotheses. The study seeks to determine the b
"impact of inventory management and control system on the
organisational performance" (a study of Nigeria dreweries
PLC and Nigeria Bottling Company PLC)
4.1: QUESTIONNAIRE ADMINISTRATION-SEX AND AGE
DISTRIBUTION OF RESPONDENTS. 1 I 1 .
It was viewed that, the age difference of the respondents
will be considered in the distribution of the questionnaires.
This was based on the assumption that there is relationship
hetweeri age and interest in the level of appreciation. The

table below sunmaries the distribution of respondents byiage
and sex,
Z .1 SEX AND AGE DISTRIBUTION OF RESPONDENTS .............. ., ........ .. ....... .-.. .......... .............-. ., .
A G E R A N G E IN j FEMALE 1 MALE TOTAL Y E A R S I I -. ............. .. - ..
.- - - .
18 - 30 yrs. . . . . . . ............. - -- -
31 - 40 yrs I I - -- .) ---- ... ... ...... .
4 1 - 50 yrs .. ... .-- -
51 - 64 yrs -~
65 yrs and above / ........... ..... ............. .......
TOTAL 100 160 I
. . ................ ,-_ . i ........
In table 4.1, a summary of the distribution c:f
questionnaire by age consideration was tabulated. The tabk
indicated that 40 questionnaires were distributed to females.
WhtlelGO were administered on men. Further, the analysis of
sex and age distribution revealed that 40 out of the 200,
representing 20?/0 were female, while the remaining 160 (80%)
represented the male.
/3n the whole, the administration of the questionnaires
were used on the two categories of respondents.

( i ) the strtff of both warehouse/ store, production and
distribL.&iici? departments respectively in Nigeria Bottling
company PLC, and
(ii) the staff of both warehouse /store, production,
planning and distribution departments in the ~ i g e r i a
Breweries PLC. The total number of respondents and
questionnaire administered were presented. In table
4.2 below: b
Table 4.2: TOTAL NUMBER OF RESPONDENTS
/ Administered Copies Retrieved / - - --- - -- - - - . . - - --
I - - - i40
-- - -- - -- - -
Staff of NBL 100 - r 50
L. -___I 'I-I --..- --
Table 4.2, shows the total number of respondents of this
research study. Out of a total of 200 subjects, 100 were for
staff of NBL, while the remaining 100 were for stsff of NBC
PLC. furthermore, o:it of the two segment of respondents;
200 were retrieved and found usable. This means that 100°/~
of the questionnaires distributed were usable.
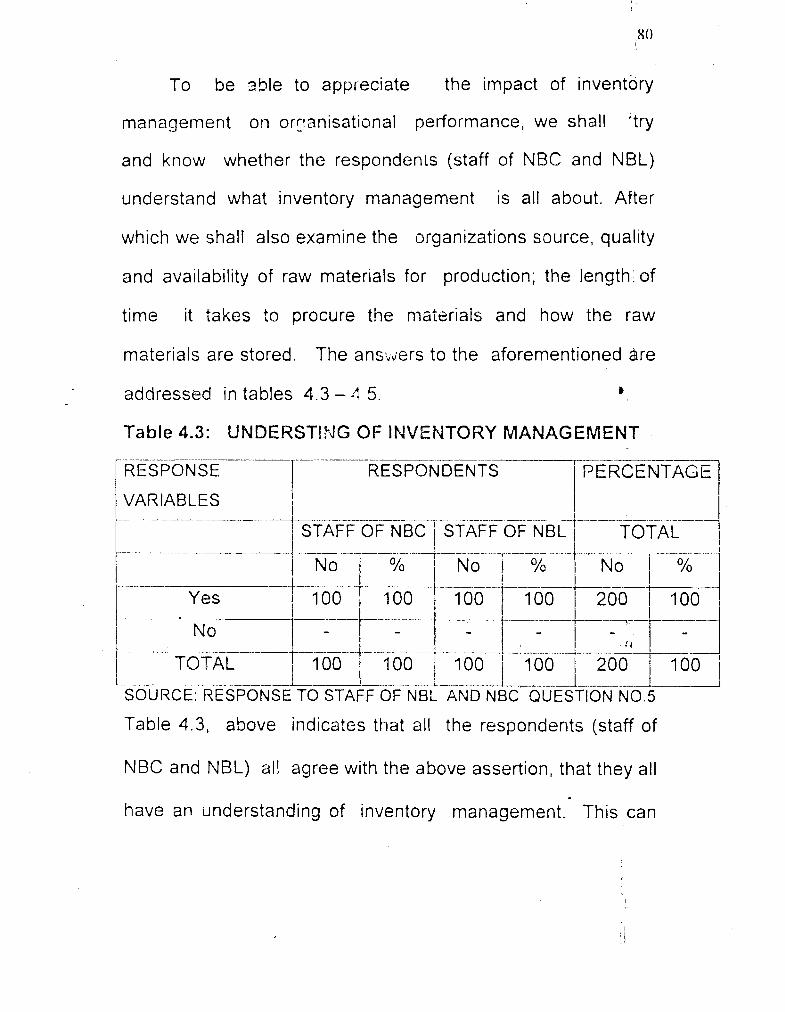
To be 2ble to appleciate the impact of inventory
management on or~!anisational performance, we shall 'try
and know whether the respondents (staff of NBC and NBL)
understand what inventory management is all about. After
which we shall also examine the organizations source, quality
and availability of raw materials for production; the length of
time it takes to procure the materials and how the raw
materials are stored. The a n s x r s to the aforementioned are
addressed in tables 4.3 - 4 5. b
Table 4.3: UNDERSTING OF INVENTORY MANAGEMENT
RESPONSE
VARIABLES
RESPONDENTS
- - .- .- - - --. .. I i 1' - . -. - .. .. - - -- . ..- . .
STAFF OF NBC STAFF OF NEIL / TOTAL
Yes -1 .- ---
TOTAL t I
Table 4.3, above indicates that all the respondents (staff of
NBC and NBL) all agree with the above assertion, that they all
have an understanding of inventory management. This can

be substantiated by the fact that a total of 200 respondents,
representing 100% all gave a nod to the above assertion.
TAE3LE 4.4: SOURCES OF RAW MATERIALS . - .. - - .- .- .. ..-.. . . . - .- .. ~
RESPONSE / PERCENTAGE
VARIABLES I I . .. - - - -- . - 1 STAFF OF NOC 1 STAFF OF NBL I TOTAL
QUESTION NO 6 A.
Table 4.4, above shows that the raw materials used in both
NB PLC and N9C PLC, are sourced from overseas. This can I
be substantiated by the fact that a total riumber of 170
respondents, representing 85% all agreed to thee above
assertion.

TABLE 4.5: QUALITY OF RAW MATERIANLS USED IN
.. .- ----- RESPONDENTS
~
-. .- :-
Fair 5 .-~-- - ..
1 substandard . .~ 1 TOTAL
NC> 6 B . ,
Table 4.5 above shows that the organizations under
study, use first class raw materisils in the production of their
finished products. This can be proved by the fact that a total
number of 192 respondents, representing 96% gave their
support to the above assertion.

TABLE 4.6: LENGTH OF TIME
THE MATERIALS
IT TAKES TO PROCURE
. . ........ - .......-.,_____.___._..._-.._I__ . . _ -
RESPOPf SE I
1 RESPONDENTS i PERCENTAGE
VARIABLES I I
... - ..... . ... .-I -. ....... -----..-I..-- . 4 ! STAFF OF N B STAFF OF NBC , I I
TOTAL . - .. ---- - . . -. . .......... . . . . -- .....
P o 1 O/o No No
.... .......--..... .... -- --- . ~ I--....-' One -, month 1 70
' 7 0 1 90 C ....... ..-.......- .-.--..- ..
Two - months 5 5 1 3 I 1. ; . . . . . ....
Below I month ' 25 1 25 1 , , L o oo --. -. -...............-......... ............ .-
TOTAL 100 ........................................... ....................................... -- 1
SOURCE: RESPONSE TO NBL AND NBC STAFF QUESTION------ NO 6 C
Table 4.6 above indicates that the organizations under study,
source their raw materials every month at least, a total
number of 16@ respondents supported this.

TABLE 4.7: STORAGE METHOD OF THE RAW MATERIALS
VARIABLES - ..... '
Cyclical method
FlFO method
Fixed order method
TOTAL
RESPONDENTS / PERCENTAGE 1 --
I STAFF OF NBL I STAFF OF NBC TOTAL -I
I t
i SOURCE: RESPONSE TO NBL AND NBC STAFF QUESTION
Table 4.7 above shows that both organizations adoptlapply . .
FlFO (i.e first in - first out) method of storage. This can be
buttressed by the 186 respondents out of the total
respondents who gave their suppart.

TABLE 4.8: WAS INVENTORY MANAGEMENT ANY
IMPACT ON YOUR MANUFACTURING PROCESS?! N-s-E --I--- ~ . ~.
RESPONDENTS I P E R C E N T A G ~ VARIABLES - - - - - - -. -. - - -- -- -- - -- -- --
h % ~ F i W N B L i STAFF OF NRC I T O T A T 1
. - ~
1 Don't Know I
2 . -. . -~ ...~ -. . -. - -
i TOTAL / 100 100 100 100 loo
SOURCE: RESPONSE TO NEIL AND NEIC STAFF QUESTION NQ-~-:'-'--
Table 4.8 above indicates that inventory management has a
great impact on the organizations manufacturing process
This can be sl-lbstantiated by the fact that a total number of
193 respondents, representing 96.5% all claim that inventory
management has a great impact on manufacturing process.

This can still be represented by a pie-chart
Fig. 4. I : A PIE- CHART REPRESENTING THE BELIEVE THAT INVENTORY MANAGEMENT HAS AN IMPACT ON MANUFACTURING PROCESS.
b TABLE 4.9: WHAT tltilPACT DOES INVENTORY
M.2NAGEMENT MAKE IN MANAGEMENT PROCESS ........ -.... .._i_ . . . . . . .
RESPONSE I RESPONDENTS I
) PERCENTAGE / I
I VARIABLES ! I
- -- - - - . + . '
/ NT % 1 No 1 - -- - - - -- - , .- so -- I .a -.--- 4 - - -*+ - -- ---- ,- - - -.
I f ---
Yes i I 85 1 85 165 82.51
-. - - I 1 . I
No -1 - 1 5- - - 15 - - 1 12 / 12 27 1 13.5 ! I I I I I I
ClodtKnow 5 3 3 -_ ...
TOTAL ........................ ....... .. ......
SOURCE: RESPONSE TO NBC AND NBL STAFF QUESTION NO 8.

Table 4 9, above shows th,?t inventory management has a great
impact on the manur,, :turing process of the organizations under
study This can be buttressed by the fact that a total number of
165 respondents, represent~ng 82.5% all gave their support to
the above assertion.
This can still be represented by a Histogram.
Fig. 4.2: A HISTOGRAM REPRESENTING THE IMPACT INVENTORY MANAGEMENT MAKE IN MANUFACTURING PROCESS

TABLE 4.W: ARE THERE PROBLEMS ENCOUNTERED
IN THE INVENTORY MANAGEMENT OF RAW
MATERIALS IN THE ORGANISATION.
SOURCE: RESPONSE TO NBL AND NBC QUESTIONS NO 9.
Table 4.10, above indicates that there are problems
encountered in the management of raw material inventory in
organization. This can be proved by the fact that a total number
of 176 respondents representing 88% have that believe that
there are problems encountered in the management of raw
materials.

This can still be represented by a bar-chart
Fig. 4.3. A BAR CHART REPRESENTING THE BELIEVE THAT THERE ARE PROBLEMS ENCOUNTERED IN THE MfJhGEMENT OF RAW ii,ATERIAL INVENTORY IN THE ORGANISATION.
TABLE 4.1q "JHAT IS THE NATURE OF THE PROBLEM?
RESPONSE RESPONDENTS ' PERCENTAGE VARIABLES I
I I
-1 I ................. .. 1 .... .35 ... .i . . . . . . . . . !--. I ........... - ....
I I-1azarcious 35 I 85 i q
............... ....... .. .+ ...
Corrosiveness 1 I 42 , 82 ! 41 1 .. 4 * ~ ~- T.--.. . . . . I '-~ I
4 1 4 r--
5 j - ~ +---. -- .. .
75 .........
j 19 1 5 . 5 1 ............... , .r G 6 1 B ............... . l-... 8 4 - I 7 1
100 1 :0107-i06i 1 100 / 200 1 100 / I I . . -. :

SOURCE, RESPONSE TC) NB!, AND NGC STAFF QUESTIONS NO10
Table 4.11, above shows that the nature of problem
encountered in the course of raw materials management in
both organizations (NBL and NBC) is hazardous and corrosive.
TABLE4.12: DOES PRINCIPLES OF CYCLICAL ORDER
QUALITY MODEL OF INVENTORY CONTROL PERMIT
CONTINUOUS FLOW OF PRODUCTS TO CUSTOMERS,
CONTINUOUS FLOW OF PRODUCTION IN THE
ORGANIZATIONAL PROFi'L'?.
RESPONSE 1 VARIABLES 1
... . - ......... .... --.. . + .... -~ 1 STAFF OF NBL / STAFF OF NBC 1 I i TOTAL I
. . . . . . . . . -....... . . . - .... -. .. .- ..... - . -- -. . -. .....- , . . -. ' .'.
YO NO O/O i
- 2 -. . . . . . . . . . . . . . . . . . . . . . . . . . . . . ............ . . G j j Yes I
70 130 / . . - _ - ...... ._ __- .. ....... - 1
No ? I - I - ,
I ! i .- ' -4- . . . - - .. ........ .. 4 1 " -3-o
-30---- : TO Don't Know / 40
40 i i .... . .......... .... - - ... - .- ... , . . . . - .- !
I , ...
TOTAL 1 1 100 I!.:,., 1 100 I i j 100 j 200 : 100 , I ... .
i . . ............ .. ..... ........ _ -. L 1.. _ i L l
SOURCE: RESPONSE TO NE!. AND NBC STAFF QUESTION NO1 1
Table 4.12, above postulates that the principle of cyclical crder
q~lality model of inventory control, when properly applied,
permit the continuous flow of products to customers, continuous
flow of przduct in the organizational profit. And this can be

buttressed by the fact that a total number of 130 respondents,
representing 65% gave their affirmation to the above assertion.
TABLE4.13: 5OES THE SUITABLE EMPLOYED FIXED
ORDER QUALITY SYSTEM OF INVENTORY ASSURE
CONTINUOUS FLOW OF INPUT MATERIAL,
DECREASE IN OVERHEADS, CHECK IN ABRUPT
HALT IPJ PRODUCTION OPERATIONS AND ENSURE
OPTIMAL INVENTORY LEVEL?
1 VARIABLES
-.. I ......... - .
. . SOURCE: RESPONSE TO NBL /ii!D NBC STAFF QUESTION ~ 0 1 2 7
Table 4. 'I 3, above indicates that the suitable, employed fixed
order quality system of inventory c o n t ~ ~ ! assilie continuous flow
of input abrupt halt in production operations and optimal
inventory levels. This can be substantiated by the fact that 168

respondents, representing 84% gave their support to the above
assertion.
TABLE 4.14: DOES APPROPRIATE ADOPTION OF THE ' 1
PRINCIPLES Or' THE MATERIALS REQUlREWtENT I "
F L A N N I N G METHOD OF INVENTORY CGI.ITROL, REDUCE COSTS ASSOCIATED WITH HOLDING
RESOURCES 1N IN\JENIBi-XY RESERVE, DECREASE
IN OVERHEADS AND CHECKS IN HALT IN
FROUUCTiON SCHED'JLE? .-.. -.....-.. .- - .......... ... ---
RESPONSE RESPONDENTS
VARIAELES -........ ..... .. -- , - - .-. -. . .---..----A,- .-.
STAFF OF NBC I r TOTAL
- ~
Yes 1 8 4 -. ........... .. -- .-..-... - ......... --- --
No I - Don't Know I 16
............... ....................
TOTAL 1 100 I - ., - -
SOURCE: RESPONSE TO f . 1 -.. ........ L-. i-- ._--
BL AND NBC STAFF QUESTION N0,%;13.
Table 4.14, above shows that the appropriate adoption of the
principles of the materials requirement planning method of
inventory control, reduces costs associated with holding
resources in inventory rescwe, decrezse in over heads and

checks in halt in production schedule. This can be buttresri;d
by the fact that a total number of 172 respondents, represent
860/ / " , 7ve ttwir nod to the above assertior~
SECTION (2): TEST OF HYPOTHESES
HYPOTI-ESES GL!E ( A )
Ho. The prop.zr!y appl~ed principles of cyclical ~ r d e r quantity
model of inventory control does not permit continuous
- flow of products to customers, continuous flow of
production in organisational profits. B
HI: The properly applied principles of cyclical order quantity
model of inventory control permit continuous flow of I
procl~rcts to customers, continuous flow of production in
organisational prof~ts
CHI-SQUARE TEST FOR TAB! E 4.12 (CONTINGENCY
TABLE) . -- -- - ..---
RESPONSES .-.-...--.-.--....--..-y-.... ........... . . . . - . . . .
YES 1 NO DON'T KNOW ~. ............. .. .. ................ p. -. -. - .- ,~--- NBL STAFF . ..7-.. I 6 O (65) ... 1 - (O)q .. 40 (35) .-
............. . .
NBC STAFF I T.OT'.iL ......... ...................... 1 1 70-165)--1 130 (OL 30 (35) I 1 - 70
L . - . . . . . . . --- L- .- 2 . I I E
SOURCE: TABLE 4.12

94
Values in the big cells are the observed frequencies, while
those in the brackets are the expected frequencies.
Computed x2 = (n,, - ey12
Where n,, = Observed frequencies
e;j = Expected frequencies
- -- - -- - - ei r oi - ti -2-- -- / (oi - ei) 1 1 (oi-ei) "1 /el
The degree of freeiLrn is determrned with the following
formula:
df =
Where
(r - I ) (c - I )
r = the number of rows
C = the number of columns
df = ( 3 -1 ) (2-1)
= 2 x 1 = 2
9.05 = 5.991

With the 2 degree of freedom at 5% level of significance
is 5.991 compar~d with the calculated value of 2.1976.
Decision Rule - Reji-ct Ho if x2 calculated is greatar than
x2 5.991. Otherwise, do not reject /-lo Since x2 calculated =
2.1976 is lesser than x2 5.991, we therefore, rejec: HI (the
alkrnative hypotheses) and accept l id (null hypotheses). The
conclusion ther-efccz, is that the principle of cyclical order
. qimlity model of inventory control does not permit continuohs
flow of products to customers, continuous flow of production
in the organkational profit.
1-1.: Suitably employed fixed order quantity system of
inventory control does not assure continuous flow of
input materials, decrease in overheads, check in abrupt
halt in production operations and ensure optima! 1 "
inventory levels.
I : Suitably employed fixed order quantity system of
inventory control assure conti t~uoi~s flow of input
materials, decrease in out , heads, check in abrupt halt
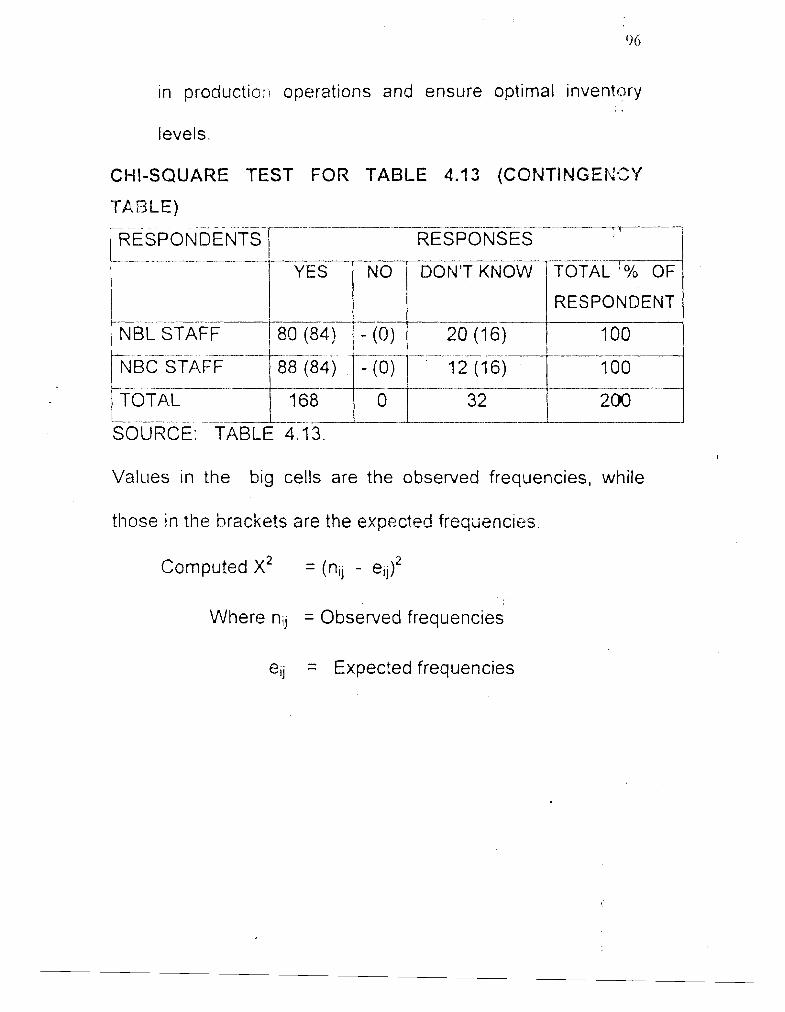
in producticn operations and ensure
levels.
CHI-SQUARE TEST FOR TABLE 4.13
optimal inventory , ,
'~...E.E ~SP O~ND WT s7--..-... . . T -
RESPONSES .. -
YES- NO DON'T KNOW OF
I I RESPONDENT
/ NBC STAFF
SOURCE: TABLE 4.13.
Values in the big cells are the observed frequencies, while
those in the brackets are the expected f r q x n c i e s .
Computed x2 = (nij - e,j)2
Where nu = Observed frequencies
eij = Expected frequencies
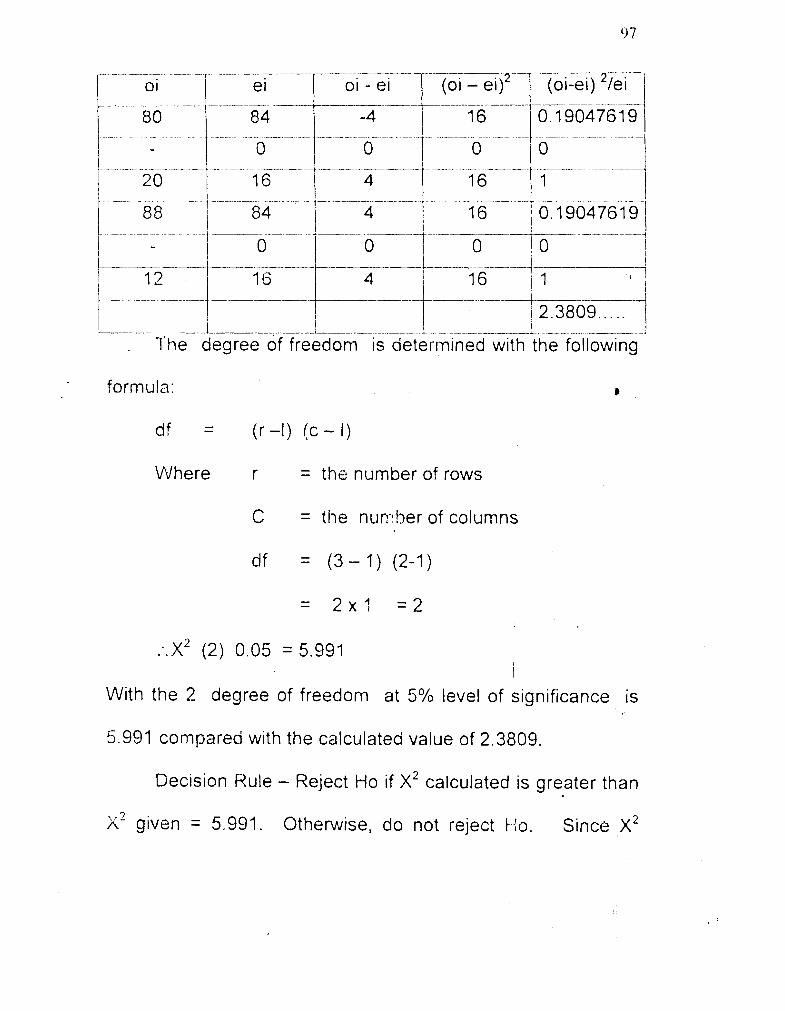
I
. l'he degree of freedom is determined with the following
formula: B
df =
Where
(r -I) (c - I)
r = the number of rows
C = the nurber of columns
With the 2 degree of freedom at 5% level of significance is
5.991 compared with the calculated value of 2.3809
Gecision Rule - Reject Ho if x2 calculated is greater than
given = 5.991. Otherwise. do not reject t io. Since x2

calculated is l e s s ~ r than x2 5.991, we therefore, accept Ho
(null hypotheses)and reject H,(alternative hypotheses). The
conclusion therefore, is that suitable employed fixed order
quality system of inventory control does not assure cormuous
flow of input materials decrease in overheads, check in abrupt
halt In prod~iction operations and ensure optimal inventory
level.
. Ho: Appropriate adoption of the principles of the materidls
requirement pianning method of inventory control does
not reduce costs .;ssociated with holding of resources in
inventory reserve, decrease in overheads and checks in
halt in production schedule.
HI: Appropriate adoption of the principles of the materials I '
requirement planning method of inventory contrcl
certainly reduces costs associated with holding of
resources in inventory reserve, decrease in overheads
and checks in halt in production schedule.

CI-11-SQUARE TEST
TABLE)
I RESPONDENTS-! I
FOR TABLE 4.1.: (CONTINGENCY
RESPONSES I I
.-. . . - . .. .
NO J -DONIT KNOW TOTAL O/O OF 1 RESPONDENT
Values in the btg cells are the observed frequencies, while
those in the brackets are the expected frequencies.
Computed x2
Where x2
"j
eij
= (nij - e,j)2
= Chi-square
= Observed frequencies
= Expected frequencies

, . - . .. . . , . . . . . ' ' . .. . -- --;- --
I o I I e i 1 oi - ei / I (oi - ei) / (01-ei) */eT~j
The degree of freedom is determined with the follewing
formula:
Where r = the number of rows
C = the number of columns
With the 2 degree of freedom at 5% level of significance is
5.991 compared with the calculated value of 0.40756.

calculated is lesser than x2 given (1.e calculated = 0.407C"
lesser than X' given 5.991), we therefore, reject HI (the
alternative hypotheses) and accept t i o (null hypotheses). The
conc lus i~n there is that appropriate adoption of the principles
of materials requirement planning method of inventory control
does not reduce costs assocrated w ~ t h holding resources in
inventory reserve, decrease in overheads and checks in halt
in proc!uction schedule. B

Uzoh, Stanley I.L, "an appraisal of public Relations inputs
(instrumei'itsistrategies) in the awareness
creation of HIVIAIDs pandemic in
Niger~a". An unpublished project
Report, for the award of a Postgraduate
Master of Spience (M,Sc-) Degree,
Department of Marketing, ~ a c u l t i of
Bminess Adrn~nistration, Uni\~ersity of
Nigeria, Enuy u Campus, Enugu.
September, 2001.
, .
CHAPTER FIVE
5.0: SUMMARY OF FINDINGS, RECOMMENDATIOIdS AND
CONCLUSION.
The various dats gathered has been presented and
analyssd ii; chapter four. This chapter therefore, will discuss
issues generated from the analysis and make
recommendations accordingly.
5.?1 SUMI"Lv(AAY OF FINDINGS
The researcher, in the course of this study found out the
following:
A. That the respondents from both organizations
understand what inventory management is all about.
B. That the organizations go for and use first class raw
materials in the production of their fin~stied products.
C. That inventory nianagement make a great impact on
the organizations manufacturing process.
D. The properly applied principles of cyclical order
quantity model of inventory control does not permit

cor~t~nuous flow of products to customers, contmuous
flow of prociuct~on in or-yanisational profits.
E. Suitably employed fixed order quantity system of
inventory control does not assure continuous flow of
input materials, decrease in overheads, check in
abrupl halt in prod~.rction operations and ensw.,
o;~trrnal mventory levels.
F -q~propriate adoption of the principles of the materials
requirement plar~ning method of inventory control
does not reduce costs associated with holding in
overheads and checks in halt in production schedule.
5.2: RECOMMENDATIONS
Based on the data analysed, and findings made, the
researcher \.vould like to make the following recommendations:
(i) For there to be continuous flow of products to the
customers, continuous flow of production in
organisational profits, there should be proper and

appropriate application of cyclical order quantity model
of inventory control.
( 1 1 ) Organisations should recognize and adopt. the
principles of the materials requirement planning
method of inventory control, ~f they are to record costs c
reducti~iis/assoc~ated with holding resources in
inventory reserve, decrease in overheads and checks
in halt in productiotr schedule b
(iii) There can be an assurance of continuous flow of input
materials:, decrease in overheads, checks in abrupt
halt in production operation and the optimal inventory
levels, if only organizations could suitably employ fixed I I '
order quantity system of mventory control as a sure
way of actualizing an organisational inventory
management objective. I, I
5.3 CC)NCLUSION
From thc analysis of the data and findings, the researcher
wc~ l l d like to conclade as follows:

' I It is only when the various principles of inventory control
methods, which i n c l u k cyclical order quantity model of
invento~ y control; fixed order quantity system; and the
materials requirement planning method of inventcry control,
are adequately and appropriately used I applied, that the
continuous flow of products to customers, continu !IS flow of
production in organisational profits, continuous flow, of input , .
materials, decrease in overheads, check in abrupt halt , in
production operations, cost reduction associated with holding
in overheads and checks in halt in production schedule e.t.c
can be assured and guaranteed.
Therefore, anything contrary to the above (i.e the
adequate and proper application of the principles of inventory
control methodsltechniques) will obviously defeat the aim
/objective of the organisational inventory management.

AREASOFFUTHERRESEARCFI
I The impact of local ,ourcing of raw materials and
backward integrat~on on organisational growth and
development
2 . Relevance of Total Quality Management (TQM) in the
development and growth of smd l scale enterprises.
3. Time management: An Indispensable tool for
organisational efficient operat~ons. B

BIBLIOGRAPHY
Amey, L R & Egginton D N; Manauement Aicountinq: a Conceptual Approach. Longman, 1973 .
Arrow K J T Htmies; "Optimum Inventory Policy", Econometric& XIX 1951.
Buyers, CI & tiolrnes GA; "Material Control". Principle of Cost Accountinq; cased London; 4Ih ed. 1984..
Busha, E.F. (1986): "Tvletnod arid source of data collection" : In Uzoh, Stanley I.L.; An Unpublished project report for the award of a postgraduate Diploma ,r3GD) in Business Administration / Marketing (Public Relations) University of, Nigeria, Enugu Campus, Enugu, February, 2000.
Dvorekzy, AJ Kiefer, and Wolfowitz; "This Inventory probleml: Case of Unknown distribution". Econometrix XXI (1 953).
Y "k
Egbui lkeagvw K. (1998): Groutidwork of Research Ml_i!IlqdoIo~y arid Procedures, Institute for .Development Studies, University of Aigeiia, Enugu Campus, Enugu.
Edwin, B Flippo S( Garry, :.I Musinger: "Allocation and Control of resources". banaqement. Allyn and Bacon, Inc., 1978.

Freund, E.F. and William, J.F.: "Model of sample deterniination": In Uzoli, Stanley I.L.: An appraisal of Public Relations inputs (instrumentslstrategi~~s) in the awareness creation of HIVIAIDS Pandemic in N ~ g e ~ i a . September , 2001
Hardley,G & T.M. Whitin: "The N a t ~ ~ r e of Inventory System". Analysis of Inyentory Systern; Prentice Hall, Eaglewood Cliff N J 1963. I
Harris, F; Operation and Costs (Factory Management Series) Chicago: A W Shaw Co 1% 5. -
J.A.F. Stoner, Mananenlent ' (London; Prentice Hall, International Inc. 1978) .
b
KIM "Economic order quantity" Quantitative &alvsis for Managerial Decision, Addison - Wesely Publishing Co. 1976 .
Kola Folayan, & Modupe Adec,~n: "The story of Excelling " History of lever Gr-other-s from - 1983.
Kostas, N. Dervitsiotis: " lnventory System and Models". Operation Management, -- -. - McGrav- HI!^ book '1981.
Lewis, C D Scientific Inv_entory Control, Hiffe, London, (Forthcoming).
Melnitsky Benjamine; Manaqement of haustrial Inventorv. Philadelphia, Chilfon Company, First ed. 1951.
Pandey I M "Managenletst of inventory". Flnmcial Management Vikas publishing House PVT Ltd 1979.
Patterson, R. et al: Decision Systems For Inventory Management and Production Planning New York; John Wtley and Sons, 1971.

Samuel JM&FM Wilkes; "Management of Inventory". Management of
Company Finance. - Welson, 2" editition ---
Synder, Arthur: "Principle of Inventory Managenlent". Financial Executive XXXII (April 1964).
Starr, Martin, K & David W Miller; Inventory Control: Theory and Practice Englewood Cliff, N.J. Prentice - Hall 1962 p. 17.
T. Lucey , Costinq (DP Publications) 1989) P. 29
Van Hees, RN and N Monhemius; Introduction to Production and Inventory Control; Theory and Practice. Phlacmillan. 1972.
Whi!;n, T M; The Theory of Inventory Manaqement. Princeton, N J Princeton University Press 1953.
Uzoh, Stanley I.L, "An Appraisal of Public Relations Inputs (Instruments/Strategies) in the Awareness Creation of HIVIAIDS Pandemic in Nigeria". An U n p ~ l blished Project Report, for the Award of a Postgiaduate Mas !~ r of Science (M.Sc.) Degree, Tepartment of Marketing, Faculty o f Business Administration, University of Nigeria, Enugu Campus, Enugu. September, 2001.
PrcAmnary Survey Annual Reports and Accounts of Afprmt 1994 D~ary of NB PLC, 2000 Pamphlet of N3C PLC, 2001

,!4PPedisr X I
EPART NT UNIVERSITY OF NIGER1 UGU C ~ W U S
Tel 042-453661
Date . S e p t ~ m b e r 19,
PG/MBA,'OO/J112~ i s a P o a t g m d u a t e e t u d o n t i n the Ditpartmunt
- of ~Yanagorxunt, F u c u l t l ; o f B u a i n o s s A d m i n i s t r a t i o n . @
P l u u s u g i v o him a l l tho n o c d 3 s a r y a a s i a t a n c o he m y r ~ q u i r e .
( Ag. Head Depar tment o f Mana~oment

APPENDIX I 1
INTERVIEW SCHEDULE
I 14-1 ;I: RVI EWER QUESTIONS ... . - -. .... .- .. . .. -- . . -..--.-- ..
your name Liir./lLladam?
For how long have you been a
mariagen7snt/markeling consultant and
practitioner?
What is your position in this
organization?
Have you indebt knowledge and
understanding of what inventory
rrianagement is all about?
What are the sources and quality of raw
materials to your organisation?
How long does it take to produce the raw
materials?
What storage techniques does your
organisation use in storing their raw
materials?
identify ?he inventorjl mmzigement
practices and policies that are being
LIC-.::d by your organizations?
Lfi:!hat are the inventory management
problems of :he organization?
INTERVIEWEE RESPONSES
- .. -

APPENDIX I I 1
Faculty of Bus-Admin. Department of Marketing, University of Nigeria, Enugu - Campus, Enugu.
September, 2002.
Please find the enclosed - a questionnaire for your
completion and return to the above address.
The questionnaire is in connection with the award of ,a post graduation Master of Business Administration (MBA)
Degree in Management, Faculty of Business Administration,
University of Nigeria, Enugu Campus, Enugu. Any
infort-nation supplied herein will be treated with urnost
confidentiality. Please feel free to select any question of your
choice and complete the box provided by ticking (4) accordingly.
Thanks.
Yours Sitxerely, Oliomogbe, Thompson I PG/MBN00/31124

QUESTIONNAIRE FOR THE STAFF AMP NIANAGEMENT OF
NB ?LC AND NBC PLC, ENUGU.
Sex: (a) Male [ ] (b) Female [ ]
Age: (a) 1 8 - 3 0 y r s . [ j ( b ) 3 1 - 4 0 y r s [ ]
(c> 41 - 50 yrs. [ ] (d) 51 - 65 yrs. [ ]
Marital status: (a) Married [ ] (b) Single [ ]
(c) Divorced [ ] (d) Widowed [ ]
Educational attainment: (a) Primary [ ] (b) Secondary [' ]
(c) Professional [ ] (d) Technicril [ . ] (e) Tertiary [ ]
Have you indebt understanding and knowledge of whgt
inventory management is all about? (a) Yes [ ] (b) No[ ]
What are the sources, quality and availability of raw materials
used in production; the length of time it takes to procure the
materials and how !he raw materials are stored? -----------------
Does inventory management have any impact on your
company's rnan~~factut lng processes.? (a) Yes [ ] (b) No [ ]
lr yes, what impac: docs ~t take? (a) Very strong impact [ ]
(b) Strong impact I, ] (c) Weak impact [ ]
Are there problenis encountered In the management of the
raw material inventory in the organisation? (a) Yes [ ]
(b) No [ ] (r) Don't know [ ]

10. If yzs, what is the nature of the problem . . . . . . . . . . . . .
. . . . . . . . . . . . . . . . . . . . . . . . . . . . . . . . . . . . . . . . . . . . . . . . . . . . . . . . . . . . . . . . . . . . . . . . . . . .
11. Does the properly applied principles of cyclical order
quantity model of invrmtory cor~trol permit continuous
flow of products to customers, continuous flow of
production in the organisational profits?
(a ) yes [ I (b) No [ I 12. Does the suitable employed fixed order quantity system of
inventory control assure continuous flow of input b
materials, decrease in overheads, Check in abrupt hd t in
production operations and ensure optimal inventory
levels. (a) Yes [ ] (b) No [ ] (c) Don't know [ ]
13. Does appropriattl adoption of the principles of the
materials requirement planning rnt.thod of inventory
control certainly reduces costs associated with holding
resources in inventory reserve, decrease in overheads
and checks in halt in production schedule?
(a) Yes [ 1 (b) No [ ] (c ) Don't know [ ]