Embed Size (px)
Citation preview

UNIVERSITY OF KWAZULU-NATAL
FINANCIAL RISK MANAGEMENT AND BANK PROFITABILITY IN SOUTH AFRICAN
BANKS
By
Sibusiso M. Mafu
210513349
A dissertation submitted in fulfilment of the requirements for the degree of Master of Commerce in
Finance
College of Law and Management Studies
School of Accounting, Economics and Finance
Supervisor: Prof Mabutho Sibanda
2017

i
DECLARATION
I, Sibusiso M. Mafu, declare that:
(i) The research reported in this dissertation, except where otherwise indicated, is
my original.
(ii) This dissertation has not been submitted for any degree or examination at any
other university.
(iii)This dissertation does not contain other persons’ data, pictures, graphs or other
information, unless specifically acknowledged as being source from other persons.
(iv)This dissertation does not contain other persons’ writing, unless specifically
acknowledged as being source from other researchers. Where other written sources
have been quoted:
a. Their words have been re-written but the information attributed to them has
been referenced; and
b. Where their exact words have been used, their writing has been placed inside
quotation marks and referenced
(v) This dissertation does not contain text, graphics or tables copied and pasted
from the internet, unless specifically acknowledged, and the source being detailed
in the dissertation and in the Reference sections.
Signature…………………………………….

iii
ACKNOWLEDGEMENTS
I would like to begin by thanking God for enabling me to complete this Master study and for
the grace He afforded me to finish it in due time. The energy, dedication, commitment and
persistence I put in this project is because of His grace.
Secondly, immense gratitude is dedicated to my supervisor, Professor Mabutho Sibanda. I am
in awe of the guidance and motivation he gave me. Doing this project without his supervision
would have been a near impossible. His expert advice and supervisory comments assisted me
in producing this document which I am truly grateful. I also extend my gratitude to the masters’
cohort that Professor Mabutho Sibanda started for his masters’ students doing related studies in
risk management. Special mention to my colleagues such as Sphiwe Zungu, Michelle Mokam,
and Nobantu Ngobe, to name but just a few from the cohort.
I would like to express my appreciation towards my family and relatives for their support.
Special mention goes to the Mqadis, Mafus and Mhlongo families. Lastly, but certainly not
least, to my young sister and brother Minenhle and Mangaliso I extend sincerest gratitude for
the love and support they gave when I needed quiet time to do my school work.

iv
ABSTRACT
This study examined the connection between financial risk management and banks’
profitability in a South African context. The relationship was segmented into three major
financial risks; credit risk, liquidity risk and market risk. Theory assumes risk to have a
negative relationship with profitability; however, some studies have proved otherwise. This
study used top five banks in South Africa over a10-year period spanning 2006 to 2015 and
employed Fixed Effect Model based on the Hausman Test to estimate the relationship between
credit, liquidity and market risk with profitability measure return on equity. “The credit risk
indicators (independent variables) employed in this study are non-performing loans to total
loans, and loans and advances to total deposit. Two control variables leverage ratio and
logarithm of total asset as proxy for firm size were also used. All variables were regressed
against ROE as a profitability measure (dependent variable). The
findings indicate a significant relationship between profitability and non-performing loans, and
leverage ratio at 1%, loans and advances to total deposit at 5%; while firm size (log total assets)
is significant at 10% significance level. The liquidity risk indicators (independent
variables) employed are loans and advances to total deposit, non-performing loans to total
loans, LOG(total assets), market capitalisation to total assets, non-deposit dependence/external
finance, equity to total assets. Control variables are non-performing loans, firm size (log total
assets), GDP growth rate, and ratio of financing gap. The findings indicate that loans and
advances to total deposit, non-performing loans, market capitalisation to total assets, and non-
deposit dependence are significant at 1% significance level, firm size (log total assets), at 5% ;
while equity to total assets, GDP growth and ratio of financing gap are insignificant.
The market risk indicators
(independent variables) employed with three main variables are market capitalisation (log
stock) to proxy equity risk, exchange rate to proxy foreign exchange risk, and lending interest
rate to proxy interest rate risk. Three control variables were employed; inflation rate, GDP and
monetary supply (M3). The findings show market capitalisation (log stock) is significant at
1%, exchange rate and GDP are significant at 10% significance level. An insignificant and
negative relationship with lending interest rate was found. With the control variables, the
findings showed that there is an insignificant and positive relationship between inflation rate
and return on equity and a negative relationship between GDP and return on equity. The results
are in conflict with the expected sign. The study suggests that, with regards to
credit risk, banks in South Africa should enhance their capacity in credit analysis and loan

v
administration while the regulatory authorities should pay more attention to banks’ compliance
to relevant regulatory requirements by the Basel Committee on Banking Supervision, put more
effort in attracting deposits as they are a major determinant of liquidity followed by external
funding liability and seek for effective hedging strategies to deal with the market risk
volatilities.

vi
PERMISSION TO SUBMIT
College of Law and Management Studies
Supervisors Permission to Submit Thesis/ Dissertation for Examination
Name: Sibusiso Mafu No: 210513349
Title: Financial Risk Management and Bank Profitability in South African Banks
Qualification: Master of Commerce: Finance
School: School of Accounting, Economics and Finance
Yes NoTo the best of my knowledge, the thesis/dissertation is primarily thestudent’s own work and the student has acknowledged all reference sources
The English language is of a suitable standard for examination without going for professional editing.
Turnitin Report
Comment if % is over 10%:
I agree to the submission of this thesis/dissertation for examination
Supervisors Name: Professor Mabutho Sibanda
Supervisors Signature:
Date:
Co- Supervisors Name:
Co- Supervisors Signature:
Date:

vii
TABLE OF CONTENTS
DECLARATION....................................................................................................................... i
ACKNOWLEDGEMENTS...................................................................................................... ii
ABSTRACT............................................................................................................................. iii
PERMISSION TO SUBMIT.....................................................................................................v
TABLE OF CONTENTS......................................................................................................... vi
LIST OF TABLES................................................................................................................... ix
LIST OF FIGURES...................................................................................................................x
LIST OF ABBREVIATIONS...................................................................................................xi
INTRODUCTION.....................................................................................................................1
1.0 Introduction................................................................................................................ 1
1.1 Background.................................................................................................................1
1.1.1 Financial Risk Management and Profitability..................................................... 2
1.1.2 South African Context.........................................................................................3
1.2 Research Problem....................................................................................................... 4
1.3 Research Objectives................................................................................................... 5
1.4 Research Questions.....................................................................................................5
1.5 Justification of the study.............................................................................................5
1.6 Scope of study............................................................................................................ 6
1.7 Chapter Summary....................................................................................................... 6
LITERATURE REVIEW..........................................................................................................7
2.0 Introduction................................................................................................................ 7
2.1 The Concept of Financial Risk Management..............................................................7
2.1.1 Credit Risk...........................................................................................................7
2.1.2 Liquidity Risk......................................................................................................9
2.1.3 Market Risk....................................................................................................... 11
2.2 Theoretical Framework on the Determinants of Financial Risk............................... 11
2.2.1 Financial Intermediation Theory....................................................................... 11
2.2.2 Shiftability Theory............................................................................................ 14

viii
2.2.3 Financial Fragility Structure and Crowding-out of deposit Theory...................14
2.2.4 Market Power Hypothesis................................................................................. 16
2.2.5 Arbitrage Pricing Model....................................................................................16
2.2.6 Liquidity Preference Theory..............................................................................17
2.3 Theoretical Literature on the Risk Indicators of Financial Risk............................... 18
2.3.1 Credit Risk.........................................................................................................18
2.3.2 Liquidity Risk....................................................................................................19
2.3.3 Market Risk....................................................................................................... 23
2.4 Empirical Literature on the Determinants of Financial Risk.................................... 26
2.4.1 Credit Risk.........................................................................................................26
2.4.2 Liquidity Risk....................................................................................................28
2.4.3 Market Risk....................................................................................................... 32
2.5 Determinants of Bank Profitability...........................................................................35
2.6 Financial Risk Management Strategies.....................................................................36
2.6.1 Credit Risk.........................................................................................................36
2.6.2 Liquidity Risk....................................................................................................37
2.6.3 Market Risk....................................................................................................... 39
2.7 Chapter Summary..................................................................................................... 41
METHODOLOGY..................................................................................................................44
3.0 Introduction.............................................................................................................. 44
3.1 Data Sources and Research Design.......................................................................... 44
3.2 Econometric Specification and Tests........................................................................45
3.2.1 Developing Panel Data......................................................................................46
3.3 Credit Risk Regression............................................................................................. 49
3.3.1 Risk Indicators (Independent variables)............................................................ 49
3.3.2 Performance Indicator (Dependent Variable)....................................................49
3.3.3 Relationship between Profitability and Risk Indicators.................................... 50
3.4 Liquidity Risk Regression........................................................................................ 51
3.4.1 Risk Indicators (Independent Variables)........................................................... 51
3.4.2 Performance Indicator (Dependent Variable)....................................................52
3.4.3 Relationship between Profitability and Risk Indicators.................................... 52
3.5 Market Risk Regression............................................................................................54

ix
3.5.1 Risk Indicators (Independent Variables)........................................................... 54
3.5.2 Performance Indicator (Dependent Variable)....................................................54
3.5.3 Relationship between Profitability and Risk Indicators.................................... 55
3.6 Chapter Summary..................................................................................................... 57
RESULTS AND DISCUSION................................................................................................58
4.0 Introduction.............................................................................................................. 58
4.1 Credit Risk Output....................................................................................................58
4.1.1 Descriptive Statistics Analysis.......................................................................... 58
4.1.2 Multicollinearity Test........................................................................................ 59
4.1.3 Fixed and Random Effects Model.....................................................................60
4.2 Liquidity Risk Output...............................................................................................65
4.2.1 Descriptive Statistics......................................................................................... 65
4.2.2 Multicollinearity Test........................................................................................ 67
4.2.3 Fixed Effects Model.......................................................................................... 68
4.3 Market Risk Output.................................................................................................. 71
4.3.1 Descriptive Statistic Analysis............................................................................71
4.3.2 Multicollinearity Test........................................................................................ 73
4.3.3 Fixed Effects Model.......................................................................................... 74
4.4 Chapter Summary..................................................................................................... 76
SUMMARY, CONCLUSION AND RECOMMENDATIONS..............................................78
5.0 Introduction.............................................................................................................. 78
5.1 Summary...................................................................................................................78
5.2 Conclusion................................................................................................................81
5.3 Policy Recommendation...........................................................................................81
5.4 Recommended Future Research............................................................................... 82
5.5 Limitations of the Study........................................................................................... 83
5.6 Chapter Summary..................................................................................................... 83
References...............................................................................................................................84
APPENDICIES.........................................................................................................................A
Appendix I: Models Summary.............................................................................................. A
Appendix II: Turnitin Report.................................................................................................B
Appendix III: Ethical Clearance............................................................................................ C

x
Appendix IV: Proposal Qualification....................................................................................D

xi
LIST OF TABLES
Table 3.2 Liquidity Risk Indicators...................................................................................... 52Table 3.3 Market Risk Indicators..........................................................................................55Table 4.1 Descriptive Analysis of Credit Risk......................................................................58Table 4.2 Correlation Matrix of Credit Risk......................................................................... 59Table 4.3 Fixed Effect Model Credit Risk............................................................................ 60Table 4.4 Random Effect Model Credit Risk........................................................................61Table 4.5 Hausman Test Credit Risk.................................................................................... 62Table 4.6 Descriptive Analysis of Liquidity Risk.................................................................65Table 4.7 Correlation Matrix of Liquidity Risk.................................................................... 67Table 4.8 Fixed Effect Model Liquidity Risk....................................................................... 68Table 4.9 Descriptive Analysis of Market Risk.................................................................... 71Table 4.10 Correlation Matrix of Market Risk....................................................................73Table 4.11 Fixed Effect Model of Market Risk...................................................................74

xii
LIST OF FIGURES
Figure 2.1 Financial Intermediary Process..............................................................................12

xiii
LIST OF ABBREVIATIONS
BASA Banking Association of South Africa
BCBS Basel Committee on Banking Supervision
BIS Bank of International Settlements
BRICS BRAZIL, RUSSIA, INDIA, CHINA AND RUSSIA
EAD Exposure at Default
EaR Earnings at Risk
ETA Equity to Total Assets
FEM Fixed Effect Model
FX Foreign Exchange
GDP Gross Domestic Product
IMF-IFS International Monetary Fund – International Financial Statistics
INFL Inflation
LA/TD Loans and Advances to Total Deposit
LCR Liquidity Coverage Ratio
LGD Loss Given Default
LOG (TA) Logarithm of Total Assets
MKT-CAP Market Capitalisation
M3 Monetary Supply
NCA National Credit Act
NDD Non-Deposit Dependence
NPL/LA Non-Performing Loans to Loans and Advances
NSFR Net Stable Funding Ratio

xiv
PD Probability of Default
ROA Return on Asset
ROE Return on Equity
REM Random Effect Model
RFG Ratio of Financing Gap
SACsi South African Consumer Satisfaction Index
SARB South African Reserve Bank
VaR Value at Risk
ZAR/USD South African Rand to American Dollar

1
CHAPTER ONE
INTRODUCTION
1.0 Introduction
In a world where financial education has become ever more important in light of the different
scenarios affecting the economic and business environment that we operate in, the research into
financial risk and profitability in the banking sector has become crucial and detrimental to
corporate and macroeconomic stability. South Africa as a thriving nation with significant
economic roles as a member of BRICS as well as the G20 has experienced a rocky last couple
of years with a number of issues bring to light the need for financial risk management and
profitability research in the banking sector.
Consequence of the above, the background leading to the study is clearly laid out by providing
an understanding of the concept of financial risk, bank profitability and regulatory
requirements. “The problem statement is defined and explained with clarity as to the goals and
objectives of the research. The justification of the study is subsequently provided in this section
followed by the scope and the organisation of the whole study.”
1.1 BackgroundThe work presented here sought to study the effects of financial risk management with a
particular focus on the performance of the banking sector in South Africa. In a study carried
out, a notion was put forward that amongst all financial firms, the banking sector has the most
risk (Adekunle A Owojori, 2011). Its riskiness is due to the nature of business where the ratio
of borrowed capital to owners’ equity is usually quite high. This leverage nature of banks
makes them more exposed to losses and catastrophic events (Quey-Jen, 1996). According to
Adekunle (2011), even a good lender cannot withstand the persistent run on deposits. As banks
are mainly funded by depositors, if depositors decide to withdraw their funds spontaneously
these banks would be subject to losses.
In the case of liquidity run, the bank will be compelled to shut down (Adukunle, 2011).
Moreover, bank performance has received great attention globally and a large number of
empirical studies have been conducted. Scholars and industry specialists are narrowing and
investigating on the deteriorating health of the banking institutions resulting from the global

2
financial crisis (Webb, 2010). According to Funso, Kolade, and Ojo (2012), bank profitability
evaluation studies are imperative in advancing knowledge in the banking industry because
banks play a crucial task in assisting economic growth. The intermediary role that banks play is
the catalyst of any country’s economic growth (Klapo and Ayeni, 2012). Bank profitability can
be measured using two broad approaches; accounting and statistical approaches. Ncube (2009)
employed the accounting methodology in his research that made use of financial ratios, in
assessing bank performance in South Africa. However, Kabnurkar (2001) viewed the
accounting methodology (financial ratios) as very limiting in evaluating bank performance; as
a result scholars in management sciences are in constant search for new and advanced methods.
1.1.1 Financial Risk Management and Profitability
All forms of businesses established to make profits are exposed to uncertainties and risks. In
that space, banks and other corporations in the financial sector are faced with a lot of risk:
credit, interest rates, foreign exchange rate, liquidity, market and commodity risk, and
operational risk (Cooperman, Mills, & Gardner, 2000). However, according to Adeusi, Akeke
Obawale and Oladunjoye (2013) there are three major financial risks affecting banks; credit,
liquidity and market risk. Coyle (2000) defined credit risk as failure from a borrower to repay
the loan amount as it falls due and also called it default risk. Credit risk volatilities are regarded
as number one risk in banks and they have the ability to deteriorate the loan book and the asset
quality of the bank (Alshatti, 2015). The Basel Committee (2008) defined liquidity risk as a
risk that arises when the bank fails to meet its short term financial obligations. Liquidity risk
exists in two types: (1) Asset liquidity which arises when an asset fails to sell because there is
no liquidity in the market and (2) funding liquidity risk arising from liabilities that are not met
at the time they become (Gomes & Khan, 2011). Market risk is the risk that arises when the
value of a portfolio (either an investment portfolio or a trading portfolio) decreases due to the
changes in market risk factors (McKinsey, 2012).
According to Toutou and Xiaodong (2011) profitability is the measure of how organisations
deploy capital funds to generate profits. It is indicative of banks’ financial health and it can be
used as a performance measure. Mabwe (2010) posited that risk erodes on banks’ profitability
and rising levels of risk deteriorate the health of banks. Moreover, scholars use three measures
of profitability as we will see in the literature review namely; return on equity (ROE), return on
asset (ROA) and net interest margin (NIM). Scholars that are more interested in capital
intensity of banks were most likely to use ROA. Those interested in the profitability of banks

3
predominantly used ROE and those interested in interest income generation were more likely
to use NIM (Pandey, 2015; Eugene & Brigham, 2011).
1.1.2 South African Context
The World Economic Forum Competitive Survey for the period 2015-2016 ranked South
Africa 8th out of 140 countries in the Financial Sector Development (BASA, 2016).
Furthermore, the Banking Association South Africa posited that even though the South African
banking industry was a highly concentrated industry, it was still competitive and continued to
keep up with the international best banking practices (BASA, 2016). The South African
Reserve Bank in December 2015 reported a 15.7% growth in total assets of South African
banks to R3.6 trillion. These assets were largely composed of loans and advances at 74.5 %. An
indicator of banking sector credit risk impaired advances decreased from R114.8 billion in
2014 to R112.4 billion in December 2015. However, impaired advances were expected to grow
as the economy worsened. Again SARB (2015) reported that the main source of funds in banks
still remained deposits. In December 2015, deposits constituted 84% of banks’ total liability.
On the contrary, the banking sector profitability measured by return on equity (ROE) decreased
from 16.64% to 16.35% in December 2015. Despite the positive impact of banks on the
economy, banks still faced challenges. In April 2016, Standard and Poor (as reported by
Banking Association of South Africa) warned South African banks that they were growing
credit risk as economy worsened. SARB (2015) reported that consumers were still constrained
because of slow employment rate, sluggish disposable income growth and rising inflation.
This, combined with tighter affordability criteria following the implementation of amendments
to the National Credit Regulations” had resulted in constrained growth in retail credit exposure.
SARB (2015) reported that South African financial markets faced two tragic events. The first
event was the 9th December 2015 when the Minister of Finance was unexpectedly replaced.
Subsequent to this event large quantities of South African financial assets were sold. The
second event was on the 11th January 2016 when the exchange rate depreciated to a level of
R17.91 against the US-Dollar from R16.35. Both these events negatively impacted the
financial markets which resulted in increased the levels of risk.
1.1.2.1 Regulatory Requirements

4
In South Africa, the South African Reserve Bank (SARB) is responsible for the regulation of
banks under the Banks Acts (1990). The law governs the public companies that take deposits
from the public. Under the wing of bank regulators is the National Credit Act (NCA) which
was introduced to protect the consumers with regards to all credit related agreements, ranging
from micro loans to home loans and from overdrafts to retail financing. The NCA informs
consumers on the information they need to know before executing credit agreements and
purchases. Moreover, there is Basel Committee on International Banking Supervision that is
based in Switzerland that governs how banks ought to operate internationally. Basel
Committee first established the Basel Framework in 1988 (referred to as BASEL I) and in 2004
issued the second publication called International Convergence of Capital Measurement and
Capital Standards also referred to as BASEL II. BASEL II emphasises on international
convergence of capital and improved disclosure with the objective of improving market
discipline and supervisory processes and procedures. Nevertheless, the Basel Committee in
2008 introduced BASEL III which will be fully operational in 2019, addressing more liquidity
requirements like liquidity coverage ratios (LCR) and net stable funding ratios (NSFR) which
BASEL I and II did not address (SAICA, 2016).
1.2 Research Problem
The global financial crisis ever-changing regulatory requirements and advancement in
technology exposes the banking system to enormous risks on a daily basis. These challenges
continually escalate on an unexpected rate and directly affect banks’ performance. However,
not much has been done to mitigate the effects of risk on banks’ overall performance. Given
that the biggest gap in the banking sector is financial risk management, after noting that
Financial risk management has not been analysed with an umbrella perspective to incorporate
all three major risks (credit, liquidity and market risk) has therefore greatly motivated this
study. Much of previous literature focused on credit risk with very little being done on liquidity
and market risk. Although Shen, Chen, and Chuan (2009) found that banks seldom faced
liquidity problems. they posited that there had been some significant concerns given the recent
global economic instability and global banking crisis. Thus, the interaction of financial risks
and bank profitability needed to be interrogated to ascertain the drivers of bank profitability. A
deeper understanding of dynamics of financial risk management is imperative as these three
major risks could affects the decision making in asset pricing of banking products which
ultimately affects the affordability of citizens especially in growing economies like that of

5
South Africa (Alper & Anbar, 2011). The banking sector health is very important in growing
economies as the banking system fuels the growth and development of the country, if this
sector is not financially protected against risk it could result in stagnant economies and poverty
deterioration (Al-Khouri, 2011).
1.3 Research Objectives
“This study aims:
1. To assess the effects of credit risk on profitability of South African banks.
2. To establish the correlation between liquidity risk and profitability using the South
African banking sector.
3. To establish the effect of market risk on banks’ profitability in the South African
context.”
1.4 Research Questions
The key questions guiding the research are:
1. What is the impact of credit risk on banks’ profitability in a South African context?
2. Does liquidity risk and profitability have any relationship with South African banks?
3. Does market risk have any impact on the profitability of South African Banks?
1.5 Justification of the study
What was discovered in the study of risk management is that much of the literature focused on
credit risk as opposed to overall financial risk (inclusive of liquidity and market risk). The
reason for this was due to the fact that much of the volatilities in banks were due to credit risk.
However, as discussed in the background, it was also noted that recent findings tinted on
macroeconomic factors such as interest rate, exchange rate, inflation and GDP. Even though
these factors relate more to market risk, they are also interrelated with liquidity risk.
Nonetheless, there have been some studies in South Africa on bank profitability. They only
looked at profitability as a standalone not in light of risk. This study therefore investigated the
overall financial risk and profitability from an umbrella perspective.
The study aimed at establishing the link between financial risk and profitability. The results
then assisted in providing recommendations to mitigate risk in terms of level of credit, access
to liquidity and the external macro-economy. The findings also provided insight on the most

6
successful strategies banks had been using to handle risk. This overall should then assist the
South African Reserve Bank (SARB) in formulating guidelines that will enhance risk
management in the banking sector. It is perceived that the academics will benefit from the
information of the study and contribute to the existing body of knowledge. The study also
provided background information to research organisations and scholars and identified gaps
useful for further research.
1.6 Scope of study
This study focused on financial risk management and profitability; mainly credit, liquidity and
market risk. The study used a South African context focusing on perceived top five banks in
terms of market share; namely FirstRand LTD, Barclays Africa LTD, Capitec Group Holdings
LTD, Standard Banks Group, and Nedbank LTD. The study was limited to these five banks
because they have been the greatest contributors to the South African economy within the
financial sector and another reason was the availability of their data consistent throughout the
period under review (2006-2015). This study employed the return on equity (ROE) across three
objectives as a profitability measure against risk indicators that relate to credit, liquidity and
market risk.
1.7 Chapter Summary
This chapter was the introduction of the envisaged study. It covered the background on
financial risk and profitability, the South African banking sector, technological advancement
and regulatory requirements. A further explanation of the research problem, research
objectives and questions were also provided. The chapter also summarised the scope, overview
of the methodology and organisation of the study.

7
CHAPTER TWO
LITERATURE REVIEW
2.0 Introduction
Scholarship surveys on both the theoretical and empirical fundamentals upon which the
concepts and views established in the current work are built are the foundation of this chapter.
The chapter had a clear focus and analysis of literature encompassing the views and
philosophies held by a number of scholars and academics as well as some governing authorities
on the contributing factors of financial risk management, the determining factors of bank
performance and the effects of financial risk management on bank performance, guidelines or
strategies and measures of financial risk. This chapter then formulated the foundation on which
the regression models developed in the subsequent chapter for empirical estimation were
founded on.
2.1 The Concept of Financial Risk Management
2.1.1 Credit Risk
Many researchers who have studied causes of bank difficulties highlighted a few factors
(Santomero, 1997). Problems pertaining to credit particularly flaws in strategies when
managing risk associated with credit were recognised as the significant contributor of banking
problems. Loans constituted a gigantic percentage of credit as they habitually accounted for 10
to 15 times of a banks’ equity (Kitwa, 1996). Thus, the banking business was possibly
confronted with problems where the quality of loans gradually weakened. This would further
escalate at each successive stage, from the approval of the loan to monitoring and supervisory
phases. This delinquent is exaggerated particularly when risk management strategies in relation
to policy stipulations and process concerning credit processing are non-existent and are weak.
Kitwa (1996) observed that these glitches were severe in developing countries.
Credit risk was defined by Chen and Pan (2012) as the magnitude of variation of worth in debt
mechanisms and products owing to fluctuations in the principal credit quality of debtors and
counterparties. Coyle (2000) defined credit risk as losses which arise when debtors default on
their loan payments whether intentionally or due to financial inability. Credit risk is the

8
vulnerability confronted by banks when borrowers default in abiding to their debt
responsibilities. This type of risk alternatively known as “counterparty risk,” when not properly
managed has the ability of driving the bank into great financial distress (Singh, 2013).
Management of this risk maximises the risk-adjusted rate of return of a bank through keeping
exposure within a tolerable limit (Kargi, 2011; Funso, Kolade, & Ojo, 2012).
Effectively managing credit risk is inextricably associated with the development of banking
technology, which enables for the rise in the rapidity of decision making and at the same time
decrease the charge associated with credit risk control. This notion has a proviso that a broad
base of partners and contractors are required (Lapteva, 2009). Credit risk has been found to be
one of significant risks attached to any bank by the nature of their activities. Effectively
managing this risk not only keeps the banking business a viable and profitable endeavour but
also add to the general stability of an economy as well as efficient resource allocation (Psillaki,
Tsolas, & Margaritis, 2010). Banks may suffer huge losses due to the inability of minority of
loan holders to pay their debts (Gestel & Baesens, 2008; Alshatti, 2015). The Basel Committee
also lends from this concept as from its early days of formulation.
Management of this risk is very crucial in the measurement and optimisation of banks
profitability (Aduda & Gitonga, 2011). The lasting sustainability of any financial institution
was therefore deemed dependent on efficient credit risk management that would guarantee loan
repayments by loan holders. This was serious in handling asymmetric information
complications as the consequence of it was a decrease in the degree of loan defaults (Basel,
2008). Powerful management structures forced risk comprises of launching an appropriate
credit risk environment. This put emphasis on working under a comprehensive credit issuing
practice, upholding a suitable credit management that comprised of supervising, processing
and sufficient measures over credit risk management (Hibbeln, 2010).
Executive officers of a bank must guarantee in the management of credit risk that all
procedures and rules are effectively communicated at all levels of the banking institution and
that everyone partaking in the management of credit risk fully comprehends what is expected
of them. Effective management systems for credit risk (comprising of identifying; measuring,
assessing and evaluating risk, as well as monitoring and regulating) are guidelines and tactics
which plainly summarise the framework and apportionment of a bank’s credit facilities and the
manner of management of credit portfolio; that addresses the origination of loans, appraisal,
supervision and collection (Basel, 2008). The task of scrutinising borrowers had extensively

9
been advocated by Derban, Binner and Mullineux (2005) among others.
The disproportionate information philosophy from debtors eventually turns out to be vital in
reaching efficient screening. Both qualitative and quantitative techniques of loan application
screening ought to be used. There is need for emphasising that debtors’ traits evaluated by
qualitative models can be converted to figures with the total of values associated with a limit.
Muraleedharan (2014) termed this procedure credit scoring. Greuning and Bratanovic (2009)
ascertain that if the scoring techniques give meaningful results, they may be used as useful
instruments in predicting the expected loan loss. Rengasamy (2014) and Kabnurkar (2014)
postulated that quantitative techniques which are more superior to others, mathematically
institute which elements are significant in the explanation of default risk as well as evaluation
of the relative degree of significance of the elements resulting in bettering the default risk
pricing. He also added that the technique enabled one to be additionally capable of screening
out bad applications and be in a place to accurately determine any reserve required to offset
predicted future losses.
2.1.2 Liquidity Risk
Rendering Bonfim and Kim (2012), the intricacy of the roles of banks gives increase to an
inherent risk deeply rooted in their core task; the intermediary role they play. Banks use a small
amount of resources that they own in granting credit and loans to firms (institutions) and
consumers and thus provide them with the liquidity to finance their investment and loans to
other customers. Most of the bank resources used to finance daily operations is typically related
with liabilities to third parties conventionally in the form of bank deposits. “The conversion of
these liquid liabilities (Bank Deposits) into risky liquid (illiquid) assets in the form of advances
capitalising on their maturity mismatch exposes them to liquidity risk (Jekinson, 2008). For a
bank to reduce the maturity gap between bank assets and liabilities (inherent illiquidity), banks
ought to find ways to effectively manage the liquidity risk by holding buffer of liquid assets
principal to the balance sheet structure. Nevertheless, apart from the great opportunity cost of
holding excessive cash or liquid assets as associated to the greater returns related with illiquid
(risky) assets, it establishes a level of ineffectiveness on the side of the bank management as it
confines the banks’ ability to deliver liquidity to businesses (institutions) and customers.
Henceforth, even though a bank has a good reason to hold a portion of liquid assets (e.g. cash,
short term assets or government bonds), according to Bonfim and Kim (2012) these buffers are
rarely ever adequate to entirely insure against a bank’s run (liquidity risk).

10
Gomes and Khan (2011) also did a study on methods of strengthening the management of
liquidity risk posited by the Basel Committee on Banking Supervision (Basel III). Gomes and
Khan made an important clarification between funding and market risk. They specified that
funding liquidity risk is the failure of a bank to produce coffers by converting assets held on
their balance sheet to meet liquidity requirements on short communication. The amount of cash
and other liquid assets that the bank holds are the key determinants of a bank’s liquidity
position, additionally by its financing structure and the kind of contingent obligations (liability)
that may come due. Market liquidity risk was further expounded as the capacity of the bank to
perform transactions in the financial market without substantial loss of value.
With regards to the theory of market liquidity risk, the Bank for International Settlements (BIS)
in (1999) deliberated on the numerous magnitudes by which significant movement in asset
prices could ascend and these comprised of; immediacy, breadth, depth and resilience. BIS
described immediacy as the speed with which transactions of a specific magnitude can be
achieved. “Breadth is the dissimilarity in the cost of an asset from mid-market costs and is for
the most part appraised by the bid-offer scatter. Depth alludes to either the size of transactions
that can be carried out without affecting prevailing market costs or the measure of requests on
the request books of market-creators. Resilience is the rate at which value changes that happen
amid the carrying out of a transaction come back to previous levels.” These factors thus go a
long way to affect market liquidity risk in diverse ways.
Market and financing liquidity dangers multiply one another as it is hard to sell when different
investors confront funding issues and it is hard to get financing when the security is difficult to
sell. Gomes and Khan (2011) again made the assertion that interactions between these two
kinds of liquidity risk could result in devastating liquidity consequences where poor conditions
for subsidizing liquidity prompt a reduction in market liquidity and thus add to a further decay
in financing liquidity. Brunnermeier (2009) gave a strong indication that without sufficient
management of liquidity-risk, banks that are faced with a liquidity stun regularly take part in
rash sale of assets, amass liquidity and decrease loaning to the real economy. These activities
thus result in the rise in probability of market interruptions and liquidity stuns confronted by
different organizations bringing about a drawn out weakening in market liquidity that severely
affects real financial development.
2.1.3 Market Risk

11
Research has shown that much of the variability in banks is associated with credit risk and
profitability is mostly associated with differences between banks (Gestel & Baesens, 2008).
However, literature has also shown that market risk (macroeconomic factors) also exert
remarkable impact on bank’s profitability and risk; in elucidating this, the currency exchange,
GDP, CPI, interest rate, and activities of the stock exchange are greatly associated with risk and
performance of banks (Warue, 2013; Kiganda, 2014; Sara & Muhammad, 2013). According to
Kiganda (2014), these results provide supporting data to three components of theoretical
analysis of the association that financial institutions have with the economy. The first one is
that the impact of actual credit increase on credit risk and profitability of a bank is in agreement
with the reasoning that complexities in managing the performance of a bank results in the
weakening of its standards governing loan policy in periods of accelerated growth. Second
proposition advocates that the complexities that banks have in their strategies to monitor
borrowers’ viability and the impact of collateral values that serves as security for loans in
signalling borrower credit worthiness play a crucial role in deciding on the supply of credit.
Finally, the outcomes agree well with what has been analysed theoretically, proposing that
cyclicality in specialists' inclinations for outfitting plays a vital role on risk and profitability of
a bank (Anum & Qodus, 2012).
2.2 Theoretical Framework on the Determinants of Financial Risk
2.2.1 Financial Intermediation Theory
Financial intermediation in the banking sense is the process by which the banks take money
from the depositors/savers (surplus parties) and transform it into different types of loans and
advances and give to borrowers (deficit parties) (Gurley & Shaw, 1960; Alin, 2009;
Greenbaum & Thakor, 2007). The relationship is depicted on the figure 2.1 below. However, in
the process of doing that, risk arises. Credit risk arise as deposits are transformed into loans,
liquidity risk arises because depositors’ money has been lent to third parties (Alin, 2009). The
market risk arises as banks would require liquidity in the financial market and find it exposed to
market risk factors like interest rate, exchange rate, and equity risk (Alin, 2009).

12
Figure 2.1 Financial Intermediary Process
Gurley and Shaw (1960) are the founding fathers of the financial intermediation theory. When
they found the theory, they based it on two theories; informational asymmetry and the agency
theory (Gurley & Shaw, 1960). The existence of the theory in principle was explained by the
following factors; regulation method, incomplete information and high transaction costs. The
theory further assumed that financial intermediaries existed because the markets were
imperfect. They posited that intermediaries would exist for as long as market imperfections
were in existence and the converse was true (Bolton and Freixas, 2000) as cited by Alin (2009).
However, the neoclassical model of a perfect market, the Arrow-Debreu world, assumed that
complete markets meaning there were no market imperfections (Allen & Santomero, The
theory of Financial intermediation, 1998).
According to their research, there were no individuals that could influence prices and everyone
in the market was a price taker. Borrowing and lending conditions were the same across all
parties concerned and thirdly, the costs of acquiring information, performing transactions and
those associated with insolvency were close to non-existent. Fourthly the economies of scale
and scope were absent and fifthly all market participants had ex ante and ex post immediate and
full data on all elements and occasions pertinent to the (future) value of the transacted financial
instruments (Anthony, 2012; Alin, 2009).
With the perfect market theory, the availability of perfect information (free of charge) would
allow investors and savers to easily connect to engage in business transactions. Since the theory

13
assumed perfect information, therefore market parties would have homogeneous expectation
and act rationally. However, because the perfect market is not a real but rather an ideal
situation, a financial intermediary would be required due to market imperfections (Iyare &
Moore, 2011). This is the basis of the informational asymmetry and agency theory.
Informational asymmetry can be categorised ex ante resulting in the challenge of extreme
selection; associated with producing the moral danger; or ex post leading to the necessity for
applying some expensive check and inspecting methods, hence, increasing risk (Masoud &
Hardaker, 2012).
The market imperfections generated by the information asymmetry lead to different forms of
transaction costs (Anthony, 2012). The emergence of financial intermediaries were to
eliminate transaction costs (Bencivenga, Valerie, Smith, Bruce, Star, & Ross, 1996). Hence,
according to the study that was done by Diamond and Dybvig (1983) they said banks were
considered to be in coalition with depositors to ensure that the individuals who set aside against
the dangers that could influence their condition of liquidity are protected. A year later another
study done by Diamond (1984) revealed that financial intermediaries (banks) as authorised
agents of the savers were able to achieve economies of scale. Thus, savers or depositors trusted
banks that they would invest their money on viable projects.
Moreover, the studies that related to information asymmetry analysed the bank and the
borrower and they mainly analysed the loan granting process and problems relating to adverse
selection and moral hazards (Gertler & Nobuhiro, 2010). Secondly, the financial
intermediation theory’s second area of concern was the transaction cost explicated by Benston
and Smith Jr. (1976) and later advanced by Fama (1980). This theory unlike the informational
asymmetry did not contradict with the assumptions of the perfect hypothesis. This
methodology depended on the contrasts between the advancements utilized by the member.
Along these lines, intermediaries were seen just like a coalition of individual banks or indebted
individuals who misused the economies of scale at the level of exchange advances
(Brunnermeier, Markus, & Yuliy, 2014). The idea of exchange cost did not contain only the
expenses with respect to the exchange costs for the sums or of foreign exchange but
additionally those associated with research, assessment and monitoring. In this way part of
monetary intermediaries would be to change the assets’ attributes such as due date and
liquidity. The alleged subjective change of money related resources, offers liquidity and open
doors for enhancement of arrangements (Brunnermeier, Markus, & Yuliy, 2014). The last

14
financial intermediary pillar is in view of the strategy for managing the banking sector and the
economy (Rampini & Viswanathan, 2015). This way of looking at things was produced by
Guttentag, and Lindsay (1968) and by Merton (1995). Intermediaries’ resolvability and
liquidity were found to be impacted by the approach taken in terms of regulatory instruments.
Diamond and Rajan (2000) and Zhiguo and Krishnamurthy (2012) revealed that the regulatory
measures around the capital of intermediaries impacted their well-being, the capacity for
renegotiating and the technique for recuperating debts.
2.2.2 Shiftability Theory
Allusion by Toby (2006) to the foundation of liquidity risk in the history of United States of
America banks with the Shiftability Theory of the banking system which explicated that the
liquidity of a bank hinges on its ability to move its assets (e.g. short term instruments) to
another institution at a reasonable price. When this theory was formulated sentiments in cases
where the huge number of investors would withdraw their investments, the banks would trade
investor portfolios so as to pay off the money acquired by the investors. One of the founding
fathers of this theory avowed that Liquidity is equivalent to Shiftability. Shiftability theory was
therefore the main tool that readdressed the traditional idea that the bank should finance its
operations through loans to a new doctrine that investments could also be used as a source of
liquidity.
However, the shortfall of this theory was that even though an individual bank might be able to
meet its liquidity requirements through the shifting of assets, the sentiments may not be
possible for all banks combined. This argument was due to the fact that not all banks had
adequate cash to shift to other banks. This caused a bit of a mismatch in the banking sector
during 1930s as all or most banks wanted to be sellers not buyers; because of this mismatch,
financial analyst said what was required were the external agents that would intermediate or
perhaps inject cash into the banking system so as to take a position of a buyer as all banks
wanted to be sellers (Toby, 2006). Unfortunately, the US Federal Reserve Bank could not
intervene resulting in the crashing of most banks (Toby, 2006). Nonetheless, this study will
utilise stock market development (market capitalisation) to proxy capital markets ability to
generate liquidity as shiftability assumed that focusing more on investing would improve
liquidity.
2.2.3 Financial Fragility Structure and Crowding-out of deposit Theory

15
Furthermore, academics and researchers have been arguing on two opposing views on bank
capital and creation of liquidity. From the first perspective, bank capital has a tendency to
hinder creation of liquidity through two different impacts: the financial delicacy structure and
deposits crowding-out. The financial fragility structure assumes that capital ratios have to be
kept lower so as to improve creation of liquidity (Diamond and Rajan, 2001). As a result
greater capital ratios force out deposits and in so doing reduce creation of liquidity (Archarya &
Viswanathan, 2010; Gorton & Winton, 2000). In layman’s terms, the effect caused by the
financial fragility structure is the consequence of the financial intermediation process. As
banks have access to information of the borrowers, they are able to assess the profitability of
their debtors (Gertler & Nobuhiro, 2010). Hence, agency problems arise as banks benefit from
asymmetry and the bank might extract rents from depositors’ money by calling for a larger
portion of the loan revenue.
In a case where depositors resist paying the higher costs, the bank simply holds back on its
monitoring attempts (Lin, Ma, & Xuan, 2011). The theory further assumes that the more the
depositors are aware of this information asymmetry the more they become reluctant to deposit
(Rengasamy, 2014). As a result, the bank has to seek for ways to win depositors’ trust by
espousing a delicate financial structure to a big portion of liquid deposits. An agreement with
investors alleviates the banks hoarding issue since contributors can keep running on the bank if
the bank threatens to hold back. As a result, financial fragility favours the creation of liquidity
as it permits the bank to pull together more resources in order to disburse more loans (Marozva,
2015). In the current research, ratio of loans and advances to total deposit will be employed to
proxy liquidity creation as presumed by the financial fragility structure theory.
On the contrary, more capital has a tendency to alleviate financial fragility and heightens a
bank’s power of bargain impeding the trustworthiness of its obligation to depositors, hence
higher capital ratios tend to reduce liquidity creation (Arbabian & Grayeli, 2009). Above and
beyond, Gorton and Winton (2000) in their study of liquidity provision, bank capital and macro
-economy demonstrated that a higher capital proportion could lessen creation of liquidity via
another effect deposits crowding out. They came to a conclusion that deposits were a much
more compelling liquidity fence for proxies than interests in bank equity. Depositor’s money is
entirely or partly insured and withdrawable at face value. Therefore, the greater the capital
share, the lesser the liquidity creation effect (Diamond & Rajan, 2001). The second view
assumes that more capital improves the capacity of a bank to generate liquidity. “Creation of
16
liquidity heightens the vulnerability of the bank to risk as losses escalate with the degree of
illiquid assets to gratify customers’ liquidity demands (Allen and Gale, 2004). Bank capital
allows the bank to take more risk” (Toutou & Xiaodong, 2011). Therefore from the second
perspective; the greater the capital ratio the greater the liquidity formation. These newly
formed theories linking capital and liquidity generation were empirically verified by Berger
and Bouwman (2009). This was done on data from a sample of commercial banks in the United
States covering the period from 1993 to 2003, and found that there was a positive relationship
for big banks and a negative one for small ones. Likewise, this study will employ a proportion
of equity to total asset to indirectly determine the levels of capital adequacy.
2.2.4 Market Power Hypothesis
In elucidating a profit generation association, a market-power (MP) hypothesis suggests that
MP is the top most parameter that results in a change in profitability (Claessen & Laeven,
2004). The relative market-power (RMP) premise asserts that only those corporations holding
a lion’s share in the market and well-varied product portfolio hold the price fixing authority for
their products and therefore are in the right spot to obtain profits that are above normal
(Guillen, Rengifo, & Ozsoz, 2014). For this situation, price fixing at a market-wide scale is not
seen, but is only done by a few market leaders. Firms holding a smaller chunk of the market
share are compelled to work as though under impeccable rivalry and are highly unlikely to
realise the same profits that are above normal. Kasman and Carvallo (2013) showed that banks
with market power are able to pass on to customers cost of raising capital buffers and
provisioning for risk. A better way of indirectly determining MP and market imperfections is,
therefore, firm-specific market share (market capitalisation).
2.2.5 Arbitrage Pricing Model
The Arbitrage pricing model advocates that the return on each stock of investment is dependent
partly on prevalent macroeconomic influences or factors and partly on noise-events that are
unique to a particular bank or entity; these factors are systematic market risk factors. According
to Brealey and Myers (2003)“for any individual stock, there are two sources of risk: the risk
that branches from the inescapable macroeconomic elements (e.g. exchange rate, interest rate,
GDP, inflation etc) which cannot be eradicated by diversification, and the risk arising from
possible events that are unique to the company. That is, diversification does not eliminate
unique risk and thus diversified investors can therefore ignore it when deciding whether to buy
or sell a stock since the risk premium is affected by factor or macroeconomic risk and not by

17
unique risk” (Brealey and Myers, 2003). This study will also incorporate interest rate,
exchange rate, GDP, inflation, and monetary supply to evaluate the market risk on bank
profitability.
2.2.6 Liquidity Preference Theory
This looks at interest rates from the perspective of supply and demand of money in the banking
sector. The theory was first established by Keynes (1936) where he specified that the demand
for money is expressed as a function of level of income and interest rate. MD=f(Y, r) where:
MD = money demanded, Y =Level of income and r = interest rate. This structure holds that the
loan fee is dictated by the connection of market activity of cash stock. According to Keynes
(1936) cash is requested for the most part for the accompanying intentions; as a medium of
exchange, for security reasons and speculative reasons. He additionally expressed that
financial specialists will dependably favour short-term securities to long-term securities. The
only incentive that can make investors choose long term securities is when they yield great
amounts in interest as compared to short-term ones. Along these lines, the trend in terms of
yield will dependably be upward inclining. This is dependent on the perception that, all factors
constant, individuals like to clutch money (liquidity) and that they will request a premium for
putting resources into non-liquid resources, for example, securities, stocks, and land.
The hypothesis proposed that the premium requested for separating with money increments as
the term for recovering the money increased. (Tonye & Priye, 2014). The transactions demand
for money relates to the need for cash and to meet current assets and business transactions
(Okpara, 2010). Auerbach (1988) postulated that the rate in increment of the premiumbacked
off with the expansion in the period for recovering the money. In money related terms, this
hypothesis is communicated as forward rates ought to surpass the future spot rates. Indaba
(2011) stated that the expectation about changes in bond prices or in current market interest
rates determines the speculative demand for money. According to Reilly and Norton (2006),
the hypothesis of liquidity inclination holds that long-term securities ought to give higher
returns than short-term commitments since financial specialists will give up a few respects put
resources into short maturity commitments to keep away from the higher price instability of
long maturity bonds. This study will employ lending interest rate to proxy effect of interest rate
on profitability which is affected by the demand of money (loans). According to Huang, J.,
Sun, Z., Yao, T., and Tong, Y. (2014) a measurable connection exists between liquidity
preference and loanable size amount, as both are affected by the level of interest rate.

18
2.3 Theoretical Literature on the Risk Indicators of Financial Risk
2.3.1 Credit Risk
Non-Performing Loans (NPLs) to Loans and Advances: Of all the risks that a bank faces,
credit risk is a significant factor with respect to the profitability of the bank due to the fact that a
large proportion of the profits realised by the bank comes in the form of interest paid by debtors
(Boahene, 2012). Nevertheless, the risk attached to interest rates is directly connected to credit
risk meaning that an increase in interest rates is concomitant with loan default (Nsobilla, 2015).
The same idea was also posed by Drehman, Sorensen, and Stringa, 2008 where they stated that
these two risks are inseparable. Thus, an increase in non-performing loans is
counterproductive. According to Ahmad and Ariff (2007), a non-performing loan is one that
has not been serviced for a period of more than three months. Owing to the growing welter of
non-performing credits, the Basel II Accord gave emphasis on sound management practices
that effectively dealt with credit risk. The result of complying with this Accord is improved
bank performance as a result of meaningful steps being taken in order to tackle credit risk.“
Ahmad and Ariff (2007) noticed that a lot of banks in markets like Asia-Pacific and Latin
America realised greater proportions of non-performing loans and noteworthy increase in
credit risk in seasons of banking and financial crunches. These phenomena saw a lot of banks in
Thailand and Indonesia shutting down. NPLs decreased the liquidity of banks, credit extension
and it backed off the development of the real sector with direct outcomes on the execution of
banks, the firm which was in default and the economy in general” (Alshatti, 2015).
Bank Size (Total Assets): the theory suggested that firm size had influence on a firm’s
performance and could be traced back from the conventional neoclassical philosophy and
economies of scale theory (Maja, 2012). Economies of scale occur in three forms; financial,
organisational and technical reasons. With financial reasons the firm may benefit from lower
interest rates and discount due to large quantities that it purchases (Mesut, 2013). With
organisational reasons the firm may benefit because of specialisation in certain areas of
expertise. And with technical reasons a firm can benefit through division of fixed costs because
of large number of units its purchases. In association with these assumptions, firm size was
anticipated to positively impact a firm’s profitability (Banchuenvijit, 2012). However, on the
contrary, some theory advocated about the negative relationship between firm size and
performance; diseconomies of scale. Diseconomies of scale may be due to managers pursuing

19
self-centred goals replacing firm’s goal of profit maximisation with managerial utility
maximisation function (Maja, 2012).
Total Loan and Advances to Total Deposit: Loan to deposits is net loans and leases divided
by total deposits. “The higher the loans relative to deposits, the lower the liquidity due to
greater amounts of cash disbursements to bank borrowers in relation to the amount of cash
receipts from bank depositors. Lower liquidity diminishes the flexibility of banks to analyse
their cash obligations when due but yields opportunities of higher profitability due to interest
revenues.
Leverage Ratio: Total debt to equity, a debt management measure, is the ratio of total debt
funding to equity funding (Boahene, 2012). Higher debt funding holds the potential for
increasing returns to shareholders (ROE) through lower requirements of equity investments.
This occurs as long as company returns from investment on assets exceed interest costs (Lane,
2009).”A firm’s financial structure has the ability to influence its ability to generate profit
(Lane, 2009). According to Dare and Sola (2010), firms have a choice to choose to be levered
or unlevered. Levered firms are firms that inject debt to finance its operations, while unlevered
firms do not employ debt on their capital structure, they finance themselves. Banks are highly
leveraged as they are mainly funded by the deposits (Kutsienyo, 2011). As a result, the firm
subsequently increases the cost of equity and financial risk as more debt is injected
(Westerfield & Ross, 2000).
2.3.2 Liquidity Risk
2.3.2.1 Bank Size (Log Total Assets)
The size of a bank, computed as the natural log of the sum of a bank’s assets increases its
liquidity levels as it impacts its ability to mobilise resources from different sources as well as
the cost associated with it (Bonaccorsi, 1992).“"Bunda and Desquilbet (2008) assimilated bank
size in the elements influencing banks’ liquidity risk from rising “economies with panel data
regression analysis. The outcome revealed that bank size had a positive effect on liquidity risk.
Shen, et al. (2009)”regarded the size of a bank as one of the key determining factor to liquidity
risk (“an endogenous determinant of bank profitability”) and the outcome was a non-linear
association between the size of a bank and the associated liquidity risk.” They discovered a
positive relationship between bank size and liquidity in a certain range, beyond which it was
negatively related. Adding the square of bank size to the list of variables ascertained these
20
findings. Other studies furthermore suggested that liquidity risk decreased as the size of the
bank increased (economies of scale) and that banks had the ability to obtain money cheaply
owing to implicit guarantee but beyond particular levels; they would begin to face liquidity risk
due to diseconomies of scale (Mesut, 2013). Also, associated with the conclusions from such
studies were the huge financial commitments associated with several branch openings and thus
the vulnerability to liquidity risk. It was thus expected that as the size of a bank increased, they
would obtain the intrinsicability to mobilise considerable deposits with ease and for that matter
were then able to grant more loans at any point in time coupled with the higher operating cost
associated with expansion (Lee, 2009). Big firms had more competitive power because of
market share compared to small firms (Jónsson, 2007).
2.3.2.2 Finance Gap Ratio
The risk of liquidity originating from potential failure of banks to provide for decrease in
liabilities or to finance growths on the side of assets on a financial statement is regarded as a
significant determining factor of profitability (Kosmidou, 2005). It is expected that banks with
a higher financing gap ratio expend most of their hard cash, trade liquid assets and moreover
rely greatly on non-deposit capital to make up for the gap; consequently, increasing the cost of
funding and hence reducing profitability (Shen, et al, 2009). In the case where there is a
competitive market for deposits, greater liquidity tends to be adversely related to interest
margin. Ismal (2011) stated that in order to anticipate liquidity gap or liquidity mismatch,
banks must frequently match assets and liabilities. Through this process the bank is able to
allocate correctly its assets based on maturity mismatch. However, liquidity management is a
dilemma if banks want to maintain high liquidity. This is because profits will be low and on the
contrary low liquidity results in high profits (Darmawan, 2014). Demirgüç-Kunt, and Huizinga
(1998) showed that banks a huge supply of liquid assets in government securities and in cash
have higher chances of receiving lower interest income compared to those with a meagre liquid
asset base. It is thus anticipated that financing gap would be positively related to ROE and
ROA (Saunders & Cornett, 2014).
2.3.2.3 Equity to Total Assets
In literature, this ratio, ETA for short, is normally used to proxy for capital and adequacy
strength which is one of the substantial intrinsic contributing factor to profitability. Banks
possessing higher capital-asset ratios are regarded as comparatively safer in case loss or
bankruptcy occurs, and the other way round (Shen, et al., 2009). Moreover, an appreciation in
21
the capital of a bank enhances the propensity of greater incomes resulting in reduced cost of
financial distress (Siaw, 2013). The lesser risk of being in financial distress thus results in an
increased creditworthiness of a bank and subsequently lessens the price of getting external
capital. Osuka and Richard (2013) hold that capital adequacy is a noteworthy driver of
profitability. Based on Vong and Chan (2009), ETA measures the ability of a financial
institution to survive bankruptcy and losses. Highly capitalised banks have the ability to reduce
funding costs which in turn increases profitability (Ghazouani & Moussa, 2013). Literature on
the link between profitability of a bank and capital maintains ETA as a discrete parameter of
profitability and consequently depicts a positive connection (Naceur & Kandil, 2009; Barth,
2003; & Kosmidou, 2005) . The implication is that banks that possess greater ETA will
therefore not be as reliant on externally sourced capital and consequently maximise their
profitability. Although a positive connection between capital sufficiency and ROA is expected,
it is expected that a negative link with the ROE will exist as banks with a competitive
advantage possess a minor fraction of equity. This entails that as the denominator gets smaller,
with a given level of profit after tax, the ROE rises (Alshatti, 2015).
2.3.2.4 Non-performing loans to total loans
The proportion of non-performing loans to loans is employed in the indirect determination of
credit risk (Nsobilla, 2015). Differences in credit risk will possibly mirror fluctuations in the
strength of the loan portfolio of a bank which in turn affects the profitability of the financial
institution (Cooper, Jackson, and Patterson, 2003). Acknowledging that differences in
profitability are mostly ascribed to differences in credit risk, Klapo and Ayeni (2012) assert
that a bank’s profitability is inversely related to its amplified exposure to credit risk. There is
therefore a great concern about not just the volume of loans made but rather the quality of them.
It is from this perspective that Miller and Noulas (1997) proposed that banks heavily exposed
to loans with high risk attached to them increase the build-up of loans that are not paid back and
thus decrease their profitability. Nevertheless, agreeing to the fact that high risk is
commensurate with high returns (in the form of income on interest), Maudos and Fernandez
(2004) indicated that the risk associated with a debtor defaulting on their loan payment (credit
risk) calls for the application of a risk premium by the bank as part of the interest rate attached
to the loan facility. This supports the argument that banks that take up more credit risk exhibit
higher interest margins. According to Arko (2012) a greater proportion of loans expended
become non-performing loans. The deteriorating health of non-performing loans is the number
one cause of distress in developed and developing economies (Mombo, 2013). Doliente (2005)

22
also specified that the pinch of credit risk is felt in the additional risk premium which is levied
by banks to recoup lost revenue from interest rates. Thus, it is predictable that NPL negatively
impacts ROA and ROE (Aduda & Gitonga, 2011).
2.3.2.5 Non-Deposits Dependence (NDD)
The reliance of a bank on external funding sources apart from that obtained from depositors
cannot be over-emphasised in assessing its probability of facing liquidity risk. Shen, et al.
(2009) regarded it as a contributing factor to liquidity risk and therefore they employed the
proportion of external funding to total liabilities to indirectly determine its dependence on non-
deposits. “Another study by Valeriu and Nimalathasan (2010) stated that external financing
(debt) was positively related to profitability ratios namely gross, operating and net profit ratios.
Banks heavily depending on wholesale funding and other money market tools instead of core
deposits to finance loans and other financial obligations have the likelihood of facing liquidity
risk compared to those that engage in the practice of the contrary.” Shen, et al. (2009)
cautioned that the larger the funds these banks would desire to appropriate from the money
market, the grander the liquidity risk they would face. It is thus obvious that non-deposit
dependence and liquidity risk are expected to be positively related. Harwood (2015) stated that
external funding is beneficial in that it increases tax free income and improves firms’ market
value.
2.3.2.6 Market Capitalisation to Total Assets
Pandey (1999) highlighted that capital markets fundamentally have two roles which are
liquidity and valuing securities. Liquidity can basically be explained as the capability of the
stock markets to turn assets into money and facilitating asset transfer with no loss in value at
each level of transaction. Capital markets play a role in turning securities liquid through
mediating transactions between numerous investors at significantly low to no cost. Under this
market type, prices are determined by demand and supply. All data on securities is published
openly thus allowing for fair determination of securities prices (Ali-Mustafa, Al-Qudah, &
Mahmoud, 2013). While the level of economic activities influences the stock market, the stock
market also influences the level of economic activities (Oluwatoyin, Gbadebo, & Odularu,
2009).
2.3.3 Market Risk
2.3.3.1 Inflation

23
Bank performance has been found to be a function of inflation. Generally speaking, loan
interests and bank income is high when the rate of inflation is also high. According to Hussain
and Farhana (2012), there is both a direct and indirect relationship of rising prices in all
industries of the economy. Bashir (2003) indicated that a bank’s profitability is positively
impacted by inflation that has been planned for whereas inflation that has not been forecasted
produces a negative effect. Correctly forecasting on future inflation rates gives banks the
opportunity to adjust their interest rates in accordance to what has been forecasted. The result is
that revenues increase at a rate faster than that of expenses ultimately resulting in higher profit
margins. This was also supported by research carried out by Bourke (1989).
The negative aspect of inflation comes in when operating expenses are increasing at a faster
rate than the inflation rate itself. Al-Timmi, Alwan, and Rahman (2011) discovered that the
impact of rising prices and interest negatively affect loan agencies and profitability. Khan,
Shahid, Bari, Anam, Shehzad, and Siddique (2014) stated that the costs of living and price
increase climb much quicker than wages and salaries, consequently consumers fail to repay
loans and mortgage bonds in time. Perry (1992) also spoke about the negative impact of
inflation where he stated that any unexpected increase in the rate of inflation resulted in cash
flow challenges for debtors leading to them prematurely terminating their loan agreements.
Likewise, Hoggarth, Milne, and Wood (1998) concluded that high and variable inflation has
the potential to pose challenges in terms of planning and loan negotiations.
2.3.3.2 Lending Interest Rates
This is the cost/fee a debtor pays for the exchange of borrowed capital/assets from a
lender/financial institutions (Crowley, 2007). “This can also be alternatively defined as rent of
money. Interest rates are central in a capitalistic economy and are generally stated as a
percentage per annum. As a price of money, interest rates reflect market data regarding
expected drop in the buying power of money or impending inflation (Ngugi, 2005). It is widely
believed that fluctuations of market interest rates exert significant influence on bank
performance. Based on the work by Samuelson (1945), under general conditions banks’ profits
usually increase with rising interest rates. He argued that the banking system as a whole is
immeasurably helped, rather than hindered by an increase in interest rates. A more accurate
measurement of how fluctuations in market interest rates affect banking firms largely depends
on the sensitivity of bank’s assets and liabilities (interest rates and volume) towards variations
in open market rates” (Mwangi, 2012). Stiglitz and Weiss (1981) advanced arguments against

24
high interest rates. They pointed out that an attempt to charge higher interest rate negatively
affected the quality of a bank’s loan because of two effects: incentive and adverse selection
effects. First, it raised the overall riskiness of the portfolio of assets. Rising interest rates
reduced the returns on all projects and made less risky projects unprofitable (incentive effect)
(Were & Wambua, 2013). This would make firms switch to more risky projects as interest rates
arose. Secondly, banks had to screen borrowers. This was because at a high borrowing interest
rate, borrowers would be less worried about the prospect of non-payment (adverse selection
effect). This implied that the rational profit maximising will practice credit rationing which
defeated the assumption generally made in financial liberalisation literature, that of interest rate
liberalisation eliminating credit rationing (Mang’eli, 2012).
2.3.3.3 Gross Domestic Product
This is the widely used macroeconomic indicator for determining a nation’s total economic
activity (Sara & Muhammad, 2013). The rate at which GDP grows reveals the status quo of the
economy. The expectation out of this is that GDP impacts the demand for loans. “The
economic conditions and the specific market environment would affect the bank’s mixture of
assets and liabilities. When GDP increases, banks may earn a higher profit by taking on higher
risk, which boosts profits (Khrawish, 2011). Sufian and Habibullah (2009) pointed out that the
GDP is anticipated to impact various factors associated with the demand and supply for loans
and deposits. A favourable economic climate has a positive influence on the supply and
demand of banking services. The rate at which an economy grows puts a limit on the rate of
growth of a bank and its profitability. This means that a well-managed bank makes reasonable
profits from loans and the sale of securities when there is a good growth rate of the economy.
Under these circumstances, profitability is also enhanced by an increase in demand for
financial transactions, which also puts a demand on loans to fuel such transactions (Ghazouani
& Moussa, 2013). A strong economic climate is also characterised by a great need for financial
services which in turn result in increased cash flows, profits and non-interest earnings for the
bank. Therefore, the growth rates of GDP and the profitability of the bank are positively related
(Siaw, 2013).
2.3.3.4 Exchange Rate
This has been adopted as the standard (or index) for measuring a country’s international
competitiveness based on its currency. A highly competitive currency has a lower index. It is
believed that volatile exchange rates have an effect on the cash flow that is expected by a
25
corporation. This makes those firms with an international presence underperform as their home
currency changes affecting costs and revenues (Amihud and Levich 1994). Diffu (2011) stated
that understanding the concept of foreign exchange is imperative as it impacts on the
companies’ finance costs and profitability. Lee and Niannian (2010) have shown that firms that
have robust currency risk management frameworks have higher firm performance.
2.3.3.5 Money Supply Change (M3)
Money “supply is the sum of currency outside banks and deposit liabilities of commercial
banks. Deposit liabilities are defined in narrower and broader senses as follows: narrow money
(Ml); broad money (M2); and extended broad money (M3).” The Reserve Bank has been
targeting monetary aggregate (broad money M3) in its policy decisions. Rotich (2007) posited
that at times of high inflation, or positive output, the Reserve Bank responded by reducing
money supply. Money supply (M3) is anticipated to have a positive impact on profitability of
commercial banks. Akomolafe (2014) opined that the stability of a country lies on the stable
financial sector and monetary policy. As the central bank increases money supply, banks are
able to extend loans to borrowers and the more profit they can then make (Solomon, 2012).
2.3.3.6 Market Capitalisation LOG (Stock)
It is imperative to recognise the degree of effect unto which the trade of a share in a stock
market has on the profitability and performance of a firm. Unlike a money market, a capital
market is one that specialises in raising medium to long-term capital. It is a system of
specialised financial institutions connecting traders and users of medium to long-term capital.
Its purpose is to provide resources for supporting industrial growth and in so doing increasing
profitability.
Okechukwu (2004) highlighted some of the ways in which a stock market can contribute to
economic growth. The first area of note was related to Funds transfer freedom. The view was
that all economies with colossal rising capital markets had loose laws on the exchange of assets
and with regards to remote speculation, on direct and portfolio venture. At the end of the day,
foreign investors were permitted to obtain and also repatriate capital and profits without
unnecessary limitations. This would advance development and subsequently the improvement
of the economy (Ali-Mustafa, Al-Qudah, & Mahmoud, 2013).
Another area was to do with the availability of infrastructure. Research showed that a
contemporary capital market flourished with the accessibility of accurate and dependable

26
information and data that was distributed to all involved parties. This would then guarantee
proficient communication (Okechukwu, 2004). Linked to this area was the allocation of
efficiency. The role of capital market would be to allocate scarce savings to productive
investments in a way that would benefit everyone (Oluwatoyin, Gbadebo, & Odularu,
2009).The last two areas involved pricing efficiency and capital efficiency. Capital markets
would ideally use prices as signals for efficient capital allocation and the demand and supply
forces would also play an imperative role in setting these prices. Efficient market hypothesis
assumed information efficiency processing. Hence, capital assets were correctly valued, at any
time, by the available information (Siaw, 2013). Capital efficiency meant limited resources
were efficiently allocated by the capital market to productive investments in order to profit
everyone (Ali-Mustafa, Al-Qudah, & Mahmoud, 2013).
2.4 Empirical Literature on the Determinants of Financial Risk
2.4.1 Credit Risk
In 2001, The Basel Committee defined Credit Risk as the likelihood of losing the loan in part or
in total as a result of credit events such as defaulting on loan repayments. Klapo and Ayeni
(2012) said the number one key risk of a bank is credit risk. The trend for financial institutions
to suffer financial distress is due to high exposures of bank to credit risk. “Thus, numerous
researches have been conducted to evaluate the effectiveness of credit risk management and the
notion that there is a positive correlation between credit risk management and bank
performance. Boahene, Dasa, and Agyei (2012) conducted a study on the bank performances
of selected large banks in Ghana to evaluate the relationship between credit risk management
and performance.” Panel data was used, extracting primary data from the six largest banks in
Ghana. In their findings, they discovered that a noteworthy association existed between risk
management and the performance of banks.
Njanike (2009) “in his study of credit risk management as a tool for survival in Zimbabwean
banks discovered that the failure to effectively managed credit risk contributed to a greater
extent on the banking crisis and demise in Zimbabwe in the early 2000’s. In his study, he used
questionnaires to conduct a survey using over six months’ worth of data. Klapo, et al. (2012)
did a study on five commercial banks in Nigeria. Panel data modeling was used to conduct the
study. At the end of their research they recommended that Nigerian banks should enhance their
capacity on credit analysis and in administering key loan risk indicators (e.g. ratio of non-
performing loans).”Again, another study was done in Nigeria by Kargi (2011) on credit risk

27
management and profitability of banks. In his study, he made use of financial ratios extracted
from annual financial reports and regress data using regression, descriptive and correlation
techniques. In his study, he showed that credit performance in banks improved following the
regulatory changes.
Furthermore, in the same year Al-Kouri (2011) also did a study on the specific risk factors on
the overall performance of banks. The study was done on 43 banks that operated in the Gulf
Cooperation Council countries. In his study, he used the fixed effect regression model narrowly
focusing on liquidity, capital and credit risk. He discovered that indeed these three risks are
correlated with performance of the bank when measured against ROA. Singh (2013) conducted
a study on Indian commercial banks to assess the connection between credit risk management
and bank performance. In his study, Singh revealed that for any bank to achieve financial
soundness it required effective risk management. Alshatti (2015) also did a study on the effect
of credit risk management on the performance of banks in Jordan. Again, panel regression
model was employed to examine the impact of credit risk management on bank performance.
He recommended that for banks to improve their profit they take into consideration the key risk
indicators affecting their credit books.
Kayode, Obamuyi, Owuputi, and Adeyefa“(2014) did a study investigating the influence of
credit risk on performance of banks in Nigeria. A panel estimation of six banks from the year
2000 to 2013 was done using the random effect model framework. Their results showed that
credit risk was undesirably and considerably connected to bank performance measured by
ROA. This suggests that an increased exposure to credit risk reduces bank profitability. They
also found that total loans positively and significantly impacted on bank performance. An
investigation by Hakim and Neaime (2001) which looked into the impact that liquidity, capital
and credit had on bank performance in Egypt and Lebanon showed that the banks were
managed efficiently and the regulations around them were effectively applied. Manzura and
Juanjuan (2009) noted that NPLs had an effect on profitability more than capital adequacy ratio
had and credit risk management affected profitability differently for all the banks studied.
Kithinji (2010) indicated that the larger part of the profits was affected by other parameters
other than credit and non performing loans. Aduda and Gitonga (2011) discovered that credit
risk management had a reasonable level of effect on profitability. Epure and Lafuente (2012)
looked at the performance of banks with respect to risk for the period from 1998 to 2007 in
Costa Rica. The study revealed that regulatory changes consequently resulted in performance
28
improvements and that the differences in performance between banks were because of risk and
non-performing loans. The study also showed that they had a negative effect on efficiency and
return on assets whereas the capital adequacy ratio positively impacts the net interest margin.”
Miller and Noulas (1997) established a negative association between profitability and credit
risk meaning that the greater the risk the greater the loss of value due to defaulting clients
resulting in difficulties in a bank’s ability to maximise profits.
Felix and Claudine (2008) studied the link between credit risk management and the
performance of a bank. They discovered that ROE and ROA were inversely correlated to the
proportion of non-performing loans to total loans in so doing resulting in a drop in profitability.
Aremu, Suberu, and Oke, (2010) also found that non-performing loans threatened profitability
in Nigerian banks. A study by Ahmad and Ariff (2007) which looked into determining factors
of credit risk in banks operating in emerging economies in comparison to those in developed
nations yielded the result that regulation played an important role for banks that had multiple
products and services in their portfolio. The study also revealed that the quality of management
was crucial in banking systems in third world economies that were loan-dominated. Another
noteworthy determining factor of potential credit risk is the rise in loan loss allowance. The
research additionally pointed out that credit risk in banks in developing economies was greater
compared to established markets. Indiael and Dickson (2013) did a study in Tanzania analysing
credit risk and performance and found a significant relationship. The credit risk pointers
portrayed a negative association between bank performance and credit risk which showed that
poor bank performance was due to higher credit risk. Ahmed, Takeda and Shawn (1998)
showed that loan loss allowance positively impacted NPLs. As a result, an increase in loan loss
allowance signified an escalation in credit risk and a weakening of loan quality. This in turn
would then cause an adverse affect on the performance of the bank.
2.4.2 Liquidity Risk
Liquidity performance is the ability to meet obligations as they fall due. For a banking
institution, it is very important to manage liquidity risk for the sustained viability of a bank.
Basel I (1988) and Basel II (2004) set out clear standards for credit and market risk. Basel II
goes further in taking an in-depth analysis of operational risk. However, little was covered with
regards to liquidity risk. In Basel III (2013), the Basel committee became more explicit on
liquidity requirements and the development of the liquidity coverage ratio. Gup and Kolari
(2005) motioned that for a bank to better manage its liquidity requirements, it should first

29
estimate its fund’s needs (deposit inflows and outflows) as well as loan variance. In their study,
they revealed that interest rate had a massive impact on deposit flows. From these studies, we
can deduce that high levels of interest rates lead to low levels of liquidity, whereas low levels of
interest rates lead to high levels of deposit inflows.
Some empirical studies revealed that liquidity risk impact on bank performance was diverse.
Molyneux and Thornton (1992) discovered a positive impact made by liquidity. On the flip
side, Bourke (1989) found there to be a negative effect. Poorman and Blake (2005) did a study
on liquidity risk. Their study, which addressed new ideas and metrics pertaining to liquidity
risk, revealed that it was not sufficient to use liquidity risk ratios to measure bank performance.
There were other factors that ought to be considered to obtain consistent and reliable results.
Decker (2000) reported that it was very difficult for a bank to obtain funds when the bank did
not have adequate liquidity probably when converting assets with an aim of not losing value.
Nevertheless, the more recent study that was done by Shen, Chen, Kao (2009) on bank liquidity
risk in Taiwan used twelve major commercial banks. Unbalanced panel data model was
employed in this study and they used financing gap as a dependent variable. They found that in
the overall bank risk, liquidity risk was endogenous in determining bank performance. They
also discovered that the main risk factors were external finance and components of liquid
assets, macro-economic factors, as well as supervisory and regulatory requirements.
Marozva (2015) did a study on connection between liquidity and performance of banks in
South Africa for the period from 1998 to 2014. “This investigation used the Auto Regressive
Distributed Lag (ARDL)-bound testing approach and the Ordinary Least Squares (OLS) to
study the relationship between net interest margin and liquidity. The study observed that a
significantly negative connection existed between net interest margin and funding liquidity
risk. However, there was an insignificant co-integrating association between the two measures
of liquidity and net interest margin.”
Tabari (2013) examined the influence of liquidity risk on bank performance using of panel data
related to banks in Iran for the period starting from 2003 to 2010. This research used two
groups of parameters only specific to a particular bank and macroeconomic variables and the
outcome was that the parameters; bank size, assets, GPD and inflation had a positive impact on
bank performance while liquidity and credit risk adversely affected its performance. The
empirical analysis of data based on 5066 banks in Europe over the period between 1998 and
2004. Lucchetta (2007) hypothesised that interest rates had an effect on the risk-taking ability

30
of a bank as well as its decision to maintain liquidity. The study concluded that across Europe,
the interest rate between banks had positive effects on the liquidity held by banks and their
resolve to be lenders in the interbank market. “The main parameter that influenced the
resolution to loan in the interbank market was the liquidity price which was dependent on the
demand and supply of liquidity and on the risk-free interest rate. The results also showed a
negative relationship between fiscal arrangement loan fee and the choice of a bank to hold
liquidity and to loan in the interbank market.”
Arbabian and Geraili (2009) “studied the influence of a bank’s capital base on the profitability
of business establishments accepted on Tehran’s stock market. They revealed a positive
connection between the proportion of short-term loans to the asset and profitability of the
company as well as between the proportion of total debt to the asset and profitability. However,
the proportion of long-term debt to assets was negatively related to profitability.”A study by
Chirwa (2003), the Malawian Commercial revealed that profitability and capital adequacy ratio
were negatively related. Abor (2005) looked into the same issue from a Ghanaian perspective
and found that the proportion of short-term debts to the asset was positively related to
profitability while on the other hand, the proportion of long-term debt to the asset was
negatively related to profitability.
A direct and positive link between asset management and profitability of a bank was found by
Havrylchyk and Emilia (2011). Accordingly, an efficient bank was expected to be more
profitable because of its ability to maximise on its net profit income. In their study of the bank-
specific and macroeconomic factors of liquidity risk between 57 United Kingdom local banks
within the period 1985 to 2003, using the proportion of liquid assets to total assets as a
yardstick for liquidity risk, Aspachs (2005) made some critical observations. “They indicated
that the likelihood of obtaining funding from the creditor of last resort, which ought to lessen
the motivation for stocking liquid assets had a positive relationship with liquidity risk. The
desire to achieve higher net interest margins which functions as a measure of opportunity cost
for holding cash had a positive effect on liquidity risk the same way loan growth does as higher
loan growth hints a surge in illiquid assets. They further indicated that despite the fact that bank
size had a non-linear (no definite) effect on liquidity risk, GDP growth as an indicator of
business cycle and short term interest rates which brings out the monetary policy effect both
positively impacted liquidity risk.”

31
Still, with the ratio for liquid assets to total assets as quantifying criteria for liquidity risk
(dependent variable), Bunda and Desquilbet (2008) were analysing the factors affecting the
risk of liquidity of banks from developing nations using panel data regression analysis. The
outcome revealed that bank size positively affected the risk of liquidity and the proportion of
equity to assets negatively affected liquidity risk. “Once more, the presence of prudential
regulation compelling banks to be liquid enough together with the share of public expenditure
on GDP as a way of determining the supply of relatively liquid assets and the inflation rate
which increases the susceptibility of banks to insignificant loan values provided to customers
all negatively affected liquidity risk. They also showed the relationship was a positive one
during the financial crisis which was likely a result of poor bank liquidity.” Considering
exchange rate regime factors, banks in states with extreme regimes were less likely to face
liquidity risk than in countries with intermediate regimes.
Rauch“(2010) in their study of 457 German state-owned savings banks from 1997 to 2006
analysed the determinants of their liquidity creation. According to the study, macro-economic
factors such as tight monetary policies had negative effects on bank liquidity creation through
their interest rates. The unemployment level was linked to high loan demands and used as an
alternative for the general condition of the economy; showed a negative effect on liquidity and
thus a positive effect on liquidity risk. The negative influence meant that the healthier the
economy, (the lower the unemployment rate) the more liquidity created by banks. They
concluded that only macro-economic factors had strong association with liquidity risk and that
bank-specific variables such as profitability and bank size, evaluated through the total number
of customers a bank has, did not have any effect on liquidity creation.
Moore (2010) studied the impact caused by a financial predicament on the liquidity in Latin
American and Caribbean banks over the period of 34 years spanning the period 1970 to 2004.
The results based on monthly observations revealed that liquidity risk was positively associated
with the business cycle in fifty percent of the nations under review and to the instability of the
cash (withdrawals) to deposits ratio; an indication that commercial banks had the propensity to
increase liquidity when the volatility of cash demand by customers arose and vice versa. The
results further indicated that the effect of money market interest rate as an indicator of the
opportunity cost of stocking liquidity is mixed. Countries with higher interest rates had a
negative relationship with holding liquidity; thus indicating a positive link with liquidity risk
and vice versa. “Consequently, the relationship between financial crisis and bank liquidity

32
varied across countries depending on where there was a lending boom before the crisis or
where banks were subject to large deposit withdrawals during the crisis making them more
vulnerable to liquidity risk. Others were more liquid during the crisis especially in countries
where the crises were accompanied by an exchange rate crisis that probably led banks to be
more conservative in their liquidity though this practice had the propensity of deepening the
crisis if companies could not access credit to finance their operations.”
2.4.3 Market Risk
Market “risk is the change in net asset value (NAV) due to change in underlying economic
factors such as interest rates, exchange rates, and equity and commodity prices” (McKinsey,
2012). Researchers and financial market analyst have different views on what can be accepted
as the satisfactory market risk measure (David, 1997). Furthermore, Mckinsey and Company
(2012) defined market risk as bank’s trading book losses due to changes in foreign exchange
rates, credit spreads, commodity prices, interest-rates and other economic factors whose values
were set in public market. David (1997) ascertained that banks used mathematical and
econometrical techniques to manage market risk. Chief among these models was value-at-risk
(VaR) which was developed by JP Morgan chase. For the past 19 years VaR had been used as
the standard measure of market risk.
Hamid (2005) “did a study on determinants of market risk on commercial banks in Malaysia. In
his study, he used pooling time series and cross section data and panel model was used as an
analysis instrument. He therefore suggested that the comprehensive market risk management
system should be a prerequisite as it contributed to the overall performance of a bank. Gizycki
(2001) also did a study on effects of macroeconomic conditions on bank risk and profitability
in Australia. The paper examined the variability of Australian banks credit risk during the
1990s. Marianne’s study made use of the regression analysis to analyse these variations of the
macroeconomic factors and their effect on banks profitability.
Warue (2013) did a study on the impact of macroeconomic and bank-specific factors on non
performing loans in commercial banks in Kenya.” In his study, he used panel data analysis.
Warue’s study discovered that the macroeconomic factors were important factors to look at
when evaluating bank performance as they also had a substantial effect on the overall bank
performance. Qinhua (2014) also did a study on the profitability of banks in China in light of
the macroeconomic factors in the decade after the World Trade Organisation (WTO)
Accession. Their paper made use of the panel data on 10 Chinese commercial banks during

33
1998-2012. The outcome of the study confirmed that macroeconomic factors had a substantial
impact to the earning power of Chinese commercial banks.
Feing-Xiao (2008) “investigated the effect of China's securities exchange on firm-level
investment by utilizing panel data set developed by the creator of all firms listed in China for
the time frame from 1992 to 1999 and by employing both fixed impacts and generalised
method of moments (GMM) strategies.” The outcomes demonstrated that securities exchange
valuation impacted investment choices, especially amid the stock exchange boom of 1996-
1999. In light of the present-esteem display, he found that securities exchange valuation in
China veered off altogether from hidden essentials. Thus the current securities exchange
extension in China was probably going to create a wasteful asset designation and cause
hindering consequences for the economy. Different reviews call attention to that securities
exchange improvement could have negative impacts by encouraging antagonistic hostile
takeovers“(Shleifer and Summers, 1988; Morck, Shleifer, and Vishny, 1990).”
Akomolafe, Danladi and Babalola (2015) “studied the effect of monetary policy on
performance of banks in Nigeria using micro-panel analysis. Interest rate and money supply
were used as representations for monetary policy, while profit before tax (PBT) represented
performance. The analysis employed fixed effect regression, pooled regression, and random
effect regression; although an investigation by Hausman showed that the most appropriate tool
to use was fixed effect regression. The outcome of the investigation was a positive association
between profits and monetary policies as indirectly determined by money supply and interest
rate. Nevertheless, there was no statistical significance on interest rate at 1% and 5%
significance levels. Okoye and Eze (2013) also carried out the same study and found out that
monetary policy rate positively affected the performance of commercial banks. However,
Enyioko (2012) showed that monetary policy had not improved the overall performances of
banks significantly.
Guru, Staunton, and Balashanmugam (2002) studied on a sample of seventeen commercial
banks during the 1986-1995 time periods in Malaysia. In this study, it was found that inflation
positively affected bank performance. Naceur (2003) investigated the effect of banks’
characteristics, final structure and macroeconomic indicators on banks’ profitability and net
interest margin in Tunisian Banking Industry for the 1983-2000 periods. It was also reported
that there was a relationship between high capital ratios and profitability and net interest
margins in banks that held them. Naceur (2003) also found out that inflation and growth rates

34
had negative effects and stock market development positively impacted profitability and net
interest margin.”
Ongore and Kusa (2013) argued that macroeconomic factors did not have a significant effect
on profitability. Athanasoglou (2006) reported mixed results with regards to the same factors.
Thus, it is hard to come to a conclusion of whether macroeconomic variables influence
profitability in Kenya. This review accordingly, looked to connect the uncertain gaps found in
literature on the impact of macroeconomic factors on profitability and the methodological
loophole of generalisation by determining the impact of macroeconomic variables on bank
productivity in Kenya with equity in core interest.
Ali, Farhan, and Zafar (2011) studied the macroeconomic and bank-specific factors of
profitability in a Pakistani context. ROE and ROA were used as profitability indicators.
Statistical techniques employed in this study were Pearson correlation and regression analysis.
The outcome was that ROA and ROE were positively linked to bank size, total deposits to total
assets ratio and operating income/total assets ratio, but then ROA had a negative relationship
with credit risk and capital. GDP was also found to be a significant factor that impacted on a
bank’s profitability.
A study was also done by Alper and Anbar (2011) on what factors impacted bank profitability
in Turkey from the year 2002 to 2010. Using panel data analysis, the outcome of their research
was that ROA was directly proportional to asset size, real interest rate and non-interest
income/assets while it was adversely affected by loans. They also found that a banks profit had
little or nothing to do with capital ratio, net interest margin, deposits, inflation and GDP. A
similar study using data from 2005 to 2009 analysed the contributing factors to banks’
profitability (Anum and Qudous, 2012).
Using regression analysis, the findings of their research were that internal variables such as
interest income, credit risk and loans substantially affected a bank’s profitability. They also
found out that profits were not a function of bank size, as well as other factors such as exports,
imports, discount rates and inflation. Safarli and Gumush (2012) carried out an investigation to
establish the external and internal factors influencing the banking sector in Azerbaijan. The
‘CAMELS’ model was employed to assess performance and Panel data regression analysis
was applied to establish the elements of profitability. The conclusion arrived at was that GDP
and inflation negatively impacted banks’ performance.

35
Husni, Walid and Ali (2011) investigated the factors impacting the Jordan Islamic banks from
the year 2005 to 2009. The statistical analysis model used in this study was the Multiple Linear
regression model. The outcome was that ROE had a noteworthy relationship with total
income/total asset and total equity/total asset. Fadzlan and Royfaizal (2008) looked into the
same issue in the context of Philippines, with data from the year 1990 to 2005, using a
Multivariate regression model. The outcome was that profitability was negatively associated
with credit risk, bank size and expenses management while conversely portraying a positive
connection with capitalisation, non-interest income and inflation. They also found that other
macroeconomic elements like market capitalisation and Money supply insignificantly
impacted banks performance.
Azam and Siddiqui (2012) looked into the profitability of foreign and locally owned banks in
Pakistan. It was discovered that domestic banks were less profitable in comparison to foreign
banks and that GDP and inflation had a greater impact on local banks than foreign-owned ones.
2.5 Determinants of Bank Profitability
Previous studies used three major profitability measures for banks which; ROA, ROE and
NIM. The ROA reflects the ability of a bank to make reasonable profit from its assets whereas
ROE specifies the returns realised by shareholders on their investment. NIM determines the
gap between the interests paid to investors versus that received from debtors. Numerous
investigations have been undertaken by many scholars from all over the world using the same
performance indicators and achieved different results. However, this study made use of ROE.
Goddard, Molyneux, and Wilson“(2004), carried out an investigation into the profitability of
banks in Europe (Spain Denmark, Germany, the UK, Italy and France) in the period from 1992
to 1998 using a cross-sectional and a dynamic panel analysis. Using ROE as the dependent
variable, the research used size, business diversification, capital adequacy, credit risk and
ownership type as well as dynamic effects as the explanatory variables. The outcome showed
that regardless of the increasing competition between banks, there was a noteworthy
persistence of atypical profits from year to year. It was also evident that the relationship
between size and profitability was relatively weak. The connection between the importance of
off-balance-sheet businesses (OBS) in a banks’ portfolio and profitability was positive for the
UK. The
relationship between the capital–assets ratio and profitability was positive though this finding

36
did not reflect the expected theoretical relationship between risk and return since a high CAR
(capital-asset ratio) signified that a bank was operating over-cautiously and ignoring
potentially profitable trading opportunities. However, it was revealed that high CAR takes care
of the cost of insurance against bankruptcy, signalling a higher future profitability and thus
creating a positive association between CAR and ROE. There was no systematic association
between type of ownership and profitability based on the pooled estimation across all
countries. In all the countries, cross-sectional estimation,” cooperative banks were less
profitable than commercial and savings banks, though the effect was only significant at the ten
per cent level.
2.6 Financial Risk Management Strategies
2.6.1 Credit Risk
2.6.1.1 Credit Risk Strategies
The strategies by Klapo and Ayeni (2012); strategies mentioned are not limited to the list;
Credit securitisation- where a buyer would purchase a contract from a seller and pays the seller
in return. Should the third party default the seller would compensate the buyer. Securitisation is
more of any insurance policy (Chen & Pan, 2012). Credit analysis - process by which
counterparties are screened so as to grant credit to the most qualifying applicants. Where a
bank can estimate the likelihood of default, hence, produce the expected credit loss. Moreover,
in this regard, they can work with the credit bureau to get information of a borrower (Aduda &
Gitonga, 2011). Compliance to Basel Accord- Basel accord is the institution that regulates
banking globally ensures soundness and stability in the banking system (Basel, 2008). Credit
derivatives- credit derivative in concept is almost the same as credit securitisation. It is an
instrument sold to a third party other than the lender to protect the loan portfolio should the
credit default take place. These instruments consist of forward contracts, options and swaps
(Klapo & Ayeni, 2012).
2.6.1.2 Measures in Credit Portfolio
The three listed measurement techniques in credit portfolios by Hebbln (2010) are briefly
explained below as follows: Probability of default (PD): According to Hibbeln (2010) PD is
defined in context of the Basel Framework. PD is the likelihood that a debtor defaults within 1
year. Default is defined according to either or both of the two following scenarios; The bank
assumes that a debtor is likely going to fail to pay their loan repayments in full, without

37
recourse by the bank to actions such as realising security (if held). No payment has been made
to the bank for at least 90 days since the last payment. Overdrafts also fall in this category when
they are past due. Loss given default
(LGD):“Gives the portion of loans and advances exposure that cannot be recuperated by the
bank should the debtors default. Moreover, obligor specific features the LGD can greatly hinge
on the contract-specific features such as the value of collateral and the superiority of the credit
obligation. There likewise exists a significant direct relation between the LGD and the
supposed recovery rate (RR). Both variables normally yield values in the range of 0% to 100%
but the loss given default can also be greater than 100% as workout costs arise when the bank
attempts to recuperate the remaining risk. Should the bank be unsuccessful to recuperate the
loan, the full loss amount can be greater than the defaulted exposure principal to an operational
LGD greater than 100% and to an RR smaller than 0%, correspondingly (Hibbeln, 2010).
Exposure at default (EAD): entails the present
outstanding which are previously drawn by the obligor. Moreover, the obligor might draw a
share of the commitments (COMM) foremost to an amplified EAD. This portion is termed the
credit conversion factor (CCF). In spite of the fact that the exposure at default is a random
variable, it is often associated with the expected gross exposure of the facility upon default of
the obligor (Basel, 2008; Hibbeln, 2010).
Using these three components, a bank can quantify the loss of a single
credit or of a credit portfolio (PF) that consists of n different loans” (Hibbeln, 2010).
2.6.2 Liquidity Risk
2.6.2.1 Liquidity Risk Strategies
The following are strategies by the Basel Committee on Banking Supervision (2008).
Strategies are not limited to the ones mentioned here.
Supervision of liquidity risk - banks ought to institute a stout liquidity risk management
framework for the management of sufficient liquidity. This helps in maintaining high quality
liquid assets which is also a tool for withstanding stress events (impairment of secured and
unsecured funding).
Articulation of liquidity risk tolerance - a bank has got numerous ways to express risk
tolerance; qualitative and quantitative. This is the core task of the senior management.
For a bank to properly project the assets cash flow, off-balance sheet items and
liabilities it should find noble methods to identify liquidity risk, measure, monitor and control.

38
This process also assists in knowing the triggers associated with off-balance sheet positions. A
bank should identify measure, monitor and control a bank’s liquidity risk positions for the four
major reasons (BCBS, 2008): Future “cash flows of assets and liabilities. Sources of contingent
liquidity demand and related triggers associated with off balance sheet positions, currencies in
which a bank is active, and lastly, correspondent custody and settlement activities.”
2.6.2.2 Liquidity Risk Measures
The Basel Committee on Banking Supervision (BCBS, 2008), “recommended two quantitative
metrics in analysing a bank’s liquidity risk at any point in time. These were Liquidity Coverage
Ratio (LCR) and the Net Stable Funding Ratio (NSFR), which were designed to fulfil two
discrete, yet complementary, goals. These two were to make certain that banks had a sufficient
supply of liquid assets, while at the same time implementing a rational and prudent maturity
mismatch. The goal of LCR was to
encourage short-term flexibility by guaranteeing that a bank had sufficient high-quality liquid
assets to endure a severe stress situation that goes on for a month. The Net Stable Funding
Ratio was developed to achieve the second objective of the Basel III liquidity standards:
promoting longer-term resilience by encouraging banks to fund their activities with more stable
” sources of funding. “That is, the NSFR was a longer-term structural ratio designed to address
liquidity mismatches and to encourage an increased dependence on medium and long-term
capital, therefore growing the average maturity of banks’ liabilities (BCBS, 2008). Liquidity
Coverage Ratio intended at growing banks flexibility to a critical month-long situation. The
Basel committee measure liquidity coverage ratio as the store of high-quality liquid assets to
total net cash out-flows over the next 30 calendar days ≥ 100%. Put differently, to achieve
funding requirements and withdrawals on provisional liabilities over the next 30 days, the LCR
required banks to hold a stock of unfettered high-quality liquid assets equal to or greater than
stressed net cash outflows. The prerequisite must be fulfilled unceasingly and conveyed to
managers on at any rate on a monthly basis, with an ideal lag time of two weeks or less”
(BCBS, 2008)
2.6.3 Market Risk
2.6.3.1 Market Risk Strategies
According to the Basel Committee there are three major market risks which are: Interest rate
risk which is defined as the risk of losing as a result from variations in interest rates. “As a

39
consequence of an incongruity of interest rates on its assets and liabilities and/or timing
dissimilarities in the maturity thereof, a bank may experience catastrophic loss or deterioration
in revenue owing to variations in interest rates. The second one is foreign exchange risk which
is defined as the possibility of losing as a result of the difference between presumed and
prevailing foreign currency rates in the situation where a bank has a long position or short
position on a net basis with respect to its assets and liabilities denominated in foreign
currencies (McKinsey, 2012). The third one is price change risk defined as the risk of losing as
a result of a decrease in the worth of assets owing to variations in the prices of securities.”
However, market risk in a broader sense is defined as systematic risk meaning it incorporates
other macroeconomic factors such as political risk, gross domestic and inflation. (David,
1997).
2.6.3.2 Guidelines and Procedure in Market Risk Management
Identification of Market Risks
Interest rate risk: The risk of the present estimation of assets and liabilities (taking into account
those assets and liabilities that do not appear on the balance sheet) being impacted by variations
in loan costs. The following risks should be considered as potential sources of interest rate risk:
yield curve risk, re-pricing risk, premise hazard, and optionality. Deposits, bonds, loans and
financial derivative products are examples of products that have interest risk associated with
them (Samuelson, 1945; Were & Wambua, 2013; Mwangi, 2012). Foreign exchange
risk: This is the risk associated with variations in the rate at which foreign exchange indices
change. This risk is found in items such as assets and liabilities that are valued in foreign
currencies, “foreign exchange transactions, derivatives of foreign exchange transactions
(forward contracts, futures, swaps, options, etc.), assets and liabilities whose cash flow
(redemption value, coupon rate, etc.) are determined in reference to foreign exchange rates”
(Levich, 1994; Diffu, 2011; Havrylchyk & Emilia, 2011). Stock risk: This is
the risk associated with fluctuations in stock prices on the stock market. See (Morck, Shleifer,
& Vishny, 1990; Al-Tamimi, Alwan, & Rahman, 2011; Feng-Xiao, 2008). Commodity risk:
This is the risk associated with changes in commodity prices. See (McKinsey, 2012) for
detailed definition.
Measurement of Market Risk

40
The accompanying are cases of estimation and investigation procedures with respect to market
risk (BIS, 2016). Firstly, the analysis of the balance of positions, “unrealised profits/losses and
realised profits/losses, gap analysis and static and dynamic simulation analysis based on the
replacing-based ladder and maturity ladder the sensitivity analysis (duration, BPV (basis point
value), GPS (grid point sensitivity), scenario analysis using static and dynamic simulation. And
value at risk (VaR) and earnings at risk” (EaR).
Monitoring of Market Risk
The risk management department is by regulated rules and policy. It monitors the market risk
that a bank faces and measures it up based on the prevailing conditions at the bank (external
environment – economy, markets etc; internal environment – risk profile, risk limit usage
status, etc) (Milanova, 2010). Monitoring of Compliance with risk limits; the status of
compliance is appropriately monitored to see if it is still within the risk limits (Andersen,
Bollerslev, Christoffersen, & Diebold, 2007). Reporting “to Board of Directors or equivalent;
The type (boundaries and flaws) and strength of the market risk determination and analysis
tools (techniques, assumptions, etc.)” (Andersen, Bollerslev, Christoffersen, & Diebold, 2007).
Feedback to Office (Trading, Banking) Divisions; feedback on results of risk measurement,
analysis and review in light of the status of market risk is provided by the Market Risk
Management Division (Andersen, Bollerslev, Christoffersen, & Diebold, 2007; Federal-
Reserve, 2016).
Control and Mitigation of Market Risk
Counter measures to Cases where unmanageable market risks exist; the market risk
management department makes available sufficient data to the board of directors or their
equivalent for use in making decisions for businesses affected by not properly managed risks or
when the risks is not small to be neglected. (Milanova, 2010). Counter measures “to cases
where risk limits are exceeded information is immediately provided to the board of directors or
their equivalent under the circumstance where the bank has surpassed the risk restrictions
(Milanova, 2010).
Review and Revision
Sophistication of market risk management: reviews are carried out in order to inform the bank
on the shortcomings and limits of the methods available for measuring and analysing market

41
risk. This also helps in the implementation of counter measures to balance out the shortcomings
identified. (Federal-Reserve, 2016; Milanova, 2010). Revision of market risk identification;
regular checks are to see if risks not under management are changing with the changing
business environment (Milanova, 2010).
2.7 Chapter Summary
The chapter provides a sound literature review that offers a survey of scholastic reviews
and views which offer background analysis into the research topic. As highlighted in the
research problem that not much has been done in covering financial risk as a topic with much of
previous studies focusing on credit risk, the research objectives were covered with that view in
mind. Given South Africa has very little that has been previously researched with regards to
risk management.
Nonetheless, the chapter begins by first explaining the concepts of credit, liquidity, and market
risk on how they are interrelated and how they impact overall financial risk. The definitions
offered thorough insight into different understanding of the three concepts and particularly
their relevance in light of the economical meaning with what South Africa has been going
through in the banking sector over the last five years with credit rating reviews as well as
recovering from numerous issues in the political and socio-economic environment. Upon the
clear elucidation of the definitions above, this was then followed by the introduction to the
theoretical frameworks. The first framework discussed in the chapter was Financial
Intermediation Theory which showed how financial intermediaries (banks) incur risk because
of the intermediary role they play in taking money from the surplus unit (depositors/savers) and
give it to deficit units (debtors/borrowers). The ideology of investing in financial markets to
acquire liquidity (e.g. Stock market) was further justified by the Shiftability Theory of
liquidity. The theory emphasised on the ability of a bank to shift its assets to the third party so
as to achieve required liquidity. The relationship
between capital ratios and liquidity was further explained by the Financial Fragility Structure
and Crowding-Out of Deposits framework.
The theory assumed that high capital ratios could be detrimental to the liquidity health of a
bank. Some theorists advocated that market power could influence profitability of a firm; the
Market Power Hypothesis illuminated the relationship between stock market development and
profitability. The
Arbitrage Pricing Theory explained the impact of macroeconomic factors on the financial

42
market and profitability of firms. The relationship between interest rate and money demand
was explained by the Liquidity Preference Theory. Level of loans demanded and deposit was
deemed dependent on the level of interest rate.
Moreover, the study reviewed the theoretical and empirical literature on the variables of credit,
liquidity, and market risk. Funso, Kolado and Ojo (2012) did a study on the effect of credit risk
in Nigeria and they found a negative relationship between non-performing loans and return on
asset. Non-performing loan were employed as a proxy for credit. The results were in agreement
with the expected relationship as advocated by Santomero (1997). Shen, et al. (2009) found
that the connection between liquidity risk and profitability was mixed based on the
geographical location, economic conditions and level of anticipated risk. This, given the South
African context would mean using the five local banks in the case study used, the reactionary
behaviour based on credit, liquidity and market risk affecting their profitability would not be
very predictable according to the script.
Again, market risk relationship with profitability was expected to be mixed. Qinhua
(2014) said the main variables in market risk, four variables being foreign exchange, interest
rate and equity risk could take either positive or negative signs. From these variables, we have
all four having a significant role in the economy of South Africa as well as impacting the
banking sector and financial performance of the aforementioned banks in the case study.
Empirical literature that related to credit risk of previous studies was useful in providing a
departure point for drawing parallel lines and contextualising with the South African banking
sector (Alshatti, 2015; Aduda & Gitonga, 2011; Boahene, 2012; Funso, Kolade, & Ojo, 2012).
Liquidity risk and profitability studies done by previous researchers show that liquidity
risk and profitability are related (Siaw, 2013; Irina Bunda, 2003; Jenkinson, 2008). Market risk
and the macroeconomic impact on profitability was also seen as a crucial relationship that
required scrutinisation given the happenings in the South African economy (Alper & Anbar,
2011; Sufian & Habibullah, 2009; Qinhua Pan, 2014).
Therefore, the study sought to fill the gap within the body of literature and risk
management practices by extending on the existing studies mentioned above. Strong links in
the relationship were established and agreed upon by different researchers which proved
relevance of risk to the strategic outlook that banks predominantly took in the countries
researched. The studies showed that banks in the first world countries where research was done
showed that a strong relationship existed between the three risks and financial performance.

43
Market risk, credit risk and liquidity risk are the three most influential risk factors that have had
significant influence on various banks in the world. The next chapter details the methodology
used in this study with particular focus on proving relevant quantitative proof pertaining to the
study at hand.

58
CHAPTER THREE
METHODOLOGY
3.0 Introduction
This chapter outlines the scope and the data sources used in this research. “Further
specification and justification of the econometric model assumed by the research while
providing strong reasons for the variables adopted in the models. The chapter thus sequentially
provided clear emphasis on the scope and sources of data for the study, the conceptual and
functional econometric models, the estimation procedures followed in estimating the
econometric models, the arguments for the choice and justification of the variables used in the
econometric models and finally the conclusion.”
3.1 Data Sources and Research Design
Data: “This study sought to establish the effect of financial risk management of South African
Commercial banks’ performance utilising annual data from 2006-2015. The time period was
motivated by the National Credit Act (NCA) (35 of 2005) which was designed to protect the
consumers in the credit market and enhance credit accessibility in the banking service. The
NCA aimed at addressing the grey areas in the South African credit market. This study used
annual reports of banks for bank-specific data; non-performing loans and advances, loans and
advances to total deposit, total assets, loan provision to classified loans, ROA, ROE, leverage
ratio, total equity to total assets, and net-interest expense to total assets obtained from
Bloomberg.” The macroeconomic data; GDP growth rate, inflation rate (CPI), Lending Interest
Rate, Exchange rate, and Annual Monetary Supply was obtained from the International
Monetary Fund (IMF) online. The sample ;used five Standard Bank Group, FirstRand Group,
Nedbank Group, Capitec Holdings LTD, and Barclays Africa.
Sample Justification: According to the South African Consumer Satisfaction Index (SACsi)
the above five banks were ranked top five according to market capitalisation. One of the
reasons as to why the study was only limited to the top five was that these banks had been
consistent in the last 10 years in releasing their data accordingly. This enabled us to avoid
unbalanced data sets which would cause more complications when performing statistical
analysis. Secondly, banks which were huge in terms of the stock market (market capitalisation)
were the ones that attracted the investors the most (Boahene, 2012).
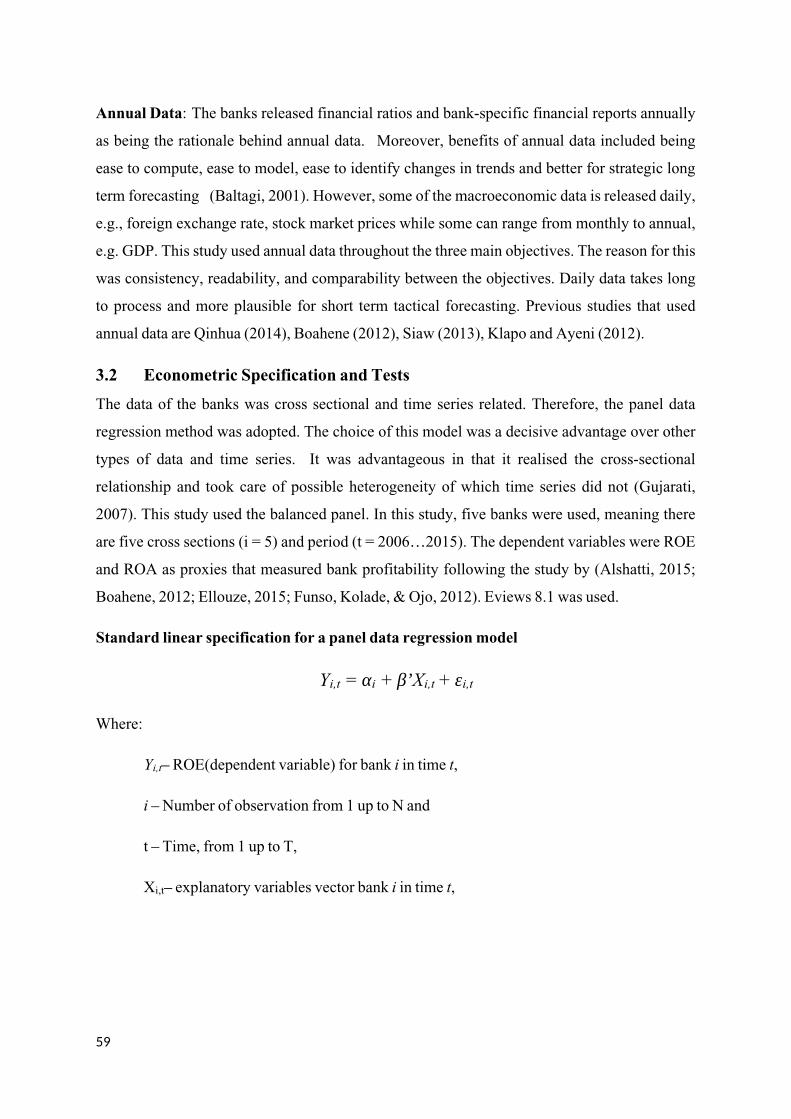
59
Annual Data: The banks released financial ratios and bank-specific financial reports annually
as being the rationale behind annual data. “Moreover, benefits of annual data included being
ease to compute, ease to model, ease to identify changes in trends and better for strategic long
term forecasting” (Baltagi, 2001). However, some of the macroeconomic data is released daily,
e.g., foreign exchange rate, stock market prices while some can range from monthly to annual,
e.g. GDP. This study used annual data throughout the three main objectives. The reason for this
was consistency, readability, and comparability between the objectives. Daily data takes long
to process and more plausible for short term tactical forecasting. Previous studies that used
annual data are Qinhua (2014), Boahene (2012), Siaw (2013), Klapo and Ayeni (2012).
3.2 Econometric Specification and Tests
The data of the banks was cross sectional and time series related. Therefore, the panel data
regression method was adopted. The choice of this model was a decisive advantage over other
types of data and time series.” It was advantageous in that it realised the cross-sectional
relationship and took care of possible heterogeneity of which time series did not (Gujarati,
2007). This study used the balanced panel. In this study, five banks were used, meaning there
are five cross sections (i = 5) and period (t = 2006…2015). The dependent variables were ROE
and ROA as proxies that measured bank profitability following the study by (Alshatti, 2015;
Boahene, 2012; Ellouze, 2015; Funso, Kolade, & Ojo, 2012). Eviews 8.1 was used.
Standard linear specification for a panel data regression model
Yi,t = αi + β’Xi,t + εi,t
Where:
Yi,t– ROE(dependent variable) for bank i in time t,
i – Number of observation from 1 up to N and
t – Time, from 1 up to T,
Xi,t– explanatory variables vector bank i in time t,

60
𝛼– constant,
𝛽’– coefficients representing the slope of variables, and
𝜀i– error term.
3.2.1 Developing Panel Data
1. Fixed Effect Model.
2. Random Effect Model.
The choice of these two models was based on the assumption that the banks were
heterogeneous, thus ignoring the pooled ordinary least squares (OLS) regression model that
denies the heterogeneity or individuality that may exist between these five banks (Podesta,
2000; Studenmund, 2011; Baltagi, Econometric Analysis of Panel Data, 2013).
Fixed Effect Model: “the fixed effect model allows heterogeneity or individuality
among five banks by allowing it to have its own intercept value. This model assumes that,
though the intercept value may differ across banks but it does not vary over time. It is time
invariant. The fixed effects model is an econometric model that characterises the observed
quantities in terms of dependent variables that are treated as if the measures were non-random.
This model centers on the hypothesis that the discrete specific effect is interconnected with the
explanatory variables (Baltagi, Econometric Analysis of Panel Data, 2013; Gujarati &
Sangeetha, 2007; Studenmund, 2011).

61
Random Effect Model: this model suggests that all five banks have the same mean
value of the intercept value and the cross-sectional variances in the intercept values of each
bank are replicated in an error term. This model assumes that there are no fixed effects, in that it
allows individual effects (Baltagi, Econometric Analysis of Panel Data, 2013; Gujarati &
Sangeetha, 2007).
Thus, the choice between the Fixed Effect and the Random Effect is pivotal around the
hypothesis one makes around the possible correlation between the cross-section specific or
individuals, error component denoted as (εi) and the regressors denoted by (X). If the
assumption is that the error component and regressors are uncorrelated the random Effect
Model would be suitable, however if error term and the regressors are correlated, the Fixed
Effect Model accepted.” Gujarati and Sangeetha (2007) lends us these helpful observations in
deciding as to which model to choose; If t is large and i is small, minute differences are seen in
the parameters estimated using the Random Effect and the Fixed Effect Models. Therefore the
decision is based on computational ease. However, based on this assumption the Fixed Effect
Model is superior. If the cross sections (i) are large and the time series (t) are small the
estimation results obtained by the two models can be significantly different. “With the Random
Effect Model [β1i = β1 + εi], where εi represents the cross-sectional random component, while
the Fixed Effect is treated as the fixed not random. In the latter instance, statistical inference is
conditional on the experiential number of cross-sections in the sample and this is fitting if it is
believed intensely that the individual or number of cross sections in the sample is not random
depictions from a sample that is large.” Therefore, this will make the Fixed Effect Model more
plausible in this situation.
Conversely, if the number of cross-sections in the sample is considered as random depictions,
then Random Effect Model is fitting, as in that instance statistical inference is unconditional. If
“the individual error term (εi) and one or more explanatory variables are correlated, then the
Random Effect Model estimators are biased, while those obtained from Fixed Effect are
unbiased.”After having estimated the random and the fixed effect models we had to decide
which model was good and fitted the data estimated perfectly that we could accept. This was
done by conducting Hausman tests. The Hausman test decided whether the estimated
coefficients, taken as a group, were significantly different from the two models; Fixed Effect
and Random Effect Model (Baltagi, Econometric Analysis of Panel Data, 2013). However, if
the fixed effect model produce desired result, it will be selected as the superior method as the

62
data for this study fit well with the properties of the fixed effect model.
3.2.1.1 Hausman Test:
“H0: Random Effect Model is Appropriate”
“H1: Fixed Effect Model is Appropriate”
Should the P-value be statistically significant 5% significance we would “reject the null
hypothesis and accept the alternative hypothesis” meaning we would use the fixed effect
model, otherwise the random effect model (Baltagi, Econometric Analysis of Panel Data,
2001; Baltagi, Econometric Analysis of Panel Data, 2013).
3.2.1.2 Descriptive Statistics Analysis
In this study, we also looked at the descriptive statistics for all the quantitative variables; the
mean, median, maximum and minimum performance of the banks. We also interpreted the
kurtosis and Jarque Bera tests for normality of distribution. The kurtosis measured the
peakness (or flatness) of a distribution. Normally distribution has the kurtosis of 3. A kurtosis
greater than 3 is indicative of a sharp peak with heavy tails closer to the mean (leptokurtic). A
kurtosis less than three is indicative of the opposite of a flat top (platykurtic). Jarque-Bera tests
whether the data has skewness and kurtosis matching normal distribution have an expected
skewness of 0 and excess kurtosis of 0 (which is the same a kurtosis of 3) (Studenmund, 2011;
Baltagi, Econometric Analysis of Panel Data, 2013).
3.2.1.3 Jarque-Bera
H0: There is normal distribution.
H1: Not normally distributed
Should the P-value be statistically significant 5% significance we would “reject the null
hypothesis and accept the alternative hypothesis that there is” non-normality (Baltagi,
Econometric Analysis of Panel Data, 2013; Studenmund, 2011).
3.2.1.3 Multicollinearity Test
It is always important to bias estimators when modelling data in econometrics. It is imperative
that multicollinearity is absent. Multicollinearity problem exists when two or more explanatory
variables are highly correlated (Baltagi, Econometric Analysis of Panel Data, 2013;
Studenmund, 2011). This may result in the instability of the coefficients and their standard

63
deviation may increase. It is tested using the correlation matrix. Correlation matrix is a good
tool to analyse pair wise correlation between variables, where the positive coefficients indicate
the positive relationship between explanatory variables and the negative coefficients represents
the negative relationship. Nonetheless, Studenmund (2011) argued that a correlation
coefficient greater than 0.8 indicated a serious problem of multicollinearity.
3.2.1.4 Testing the Suitability of the Model using F-Test
It is important to evaluate whether the explanatory variables used in the model affect the
dependent variable before we can even conclude that risk management has any effect on the
performance of the bank. In doing that, the F-statistic test was conducted and one of the
following hypotheses rejected.
H0: The model is not appropriate if the explanatory variables do not affect the
dependent variable.
H1: The model is appropriate if the explanatory variables do affect the dependent
variable.
Decision rule is as follows: We accept the null hypotheses if the F-statistic is greater than 5%
significance level or we accept the alternative if the F-statistic is less than 5% significance level
(Baltagi, Econometric Analysis of Panel Data, 2013; Studenmund, 2011).
3.3 Credit Risk Regression
Objective one: “To determine the effect of credit risk on the profitability “of South African
banks.
Many factors can be considered to evaluate credit risk on performance of South African Banks.
However, this study only used the risk and performance indicators mentioned below, following
the study by Funso, Kolade and Ojo (2012). Panel data was used in their study; thus, this paper
similarly adopted it. However, there was an addition of two variables from their original study
which was a log of total assets and leverage ratio as advocated by Boahene (2012) in his study
of credit risk in Ghanaian banks. Log of total assets measures bank size in relation of its assets
and theory suggests that the bigger banks benefits from economies of scale (Goddard, et al.,
2004).” Then the leverage ratio represents the capital structure of the firm and the motivation
for the addition of this variable is that theory suggests that banks with more debt tends to
perform better because of the shield on interest tax that huge debt carries to the business

64
(Boahene, 2012).
3.3.1 Risk Indicators (Independent variables)
I. Non-performing loans and advance (NPL/ LA)
II. LOG (Total Assets) (LOG(TA))
III. Loans and advances to total deposit (LA/ TD)
IV. Leverage Ratio (DEBT/EQUITY)
3.3.2 Performance Indicator (Dependent Variable)
I. Return on Equity (ROE)
“Therefore, the econometric equation for the model is specified as”
ROEi,t= αi +βi,t NPL/LA +βi,t Log(TA) +βi,t LA/TD +βi,t LR+ εi,t
Table3. 1Credit Risk Indicators
PARAMETER DEFINITION EXPECTEDSIGN PREVIOUS RESEARCH
ROE “Profitability = ROE(NetIncome to TotalEquity Fund) of Bank i intime t
NPL-LA “Non-Performing Loans/ Total Loans andAdvancesof Bank i in time t”
Negative/Positive
SIZE “The log of Total Assetsof Bank i in time t”
Positive/Negative
LA/TD “Loan andAdvances/total deposit ofBank i in time t”
Positive
LR Leverage Ratio=Debt/Equity of Bank i intime t
Positive
(Alshatti, 2015;Boahene, 2012; Ellouze,2015; Funso, Kolade, &Ojo, 2012; Kosmidou,2005; Singh, 2013)
E The error term
65
3.3.3 Relationship between Profitability and Risk Indicators
Non-Performing Loans to Loans and Advances: Theory suggests that non-performing
loan advances (NPL/ LA) are expected to have a negative impact with Return on Equity
(ROE). Non-performing loans are the loans that are categorised as bad performing loans due to
debtors failing to pay their obligations within 90 days’ period. Therefore, a bank regards these
loans as non-performing because there is a possibility of losing the whole loan amount
(Boahene, 2012; Klapo & Ayeni, 2012).
LOG (Total Assets): Again, theory suggests that the size of a bank denoted by LOG (TA) has
a positive impact on the performance of a bank. The gains linked to firm size, if handled well,
comprise of economies of scale, enhanced productivity of operation due to increased capacity
to bear the cost of acquiring better technologies, high bargaining power, capability to put
resources into innovative work (Goddard, Molyneux, & Wilson, 2004) as cited by (Siaw, 2013)
. However, the sign of firm size can also be negative representing diseconomies of scale. These
benefits could possibly contribute to decreased cost of daily operations and improved
profitability (Kosmidou, 2005). For example, bigger banks are well on the way to lure greater
and less expensive loans, on account of their high guarantee limit. Likewise, they have greater
chances of winning better contracts with prospects of high profits compared to minor banks
(Boahene, 2012).
Loan and Advances Ratio: Loans and advances are expected to have a positive effect on
ROE. This represents the capability of a bank to cover the withdrawals made by its customers.
However, if the ratio is too high, that might be detrimental to the bank because it may not have
enough liquidity to cover any unanticipated liquidity requirements and on the contrary, if the
ratio is too low, the bank may struggle to earn as it wishes to (Siaw, 2013; Boahene, 2012).”
Leverage Ratio: The leverage ratio is expected to have a positive sign. It is used to proxy
the capital structure of the firm. Banks that have huge amounts of debt are better capable to
improve their firm value or profitability compared to banks with less the reason being due to
the additional discipline and interest tax shield that is brought by high debt. This is in
agreement with what was found in earlier research in Ghana (Kargi, 2010) and correspondingly
advocated by the agency cost hypothesis. Thus, it is in line with the Modigliani and Miller’s
second proposal, which stipulates that a company’s worth is to a greater extent dependent on its
capital.

66
3.4 Liquidity Risk Regression
Objective two: To ascertain the relationship between liquidity risk and profitability in South
African banks
Again, there are many factors that can be used to investigate the effect of liquidity risk to bank
performance. However, this study will follow the study by Siaw (2013) in his study of liquidity
risk in Ghana. Siaw study applied the panel data technique to interpret the data. However, this
study replaced and added some variables due to irrelevance and unavailability of data.
3.4.1 Risk Indicators (Independent Variables)
I. Loans “and Advances to Total Deposit (LA/TD)
II. Non-Performing Loans to Total Loans”(NPL)
III. LOG(Total Assets) (LOG(TA))
IV. Market Capitalisation to Total Assets (MKT/TA)
V. Non-Deposit Dependence/External Finance (NDD/EFD)
VI. Inflation Growth Rate (INFL)
VII. Ratio of financing Gap to Total asset (RFG/ TA)
VIII. Equity to Total Assets (ETA)
3.4.2 Performance Indicator (Dependent Variable)
I. Return on Equity
“The econometric equation for the model is a follow:”
ROE= αi+ βi,t LA/TD +βi,t NPL + βi,t LOG(TA) + βi,tMKT/TA+ βi,tNDD/EFF+βi,t RFG/TA
+ βi,t ETA+ βi,t INFL + εit
Table 3.2 Liquidity Risk Indicators
VARIABLE DEFINITION EXPECTED SIGN
PREVIOUS RESEARCH
ROE “Profitability = ROE (Net Income to TotalEquity Fund) of Bank i in time t”
SIZE “Size = the log of Total Assets of Bank i intime t”
Negative orPositive
ETA Proportion of equity to “total assets. Aproxy of capital adequacy of Bank i in timet”
Negative orPositive
NPL

67
Ratio of non-performing loans to loans andadvances. Measure of credit risk of Bank iin time t
Negative orpositive
MKT/TA Ratio of market capitalisation to totalassets. Proxy for market power of Bank i intime t
Positive
NDD The ratio of non-deposits dependence tototal liabilities of Bank i in time t
Positive
GDPc GDP Growth Rate of Bank i in time t Positive
(Siaw, 2013;Shen, Chen, &Chuan, BankLiquidity Riskand Performance, 2009; Tabari,2013; IrinaBunda, 2003;Aspachs, 2005; Saunders &Cornett, 2014);
LA/TD “Ratio of loan and advances to total depositof Bank i in time t”
Positive
3.4.3 Relationship between Profitability and Risk Indicators
Loan “and Advances to total deposit: Loans and advances are expected to have a
positive effect on Return on equity. This represents a bank’s ability to cover the withdrawals
made by its customers” (Siaw, 2013).
Non-performing loans to Loans: The ratio of non-performing loans is used to proxy for
credit risk in bank performance, one of the main determining factors of bank profitability.
Variations in credit risk will possibly reflect changes in the well-being of a bank's loan
portfolio which successively affects the profitability of the financial institution. There is
therefore a great concern about not just the volume of loans made but rather the quality of it.
Financial institutions heavily vulnerable to high risk loans increase the accrual of unpaid loans
and thus decrease their profitability” (Klapo & Ayeni, 2012; Boahene, 2012)
Market Capitalisation to Total Assets: The relationship between a firm and its shares in
the stock market is expected to be positive. It is the measure of market power of a bank. It is
expected that the higher the level of capitalisation, the lesser the competition and the lesser the
vulnerability to liquidity risk. The opposite is true since banks would have to work extra hard in
order to mobilise appreciable levels of deposits when there is stiff competition in the industry
(Shen, 2009). Stock market development could also increase liquidity and provide a vehicle for
risk diversification. We therefore find that more liquidity and diversification reduce the risk
and the cost of investing in those long-term projects with higher returns and therefore could

68
result in efficient resource allocation by promoting more and better investment.”
Finance Gap Ratio: Theory suggests that finance gap ratio has positive/negative relationship
with ROA. A negative value indicates a lower amount as well as a lesser risk of liquidity and
vice versa. The expectation is that banks having high liquidity gaps will utilise their cash, sell
the reserved liquid assets and depend on external financing that excludes deposits (Siaw,
2013). This is the amount of money required by the bank to fund it future projects and
operations (Saunders and Cornett, 2006). It is usually acquired from venture capital loans,
angel investors, and loans from other financial institutions.
Equity to Asset: The proportion of equity to assets (ETA) is used to indirectly determine
the capital strength, or in modern language, capital adequacy. Theory suggests that banks
having high capital-asset proportions are regarded as comparatively safer when loss or
liquidation occurs. Moreover, it is assumed that a growth in capital possibly will increase
anticipated income by decreasing the anticipated costs of financial distress (Shen, 2009). A
bank’s credit worthiness is increased by reduced risk and accordingly decreases the cost of
funding. Thus, banks having higher equity to assets quotient have a reduced need for external
funding and hence greater profitability (Kosmidou, 2005).
Non-Deposit Dependence: Regarded as one of the sources of liquidity risk by Shen, et al.
(2009). Based on that, they indirectly determined non-deposit dependence using the ratio of
external funding to total liabilities. Banks heavily depending on general borrowings and other
money market instruments rather on core deposits to finance loans and other financial
obligations have the likelihood of facing liquidity risk compared to banks that engage in the
practice of the contrary. It is thus obvious that non-deposit dependence and bank liquidity risk
are expected to have a positive relationship.
3.5 Market Risk Regression
Objective three: “To establish the influence of market risk on banks profitability in South
Africa”
There are many macroeconomic factors that may affect the banking sector but this paper
focused on the ones listed below as they were the most significant. Moreover, this paper
followed Qinhua (2014) in the study of macroeconomic factors in China’s commercial banks
with panel data application. However, there was one variable that was added, exchange rate. “It
is a widely-held view that exchange rate volatility should affect corporate expected cash flows

69
and hence its performance by causing changes in the home currency denominated revenues
(costs) and the terms of competition for firms with international activities”(Levich, 1994).
3.5.1 Risk Indicators (Independent Variables)
The risk indicators are listed below as follows;
I. LOG(GDP)
II. Money Supply Growth Rate (M3)
III. Inflation (INFL) Growth Rate
IV. Exchange rate ((LOG)ZAR/USD (EX))
V. Lending Interest Rate
VI. Market Capitalisation/Total assets
3.5.2 Performance Indicator (Dependent Variable)
I. Return on Equity
Therefore, the econometric equation for the model is a follow:
ROE= αi + βi,t (LOG)GDP+ βi,t M3 + βi,t INFL+ βi,t ZAR/USD+ βi,t LIR+ βi,t
MKT/TAi,t+ εit
Table 3.3 Market Risk Indicators
VARIABLE DEFINITION EXPECTED SIGN
PREVIOUS RESEARCH
ROE Profitability = “Return onEquity (Net Income to TotalEquity Fund) of Bank i in timet”
GDP GDPC annual real GDP PositiveM3 M3= annual money supply
growth ratePositive
(LOG)INFL INFL annual consumer priceindex growth rate
Positive/Negative
(LOG)ZAR/USD South Africa to Americanannual exchange rate
Positive/Negative
(Kiganda, 2014;Illo, 2011;Kosmidou, 2005;Sara &Muhammad, 2013)
LIR Annual Lending Interest rate Positive/Negative

70
LOG(STOCK) Natural log of stock Positive/Negative
3.5.3 Relationship between Profitability and Risk Indicators
Gross Domestic Product: The most used macroeconomic factors that literature uses in
studying bank performance are GDP growth rate and annual percentage change of inflation
(INF). GDP is a measure of total economic activity of all products produced within the country
and it is the number one indicator of the country’s economic prospect. “Theory and economists
posit that an economy that is doing well motivates banks to loan more and allows them to set
higher interest bettering the quality of their assets and profitability in their banking books.
Previous studies found that economic growth had a positive effect on bank’s performance
(Siaw, 2013).
Inflation: Inflation is a proxy for consumer price index in the economy and it is also one of the
most watched indicators in macroeconomics. However, two distinctions in studying inflation
are imperative to look at: the first scenario is when inflation is appropriately anticipated and
interest rates are adjusted to allow revenues to rise faster than the costs of credit institutions, if
this theory holds it is therefore anticipated to positively impact the profitability of a bank. The
second scenario is when inflation is not appropriately anticipated and banking institutions are
not able to alter interest rates, in this case the inflation rate has the opposite effect in that the
costs of credit institutions exceed the income and as a result inflation will have a negative effect
on the bank profitability. Therefore, the expected sign is ambiguous it could be either positive
or negative” (Gizycki, 2001; Siaw, 2013)
Monetary Supply (M3): The South African Reserve Bank (SARB) are the controllers of
monetary supply in South Africa, in doing this they apply their quantitative monetary policies
and that has a great impact on the performance of a bank. If the SARB decides to increase the
money supply they simultaneously increase the funds in banks, thereby increase the interest
revenues of the banks. Furthermore, if the banks have more funds this causes an increase in
demand for bonds; that raises the price of bonds. “Higher bond prices lead to lower interest
rates, which stimulates consumption and increase investment, expand the scale of commercial
bank credit, thereby increasing the profitability of commercial banks” (Rotich, 2007).
Exchange Rate ZAR/USD: Theory suggests “that exchange rate volatility should affect
corporate expected cash flows and hence its performance by causing changes in the home

71
currency denominated revenues (costs) and the terms of competition for firms with
international activities (Levich, 1994). Ndungu (2000) asserts that exchange rate policy in
Kenya has undergone various shifts mostly driven to a large extent by the economic events
especially balance of payment crisis. Obadan (2006) put forward an argument that the
exchange rate plays a role in connecting the price system in different countries thus enabling
traders to compare price directly. Changes in exchange rate has a powerful effect on imports
and exports of the countries concerned through effects on relative prices of goods.” The
exchange rate becomes unstable the more the banks find it difficult to control credit and loan
books, hence increasing credit risk (Owoeye & Ogunmakin, 2013).
Lending Interest Rate: According to Saunder (1995), lending interest rates influence the
overall economic activity including the flow of goods, services and financial assets within the
economy and as well as the whole world. He points out that interest rates relate to the present
value to the future value of money. According to Samuelson (1945), under general conditions,
banks’ profits increase with rising interest rates. According to Were and Wambua, (2013)
lending interest rate on the revenue side operates via two channels. The first channel assumes
that the interest rate increase causes an increase in the income generated through new acquired
assets. Second, assumes that the effect hinges on the amount of loans and securities held.
Mang’eli (2012) interest rate spread affects the performance of commercial banks through far
reaching effect of lending rates interest rates.
LOG (Stock) Market Capitalisation: “There are both complementary effect substitution
effect between direct financing and indirect financing and therefore the relationship between
the banking sector and financial markets are uncertain. Development of financial markets
weakens consumers’ demands for banks, creating a competitive relationship between them.
Meanwhile, there is a certain complementary relationship between the banking sector and
financial markets because their mutual promotion roles in the development process” (Qinqua,
2014).
3.6 Chapter Summary
The study employs Panel Data for studying the relationship between profitability and
financial risk management. Data was collected from Bloomberg, IMF-IFS, and SARB. The
risk indicators across three objectives are estimated on Panel Data Fixed Effect Model based on
the Hausman Test. Data is over 10-year period 2006-2015. Eviews 8.1 was employed to
execute statistical data. All this was done in accordance with the research objectives in order to

72
have objective quantitative information upon which to draw conclusions. The chapter provides
a fitting foundation for chapter four which then elucidates the results and their meaning in
relation to the study for purposes of solving the research problem.
It is paramount in appreciating the different models and statistical tools defined above
and also their overall relevance and importance in light of the different research objectives
which serve to underline the link between risk and financial performance. Therefore the
chapter acutely delves into the factors such as the exchange rate, inflation and different
variables which cement the study hypotheses and assist in the conclusions made in the
following chapter. The next chapter presents data analysis findings tying in results obtained
based on the foundations built by the literature review in chapter two and methodology
presented in chapter three.
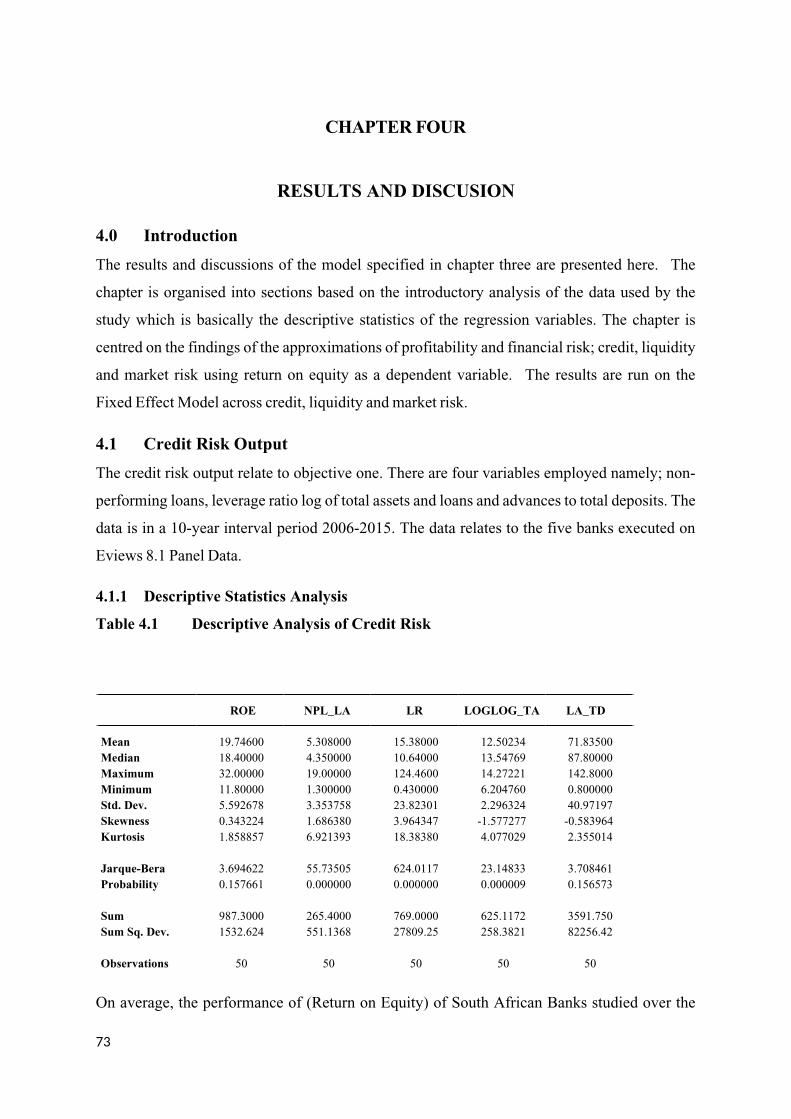
73
CHAPTER FOUR
RESULTS AND DISCUSION
4.0 Introduction
The results and discussions of the model specified in chapter three are presented here. “The
chapter is organised into sections based on the introductory analysis of the data used by the
study which is basically the descriptive statistics of the regression variables. The chapter is
centred on the findings of the approximations of profitability and financial risk; credit, liquidity
and market risk using return on equity as a dependent variable.” The results are run on the
Fixed Effect Model across credit, liquidity and market risk.
4.1 Credit Risk Output
The credit risk output relate to objective one. There are four variables employed namely; non-
performing loans, leverage ratio log of total assets and loans and advances to total deposits. The
data is in a 10-year interval period 2006-2015. The data relates to the five banks executed on
Eviews 8.1 Panel Data.
4.1.1 Descriptive Statistics Analysis
Table 4.1 Descriptive Analysis of Credit Risk
“ROE NPL_LA LR LOGLOG_TA LA_TD”
Mean 19.74600 5.308000 15.38000 12.50234 71.83500 Median 18.40000 4.350000 10.64000 13.54769 87.80000 Maximum 32.00000 19.00000 124.4600 14.27221 142.8000 Minimum 11.80000 1.300000 0.430000 6.204760 0.800000 Std. Dev. 5.592678 3.353758 23.82301 2.296324 40.97197 Skewness 0.343224 1.686380 3.964347 -1.577277 -0.583964 Kurtosis 1.858857 6.921393 18.38380 4.077029 2.355014
Jarque-Bera 3.694622 55.73505 624.0117 23.14833 3.708461 Probability 0.157661 0.000000 0.000000 0.000009 0.156573
Sum 987.3000 265.4000 769.0000 625.1172 3591.750 Sum Sq. Dev. 1532.624 551.1368 27809.25 258.3821 82256.42
Observations 50 50 50 50 50
On average, the performance of (Return on Equity) of South African Banks studied over the

74
period 2006-2015 was 19.75%, which was relatively low. “The performance was reasonable
given the fact that the South African economy was not performing well during these years. The
standard deviation was also small; with order of magnitude of 5.6%. Furthermore, the
minimum performance was 11.8% and the maximum performance was 32%. On average, the
performance of non-performing loans to gross loans and advance (NPL_LA) of South African
banks studied over the period under review was 5.31%. The maximum and minimum are 19%
and 1.3%, respectively, and the standard deviation was 3.5%. For its part, the leverage factor
performance (LR) of South African banks studied over the period 2006-2015 was 15.39%. The
maximum performance was 124.5% and the minimum was 0.43%. The standard deviation was
23.8%. The average performance of Loan to total deposit ratio was (LA_TD) of South African
banks in this same period was 71.8% and the attached standard deviation was 41%. The
maximum and minimum performances were 142.8% and 0.80% respectively. Moreover, the
performance of LOG (Total Assets) of South African banks was 12.5%. On its maximum
performance, it was 14.3%, while on its minimum performance it was 6.2%. The standard
deviation was 41%.
The Series show features of non-normality which is common in financial time series data. All
the series have a coefficient of kurtosis of either less than or greater than 3 against the standard
value of 3 for a normal distribution and a non-zero coefficient of excess kurtosis.”The series
was non-normally distributed; hence, Jarque-Bera was significant. The P-value of a Jarque-
Bera was 0% for NPL-LA, LR, and LOGLOG-TA indicating non-normal distribution; while
ROE and LA-TD indicated normal distribution (kurtosis) at 0.16% and 0.16%, respectively.
ROE, NPL-LA, LR had respective positive skewness 0.34%, 1.7%, 3.96%; while LOGLOG-
TA, and LA-TD were negatively skewed; -1.6% and -0.58% respectively. ROE, NPL-LA,
LOGLOG-TA and LA-TD peak distribution were 1.85%, 6.92%, 4.1%, and 2.4% respectively.
LR had the highest peak distribution.
4.1.2 Multicollinearity Test
Table 4.2 Correlation Matrix of Credit Risk
LA_TD LOGLOG_TA LR NPL_LA
LA_TD 1.000000 -0.180922 -0.034232 0.056164LOGLOG_TA -0.180922 1.000000 0.132032 -0.527387
LR -0.034232 0.132032 1.000000 -0.315649NPL_LA 0.056164 -0.527387 -0.315649 1.000000

75
Studenmund (2011) argued that a correlation coefficient greater than 0.8 indicated a serious
problem of multicollinearity. “The positive coefficients indicated the positive relationship
between explanatory variables and the negative coefficients represented the negative
relationship. Nonetheless, the correlation coefficient matrix showed that the problem of
multicollinearity between the explanatory variables did not exist. The maximum correlation
coefficient was found between NPL_LA and LOGLOG_TA (-0.527).” Nonetheless, the
researcher considers this percentage within the acceptable limits as it was less than 0.8.
4.1.3 Fixed and Random Effects Model
We ran both Random and Fixed effect models and did the Hausman test to decide as to which
model to choose. The choice of these two models is based on the assumption that the banks are
heterogeneous, thus, ignoring the pooled ordinary least squares (OLS) regression model that
denies the heterogeneity or individuality that may exist between these five banks (Podesta,
2000; Studenmund, 2011; Baltagi, Econometric Analysis of Panel Data, 2013).
Table 4.3 Fixed Effect Model Credit Risk
DEPENDENT VARIABLE: ROE
* ** *** 10%, 5% and 1% level of significance respectively.
“Variable Coefficient Std. Error t-Statistic Prob.”
C 28.46362*** 4.390752 6.482631 0.0000
LA_TD 0.031766** 0.015764 2.015050 0.0505
NPL_LA -1.033009*** 0.196884 -5.246779 0.0000
LR 0.081217*** 0.017297 4.695473 0.0000
LOGLOG_TA -0.541132* 0.302782 -1.787203 0.0813
Effects Specification
“Cross-section fixed (dummy variables)”
R-squared 0.815442 Mean dependent var 19.74600
Adjusted R-
squared 0.779431 S.D. dependent var 5.592678
S.E. of
regression 2.626590 Akaike info criterion 4.930799
Sum squared
resid 282.8580 Schwarz criterion 5.274963
Log likelihood -114.2700 Hannan-Quinn criter. 5.061859

76
F-statistic 22.64405 Durbin-Watson stat 1.945546
Prob(F-
statistic) 0.000000
To choose the most accurate method to interpret our data for objective results we employed
both FEM and REM and performed the Hausman test to decide the best approach.
Table 4.4 Random Effect Model Credit Risk
DEPENDENT VARIABLE: ROE
* ** *** 10%, 5% and 1% level of significance respectively.
Variable Coefficient Std. Error t-Statistic Prob.
C 47.70950*** 3.136574 15.21070 0.0000
LA_TD -0.041920*** 0.009325 -4.495410 0.0000
NPL_LA -0.282262** 0.137880 -2.047164 0.0465
LR 0.070429*** 0.016620 4.237645 0.0001
LOGLOG_TA -1.962601*** 0.195671 -10.03012 0.0000
Effects Specification
S.D. Rho
Cross-section random 1.76E-06 0.0000
Idiosyncratic random 2.626590 1.0000
Weighted Statistics
R-squared 0.609283 Mean dependent var 19.74600
Adjusted R-squared 0.574553 S.D. dependent var 5.592678
S.E. of regression 3.647897 Sum squared resid 598.8219
F-statistic 17.54324 Durbin-Watson stat 1.399496
Prob(F-statistic) 0.000000
Unweighted Statistics
R-squared 0.609283 Mean dependent var 19.74600
Sum squared resid 598.8219 Durbin-Watson stat 1.399496

77
Model Choice
In order to choose as to which model was superior between the above estimated models
(fixed/random effects models); the Hausman Test was conducted.
Hausman Test
H0: Random Effect Model is Appropriate
H1: Fixed Effect Model is Appropriate.
Table 4.5 Hausman Test Credit Risk
CORRELATED RANDOM EFFECTS: HAUSMAN TEST
Test Summary Chi-Sq. Statistic Chi-Sq. d.f. Prob.
Cross-section random 45.798649 4 0.0000
Cross-section random effects test comparisons:
Variable Fixed Random Var(Diff.) Prob.
LA_TD 0.031766 -0.041920 0.000162 0.0000
NPL_LA -1.033009 -0.282262 0.019753 0.0000
LR 0.081217 0.070429 0.000023 0.0244
LOGLOG_TA -0.541132 -1.962601 0.053390 0.0000
Results: the probability value, p-value was 0.0000 and 100% significant. Meaning we rejected
the null hypothesis that random effect model was suitable in favour of the alternative
hypothesis.
Consequently, the fixed effect model was then used to analyse the effect of credit risk
management on South African banks’ profitability.

78
Fixed Effect Model: The study shows that loans and “advances to total deposit, non-
performing loans to loans and advances, leverage ratio, and log of total asset were key credit
risk factors that influenced the performance of sampled banks in South Africa. Non-performing
loan to loans and advances, and leverage ratio were significant at 1%, loans and advances
significant at 5%, and logarithm of total assets was significant at 10% significant level.
Loans and Advances to Total Deposit: The results showed a positive and a significant
relationship between loans and advances to total deposit and return on equity, at 5%
significance level in accordance with the expected sign. The findings were in-line with the
findings by Funso, Kolado and Ojo (2012). Both loans and deposits were equally important in
the banking operation like two sides of the same coin. In general, the main source of income for
the banks was interest from loans and advances. The primary function of the bank was to lend
money to the borrowers in order to mobilise the interest revenue; this was the ultimate source
of revenue for the banks. Normally all the banks try to increase the amount of loans to the
borrowers for aggregate interest revenue in the financial statement. It is understandable that the
banks offer more loans the more it goes on to generate high revenue and profit, Abreu and
Mendes (2002).” This means a 1% increase in loans and advances to total deposit increased the
profitability of South African banks by (0.031766%).
Non-Performing Loans to Loans and Advances: The result showed a negative relationship
between non-performing loans to loans and advances and return on equity, at 1%significance
level in accordance with the expected sign. The findings were also in-line with the findings by
Funso, Kolado and Ojo (2012); and Mwangi (2012). This meant that as the number of non-
performing loans decreased the banks’ profitability increased; therefore a converse
relationship. Bank performance was dependent on the management practices pertaining to non-
performing loan. This signified that the best practices in non-performing loan management had
the prospect of improving the financial performance of that institution. Nonperforming loans
can bring down investors’ confidence in the banking sector, piling up unproductive economic
resources even though depreciations are taken care of, and impeding the resource allocation
process.” Nevertheless, our findings showed that with a 1% increase in non-performing loans
there was a (-1.033009%) in return on equity.
Leverage Ratio: The results showed that leverage ratio and ROE were positively related,
at1% significance level in accordance with the expected sign. Banks that had huge amounts of

79
debt were better capable to improve their firm value or profitability compared to banks with
less; the primary reason for this being the additional discipline and interest tax shield that was
brought by the high debt. This notion was in agreement with Modigliani and Miller’s (1958)
second proposition, which summarised that a company’s worth was to a greater extent heavily
dependent on its capital base. Nevertheless, our findings showed that a 1% increase in a banks’
leverage ratio, return on equity increased by (0.081217%). These findings were in-line with the
findings by Boahene (2012) and Lane (2009).
Log of Total Asset: The result showed a negative relationship between firm size (log of total
assets) and return on equity at a 10% significance level. The prior expectation was of a positive
relationship; indicating economies of scale. However, in this case South African banks seemed
to have experienced diseconomies of scale. The findings were in-line with the findings by
Becker (2010) and Mesut (2013). This meant, for a 1% increase in firm total assets, the banks’
profitability would decrease by (-0.541132%). Nevertheless, this would not be surprising
because much of the banks’ assets were loans which were risky assets. An increase in risky
asset may decrease profitability.
Suitability of the Research Model
H0: “The model is not appropriate; when the independent variable doesn’t affect the
dependent variable.”
H1: “The model is appropriate; when the independent variable affects the dependant
variable.”
The Decision Rule
Accept H0 If (Sig. F) > 5%
Accept H1 If (Sig. F) < 5%
From the “analysis output, the value of (Sig. F) was equal to (0.00000). Therefore, we accepted
the alternative hypothesis and the model used was appropriate; meaning credit risk
management had an effect on banks’ financial performance.
Divergence in the Dependent Variable

80
The divergence of the dependent variables was explained by the independent variable (R-
squared). R2 suggested that 83% of the total variation in ROE across the banking firms was
explained by joint variations in the four variables.”
4.2 Liquidity Risk Output
The liquidity risk outputs relate to objective two. “There were eight variables employed
namely; loans and advances to total deposit, non-performing loans to loans and advances, log
of total assets, market capitalisation to total assets, non-deposit dependence- external finance
dependence, equity to total assets, gross domestic product change and ratio of financing gap to
total assets.” The data was based on a 10-year interval period 2006-2015. The data was taken
from the five aforementioned banks, executed on Eviews 8.1 Panel Data.
4.2.1 Descriptive Statistics
Table 4.6 Descriptive Analysis of Liquidity Risk
ROE_ LA_TD_ NPL_LA_LOGLOG_
TA_MKT_CAP
_TA_ NDD_EFF_ ETA_AR_ GDPC RFG_TA_
Mean 19.74600 71.83500 5.308000 12.50234 0.261096 56.10403 15.38000 5.912000 -5.299400
Median 18.40000 87.80000 4.350000 13.54769 0.130450 57.65825 10.64000 5.515000 -5.260000
Maximum 32.00000 142.8000 19.00000 14.27221 1.144000 85.28620 124.4600 9.350000 51.10000
Minimum 11.80000 0.800000 1.300000 6.204760 0.065600 32.25810 0.430000 3.370000 -55.74000
Std. Dev. 5.592678 40.97197 3.353758 2.296324 0.267994 8.843178 23.82301 1.555712 19.19664
Skewness 0.343224 -0.583964 1.686380 -1.577277 1.843372 -0.243876 3.964347 0.734500 -0.453402
Kurtosis 1.858857 2.355014 6.921393 4.077029 5.489516 6.054090 18.38380 3.394919 5.304804
Jarque-Bera 3.694622 3.708461 55.73505 23.14833 41.22869 19.92785 624.0117 4.820670 12.78003 Probability 0.157661 0.156573 0.000000 0.000009 0.000000 0.000047 0.000000 0.089785 0.001678
Sum 987.3000 3591.750 265.4000 625.1172 13.05480 2805.201 769.0000 295.6000 -264.9700 Sum Sq. Dev. 1532.624 82256.42 551.1368 258.3821 3.519217 3831.888 27809.25 118.5918 18057.04
Observations 50 50 50 50 50 50 50 50 50
On average, “the performance of (Return on Equity) of South African Banks studied over time
the period 2006-2015 was 19.75%, the performance was relatively low. The performance was
reasonable given the fact that the South African economy was not performing well during these
81
years. The standard deviation was also small; it was of order 5.6%. Furthermore, the minimum
performance was 11.8% and the maximum performance was 32%.
On average the performance of non-performing loans to gross loans and advance (NPL_LA) of
South African banks studied over the period 2006-2015 was 5.31%. The maximum and
minimum performance figures were 19% and 1.3% respectively. The standard deviation was
3.5%. Loans and advances (LA/TD) registered 71.84% mean and the ratio was quite high. This
was reasonable as it indicated the core activities of the South African banks. The standard
deviation was also a high of 40.98%. The maximum and minimum performances were 142.8%
and 0.80% respectively.
The log of total assets (LOG(TA)) had a mean of 12.50%, with a small standard deviation of
2.30%. The maximum and minimum performances were 14.27% and 6.20% respectively.
Moreover, the market capitalisation to total assets (mkt-cap/ta) had a small mean of 0.26%
associated with the standard deviation of 0.28%. The maximum and minimum performances
were 1.14% and 0.66% respectively. On average the non-deposit dependence (NDD-EFF) was
56.10% with the standard deviation of 8.43%. The maximum and minimum performances were
85.29% and 32.29% respectively.
Moreover, the equity to total asset (ETA-AR) mean was 15.38% and standard deviation was
23.82%. The maximum and minimum performances were 124.46% and 0.43% respectively.
Furthermore, the GDP change (GDPC) mean was 5.91% and standard deviation was 23.82%.
The performances were 9.35% at maximum and 3.37% at minimum levels. Lastly, the ratio of
financing gap (RFG/TA) mean was -5.299% and the associated standard deviation was
19.20%. Maximum and minimum performances were 51.1% and -55.74% respectively.
Again, the series showed features of non-normality which was common in financial time series
data. All the series had a coefficient of kurtosis of either less than or greater than 3 against the
standard value of 3 for a normal distribution” and a non-zero coefficient of excess kurtosis. The
series was non-normally distributed; hence, Jarque-Bera was significant. ROE, NPL-LA, MKT
-CAP/TA, ETA-AR, and GDPC were positively skewed with 0.34%, 1.69%, 1.84%, 3.96%
and 0.73%, respectively; while LA-TD, LOGLOG-TA, NDD-EFF and RFG-TA were
negatively skewed with -0.58%, -1.58%, -0.24% and -0.45%.
Seven variables indicated normal peakness. ROE, LA-TD, NPL-LA, LOGLOG-TA, MKT-
CAP/TA, NDD-EFF, GDPC, and RFG-TA distribution (kurtosis) peak levels were 1.86%,

82
2.36%, 6.92%, 4.01%, 5.5%, 6.1%, 3.4%, and 5,3% respectively. Only ETA-AR indicated the
highest distribution peak level at 18.38%. The P-values of Jarque-Bera below 10% significance
level were NPL-LA, LOGLOG-TA, MKT-CAP/TA, NDD-EFF, ETA-AR, GDPC, and RFG-
TA indicating non-normal distribution; while ROE and LA-TD had values at 0.16% and 0.16%
respectively.
4.2.2 Multicollinearity Test.
Table 4.7 Correlation Matrix of Liquidity Risk
LA_TD_ NPL_LA_LOGLOG_T
A_MKT_CAP_
TA_ NDD_EFF_ ETA_AR_ GDPC RFG_TA_LA_TD_ 1.000000 0.056164 -0.180922 -0.107576 0.057149 -0.034232 0.043456 0.195516
NPL_LA_ 0.056164 1.000000 -0.527387 0.347693 -0.408206 -0.315649 -0.030036 0.042337LOGLOG_T
A_ -0.180922 -0.527387 1.000000 -0.449972 0.381048 0.132032 -0.085638 -0.256429MKT_CAP_
TA_ -0.107576 0.347693 -0.449972 1.000000 -0.497036 -0.205669 0.072879 0.047974NDD_EFF_ 0.057149 -0.408206 0.381048 -0.497036 1.000000 0.347849 0.035882 -0.015448ETA_AR_ -0.034232 -0.315649 0.132032 -0.205669 0.347849 1.000000 0.070921 0.061747
GDPC 0.043456 -0.030036 -0.085638 0.072879 0.035882 0.070921 1.000000 0.287150RFG_TA_ 0.195516 0.042337 -0.256429 0.047974 -0.015448 0.061747 0.287150 1.000000
Jolibert and Jourdan (2006) “argued that a correlation coefficient greater than 0.8 indicated a
serious problem of multicollinearity. The positive coefficients indicated the positive
relationship between explanatory variables and the negative coefficients represented the
negative relationship. Nonetheless, the correlation coefficient matrix showed that the problem
of multicollinearity between the explanatory variables did not exist. The highest correlation
coefficients were between mkt-cap/ta and ndd/eff (-0.49).”The researcher considered this to be
the acceptable limit.

83
4.2.3 Fixed Effects Model
This time we only ran the fixed effect model because of computational convenience that made
it the superior method over the random effect model.
Table 4.8 Fixed Effect Model Liquidity Risk
DEPENDENT VARIABLE: ROE
* ** *** 10%, 5% and 1% level of significance respectively
Variable Coefficient Std. Error t-Statistic Prob.
C -8.574752 6.778340 -1.265022 0.2138LA_TD_ 0.067297*** 0.017762 3.788828 0.0005
NPL_LA_ 1.538030*** 0.238607 6.445873 0.0000LOGLOG_TA_ -0.808413** 0.361682 -2.235147 0.0315MKT_CAP_TA_ -8.674975*** 2.575200 -3.368661 0.0018
NDD_EFF_ 0.200721*** 0.064436 3.115066 0.0035ETA_AR_ -0.003896 0.019578 -0.198999 0.8434
GDPC 0.110658 0.280681 0.394249 0.6957RFG_TA_ -0.029571 0.024902 -1.187488 0.2426
Effects Specification
Cross-section fixed (dummy variables)
R-squared 0.902239 Mean dependent var 4.063600Adjusted R-squared 0.870533 S.D. dependent var 8.064358S.E. of regression 2.901680 Akaike info criterion 5.187352Sum squared resid 311.5306 Schwarz criterion 5.684478Log likelihood -116.6838 Hannan-Quinn criter. 5.376660F-statistic 28.45621 Durbin-Watson stat 1.377623Prob(F-statistic) 0.000000
Loans and advances to total deposit, non-performing loans, market capitalisation, and non-
deposit dependence were significant at 1% significance level; logarithm of total assets
significant at 5% whereas, equity to total assets, GDP change, and ratio of finance gap were
highly insignificant.
Loans and Advances to Total Deposit: The results showed a significant and positive
relationship between loans and advances to total deposit and return on equity at 1%
significance level. The results were in accordance with the expected sign. The findings were in-

84
line with the findings by Syarif (2004) and Rengasamy (2014). The bank profit was based on
the interest charged against the deposits; it meant the profit was generated through the positive
difference between interest of loans and interest on deposits supported a study by Towpek”
(2006). Nonetheless, the findings indicated that a 1% increase in loans and advances resulted in
(0.06% increase) in return on equity.
Non-performing Loans to Loans and advances: The results showed a significant and
positive relationship between loans and advances and return on equity at 1% significance level;
these results were quite shocking as they were in conflict with the expected sign. However,
they were in-line with the findings by Boahene (2012). This implied that there was a positive
and a substantial connection between credit risk and profitability of a bank.”This could well be
interpreted as; for an increase in the risk of loan holders defaulting on their payments would
correspondingly result in a bank’s profitability going up. This would be so because banks were
able to charge exorbitant interest rates. Nonetheless, the implication was that with a 1%
increase in non-performing loans, return on equity increased by 1.54%.
Log of Total Assets: The result showed a significant and negative relationship between bank
size (LoglogTA) and return on equity at 5% significance level.”The results were in accordance
with the expected sign. However, they indicated the most unfortunate circumstance. It was
expected that as the firm increased in terms of assets, the profit increased as well. However, our
findings were in-line with the findings by Becker (2010) and Banchuenvijit (2012); indicating
diseconomies of scale. Nonetheless, this meant for a 1% increase in total assets, South African
Banks return on equity would decrease by (-0.81%).
Market Capitalisation: The results showed a significant and negative relationship
between market capitalisation and return in equity at 1% significance level. The findings were
in agreement with the expected sign; Goddard (2004), Thornton (1992) and Gul (2011) also
experienced a negative relationship with the market capitalisation. This meant that well
capitalised banks experienced negative returns. Nonetheless the results showed that for every
1% increase in market capitalisation, profitability (ROE) would decrease by (-8.68%).
Non-Deposit Dependence External Finance needed: The result showed a significant
positive relationship between non-deposit dependence and return on equity; in accordance with
the expected sign. The findings were in-line with the findings by Siaw (2013). A bank's
reliance on external sources of funding other than deposits or wholesale funding cannot be over

85
emphasised in assessing its probability Shen” (2009). This meant for every 1% increase in non-
deposit dependence, profitability would also increase and (ROE) would also increase by
(0.20%). The more the bank would borrow from the financial market the more it would
increase it profitability. This can be justified by proposition two of capital structure by
Modigliani and Miller, which stated that a company’s worth was dependent on its capital base;
firms with debt funding benefit from interest tax shield.
Equity to Total Assets: The results showed an insignificant and negative relationship
between equity to total asset and return on equity. This was in agreement with the expected
sign; also in-line with the suggestions by Siaw (2013). A positive relationship was anticipated
between Capital adequacy (ETA) and ROA while a negative relationship was expected with
the ROE since banks with a higher leverage have a smaller proportion of equity and thus as the
value of denominator falls, with a given level of profit after tax, the ROE would ideally
increase.” That is why the findings showed that for a 1% increase in equity to total assets
resulted in a decrease (-0.004%) in return on equity.
GDP Change: The results showed an insignificant but positive relationship with GDP
and return on equity. The results were in accordance with the expected sign. GDP was
anticipated to affect quite a number of factors associated with the demand and supply for loans
and deposit and “as its growth slowed down particularly during recessions. As a result, credit
quality would deteriorate and defaults increase thus reducing bank returns.” However, the
results were inconclusive as they were highly insignificant. GDP change was added in the
regression as a control variable.
Ratio of financing Gap: The results showed an insignificant and negative relationship
between ratio of financing gap and return on equity. The findings were in-line with the
expected sign. Kosmidou (2005) established a negative relationship between liquidity risk and
bank profitability. However, the results were inconclusive as they were highly insignificant.
Suitability of the Research Model
H0: “The model is not appropriate; when the independent variable does not affect the
dependent variable.”

86
H1: “The model is appropriate; when the independent variable affects the dependant
variable.”
The Decision Rule
Accept H0 If (Sig. F) > 5%
Accept H1 If (Sig. F) < 5%
From the analysis output, the value of (Sig. F) was equal to 1%. “Therefore, we accepted the
alternative hypothesis and the model used was appropriate; meaning liquidity risk management
had an effect on the banks’ financial performance.”
Divergence in the Dependent Variable
The divergence of the dependent variables was explained by the independent variable (R-
squared). R2 suggested that 90% of the total variation in ROE across the banking firms was
explained by joint variations in the eight variables.”
4.3 Market Risk Output
The market risk outputs relate to objective three. There were six variables employed namely;
market capitalisation to total assets (Log of stock), South African Rand to American Dollar
exchange rate, lending interest rate, monetary supply M3, inflation growth rate, and log of
gross domestic product. The data related to a 10-year interval period 2006-2015. Data was
obtained from the five aforementioned banks, executed on Eviews 8.1 Panel Data.
4.3.1 Descriptive Statistic Analysis
Table 4.9 Descriptive Analysis of Market Risk
ROEMKT_CAP_T
A_ZAR_USD__E
X_LN LIR M3 INFL GDPLN
Mean 19.74600 0.261096 2.141379 10.68900 11.24300 5.912000 5.810610 Median 18.40000 0.130450 2.104702 9.915000 10.58500 5.515000 5.801606 Maximum 32.00000 1.144000 2.474856 15.13000 20.70000 9.350000 6.032127 Minimum 11.80000 0.065600 1.805005 8.750000 1.440000 3.370000 5.604478 Std. Dev. 5.592678 0.267994 0.221367 2.026858 5.366335 1.555712 0.142878 Skewness 0.343224 1.843372 0.200955 1.019522 0.344066 0.734500 0.109225 Kurtosis 1.858857 5.489516 1.771186 2.869427 2.910160 3.394919 1.575015
Jarque-Bera 3.694622 41.22869 3.482325 8.697402 1.003329 4.820670 4.329796 Probability 0.157661 0.000000 0.175316 0.012924 0.605522 0.089785 0.114762

87
Sum 987.3000 13.05480 107.0689 534.4500 562.1500 295.6000 290.5305 Sum Sq. Dev. 1532.624 3.519217 2.401154 201.2994 1411.080 118.5918 1.000293
Observations 50 50 50 50 50 50 50
On average the performance of (Return on Equity) of South African Banks studied over time
the period 2006-2015 was 19.75% meaning the performance was relatively low. The
performance was still reasonable given the fact that the South African economy was not
performing well during these years. The standard deviation was also small; it was of order
5.6%. Furthermore, the minimum performance was 11.8% and the maximum performance was
32%. The market capitalisation on average was 0.26% with the standard deviation 0.27%;
minimum and maximum performances were 1.14% and 0.07% respectively. The South African
exchange rate to American Dollar (ZAR/USD) performance was on average 2.14% with a
standard deviation of 0.22%. The maximum and minimum performance was 2.48% and 1.81%,
respectively. The lending interest rate mean was 10.70% with the associated standard deviation
of 2.03%. LIR performed at 15.13% maximum and 8.75% at minimum. The monetary supply
(M3) performed at 11.24% on average and standard deviation of 5.4%. With regards to
maximum and minimum performance, the South African banks had 20.7% and 1.44%
respectively. The Inflation rate mean was 5.9% and the standard deviation was 1.55%. The
maximum performance was measured at 9.35% and the minimum at 3.37%. Lastly, GDP mean
was 5.82% and standard deviation was 0.15%. GDP at maximum and minimum performance
was 6.03% and 5.61% respectively.
Series “showed features of non-normality which were common in financial time series data.
All the series had a coefficient of kurtosis of either less than or greater than 3 against the
standard value of 3 for a normal distribution and a non-zero coefficient of excess kurtosis.” The
series was non-normally distributed; hence, Jarque-Bera was significant. All of the variables
were positively skewed. ROE, MKT-CAP/TA, ZAR-USD-EX-LN, LIR, M3, INFL and
GDPLN with the respective values 0.34%, 1.84%, 0.20%, 1.01%, 0.34%, 0.74%, and 0.1%.
The distribution peak levels (kurtosis) range at the same levels; ROE, ZAR-USD-EX-LN, LIR,
M3, INFL, and GDPLN with the respective values 1.85%, 1.8%, 2.9%, 2.9%, 3.4%, 1.6%.
Only MKT-CAP/TA peaked highest at 5.5%. The P-value of a Jarque-Bera less than 10%
significance level were MKT-CAP/TA, LIR, and INFL. They were indicative of non-normal
distribution; while ROE, ZAR-USD EX-LN, M3, and GDPLN indicated normal distribution
with the P-value greater than 10%.

88
4.3.2 Multicollinearity Test
Table 4.10 Correlation Matrix of Market Risk
MKT_CAP_TA
_
ZAR_USD__EX
_ GDP INFL LIR M3
MKT_CAP_TA
_ 1.000000 -0.048671 -0.014464 0.072879 0.063952 -0.018272
ZAR_USD__EX
_ -0.048671 1.000000 0.256577 -0.064523 -0.436437 -0.250066
GDP -0.014464 0.256577 1.000000 -0.335978 -0.753913 -0.392637
INFL 0.072879 -0.064523 -0.335978 1.000000 0.748998 0.115256
LIR 0.063952 -0.436437 -0.753913 0.748998 1.000000 0.282562
M3 -0.018272 -0.250066 -0.392637 0.115256 0.282562 1.000000
Jolibert and Jourdan (2006) “argued that a correlation coefficient greater than 0.8 indicated a
serious problem of multicollinearity. The positive coefficients indicated the positive
relationship between explanatory variables and the negative coefficients represented the
negative relationship.” Nonetheless, the correlation coefficient matrix indicated that the
problem of multicollinearity between the explanatory variables was absent. The highest
correlation coefficients were between lending interest rate and inflation (-0.75%). However,
the researcher considered this to be the acceptable limit.

89
4.3.3 Fixed Effects Model
Table 4.11 Fixed Effect Model of Market Risk
DEPENDENT VARIABLE: ROE
* ** *** 10%, 5% and 1% level of significance respectively.
Variable Coefficient Std. Error t-Statistic Prob.
C 124.2590* 65.35284 1.901355 0.0647
MKT_CAP_TA_ -19.33425*** 3.676689 -5.258604 0.0000
ZAR_USD__EX_LN -7.896891* 4.183557 -1.887602 0.0665
GDPLN -15.79361* 9.358652 -1.687595 0.0995
INFL 0.990666 0.930218 1.064983 0.2934
LIR -1.367513 1.072342 -1.275259 0.2098
M3 0.204040 0.139007 1.467842 0.1502
Effects Specification
Cross-section fixed (dummy variables)
R-squared 0.741467 Mean dependent var 4.063600
Adjusted R-squared 0.675176 S.D. dependent var 8.064358
S.E. of regression 4.596145 Akaike info criterion 6.079852
Sum squared resid 823.8574 Schwarz criterion 6.500497
Log likelihood -140.9963 Hannan-Quinn criter. 6.240036
F-statistic 11.18510 Durbin-Watson stat 0.941336
Prob(F-statistic) 0.000000
The fixed effect model indicated three significant variables. Market capitalisation was
significant at 1% significance level and ZAR/USD exchange rate and GDP were significant at
10% significance level while the other three variables were insignificant; inflation rate, lending
interest rate and monetary supply (M3).
Market Capitalisation: The results showed a significant and negative relationship
between the market capitalisation and return on equity at 1% significance level. The expected
sign could have been either positive or negative depending on the relative extent of the
complementary and substitutive effects between financial markets and the banking sector. The

90
findings were in-line with the findings by” (Shleifer & Summers, 1988; Qinhua Pan, 2014;
Morck, Shleifer, & Vishny, 1990). These results meant that for a 1% increase in market
capitalisation or stock market development, bank profitability (ROE) decreased by (-19.33%).
Exchange Rate (ZAR/USD): The results showed a negative relationship between
exchange rate and return on equity at 10% significance level. Again, the expected sign of the
exchange rate could have been either positive or negative. Our findings were in-line with the
findings by” (Owoeye & Ogunmakin, 2013; Chow, Lee, & Solt, 1997). The results meant
for a 1% increase in exchange rate, bank profitability (ROE) decreased by (-7.89). Negative
exchange rate implied a negative relationship with accounting, transactional, translation of
home dominated revenues of local banks to those of their trading partners.
GDP: The results show a negative relationship between GDP and return on equity, the
results were in conflict with the expected sign at 10% significance level. A 1% increase in
GDP, bank’s profitability (ROE) decreased by (-15.79%). Nonetheless, the findings were in
line with the findings by” (Sara & Muhammad, 2013; Khrawish, 2011). These results
meant; as the economy grew people required fewer activities with the banks.
Inflation Rate: The result showed an insignificant and positive relationship between
inflation rate and return on equity.”Therefore, these results were inconclusive. Our findings
were in agreement with the findings by Sara and Muhammad (2013).
LIR: The result showed an insignificant and negative relationship between lending interest
rate and return on equity. Therefore, these results were inconclusive. The findings were in
agreement with the assumption by Stiglitz and Weiss (1981).
M3:“The results showed a positive and insignificant relationship between monetary supply
and return on equity. Therefore, these results were inconclusive. However, the findings
were in line with the findings by” (Amassoma, PI, & Olaiya, 2011).
The results that were obtained from the market risk equation were a clear indication that it was
mostly the firm-specific and industry factors that determined a bank’s profitability. The Market
risk theory that assumed that it was the risk that could not be diversified away seemed to hold.

91
Suitability of the Research Model
H0: “The model is not appropriate; when the independent variable doesn’t affect the
dependent variable.”
H1: “The model is appropriate; when the independent variable affects the dependant
variable.”
The Decision Rule
Accept H0 If (Sig. F) > 5%
Accept H1 If (Sig. F) < 5%
From the analysis output, the value of (Sig. F) was equal to (0.00000). Therefore, we accepted
the alternative hypothesis and the model used was appropriate; meaning market risk had an
effect on banks’ financial performance.”
Divergence in the Dependent Variable
The divergence of the dependent variables was explained by the independent variable (R-
squared).” R2 suggested that 74% of the total variation in ROE “across the banking firms was
explained by joint variations in the six variables.”
4.4 Chapter Summary
The Panel Data Fixed Effect Model (FEM) based on the Hausman Test applied across
three objectives revealed that the credit risk indicators (independent variables) relating to
objective number one employed in this study were “non-performing loans to total loans and
advances, and loans and advances to total deposit which were the main variables. This was
done along with two control variables leverage ratio and log of total asset as proxy for firm
size. Everything regressed against return on equity (ROE) as profitability measure (dependent
variable).”Nonetheless, the findings indicated a significant relationship at 5% significance
level with non-performing loans, loans and advances and leverage ratio; while firm size (log
total assets) was significant at 10%. The liquidity risk indicators (independent variables)
relating to objective two employed were loans and advances to total deposit, non-performing
loans to total loans, LOG(total assets), market capitalisation to total assets, non-deposit

92
dependence/external finance, GDP growth rate, ratio of financing gap to total asset, equity to
total assets.
Control variables were non-performing loans, firm size (log total assets), Gross
Domestic Product growth, and ratio of financing gap. The findings indicated that loans and
advances to total deposit, non-performing loans, firm size (log total assets), market
capitalisation to total assets, and non-deposit dependence were significant at 5% significance
level; while equity to total assets, GDP growth and ratio of financing gap were insignificant.
The market risk indicators (independent variables) relating to objective three were employed
with three main variables; market capitalisation (log stock) to proxy equity risk, exchange rate
to proxy foreign exchange risk, and lending interest rate to proxy interest rate risk. Three
control variables were employed; inflation rate, GDP and monetary supply (M3).
The findings showed market capitalisation (log stock) and exchange rate to be
significant and we found an insignificant and negative relationship with lending interest rate.
With the control variables, the findings showed that an insignificant and positive relationship
existed between inflation rate and return on equity. We found a negative relationship between
GDP and return on equity. The results were in conflict with the expected sign. All three
objectives used return on equity as a profitability measure. The next chapter is the last chapter
on summary, conclusions and recommendations.

93
CHAPTER FIVE
SUMMARY, CONCLUSION AND RECOMMENDATIONS
5.0 Introduction
Presented here is a summary of the outcome of the research carried out. Conclusions were
drawn based on the objectives of the study and policy recommendations were also provided.
The chapter is organised into four sections: the summary, conclusions, recommendations and
limitations of the study.”
5.1 Summary
The aim of the study was to determine the impact of financial risk on the financial performance
of banks in South Africa; with regards to credit, liquidity and market risk. “The sample of the
study consisted of five banks listed on the Johannesburg Stock Exchange. Firm specific data
was extracted from Bloomberg and McGregor (BFA), and macroeconomic data was extracted
from the International Monetary Fund – International Financial Statistics and the South African
Reserve Bank; during the period 2006-2015. To assess the relationship between financial risk
indicators and bank profitability with regards to credit, liquidity and market risk; the Panel
Data fixed effect model was employed. In assessing the relationship between financial risk and
profitability the study used the Eviews 8.1.
”
Objective One: “To measure credit risk, two main variables were employed; ratio of non-
performing loans to loans and advances and the ratio of loans and advances to total deposit.
Control variables were leverage ratio to proxy banks’ capital structure and log of total assets to
proxy firm size. The ratio of non-performing loans was expected to be negatively related to
profitability, while the ratio of loans and advances was projected to be positively related to
profitability. With the control variables; leverage ratio was expected to be positively related to
profitability, while the firm size (log total assets) could either have a positive or negative
relationship depending whether the bank was experiencing economies or diseconomies of
scale.”
Nonetheless, the findings indicated a significant relationship at 1% significance level with non-
performing loans, and leverage ratio, loans and advances at 5% ; while firm size (log total

94
assets) was significant at 10%. The results indicated that a 1% increase in loans and advances to
total deposit increased the profitability of South African banks by (0.031766%), with a 1%
increase in non-performing loans there was a decrease of (-1.033009%) in return on equity, 1%
increase in a banks’ leverage ratio, return on equity increased by (0.081217%). These findings
were in-line with the findings by Boahene (2012) and Lane (2009). Furthermore, a 1% increase
in a firm’s total assets, the banks’ profitability decreased by (-0.541132%). All four variables
lived to their expected signs.
Objective Two: To measure liquidity risk four main variables were employed; loans and
advances to total deposits, non-deposit dependence, market capitalisation to total assets and
equity to total assets. Control variables used were non-performing loans, firm size (log total
assets), Gross Domestic Product growth, and the ratio of financing gap. “Loans and advances
and non-deposit dependence were expected to have a positive sign, while market capitalisation
to total assets and equity to total assets were expected to have either positive or negative signs.
With control variables; non-performing loans were expected to have a negative sign even
though some studies have obtained a positive relationship, firm size (log total assets) and ratio
of financing gap could have either a positive or a negative relationship and GDP growth was
expected to have a positive sign.”
However, the findings indicated that loans and advances to total deposit, non-performing loans,
market capitalisation to total assets, and non-deposit dependence were significant at 1%
significant level, firm size (log total assets) at 5% significance level; while equity to total
assets, GDP growth and ratio of financing gap were insignificant. The results indicated that a
1% increase in loans and advances resulted in an (0.06%) increase in return on equity; a 1%
increase in non-deposit dependence profitability increased, ROE increased by (0.20%), 1%
increase in market capitalisation, profitability (ROE) decreases by (-8.68%) and 1% increase in
equity to total assets resulted in a decrease (-0.004%) in return on equity. However, the equity
to total assets results were inconclusive. With the control variables, the findings showed that a
1% increase in non-performing loans, return on equity increased by 1.54%; 1% increase in total
assets, South African Banks return on equity decreases by (-0.81%) representing diseconomies
of scale, we found an insignificant and negative relationship between ratio of financing gap and
return on equity. The findings were in-line with the expected sign.
Kosmidou (2005) established a negative relationship between liquidity risk and bank
profitability. However, our results were inconclusive as they were highly insignificant. We

95
found an insignificant but positive relationship between GDP and return on equity. “The results
were in accordance with the expected sign. GDP was expected to influence many elements
associated with the demand and supply for loans and deposit and as its growth slowed down
particularly during recessions, credit quality deteriorated and defaults increased thus reducing
bank returns. However, our results are inconclusive as they were highly insignificant. GDP
change was added in a regression as a control variable.”
Objective Three: To measure market risk we employed three main variables; market
capitalisation to proxy equity risk, exchange rate to proxy foreign exchange risk, and lending
interest rate to proxy interest rate risk. Three control variables were employed; inflation rate,
GDP and monetary supply. All main variables could have either positive or negative
relationship with profitability; likewise, with the control variables. Only market capitalisation
is significant at 1%, and ZAR/USD and logarithm of GDP are significant at 10%. Inflation,
lending interest rate and money supply (M3) are insignificant. The findings with regards to
main variables showed that 1% increase in market capitalisation, bank profitability (ROE)
decreased by (-19.33%); 1% increase in exchange rate, bank profitability (ROE) decreased by (
-7.89%), and 1% increase in GDP bank profitability decreased (ROE) by (15.79%). We found
an insignificant and negative relationship between lending interest rate and return on equity.
Therefore, these results were inconclusive. “Moreover, with the control variables the findings
showed that an insignificant and positive relationship between inflation rate and return on
equity. We found a negative relationship between GDP and return on equity; the results were in
conflict with the expected sign. A 1% increase in GDP, bank’s profitability (ROE) decreased
by (-15.79%); and we found a positive and insignificant relationship between monetary supply
and return on equity. Therefore, these results were inconclusive. However, this was no surprise
as it was expected that firm specific factors had more influence than external factors on
profitability.
Robustness of the Study Model
This is the summary that entails “testing the -goodness of fit' of the model to the actual data and
the extent to which the explanatory variables explained the variation in the dependent variable.
”
Objective One: “The divergence of the dependent variables was explained by the independent
variable (R-squared). R2 suggested that 82% of the total variation in ROE across the banking

96
firms was explained by joint variations in the four variables while 18% were due to error term
or chance or unexplained. And the F-statistic with the value of 22.64 and the Prob(F-statistic)
0.00000 which was highly significant thus all the independent variables jointly influenced
ROE. The model therefore was considered robust or fitted well to the actual data.
Objective Two: “The divergence of the dependent variables was explained by the independent
variable (R-squared). R2 suggested that 90% of the total variation in ROE across the banking
firms was explained by joint variations in the eight variables, while 10% were due to error term
or chance or unexplained.” And the F-statistic with the value of 28.46 and the Prob(F-statistic)
0.00000 which was highly significant thus all the independent variables jointly influenced
ROE. Therefore the model was considered robust or fitted well to the actual data.
Objective Three: “The divergence of the dependent variables explained by the independent
variable (R-squared). R2 suggested that 74% of the total variation in ROE across the banking
firms was explained by joint variations in the four variables “while 26% were due to error term
or chance or unexplained. And the F-statistic with the value of 11.2 and the Prob(F-statistic)
0.00000 which was highly significant thus all the independent variables jointly influenced
ROE. Therefore the model was considered robust or fitted well to the actual data.
5.2 Conclusion
Referring to the study findings, the study established that R-squared of credit, liquidity and
market risk equations; 82%, 91%, and 74% respectively. This therefore meant that the
variations in the dependent variable (ROE) were explained by the independent variables. This
implied the strong explanatory power for the regressions. Therefore, we can accept the
hypothesis that assumes that credit, liquidity and market risk have a relationship with the
profitability (ROE). With respect to bank profitability measured by ROE, liquidity risk was
revealed to be a major determinant of bank profitability due to the highest R-squared.”
5.3 Policy Recommendation
Objective One: With regards to credit risk based on our conclusions, it is recommended
that banks in South Africa should enhance their capacity in credit analysis and loan
administration while the regulatory authorities (National Credit Regulatory, South African
Reserve Bank and Banking Association of South Africa) should pay more attention to banks’
compliance to relevant regulatory requirements by the Basel Committee on Banking
Supervision. Just like any other type of business, banks are exposed to all kinds of risk, without

97
exception. The major contributor to serious challenges faced by banks was seen as poor credit
risk management. As the study has revealed that much of credit risk was due to non-performing
loans, thus South African Banks have to review their loan books and revise their credit granting
process.
Objective Two: With liquidity risk; taking the various determinants of bank liquidity
risk into consideration and how liquidity risk impacts bank profitability, an efficient
management of it would not only harden to the benefit of banks but also to individuals and
business entities and thus the whole economy at large.” South African Banks have to put more
effort towards attracting deposits as they are a major determinant of liquidity followed by
external funding liability. Greater reliance on the stock market has to reduce as this study has
found a negative relationship with profitability.
Objective Three: With market risk; South African Banks have to seek for effective
hedging strategies to deal with the market risk volatilities. This research has indicated that
market risk is negatively correlated with profitability; banks cannot diversify away this risk,
therefore the best they could do is to at least find forecasting techniques to predict the future so
as to better prepare.
5.4 Recommended Future Research
The “main goal of this research was to look at the link between financial risk indicators and
financial performance of commercial banks in South Africa. This research could be replicated
by increasing the sample of analysis and establishing whether the results would be different
from the current study. This study can be extended to include the whole of banking sector and
not just commercial banks. The study may also be extended to cover other fields of
performance measurement such as effectiveness, economy, prudence and soundness of
commercial banks in other countries.” Alternatively, future researchers could replicate the
study but consider other methods of analysis such as P-ADRL, GARCH model, ARCH model,
VAR model, and Co-integration analysis among other models and try to establish if the results
would be different. Another study could be done but with the addition of more variables to
establish their lagged effect on the performance of the commercial bank.
5.5 Limitations of the Study
A number of limitations could be pointed out for this study. Firstly, this study was limited to
top five banks in South Africa and not the banking sector as a whole. Secondly, the sample size

98
taken could be considered small and other researchers could use a larger sample size. Thirdly,
this study made use of one measure of financial performance, ROE. There were other measures
of financial performance of commercial banks including ROA and Net Non-Interest Margin
(NIM). Fourthly, this descriptive and correlational study relied on secondary data which had
already been compiled by Bloomberg, McGregor (BFA), South African Reserve Bank (SARB)
and International Monetary Fund – International Financial Statistics (IMF-IFS). Data was used
as it was obtained and the researcher had no means of verifying the validity of the data which
was assumed to be accurate for the purpose of this study. The study results were therefore
subject to the validity of the data used.
5.6 Chapter Summary
This chapter gave us the summary of the study findings and the interpretations thereof and
subsequent conclusions. Policy and future study recommendations were also identified in this
chapter so as to enable future researchers to capitalise on any gap(s). The limitations related to
the study were addressed in this chapter.
References
Abor, J. (2005). The effect of capital structure on profitability: an empirical analysis of listed firms in Ghana. Journal of Risk Finance, Vol. 06(05), 438-445.

99
Adekunle A Owojori, I. R. (2011). The challenge of Risk Management in Nigeria in the post consolidation era. Journal of Accounting and Taxation, Vol. 03(02), 23-31.
Adeusi, S., Akeke, N., Obawale, S., & Oladunjoye, O. (2013). Risk Management and Financial Performance Of Banks In Nigeria. Journal of Business and Management, Vol. 14(No. 06), 52-56.
Aduda, J., & Gitonga, J. (2011). The Relationship between Credit Risk Management and Profitability Among the Commercial Banks in Kenya. Journal of Modern Accounting and Auditing, Vol. 09(07), 934-946.
Ahmad, N., & Ariff, M. (2007). “Multi-country study of bank`s credit risk determinants. International Journal of banking and Finance, Vol. 05(01), 135-152.
Ahmed, A., Takeda, C., & Shawn, T. (1998). Bank Loan Loss Provision: A Reexamination of Capital Management and Signaling Effects. Working Paper, Department of Accounting, Syracuse University, 1-37.
Akomolafe, K. (2014). Financial Deepenning and Economic Growth: Evidence from Nigeria. International Journal of Economics, Commerce and Management, Vol. 02(02), 20-35.
Akomolafe, K., Danladi, J., & Babalola, A. (2015). Monetary Policy and Commercial Banks’ Performance in Nigeria. Public Policy and Administration Research, Vol. 05(09), 158-166.
Ali-Mustafa, Al-Qudah, & Mahmoud, A. (2013). The Impact of Macroeconomic Variables and Banks Characteristics on Jordanian Islamic Banks Profitability: Empirical Evidence. International Business Research, Vol. 06(10), 153-163.
Alin, M. (2009). Theories Regarding Financial Intermediation and Financial Intermediaries – A Survey.Romania: University of Suceava.
Al-Khouri, R. (2011). Assessing the Risk and Performance of the GCC Banking Sector. International Journal of Finance and Economics, Vol. 72(65), 72-78.
Allen, F., & Gale, D. (2004). Financial intermediaries and markets. Econometrica, Vol. 72(01), 1023- 1061.
Allen, F., & Santomero, A. (1998). The theory of Financial intermediation. Journal of Banking & Finance, Vol. 21(02), 1468-1485.
Alper, D., & Anbar, A. (2011). Bank specific and macroeconomic determinants of commercial bank profitability: empirical evidence from Turkey. Business and Economics Research Journal, Vol. 02(02), 139-152.
Alshatti, A. S. (2015). The effect of credit risk management on financial performance of the Jordaniancommercial banks. Investment management and financial innovation, Vol. 12(01), 338-345.
Al-Tamimi, H., Alwan, A., & Rahman, A. (2011). Factors affecting stock prices in the UAE financial markets. Journal of Transnational Management, Vol. 16(01), 3-19.

100
Amassoma, D., PI, W., & Olaiya, S. (2011). An Appraisal of Monetary Policy and Its Effect on Macro Economic Stabilization in Nigeria. Journal of Emerging Trends in Economics and ManagementSciences, Vol. 02(03), 232-237.
Amihud, Y., & Levich, Y. a. (1994). Exchange rates and the valuation of equity shares. Business One Irwin.
Andabai, P. (2010). Dynamics of Interst Rate Management and its Impact on Money Supply in Africa: A Theoretical Approach. The Universirty Advanced Research Journal, Vol. 01(03), 1-7.
Andersen, Bollerslev, Christoffersen, & Diebold. (2007). Practical Volatility and Correlation Modeling for Financial Market Risk Management. National Bureau of Economic Research.
Anthony, P. (2012). The Development of the Barbadian Financial System: 1966 -1990. International Journal of Business and Social Science, Vol. 03(06), 61-73.
Anum, J. B., & Qodus, B. (2012). Internal and external determinates of profitability of banks: Evidence from Pakistan. Interdisciplinary journal of contemporary research in business, Vol. 03(09), 1037-1058.
Arbabian, A., & Grayeli, M. (2009). The Effect of Capital Structure on Profitability in Tehran Stock Exchange. Journal of Management Perspective, Vol. 33(06), 159-175.
Archarya, V., & Viswanathan, S. (2010). Leverage, Moral Hazard and Liquidity. NBER Working Paper.
Aremu, O., Suberu, O., & Oke, J. (2010). Effective credit Processing and Administration as a Panacea for Non-performing Assets in the Nigerian Banking System. Journal of Economics, Vol. 01(01),53 – 56.
Arko, S. (2012). Determining the Causes and Impact of Non-Performing Loans on the Operations of Microfinance Institutions: A Case of Sinapi Aba Trust. Kwame: Kwame Nkrumah University ofScience and Technology.
Armendariz, B., & Szafarz, A. (2009). Microfinance Mission Drift. Belgium: Solvay Brussels School.
Aspachs, O. N. (2005). Liquidity, Banking Regulation and the Macroeconomy: Evidence on Bank Liquidity Holdings from A Panel of UK-Resident Banks,” Bank of England Working Paper. England: Bank of England.
Auerabach, D. R. (1988). Money banking and financial markets. 3rd Edition. Maxwell Macmillan International Edition.
Azam, M., & Siddiqui, S. (2011). Domestic and Foreign Banks’ Profitability: Differences and Their Determinants. International Journal of Economics and Financial Issues, Vol. 02(No. 01), 33-40.
Bain, J., Nolle, D., Phumiwasana, T., & Yago, G. (1951). Relation of Profit Rate to Industry Concentration: American Manufacturing, 1936-1940. The Quarterly Journal of Economics, Vol. 65(03), 293-324.

101
Baltagi. (2001). Econometric Analysis of Panel Data. Chichester: John Wiley & Sons,.
Baltagi. (2013). Econometric Analysis of Panel Data (5th ed.). New York.
Banchuenvijit, W. (2012). Determinants of Firm Performance of Vietnam Listed Companies. Academic and Business Research Instıtute.
Bank for International Settlements, B. (2016). Market Liquidity: Research Findings and Selected PolicyImplications. Switzerland: BIS.
Barth, J. R. (2003). A Cross-Country Analysis of the Bank Supervisory Framework and Bank Profitability. Financial Markets, Institutions &Instruments, Vol. 12, 67-120.
BASA. (2016, December 10). SA Banking Sector Overview. Retrieved from The Banking Association South Africa: www.banking.org.za
Basel, C. (2008). Principles for the Management of Credit Risk. Switzerland: Bank of International Settlements.
Basel-Committee. (2008). Principles for Sound Liquidity Risk Management and Supervision. Switzerland: Bank for International Settlements Press & Communications.
BCBS, B. C. (2008). Principles for Sound Liquidity Risk Management and Supervision. Switzerland: Bank for International Settlements Press & Communications.
Bencivenga, R., Valerie, Smith, Bruce, D., Star, & Ross, M. (1996). Equity Markets, Transaction Costs, and Capital Accumulation: An Illustration. World Bank Economic Review, Vol. 10(02), 241-65.
Benson, G., & Smith, C. (1976). A transaction cost approach to the theory of financial intermediation.The Journal of Finance, Vol. 46(No. 01), pp. 215-231.
Benton, E. G., James, W. K., & Donal, R. F. (2005). Commercial Banking; the management of risk. Hoboken.
Berger, A., & Bouwman, C. H. (2009). Bank Liquidity Creation. Review of Financial Studies, Vol. 21(07), 3779-3837.
BIS, B. f. (2016). Minimum Capital Requirements for Market Risk. Switzerland: BIS.ORG.
Boahene, S. D. (2012). Credit risk and profitability of selected banksin Ghana. Research Journal on finance and accounting, Vol. 03(07), 6-8.
Bohren, O., Josefsen, M., & Steen, P. (2009). Dividends and stakeholder conflicts: A cleaner test.
Bolton P, X., & Freixas. (2000). Equity, Bonds and Bank Debt: Capital Structure and Financial Market Eequilibrium under Asymmetric Information. Journal of Political Economy, Vol. 108(13), 324-351.
Bonaccorsi, A. (1992). On the Relationship between Firm Size and Export Intensity. Journal of International Business Studies, Vol. 23(04), 605-636.

102
Bonfim, D., & Kim, M. (2012). Liquidity Risk in Herding: Is there Herding? papers.ssrn.com/sol3/papers.cfm?abstract_id=2163547.
Born, J. (1988). Insider Ownership and Signals: Evidence from Dividend Initiation Announcement Effects. Financ. Manage, Vol. 17, 38-45.
Bourke, P. (1989). Concerntration and other determinants of bank profitability in Europe, North America and Australia. Journalof banking and finance.
Brealey, R. A., & Myers, S. C. (2003). Principles of Corporate Finance. New York: McGraw-Hill Higher Education.
Brunnermeier, M. K. (2009). Deciphering the Liquidity and Credit Crunch 2007–2008. Journal of Economic Perspectives, Vol. 23(01), 77–100.
Brunnermeier, Markus, K., & Yuliy, S. (2014). A Macroeconomic Model with the Financial Sector. American Economic Review, Vol. 104(60), 379-421.
Bunda, I., & Desqioůbet, J. (2008). The Bank Liquidity Smile Across Exchange Rate Regimes. International Economic Journal, Vol. 22(03), 361-386.
Capitec, H. L. (2008). Blue-Chip Investment. Cape Town: Capitec Bank Holdings.
Chen, K., & Pan, C. (2012). An Empirical Study of Credit Risk Efficiency of Banking Industry in Taiwan. Web Journal of Chinese Management Review, Vol. 15(01), 1-16.
Chijoriga. (1997). An Application of Credit Scoring and Financial Distress prediction Models to commercial Bank Lending: The case of Tanzania. Ph.D Dissertation Wirtschaftsuniversitatwien (WU) Vienna.
Chirwa, E. (2003). Determinants of commercial banks in Malawi: a cointegration approach. Applied Financial Economics, Vol. 13, 565-571.
Chow, E., Lee, W., & Solt, M. (1997). The Exchange-Rate Exposure of Asset Returns. The Journal of Business, Vol. 07(No. 01), 105-123.
Claessen, & Laeven. (2004). What Drives Bank Competition? Some International Evidence. Journal of Money Credit and Banking, Vol. 36(01), 1-14.
Committee, B. (2000). Principles for the Management of Credit Risk. Switzerland: Bank of International Settlements.
Committee, B. (2008). Basel Committee on Banking Supervision. Switzerland.
Cooper, M. J., Jackson, W. E., & Patterson, G. A. (2003). Evidence of Predictability in the Cross-Section of Bank Stock Returns. Journal of Banking and Finance, Vol. 27, 817-850.
Cooperman, E., Mills, D., & Gardner, J. (2000). Managing Financial Institutions: An Asset/Liability Approach. Orlando: The Dryden Press, Harcout College Publishers.

103
Coyle, B. (2000). Framework for Credit Risk Management. United Kingdom: Charttered Institute of Bankers.
Crowley, J. (2007). Interest Rate Spreads in English-Speaking African Countries. IMF Working Paper 07 101.
Dare, F., & Sola, O. (2010). Capital Structure and Corporate Performance in Nigerian Petroleum Industry: Panel Data Analysis. Journal of Mathematics and Statistics, Vol. 02(01), 1-20.
Darmawan, P. (2014). Evaluation of Bank Liquidity using Gap Analysis - Case Study of Indonesia Islamic Banks. Journal of Economics and Sustainable Development, Vol. 05(16), 59-62.
David, H. (1997). Bank risk management; theory.
Decker, P. (2000). The Changing Character on Liquidity & Liquidity Risk Management; A Regulator's Perspective. Chicago: Federal Reserve Bank of Chicago Banking Supervision & Regulation Research.
Demirguc-Kunt, A., & Huizinga, H. (1998). Determinants of commercial bank interest margins and profitability: Some international evidence. World Bank Economic Review, Vol. 13, 379-408.
Demsetz, H. (1973). Industry Structure, Market Rivalry and Public Policy. Journal of Law and Economics, Vol. 18(03).
Demsetz, H., & Alchian, A. (1972). Production, information costs, and economic Organization. American Economic Review, Vol. 62, 777–795.
Derban, W. K., Binner, J. M., & Mullineux, A. (2005). Loan repayment performance in community development finance institutions in the U.K. Small Business Economics, Vol. 25, 319 – 321.
Diamond, D. W., & Rajan, R. (2001). Bank Runs, Deposit Insurance, and Liquidity. Journal of Political Economy, Vol. 91, 401-419.
Diamond, D., & Dybvig, P. (1983). Bank runs, deposit insurance and liquidity. Journal of Political Economy, 91, 401-419.
Diffu, I. (2011). Relationship between foreign exchange risk and financial performance of airline companies in Kenya, a case study of Kenya Airways. Nairobi: University of Nairobi.
Doliente, J. S. (2005). Determinants of Bank Net Interest Margins in Southeast Asia. Applied FinancialEconomics Letters, Vol. 01, 53-57.
Drehman, M., Sorensen, S., & Stringa, M. (2008). The Integrated Impact of Credit and Interest Rate Risk on Banks: An Economic Value and Capital Adequacy Perspective. England: Bank of England Working Paper No.339.
Duca, J., & McLaughlin, M. (1990). Developments affecting the profitability of Commercial banks. Federal Reserve Bulletin, Vol. 76(07), 477-499.

104
Dutta, A. (1999). Managerial Ownership, Dividend and Debt Policy in the US Banking Industry. Management Finance, Vol. 25( 05), 57-68.
Ellouze, I. A. (2015). The Determinants of the Tunisian Banking Performance: A Panel Data. International Journal of Economics and Finance, Vol. 01(01), 262-272.
Emmanuel I. Kaparakis, S. M. (1994). Short-Run Cost Inefficiency of Commercial Banks: A Flexible Stochastic FrontierApproach. Journal of Money, Credit and Banking, Vol. 26(04), 875-893.
Enyioko, N. (2012). Impact of interest rate policy and performance of deposit money banks in Nigeria. Global journal of management and business research, Vol. 12(21), 100-115.
Epure, M., & Lafuente, I. (2012). Monitoring Bank Performance in the Presence of Risk. Barcelona GSE Working Paper Series No.61.
Eugene, F., & Brigham. (2011). Fundamentals of Financial Management. (8th, Ed.) Burningham: Cengage Learning.
Fadzlan, S., & Royfaizal, R. C. (2008). Determinants of banks profitability in a Developing economy: Empirical evidence from the Philippines. Journal of Accounting and Finance, Vol. 04(02), 91-112.
Fama, E. (1980). Fama Banking in the theory of finance. Journal of Monetary Economics, Vol. 06(No. 01), pp. 39-57.
Federal-Reserve. (2016, May 17). Supervisory Policy and Guidance Topic. Retrieved from Federal Reserve Bank: www. federalreserve.gov
Felix, A., & Claudine, T. (2008). Bank Performance and Credit Risk Management. Skovde: Unpublished Masters Dissertation in Finance, University of Skovde.
Feng-Xiao. (2008). The Role of the Stock Market in Influencing Firm Investment in China. Department of Economics California State University at Fullerton.
Flamini, V., C, M., & Schumacher, L. (2009). The Determinants of Commercial Bank Profitability in Sub-Saharan Africa. Working Paper, WP/09/15, International Monetary Fund.
Froot, K. A., & Stein, J. C. (1993). A Framework for Risk Management. Harvard Business Review, Vol. 76(06), 91-102.
Funso, K. T., Kolade, A. R., & Ojo, a. O. (2012). Credit Risk and Commercial Banks in Nigeria: A Panel Model. Australian Journal of Business and Management Research, Vol. 02(02), 31-32.
Gertler, M., & Nobuhiro, K. (2010). Financial Intermediation and Credit Policy in Business Cycle Analysis. Handbook of Monetary Economics, Vol. 03(01), 547-599.
Gestel, T., & Baesens. (2008). Credit Risk Management Basic Concepts: financial risk components, rating analysis, models, economic and regulatory capital. Oxford University Press.

105
Ghazouani, I., & Moussa, S. (2013). Explanatory Factors of Bank Performance Evidence from Tunisia. International Journal of Economics, Finance and Management, Vol. 02(01), 143-152.
Gizycki, M. (2001). The Effect of Macroeconomic Condition on Banks' and Profitability. Australia: Reserve Bank of Australia.
Goddard, J., Molyneux, P., & Wilson, J. (2004). Dynamic of growth and profitability in banking. Journal of Money, Credit and Banking, Vol. 36, 1069–1090.
Gomes, T., & Khan, T. (2011). Strengthening Bank Management ofLiquidity Risk: The Basel III Liquidity Standards. Canada: Bank of Canada, Financial System Review.
Gonzales, F. (2005). Banking Regulation and Risk Taking Incentives: An International Comparison of bank Risk. Journal of banking and finance, Vol. 29(5), 1153-1184.
Gorton, G., & Winton, A. (2000). Liquidity provision, bank capital, and the Macroeconomy. Universityof Minnesota, Working Paper.
Greenbaum, S., & Thakor, A. (2007). Contemporary Financial Intermediation (2rd ed.). Elsevier Academic Press.
Greuning, H., & Bratanovic, S. (2009). Analyzing Banking Risk: A framework for Assessing Corporate Governance and Financial Risk Management (3rd ed.). Washington D.C: The World Bank,.
Guillen, J., Rengifo, E., & Ozsoz, E. (2014). Relative Power and Efficiency as a Determinant of Bank's Profitability in Latin America. Borsa instabul Review, Vol. 14(01), 191-125.
Gujarati, D. (2004). Basic Econometrics (Fourth Edition ed.). MacGraw-Hill Companies.
Gujarati, D., & Sangeetha, S. (2007). Basic Econometric (4th Edition ed.). India: McGraw-Hill Education Books LTD.
Gul, S. (2011). Factors Affecting Bank Profitability in Pakistan. The Romanian Economic Journal, Vol. 05, 61-87.
Gup BE, &. K. (2005). Commercial Banking: The Management of Risk (3rd edition ed.). Indiana: Quorum Books.
Gurley, J., & Shaw, E. (1960). Money in a theory of finance. Brookings.
Guru, B., Staunton, J., & Balashanmugam, B. (2002). Determinants of Commercial Bank Profitability in Malaysia. University Multimedia Working Papers.
Guttentag, J., & Lindsay, R. (1986). The uniqueness of commercial banks. Journal of Political Economy, Vol. 71, 991-1014.
Hakim, S., & Neaime, S. (2001). Performance and credit risk in banking: A comparative study for Egypt and Lebanon, Working Paper. The Economic Research Forum.
Hamid, N. A. (2015). Abstract Market Risk and Bank Specific Determinats of Commercial Banks in Malaysia. Malaysia.

106
Harwood, I. (2015). Effect of Debt on Financial Performance: A Survey of Commercial Banks Listed onNairobi Securities Exchange. Global Research of Advanced Research, Vol. 02(06), 1025-1029.
Havrylchyk, O., & Emilia, J. (2011). Profitability of foreign banks in Central and Eastern Europe: Does the entry mode matter? Economics of Transition, Vol. 19(03), 443–472.
Heffernan, S. (1996). Modern banking in theory and practice. John Wiley and Sons chichester.
Hibbeln, M. (2010). Risk Management in Credit Portfolios. Contributions to Economics.
Hoggarth, G., Milne, & Wood, G. (1998). Alternative Routes to Banking Stability: A Comparison of UK and German Banking Systems. Bank of England Bulletin.
Hosna, A., Manzura, B., & Juajuan, S. (2009). Credit risk management and profitability in commercial banks in Sweden, Master Theses.
Huang, J., Sun, Z., Yao, T., & Tong, Y. (2014). Liquidity Premium in the Eye of the Beholder. Pennsylvania: Pennsylvania State University.
Hull, J. (2007). Risk Management and Financial Institutions. New Jersey: Prentice Hall.
Husni, A. K., Walid, Z. S., & Ali, H. K. (2011). Determinants of Islamic Bank Profitability: Evidence fromJordan. Middle Eastern Finance and Economics, Vol. 01(13), 43-57.
Hussain, M., & Farhana. (2012). Global commodity price volatility and domestic Inflation.
Illo, A. D. (2011). The Effect of Macroeconomic Factors on Financial Perfomance of Commercial Banksin Kenya. Nairobi: University of Nairobi.
Indiael, K., & Dickson, P. (2013). Credit Risk and Commercial Banks Performance in Tanzania: a Panel Data Analysis. Research Journal of Finance and Accounting, Vol. 04(16), 55-62.
Irina Bunda, J.-B. D. (2003). Bank Liquidity and Exchange Rate Regimes. university of National and World Economy So, (pp. 24-43). Bulgaria.
Ismal, R. (2011). The Indonesian Islamic Banking - Theory and Practice. Indonesia: Gamata Publishing.
Iyare, S., & Moore, W. (2011). Financial Sector Development and Growth in Small Open Economies. Applied Economics, Vol. 43(10), 1289 - 1297.
Jenkinson, N. (2008). “Strengthening regimes for controlling liquidity risk”. Euro Money Conference on Liquidity and Funding Risk Management (pp. 09-20). London: Bank of England.
Jensen, G., Solberg, D., & Zorn, T. (1992). Simultaneous Determination of Insider Ownership, Debt, and Dividend Policies. Journal of Finance Quantitative Analysis, Vol. 27(02), 247-263.
Jolibert, J. a. (2006). Marketing Research, methodes de recherche et d'etudes en marketing. Paris: Dunod.
Jónsson, B. (2007). Does the size matter? The Relationship Between Size And Profitability Of Icelandic Firms. Bifröst Journal of Social Sciences, Vol. 01(01), 43-55.

107
Kabnurkar, A. (2001). Mathematical Modeling for Data Envelopment Analysis with Fuzzy Restrictions on Weights. Falls Church, Virginia: Virginia Polytechnic Institute and State University.
Kargi, H. (2011). Credit Risk and the performance of Nigerian Banks. Vol. 31(01), 1685-1691.
Kasman, A., & Carvallo, O. (2013). Efficiency and Risk in Latin American Banking: Explaining Resilience. Emerging Markets Finance and Trade, Vol. 49(01), 105-130.
Katib, M. (2004). Market Structure and Performance in the Malaysian Banking. 8th Capital Markets Conference. Malaysia: Indian Institute of Capital Markets Paper.
Kaufman, G. (1966). Bank Market Structure and Performance: The Evidence from. Southern Economic Journal, Vol. 34(02), 429-439.
Kayode, O., Obamuyi, T., Owuputi, J., & Adeyefa, F. (2014). Credit Risk and Bank Performance in Nigeria. Journal of Economics and Finance, Vol. 06(02), 21-28.
Keynes, J. (1936). The general theory of employment, interest rate and money. Harcourt Publishers.
Khan, T. (2006). Company Dividends and Ownership Structure: Evidence from UK Panel Data. Economics Journal, Vol. 116(510), C172-C189.
Khan, W., Shahid, M., Bari, R., Anam, W., Shehzad, N., & Siddique, S. (2014). Impacts of Inflationary Trends on Banks’ Performance (Large Banks Segment) in Pakistan. International Journal of Accounting and Financial Reporting, Vol. 04(01), 296-306.
Khrawish, H. A. (2011). Determinants of commercial banks performance: evidence from Jordan. International Research Journal of Finance and Economics, Vol. 81, 148-159.
Kiganda, E. O. (2014). Effect of Macroeconomic Factors on Commercial Banks Profitability in Kenya: Case of Equity Bank Limited. Journal of Economics and Sustainable Development, Vol.05(02), 2222-2855 .
Kitwa, D. (1996). Application of multiple discriminant analysis in developing a commercial banks loanclassification model and assessment of significance of contributing variables: a case of National Banking of Commerce. MBA Thesis, UDSM, Dar es Salaam.
Klapo, T. F., & Ayeni, R. K. (2012). Credit risk commercial banks performance in Nigeria; A panel model approach. Australian Journal of Business and Management Approach, Vol. 02(02), 31-45.
Kolari, B. E. (2005). Commercial Banking (3rd ed.). Texas America: Leyh Publishing.
Kosmidou, K. T. (2005). Determinants of Profitability of Domestic UK. United Kingdom.
Kutsienyo, L. (2011). Determinants of Profitability of Banks in Ghana. (Available at http://dspace.knust.edu.gh:8080/xmlui/handle/123456789/4220.
Lane, D. (2009). The Cost of Capital, Corporation Finance and Theory of Investment: A Refinement. Applied Economic Letter, Vol. 16(01), 20-40.

108
Lapteva, M. (2009). Credit Risk Management in the Bank, Letter from the Bank of Russia ‘On typical banking. Available at: https://www.google.jo.
Lartey, V., Antwi, S., & Boadi, E. (2013). The Relationship between Liquidity and Profitability of ListedBanks in Ghana. International Journal of Business and Social Science, Vol. 04(03), 48.56.
Lee. (2009). Does Size Matter in Firm Performance? Evidence from US Public Firms. International Journal of the Economics of Business, Vol. 16(02), 189-203.
Lee, L., & Niannian, M. (2010). Foreign Exchange Risk Management in Multinationals: An Empirical Investigation on China. Japan.
Levich, A. a. (1994). Exchange Rate and Corporate Performance. New York: Irwin Professional Pub.
Lin, C., Ma, Y., & Xuan, Y. (2011). Ownership Structure and Financial Constraints: Evidence from a Structural Estimation. J. Financ. Econ, Vol. 102, 416-431.
Maja, P., & Jospa, V. (2012). Influence of Firm Size on its Business Success. Croation Operational Research Review.
Mang’eli, M. (2012). Relationship between Interest rates spread and financial performance of commercial banks in Kenya. Nairobi: University of Nairobi.
Markowitz, H. M. (1959). Portfolio selection: Efficient Diversification on Investments. Willey: Yale University Press.
Marozva, G. (2015). Liquidity And Bank Performance. International Business & Economics Research Journal, Vol. 14(03), 432-462.
Marycela, D.-U. (2016, December 10). Technology Trends Affecting the Banking Indiustry. Retrieved from Federal Reserve Bank of Atlanta: frbatlanta.org/education/publications
Mason, & Roger. (1998). A capital adequacy framework for Islamic banks: the Need to reconcile depositors' risk aversion with managers' risk taking. Applied Financial Economics, Vol. 14, 429-41.
Masoud, N., & Hardaker, G. (2012). The impact of financial development on economic growth: Empirical analysis of emerging market countries. Studies in Economics and Finance, Vol. 29(03), 148-173.
Maudos, J., & Fernández de Guevara, J. (2004). Factors Explaining the Interest Margin in the Banking Sectors of the European Union. Journal of Banking and Finance, Vol. 28, 2259-2281.
McKinsey, C. &. (2012). Managing market risk; today and tomorrow.
Mesut, D. (2013). Does Firm Size Affect The Firm Profitability? Evidence from. Research Journal of Finance and Accounting, Vol. 04(04), 1-8.
Milanova, E. (2010). Market Risk management in Banks – Models for Analysis and Assessment. Economics and Organization, Vol. 07(04), 395 - 410.

109
Miller, S., & Noulas, A. (1997). Portfolio mix and large-bank profitability in the USA. Applied Economics, Vol. 29(04), 505-512.
Modigliani, F. a. (1958). The Costs of Capital, Corporate Finance, and the Theory of Investment. American Economic Review, Vol. 17(03), 261-297.
Molyneux, P. a. (1992). Determinants of European bank profitability; A Note. Journal of banking and finance, vol. 16(no. 6), 1173-1178.
Mombo. (2013). Volunteer and satisfied? Rural households’ participation to a pro-environment program in Inner Mongolia. Ecological Economics, Vol. 116(01), 15-23.
Moore, W. (2010). How do financial crises affect commercial bank liquidity Evidence from Latin America and the Caribbean. MPRA Paper no. 2010-21473. Munich Personal RePEc Archive.
Morck, R., Shleifer, A., & Vishny, R. (1990). The stock market and investment: Is the stock market a sideshow? Brookings Papers on Economic Activity, Vol. 02, 157-215.
Mwangi, K. (2012). The effect of risk management practices on the Financial performance of commercial banks in Kenya (Doctoral dissertation). Kenya.
Naceur, S. (2003). The Determinants of the Tunisian Banking Industry Profitability: Panel Evidence. Universite Libre de Tunis Working Papers.
Naceur, S., & Kandil, M. (2009). The impact of capital requirements on banks' cost of intermediation and performance: The case of Egypt. Journal of Economics and Business, Vol. 61(01), 70-89.
Naser-Ail, Y. (2013). The Effect of Liquidity Risk on the Performance of Commercial Banks. International Research Journal of Applied and Basic Sciences, Vol.4(06), 1624-1631.
Ncube, M. (2009). Efficiency of the Banking Sector in South Africa. African Economic Conference 2009.
Ndungu, N. (2000). Monetary and Exchange Rate Policy in Kenya. Kenya.
Ngugi, R. (2004). Determinants of interest spread in Kenya. Nairobi, Kenya: Kenya Institute for Public Policy Research and Analysis.
Njanike, K. (2009). The impact of effective credit risk management on bank survival. Journal of financial regulation and compliance, Vol. 09(02), 173-182.
Nsobilla, T. (2015). The Effect of Non-Performing Loans on the Financial Performance of Selected Rural Banks in the Western and Ashanti Regions of Ghana. Ghana: BA Publishing Studies.
Obadan, M. (2006). Overview of exchange rate management in nigeria from 1986-2006. Central Bank of Nigeria Bullion, Vol. 30(03), 1-15.
Okechukwu, Z. (2004). Shareholding: Steps to Financial Empowerment (1st Ed ed.). Lagos: Phil gad International Limited.

110
Okoye, V., & Eze, R. (2013). Effect of bank lending rate on the performance of Nigerian deposit money banks. International Journal of Business and Management Review, Vol. 01(01), 34-43.
Okpara, G. (2010). The Cost of Capital Corporation and the Theory of Investment. American Economic Review, Vol. 32(14), 35-50.
Oluwatoyin, M., Gbadebo, & Odularu, O. (2009). The impact of share market capitalization on a company’s performance: A case study in the Nigerian confectionary industry. African Journalof Business Management, Vol. 03(05), 220-226.
Ongore, V., & Kusa, G. (2013). Determinants of financial performance of commercial banks in Kenya. International Journal of Economics and Financial Issues, Vol. 03(01), 237-252.
Osuka, B., & Richard, O. (2013). The Determinants of Financial Performance of Quoted Banks in Nigeria: A Study of Selected Deposit Money Banks (DMBs) 2001-2010. International Journal of Education and Research, Vol. 01(10), 1-8.
Owoeye, T., & Ogunmakin, A. (2013). Exchange Rate Volatility and Bank Performance in Nigeria. Asian Economic and Financial Review, Vol. 03(02), 178-185.
Pandey, I. (2015). Financial Management (8Th Edition ed.). New Delhi: Vikas Publishing.
Peltzman, S. (1977). The gains and Losses from industrial concentration. Journal of Law and Economics, Vol. 20, 229-263.
Perry, P. (1992). Do banks gain or lose from inflation? Journal of Retail Banking, Vol. 13, 25–30.
Podesta, F. (2000). Recent Development in Quantitative Comparative Methodology: the casw of pooledtime series cross section analysis. Georgetown: Georgetown University.
Poorman, F., & Blake, J. (2005). Measuring and Modelling Liquidity Risk; New Ideas & Metrics. New York: Financial Managers Society Inc.
Psillaki, M., Tsolas, I., & Margaritis, D. (2010). Evaluation of Credit Risk Based on Firm Performance. European Journal of Operational Research, Vol. 201(03), 873-888.
Qinhua Pan, M. P. (2014). The Impact of Macro Factors on the Profitability of China’s Commercial Banks in the Decade after WTO Accession. Open Journal of Social Sciences, Vol.02, 64-69.
Quey-Jen, Y. (1996). The Application of Data Envelopment Analysis in Conjunction with Financial Ratios for Bank Performance Evaluation. Journal of the Operational Research Society, 982-985.
Rampini, A., & Viswanathan. (2015). Financial Intermediary Capital. Duke: Duke University.
Rauch, C. (2010). Determinants of Bank Liquidity Creation. Available: http://papers.ssrn.com/sol3/papers.cfm?abstract_id=1343595.
Reilly, F. K., & Norton, E. A. (2006). Investments, 7th edition. United State: Thomas South-Western.

111
Rengasamy, D. (2014). Impact of Loan Deposit Ratio (LDR) on Profitability: Panel Evidence from Commercial Banks in Malaysia. Proceedings of the Third International Conference on Global Business, Economics, Finance and (pp. 1-12). Mumbai, India: Curtin University, Malaysia.
Repullo, R. (2004). Capital requirements, market power, and risk taking in banking. Journal of Financial Intermediation, Vol. 13, 156-182.
Rhoades, S. A. (1985). Market Share as a Source of Market Power: Implications and Some Evidence. Journal of Economics and Business, Vol. 37(04), 343–363.
Richardson, D. (2002). PEARLS monitoring system. Madison: World council of Credit Unions Toolkit Series.
SAICA. (2016, December 10). Acts and Regulations. Retrieved from South African Institute of Chartered Accountants: www. saica.co.za/technical/financialservices/Banking
Samad, A. (2004). Performance of Interest-Free Islamic Banks Vis-A-Vis Interest-Based. HUM Journal of Economics and Management, Vol. 12(02), 58-90.
Samuelson, P. A. (1945). The effect of interest rate increases on the banking system. American Economic Review, Vol. 35, 16–27.
Santomero, A. M. (1997). Commercial Bank Risk Management; An Analysis o the process. Journal of Financial Services Report.
Sara, K., & Muhammad, N. (2013). The Impact of Macroeconomic Variables on the Profitability of Lised Commercial Banks in Pakistan. Journal of Business and Social Sciences, Vol. 02(09), 186 - 201.
SARB. (2016, December 20). Financial Stability Review First Edition 2016. Retrieved from South African Reserve Bank: http://www.reservebank.co.za
Saunders, A., & Cornett, M. (2014). Financial Markets and Institutions. Boston: McGraw-Hill.
Seelanatha, L. (2010). Market Structure, Efficiency and Performance of Banking Industry. Banks and Bank Systems, Vol. 05(01), 1-18.
Sharpe, W. (1964). Capital asset prices: A theory of market equilibrium under conditions of risk. Journal of Finance, Vol. 19, 425-442.
Shen, C., Chen, Y., & Chuan, Y. (2009). Bank Liquidity Risk and Performance. 1-37.
Shen, C., Kuo, C., & and Chen, H. (2001). Determinants of Net Interest Margins in Taiwan Banking Industry. Journal of Financial Studies, Vol. 09, 47-83.
Shleifer, A., & Summers, L. (1988). Breach of trust in hostile takeovers. In e. Alan Auerbach, Corporate Takeovers: Causes and Consequences (pp. 33-56). Chicago: University of Chicago Press.
Siaw, S. (2013). Liquidity Risk and Profitability in Ghana. Ghana: University of Ghana.

112
Singh, A. (2013). Credit Risk Managent in Indian Commercial Banks. International Journal of Marketing, Financial Services & Management Research, Vol.2(07), 47-51.
Smirlock, M. (1985). Evidence on the Relationship between Concentration and Profitability in Banking. Journal of Money, Credit and Banking, Vol. 17, 69-83.
Smith, C., & Watts, R. (1992). The investment opportunity set and corporate financing, Dividend and compensation policies. Journal of Financial Economics, Vol. 07, 117-61.
Solomon, O. (2012). Credit Risk Management as a tool For Bank Survival. www.independent.academia.edu/kingsooloo.
Stiglitz, J., & Weiss, A. (1981). Credit rationing in markets with imperfect information. American Economic Review, Vol. 71, 393-410.
Studenmund, A. (2011). Using Econometrics: A Practical Guide (6th ed.). Pearson.
Sufian, F., & Habibullah, M. (2009). Bank specific and macroeconomic determinants of bank profitability: Empirical evidence from the China banking sector. Frontiers of Economics in China, Vol. 04(02), 274–291.
Syarif, S. (2004). Aanalisis Pengaruh Rasio-Rasio Camels Terhadap Net Interest Margin (Study EmpirisPada Bank-bank yang Listed di Bursa Efek Jakarta Periode Tahun 2001 – 2004). Diponegoro University institutional Repository.
Tabari, N. A. (2013). The Effect of Liquidity Risk on the Performance of Commercial Banks. International Research Journal of Applied and Basic Sciences, Vol.4(06), 1624-1631.
Toby, A. (2006). Empirical Study of Liquidity Risk Management in Nigerian Banks. Journal of Financial Management and Analysis, Vol.3(05), 15-30.
Tonye, O., & Priye, A. (2014). Liquidity Preference Theory: A Comparison of William Baumol's and James Tobin's Proposition. African Research Review, Vol. 08(04), 143-152.
Toutou, J., & Xiaodong. (2011). The Relationship between Liquidity Risk and Performance: An Empirical Study of Banks in Europe, 2005-2010. Europe: Umea School of Business.
Towpek, J. T. (2006). Theory of Profit in Islamic Banking System. Malasia: Department of Publication University of Malaya.
Ugurlu, M. (2000). Agency costs and corporate control devices in the Turkish manufacturing industry. Journal of economic studies.
Valeriu, B., & Nimathalasan, B. (2010). Capital Structure and its Impact on Profitability: A study of Listed Manufacturing Companies in Sri lanka. The Young Economists Journal, Vol. 13(01), 55-61.
Vong, A., & Chan, H. (2009). Determinants of bank profitability in Macao. Macau Monetary Research Bulletin, Vol. 12(06), 93–113.

113
Warue, B. N. (2013). The Effects of Bank Specific and Macroeconomic Factors on Nonperforming Loans in Commercial Banks in Kenya:A Comparative Panel Data Analysis. Advances in Management & Applied Economics, vol.3(13), 135-164.
Webb, M. K. (2010). A Financial Ratio analysis of Commercial Banks in South Africa. African Review ofEconomics and Finance, Vol. 01(01), 35-37.
Were, R., & Wambua, S. (2013). Determinant of interest rate spread. Nairobi, Kenya: Kenya Institute for Public Policy Research and Analysis. Nairobi: Public Policy Research and Analysis.
Westerfield, W., & Ross, A. (2000). Fundamentals of Corporate Finance. New York: McGraw-hill Inc.
Winters, M. (2010). Choosing to target: what types of countries get different types of World Bank projects. World Politics, Vol. 62(03), 422-458.
Wlliamson, O. (2010). Transaction Cost Economics: The Natural Progression. American Economic Review, Vol. 100( 03), 673-90.
Zhiguo, H., & Krishnamurthy, A. (2012). A model of Capital and Crises. Review of Economic Studies, Vol. 79(56), 735-777.

A
APPENDICIES
Appendix I: Models Summary
MODEL R-SQUARE PROBABILITY F-STAT
VALUE
One 82% 0.00000 22.64
Two 90% 0.00000 28.5
Three 74% 0.00000 11.2

B
Appendix II: Turnitin Report

C
Appendix III: Ethical Clearance

D
Appendix IV: Proposal Qualification