Embed Size (px)
Citation preview
University of Nigeria Research Publications
OKETAH, Ifeoma M.
Aut
hor
PG/MBA/93/17519
Title
Risk Analysis and Control In Banks Credit Portfolio Management
Facu
lty
Business Administration
Dep
artm
ent
Banking and Finance
Dat
e
August, 1995
Sign
atur
e

RISK ANALYSIS AND CONTROL IN BANKS
CREDIT PORTFOLIO MANAGEMENT
OKETAH IFEOMA MARY PG/MBA/93/17519
SUBMITTED TO THE FA~S&+Y-'O~F BUSINESS ADMINISTRATION IN PARTIAL FULFILLMENT
OF REQUIREMENTS FOR THE DEGREE MBA FINANCE
UNIVERSITY OF NIGERIA ENUGU CAMPUS
AUGUST 1995.

CERTIFICATION
Oketah Ifeorna Mary, a Postgraduate ti dent in the Department of Banking and
Finance and with Registration NP PG/MBA/93/17519 has satisfactorily completed
the requirements for course and research work for the degree of M. B. A. in
Banking and Finance.
The work embodied in this thesis/dissertation project/report is original and has
not been submitted in part or in full for any other Diploma or degree of this or
any other University.
I
Dr. A. M. 0. Anyafo Dr. 3 E. Chikeleze Head, Desprtmenl of Ranking & Finance, Supervisor, University of Nigeria, Departmcnt of Banking & Finance Enugu Campus. University of Nigeria,
Enugu Campus.

DEDICATION 1 (
This work is dedicated to my husband,
Dr. M. 0. Okwor and my Son, Master Chikeluh Okwo.
iii

1
ACKNOWLEDGEMENT This research could not have been completed'without the
assistance of so many people.
First and foremost, my profound gratitude goes to my super-
visor, Dr. Chikeleze, who developed special interest in his work and
monitored its progress to completion.
My sincere gratitude also goes to my mother-in-law, Mrs. B.
Okwo and my mother, Chief Mrs. R. Oketah for their motherly
love and their moral support.
I also express my gratitude to my brothers-in-law, Dr. Fred.
Okwo for his worthy contribution and guidance which has made
the successfulcompletion of the project a reality and to Mr. Marcy
Okwor and Mr. Charles Okwo for their moral and financia! support.
My gratitude also goes to my brother, Engr. Festus Oketah,
and to my uncle, Mr. Lawrence eneje for their contribution to the
successful completion of this academic programme.
I am equally indebted to the following people who have in
one way or the other contributed toward the attainment of this aca-
demic goal. They are: Mrs. P. Ugwu; Mr. E. Echiegu; Joe Ezeh;
Esther Ugwu Ebere Okwor; Ann Eze; Mr. and Mrs. Diyoke; Mr. and
Mrs. M. Oke; Mr. Osy Oke; Mr. Paddy Ugwuoju; Mr. Paddy Okwor;
Mr. and Mrs. A. Odoh and others whose names are not written

I
down due to space.
Last but not the least, to my hr;sbai?d Di-. M. 0. Okwo and my
5211 ChilieIuba Okwo for contributing in many ways to the atiain-
;-:lent of this goal. And finally, to Almighty God for His protection
,:i:;d guidance over me.
Oketah, Bfeoma M. August 1995.
CERTiFICATION
iIEDICATION
ACKNOWLEDGEMENT
TABLE OF CONTENTS
LIST OF TABLES
LIST OF FIGURES
ABST2.:b*r3T
CHAPEX ONE
INYRODUCTION
1.1 Background of the Study
? Statement of the Problem
i .3 Objectives of the Study
i 4 Formulation of Hypothesis -. - yificance of the Study
S c o p a d Limitation of the Study
Page No.
iii
iv
iv
ix
X
xi
X
1
1
2
3
4
5
6
LITERATURE REVIEW 7
2. i The Concept of Risk, Uncertainty and Bank 7
2.2 Distinction between Risk and Uncertainty 9
vi
'7 . \ 3 ) Classification of Risk
2.11 ~xurement and Manayerneht oi Rls!i through Port I _ \i Theory 19
2 5 Portfolio Analysis Theo y 25
2.6 The Capital Asset Pricing 27
REFERENCES 29
CHAPTEi? THREE
33EARCH METHODOLOGY 32
C - < J i Sowces of Data 32
S '2 Population ax! Sampie 33
3.3 Method of Data Collection 33
n
vii
5.4 The Proposed Risk Analysis aid
Measure.mcnt Model
CFI-. '-'TER FOUR
PRESENTATION AND ANALYSIS CF D,
4.1 Data Analysis
3.2 Hypothesis Testing
SLJMMARY, CONCLUSION AND RECOMMEN- 65 DATION
5.1 Adoption of the Suggested Risk Analysis Model . in the Banlcing Industry 66
5.2 Findings G S
5.3 Co~~clusion
5.4 Recommendations
References
PICTORIAL AND PROCEDURAL ILLUSTRATION OF TEE MECHANICS OF THE PROPOSED RISK MEASUIIEMENT MODEL FOR BANKS CREDIT PORTFOLIO
I1 TAXANOMY OF BANK RISKS 78
III ALPHABETCAL LIST OF REGISTEREG BAlYK IN NIGERIA 83
QUESTIONNAIRE 90
viii

Table LIST OF TABLES
Page No.
Classification of Respondents Bank by their Areas of Banking Operation 40
Opinion on Risk Analysis of Credit Applications 41
Techniques or Credit Application's Risk Analysis 41
Causes of State Government Banks hsolvency 43 0
Opinion on. the Necessity for Diversification of loan Portfolio 44
Respondents View on the Enhancement of Banks Loan '
PortfoIio through Effective Risk Diversification 45
Opinion on the Employment of Correlation Analysis for Effective Risk Diversification 45
Clas<ification of Banks Provision or Bad and Doubtful Debts 47
CE.'"s Sectoral Loan Allocation Guidelines Effect on versification 48
Opinion on whether the CBN's Sectoral Loan Allocation Guidelines should be Scrapped 49
Hypothesis 1 Table 52
Hypothesis 2 Table 57
Pse!iminary Calculation for Applying Variance AnaIysis Test 58
ix

LIST OF FIGURE
Figure
1
2
3
6:
5
6
Pie Chart Presentation of Table 7
Bar Chart Presentation of Table 7
Pie Chart Presentation of Table 6
.Bar Chart Presentation of Table 6
Pie Chart Presentation of Table 8
Bar Chart Presentation of Table 8
Pie Chart Presentation of Table 9
Bar Chart Presentation of Table 9
Page No.
51
52
55
56
63
64
63
65

ABSTRACT
This study is about Risk Analysis and Control in Banks Credit
Portfolio Management. The study Involved ascertaining opinions of
bank managers on risk analysis and control technique in the Nigerian
banking industry. The fundamental objectives of the study, among
others were:
1. To determine the existing tools of risk analysis and control in
banks lending portfolio management.
2. To construct a m d e I far risk analysis and control in credit
portfolio. *l t
The researcher, therefore, developed a risk measurement model
for banks credit portfolio management. The model identifies risk
vectors in the economy; proposes that diversification should be based
on riskcorrelationship; and determines the correIationship in terms
of correlation coefficient of the risk of the existing portfolio with that
of the additional investment. This model formed the basis of our
appraisal of risk analysis and control technique in practice in Nigeria
banking industry. n
The entire commercial, merchant and development banks in
Nigeria were the study population, from which a sample of 56 were
selected. A set of structured questionnaire was administered to the 4
sample, out of which 42 responded.
The collected data were classified, analysed and interpreted by
use of tabular and graphic discussion. Product-moment coefficient of
correlation and variance analysis were used in testing the hypotheses.
From the analysis of the data, the major findings were that:
1. There does not exist any risk qualification and comparison
technique applicable on continual basis for diversification pur
pose in banking industry.
2. . CentlraI Bank of Nigeria's sectoral loan aIlocation guidelines does
not inhibit effective diversification.
3. The distribution of respondents between different options as to I
the effects of diversification of banks credit portfolio is not
significantly different between the three classes of banks.
Majority of the respondents in each of the three banks agreed
that effective diversification will enhance the quality of banks
credit portfolio.
Based on the findings, recommendations were made. These
focus attention on the need to create an enabling environment for the
adoption of statistical approach to risk quantification and comparism
in the banking industry .
xii

CHAPTER ONE
INTRODUCTION
1.1 Background of the Study
Banks perform a very important service t o all sectors of.the
~xonomy, by providing facilities fur the mobilization of savings, and
making the funds available for investment purposes by the process of
granting credit facilities to other customers. Thus, these funds are
made available to businesses t o enable them to expand their produc-
tive capacity, and to individuals and household to facilitate consump-
tion. Commercial banks thereby create money by granting credit
through overdraft, loans and advances.
The problem these banks encounter is that most of theses
loan granted are not repaid, leading to making provision for bad
debts. Since the introduction of Central Bank of Nigeria's Prudential
Guidelines in November 1990, huge sum of money are written of the
books of banks as bad and doubtful debts. The trend of the lending
risk actor which is the percentage of provision for bad and doubtful
debts to total loan and advances is increasing.
Bank have, in place, standard practice for appraising and ap-
proving individual credit applications. In spite of this, bad and doubt-
ful debts still claim bulk charge on banks performance; and in some
cases threatens the collapse of the affected banks, classified distressed
by (Nigeria deposit Insurance Corporation NDIC). 1

0
This study premised upon the fact that most loan defaulters
do so due to the economic circumstances affecting the industry in
which they operate; which we believe that a credit portfolio can
diversify holdings of loans as to achieve simultaneously low risk and
high returns.
1 .2 Statement of the Problem
That banks ensure the individual appraisal and ratings of credit
applications through their credit analysis departments is not in doubt.
However, as a result of non-effective diversification of portfolio
effect, negative pressure on a sector of the economy adversely af-
fect the value of banks overall credit portfolio as they are basically
positively correlated.
For instance, governments all over the world are rated as
highly credit-worthy and are preferred for bank lending. The reverse
appears to be the case in Nigeria, as state governments appear un-
able to meet their debt obligations. This plunged most banks neck-
deep into troubled water because of the prudential guidelines. Most
State banks concentrate their loan portfolio on government and gov-
ernment related institutions; which its default leads to the banks Ii-
abilities exceeding their assets basically resulting from provisions for
bad and doubtful debts.
The volume and value of bank loan which have become clas-
sified have continued to increase even at a faster rate than the in-

creases in bank lending. This has adverse effect on banks since it
affects their cash flow. It is beIieved that most debts go bad because
of the inadequacy of loan management and recovery procedure of
banks.
Central Bank's sectoral allocation affects bank lending and
increases risk in bank lending. For instance, agriculture is considered
a high risk and low yield venture for bank financing. As a result of
this, low yield high risk situation banks have used a11 sorts of strate-
gies known to them to circumvent lending to farmers. Although the
banks agree to the existence of risk in agricultural lending, none of
them knows the rate of defauh or any indicator of risk. There is,
therefore, no knowledge of which institutions record more risk and
why they do so.
This lack of knowledge and obvious ignorance to a ve y im-
pol-tant fact to the business of banks has led to questions such as:
What could be done to eliminate or at least reduce the magni-
tude of the risk and uncertainly in bank lending portfolio and hence
assist in creating an easy and undistributed investment cycle in bank
lending?
Why does lending risk exist? What are the causes of the re-
ported high risk in bank Iending?
1.3 Objectives of the Study
The study is meant to -
1. Determine the existing tools of risk analysis and control in
banks lc~nding portfolio management; 3

2. Determine the effectiveness of lending diversification through
portfolio theory in checking the incidence of bad doubtful
debts in bank management;
3. Construct a model for risk analysis and control in credit
portfolio;
4. Determine the effect of Central Bank of Nigeria's sectoral
credit allocation guidelines on banks lendings;
5 . Make recommendations based on the findings.
1.4 Formulation of Hvpothesis
Hypothesis 1
Null -Hypothesis IH ): Effective loan diversification through risk 0 -
and correlation analysis of banks credit investments is not in prac-
tice.
Alternative Hvpothesis (Hi): Effective loan diversification credit
investment is in practice.
Hypothesis 2
Null Hypothesis: The distribution of respondents between differ-
ent optiqns as to the effects of diversification of banks credit
portfolio is not significantly different between the three classes of
banks.
Alternative Hwothesis: The distribution of respbndents between
different options as to the effects of diversification of banks credit
portfolio is significantly different between the three classes of banks.
Null Hvpothesis: CBN's sectoral loan allocation guidelines do not 4
ink7.it effective diversification in banks lending.
Ahernative Hypothesis: Central Bank of Nigeria's (CBN) sectoral
loans allocation guidelines do inhibit effective diversification in banks
lending.
1.5 Sisnificance of the Study
The relevance of this study can readily be seen in its contribu-
' d m towards enhancing fending practices; thereby improving the quality
of banks loan portfolio through achieving effective diversification.
It is not an exaggeration to say that the difference between
success and failure in the banking industry is in the effetfive manage-
ment of the banks loans and advances. Efficient loan management is
vital to the protection of assets and the achievement of adequate
returns to investments. Though much work abound in the literature
on the techniques of lending, the methods of securing such lending
and the pitfalls that await the unwary banker; by cornparism, there
appears to be ve y little in print on the subject of loan management
and recovery. A study of this will therefore be an addition to the
existing volumes of banking literature.
For loan management to be effective, it must know when a
loan begins to look doubtful and take appropriate action. This will
enable the bank to at best obtain full repayment including accrued
interest or at worst to mitigate the eventual capital loss. In the face of
increased competition among banks, future profits are likely to be
harder to come by.
The study will show the effect of Central Bank's sectoral loan
allocation guidelines on bank lending, and suggest possible solution,
if necessary. The economy as a whole will benefit from the study
because if the level of bad debts is reduced, banks will be left with
more profits t o enable them make the expected contribution to the
development of the economy. The study will also be a guide to fu-
ture researchers who may like to research more on the topic.
1.6 Scope and Limitation of the Study
The study was restricted to risk analysis and control in bank's
credit portfolio management. The researcher assumed the existence
of an effective credit analysis and department in the banks in study.
The study is therefore concern with risk comparism instead of riskness
of individual loan investments.
The researcher intends to cover all the banks in Nigeria, but
due to the three main constraints of research namely: Time, money
and energy, she can only study some selected commercial. The study does not include mortgage, people and community banks.

CHAPTER TWO
LITERATURE REVIEW
It is important to consider the work of other people who have
written on related topics to achieve the theoretical framework of this
study. It is therefore in realization of this objective that the researcher
critically reviewed the works of different people under these sub-
headings, namely:
1. The concept of risk, uncertainty and bank.
2. Distinction between risk and uncertainty.
3. Classification of Risk.
4. Measurement and management of risk through portfolio
the0 y.
5. Portfolio analysis and selection.
6. Capital asset pricing model.
2.1 The Concept of Risk, Uncertaintv and Bank
The word "Risk" means different things to different people.
h economics, risk is defined as the chance that a particular deci-
sion oraction can give rise to as variety of outcomes for which one
can calculate the mathematical probability. In investment, it is the
probability of loosing money or making profit on one's invest-
ments. In insurance, it is a general term for any possibility of loss. It
is also the person or property covered by an insurance policy.

Okafor argued that risk is used as a surrogate for the likeli-
hood of loss or the potential size of such a loss. He also explained
that risk implies exposure to danger for economic adversity. He
used risk to denote exposure to loss arising from variations between
the expected, and the actual outcome of investment activities. Ac-
cording to him, condition of risk is incomplete knowledge and at
the same time, incomplete ignorance.'
Also, yandey defined risk as the variability that is likely to
occur in the future returns from a project. "The greater the variabil-
ity of the expected returns, the riskier the p r o j e ~ t . " ~ He gave three
different techniques to handle risk: The payback p'ei-iod, risk ad-
justed discount rate and certainty-equivalent techniques. His defini-
tion of risk is associated with projects.
Weston and Brigham also defined the riskiness of an asset in
terms of the likely variability off future returns from the assets. In
their word The concept of probability is a fundamental element in both the definition and the measurement of risk. A probability distribution shows the probability off occurrence of each possible outcome, assuming a given investment is undertaken.
Also Irukwu argued that no one is exempt from risk. He
insisted that risk in the sense of chance of loss has been the bane of
human existence from time immemorial. According to him, whether
we like it or not, and however careful we may be, we are exposed to

the risks of, for instance, fire, earthquake, storm, flood, burglary at-
tack by an armed robber, injury from the tortuous acts of others and
several other hazards. The above situations gave birth to many defi-
nitions of risk depending on the context it has been used.
In the same way, Pappas and Brigham argued that risk is "a
hazard or peril; exposure to harm; and risk to mean the possibility
that some unfavourable events wil[ occur.Wardy opined that risk is
uncertainty in regard to cost, loss or damage. According to him where
destruction or loss of capital is certain in connection with a business
process, it not a risk, it can be charged up in advance as a cost.
The above definitions though in line with most literature defi-
nitions, are narrow in the sense that they are simply looking at risk
as a negative variance. In view of the above, a further consideration,
of other definitions is necessary.
Political risk was defined by Ting "as the the non-market un-
certainks or variations surrounding the desired business outcome
(revenues, cost, profit, market share, continuation off the business
and so on), for an international project or venture that may stem
from instabilities in the host country's political policy and/or foreign 7
exchange system", Higgins simply defined risk "as the dispersion in
possible o u t ~ o m e " . ~ Also sharpe defined risk as the extent to which
the actual outcome is likely to diverge from the expected value.9
2.2 Distinction between Risk and Uncertainty 1
The definitions made in 2.1 above lack clarity as to distinction

beheen risk and uncertainty. In attempt to distinguish the two, Ruth
argued that "uncertainty is the compliment of knowledge" and went
further to define it as "the gap between what is known and what
needs to be known to make correct decision.'O Also in his attempt t o
distinguish between risk and uncertainty Willett contended that: Risk is the object corrective of the subjective uncertainty. It is the uncertainty considered as embodied in
0 the course of events in the external would of which the subjective uncertainty is a more or less faithfd interpretation."
In his own distinction Preffer contended that risk is a combi- I
nation of hazards and is measured by probability while uncertainty is
veasured by a degree of belief. Risk is a state of the world, uncer-
tainty is a state of the mind.
Willett's and Prefers definitions were analysed by Houston.
According to him, Willett's definition was seen to comprise of two
major aspects: the first is the objective - subjective distinction risk is
seen as an objective phenomenon which can be measured empiri-
cally in the real world and is independent of the individual observer.
The second aspect denfined risk as "a concept of variation and is
not identified with the degree of probability. While in Preffer's defi-
nitions, Houston notes his emphasis on the objective - subjective
dichotomy of risk and uncertainty, is that in the former the distribu-
tion of the outcome in a group of instances is known (either through
calculations a prior or from statistics of past experiences) while in

the case cf uncertain@, this is not true, the reason being in general
that it is impossible to form a group of instances because the situa-
tion dealt with, is in a high degree unique.15
In an attempt to distinguish risk and uncertainty, 0kafor ex-
plained that condition of risk implies incomplete knowledge as well
as incompleteignorance. The condition of uncertainty, on the other
hand, implies a near complete ignorance of the future outcome of
present clzcision .I6
Although, Weston and Brighan used the two words synony-
mously, they made distinction between risk and uncertainty. In their
words: Risk is associated with those situations in which a probability distribution of the returns on a given project can be estimated; uncertainty is associated with those situations in which insufficient evidence is available even to estimate a probability
di~tribution.'~
They argued that probability distributions of expected returns
can themselves by estimated with greater or lesser precision. They
explained that when statistical procedures can be used to estimate
probability distribution, then risk is said to be measured by objective
probability distributions. However, if statistical data cannot be used to
estimate probability distribution, then the estimate will be determined
subjectivdy, hence, subjective probability distributions.
Dzspite the above definitions, for purposes of our study, we
should regard an investment risky if its actual outcome has the prob-
11

;.':i;ity of varying, positively or negatively, from the expected out-
come and that there exist techniques to measure this dispersion,
.- - : ~ e l y the average (or mean) absolute deviation and the standard
dct iation.
2.3 Classification of Risk
There exist distinctions in risk types. Monray distinguished
between two types of risk According to him, risk could be pure or
speculative in nature Barauch et al. explained that pure risk holds
our the prospect of a loss or no loss (insurable risk) whik a specula-
tive risk holds out the prospect of a gain as well as 1 0 ~ s . ~ ~
However, Kulp, adopts a different dimension to the categori-
zation of risks based on the origin or cause of the risk situation.
Risk, according to him, could be "fundamental" or particular in na-
ture. His explanations of the two terms are that:
Fundamental risks are essentially group risks, the conditions which cause them have no relation to any particular individual . . . Particular risks affect each individual separately .. . They are usually personal in their application, because they are so largely personal in their nature . .. , the individual has a certain degree of control over their causes .20
In line with portfolio risk analysis, Higgins classified risk as "non- diversifiable" and "diversifiable."
He explained that the non-diverslfiable
?-is:-; is the risk remaining after the rest has been diversified away in
the portfolio.
The part that is diversified away is Imownas the diversifiable risk.21
In addition to the above, Fabozzi, et a. distinguished between
a security's unsystematic risk and its systematic risk. They described
unsystematic risks as the risks whjch can be washed away by mixing
the security with other securities in a diversified portfolio; whereas
sy;lcmatic risk are those which cannot be eliminated by diversifica-
tion. He further explained that the unsystematic risk depends on fac-
tors that are unique or specific to the company that issued the secu-
rity, such as labor difficulties, unexpectedly high or low sales, mana-
gerial issues, and so on. Thus, the unsystematic component is not
linked tc: the overall market or economic system.
Osubor grouped risk into four classes: Market risk, purchasing
power risk, money rate risk and credit risk. According to him, market
ris!.. :s risk that a failure or impairment of market would cause the
market instruments to be unsaleable, at less that their fair prices;
purchasing power risk that ?ype of risk that a prolonged inflation
would cause repayment of money in future of reduced buying power;
money rate risk is the risk that a future rise in interest rate would
Iocver the value of debt; and finally credit risk which is the risk of
deiault in repayment. It is the risk associated with the fear that those
who owe you might default in their regular payments.23
Okafor also grouped risk into six classes: Business risk, mar-
ket risk, purchasing power risk political risk, risk ~ f q unplanned
obsolence and management and union risks. He explained that busi-
13
ness risk does arise from changes in genera! economic conditions
Lhat lead to unexpected declines in the earning power of most in-
wstments. It therefore follows that period of unanticipated deprcs-
sion are characterized by a high rate of business; market risk origi-
:-ates from adverse market (Mob) reactionto unanticipated events.
Depressed returns could arise from fundamental changes in earn-
ings power or simply from outright pessimism on the part of capital
market participants. There are many things that can cause this type
of risk for instance, an unpopular election result could cause de-
przssed stock market prices. Similarly, the death of a president or a
surprise sign of war could cause tremendous pessimism in the mar-
ket; purchasing power risk, according to him is the risk that arises
from afall in the reaI value of investment outcomes due to an unan-
ticipated increase in the rate of inflation. Investors in fixed income
financial assets are exposed to a great deal of inflation or purchasing n
power risk; political risk come from non-predictability of political
forces, which affect investment outcomes. Many political measures
such as nationalization, indigenisation programmes,, could cause an
unanticipated decline in the return on investment; risk of unplanned
obsolence occurs when unanticipated economic and/or technologi-
cal factors cause a premature abandonment of a product Iine or of a
entire project. For example, when a radical change in consumer
taste eliminates the effective demand for a product, thus rendering
it obsolete,^ or when a drastic change in technology causes the un-

planned abandonment of a manufacturing process. This risk often
arixs from less revolutiona y forces, e.g when a manufacturing plant
is forced to close down due to tempora y or permanent disruption of
raw materials supplies, and finally management and union risks, this
according to him arises from unanticipated variations in profit perfor-
mance caused by management. Similarly, unexpected changes in per-
formance could arise from union risks. Union risks are disruptions t o
corporate performance caused by unfavourable union actions such
as strikes, sit-ins and outright sabotage. He also explained that man-
ageinent and union risk is due to errors of judgement, inefficiency or
fraud on the.part of management and union leaders.24
Also Johmson et aI. mentioned specific sources of risk that
causedvariability in banks return; These include liquidity risk, interest
rate risk, credit risk and capital risk. He explained that some ele-
ments of these source of risk are controllabIe and cari 'be limited
through managerial action, whereas other elements remain uncon-
trdlable. According to them, Banks must meet demand for liquidity
when customers demand loanable funds. In order t o meet potential
demands for liquidity, banks must maintain liquidity in assets or must
rely on creating liquidity by borrowing funds. In their words.
Liquidity risk refers to the variability in earnings that results from satisfying a demand for liquidity.
They also explained that interest rate risk is the risk of mak-
ing a loan that is financed at a known rate but that during the loan life
may be referred to be refinanced at a higher interest rate. The net
yield to the bank is reduced whenever loan rate is fixed and funding
rate rises. A bank is therefore, subject to certain degree of earnings
variabiiity as interest rate fluctuates. Management can control the
degree of interest rate risk that a bank is subject to, to some extent.
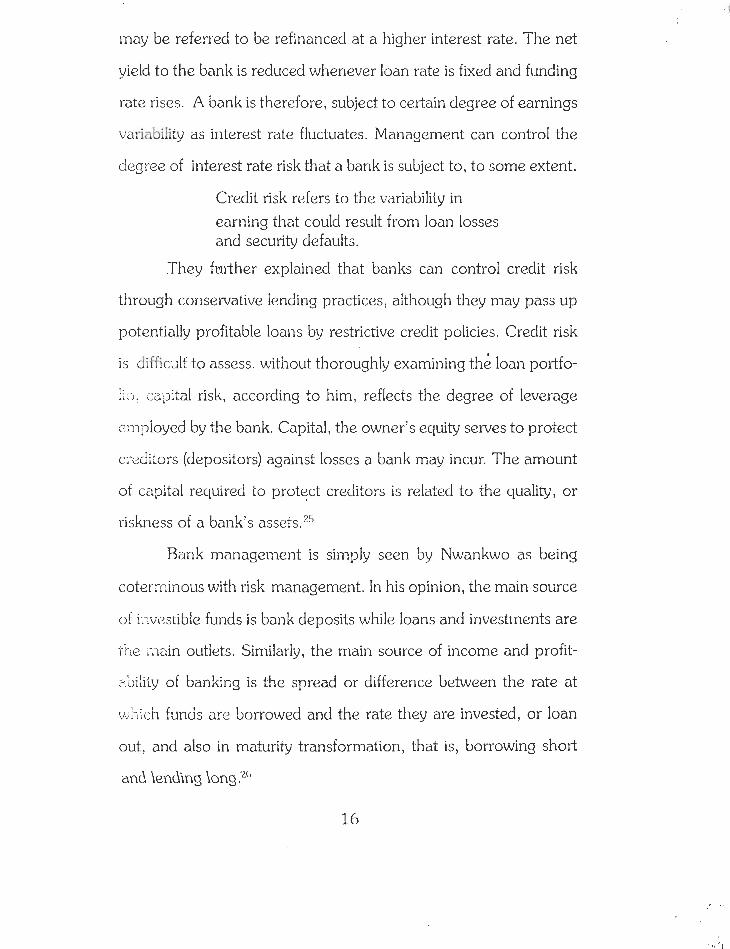
Credit risk refers to the variability in earning that could result from loan losses and security defaults.
,They further explained that banks can control credit risk
through conservative lending practices, although they may pass up
potentially profitable loans by restrictive credit policies. Credit risk
is difficult to assess. without thoroughly examining the loan portfo-
1;:). ~ci~)iial risk, according to him, reflects the degree of leverage
cxpioyed by the bank. Capital, the owner's equity serves to protect
cxditors (depositors) against losses a bank may incur. The amount
of capital required to protect creditors is related to the quality, or
riskness of a bank's assets.25
Bank management is simply seen by Nwankwo as being
coterranous with risk management. In his opinion, the main source
of ~i.vesilble funds is bank deposits while loans and investments are
L?.C main outlets. Similarly, the main source of income and profit-
?bility of banking is the spread or difference between the rate at
w.-kh funds are borrowed and the rate they are invested, or loan
out, and also in maturity transformation, that is, borrowing short
and \en&ng long .2''
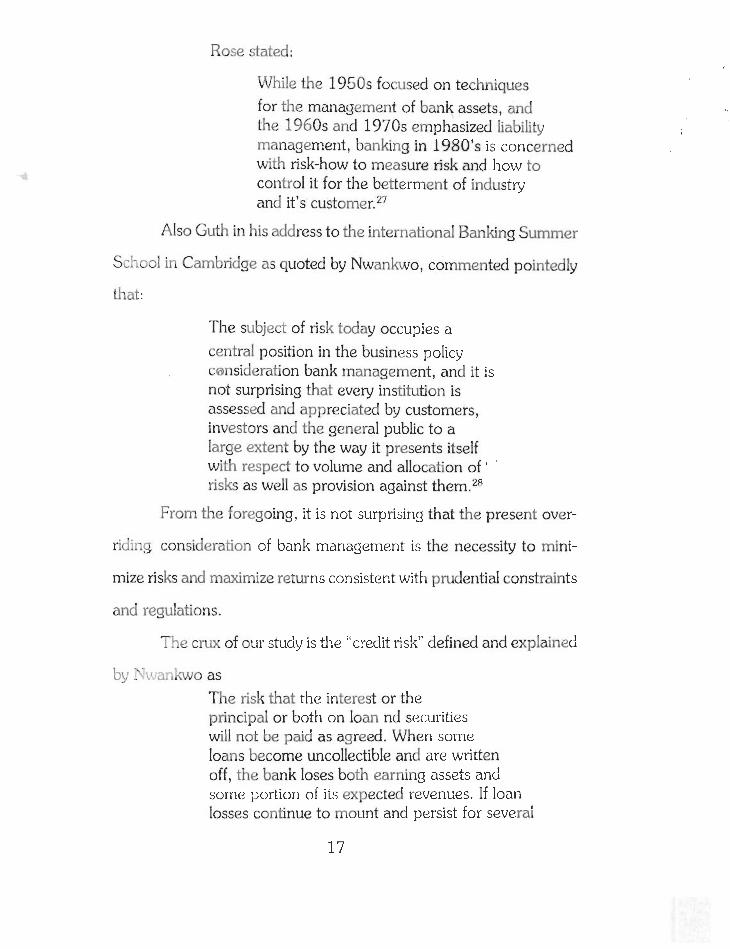
Rose stated:
While the 1950s focused on techniques for the management of bank assets, and the 1960s and 1970s emphasized liability management, ban king in 1980's is concerned with risk-how to measure risk and how to control it for the betterment of industry and it's
Also Guth in his address to the international Banking Summer
ScImol in Cambridge as quoted by Nwankwo, commented pointedly
that:
The subject of risk today occupies a
central position in the business policy csnsideration bank management, and it is not surprising that every institution is assessed and appreciated by customers, investors and the general public to a large extent by ihe way it presents itself with respect to volume and allocation of ' '
risks as well as provision against them.28
From the foregoing, it is not surprising that the present over-
riding consideration of bank management is the necessity to mini-
mize risks and maximize returns consistent .with prudential constraints
and regulations.
The crux of our study is the "credit r isk defined and explained
by >-\':.' clnkwo as The risk that the interest or the principal or both on loan nd securities will not be paid as agreed. When some loans become uncollectible and are written off, the bank loses both earning assets and some portion of its expected revenues. If loan losses continue to mount and persist for several

years, the bank's cushion for capital eventually becomes eroded and unless additional funds are injected, the bank may be forced to liquidation.
As can be deduced from Nwankwo's definition and explana-
tion, credit risk can be very disastrous to the banking industry. He
also mentioned some factors that contributes to credit risk. These
factors include: The range of interest rate in the portfolio and the
proportion of the portfolio at the various ranges. The higher the
dispersion, the greater the credit risk; competence of the loan ad-
ministrators, this include the managerial and the technical compe-
tence of the administrators; the proportion of the portfolio effec-
tivcly collaterised - the higher the effective collaterisation the lower
the credit risk. Last but not least is the degree of the correlationship
of the risks in the portfolio - the higher (positive) correlation the
greater the credit risk.
In general, management and control of risks in the banking
industvy take the path or risk avoidance and minimization, risk trans-
fer < i?d risk retention. 6
Risk minimization and avoidance is a technique whereby in
Q:.~' 31. to control risk, banks specifically restrain from lending got cer-
tain sectors or projects perceived to be very risky. This is.particularly
emphasized in their strong preference for self-liquidating short-term
lending strategy; risk transfer entails sharing risk with external i n -
stitutions, e. insurance company. This becomes necessary because
all risks of bank cannot be completely avoided. Banks assume those

risks, in their operations, that are not and cannot be transferred and
those that are not and cannot be self insurance. The insurance fund is
the networth and incomes earned on current operation serve as the
insurance premium required to keep the networth at an adequate
The importance of diversification was explained by Nwankwo.
In his words.
It is for instance, the heavy concentration in property lending that partly contributed to the faiIure of some banks in the U.K. during the fring bank crisis. In the U.S the collapse of the Penn square bank and 'many Texas and Oklahoma banks was attributed largely to the banks heavy concentration of investments in energy sector; v~hile in West Germany, over exposure to a single borrower, IBH Holdings AG, and its subsidiary companies was responsible for SMH's difficulties and near collapse. When SMH got into trouble its exposure to IBH Holdings was equivalent to 800% of the bank's capital and 40% of its assets. While a certain degree of concen tration is inevitable and may be necessary in certain circumstance, and while a fool proof diversification policy may be difficult to implement, the p;ecept nevertheless still remain that the more diversified, the less the risk.2'
2.4 Measurement and Management of Risk Throuqh Portfolio Theory
Diversification, according to Tewles and Bradley is to spread
out o m ' s investment as a protection against risk. This, they further
explained, is based on the age-old axion "Don't put a11 your eggs in
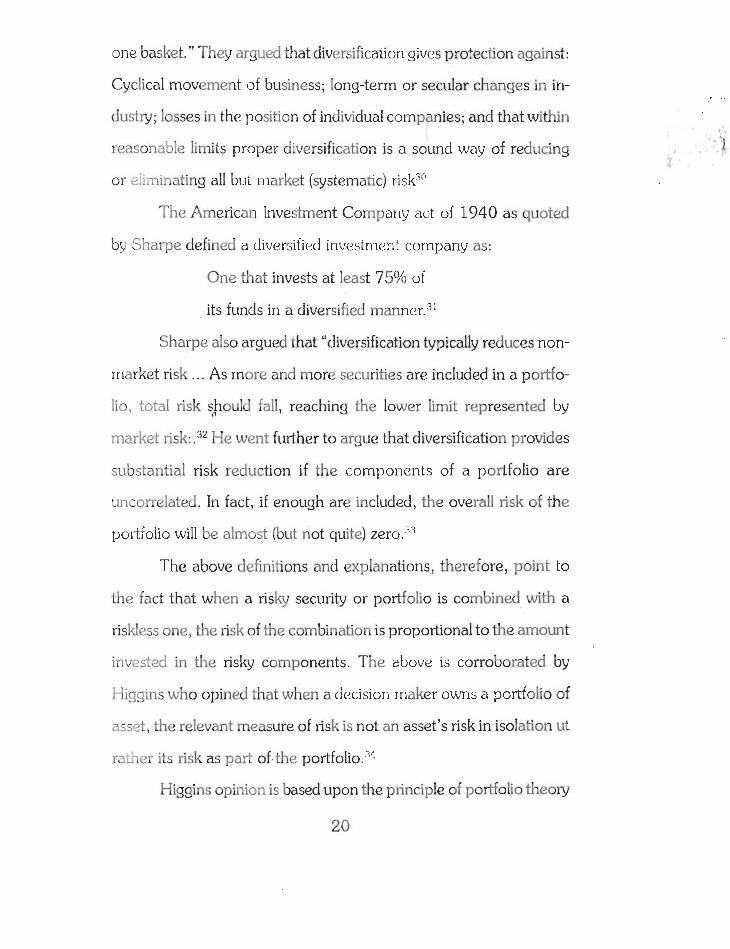
one basket." They argued that diversification gives protection against:
CycIical movement of business; long-term or secular changes in in-
dusty; losses in the position of individual companies; and that within
reasonable limits proper diversification is a sound way of reducing
or ei~~ninating all bui market (systematic) risk""
The American Investment Company act of 1940 as quoted
by Sharpe defined a diversified investment company as:
One that invests at least 75% of
its funds in a diversified manner.?'
Sharpe also argued that "diversification typically reduces non-
market risk. .. As more and more securities are included in a portfo-
lio, total risk should fall, reaching the lower limit represented by
market risk: ." He went further to argue that diversification provides
substantial risk reduction if the components of a portfolio are
uncorrelated. In fact, if enough are included, the overall risk of the
poltiolio will be almost (but not quite) zero.33
The above definitions and explanations, therefore, point to
the fact that when a risky security or portfolio is combined with a
riskless one, the risk of the combination is proportional to the amount
inveskcl in the risky components. The ebove is corroborated by
Higgins who opined that when a decision rnaker owns a portfolio of
asset, the relevant measure of risk is not an asset's risk in isolation ut
rai.1er its risk as part of the portfolio,34
Higgins opinion is based upon the principle of portfolio theory
20

as first enunciated by I-I. M. Markwortz as quoted by Frear who went further
to argce that effective diversification would require estimates off three fac-
tors, namely:
Expected future return of each candidate security.
The expected risk of each candidate security.
The extent to which each security risk correlates with
each other security.
$.nd that based on the above actors, the best portfolio for an investor
will be:
if: two portfolios have the same risk but different returns, the investor
will prefer the portfolio with the higher return.
If two portfolio have the same expected returns but difference degree of risk, the investor will prefer the portfolio with the lower risk.
If one portfolio has both a higher return and a lower risk than an o t b , the investor will prefer the first portfolio.
- h e above assumption gave rise to the "efficient portfolio" concept
descr?c.d by Sharpe. According to him, a portfolio is said to be efficient, if it
has less. risk than others with comparable expected return and more return
than others with comparable risk.35 a
According to Okafor, Measurement Problems arise from the fact that
risk represents an index of the variability of the realized from the expected
rates of retwn. He also emphasized that the degree of risk cannot be as-
sessed with absolute certainty until the final outcome of a investment is known.
He further explained that any of the statistical measure of dispersion, such
21

;s the range, the variance or the standard deviation or its square (the vari-
ance) is the best indicator of investment risk, just as the expected rate of
return is the most widely used measure of investment return. He also ex-
plained that unlike returns, the risk of an investment portfoIio is not neces-
sarily the weighted average of the risk of component securities. Inter-rela-
tionship among the risks of individual securities in the portfolio must be
considered. The interactive risk of securities in a portfolio is measured
either by the covariance or by the correlation coefficient of their returns.36
lie also gave example of how to measure co-variance of returns in a two
assets portfolio. He defined the covariance of returns as:
where: Covxy = Covariance of returns of securi
ties X and Y
X - - Series of observed returns
on security X.
Y - - Series of observed returns
on security Y.
Rx = Mean (expected value)
return on X.
R - - Y
Mean (expected value)
22

return on Y.
n = number of returns
observed.
Similarly, the correlation co-efficient of security in a two as-
set por~ol io is obtained by dividing their covariance by the product
of the standard deviation of their individual returns.
Thus:
where rxy = Co-efficient of correlation
between returns on X and Y.
Sx = risk of security x, i.e
standard deviation of its
return.
S Y
= risk of security y, i.e
standard deviation of its
return.
Weston and Brighams (1979) used the equation below for
the calculation of the riskness of a portfolio, but under the assump-
tion that the distributions are normal.
According to then, the co-variance (COV) between two securities
depends upon:
1. The correlation between the two securities; and
2. The standard deviation of each security's returns. It
23

is calculated as follows:
Cov A,, = p,,GAIrB ........ (2)
Cov A:, - - Co-variance between A and B
PAL3 - - Correlation coefficient between A and
0 B.
/'A and /B = Standard deviation of the securities
returns.
Substituting equation 2 for COV,,, in (1) above
Where:
[P = PortfoIio risk.
W = Percentage of the total portfolio value in
vested in security A.
(I-W)= Percentage of the portfolio invested in secu
rity B;
/A = Standard deviation of security A
= Standard deviation of security B
COVAB = The covariance between securities A and E
~ A B = Correlation coefficient between the securi-
ties. 37
Fabozzi et al. while explaining portfolio theory mentioned
that it is a the0 y that deals with the construction of optimal port-
foiios by rational risks-averse, and its implications for the returns
on different assets, and hence security prices. According to them, 24
one way to evaluate the risk of a portfolio is by estimating the extent to
which future portfolio values are likely to deviate from expected portfolio
return. This is measured by the variance of the portfolio's return and is
called the total portfolio risk Total portfolio risk can be decomposed into
two types of risk: Systematic risk and unsystematic risk. They went further
to explain that systematic risk, also called market risk, is the risk that af-
fects all securities. The beta of any security or portfolio is the relative sys-
terrdic risk of the asset and is measured statistically (using historical return
data) by the slope of the repression between the assets and the market's
returns. The repression line estimated is called the market model Unsys-
tematic risk.is the risk that is unique to a company and it can be eliminated
by diversifying the portfolio. Thus, systematic risk and unsystematic risk
are referred to as non diversifiabIe and diversifiable risk respec t i~e ly .~~
Thus they have developed two measures of risk: One is a measure
of total risk (standard deviation), the other, a relative index of systematic or
noil-diversifiable risk (beta).
The totality of portfolio theory is simply a technique of risk
measurement through standard deviation and risk management by diversi-
fication through correlation analysis of securities returns. This study de-
veloped a model for bank's credit risk measurement and management in
line with portfolio theory.
2.5 Portfolio Analysis and SeIection
Van Horne in his book, financial management and policy, argued
that the best combination of expected value of return and standard devia
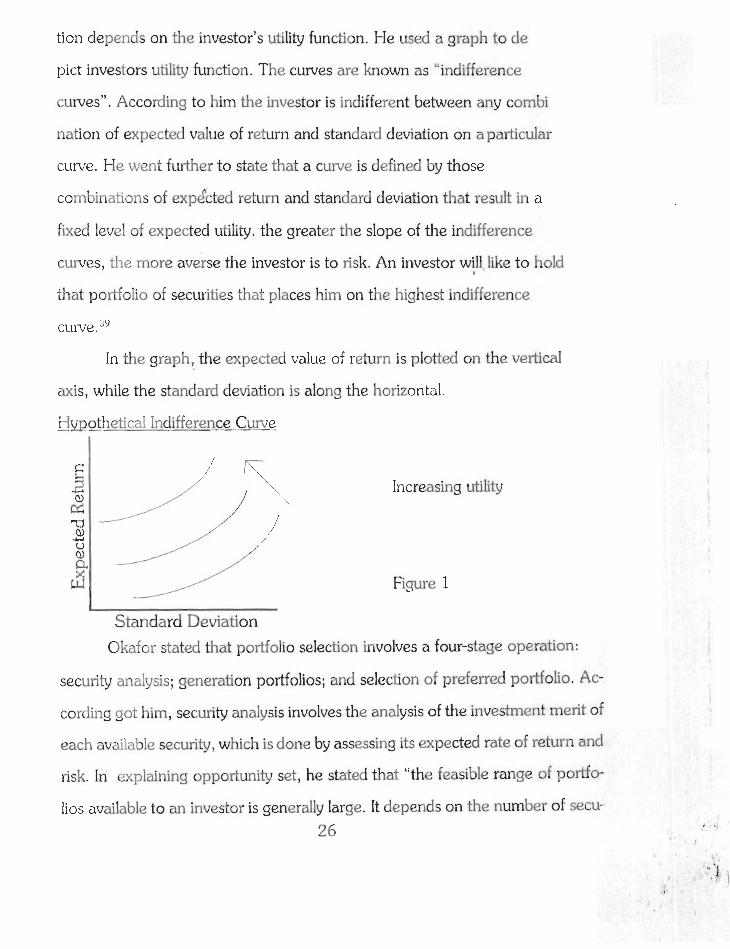
tion depends on the investor's utility function. He used a graph to de
pict investors utility function. The curves are known as "indifference
curves". According to him the investor is indifferent between any combi
nation of expected value of return and standard deviation on aparticular
curve. He went further to state that a cuwe is defined by those
combinations of expe"cted return and standard deviation that result in a
fixed level of expected utility. the greater the slope of the indifference
curves, the more averse the investor is to risk. An investor will, like to hold
that portfoIio of securities that places him on the highest indifference
curve .3c)
In the graph, the expected value of return is plotted on the vertical
axis, while the standard deviation is along the horizontal.
Hypothetical Indifference Curve
I
Increasing utility
Standard Deviation
Okafor stated that portfolio selection involves a four-stage operation:
security analysis; generation portfoiios; and selection of preferred portfolio. Ac-
cording got him, security analysis involves the analysis of the investment merit of
each avdable security, which is done by assessing its expected rate of return and
risk. In explaining opportunity set, he stated that "the feasible range of porifo-
lios available t o an investor is generally large. It depends on the number of sew- 26
rities avai!abIe on the market. For a set of securities, the opportunity set would
be a maximum number of n = C,, portfolios where n is the number of single-
asset portfolio and C,, is the maximum number of portfolios t o be constructed
irom all possible combinations among them."('
He also describe how to identify an efficient portfolio. According to
him, "A pclrtfolio is efficient if it has less risk that any other with a similar
return; 0:- a higher return than any other in its risk class. When efficient port-
folios have been identified, then selection of preferred portfolio will take place.
2.6 The Capital Asset Pricing
Fabozzi et al described the capital asset pricing model as a form of
relationship between risk and return. According to him, it is based on elemen-
tary logic and simple economic principles. Asset with the same systematic risk
should have the same expected rate of return; that is, the price of assets in the
capital markets should adjust until equivalent risk asset have identical expected
returns.";
Van home explained that there is implied an equilibrium relationship
betweer: risk and expected return for each security. He further explained that
a security will be expected to provide a return commensurate with its unavoid-
able risk. This is simple the risk that cannot be avoided by diversification. The
greater the unavoidable risk of a security, the greater the return that investors
will expect from the security. The relationship between expected return and
unavoidal' isk, and the valuation of securities that follows, is the essence of
capita1 z ;w pricing mode. This model was developed by Sharpe and Lintner
in the 1960's and it has had important implication for finance ever since.42
For proper risk analysis, projects must be properly analysed and evalu-

ated. Betterley wrote that the objective of risk management is proper protec-
tion of company assets and profitability against loss from pure risk. This pro-
tection is accomplished by systematic analysis of risks and the employment of
various techniques aimed at reducing potential loss from these risks. He rec-
ommended the following steps to project analysts and financiers or proper
evaluation of projects.
Make actual visits to project sites.
Interview heads of departments and operating divisions regularly to
learn their problem area. Maintain close communication to keep
abreast of changes.
Educate the people processing orders (and loan application) t o be
alert for indications of new exposures to risk.
Establish a routine or reviewing agreements with clients.
Study inspection reports submitted by project monitoring team.
Read house journals, news releases, etc. of clients.
Learn from the misfortune of others.
Be guided more by potential severity that probability in performing
risk analysis.
Risk analysis is a never encling process; so repeat t h e s ~ steps over
and over again.""
In conclusion, the totality of portfolio theory is simply a technique of
risk measurements. This study, developed a m d e l for banks credit risk
measurement and management in line with portfolio theory.

REFRENCES
Okafor, F. 0. Investment decisions. (Southampton: The Camelot Press, 1983), p. 28.
Pandey, I. M. Financial Management. (New DeIhi: Vikas Publishing House PVT Ltd., 1991), p. 573 .
Weston & Brighams, Managerial Finance. (New York: The Dyden Press, 1978), p. 247.
Irukwu, J. 0. Accident and motor Insurance in Africa. (Ibadan, the Gaxton Press, 1974), p. 4
Pappas, J . L. and Brigham, E. F., Managerial Economic. 3rd ed., (Illinois: The Dyden Press, 1979, p. 74.
Pardy, C. 0. Readings in risk and risk bearinq. (Chicago: University of Chicago Press, 1924), p. 1
Tings, W. Multinational risk Assessment and Manaqement. (Quorum Books, 1958), p. 22.
Higgins, R. C. Evaluatins investment osportunity. (New Jersey: Prentice-Hall Inc., 1 9 8 1 , p . 22.
Sharpe, W. F. Investments. 3rd ed. (New Jersey: Prentice-Hall, Inc., 1978), p. 579.
Ruth, P. M., Planning on uncertainty (John Wiley and Sons, Inc., 1971), p. 1.
Willet, A. H., The economic theory of risk and insurance. .(~hila$elphia: University off Pennsylvania Press, 195f), p. 6.
Pfeffer, I. Insurance and economic theow. (Illinois: Richard D. Irvin, Inc., 19561, p. 42. ,
Ho~xton, D. B. "Risk insurance and sampling". In J . D. Hammond,

Essays in the Theory of Risk and Insurance, (Illinois: Scott, foreman and Co., 1968), p. 152.
14. Ibid.
15. Kngiht, F. H. Risk, uncertaintv and profit. Bonston: Houghton Mufflin, 1921), p. 233.
17. Weston & Brigham, Op.' cit., p. 251.
18. Monbray, A. H. Insurance : Its theorv and practice in the United States. 1st ed. (New York: McGraw-Hall Book Co., Inc., 1930), pp. 4-5.
19. Balauch, F., et aI. Acceptable risk. (Cambridge University Press, 1983), p. 6.
20. Kulp, C. A. Casualtv insurance. (New York: Ronald Press, 1928), pp. 4-7.
21. Huggins, R. C., Op. cit., p. 272.
22. Fabozzi, et al. Foundation of financial markets and institutions. , .
(Englewood Cliffs: Prentice-Hall International Inc., 1994), p. 265. .: '1
23. Osubor, J. U. Business finance and bankinq in Nigeria. (Owerri: New Africa Publishing Co. Ltd., 1954), pp. 178-179.
24. Okafor, F. O., Op. cit., pp. 32-33
25. Johnson, et a]., Commercial bank management. (New York: The dryden Press, 1985), pp. 46-48
26. Nwankwo, G. 0 . Bank manaqement principles and practice. (Lagos: Malhouse Press Ltd., 1991), p. 138.
27. Rose, P. S. (1987), p. 54.

29. Ibid.
Teweles and E. S. Bradley, The stock market. (New Jersey: John Wiley and Sons, Inc., 1982), p. 345.
Higgins, R. C., Op. cit., p. 271
Sharpe, W. F. Op. cit., p. 580.
Ibid .
Higgins, Op. cit., p. 271.
Frear, J., The manasement of business finance. London: Pitman publishing Ltd., 1980), p. 233.
Okafor, F. O., Op. cit., p. 189.
Weston & Brigham Op. cit., pp. 257-258.
Fabozzi, et aI. Op. cit., p. 232.
Van Horne, J. C., Financial Manaqement and ~ol icy. (Englewood Cliffs: Prentice-HalI, Inc., 1989), p. 58.
Okafor, F. O., Op. cit., p. 192.
Fabozzi, et aI. Op. cit., p. 273.
Van Horne, J . C., Op. cit., p. 61.
Betterley, G. M., "Risk management." In Mayrard, H, B. (ed.) Handbook of business Administration, (New York: McGraw-Hill Book Co., 1970), p. 78.

CHAPTER THREE
RESEARCH METHODOLOGY
This chapter is concerned with methods with which data were col-
lected, their sources, determjnation of sample size, method of analysis of
data and test of hypothesis. Included in the chapter, is a model suggested
for :isk measurement and analysis.
3.1 Sources of Data
Two main sources of data were used to calIect information by the
researcher. The sources were prima y data and seconda y data.
In gathering the primary data, the researcher used sample survey of
selected commercial, merchant and development banks in Nigeria. The
study excluded mortgage banks which in the banking industy are relatively
new and established specifically to cater for a segment of the economy -
estate development. Also the study excludes, the community banks which
like the Mortgage banks are relatively new to allow for operational assess-
ment.
The s a m ~ l e survey of the banks was considered necessary because it
is t h r o ~ g h it that data required to test the stated hypotheses are to be gener-
ated.
In addition to the primary data collected, secondaQ data are ob-
tained from research literature and conceptual literature. From research
Iiterature, past research related projects and research work are consulted,
while in the conceptual literature, data were obtained from textbooks and
journals, etc. 32

3.2 Population and Sample
The research population comprise all the 125 registered commercial, merchant and development banks, in Nigeria as at December 1993. (See
Appendix 3). Our determination of sample size will be based on this figure.
The actual sample size is determined by using the formular.
Sample size N 1 + N(r)"
Where:
N - - Total Population
r - - Error estimate.
The total population (N) is 125
The error estimate (r) is 10%)
Sz-nple size is therefore:
Sample - - 125
Size - - 1 + 125 (0.1)2
f l
56 Approx,
Based on the above calculation fifty six (56) questionnaires were
printed an distributed. The selection of the sample was done through s imple I
randolr. sampling.
3.3 Vethod of Data Collection
Survey questionnaire was employed in collecting relevant data for the
study. The questionnaire was well structured, so as t o provide a precise
answer for easy analysis. The questionnaire was also designed so as to
enable respondents, in some cases, to select responses from among alterna-
33

tive answers supplied, and in others, to supply the answers themselves when
the questions involved are unstructured. The survey questionnaire was per-
sonally administered to the respondents ostensibly to minimize the low re-
sponse and in most cases, non-response syndrome characteristics of most
research survey in Nigeria. Despite this, the researcher was not able to collect
the fifty-six (56) questionnaire administered, only forty-two (42) were collected,
which represents about 75% of the sample size Data analysis will be based on
the collected questionnaires.
3.4 :Jethod used for Data Analysis
The raw data collected from the selected commercial, merchant and
development banks are translated into percentages so as to enable the
researcher draw a reasonable conclusion based on the information collected. 0
Tables were used to analyse the responses derived from the question-
naire. Analysis of data also include test of hypothesis, which is to determine:
1. Whether effective loan diversification through risk and correlation
analysis of banks credit investments is not in practice.
2 . Whether the distribution of respondents between different options
as to the effects of diversification of banks credit portfolio is
not significantly different between the three classes of banks.
3. Whether Central Bank of Nigeria's (CRN) sectoral loans allocation
guidelines do not inhibit effective diversification of banks
lending.
In order to reach conclusion on those issues, answers supplied by
respondents to the relevant survey questionnaire were quantified and sub-

jeded to appropriate statistical test namely, product-moment co-efficient of
correlation and variance analysis test using ANOVA table. Different statistical
charts will also be used for clearer presentation.
3.5 The "roposed Risk Analvsis and
Measurement Model
The researcher proposed the following methodology framework for
risk analysis measurement and control in banks credit portfolio.
Since a portfolio already exists, arising from the combine effect of all
past decisions, this model therefore seeks to determine the risk of the existing
portfolio and that of the additional loan investment, together with their
correlationship, using the standard deviation and the correlation coefficient,
whereas the isrobable st@e of the economy becomes the risk vector.
The model is based on credit risk analysis using the popular statistical
approach to 'he measurement and control of risk, involving calculation of
"portfolio return" (aggregate returns) "expected value", ''standard deviation",
"Co-variance" and "Correlation co-efficient" (See Appendix I for the picto-
rial iIlustrakion). The mechanics of the m d e l follows the logical steps pre-
sented below:
Sten 1: The first step in the application of the model requires the
aggregation of the existing portfolio's return. The portfolio return is simply
the weighted average of the portfolios individual loans (Security) returns.
-r A hus:
R C
- The portfolio return. 35
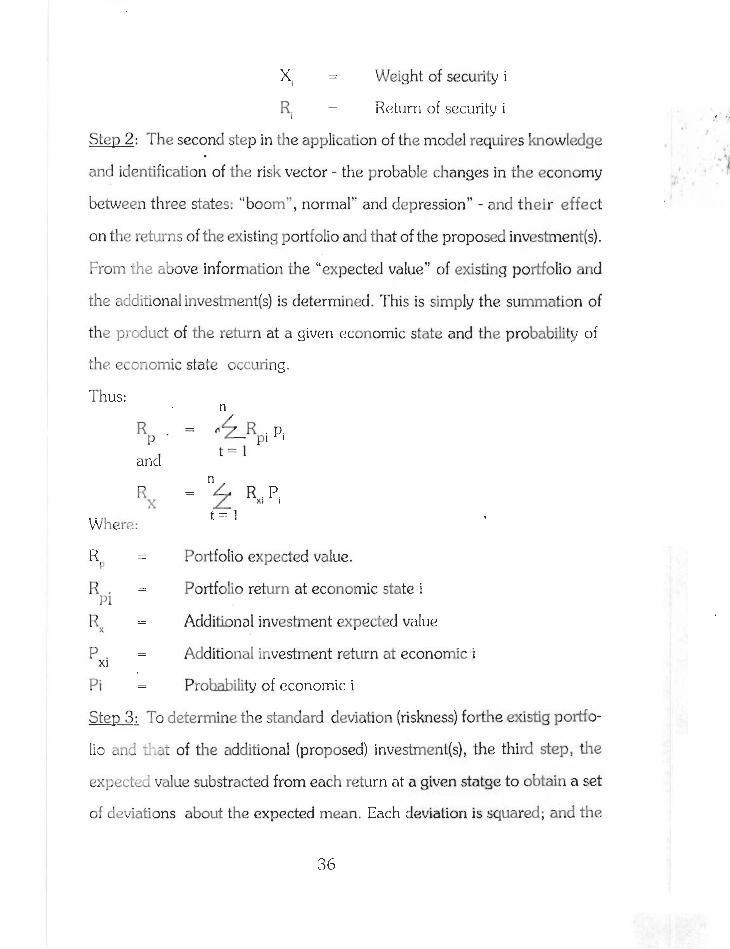
Xi = Weight of security i
R, = Return of security i
Step 2: The second step in the application of the model requires knowledge
and identification of the risk vector - the probable changes in the economy
between three states: "boom", normal" and depression" - and their effect
on the retuns of the existing portfolio and that of the proposed investrnent(s).
From the above information the "expected value" of existing portfolio and
the additional investment(s) is determined. This is simply the summation of
the p r~duc t of the return at a given economic state and the probability of
the eco:-iomic state occuring.
Thus: n
R P .
= "R p i P '
t = l and
R s = "4 Rxi Pi
Where: t = 1
R P
= Portfolio expected value.
R - .- Portfolio return at economic state i pi
R .- - X
Additional investment expected value
P - - xi Additional investment return at economic i
Pi = Probability of economic i
Step 3: To determine the standard deviation (riskness) forthe existig portfo-
lio and ?;at of the additional (proposed) investment(s), the third step, the
expectec; value substracted from each return at a given statge to obtain a set
of deviations about the expected mean. Each deviation is squared; and the

squared deviation is multiplied by the probability of the occurence of the given . economic state; the products are then summed to obtain the variance of the
probability distribution, the square root of which give the standard deviation:
Standard Deviation = P /'% ( Rp, - fip = j2 Pi t= 1
and
Standard Deviation
of additional investment x= /-
t = l
Step 4: Having worked independently with the two investments, the first
attempt at risk comparison is step 4; where the covariance of the existing
portfolio's return with that of the additional investment is analysed by the
summation of the product of the set of deviations of the two investments and
their probabilities at the given economic states.
Thus:
Step 5: Finally in order t o determine the degree of association of the risk
of the exist!:.: portfolio with the additional investments, their correlation co-
efficient 51; ;Jd be determined by the quotient of the co-variance of the port-
folio and additional investment to the product of the portfolio standard devia-
tion and that of the additional investment.
Thus:

Correlation co-efficient - - r = Covariance PA
Interpretation of Correlation Co-efficient (r)
The value for correlation coefficient ranges from + I (perfectlyposi-
tive correIation) to - 1 (perfectly negative correlation). Diversification in lend-
ing therefore, will be effective; if additional loan investment are in loans which
are nqatively correlated with the existing loan portfolio,
CHAPTER FOUR
PRESENTATION AND ANALYSIS OF DATA
The data collected from the survey questionnaire are presented and
analysed in this chapter. Raw scores are converted into percentages for
easy analysis. The three hypotheses made in Chapter one are tested in
this chapter. Product-moment coefficient of correlation and variance analysis
are the methods used to test the hypotheses. Diiferent statistical charts are also
used for ck-mr presentation.
Du,:~g the research, a total of fifty-six questionnaires were distributed.
The figure was determined by sample formular.
N
1 + N (r2)
When N is the total population
r is the error estimate
Out of the fifty-six (56) questionnaire administered, forty-two (42)
were collected. This figure is regarded as data producing sample. Theanaly-
sis will be based on the forty-two questionnaire collected.
4.1 Fata Analysis
Question 1: Which class of Banking does your bank fall into? The study
attempted to classify the respondent banks according to their business areas. They were asked to indicate which of the foIlowings: Commercial, merchant and development - class of banlung operations their banks are engaged. Since the classification was distinct the respondent answered as shown in Table 1.

Table 1
Classification of Respondents Bank by their
P,rer.s of Banking Operation
Option No. of Respondents Percentage
Commercial 18 43
Merchant 21 50
Development 3 7
I Total 42 1 0 0 1 The above table shows that 18 respondents representing 43% specifi-
caily chose commercial banking as their operational area; 21 respondents
being 50% indicated merchant banking while 3 (7%) chose development bank-
ing. Majority of the respondents are merchant bankers. The result shows
that the research covers different classes of banks. This will make the result
from the analysis of data more acceptable, though there are other
classes of banking that are not mentioned. ' ' 1 , I
Q~iestion 2: Does your Bank review its credit application with a view to
determine their riskness?

Table 2
Opinion on Risk AnaIvsis of Credit A~pIications
Optim No. of Respondents Percentages
1 Total 42 100 1
In line with the view expressed by the researcher in Chapter one, all
the respondents agreed to reviewing credit applications by their banks with a
view to determining their riskness prior to its approval. Forty-two (42) respon-
dents representing 100% agreed that they review their credit application be-
fore approval.
Question 3: If your answer to question 2 is yes? what techniques do your
bank employ for its analysis?
Table 3
Techniques for ~rGdi t Application's Risk Analvsis
I
Options
Historical Analysis
Standard deviation
Ratio analysis
Transaction dynamic
41
No. of Respondent
33
-
35
26
Percentage
79
0
83
62
4

Although all the respondents agreed (in the last question) to review-
i r , ~ credit applications by their bank with a view to determining their riskness,
there exists divergent views as to the method adopted for risk anaIysis. Table
3 shows that 33 of the respondents which represents 79% adopt historical
analysis, 35 (83%) adopt ratio analysis,; 26 respondent being 6296, chose
future transactions, commencing from the time of loan approval to loan re-
payment with a view to identifying risky areas of the transactions as to make
adeqrmte provision for their control. None of the respondents chose stan- fl
d a d deviation technique of risk analysis. This is an indication that this tech-
nique of risk analysis and quantification is not in practice, despite acclaimed
usekhess in theory. With the above result we can generalize that no bank
use standard deviation as a technique for calculating theriskness of a portfo-
lio 01- investment.
Question 4:
In a survey by Nigeria Deposit Insurance Corporation (NDIC), it was
discovered that most state governments owned banks are technically
insoIvent, basically arising from non-performing loan portfolio. Which
af the following do you think is the major cause of the above problem?

Table 4
Causes of State Government Banks Insolvency
1 Options No. of Respondents Percentaqe
Loan concentration on government and its ar,r-cies fl 10
Improper loan appraisal techniques
Poo:- Management
1 Others 2 5 I I Total 42 100
In answering the question above, as Table 4 shows, 1 Oresponden(249b)
are of the opinion that the cause of insolvency of stategovernment owned
banks is Icm concentration on government and its agencies, 22 respondents
(52%) chose improper loan appraisal technique as the cause of banks insol-
vency. Eqht (8) respondents (19%) suggested poor management and two re-
spondent (5% give other reascns, these reasons indude poor collatarisation of
loans. This table reveals that the bane of State Government owned banks is
not necessarily its loan concentration in government sector, but basically that
of improper loan appraisal techniques.
This table can also be used to answer the questions stated in Chapter 1
under Statement of Problem. The questions go like this:
'kvhat could be done to eliminate or at least reduce the magnitude of
the risk and uncertainty in bank lending portfolio and hence assist increating
43

an easy and undistributed investment cycle in bank lending.
Why does lending risk exist? What are the causes of the reported high risk in bank lending?
n' Question 5:
Do you think it is necessary for a bank to diversity its loan portfolio?
Table 5 ,
Opinion on the Necessity for Diversification of Loan Portfolio
Option No. of Respondents Percentage
Can't Say - -
I Total 42 100 I Pi1 the 42 (100%) respondents agreed that it is necessary for a bank
to diversify its loan portfolio (See Table 5).
Question 6:
In your opinion, do you think the quality of a bank's loan portfolio can be enhanced through effective risk diversification.
Table 6
Respondents view on the Enhancement of Banks Loan Portfolio throush Effective Risk Diversification

Options No, of Respondents Percentage
i Yes n
34 81 I I No 6 14
1 Can't Say 2 5
1 Total 42 1 0 0
It was the opinion of 34 (18%) respondents that effective risk
diversification can enhance the quality of bank's ioan Portfolio, 6 respondents
(14%)) objected the view that effective risk diversification enhances the quaZity
of bank's ioan portfolio, while two respondents (5%) could not express opin-
ion on rke issue.
Question 7:
h e s your bank embark on Correlation analysis of the risk of proposed
loan invesiment with that of the existing loan portfolio with a view to risk di-
versification prior to loan approval?
Table 7
Opinion on the Employment of Correlation
Analvsis for Effective Risk Diversification
Options No. of Respondents Percentage -
Yes
No
Can't Say
Total 42 100

Only three (7%) respondents agreed that their banks employ corre-
lation analysis. 36 (86%) Respondents agreed to the absence of a formal
correlation risk analysis technique, white the remaining (7%) respondents
couiL not give their opinion on the issue. This can be interpreted to mean
that the respondents who do not give an opinion on the issue d o not under-
stand what correlation analysis means. Most banks do not carry out the
analysis.
Question 8:
i: your answer to question 7 is "yes" what technique does your bank
em>loy for the analysis.
In the proceeding question: Question No. 7, only 3 respondents
were of the opinion that their banks embark on correlation analysis of the
risk of proposed load investment with that of the existing loan portfolio
with a view to risk diversification prior to loan approval. Although, these
respondents agreed that their banks employ correlation analysis, they do
not mention the technique they adopt in the analysis. This could be inter-
pretcd to mean that the respondents either do not know the technique in
use by their banks, which is not likely, given the status of the respondents,
or rfiey provided wrong answers.
A discussional interview with some of the respondents shows that in
practice, diversification is achieved through budgetary limits for different
sectors, and government securities subject to regulational requirements of
CentraI Bank of Nigeria (CBN); pointing to the absenceof the use of port-
46

folio theory in banks credit portfolio management.
Que'stion 9:
Since the inception of the Central Bank of Nigeria's (CBN) prudential
yuide;incs, how can you classify your banks provision for bad and
doubtful debts?
Table 8
Classification of Banks Provision for
Bad and Doubtful Debts
Options
Rising .
Fdling
.%able
Can't Say
No. of Respondents
36
Percentage
The above table reveals that most of the respondents 36 representing
Total
86% bclieve that since the inception of the prudential guideline of CBN,
their ~rovision or bad and doubtful debts have been rising. Their reason for
the above, they believe, arises from the stringent requirements of the guide-
line and the increase in volume of their loan portfolio, and not necessarily a
42
decline in quality of their loan portfolio since most of the provisions are usu-
100
ally recovered.
Question 10:
For the purpose of effective loan diversification, how can you clas-
sify the central bank of Nigeria's sectoral loan allocation guidelines. 47

CBW: Sectoral Loan Allocation Guidelines Effect on Diversification
Options
Enhance
Inhibit
Has no effect
Can't Say
No. of Res~ondents 1 ~ercen ta se
Twenty four (24) respondents representing 57% were of the opin-
I
ion that the CBN's sectoral allocation guidelines enhance effective loan
diversification, respondents (29%) believe that it inhibits effective diversifi-
I
catica, while 6 respondents (14%) could not express opinion on the issue.
Many of the respondents would think that effective loan diversifications is
w k n loans are given to different sectors of the economy, according to
CBN's guideIines without looking at the correlation of their loan portfolio.
In actual sense, effective diversification of loan portfolio is deemed to
exist, if the loan are negatively correlated.
Question I 1 :
Would you wish to see the scrapping of the CBN's sectoral loan
allocation guidelines?
Total 42 100
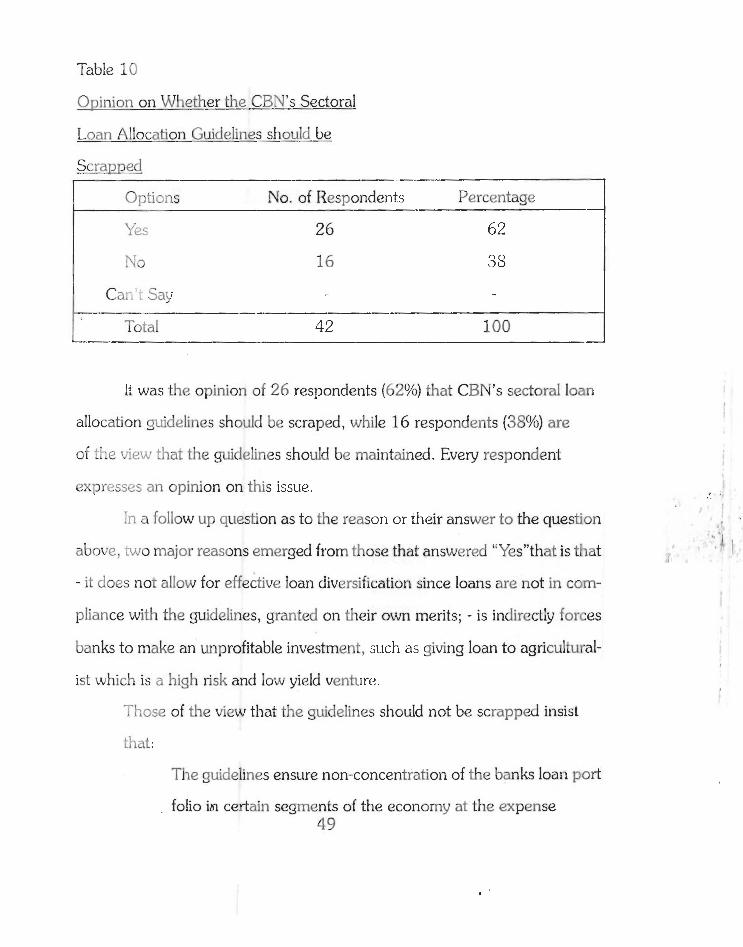
Table 10
Opinion on Whether the CBN's Sectoral
Loan Allocation Guidelines should be
Scrapped
Optims No. of Respondents Percentage
1 Total 42 100 1
It was the opinion of 26 respondents (62%) that CBN's sectoral loan
allocation guidelines should be scraped, while 16 respondents (38%) are
of the view that the guidelines should be maintained. Every respondent
expresses an opinion on this issue.
In a follow up question as t o the reason or their answer to the question
above, two major reasons emerged from those that answered "Yeswthat is that
- it does not allow for effective loan diversification since loans are not in com-
pliance with the guideIines, granted on their own merits; - is indirectly forces
banks to make an unprofitable investment, such as giving loan to agricultural-
ist which is a high risk and low yield venture. - 1 hose of the view that the guidelines should not be scrapped insist
that :
The guidelines ensure non-concentration of the banks loan port
folio in certain segments of the economy at the expense 49

of the others;
- the guidelines also have a favourabte impact on economic
development, since most of the sectors of the economy were
considered.
They argued further that the problem is not with the guidelines but
with its implementation and monitoring which they hope the Central Bank
o; 5i;cria will intensify to ensure the attainment of the objective of the
guidelines.
4.2 Hypothesis Testinq
The first and third hypotheses will be tested using product-moment
co-effi::' - -. cf correlation while the second will be tested using variance analysis
(ANC . . :). For each test two related questions would be used. Pie Chart and
Bar Chart would also be used for clearer presentation.
hkothesis 1
Null Hmothesis (Hol: Effective loan diversification risk and correlation analysis
of banks credit investment is not in practice.
Alternative Hy~othesis (Hi): Effective loan diversification through risk and
correlation anaIysis of banks credit investment is in practice.
Question 2 and 7 (Table 2 and 7) will be used to test this hypothesis.

Table 2
Opinion on Risk Analysis of Credit Applicatjon
I Options No. of Respondents Percentaqe
Yes
No
Can't S2y
Table 7
Opinion or, the Ern~loyment of Correlation
Analysis for Effective Risk Diversification
Options No. of Respondents Percentage
Yes
No
Can't Say
Pie Chart Representation of Table 7
Fig. 1

Can't Say - 3 x 360 42
Bar Chart Presentation of Table 1
Fig 2
TabIe 1 f
Yes
No
Can't Say.
,Hvnothesis 1 Table (x-X)
Option x Y D(-X) (Y-Y) (Y-Y) (x-X)"-T)Y)' 'I
Yes 42 3 28 -11 -308 784 121
I i Can't Say 0 3 -14 -11 154 196 121 1 Total 42 42 -462 1176 726

Note: X data are extracted from Table 2.
Y data are extracted from Table 7.
G/ '7
Where ZT = Critical value from the Standard
normal table.
- - Standard Error.

Using 1% level of significance
' n - 1 / 3 - 1
- - 1.82 I
Ho is accepted if r < Z 56; n - i
Thus, - 0.5 c 1.82. We therefore accept the null hypothesis and
conclude that effective loan diversification through risk and correlation
analysis of banks credit investments is not in practice.
Hypothesis 2
Null Hrlpothesis (Ho): The distribution of respondents between different
options as to the effects of diversification of banks credit portfolio is not
significantly different, between the three classes of banks.
Alternative Hwothesis: The distribution of respondents between different
options as to the effects of diversification of banks credit podfolio is signifi- n
cantly different, between the three classes of banks.
This hypothesis will be tested using variance analysis test. The ANOVA
table for the test will be extracted from TabIe 5 and 6. , ~

Table 5
Opinion on the Necessity for Diversification
of Loan P d o l i o
Table 6
respond en:^ View on the Enhancement of
Banks Loan Portfolio throush Effective
Risk Diversification
Option 1 %s
I No i 1 Can't Say
No. of Respondents
42
-
-
aption I Yes
NO n
Can't Say
Percentage - 100
-
-
No. of Respondents
34
6
U 3
Percentage
81
14
5

Key:
Yes
Ns
Can't Say
Fig 4
i I I Yes
0 0 0 Can't Say.

Table 12
Hvnothesis 2 TabIe
Question Option
5 Yes
No
Can't Say
6 Yes
No
Can't Say
The relevmr aata-for the analysis were:
x2
13 22
0 0 0
0 0
12 19
5 I
i 1
Total Commercial Merchant
42 18 22
0 0 0
0 0 0
34 12 19
6 5 I
2 1 1
Dev. , .
2

Extracted from Table 12
Table 13
Pre!b--'m-g Calculation for Applvinq
Variance Analysis Test
Bank Classi No of fication 1 Ob.sENantl
Merchant bank n, = 6
Develop- ment bank n, = 6
Sum of Squares = n
Sum of Value
Xii=36
X,,=43
xs i=5
Mean isurn of Squares Value Value
t n Between Classes = T: - ( X)Z, Ti =SX.. - 11 t = 1 11
n.

- - 136.3333
Within class sum = 5 ~ . 2 -
= 1354
Table 14
Analysis of Variance
I Nature of Degree of Sum of Mean Square (Variance) I Varjjability Freedom Square
Between
Classes 68.1667 I
Within i Classes n - K = 1 5 825.6667 55.O444
Note: K = number of groups or classes on which observation
were made for this test, K = 3.
Based on the foregoing analysis, we determine whether the variance
Szhveen the mean responses obsenred on the different banking groups is
sig;:lficantly greater than the variance within these groups.
The observed variance ratio is given by
59

The observed variance (F) ratio is 1.24, while the critical value of
F,, 15 at 0.05 level of significance is 3.68. These results were interpreted to
mean ti-& the variance between and within the groups responses is not sig-
nificant; hence we accept the null hypothesis and conclude that the distribu-
tior of respondents between different options as to the effects of diversifica- n
tion of banks credit portfolio is not significantly different between the three
classes of banks.
Hy~othesis 3 1
Null Hypothesis (Ho): CBN's sectorial loans allocation guidelines do not in-
hibit effective diversification in banks lending.
AIte:-native Hypothesis (HZ: CBN's sectoral loan allocation guidelines d o in-
l-,ibii effective diversification in banks lending.
Product moment coefficient of correlation will be used to test this
hypothesis. Tables 8 and 9 will be used.
Table 8,
Classification of Banlcs Provision
for Bad and Doubtful Debts

. , . _:iestion Rising FaIling Stable Can't Say
;-low can you cIassify
your bank provision
for and and doubtful
debts 36 - 2 4
CBX's Sectoral Loan Allocation Guidelines --
Effect or; Diversification Question Enhance Effec- Inhibits Has no Can't say
tive Loan Effective Effect . Diversification Loan Diver. a .
How can you classify the CBN's S:;- toral LC- a i ! ~ ~ x i ~ : i g ~ d b e h e s 24 12 - 6
Tab!e 15 PRODUCT MOMENT COEFFICIENT OF CORRELATION

Comparison: Using Z <~7- 2
Where Z-' = 2 Critical value from the Standard
normal tale.
7 - - Standard error.
Using 1% leveI of significance.

The null hypotflesis is accepted if r < Z , r Thus: 0.85 c 1.48.
We therefore accept the null hypothesis and conclude that CBN's sectoral
loans allocation g~udelines do riot inhibit effective diversification in lending.
- Chart Presentation of Table 8
Fig. 5
P,isir,g - 36 x 360° - - 309O
42
Stable - 2 x 360° - - 17"
42
Can't say 4 x 360° - 24O - -
42
Pie Chart Presentation of Table 9
Fig. 7

Enhance
Inhibit
Can't say
Bar C!;al? Presei
35
30
25
20
15
18
5
&:
24 x - 360 = 206O
42
x 360 = 1 03O
42
6 x - 5 1c
42 able 8
oooCan't say

Uar Chart Presentation of Table 3
1 1 1 Enhance effective diversification
- --- Inhibit effective diversilication
CHAPTER FIVE
SWAIZY, CONCLUSION AND RECOMMENDATION
5.1 Adov~ion of the Susqested Risk
Ar-c?iysis Model in the Banking Industry
All the survey banks do not adopt any specific model which ensures
sound brlsis for risk determination, analysis, and quantification applicable as
a continual means or risk minimization in their loan portfolio management.
But they all adopt one technique or dynamics for individual credit risk analysis
and the use of budgetary limits for loan diversification. 0'
Aithough the above techniques ensure certain degree of risk identifica-
tion and mzasurement, they individually have their flaws;
distorical analysis is simply a measurement of past trend and making
infere:?m into the future with the knowledge gained. Ratio analysis, like the
historical analysis, used past events, comparison of the figures, to forecast for
the future.
We draw inference from Ray (1981) to criticize the above ap-
proaches to risk measurement. According to Ray:
The importance of such measurement lies in the probability of predicting future losses from a study of the past records. But not infrequently, nature is found to outdo all its own past behaviour, resulting in wide deviations from the average loss-cost calculated from its past experience.
Thus, the historical and ratio analysis concept certainly predicts
"hture risk from a study of the past records", but does not quantify the
future A c , that is they are not related to any standard measure of risk.
Transaction dynamics - which is a forecast of future activities, though
futuristic in nature also lacks the merit of standard measure of risk.
Despite the flaws of the above approaches, they are basically em-
pIoyed as a too1 for singIe risk analysis contrary to risk comparison upon
which this i-csearch is based. In this area there exists no form of standard-
ized med~odological approach in the banking industry. The technique of
budgeta:y limits as a diversification tool suffers the setback of not being
based on any form of standard measure and correlation of risk; it therefore
cannot yield an effective diversification decision.
The model we propose for credit portfolio management (See Chap-
ter 3) simp!y is an attempt at contributing knowledge towards the solution of
the forcgoi:ig.risk analysis and control omissions in credit portfolio manage-
ment. The model directly quantifies the risk associated with the existing
credit portfolio and that of the proposed additional investments. On the
basis of ccrrelation analysis, the investment that will minimize as well as
maintain the banks returns requirement isselected. The superiority of this
model is derived from Ray's assertion.
A knowledge of the amplitude of fluctuation or dispersion of deviation from the mean, is necessary in order to have a fairly accurate assessment of the hazard.
. - i he model is not only useful as a tool for selecting from alternatives

but can be of use in deciding what interest rate t o charge for a given loan
inves%ment. In this area the model becomes a useful tool for adaptation of
the CAPM in the banking industry; CAPM is simply a tool for determing the
lisk ;=.rzmiurn, interest rate, to be added to the bank's required rate of return
to arrive at the interest rate to be charged for a given loan. This is achieved
by multiplying the correlation co-efficient of the investment to the portfolio
with the standard deviation of the investment and dividing the product with
the standard deviation of the existing portfolio.
The quotient so calculated is added to the required rate of return to
arrive at the interest rate chargeable for the given loan.
5.2 Findi~g
The survey confirmed the formulated hypothesis, that effective loan
diversification through risk and correlation analysis of banks credit invest-
ments is not in practice; the distribution of respondents between different
options as to the effects of diversification of banks credit portfolio is not
significantly different between the three classes of banks. Majority of the .. j : . I
resp~ndents in each of the three classes of banks agreed that effective diver-
sification will enhance the quality of banks credit portfolio; and that CBN's
sectcral Ioan allocation guidelines do not inhibit effective diversification in
bank iending.
The forty-two banks in study comprise of 18 commercial banks, 21
merchant banks and three development banks. All the respondents agreed
that their banks review their credit applications with a view to determining
their riskless. The banks used different techniques of credit analysis. Thirty
thrm (33) banks~lsed historical analysis, 35 ratio analysis and 26 use trans- 68

0'
action dynamics. No bank uses standard deviation as a technique for risk analy-
sis. Ten (10) banks representing 24% suggested that the cause of insolvency of
government owned banks is loan concentration on governmept and its agen-
cies. Twenty two (22) respondents suggested improper Ioan appraisal tech-
niques, 8 s~r2gested poor management and 2 banks gave other reasons which
include jjoor collaterisation of loans. Every respondent agreed that it is
neccessaryr to diversify bank's loan portfolio. Thirty four (34) banks agreed
that the qaality of a bank's loan portfolio can be enhanced through effec-
tive risk diversification 6 banks disagreed with the view and two banks couldn't
make their opinion on the view. Three banks embark on correlation analysis
of the risk of proposed loan investment with loan portfolio with a view to risk
diversification prior to loan approval, b~i t when asked the techniques they
used, they didn't mention any technique. Thirty six (36) banks do not embark
or, correlation analysis while three banks could not express their view. Thirty
six banks c!assify provision for bad and doubtful debts as rising since the incep-
tion or CZN's prudential guidelines. Two (2) banks as stale and 4 banks could
not express their view. Twenty four (24) banks were of the opinion that CBN's
sectoral Ioan allocation guidelines enhance effective loan diversification, 12
banks opined that is inhibits effective diversification, 6 banks did not express
opinion on the view. Twenty six (26) banks would wish to see the scrapping of
the CBN's sectoral loan allocation guidelines but 16 banks would not.
The highlights of the research findjng are summarized below:
1 Iiisk Quantification through standard deviation analysis is not yet
and will not in the foreseeable future, be a popular practice in
the banlung industry. The bankers feel the effort involved in the 69

task of risk quantification is not economical and that most of the
required information for its computation is not readily available.
2. Diversification as an operational concept in the bank's lending
portfolio was consented to by all the respondents as an essential
factor in bank's operation.
3. Most of the bankers who responded to our questionnaires believed
that since the inception of the prudential guidelines of CBN, their
provision for bad and doubtful debts have been rising. Their reasons
of the above, they believe, arises from the stringent requirement of
the guidelines and the increase in volume of their loan portfolio
and not necessarily a decline in quality of their loan portfolio,
since most of the provisions are usually recovered.
. The research also revealed that the bane of state government owned
banks is not necessarily its loan concentration in government
sector, but basically that of improper loan appraisal technique and
poor collaterisation of loans.
5. It was confirmed through one of four statistical tests that the distribu
tion of respondents between different options as to the effects of di
versification of banks credit portfolio is not significantly different be
tween the three classes of banks. Most of the respondents in each of
the three banks agreed that the quality of a bank's loan podfolio can
be enhanced through effective risk diversification.
6. The concept of portfolio theory like that of standard deviation, is
yet to find its place in the banking industry. This was also proved
by our statistical lest. 70

It is a majority view of our respondents that CBN's sedoral Ioan alloca
'iion guidelines enhance effective diversification. This was confirmed by
the result of our statistical test which upheld the null hypothesis stating
that it does not inhibit effective loan diversification. This can be ex
plained to mean that it enhances effective diversification.
Conclusion
It is not an exaggeration to say that the difference between success and
failure in the banking industry is in the effective management of the banks
loam c;nd advance. Efficient loan management is vital to the protection of
assets and the achievement of adequate returns t o investments.
The banking industry requires more than just for the rule of thumb
coi~cept of "budgetary limits" for the purpose of effective diversification, espe-
cially in this area of intense competition and highly volatile economy of the
nation. The key to survival and real growth in the industry, in the near future,
will be a function of banks ability to adopt statistics methodology for their , .
operations.
The adoption of a statistical based risk analysis and control technique "'1 : r I
capabic of quantifying and comparing risk will, in no small measure,enhsnce
decisim making in the banking industry by standardizing the policy and deci-
sion making process; and thereby the attainment of effective diversification
through the concept of maximum return at minimum risk or maximum re-
turns at a given risk level.
The issue in attaining optimal diversification is not the number of in-
vestmer.? in the portfolio. It is rather the nature of inter-relationships among 71
n'
then. The general principle therefore is that diversification is efficient only
when :he risks of loan portfolio are negatively correlated.
54. Recommendations
The research revealed that, risk quantification through standard de-
viation analysis is not yet in practice in the banking industry. The researcher,
therefore, makes the following recommendations in view of the findings of
this s tu ty:
As a mean towards attainment of effective diversification through
risk minimization, banks should implement techniques that
will enable them quantify the risk of their existing loan portfolio.
Banks should use the model suggested in this study, to analysis the
riskness of additional investment. This model uses standard devia
tion.
As one of the means towards institutionalization of statistical approach
to problev solving, we recommend that the tertiay institutions be
involved in calculating statistical data for business reference points as
is obtainable in the developed countries.
The prudentiaI guidelines have been one effective 'means of standard
izing the financial statement of the banking industry, as well as insti
tuting caution in lending habit of the industry. The CBN will be doing
the nation a lot of favour if the guidelines implementation is effec
tively monitored.
State government owned banks should use proper loan appraisal
techniques in appraising their loan portfolio. Collateral should
not be made the primay appraisal technique, but where it is used,

it must be made perfected.
REFERENCES
1. Ray, P. K. Asricultural insurance: Theory and nractice and annlication to developinq countries. 2nd ed. (Oxford: Pergamon Press, i981), p. 24.

BIBLIOGRAPHY
AND
APPENDICES

BIBLIOGRAPHY
Barauch: 7., et al. Acceptable-. (Cambridge: University Press, 1983).
Fabozzi, ct a[. Foundation of financial markets and institutions. (Englewod Cliffs: Prentice-Hall International Inc., 1994).
Frear, J. _The manaqement of business finance. (London: Pitman Publishing Ltd., 1980).
Hardy, C. 0. Reading in risk and risk bearing. (Chicago: University of Chicago Press, 1924).
Higgins, R. C. Evaluating investment opportunim. (New Jersey: Prentic-Hall Inc., 1981).
Irckwu, J. 0. Accident and Motor Insurance in Africa. (Ibadan: The Gaxton Press, 1974).
Johnson, ~ ) t a1 Commercial Bank princinles and ~ractice. (Lagos: Malhouse Press Ltd., 1991).
Knight, F, H. Risk uncertainty and profit. (Baston: Hmghton Mufflin, 1321).
Kulp, C. A. (hsualty insurance. (New York: Ronald Press, 1928).
Mowbray, -4. H. Insurance: It's Theorv and practice in the United Sr;l%?s. 1st ed. (New York: McGraw-Hill Book Co., Inc., 1930).
0
Nwankwo, G. O., Bank management princinles and practice. (Lagos: Phihouse Press Ltd . , 199 1).
Oltafor, F. 0. Investment decisions. (Southampton: The Carnelot Press, 1983).
Osubor, J. U. Business finance and bankinq in Niqeria. (Owerri: New Africa Publishing Co. Ltd., 1984).
Pandey, I. M. Financial manaqement. (New Delhi: Vikas PilbIishing House PVT Ltd., 1979).

Pappas, J. L. and Brigham, E. F. Manaserial economics. 3rd ed. (Tllinois: The Dyden Press, 1979).
Pfeffer, I. Instrrance and economic theory. (Iliionois: Richard D.Iroin, Inc., 1956).
Ray, P. I<. Asricultural insurance: Theory and practice and a asplication to develoninq Countries. 2nd ed. (Oxford: Pergamon Press, 1981).
RUI , 1'. M. PIannins on uncertainty. (New Jersey: John Wiley and Sons Inc., 1971).
Sharpe, W. F. Investments. 3rd ed. (New Jersey: Prentice-Hall, Inc., 1978).
Teweles, and Bradley, E. S. The stock market. 4th ed. (New Jersey: John Wiley and Sons Inc., 1982).
Ting, IV. Mtlltinational Risk assessment and manaqement. (Quorum Books, . . 1958).
" '1 : Van, Horne J. C. Financial manaqement and nolicy. 8th ed. (New Jersey: ' /
Prenticc-Hall Inc., 1989).
Wes-ion, J. and Brigham's F. Manaqerial finance. 6th ed. (New York: The Dyden Press, 1979).
Willett, A. H. _The economic theory of risk and insurance. (Philadelphia: University of Pennsylania Press, 1951).
JOURWAL ARTICLE
Ro iE t~n , D. B. "Risk theory". The Journal of Risk and Insurance, Vol. xxvii, No. 1, March 1960.
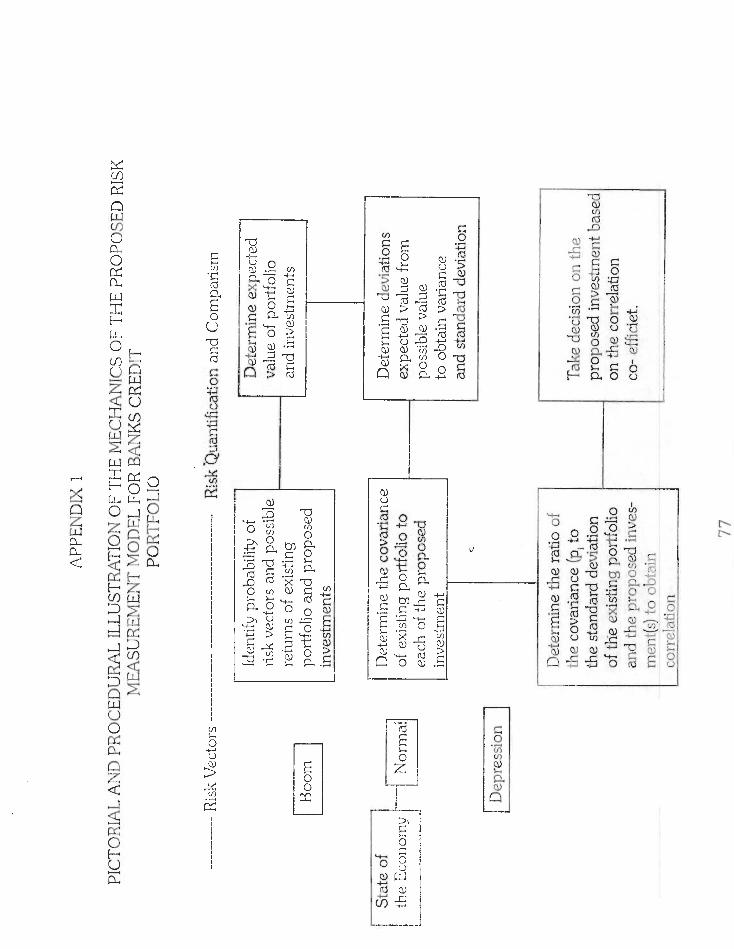

APPENDIX 11
TAXANOMY OF BANK RISKS
TYPES OF RISK
1.) ,c~r,fidence:
SOURCE
Loss of confidence on the bank by depositors, the general public and the regulatory authorities. The ultimate in risks - the culmination of a11 risk.
2) Liquidity:
3) Fraud: 0
5) interest Rate:
Faulty balance sheet, financing mismatches, changes in asset prices.
Theft, defaIcation, forgery, embezzlement.
Default or delay in fulfiIlment of obligations.
Mismatches between h e r e s t sensitive assets and interest sensitive liabilities.
6) Earnings or Profits: Changes in operating expenses and interest rates, excess of expenses over incomes.
7 ) Operations: Operating errors, inefficiency, faulty control procedures.
Changes in interest rates and changes in asset prices.
9) Currency or Foreign: Speculation, mismatches in - Exchange: foreign exchange exposure.

i 1) Counterpart:
i2) Country.: n
9
i ) Sovereign:
14) Rzsulatory:
15) Of!-balance Sheet:
Inability to purchase funds or otherwise obtain funds to meet obligations as they fall due - a form of liquidity and investment risks.
DefauIt or delay by Counterpart, i.e related or affiliated party to honour obligations as they fall due.
Failure or delay by a country to honour obligations as they fall due.
Inability to take action or obtain redress when a county defaults owing to sovereign immunity. Arising from violations, or sudden imposition of laws and regulation by the regulatory authorities.
Arising from operations that do not show in the balance sheet.

APPENDIX IIB
&APT '%G RISK: SOME MEASUREMENT INDICATORS
Tyue of Risk Measurement Indicator
i) Failure: ti (i) Bank's stock Price: Annual earning
per share
(ii) Networth: Total assets.
(iii) Networth: Risk assets. '
(iv) Purchased funds: Equity capital.
2) Liquidity:
3) Interest Rate:
(i) Total Cash assets: Total Assets.
(ii) Cash Assets + Government Securitv: Total Assets.
(iii) Total Loans: Total Assets.
(iv) Core Deposits: Total Liabilities
(v) Purchased funds: Total Assets.
(vi) Foreiqn branch liabilities: Total Assets.
(i) Interest Sensitive Assets: Interest Sensitive Liabilities.

6) Fraud:
(i i)
(iii)
(i)
(i i)
ii)
(ii)
(i i i)
Money Market AS sets_ : - M ~ n e y rnarket Liabilities.
B e Cumulative Gap between interest sensitive As*: - The Cumulative Gap between interest sensitive liabilities.
variance of net income before or after taxes over some designated period say there or fie years.
Variance of return on equity (ROE) or return on Assets (ROA) over a designated period.
Net loan !asses: Equity.
Net loan losses: Bad debt reserves
Total loan: Total Assets.
(i) Function of (a) quality of security measures (b) Management control systems (c) Internal audit (d) Insurance (e) Operating procedures.
Function of the banks: (a) liquidity (b) capital adequacy (c) earnings (d) market rating (e) regard by regulato y authorities.
(ii) Total loan: Total deposit

s; Forcign Exchange/ Cu~rency: Function of (a) Currency
mismatches (b) Interest rate mismatches, (c) exchange rate mismatches, id) settlement dates, (2) counterpart obligations.
9) Country Risk:
16) Off: Balance:
Exposure over equity and provisions, also function of debtor country's
Overall debt, its spread and its concentration. Debt servicing capacity. Economic prospects. Debt burden. Political stability. Direct Credit substitute 100% Certain transactions related item 50% Short term trade related 20% resource 100%. Commitment with certain draw downs 100% Other commitment with original maturity exceeding one year 50% Similar commitments with original maiurity less than one year 0%
Foreign exchange commitments with residual maturity. (a) Less than one year 1% (b) one year and above 5%
Interest rate contracts with residual maturity of (a) less than one year 0% (b) one year and over 0.5%
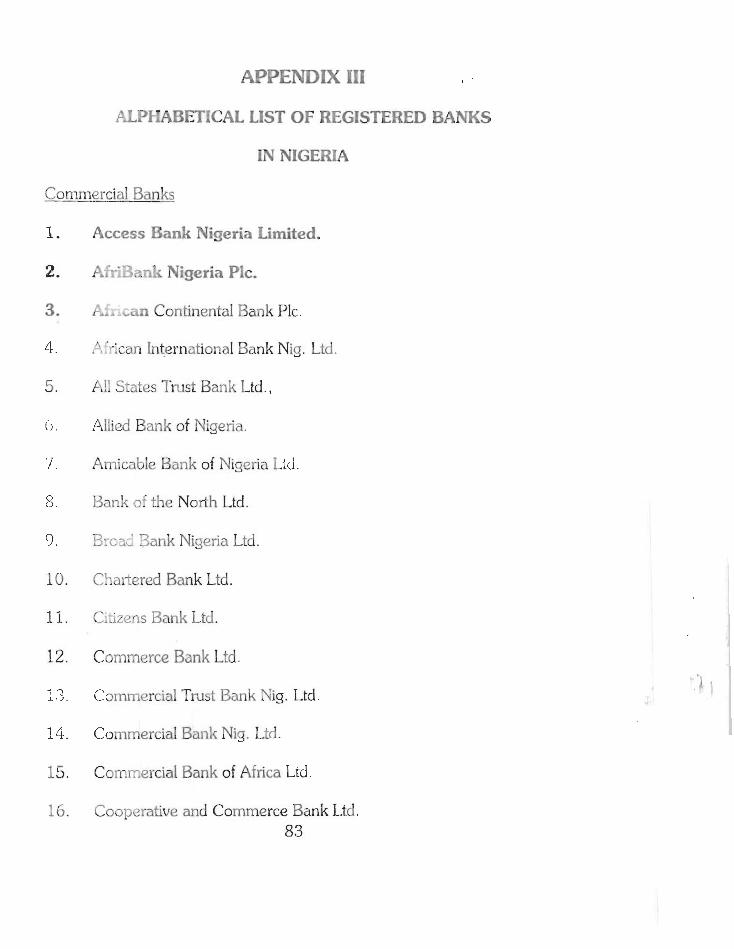
APPEhDIX 111
F-L?YABET?CAL LIST OF REGISTERED BANKS
IN NIGERIA
Commercial Banks --
Access Bank Nigeria Limited.
i?c,'-?z.?i Nigeria PIC.
;i.. . a n Continental Bank Plc.
:';-ican International Bank Nig. Ltd .
A!: States Trust Bank Ltd.,
Aificd Bank of Nigeria.
Amicable Bank of Nigeria Ltd.
Rank sf the North Ltd.
s,---+ .*,' Zank Nigeria Ltd.
C5nl"ircd Bank Ltd.
Cii-ized-1s Bank Ltd.
Com.;nerce Bzn k Ltd .
Commercial Tr~s t Bank hig. Ltd.
Commercial Bank Nig. Lid.
Cormercial Bank of Africa Ltd.
Cooperative and Commerce Bank Ltd,

Cooperative Rank Ltd.
Credit E3ar.k Nig. Ltd.
Crystal Bank of Africa Ltd.
Diamond Bank Nig. Ltd.
Eccbank Nig. Plc.
'5c;uitorial Trust Bank Lid.
Eko International Bank Plc.
First African Trust Bank Plc.
First Bai2k of Nigeria Pic.
FSB International Bank Plc.
Gamji Bank of Nig. P1.
Gakway Eank of Nig. Ltd.
Guaranty Trust Bank Ltd.
Gulf Bank of Nigeria Ltd.
i-labib Nig. Esnk Ltd.
HG!~ ma:k Zank Nig. Ltd.
F;ighland 13ank of Nig. Ltd.
tn!and Bank Nig. Pic.
intercity Bank Ltd.
Lion Bank of Nig. Plc.
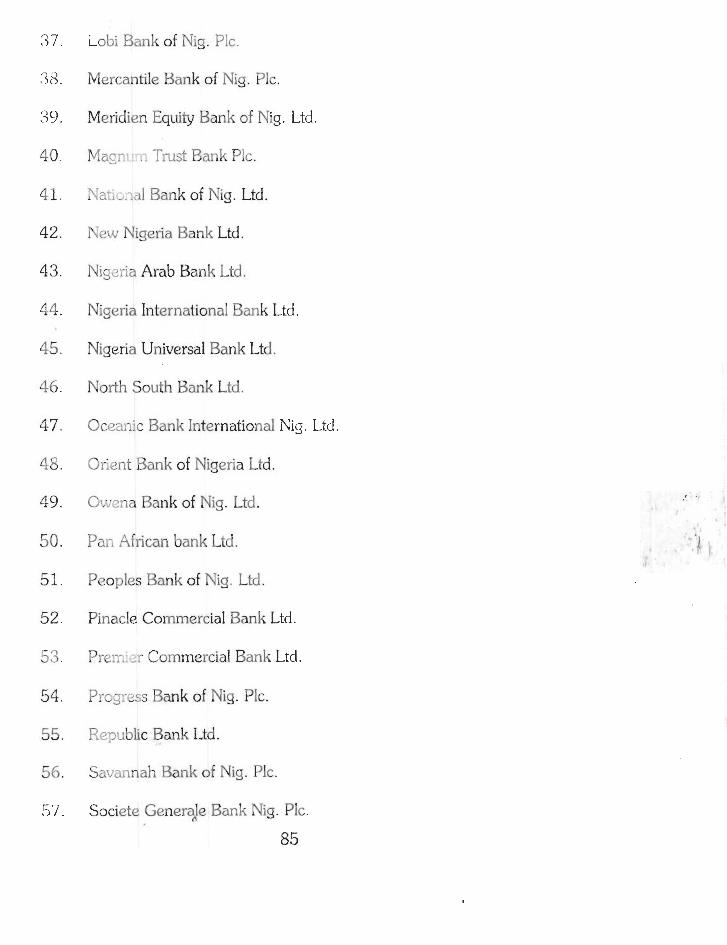
Lobi Sank of Nig. Plc.
Mercantile Bank of Nig. Plc.
Meridien Equity Bank of Nig. Ltd.
Mac?. -.: Txst Eank Plc.
h'+: I .:L!~.,.7.,d Bank of Nig. Ltd.
n'ew Nigeria Bank Ltd.
N i g x k Arab Bank Ltd.
Nigeria International Bank Ltd.
Nigeria Universal Bank Ltd .
North South Bank Ltd.
Cccmic Bank International Nig. Ltd.
01-lent Bank of Nigeria Ltd.
Cv;ma Eank of Nig. Ltd.
Par, African bank Ltd.
Peoples Bank of Nig. Ltd.
Pinacle Commercial Bank Lid.
?re:;-.: ;r Commercial Bank Ltd.
Prcgxss Bank of Nig. PIC.
F??l~blic Bank Ltd.
Sa:;c;nnah Bank of Nig. Plc.
Societe Generaje Bank Nig. Plc.

55. Trade Bank Nig. PIC.
59. Tr-ms International Bank Plc.
GO. '7;opical Commercial Bank Limited
61. Union Bank of Nig. PIC
62. United Bank of Africa PIC. 1
63. United Commercial Bank Ltd.
64. Universal Trust Bank of Nig. Ltd.
65. Wema Bank Plc.
66. zenith International Bank.
Abacus Merchant Bank Ltd.
A B C Merchant Bank Ltd.
Afribank International Ltd.
Alpha Merchant Bank Ltd.
Cmire Point Merchant Bank Ltd.
Century Merchant Bank Ltd.
Citi Trust Merchant Bank Ltd.
Comet Merchant Bank Ltd.
Crown Merchant Bank Ltd.
Continental Merchant Bank Ltd.
86

11.
12.
1 " r J.
: 4.
. - is.
16.
17.
1s.
19.
2 '. I).
0 7 L I.
23.
23.
25.
2 6.
27.
Q 71 '2 J .
29.
30.
31.
Devcom Merchant Bank Ltd.
F.B.N. ktd.
Fidelity Union Merchant Bank Ltd.
Fountain Trust Merchant Bank Ltd.
First City Merchant Bank Ltd.
First Interstate Merchant Bank Ltd.
Great Merchant Bank Ltd.
Stabic Merchant Bank of Nig. Ltd.
Group Merchant Rank Ltd.
Hill Crest Merchant Bank Ltd.
ICON Ltd. (Merchant Bank).
Indo-Nigeria Merchant Bank Ltd.
Industrial Bank Ltd.
.. .Lrrnational Merchant Bank PIC.
Investment Banking and Trust Company Limited.
Ivory Merchant Bank Ltd.
Lead Merchant Bank Ltd.
Liberty Merchant Bank Ltd.
Manufacturers Merchant Bank Ltd.
Marina International Bank PIC.
Merchant Bank of Africa Nig. Ltd.
87

Merchant Bank of Commerce Ltd.
Xerchant Banking Corporation Nig. Ltd.
Metropolitan Merchant Bank.
Midas Merchant Bank Plc.
NAL Merchant Bank Plc.
National Merchant Bank Limited
New Africa Merchant Bank Plc.
New World Merchant Bank Ltd.
Nigbef Merchant Bank Nig. Ltd.
Nigerian - American Merchant Bank.
Nigerian Intercontinental Merchant Bank Ltd.
Xigel-is Merchant Bank PIC.
Pacific Merchant Rank Ltd.
?~a!( Merchant Bank Ltd.
Prime Merchant Bank Ltd.
Prudent Merchant Bank Ltd.
Reliance Merchant Bank Ltd.
Rim's Merchant Bank Ltd.
Royal Merchant Bank Ltd.
Socjete Bancaire Bank Nig, Ltd.
83

52. Triumph Merchant Bank Ltd.
53. V i c h y Merchant Bank Ltd.
Cevelop~nent Banks
1. PJigzria Industrial and Development Bank Ltd.
2. Nigeria Bank for Commerce and Industry Ltd.
3. Nigeria Agricultural and Co-operative Bank.
4. Federal Mortgage Bank Nigeria Ltcl.
5. Cc-qcrative Development Bank.

QUESTEONNA3aT,E
UNIVERSITY OF NIGERIA, ENUGU C M U S
SCHOOL OF POSTGRADUATE STUDIES
DEPARTMENT OFF BANKING AND FINANCE
Questionnaire On:
"Risk PAnalysis and Control in Banks Credit Portfolio Management" (To be
Cor$cted by Credit Control Managers).
Sirmadam,
Tk rwxucher is conducting a study on the above subject for the purpose of
a research project in padial fulfillment of the requirement for MBA of the
University of Nigeria, Enugu Campus. The attached questionnaire thus seeks
to elicit your opinion on relevant aspects of the research study
The researcher will be glad if you would assist her by completing and
retw%g the questionnaire to the undersigned. The researcher guarantees I?
the confidentiality of individual responses.
Signed:
Oketah I. M
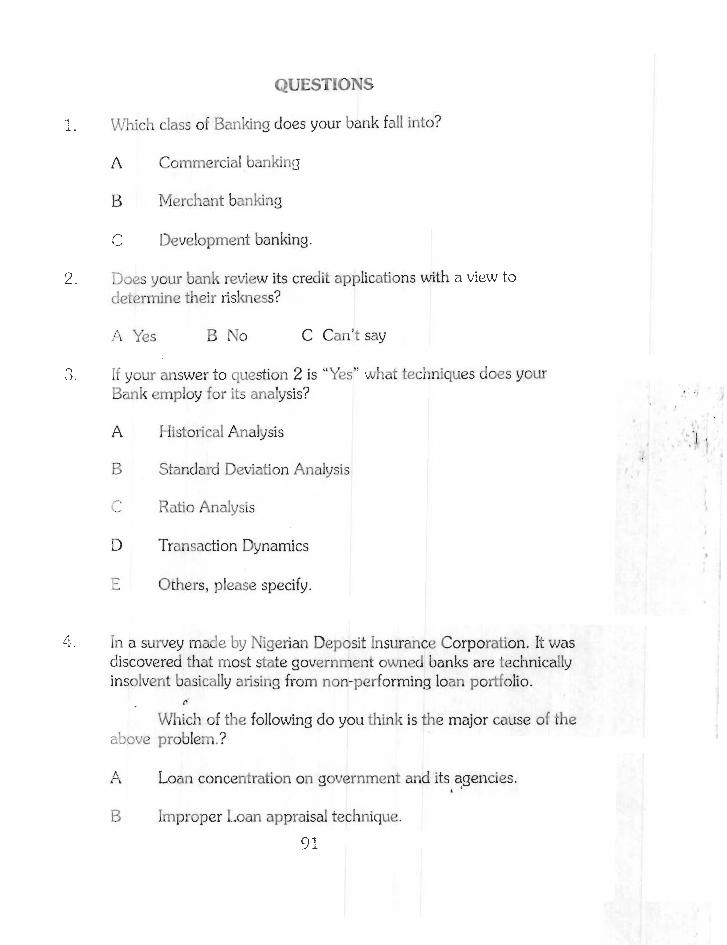
QUESTIONS
1. CVhich class of Banking does your bank fall jnto?
A Commercial banlung
B Merchant bankiing
C Development banking.
2. Does your bank review its credit applications with a viev~ to detcrrnine their risltness?
-4 Yes B No C Can't say
3. If your answer to question 2 is "Yes" what techniques does your Bank employ for its analysis?
A Historical Analysis
6 Standard Deviztion Analysis
2 Ratio Analysis
D Transaction Dynamics
r L. 0 thers, please specify.
4. In a survey made hy Nigerian Deposit Insurance Corporation. It was discovered that most state government owned banks are technically insolvent basically arising from non-performing loan portfolio.
0'
Which of the following do yo11 think is the major cause of the zl.mve problem.?
A Loan concentration on government and its agencies. I
B Improper Loan appraisal technique.
91
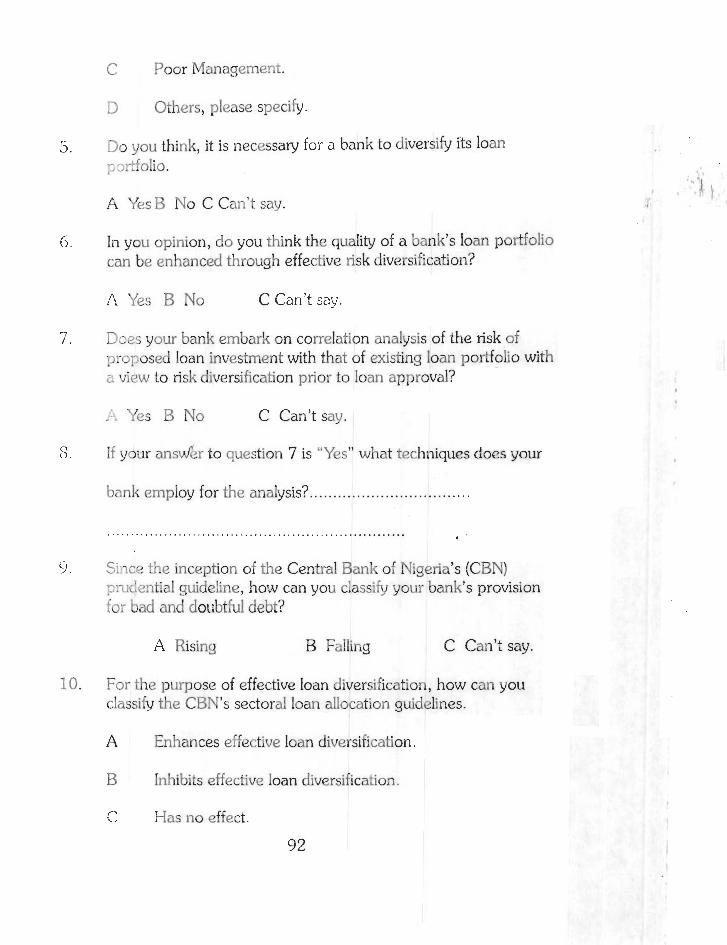
C Poor Management.
I) Others, please specify.
Do you think, it is necessaly for a bank to diversify its loan - x?foho.
k Yes B No C Can't say.
In you opinion, do you think the quality of a bank's loan portfolio can be enhanced through effective risk diversification?
A Yes B No C Can't say.
'xs your bank embark on correlation analysis of the risk of p:-c;psed loan investment with that of existing loan portfolio with ;: vie.w to risk diversification prior to loan approval?
-:. Yes B No C Can't say.
If your ansder to question 7 is "Yes" what techniques does your
bmk employ for the analysis? ..................................
Six.: the inception of the Central Bank of Nigeria's (CBICJ y:-&ntial guideline, how can you ciassih~ your bank's provision io; bad and doubtlcul debt?
A Rising B Falling C Can'i say.
10. For the purpose of effective Ioan diversification, how can you classify the CBN's sectoral loan allocation g~delines.
A Enhances effective loan diversific a ti on.
B Inhibits effective loan diversification.
0 - Has no effect.
92

D. Can't say.
11. Would you wish to see the scrapping of the CBN's sectoral loan aI!ocation g~ideiines?
A Yes 5 No C Can't say.
12. P!caze state your reason for your answer to question I I. . . .. .. . . .. . . . . . . . . . . . . . . . . . . . . . . . , . . . . . . . . . . . . . .. .. . .. . .. . . . . . . . . . . . . . .