Embed Size (px)
Citation preview

University of Manitoba
Department of Electrical & Computer Engineering
ECE 4600 Group Design Project
Final Report
Portable Resistive Leakage Current Monitoring System for Distribution Class ZnO Lightning
Arresters Using the Modified Shifted Current Method
By
Group G18
Brian Hines
Shea Lerner
Karl Dirks
Rapinder Sandhu
Matthew Ratson
Academic Supervisor
Prof. Behzad Kordi, Ph. D., P. Eng.
Industry Supervisor
Nathan Jacob, M. Sc., P. Eng. – Manitoba Hydro

This page intentionally left blank

Portable Restive Leakage Current Monitoring System
i
Abstract
The purpose of this project was to design a portable ZnO lightning arrester condition
monitoring system which is capable of performing arrester health analysis without the need for a
voltage source reference. This project is based on a paper entitled, “New Method to Extract the
Resistive Component of the Metal Oxide Surge Arrester Leakage Current” [1] which is a
technique for diagnosing arrester health with only the leakage current waveform. Manitoba
Hydro’s test lab currently employs an older system that requires a voltage referenece. The
advantage of not needing the voltage referene is that the system can ultimately be used in the
field where accesing a voltage reference upwards of 200 kV is not practical.
Our design employs a wireless mircoproccesing based system utilizing an Arduino UNO
microcontroller. The ground side current from the arrester is fed through a resistor, which can
then be used as a readable voltage. To analyze an arrester’s data, a Python-based graphical
user interface was created. The user connects the GUI to the Arduino via Bluetooth, samples
the waveform from an arrester and then additional data processing is executed. The main part
of this processing involves the modified shifted current method on the sampled waveform. Upon
conclusion, the user is left with only the resistive component of the arrester leakage current,
which is displayed in both the time and frequency domains for analysis.

Portable Restive Leakage Current Monitoring System
ii
Contributions
Mat
the
w R
atso
n
Bri
a H
ine
s
Rap
ind
ar S
and
hu
Kar
l Dir
ks
She
a Le
rne
r
Project Proposal Compilation Design Uniteruptable Power Supply Design DC Bias Circuit Design Overvoltage Protection Choose Microprocessor & Antenna Program Wireless Transmission Hardware Testing DR2 Compilation Program Digital Filtering Simulated Arrestor Wave Program MSCM DR3 Compilation Program LCD and Battery Circuit Design & Program GUI Design Databse Storage Suite Design Excel Exporting DR4 Compilation Component Integration Final Report Compilation Final Report Content
Legend: Lead or Major Contributor Contributor

Portable Restive Leakage Current Monitoring System
iii
Acknowledgments
We would like to thank the following people for contributions to the project;
Dr. Behzad Kordi, our project advisor.
Nathan Jacob, our industry advisor.
Dan Card, Derek Oliver and Aidan Topping for guiding us through the capstone course.
Sinisa Janjic, Ken Biegun, Glen Kolansky, Erwin Dirks and Cory Smit, ECE technical
staff, without whom our project would not have been possible.

Portable Restive Leakage Current Monitoring System
iv
Table of Contents
Abstract ....................................................................................................................... i
Contributions ..............................................................................................................ii
Acknowledgments ......................................................................................................iii
List of Abbreviations ............................................................................................... viii
1.0 Introduction ..................................................................................................... 1
1.1 Purpose ................................................................................................................ 1
1.2 Design Overview .................................................................................................. 2
2.0 Power Supply & Battery Charging Circuit...................................................... 4
2.1 Power Supply Design Specifications ..................................................................... 4
2.2 Voltage Regulator Calibration.............................................................................. 5
2.3 Integration of Voltage Regulator Modes ............................................................... 6
2.4 Battery Charging System ..................................................................................... 7
2.5 Control of Battery Charging Circuit .................................................................. 10
2.6 Battery Tests ..................................................................................................... 11
2.7 Battery Charger Control System ........................................................................ 14
2.8 Battery Charger Control Actuator System ......................................................... 15
2.9 LCD Screen ........................................................................................................ 17
3.0 Measurement Method, Protection and Biasing ............................................. 19
3.1 Measurement Method ......................................................................................... 19
3.2 DC Biasing Circuit ............................................................................................. 20
3.3 Protection Circuit .............................................................................................. 23
3.4 Low pass Filter .................................................................................................. 25
4.0 Wireless & Data Acquisition .......................................................................... 29
4.1 Wave Capture .................................................................................................... 29
4.2 Bluetooth Connectivity ...................................................................................... 29
4.3 Device-to-Device Communication ....................................................................... 30
4.4 Comments .......................................................................................................... 34
5.0 Data Processing .............................................................................................. 35
5.1 Arrester Leakage Current Waveform ................................................................. 35
5.2 Simulated Arrester Waveform ............................................................................ 37

Portable Restive Leakage Current Monitoring System
v
5.3 Digital Low Pass Filter ...................................................................................... 38
5.4 MSCM ............................................................................................................... 39
6.0 GUI ................................................................................................................ 44
6.1 Planning Stage ................................................................................................... 44
6.2 Python Implementation ..................................................................................... 45
6.3 Excel Functionality ............................................................................................ 48
7.0 Conclusion ...................................................................................................... 52
8.0 Bibliography ................................................................................................... 53
Appendix A – Updated Budget ................................................................................ 55
Appendix B – Arduino Code .................................................................................... 56
Appendix C – Python Communication Code ........................................................... 59
Appendix D – MSCM Python .................................................................................. 61
Appendix E – GUI Python ....................................................................................... 65
Appendix F – Excel Export ...................................................................................... 82
Appendix G – Device Hardware ............................................................................... 84

Portable Restive Leakage Current Monitoring System
vi
List of Figures
Figure 1.1: System Block Diagram .............................................................................................. 3
Figure 2.1: Voltage Regulator Schematic ..................................................................................... 5
Figure 2.2: Simulated Calibration of Voltage Regulator with 12 V Supply Input ........................ 5
Figure 2.3: Simulated Calibration of Voltage Regulator with 9V NiMH Batteries as Input ......... 6
Figure 2.4: Integrated Voltage Regulator Schematic ................................................................... 7
Figure 2.5: Fast Charge Design: a) Schematic b) Charger Response ............................................ 8
Figure 2.6: Trickle Charger: a) Schematic b) Charger Response .................................................. 9
Figure 2.7: Schematic of integrated Battery Charger Circuit ..................................................... 11
Figure 2.8: Fast Charge Mode Charging Test Results ............................................................... 12
Figure 2.9: Trickle Charge Mode Charging Test Results ........................................................... 13
Figure 2.10: Discharge Test Results .......................................................................................... 13
Figure 2.11: Charging Control Algorithm .................................................................................. 15
Figure 2.12: Charger Control Actuator Calibration ................................................................... 17
Figure 2.13: LCD Display Connection ....................................................................................... 18
Figure 3.1: Tested CT CR8401-1000-G...................................................................................... 19
Figure 3.2: Experimental Test Setup w/ Grounding Resistor .................................................... 20
Figure 3.3: Adder Circuit .......................................................................................................... 21
Figure 3.4: Simulation of the Adder Circuit .............................................................................. 23
Figure 3.5: Output of Adder Circuit .......................................................................................... 23
Figure 3.6: Crowbar Circuit ...................................................................................................... 24
Figure 3.7: Protection Circuit Output ....................................................................................... 25
Figure 3.8: Second Order Low Pass Filter ................................................................................. 26
Figure 3.9: Low Pass Filter Frequency Response ....................................................................... 27
Figure 3.10: DC Biasing, Protection, and Low-Pass Filter Design ............................................. 28
Figure 4.1: Bluefruit EZ-Link Shield w/ Arduino Uno R.3 ........................................................ 30
Figure 4.2: Arduino Communication Protocol Flow Chart ........................................................ 31
Figure 4.3: CaptureWave and ValidateConnection Function Flow Charts ................................ 32
Figure 4.4: Functional Flow Chart for Finding and Connecting to Arduino .............................. 33
Figure 5.1: Arrester Shunt Model .............................................................................................. 36

Portable Restive Leakage Current Monitoring System
vii
Figure 5.2: Arrester Leakage Current ........................................................................................ 36
Figure 5.3: Lightning Arrester Leakage Current Simulation ...................................................... 37
Figure 5.4: Resistive Component of Leakage Current ................................................................ 38
Figure 5.5: Simulated Leakage Current Waveform .................................................................... 38
Figure 5.6: Current Voltage Characteristic ................................................................................ 39
Figure 5.7: Block Diagram of Modified Shifted Current Method ............................................... 40
Figure 5.8: Manitoba Hydro Lightning Arrester Leakage Current Waveform ............................ 41
Figure 5.9: Extracted Resistive Leakage Component From Manitoba Hydro Arrester ............... 41
Figure 5.10: Stock Arrester Wave and Extracted Leakage ......................................................... 42
Figure 5.11: Extracted Resistive Component ............................................................................. 43
Figure 6.1: Tkinter Root Window Code .................................................................................... 45
Figure 6.2: Graphical User Interface .......................................................................................... 47
Figure 6.3: Excel Database ........................................................................................................ 49
Figure 6.4: Excel Summary Report ........................................................................................... 51
Figure 0.1: Power Supply/Arrester Processing Subsystem Integration ...................................... 84
Figure 0.2: Power Supply/Arrester Processing Subsytem, Integration ....................................... 84
Figure 0.3: Power Supply .......................................................................................................... 86
Figure 0.4: Device In Test ......................................................................................................... 86
List of Tables
Table 1.1: Performance Metrics ................................................................................................... 3
Table 2.1: Proposed Power Supply Specifications ........................................................................ 4
Table 2.2: Voltage Regulator Relay Configuration ...................................................................... 6
Table 2.3: Voltage Regulator Relay Configuration .................................................................... 10
Table 2.4: Charger Circuit Relay Configuration ........................................................................ 10
Table 2.5: Charger Circuit Relay Configuration ........................................................................ 14
Table 2.6: Charger Circuit Relay Logic ..................................................................................... 16

Portable Restive Leakage Current Monitoring System
viii
List of Abbreviations
Abbreviation Description
MSCM Modified Shifted Current Method
MO Metal Oxide
GUI Graphical User Interface
A2D Analog to Digital
CT Current Transformer
VAC Volts Alternating Current
ZnO Zinc Oxide
FFT
NiMH
LSB
Fast Fourier Transform
Nickel-Metal Hydride
Least Significant Bit

Portable Restive Leakage Current Monitoring System 1.0 Introduction
1
1.0 Introduction
1.1 Purpose
Lightning arresters are highly specialised equipment used in the electrical grid for protecting
distribution equipment from the dangers of lightning strikes. Over time, due to atmospheric
conditions as well as lightning surge events, the usefulness and reliability of lightning arresters
degrades. In order to diagnose an arrester’s condition, a technician must take the equipment
offline, bring the arrester to the lab and perform tests. This test can only be performed where
the technician has access to record the voltage waveform across the arresters, something
inconvenient and potentially dangerous when dealing with high voltages.
The purpose of this project was to design a portable lightning arrester condition monitoring
system which is capable of performing an arrester health diagnosis without the need for a
voltage source reference, this only applies to arresters made of ZnO. This project is based on a
paper entitled, “New Method to Extract the Resistive Component of the Metal Oxide Surge
Arrester Leakage Current” [1] which is a technique for diagnosing arrester health with only the
leakage current waveform. Nathan Jacob, a representative from Manitoba Hydro, had brought
this project concept forward because he wanted a new system for diagnosing the condition of
lightning arresters. Manitoba Hydro’s test lab currently employs an old system that requires a
voltage referenece.
A lightning arrester’s coniditon is determined by analyzing the resistive component of its
leakage current. The electrical model employed for the lightning arrester is a shunt capacitor
and resistor, which is shown in Figure 5.1. The capacitor operates at 60 Hz and the resistor
current is the sum of odd harmonics from 1st to N, where N is around the 11th harmonic. The
methodology employed here is that by knowing the leakage current is the sum of resistive and
capacitive components, one can subtract the capacitor current from the total amount which
results in the resistive leakage component.

Portable Restive Leakage Current Monitoring System 1.0 Introduction
2
1.2 Design Overview
The system goal was that a technician or engineer could easily measure the leakage current from
an arrester and diagnose its condition. The end user would be presented with an enclosure that
contains the microcontroller and all other crucial system hardware. The current through the
arrestor will be measured by placing a small resistor around 200Ω at the ground side of the
arrester and measuring the voltage across it. Simple circuit theory says that the current is just
the measured voltage divided by the resistance. On the side of the enclosure, there will be a
BNC connection, from which two wires will come out of that must be clipped onto the resistor
for measurement. The user connects to the system wirelessly via laptop and is presented with a
GUI for operating the device. After connecting with the device and initiating the data import,
the resistive leakage current waveform appears. This is all accomplished in less time, and
without any dangers of hooking up to and measuring the waveform from a high voltage source.
The project was divided into several sections in order to encompass the overall design. A
Bluetooth-enabled Arduino microcontroller was utilized to receive data from the device, as well
as for transmitting information to the computer. Working alongside the Arduino, a smart
battery-charging management circuit was employed. This utilizes fast and slow charging modes,
as well as automatic switching to the backup-battery in the event of a power disconnect.
Additionally, an LCD screen is used to display the current battery status to alert the user if a
recharge is necessary. The input to the circuit employs “active low pass” filtration to eliminate
impulses and noise from the input waveform. Transient overvoltage protection was added to
assist in the event of over-current to the circuitry. A non-inverting summing amplifier topology
is utilized to bias the incoming signal so that the Arduino can read it. The sampled signal is
sent via Bluetooth to the computer, where all digital signal processing is done. There is no
additional data processing done on board the Arduino. On the computer, a GUI is available as
a simplistic tool for arrester monitoring and analysis for the end user. The GUI takes a sample
of the raw leakage current waveform and sends it to the MSCM algorithm. Afterwards, further
digital filtering is executed and the extracted resistive current is returned. Finally, the resistive

Portable Restive Leakage Current Monitoring System 1.0 Introduction
3
leakage current waveform is displayed within the GUI. The user is then able to export the data
to an excel spreadsheet, which is helpful to easily share the information with other interested
parties. A system block diagram is shown in Figure 1.1, the system performance metrics are
shown in Table 1.1. The physical implementation of the system can be seen in Appendix G –
Device Hardware.
Figure 1.1: System Block Diagram
Table 1.1: Performance Metrics
Specification Goal Achieved
Current Sensing Range 0.1 - 10 mA Adjustable
Current Sampling Rate Greater than 1 kHz 9.6 kHz
Input Harmonic Filtering Bandwidth 2 kHz 2.4 kHz
Input Voltage Range 7 - 12 V 7 - 12 V
Measurement Instrument Current Transformer Ground Side Current Sensor
Method Of Data Transmission Wireless Bluetooth/USB
Battery Life 30 Minutes 120 Minutes
Size Less than 3000 cm3 3000 cm3
Weight Less than 1 kg 0.75 kg
Resistive Current Accuracy Less than 20% error Less than 5% error
Export Data Types .csv Full excel report

Portable Restive Leakage Current Monitoring System 2.0 Power Supply & Battery Charging Circuit
4
2.0 Power Supply & Battery Charging Circuit
To ensure the versatile use of this arrester monitoring device, a 12 VDC wall adapter and two
9V, rechargeable NiMH batteries are used to power this device. Both sources provide power to
all subsystems via an adjustable voltage regulator, which is set to output approximately 7 VDC.
After use of the device, a battery charging system will re-charge the batteries. A control
subsystem for this charging function utilizes two different charging modes. The system default
is a fast charge mode which charges the batteries when they are severely discharged. Once the
maximum voltage is reached, a trickle charge mode is activated which is designed to maintain
the maximum voltage between battery uses.
2.1 Power Supply Design Specifications
The power supply design specifications for battery life and voltage are noted in Table 2.1. The
output voltage of the voltage regulator is set to the minimum voltage required by the Arduino
Uno [2].
Table 2.1: Proposed Power Supply Specifications
Feature Value or Range
Voltage Regulator Output Voltage 7-12 VDC
Battery Life 30 minutes
2.1.1 Voltage Regulator Design
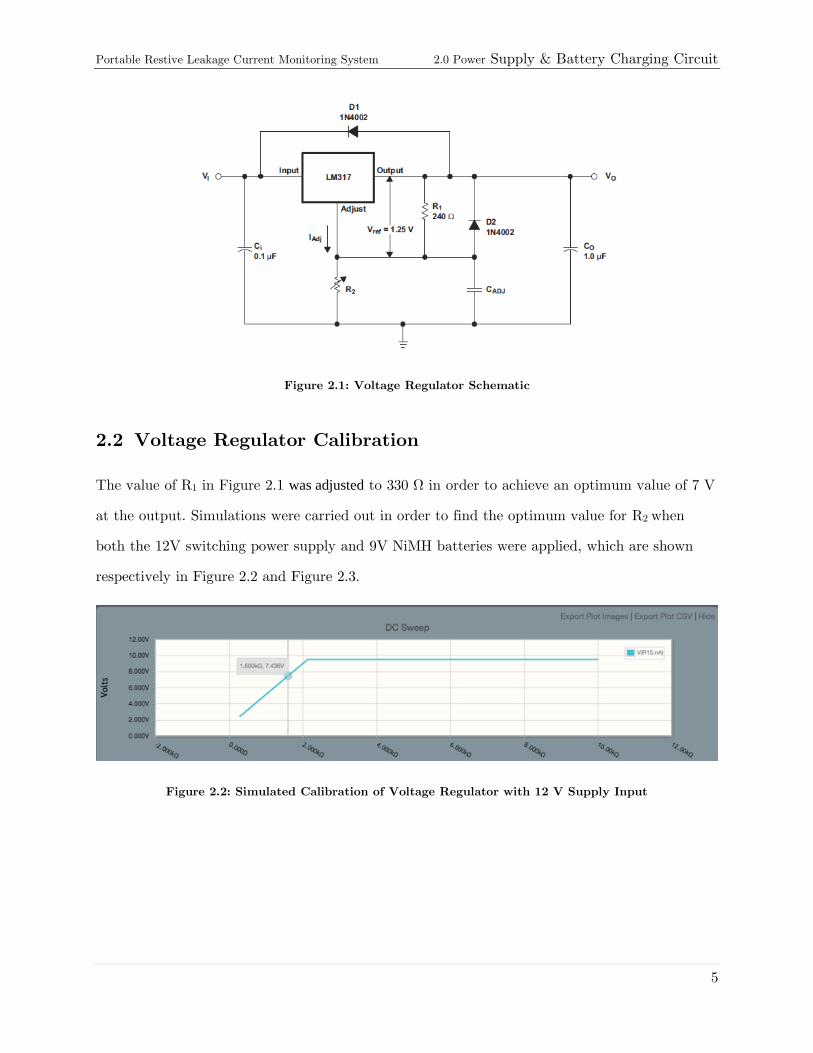
As seen in Figure 2.1, the output voltage of the voltage regulator can be set by adjusting the
value of R2, shown in equation ( 1 ).
VO = VREF (1 + R2 / R1) + (IADJ × R2) ( 1 )
Due to the fact that IADJ was approximately 30µA, CADJ was omitted from the calculation [3].
Portable Restive Leakage Current Monitoring System 2.0 Power Supply & Battery Charging Circuit
5
Figure 2.1: Voltage Regulator Schematic
2.2 Voltage Regulator Calibration
The value of R1 in Figure 2.1 was adjusted to 330 Ω in order to achieve an optimum value of 7 V
at the output. Simulations were carried out in order to find the optimum value for R2 when
both the 12V switching power supply and 9V NiMH batteries were applied, which are shown
respectively in Figure 2.2 and Figure 2.3.
Figure 2.2: Simulated Calibration of Voltage Regulator with 12 V Supply Input

Portable Restive Leakage Current Monitoring System 2.0 Power Supply & Battery Charging Circuit
6
Figure 2.3: Simulated Calibration of Voltage Regulator with 9V NiMH Batteries as Input
2.3 Integration of Voltage Regulator Modes
A 12 V switching relay was used to manage the switching control between the batteries and a
12 V adapter. The relay logic is described in Table 2.2.
Table 2.2: Voltage Regulator Relay Configuration
Relay Output Relay N/C Relay N/O
Bus Power 9V Rechargeable Batteries 12 V Power Adapter
Regulator Adjust Resistor [kΩ] 470 1.5
Regulator Output [V] 7.06 7.24
Figure 2.4 provides a visual of the schematic for the integrated voltage regulator subsystem. It
should be noted that a 180 Ω resistor and a flyback diode were incorporated into the relay to
ensure that once the relay is turned off, it will be discharged safely. As well, a 70 Ω resistor is
used to simulate the 100 mA total current required by the major components of the system.
Lastly, the regulator output for both power sources satisfies the proposed voltage regulator’s
output voltage specified in Table 2.1.

Portable Restive Leakage Current Monitoring System 2.0 Power Supply & Battery Charging Circuit
7
Figure 2.4: Integrated Voltage Regulator Schematic
2.4 Battery Charging System
The battery charging system is dedicated to charging the pair of onboard 9V, rechargeable
NiMH batteries. The details of the subsystem are discussed further below.
2.4.1 Rechargeable Batteries
The selection of the specific batteries used was made due to several reasons. First, NiMH
batteries can handle the adverse effects of overcharging and over discharging due to their
oxygen and hydrogen cycles respectively [4]. In addition to this, a 9V battery was chosen over
AA batteries because several of our device’s components require a voltage of at least 7 VDC.
Therefore, a minimum of 7 NiMH AA batteries would have been required [5]. Additionally, the
charging time for two 9V batteries is considerably shorter than 7 NiMH AA batteries [6].
2.4.2 Fast Charge Mode Charging
NiMH batteries have various charging techniques which include continuous low rate, timer
controlled, delta voltage, or by sensing change in battery temperature [6]. The method of charge
that was settled upon was a combination of these methods. In the first method, the batteries

Portable Restive Leakage Current Monitoring System 2.0 Power Supply & Battery Charging Circuit
8
would be charging initially at a high rate using a fast charge mode until a maximum voltage is
reached. The circuitry for the fast charging mode is displayed in Figure 2.5. A large smoothing
capacitor 470μF is placed at the input of the battery charger circuit to help smooth the
incoming charging current [7].
a)
b)
Figure 2.5: Fast Charge Design: a) Schematic b) Charger Response
Simulation of this circuit was carried out and the result can be seen in Figure 2.5. As the charge
current increases, the voltage of the batteries will also increase and so the transistor will
attempt to maintain the current state of operation.
2.4.3 Trickle Charge Mode Design
Once the maximum battery voltage of 9.86 V is reached, the charger switches to a continuous
low rate charge, also known as a trickle charge. This maintains the value of the maximum

Portable Restive Leakage Current Monitoring System 2.0 Power Supply & Battery Charging Circuit
9
voltage over time. Figure 2.6 shows a schematic of the trickle charge design, which is a variation
of the design used in the fast charge mode.
a)
b)
Figure 2.6: Trickle Charger: a) Schematic b) Charger Response
Additional components included in the trickle charge design reduce the current to very low
charge rates, as simulated in Figure 2.6. This allows a user to leave the battery charging
unattended, as the charge rate is designed to maintain the full charge capacity of the batteries.
1N4148 Diodes were chosen because the forward voltage is essentially constant, at 0.5 to 0.7 V
within the conducting current range, which is 0.1 mA to 5 mA [7]. A 270 Ω resistor placed
between the base and collector terminals is required to calibrate the current between the charger
circuit and the batteries. Table 2.3 compares the proposed trickle charge range with the rated
trickle charge range for NiMH batteries [5] [6].

Portable Restive Leakage Current Monitoring System 2.0 Power Supply & Battery Charging Circuit
10
Table 2.3: Voltage Regulator Relay Configuration
Trickle Charge Measurement Rated Trickle Charge Rate Proposed Trickle Charge Rate
Percentage of rated capacity [%] 3.0 - 5.0 0.1 - 0.5
Current [mA] 5.25 - 8.75 1.1 – 1.2
2.5 Control of Battery Charging Circuit
The battery charger circuit uses a 12 V relay design identical to the integrated voltage regulator
to control the functions of the battery charging circuit. A table of the double-throw, double pole
relay functions is below.
Table 2.4: Charger Circuit Relay Configuration
Relay Output Relay N/C Input Relay N/O Input
Battery Charger Power None 12 V Power Adapter
Battery Charger Output 100 Ω 9V Rechargeable Batteries
Regulator Output [V] 7.06 7.24
It should be noted that when the relay is in the closed position, nothing is powering the
circuit. However, during testing, it was discovered that the 470μF capacitor held 12V of charge
even after the 12V source was removed. A 100 Ω resistance is used to discharge the capacitor
voltage once the battery charger has been turned off, according to the equation ( 2 ).
𝛕= RC ( 2 )
Figure 2.7 shows a schematic of the integrated battery charger.

Portable Restive Leakage Current Monitoring System 2.0 Power Supply & Battery Charging Circuit
11
Figure 2.7: Schematic of integrated Battery Charger Circuit
2.6 Battery Tests
The following section provides the data specific to charging and discharging characteristics of
the onboard 9V NiMH rechargeable batteries.
2.6.1 Battery Charge Tests
Data collected for both tests were conducted within five minute intervals, the fast and trickle
charge test durations were 390 and 720 minutes respectively.
2.6.1.1 Fast Mode Battery Charge Test
The fast mode charge test started at a minimum battery operational voltage of 8.0 V. Testing of
this battery charging mode differed from the simulation results, as can be seen in the
comparison of Figure 2.5 b) and Figure 2.8, respectively.

Portable Restive Leakage Current Monitoring System 2.0 Power Supply & Battery Charging Circuit
12
Figure 2.8: Fast Charge Mode Charging Test Results
At the beginning of the charging test, current was applied to the battery and the battery
voltage jumped from 8 V to 9.08 V. The large current at the start of the fast charge mode
required a minimum of 8 V battery voltage. This is due to the 2N3904 transistor maximum
collector continuous current rating of 200 mA. If the battery voltage drops below 8 V, this
increased difference seen at the output and adjustment terminals of the LM317 creates a
charging current that can exceed 300 mA [8] [9].
2.6.1.2 Trickle Charge Mode Battery Charge Test
The trickle charge mode battery test was initiated as soon as the battery control circuit senses
the maximum voltage of the battery is reached and switches from the fast mode to the slow
mode. Figure 2.9 shows that the trickle charge current is approximately 10% less than that in
the simulated response shown in Figure 2.6. Note that both the data points are connected using
a line and the x-axis of the graph is reversed to illustrate how the trickle charge response
occurred over the course of the test.

Portable Restive Leakage Current Monitoring System 2.0 Power Supply & Battery Charging Circuit
13
Figure 2.9: Trickle Charge Mode Charging Test Results
2.6.2 Battery Discharge Test
The battery system was tested by powering all subsystems noted in section 2.1. The results of
the discharge test can be seen in Figure 2.10. The 120 minute continuous system on-time
results confirm that the proposed maximum continuous on-time will be achieved as noted in
Table 2.1. This discharge response is similar to nominal discharge tests for 9V NiMH batteries
[5].
Figure 2.10: Discharge Test Results

Portable Restive Leakage Current Monitoring System 2.0 Power Supply & Battery Charging Circuit
14
2.7 Battery Charger Control System
In order to control the modes of operations, a battery control system was put in place to
monitor and switch between charging modes, depending on the current conditions of our device.
2.7.1 Battery Control Monitoring System
Two analog inputs from the Arduino are dedicated to the battery monitoring system. Table 2.5
shows the relationship between the Arduino analog inputs and the two onboard power sources.
Each analog input requires a voltage divider in order to ensure no more than 5 V is applied to
any input pins of the Arduino [2].
Table 2.5: Charger Circuit Relay Configuration
Arduino Power
Source Voltage Divider Analog Input [V] Analog
Input
A0 12 V Supply 4.45
A1 9V Batteries 3.91
The control algorithm flow seen in Figure 2.11 shows that unless the 12 V power supply is
connected, the battery charger control system is off.

Portable Restive Leakage Current Monitoring System 2.0 Power Supply & Battery Charging Circuit
15
Figure 2.11: Charging Control Algorithm
When the battery is below its maximum voltage, the Arduino microprocessor will not execute
any commands. However, when the maximum voltage of the battery is reached, the Arduino
will raise digital pin 3 to 5V which will switch the battery charging modes.
2.8 Battery Charger Control Actuator System
The actuator of the charging control system is the 12 V relay. Unlike the other two relays,
which were easily implemented directly from the 12 V DC power adapter, this relay would need
to be activated once the Arduino acknowledges that the maximum battery charge level had
been reached.
2.8.1 Battery Charger Control Actuator Design
The 12 V switching power adapter provides the primer for the relay, while a combination of a
12 VDC relay and a pull down transistor were designed to activate the relay once the maximum

Portable Restive Leakage Current Monitoring System 2.0 Power Supply & Battery Charging Circuit
16
voltage condition is reached. The 5 V source which is connected to the base of the pull down
transistor is represented by digital pin 3 of the Arduino.
In order to choose the appropriate biasing resistors, the emitter resistance was found using
expression ( 3 ), which relates the relay turn-on current to the minimum emitter current.
IE ≈ IC ≥ 11.7 mA ( 3 )
Expression ( 4 ) relates the value of the relay current to the maximum emitter resistance.
RE ≤ (VB – VBE)/(IE) = 367.52 Ω ( 4 )
VBE used in expression ( 4 ) was found using a measured base-emitter voltage of 0.7 V. A
resistor value of 33 Ω was chosen to ensure a large enough current runs through the relay coil.
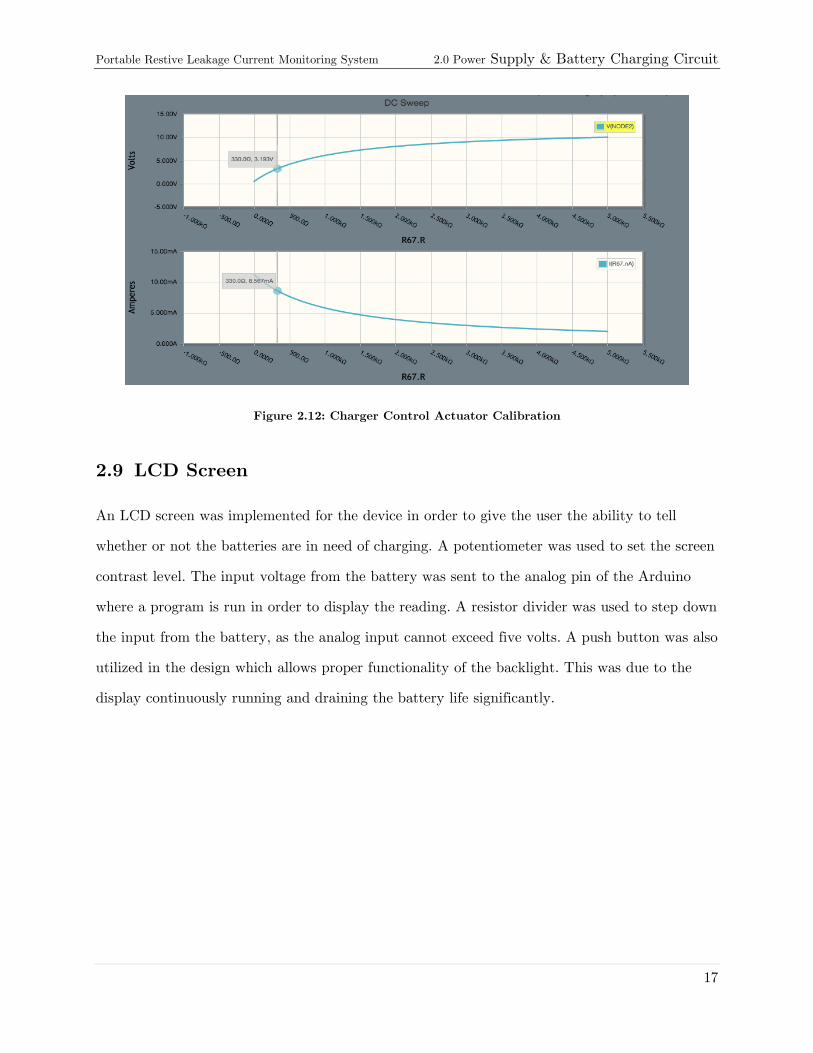
Additionally, a relay turn on voltage of 9V is required [10]. To calibrate the relay, a simulation
was carried out to find the optimum value of the collector resistor. The results for this
simulation can be seen in Figure 2.12. Although a 330 Ω resistor was simulated to have an
optimal coil turn on voltage, a final resistor value of 270 Ω was chosen.
Finally, Table 2.6 describes the states of the battery charger and how they are related to the
states of the battery charger control 12 V relay. Each of the outputs of this double-pole, double
throw relay are simultaneously switched in order to select the appropriate charge mode, as seen
in Figure 2.12. The power supply implementation can be seen in Appendix G – Device
Hardware.
Table 2.6: Charger Circuit Relay Logic
Relay State Relay N/C Relay N/O
Battery Charger
Mode
Fast
Charge
Trickle
Charge
Portable Restive Leakage Current Monitoring System 2.0 Power Supply & Battery Charging Circuit
17
Figure 2.12: Charger Control Actuator Calibration
2.9 LCD Screen
An LCD screen was implemented for the device in order to give the user the ability to tell
whether or not the batteries are in need of charging. A potentiometer was used to set the screen
contrast level. The input voltage from the battery was sent to the analog pin of the Arduino
where a program is run in order to display the reading. A resistor divider was used to step down
the input from the battery, as the analog input cannot exceed five volts. A push button was also
utilized in the design which allows proper functionality of the backlight. This was due to the
display continuously running and draining the battery life significantly.

Portable Restive Leakage Current Monitoring System 2.0 Power Supply & Battery Charging Circuit
18
Figure 2.13: LCD Display Connection
Figure 2.13 depicts the physical connection of the LCD display to the Arduino. Programming
for the LCD display is provided in Appendix B – Arduino Code.

Portable Restive Leakage Current Monitoring System 3.0 Measurement Method, Protection and Biasing
19
3.0 Measurement Method, Protection and Biasing
In order for a user to conduct an analysis of the arrester leakage current, several operations
must be applied to the input signal prior to being processed by the Arduino. This section
describes each of the stages involved in the leakage current processing.
3.1 Measurement Method
An initial design of this project required the use of a current transformer to measure the
lightning arrester leakage current. Using a split-core clamping CT enables a technician to easily
attach the measurement system to the grounding conductor of the arrestor. Preliminary
prototyping of the system design was done to select a current transformer that could meet the
design requirements. The CT would need to reliably measure leakage currents in the range of
0.1-10 mA at 60 Hz. However, a split-core CT that measured currents in the target range was
not available to us. Instead, a solid core CT was selected and purchased. Unfortunately testing
showed that the CT, a CR8401-1000-G [11] shown in Figure 3.1, was not capable of measuring
60 Hz AC currents of less than 20 mA. This made it unsuitable for the project. Additionally, it
was found that the lower price CTs tended to pick up stray flux from surrounding electronics,
which would skew the results. This is especially unwanted in the highly noisy environment of a
power systems station.
Figure 3.1: Tested CT CR8401-1000-G

Portable Restive Leakage Current Monitoring System 3.0 Measurement Method, Protection and Biasing
20
After discussion with our supervisor, Dr. Kordi, the decision was made to eliminate the current
transformer from the design. The updated method of capturing the required leakage current
wave would be by using a ground-side resistor to get a voltage output which can be converted
to current using ohms law. Although this limits the systems field use due to the difficulty of
connecting a resistor in series with the surge arrestor, it allows for higher reliability and
confidence in results. Additionally, since the measurement of the leakage current and the use of
the Modified Shifted Current Method are located in different modules of the project, changing
the method of measurement has no affect on the algorithm. Using a grounding resistor in this
manner is already the industry standard for measuring surge arrestor leakage currents in the lab
setting, as attested by our industry advisor Nathan Jacob. After this decision, the input module
of the system was designed to accommodate a 2 mA current flowing across a 200-Ohm ground-
side resistor as shown in Figure 3.2. This would generate approximately 800 mV pk-pk at the
input to the biasing and protection circuits.
Figure 3.2: Experimental Test Setup w/ Grounding Resistor
3.2 DC Biasing Circuit
The analog waveform obtained when reading the voltage from the ground side resistor has a
voltage varying between -0.4 V< 𝑉𝑅𝐸𝐹 < 0.4 V however, the Arduino’s A2D system is only
Portable Restive Leakage Current Monitoring System 3.0 Measurement Method, Protection and Biasing
21
capable of measuring signals greater than 0 Volts. As such, a DC biasing circuit is required in
the design to bringing the signal above zero.
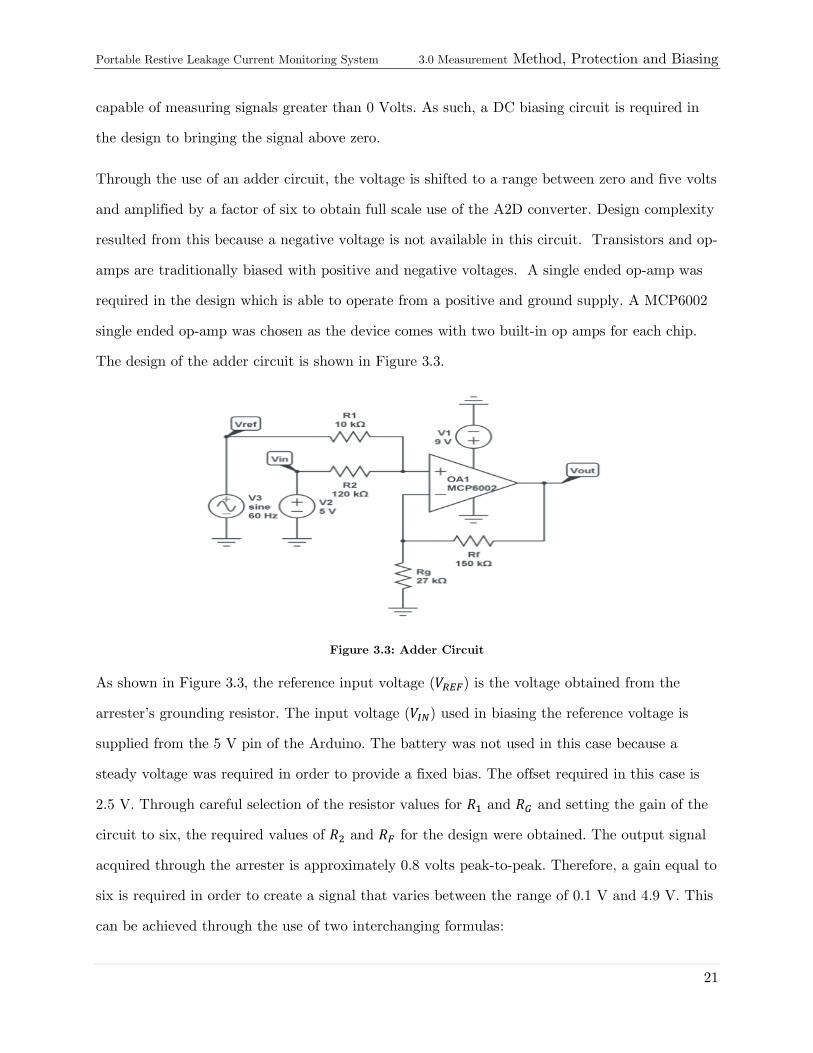
Through the use of an adder circuit, the voltage is shifted to a range between zero and five volts
and amplified by a factor of six to obtain full scale use of the A2D converter. Design complexity
resulted from this because a negative voltage is not available in this circuit. Transistors and op-
amps are traditionally biased with positive and negative voltages. A single ended op-amp was
required in the design which is able to operate from a positive and ground supply. A MCP6002
single ended op-amp was chosen as the device comes with two built-in op amps for each chip.
The design of the adder circuit is shown in Figure 3.3.
Figure 3.3: Adder Circuit
As shown in Figure 3.3, the reference input voltage (𝑉𝑅𝐸𝐹) is the voltage obtained from the
arrester’s grounding resistor. The input voltage (𝑉𝐼𝑁) used in biasing the reference voltage is
supplied from the 5 V pin of the Arduino. The battery was not used in this case because a
steady voltage was required in order to provide a fixed bias. The offset required in this case is
2.5 V. Through careful selection of the resistor values for 𝑅1 and 𝑅𝐺 and setting the gain of the
circuit to six, the required values of 𝑅2 and 𝑅𝐹 for the design were obtained. The output signal
acquired through the arrester is approximately 0.8 volts peak-to-peak. Therefore, a gain equal to
six is required in order to create a signal that varies between the range of 0.1 V and 4.9 V. This
can be achieved through the use of two interchanging formulas:

Portable Restive Leakage Current Monitoring System 3.0 Measurement Method, Protection and Biasing
22
𝑽𝑹𝑬𝑭 = 𝟎. 𝟖 𝑽 𝒑𝒌 − 𝒑𝒌, 𝟔𝟎 𝑯𝒁 𝑽𝑰𝑵 = 𝟓𝑽 ( 5 )
Gain required for 𝑉𝑅𝐸𝐹 𝑖𝑠 𝐺𝑅𝐸𝐹 = 6
(𝟏 +𝐑𝐅
𝐑𝐆) (
𝐑𝟐
𝐑𝟏 + 𝐑𝟐) = 𝟔 ( 6 )
The gain required for 𝑉𝐼𝑛 𝑖𝑠 𝐺𝐼𝑁 = 0.5, which is used to obtain an offset of 2.5 volts.
(𝟏 +𝐑𝐅
𝐑𝐆) (
𝐑𝟏
𝐑𝟏 + 𝐑𝟐) = 𝟎. 𝟓 ( 7 )
Dividing equation (6) by the equation (7), we can obtain the values of 𝑅1 and 𝑅2.
(𝟏 +𝐑𝐅𝐑𝐆
) (𝐑𝟐
𝐑𝟏 + 𝐑𝟐)
(𝟏 +𝐑𝐅𝐑𝐆
) (𝐑𝟏
𝐑𝟏 + 𝐑𝟐)
= 𝟔
𝟎. 𝟓 ( 8 )
𝐑𝟐
𝐑𝟏= 𝟏𝟐 𝐨𝐫 𝐑𝟐 = 𝟏𝟐𝐑𝟏 ( 9 )
A large input impedance was required when looking into the network in order to avoid
attenuation of the signal. Therefore a high resistance value for 𝑅1 was selected.
𝐑𝟏 = 𝟏𝟎𝐤𝛀 𝐚𝐧𝐝 𝐑𝟐 = 𝟏𝟐𝐑𝟏 = 𝟏𝟐(𝟏𝟎𝐤𝛀) = 𝟏𝟐𝟎𝐤𝛀 ( 10 )
These two values were used in order to obtain the resistor values for 𝑅𝐹 and 𝑅𝐺.
(𝟏 +𝐑𝐅
𝐑𝐆) (
𝐑𝟐
𝐑𝟏 + 𝐑𝟐) = 𝟔 ( 11 )
(𝟏 +𝐑𝐅
𝐑𝐆) (
𝟏𝟐𝟎𝐤𝛀
𝟏𝟎𝐤𝛀 + 𝟏𝟐𝟎𝐤𝛀) = (𝟏 +
𝐑𝐅
𝐑𝐆) (
𝟏𝟐
𝟏𝟑) = 𝟔 ( 12 )
𝐑𝐅
𝐑𝐆=
(𝟏𝟑)(𝟔)
(𝟏𝟐)= 𝟓. 𝟓 𝐨𝐫 𝐑𝐅 = 𝟓. 𝟓(𝐑𝐆) ( 13 )
Selecting 𝑅𝐺 = 27𝑘Ω, we obtain:
𝐑𝐅 = 𝟓. 𝟓 (𝟐𝟕𝐤𝛀) = 𝟏𝟒𝟖. 𝟓𝐤𝛀 ( 14 )
Using standard resistor values, we select 𝑅𝐹 = 150𝑘Ω.
Figure 3.4 shows the input waveform 𝑉𝑅𝐸𝐹 and the associated output waveform 𝑉𝑜𝑢𝑡, after the dc
biasing circuit.

Portable Restive Leakage Current Monitoring System 3.0 Measurement Method, Protection and Biasing
23
Figure 3.4: Simulation of the Adder Circuit
Figure 3.5 shows the results of the tested device, which agrees with the simulation. As expected,
the range of the output is between 0.1 volts and 4.9 volts, with a DC offset of 2.5 volts.
Figure 3.5: Output of Adder Circuit
3.3 Protection Circuit
An overvoltage protection circuit is required in many devices involving electrical components
because they can be damaged due to unexpected surges. A crowbar circuit design is used to
protect a circuit against high voltages in the event of a power supply malfunction or power
surge. This type of circuit works by sensing when a voltage exceeds a certain threshold and then
Portable Restive Leakage Current Monitoring System 3.0 Measurement Method, Protection and Biasing
24
shorts out the power supply. Therefore, a voltage drop occurs in the rest of the circuit and a
current surge runs through the power supply, which will trip a circuit breaker or blow a fuse.
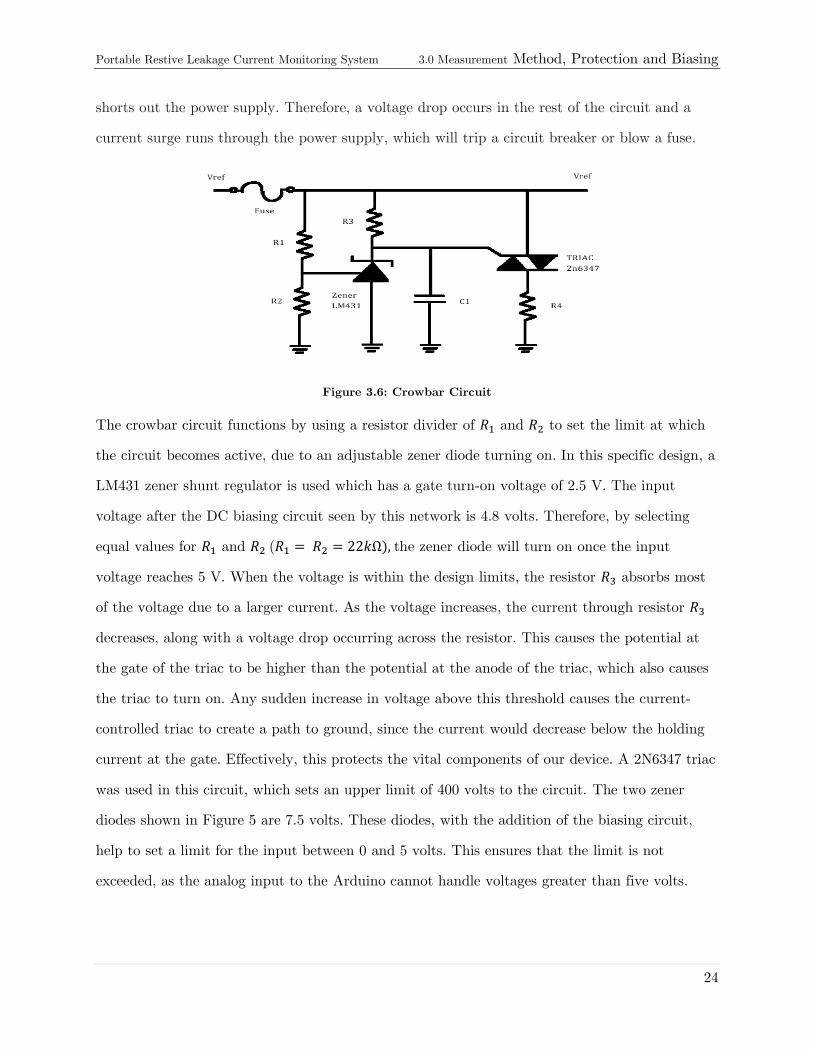
Figure 3.6: Crowbar Circuit
The crowbar circuit functions by using a resistor divider of 𝑅1 and 𝑅2 to set the limit at which
the circuit becomes active, due to an adjustable zener diode turning on. In this specific design, a
LM431 zener shunt regulator is used which has a gate turn-on voltage of 2.5 V. The input
voltage after the DC biasing circuit seen by this network is 4.8 volts. Therefore, by selecting
equal values for 𝑅1 and 𝑅2 (𝑅1 = 𝑅2 = 22𝑘Ω), the zener diode will turn on once the input
voltage reaches 5 V. When the voltage is within the design limits, the resistor 𝑅3 absorbs most
of the voltage due to a larger current. As the voltage increases, the current through resistor 𝑅3
decreases, along with a voltage drop occurring across the resistor. This causes the potential at
the gate of the triac to be higher than the potential at the anode of the triac, which also causes
the triac to turn on. Any sudden increase in voltage above this threshold causes the current-
controlled triac to create a path to ground, since the current would decrease below the holding
current at the gate. Effectively, this protects the vital components of our device. A 2N6347 triac
was used in this circuit, which sets an upper limit of 400 volts to the circuit. The two zener
diodes shown in Figure 5 are 7.5 volts. These diodes, with the addition of the biasing circuit,
help to set a limit for the input between 0 and 5 volts. This ensures that the limit is not
exceeded, as the analog input to the Arduino cannot handle voltages greater than five volts.

Portable Restive Leakage Current Monitoring System 3.0 Measurement Method, Protection and Biasing
25
The capacitor is used in order to reduce the sensitivity of the triac to short voltages spikes. As
well, it reduces the risk of a false triggering of the triac, due to the initial application of a
voltage which could be a sudden increase of voltage upon start up. It was discovered that the
gate of the triac needed a holding current above the threshold applied at the gate, in order to
set the limit for triggering of the device. Therefore, this device could not be placed before the
DC biasing circuit as a negative input voltage caused the device to trigger. Unfortunately, the
DC biasing circuit is not be protected by the crowbar circuit, but all other vital components of
the device will be. Since the circuit protects against sudden increases in voltage, but not against
high current levels, a fuse is necessary. A value of 1A was chosen in order to set an upper limit
for the current.
Figure 3.7: Protection Circuit Output
Figure 3.7 shows that the output is limited between 0 and 5 volts for any increase in the input
signal above 0.8 V peak-to-peak, which helps protect the Arduino.
3.4 Low pass Filter
The nominal frequency of operation for the signal is given to be 60 Hz. However, excess noise
can cause the signal to become distorted. The noise can be limited through the use of a low pass

Portable Restive Leakage Current Monitoring System 3.0 Measurement Method, Protection and Biasing
26
filter. In this case, we are using a filter that allows up to the 11th harmonic to pass through, in
order to block out noise and provide a clear signal.
For this design, a 2nd
order Sallen-Key filter was chosen that is a unity gain active filter.
Through selection of the capacitor values (𝐶1 and 𝐶2) and setting the desired frequency cut-off,
the resistance values of the filter were obtained. However, the experimental values did not
comply with actual results, so the filter designed needed to be adjusted. Designing a filter with a
cut-off frequency of 5 kHz helped to obtain the desired frequency cut-off of about 2.5kHz.
Selecting 𝐶 = 𝐶1 = 𝐶2 = 4.7𝑛𝐹 and also selecting 𝑅 = 𝑅1 = 𝑅2:
𝐟𝐜 = 𝟏
𝟐𝛑√𝐑𝟏𝐂𝟏𝐑𝟐𝐂𝟐
= 𝟏
𝟐𝛑√𝐑𝟐𝐂𝟐=
𝟏
𝟐𝛑𝐑𝐂 ( 15 )
𝐑 = 𝟏
𝟐𝛑𝐟𝐜𝐂=
𝟏
𝟐𝛑(𝟓𝐤𝐇𝐳)(𝟒. 𝟕𝐧𝐅)= 𝟔𝟕𝟕𝟐. 𝟔𝛀 ≈ 𝟔. 𝟖𝐊𝛀 ( 16 )
𝐟𝐜 = 𝟏
𝟐𝛑√𝐑𝟏𝐂𝟏𝐑𝟐𝐂𝟐
= 𝟏
𝟐𝛑√(𝟔. 𝟖𝐤𝛀)(𝟒. 𝟕𝐧𝐅)(𝟔. 𝟖𝐤𝛀)(𝟒. 𝟕𝐧𝐅)= 𝟒𝟖𝟕𝟗. 𝟖𝟐 𝐇𝐳 ≈ 𝟓𝐤𝐇𝐳 ( 17 )
Figure 3.8: Second Order Low Pass Filter
Figure 3.8 depicts the topology of the 2nd order Sallen-key filter. Again, the MCP6002 op amp is
used in the design of the filter.

Portable Restive Leakage Current Monitoring System 3.0 Measurement Method, Protection and Biasing
27
Figure 3.9: Low Pass Filter Frequency Response
As seen in Figure 3.9, a 2nd
order Sallen-Key filter attenuates fairly slowly and the -3 dB corner
frequency point is obtained at about 2.4 KHz. Increasing the order of the filter or cascading
similar filters in series can increase the attenuation rate of the filter. However, for the purpose of
our design, the second order filter was substantial enough.
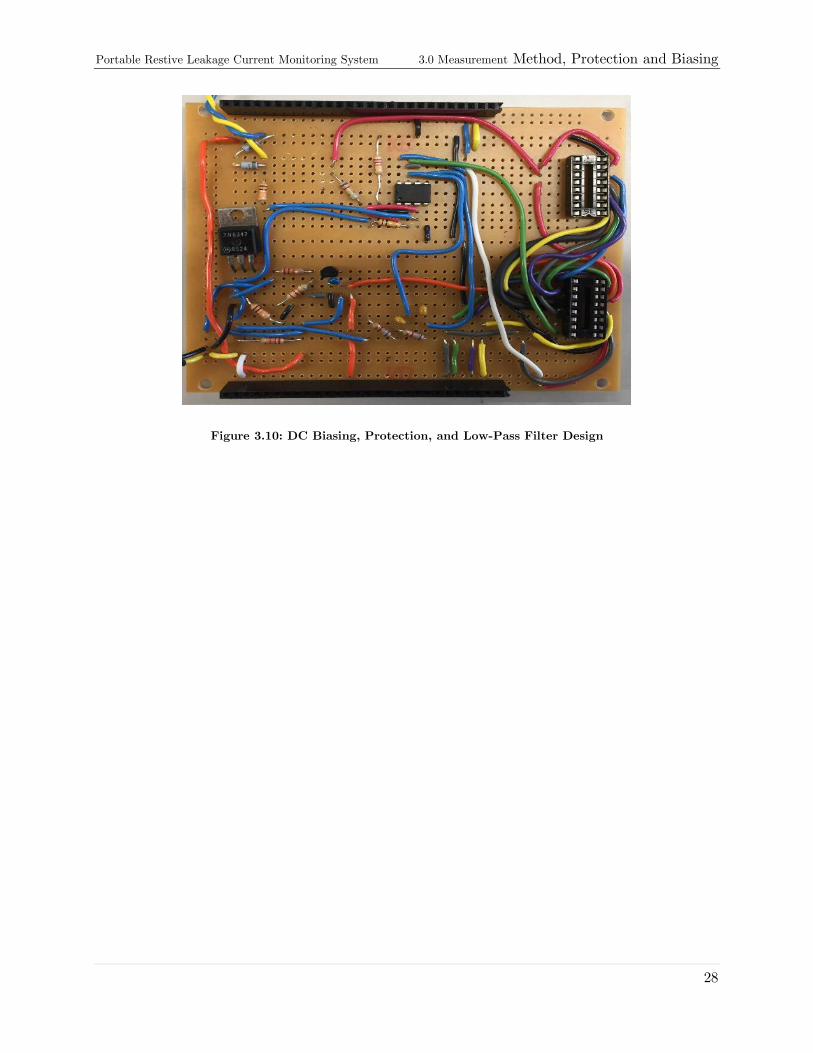
The final result of the DC biasing circuit, protection circuit and the low pass filter is shown in
Figure 3.10. The connectors at the top left and bottom left connect to the battery charging
circuit, while the connecter at the bottom right established the connection between the input
signal, the battery charging circuit and the Arduino. The top right connector links the Arduino
and the LCD display together in order to provide a reading for the battery voltage level.
Portable Restive Leakage Current Monitoring System 3.0 Measurement Method, Protection and Biasing
28
Figure 3.10: DC Biasing, Protection, and Low-Pass Filter Design

Portable Restive Leakage Current Monitoring System 4.0 Wireless & Data Acquisition
29
4.0 Wireless & Data Acquisition
In Section 4, the methods for data acquisition and wireless communication are discussed in
depth. This includes selection of components and pertinent design decisions.
4.1 Wave Capture
The microprocessor selected for this project, the Arduino Uno, has a 6-channel successive
approximation analog to digital convertor available on board [12]. The ADC is capable of
measuring within 10 bits of resolution with an overall absolute error of less than 2 LSB. This is
done while operating at a sampling rate of up to 15 kilo samples-per-second.
For this project the maximum sampling rate is determined by the following:
𝒇𝒎𝒂𝒙𝒊𝒎𝒖𝒎 =
𝒇𝒄𝒍𝒐𝒄𝒌
𝑨𝑫𝑪 𝑷𝒓𝒆𝒔𝒄𝒂𝒍𝒆𝒓 ∗ 𝑪𝒚𝒄𝒍𝒆𝒔 𝒑𝒆𝒓 𝑪𝒐𝒏𝒗𝒆𝒓𝒔𝒊𝒐𝒏=
𝟏𝟔 𝑴𝑯𝒛
𝟏𝟐𝟖 ∗ 𝟏𝟑
= 𝟗𝟔𝟏𝟓 𝑯𝒛
( 18 )
The actual sampling frequency will be lower due to the instruction delay in the following
Arduino sampling code:
cli();
for (int samp = 0; samp < numSamples; samp++)
analogValues[samp] = analogRead(sensorPin);
sei();
Fortunately, the exact sampling rate is unimportant, as the fundamental frequency of the input
waveform is known to be precisely 60 Hz, which allows the sampling rate to be extracted from
the waveform if necessary. Furthermore, the MSCM does not rely on the frequency of operation.
4.2 Bluetooth Connectivity
A main target of the project was wireless connectivity to the measurement system. In the
planning stage, several types of communication were considered, such as Bluetooth, Zigbee, and

Portable Restive Leakage Current Monitoring System 4.0 Wireless & Data Acquisition
30
WiFi. A WiFi connection required both devices to have Internet available to them, which is
impossible in the field. Zigbee, while having a very high reliability and low power consumption,
is more expensive and unnecessary for this project. Therefore, Bluetooth was selected due to its
simplicity of use when connecting with modern laptop computers and its reasonable range of
approximately 30 meters. After research, the device selected for use in the project was the
Bluefruit EZ-Link Bluetooth Shield as pictured in Figure 4.1 with Arduino Uno Rev. 3.
Figure 4.1: Bluefruit EZ-Link Shield w/ Arduino Uno R.3
This shield plugs onto the top headers of the Arduino Uno board and acts as a Bluetooth serial
link and programmer for the Uno. Once power is applied to the Bluetooth shield, it appears as a
parable device for computers using Windows, Mac OSX, and Linux, as well as mobile devices
running on Android [13].
4.3 Device-to-Device Communication
To allow communication between the user’s computer and microcontroller, code was developed
first on the Arduino and in Matlab. Finally, the code was re-developed in Python to connect
with the Arduino. This section will focus on the code developed for connection between the
Arduino and Python.

Portable Restive Leakage Current Monitoring System 4.0 Wireless & Data Acquisition
31
4.3.1 Arduino
On the Arduino, there are two main operations occurring, which check for commands from the
user, and handle the battery control and LCD. When communicating with the user’s computer,
there are two core commands used. Sending command ‘S’ will begin the capturing and sending
of a sample wave to the computer. Sending command ‘V’ will tell the Arduino to send a ‘V’
character back in order to validate that the computer is in fact connecting to the Arduino. The
block diagram explaining the code in shown in Figure 4.2.
Figure 4.2: Arduino Communication Protocol Flow Chart
Two things of note are as follows:
Interrupts are turned off during analog sampling to prevent the interrupt service
routine responsible for updating the charging mode and battery display from
triggering during a sampling period, which would make the data non-periodic.
Samples are sent 100 at a time. This is due to restrictions on the number of
characters that can be stored in the Bluetooth serial buffer.

Portable Restive Leakage Current Monitoring System 4.0 Wireless & Data Acquisition
32
In addition to the code responsible for communication, the interrupt service routine
previously mentioned contains the code required to update the battery charging
mode and measure and display the current battery voltage. The routine is set to
trigger every four seconds using Timer1 of the Arduino. For full code details please
see Appendix B – Arduino Code.
A flow chart for the operation of the Battery Control Circuit is shown in Figure 2.11.
4.3.2 Python
On the user’s computer, the communication code is broken up into several callable python
functions. For full code details please see Appendix C – Python Communication Code. Initially,
several functions were created which mirror the Arduino implementation and allow consistent
communication to and from each device. These functions are “validateConnection” and
“captureWave”. The simplified flow charts for both functions are found in Figure 4.3 below.
Figure 4.3: CaptureWave and ValidateConnection Function Flow Charts
In addition to these functions, several functions were created to allow the GUI to more easily
interface with the Arduino which are “getPort” and “getWave”. The first function creates a list

Portable Restive Leakage Current Monitoring System 4.0 Wireless & Data Acquisition
33
of available serial ports on the computer and attempts to connect to each of them sequentially
to see if the Arduino is connected to one of them and returns that port. This allows the
computer to automatically connect over USB or Bluetooth, depending on which is available. See
Figure 4.4 for flowcharts.
Figure 4.4: Functional Flow Chart for Finding and Connecting to Arduino

Portable Restive Leakage Current Monitoring System 4.0 Wireless & Data Acquisition
34
When you successfully create a serial link to the Arduino, it causes it to reset. The time it takes
for the reset sequence to complete and for the program to enter the main loop is approximately
1.5 seconds. The two-second delay allows the microcontroller time to begin responding to the
serial command ‘V’, which allows validation of connection.
The final function “getWave” checks that the Arduino is still connected, then captures a wave
and returns it. If the Arduino is no longer connected, it returns False.
4.4 Comments
These functions performed as expected when integrated with the Graphical User Interface.
Connection to the device takes approximately 10-15 seconds while it tests each port, while the
actual capturing of a waveform takes less than 1 second. Results are accurate within 5% of the
actual currents as discussed in Section 5.4.
Portable Restive Leakage Current Monitoring System 5.0 Data Processing
35
5.0 Data Processing
In section 5.0 below, the data processing of the lightning arrester leakage current is explained in
detail. Included in this section is a brief summary explaining the function of the lightning
arrester and the method used for assessing arrester health. After the reader is briefed on the
diagnostic process of the lightning arrester, the digital signal processing is explained in further
detail.
5.1 Arrester Leakage Current Waveform
Lightning arresters are devices that contain a voltage dependant resistance, commonly known as
varistors. The general function of the arrester is to provide overvoltage protection on
transmission equipment, such as transformers and switch gear. When the voltage is operating
below the MCOV rating, an arrester will act as a high impedance path to ground in the Mega
Ohm range. When an overvoltage surge event occurs, the nonlinear resistance characteristic of
the arrester lowers the internal resistance and allows a ground path for the current. Each time
an overvoltage event occurs, the arrester will degrade internally. When an arrester is connected
to the system, a nominal current, usually in the order of mA, will leak through the arrester.
This leakage current through the arrester can be described by the simplified model shown in
Figure 5.1, in which a capacitor is in parallel with a variable resistance. The leakage current
exiting the arrester is made of up the summation of the parallel resistor and capacitor. Figure
5.2 shows an example of the arrester total leakage waveform.

Portable Restive Leakage Current Monitoring System 5.0 Data Processing
36
Figure 5.1: Arrester Shunt Model
Figure 5.2: Arrester Leakage Current
The resistive portion of the leakage current is the sum of a number of odd harmonics in the
range of 1 to 11, where the magnitude decreases as the harmonic increases. When experts
attempt to diagnose the condition of a lightning arrester, they look at the resistive component.
The leakage current must be broken up into the resistive and capacitive components in order to
diagnose the arrester’s health. If the capacitor current waveform is known, it can be subtracted
from the total leakage waveform, resulting in the resistive component. By viewing a frequency
spectrum of the remaining signal, the arrester can then be diagnosed. The actual extraction of
the resistive leakage current is the objective of this project. Diagnoses and interpretation of the
leakage waveform is out of this projects scope and up to a trained engineer. The following
sections outline the process to obtain the resistive component from the total leakage current.

Portable Restive Leakage Current Monitoring System 5.0 Data Processing
37
5.2 Simulated Arrester Waveform
Testing of our device was done in a low voltage lab as access to an actual lightning arrester was
not achieved. For practicality and safety, the use of an arrester operating in excess of 18 kV for
testing was not possible. The solution to this problem was to generate a simulated arrester
waveform using common lab equipment. This was done by taking a summing amplifier and
several waveform generators to add together 1st, 3rd and 5th harmonic waveforms to generate an
equivalent resistive component. A capacitor current was also added to effectively model the
parallel resistance and capacitances. The reader should note that a true arrester waveform
contains up to 11 harmonics. However, it was not practical in the lab to build a device that
would generate up to the 11th harmonic. Therefore, there are slight discrepancies between this
waveform and one coming from a real arrester. The schematic shown in Figure 5.3 was built in
hardware and was used during testing to act as a lightning arrester.
Figure 5.3: Lightning Arrester Leakage Current Simulation
The designed system outputs the resistive leakage current, shown in Figure 5.4, as well as the
capacitive component. Figure 5.5 shows the total waveform output which is ultimately sent to
our device for processing and mimics the true arrester leakage waveform.
U1
741
3
2
4
7
6
51
V++
V--
R1
10kΩ
R2
10kΩ
R4
10kΩ
R5
10kΩV3
100mVpk
60 Hz
0°
R8
100Ω
V4
70mVpk
180 Hz
180°
V5
50mVpk
300 Hz
0°
U2
7413
2
4
7
6
51
V--_1
V++_1
R3
10kΩ
C1
10µF

Portable Restive Leakage Current Monitoring System 5.0 Data Processing
38
Figure 5.4: Resistive Component of Leakage Current
Figure 5.5: Simulated Leakage Current Waveform
5.3 Digital Low Pass Filter
The first stage in the data processing is a digital low pass filter which was implemented for two
reasons. First, if any noise or unwanted voltage spikes enter the waveform, there is a risk that
incorrect data will be returned to the user. The second purpose of this low pass filtration is to

Portable Restive Leakage Current Monitoring System 5.0 Data Processing
39
correct the resolution on the A2D converter on the Arduino. The original design plans called for
only a low pass filter in hardware before being digitized. It became apparent after the first trial
of digital sampling that the signal appeared jagged and the A2D resolution did not create a
perfect replica of the original signal. However, this was not a problem given the knowledge of
the harmonic content for the original signal. An algorithm was added into code to linearly
extrapolate the number of data points, as well as performing an FFT. This resulted in only the
signal lying below the 11th harmonic being retained. The final product was a smooth signal
that would be appropriate for further processing.
5.4 MSCM
The Modified Shifted Current Method (MSCM) is an algorithm outlined in the IEEE paper
produced by Malek and Novizon [1]. It outlines a method to extract the resistive leakage current
waveform from the total waveform when presented with an arrester. The advantage of the
algorithm over the conventional system for extracting resistive leakage current is that it can be
done without knowledge of the voltage waveform applied across the arrester. Basic circuit
theory leads to Figure 5.6, where the current through a capacitor will lead the voltage by 90
degrees, whereas a resistor’s current will be in phase with the voltage. If the voltage source is
known, the capacitive current peak can be approximately taken as the value 90 degrees ahead of
the voltage peak on the current waveform. Traditionally, a technician would generate this
capacitive waveform, and then subtract it from the total arrester leakage current.
Figure 5.6: Current Voltage Characteristic

Portable Restive Leakage Current Monitoring System 5.0 Data Processing
40
A block diagram schematic of the MSCM is shown in Figure 5.7. The actual derivation of the
algorithm is out of the scope of this project and is not of crucial importance.
Figure 5.7: Block Diagram of Modified Shifted Current Method
Before proceeding on the project, we wanted to first asses the functionality of the algorithm. It
was not in anyone’s ability to assess the mathematical correctness, but rather experimentally we
could assess the suitability. Initially, the algorithm was coded in Matlab as this was a familiar
programming language and is designed specifically for scientific and mathematical programming.
As well, Matlab’s convenient graphing ability allowed for easy design and testing. As outlined
in 5.3, the use of an actual lightning arrester was not achieved. However, by feeding an actual
lightning arrester waveform into it digitally, the suitability of the algorithm could be tested.
Nathan Jacob, our industry advisor from Manitoba Hydro, sampled a lightning arrester
waveform on our behalf and emailed the results. Shown in Figure 5.8 is the total leakage current
waveform.

Portable Restive Leakage Current Monitoring System 5.0 Data Processing
41
Figure 5.8: Manitoba Hydro Lightning Arrester Leakage Current Waveform
The reader should note the difference in the time domain of the wave shapes between Figure 5.8
and Figure 5.5. As explained earlier, our lab simulation only included up to the 5th harmonic,
and not the 11th. The waveform in Figure 5.8 was fed into the MSCM and the result is shown in
Figure 5.9.
Figure 5.9: Extracted Resistive Leakage Component From Manitoba Hydro Arrester
Unlike the waveform generated by our group, we were not aware of the original leakage resistive
current to determine if the results were accurate. Included in the paper by Malek and Novizon
[1] was an example of what an arrester waveform and extracted resistive component should look
like as shown in Figure 5.10.

Portable Restive Leakage Current Monitoring System 5.0 Data Processing
42
Figure 5.10: Stock Arrester Wave and Extracted Leakage
The comparison between amplitudes as well as wave shapes shown in Figure 5.8, Figure 5.9 and
Figure 5.10 were satisfactory to use in confirming that the MSCM was indeed affective.
The next step in the design process was to transfer the Matlab code into something more readily
available in industry. Our group chose to utilize Python because of its strong familiarity with
both computer and electrical engineers. As well, Python was chosen due to the easy importing
of scientific packages that operate similarly to Matlab. A final test of the operation of our
system was conducted with the simulated arrester waveform as outlined in 5.2. Shown in Figure
5.5 is the total waveform that was fed into the system.

Portable Restive Leakage Current Monitoring System 5.0 Data Processing
43
Figure 5.11: Extracted Resistive Component
Shown in Figure 5.11 is the arrester resistance current component that was extracted by our
device. A comparison between that and Figure 5.4 shows an initial amplitude of 108 mV and
the extracted current shows 103mV, which has a 5% error.

Portable Restive Leakage Current Monitoring System 6.0 GUI
44
6.0 GUI
The main purpose of our Graphical User Interface is to provide a user friendly method to
interact with the device, as well as monitor and store information on lightning arresters over
time. Once a new lightning arrester is installed, a user can create a new arrester instance and
store crucial information for this specific arrester in the GUI. When a data reading is initiated,
the unfiltered arrester waveform will be displayed to the user. If the waveform is not acceptable,
meaning that errors occurred which have affected the data in some way, the user can decide not
to utilize this waveform data and is able to try again. However, if the reading is successful, our
MSCM code will then be run on the data sample. Once complete, both the resistive component
of the leakage current and its FFT will be displayed to the user. The user can then monitor and
evaluate these waveforms over time and decide if a specific arrester needs to be replaced due to
degradation.
6.1 Planning Stage
Originally, our GUI went through development stages in which Matlab, in conjunction with
C++ were going to be utilized. This seemed to be ideal as our MSCM was going to be
implemented in Matlab. However, due to Manitoba Hydro not having the proper licensing
package for Matlab, alternative ideas needed to be considered. Further research was conducted
on GUI implementations and it was discovered that Python had a standard, easy-to-use GUI
library package called Tkinter [14]. This seemed to be ideal as it had all of the functionality we
required. Additionally, Tkinter could easily be added to with external, open-source python
packages. This was of utmost importance due to our necessity of using additional python-based
frameworks as part of the GUI and data processing. Lastly, when compared to C++, Python
seemed to be more easily utilized for our purposes. Therefore, the choice was clear to move
forward with programming the GUI in Python utilizing the Tkinter package.

Portable Restive Leakage Current Monitoring System 6.0 GUI
45
6.2 Python Implementation
At the base of a Tkinter GUI, there is one main root window. This is initialized by creating an
object class for the GUI application, and then wrapping a Tkinter root window within it. The
basic code for this can be seen below in Figure 6.1.
Figure 6.1: Tkinter Root Window Code
Line 1 is purely used for the operating systems to choose the correct version of python to call
when the program is executed. As well, line 2 is the general tkinter import statement which is
needed to utilize the tkinter library. The tkinter module was renamed to “tk” for ease of use in
all future calls to this package. Although tkinter is included within a Python installation, the
library itself still needs to be imported within an individual program. Within lines 4 to 13 are
the main GUI class which is called “ArresterGUI” for intuitiveness. This is the class in which all
functions and data parameters are stored for the GUI. On line 6, the master frame is initialized
and then the “initGUI” function is called. Within this function, the master frame is given a title,
a minimum size with height and width parameters and a background color. Finally, on line 13,
1 #! /usr/bin/env python 2 import tkinter as tk 3 4 class ArresterGUI(tk.Frame): 5 def __init__(self, master = None): 6 tk.Frame.__init__(self, master, bg = 'grey') 7 self.initGUI() 8 9 def initGUI(self): 10 self.master.title( 'Lightning Arrester Monitor & Analysis Program') 11 self.master.minsize(1500, 1000) 12 self.master.config(background = "#FFFFFF") 13 self.grid() 14 15 def main(): 16 root = tk.Tk() 17 ArresterGUI(r oot).pack(fill = "both", expand = True) 18 root.mainloop() 19 20 if __name__ == "__main__": 21 main()

Portable Restive Leakage Current Monitoring System 6.0 GUI
46
the root window frame is displayed on screen with the “grid” function. The definition for the
main function of this program starts on line 15. The ArresterGUI class is instantiated on line 17
and is given a root Tk window as an input parameter. On line 18, the ArresterGUI’s main loop
is started and will begin waiting for any user instantiated events. Lines 20 and 21 were added
for safety to ensure that this program will be properly executed as a main source file when
called and will not be started if another source file were to import this program.
With a master frame initialized, construction of the overall design of the GUI began. The
tkinter module allows organization of the root window frame into separate individual frames.
Inside of these smaller frames, widgets can be placed which are components that tkinter has to
offer that provide functionality to a GUI application. Examples of these include various buttons,
text fields and frame labels. In order to easily switch between different arresters, a drop-down
menu bar was created which was placed in its own frame, on the left side of the root window.
As well, a second frame was created on the right side of the root window to place the waveform
graphs that would be produced whenever a data reading was initialized. The next step taken
was to separate the bottom half of the master frame into sections for different functionality.
Underneath the arrester menu frame, a section was implemented which would be utilized to
create and modify different arresters to track over time. Three buttons were then added to this
frame, which can be used to create a new arrester, modify information regarding a specific
arrester and delete an arrester instance once it is taken out of use due to degradation. In the
center of the bottom of frame, three additional buttons were placed in parallel whose functions
are focused on manipulation and storage of arrester waveform data once read from a device. A
“Save To Excel” button is used to take the most recently imported data from a specific arrester
and save it to an excel spreadsheet. Once this option is selected, excel will open and display this
data summary for an arrester. The details for this implementation are discussed further in
section 6.3.2. Additionally, a button was created to take the same data placed into an excel file
but utilize a PDF document instead. As well, a button was created to directly send this data
report via email to a user-chosen destination. However, as work on the project continued, these
features were ultimately dropped. The reasoning for this being excel is more than sufficient as a

Portable Restive Leakage Current Monitoring System 6.0 GUI
47
framework for displaying and analyzing arrester data and is widely used at Manitoba Hydro for
various purposes. Implementing this functionality for a PDF document would therefore be
redundant as an excel spreadsheet already accomplishes this task. The email functionality was
dropped as the end-user would not have direct access to an internet connection in the field.
Therefore, they would have to wait until they were back at their facility to send a document,
which can easily be done with any mail client program. The final bottom frame section created
was for a “Save and Quit” button, which is necessary to properly save all data before
terminating the program. Lastly, a frame was placed in the middle of the GUI to display vital
information regarding the current lightning arrester being viewed. The final version of our GUI
can be seen below in Figure 6.2.
Figure 6.2: Graphical User Interface
Once the GUI layout was set, work on the individual functions for all of its features was started.
The code for creating, modifying and deleting arresters was written first. After research online,
two specific tkinter classes, “simpledialog” and “messagebox”, were discovered that would be
extremely useful for the functionality required. These classes display pop-up windows which will
Portable Restive Leakage Current Monitoring System 6.0 GUI
48
ask the user various questions. Using these messages, user responses were easily retrieved and
various data could be set for specific arresters.
At this point in the project, a method of keeping track of arresters over time was required. More
specifically, an implementation was needed for saving arrester data once the program was closed
and re-loaded once the program was opened. This functionality is discussed at length in section
6.3.1. However, as a temporary solution, a global array of arresters was created which could be
utilized throughout the actual program execution. Along with this, a new class object called
“Arrester” was created. Originally, this class contained 4 string variables which were an arrester
name, the date it was installed, the location it was installed and any additional comments a user
would like to include. Further arrester variables were later created and are discussed in section
6.3.1.
With the arrester creation and modification functions complete, a method was required to
properly display all relevant information for an arrester once it was selected from the drop down
menu bar. The function “displayArresterInfo” was created for this purpose. Once a lightning
arrester is selected from the menu list, the textbox in the middle of the GUI displays
information about that arrester. Additionally, this function will display arrester waveforms
within the GUI.
6.3 Excel Functionality
6.3.1 Excel Employed Database
In order to store arrester data, Microsoft Excel was utilized because storing data in specific cells
seemed to be a very simplistic process. As research was conducted online about doing so, an
open source python package add-on called openpyxl was discovered [15]. This module allows one
to fully utilize an excel spreadsheet with a wide-array of capabilities.
Initially, the layout of this database system was created pertaining to how the data would be
stored and organized. The first page of the database includes the name of each stored arrester

Portable Restive Leakage Current Monitoring System 6.0 GUI
49
and the number of data readings each one has taken in the past. In order to store the number of
data readings, the Arrester class was given a new variable called “dataSetAmount”. These
variables are used for importing or exporting the precise amount of data readings for each
arrester. Starting on page 2, each page in the database is used for a specific arrester and
includes all of its associated information and data. When the MSCM is run on an arrester data
reading, four values are produced which are time, resistive current, frequency and an FFT.
Therefore, four new Arrester class variables were created for these four respective values. These
new class variables were set as arrays in order to store multiple readings of the data values.
Additionally, another array class variable was created called “dataDateEntry” in order to
organize all data readings for an arrester by data and time. An image of the excel database for
one arrester can be seen below in Figure 6.3.
Figure 6.3: Excel Database

Portable Restive Leakage Current Monitoring System 6.0 GUI
50
The first algorithm to utilize this database was for exporting the arrester data from the GUI.
This function is executed once the user presses “Save and Quit” to end the program.
Comprehensive testing was completed to ensure that the arrester data was exporting properly to
the correct cells in the excel database. After running simulations and complete tests, the GUI
was able to successfully save and store all user-created data upon quitting the program.
The exporting function created was then modified to act as an importing function as well.
Therefore, upon start up of the GUI, all lightning arrester data that had been previously stored
in the excel database would be re-loaded into the program. In summary, all arrester data, if pre-
existing, will be extracted from the master database file and loaded into the GUI. No changes
will be made to the database while the GUI is in use. However, once the user selects the “Save
and Quit” button, all of the data will be stored into a new database file with the previous
information being replaced.
6.3.2 End User Excel Output Summary
In order to easily view the data for a lightning arrester, an algorithm was developed in order to
export a data summary into an excel spreadsheet. An example of this summary can be seen
below in Figure 6.4.
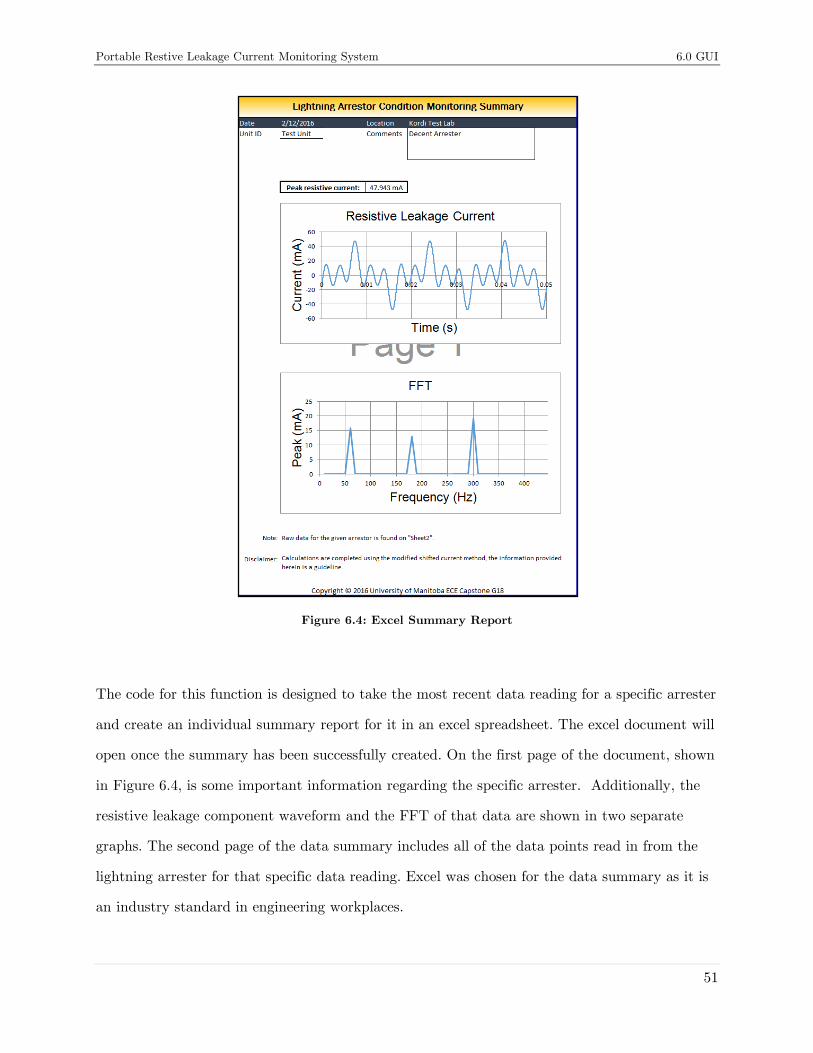
Portable Restive Leakage Current Monitoring System 6.0 GUI
51
Figure 6.4: Excel Summary Report
The code for this function is designed to take the most recent data reading for a specific arrester
and create an individual summary report for it in an excel spreadsheet. The excel document will
open once the summary has been successfully created. On the first page of the document, shown
in Figure 6.4, is some important information regarding the specific arrester. Additionally, the
resistive leakage component waveform and the FFT of that data are shown in two separate
graphs. The second page of the data summary includes all of the data points read in from the
lightning arrester for that specific data reading. Excel was chosen for the data summary as it is
an industry standard in engineering workplaces.

Portable Restive Leakage Current Monitoring System 7.0 Conclusion
52
7.0 Conclusion
The proposed project, with some aforementioned practical modifications, was completed
successfully according to the design specifications set out in Section 1.2. It implements the
Modified Shifted Current Method in order to extract the resistive leakage current of ZnO
lightning arresters. Therefore, a trained technician is able to easily diagnose the health of the
arrester. The use of this method is important and novel because it allows diagnosis to occur
while only measuring the ground-side leakage current and not the more difficult source voltage.
Using modern design components, such as Bluetooth communication, an Arduino
microcontroller and a Python-based GUI, Manitoba Hydro’s method has been updated to suit a
more streamlined approach. Due to these improvements, Group 18 feels confident that the
finished product is valuable to the industry client, Manitoba Hydro.
In summary, the main system modules are:
- Analog biasing and filtering
- Uninterrupted Power Supply
- Signal capturing and transferring
- Data processing
- Graphical User Interface
Each module was completed by a lead designer, in conjunction with other supporting roles from the
group. The total cost of the project was $424.45 CAD out of a total budget of $500 CAD. The completion
of the project was under budget and on schedule. The members of Group 18 are proud of their
contribution to the area of Power Systems study.

Portable Restive Leakage Current Monitoring System 8.0 Bibliography
53
8.0 Bibliography
[1] Z. Abdul-Malek and A. Novizon, "A new method to extract the resistive component of the
metal oxide surge arrester leakage current," IEEE 2nd International, pp. 399-402, 2008.
[2] Arduino LLC, "Arduino Uno," February 2016. [Online]. Available:
https://www.arduino.cc/en/Main/ArduinoBoardUno.
[3] Texas Instruments, "LM317 3-Terminal Adjustable Regulator," October 2014. [Online].
Available: http://www.ti.com/lit/ds/symlink/lm317.pdf.
[4] J. Kopera, "Inside the Nickel Metal Hydride Battery," 25 June 2004. [Online]. Available:
http://www.cobasys.com/pdf/tutorial/inside_nimh_battery_technology.pdf.
[5] Energizer, "Energizer NH22-175 Product Datasheet," [Online]. Available:
http://www.data.energizer.com/PDFs/nh22-175.pdf.
[6] Energizer, "Nickel Metal Hydrive(NiMH) Handbook and Application Manual," [Online].
Available: http://www.data.energizer.com/PDFs/nickelhydride_appman.pdf.
[7] E. Circuits, "Switchless NiCd-NiMH Battery Charger," [Online]. Available:
http://www.eeweb.com/blog/extreme_circuits/switchless-nicd-nimh-battery-charger.
[8] Fairchild Semiconductor, "2N3904/MMBT3904/PZT3904 NPN General Purpose
Amplifier," October 2014. [Online]. Available:
https://www.fairchildsemi.com/datasheets/2N/2N3904.pdf.
[9] Fairchild Semiconductor, "1N/FDLL/ 914/A/B/ 916/A/B/ 4148/4448 Small Signal
Diode.," June 2015. [Online]. Available:
https://www.fairchildsemi.com/datasheets/1N/1N4148.pdf.

Portable Restive Leakage Current Monitoring System 8.0 Bibliography
54
[10] KEMET Electronics Corportaion, "Miniature SIgnal Relays EC2/EE2 Series," 2 February
2014. [Online]. Available:
http://www.kemet.com/Lists/ProductCatalog/Attachments/527/KEM_R7002_EC2_EE2
.pdf.
[11] CR Magnetics, "CR8400 Series of Wire Lead Current Transformers," [Online]. Available:
http://www.crmagnetics.com/Assets/ProductPDFs/CR8400%20Series.pdf.
[12] Atmel Corporation, "ATmega48A/PA/88A/PA/168A/PA/328/P Datasheet," November
2015. [Online]. Available: http://www.atmel.com/images/Atmel-8271-8-bit-AVR-
Microcontroller-ATmega48A-48PA-88A-88PA-168A-168PA-328-
328P_datasheet_Complete.pdf.
[13] Adafruit Industries, "Bluefruit EZ-Link Shield," February 2016. [Online]. Available:
https://www.adafruit.com/products/1628.
[14] Python Software Foundation, "Tkinter," November 2015. [Online]. Available:
https://wiki.python.org/moin/TkInter.
[15] C. Clark and E. Gazoni, "openpyxl," January 2016. [Online]. Available:
https://openpyxl.readthedocs.org.

Portable Restive Leakage Current Monitoring System Appendix A – Updated Budget
55
Appendix A – Updated Budget
The forecasted budget for the project was $347.48. Total costs came in at $424.45
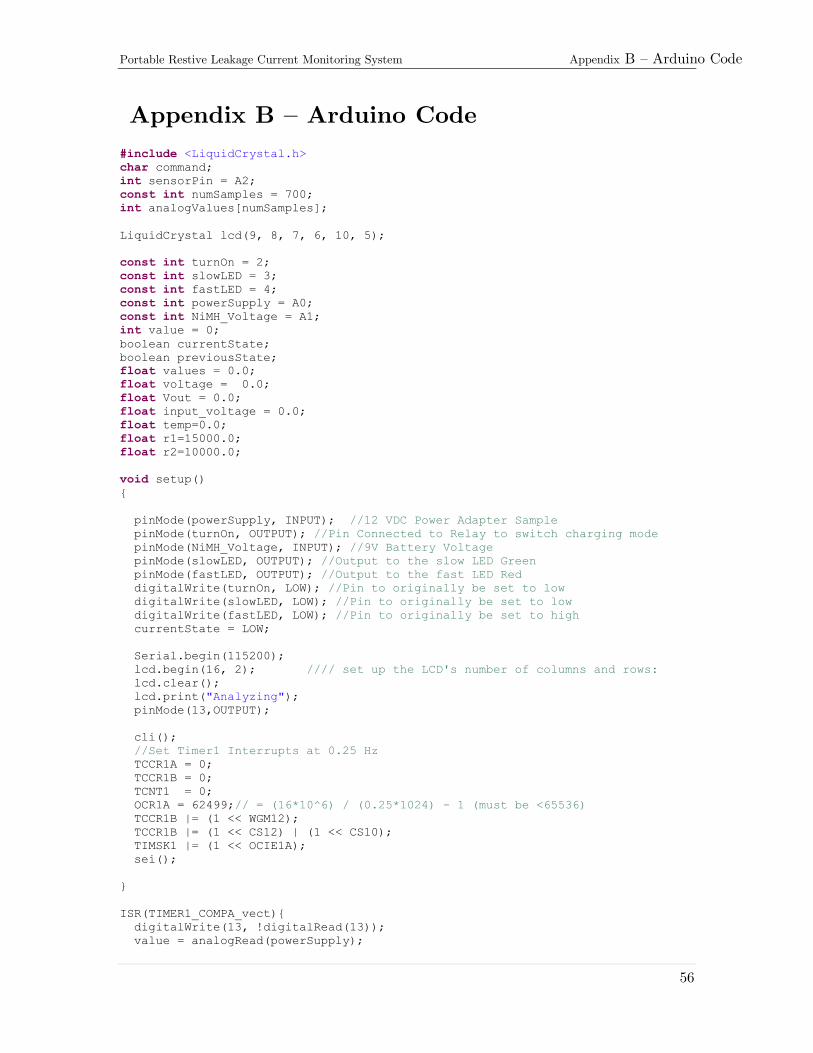
Portable Restive Leakage Current Monitoring System Appendix B – Arduino Code
56
Appendix B – Arduino Code
#include <LiquidCrystal.h>
char command;
int sensorPin = A2;
const int numSamples = 700;
int analogValues[numSamples];
LiquidCrystal lcd(9, 8, 7, 6, 10, 5);
const int turnOn = 2;
const int slowLED = 3;
const int fastLED = 4;
const int powerSupply = A0;
const int NiMH_Voltage = A1;
int value = 0;
boolean currentState;
boolean previousState;
float values = 0.0;
float voltage = 0.0;
float Vout = 0.0;
float input_voltage = 0.0;
float temp=0.0;
float r1=15000.0;
float r2=10000.0;
void setup()
pinMode(powerSupply, INPUT); //12 VDC Power Adapter Sample
pinMode(turnOn, OUTPUT); //Pin Connected to Relay to switch charging mode
pinMode(NiMH_Voltage, INPUT); //9V Battery Voltage
pinMode(slowLED, OUTPUT); //Output to the slow LED Green
pinMode(fastLED, OUTPUT); //Output to the fast LED Red
digitalWrite(turnOn, LOW); //Pin to originally be set to low
digitalWrite(slowLED, LOW); //Pin to originally be set to low
digitalWrite(fastLED, LOW); //Pin to originally be set to high
currentState = LOW;
Serial.begin(115200);
lcd.begin(16, 2); //// set up the LCD's number of columns and rows:
lcd.clear();
lcd.print("Analyzing");
pinMode(13,OUTPUT);
cli();
//Set Timer1 Interrupts at 0.25 Hz
TCCR1A = 0;
TCCR1B = 0;
TCNT1 = 0;
OCR1A = 62499;// = (16*10^6) / (0.25*1024) - 1 (must be <65536)
TCCR1B |= (1 << WGM12);
TCCR1B |= (1 << CS12) | (1 << CS10);
TIMSK1 |= (1 << OCIE1A);
sei();
ISR(TIMER1_COMPA_vect)
digitalWrite(13, !digitalRead(13));
value = analogRead(powerSupply);
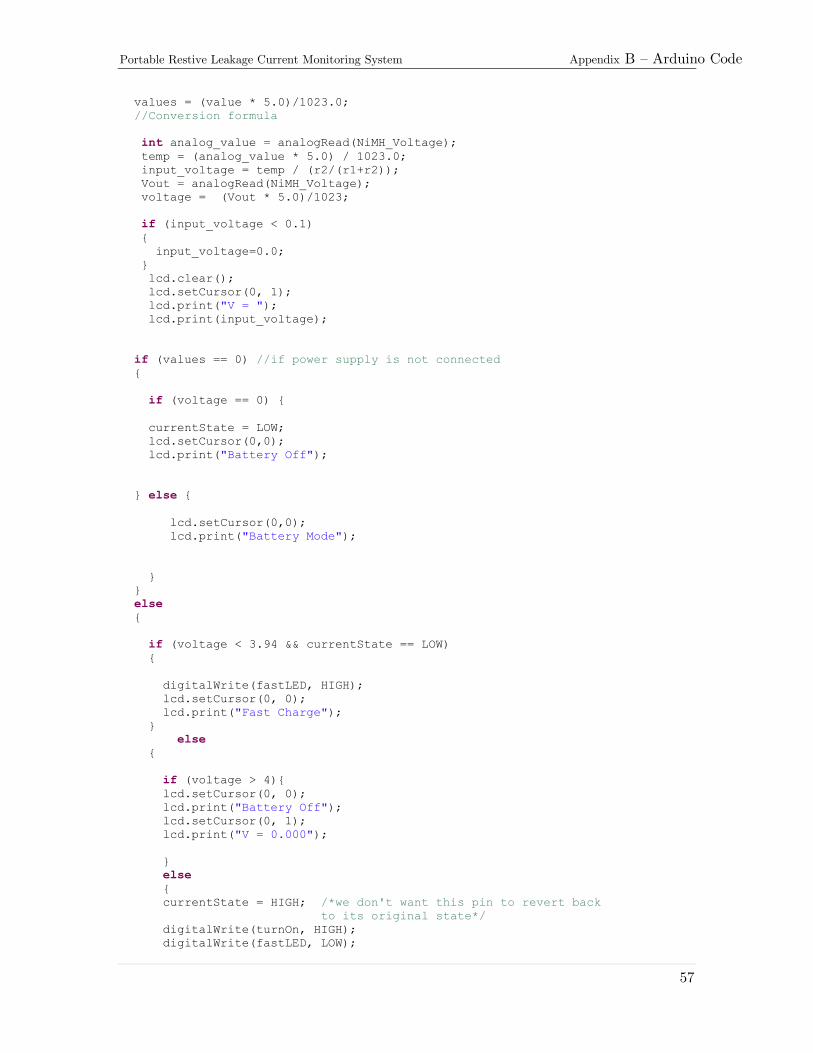
Portable Restive Leakage Current Monitoring System Appendix B – Arduino Code
57
values = (value * 5.0)/1023.0;
//Conversion formula
int analog_value = analogRead(NiMH_Voltage);
temp = (analog_value * 5.0) / 1023.0;
input_voltage = temp / (r2/(r1+r2));
Vout = analogRead(NiMH_Voltage);
voltage = (Vout * 5.0)/1023;
if (input_voltage < 0.1)
input_voltage=0.0;
lcd.clear();
lcd.setCursor(0, 1);
lcd.print("V = ");
lcd.print(input_voltage);
if (values == 0) //if power supply is not connected
if (voltage == 0)
currentState = LOW;
lcd.setCursor(0,0);
lcd.print("Battery Off");
else
lcd.setCursor(0,0);
lcd.print("Battery Mode");
else
if (voltage < 3.94 && currentState == LOW)
digitalWrite(fastLED, HIGH);
lcd.setCursor(0, 0);
lcd.print("Fast Charge");
else
if (voltage > 4)
lcd.setCursor(0, 0);
lcd.print("Battery Off");
lcd.setCursor(0, 1);
lcd.print("V = 0.000");
else
currentState = HIGH; /*we don't want this pin to revert back
to its original state*/
digitalWrite(turnOn, HIGH);
digitalWrite(fastLED, LOW);

Portable Restive Leakage Current Monitoring System Appendix B – Arduino Code
58
digitalWrite(slowLED, HIGH);
lcd.setCursor(0, 0);
lcd.print("Trickle Charge");
//end else
//end else
void loop()
//Check Serial Commands
if (Serial.available() > 0)
command = Serial.read();
switch (command)
case 'S' :
cli();
for (int samp = 0; samp < numSamples; samp++)
analogValues[samp] = analogRead(sensorPin);
sei();
Serial.println(numSamples);
while(command != 'R')
command = Serial.read();
for (int group = 0; group < numSamples/100; group++)
command = 'N';
for (int samp = group*100; samp < group*100 + 100; samp++)
Serial.print(analogValues[samp]);
Serial.print(',');
Serial.println();
while(command != 'R')
command = Serial.read();
break;
case 'V' :
Serial.println('V');
break;

Portable Restive Leakage Current Monitoring System Appendix C – Python Communication Code
59
Appendix C – Python Communication Code
1. import numpy as np 2. 3. def captureWave(serialPort): 4. "Captures waveforms from the given serial port." 5. serialPort.write(b'S') 6. numSamples = int(serialPort.readline().decode("utf-8").strip()) 7. serialPort.write(b'R') 8. waveform = [] 9. scale = 5.0/1024.0 10. for i in range(int(numSamples//100)): 11. samps = list(map(int,serialPort.readline().decode("utf-
8").strip().split(',')[:-1])) 12. waveform = waveform + samps 13. serialPort.write(b'R') 14. waveform = list(map(float,waveform)) 15. mean = sum(waveform)/float(len(waveform)) 16. waveform[:] = [(x - mean)*scale for x in waveform] 17. waveform = np.asarray(waveform) 18. return waveform
1. def validateConnection(port): 2. validate = False 3. port.write(b'V') 4. response = port.readline().decode("utf-8").strip() 5. if (response == 'V'): 6. validate = True 7. 8. return validate
1. import sys 2. import glob 3. import serial 4. 5. def findPorts(): 6. platform = sys.platform 7. connected_ports = [] 8. if ("darwin" in platform): 9. ports = glob.glob('/dev/tty.*') 10. elif ("win" in platform): 11. ports = ['COM%s' % (i + 1) for i in range(256)] 12. 13. for port in ports: 14. try: 15. s = serial.Serial(port) 16. s.close() 17. connected_ports.append(port) 18. except serial.SerialException: 19. pass 20. 21. return connected_ports
1. from findPorts import findPorts 2. from validateConnection import validateConnection 3. import serial 4. import time

Portable Restive Leakage Current Monitoring System Appendix C – Python Communication Code
60
5. 6. def getPort(): 7. ports = findPorts() 8. foundArduino = False 9. for port in ports: 10. s = serial.Serial(port,115200,timeout=1) 11. time.sleep(2) 12. if(validateConnection(s)): 13. foundArduino = True 14. break 15. s.close() 16. if foundArduino: 17. return s 18. else: 19. return False
1. from captureWave import captureWave 2. from validateConnection import validateConnection 3. 4. def getWave(port): 5. connected = validateConnection(port) 6. if connected: 7. wave = captureWave(port) 8. return wave 9. else: 10. return False

Portable Restive Leakage Current Monitoring System Appendix D – MSCM Python
61
Appendix D – MSCM Python 1. import matplotlib.pyplot as plt 2. import numpy as np 3. from scipy.fftpack import rfft, irfft, fftfreq,fft 4. 5. def MSCM_Resistive(wave, MM): 6. 7. wave = waveResolution(wave, MM) 8. wave = makePeriodicSignal(wave) 9. mean = sum(wave)/float(len(wave)) 10. wave = wave - mean 11. wave = lowPassFilter(wave, 890) 12. 13. #plt.figure(2) 14. # plt.subplot(221) 15. #plt.title('filtered wave') 16. #plt.plot(wave) 17. 18. ZC = zeroCross(wave) # take second element in this array to get zero cross
19. 20. 21. shiftWave = np.roll(wave,round(ZC/8)) 22. 23. totalPlusshift = addWave(wave,shiftWave) 24. global maxVals 25. maxVals= maxValues(totalPlusshift) # returns an array with the max value and
index 26. 27. 28. maxCap = maxCapacitive(wave, maxVals, ZC)# gives the peak value for the capa
citive component 29. #Correct Up To Here 30. global capOffset 31. capOffset = offSetFromCos(wave,ZC) # may need to add 1 to this number 32. 33. #******************************** New Capacitor Wavform Etc.****************
******************************* 34. global f 35. f = 2/ZC 36. length = np.arange(len(wave)) 37. newCapacitive = maxCap*np.cos((2*np.pi*f*length) +np.pi/2 ) 38. 39. 40. global roll 41. roll =maxVals[1]- round(ZC/2) 42. newCapacitive = np.roll(newCapacitive, int(roll)) 43. 44. 45. #plt.figure(0) 46. #plt.plot(wave -newCapacitive) 47. #plt.title('shifted') 48. #plt.show() 49. 50. 51. 52. resistCurrent = wave - newCapacitive 53. resistCurrent = lowPassFilter(resistCurrent, 890) 54. time = np.linspace(0,3/60,len(resistCurrent)) 55. [freq, fftPlot] = returnFFT(resistCurrent, 890)
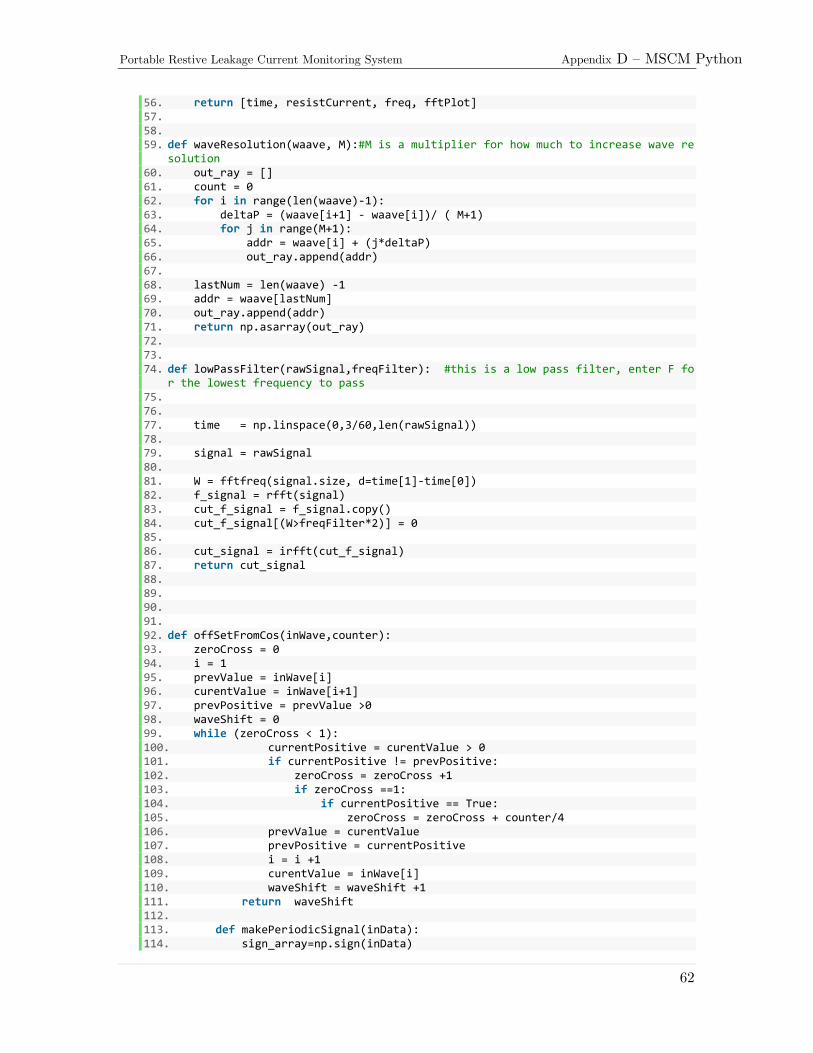
Portable Restive Leakage Current Monitoring System Appendix D – MSCM Python
62
56. return [time, resistCurrent, freq, fftPlot] 57. 58. 59. def waveResolution(waave, M):#M is a multiplier for how much to increase wave re
solution 60. out_ray = [] 61. count = 0 62. for i in range(len(waave)-1): 63. deltaP = (waave[i+1] - waave[i])/ ( M+1) 64. for j in range(M+1): 65. addr = waave[i] + (j*deltaP) 66. out_ray.append(addr) 67. 68. lastNum = len(waave) -1 69. addr = waave[lastNum] 70. out_ray.append(addr) 71. return np.asarray(out_ray) 72. 73. 74. def lowPassFilter(rawSignal,freqFilter): #this is a low pass filter, enter F fo
r the lowest frequency to pass 75. 76. 77. time = np.linspace(0,3/60,len(rawSignal)) 78. 79. signal = rawSignal 80. 81. W = fftfreq(signal.size, d=time[1]-time[0]) 82. f_signal = rfft(signal) 83. cut_f_signal = f_signal.copy() 84. cut_f_signal[(W>freqFilter*2)] = 0 85. 86. cut_signal = irfft(cut_f_signal) 87. return cut_signal 88. 89. 90. 91. 92. def offSetFromCos(inWave,counter): 93. zeroCross = 0 94. i = 1 95. prevValue = inWave[i] 96. curentValue = inWave[i+1] 97. prevPositive = prevValue >0 98. waveShift = 0 99. while (zeroCross < 1): 100. currentPositive = curentValue > 0 101. if currentPositive != prevPositive: 102. zeroCross = zeroCross +1 103. if zeroCross ==1: 104. if currentPositive == True: 105. zeroCross = zeroCross + counter/4 106. prevValue = curentValue 107. prevPositive = currentPositive 108. i = i +1 109. curentValue = inWave[i] 110. waveShift = waveShift +1 111. return waveShift 112. 113. def makePeriodicSignal(inData): 114. sign_array=np.sign(inData)

Portable Restive Leakage Current Monitoring System Appendix D – MSCM Python
63
115. #t('sign data') 116. out=[] 117. current = sign_array[0] 118. count=1 119. for i in sign_array[1:]: 120. if (i!=current) and (i!=0): 121. out.append(count) 122. current=i 123. count=1 124. else: count+=1 125. beg = out[0] 126. end = out[0] + out[1]+ out[2] +out[3] +out[4] +out[5] +out[6] +1 127. outSignal = inData[beg:end] 128. 129. return outSignal 130. 131. def maxValues(val): 132. a = np.amax(val) 133. b = np.argmax(val) 134. c = len(val) 135. out = np.array([a,b,c])# a= maxvalue b= index in array of max value
136. return out 137. 138. def maxCapacitive(aa,ray, zeroCross): #aa = total current ray = indexarr
ay 139. maxCapIndex = ray[1] -round(zeroCross/8) +round(zeroCross/2) 140. if maxCapIndex > (ray[2]-1) : 141. maxCapIndex = maxCapIndex - ray[2] 142. out = aa[maxCapIndex] 143. return out 144. 145. def zeroCross(data): 146. sign_array=np.sign(data) 147. #t('sign data') 148. out=[] 149. current = sign_array[0] 150. count=1 151. for i in sign_array[1:]: 152. if i!=current and (i!=0): 153. out.append(count) 154. current=i 155. count=1 156. else: count+=1 157. count = out[1]+ out[2] +out[3] +out[4] 158. #t('zcd data') 159. return count 160. 161. 162. def addWave(wave1, wave2): 163. out = wave1 +wave2 164. return out 165. 166. 167. def returnFFT(rawSignal,freqFilter): #this function returns the magnitu
de and frequency of the fft 168. rawSignal = np.append(rawSignal,rawSignal) 169. time = np.linspace(0,6/60,len(rawSignal)) 170. N = len(rawSignal) 171. T = time[2]-time[1] 172. yf = fft(rawSignal)

Portable Restive Leakage Current Monitoring System Appendix D – MSCM Python
64
173. xf = np.linspace(0.0, 1.0/(2.0*T),N/2) 174. freq = xf 175. freq = freq +10 176. 177. return([freq, 2.0/N*np.abs(yf[0:N/2] )])

Portable Restive Leakage Current Monitoring System Appendix E – GUI Python
65
Appendix E – GUI Python
1. #! /usr/bin/env python 2. 3. # Tkinter Imports Statements # 4. import tkinter as tk 5. from tkinter import messagebox 6. from tkinter import simpledialog 7. 8. # Openpyxl Imports Statements # 9. import openpyxl 10. from openpyxl import Workbook 11. from openpyxl import load_workbook 12. from openpyxl.chart import ( 13. 14. ScatterChart, 15. Reference, 16. Series, 17. 18. ) 19. 20. # Matplotlib Imports Statements # 21. import matplotlib 22. matplotlib.use("TKAgg") 23. import matplotlib.pyplot as plt 24. from matplotlib.backends.backend_tkagg import FigureCanvasTkAgg, NavigationToolb
ar2TkAgg 25. from matplotlib.figure import Figure 26. 27. # Numpy Imports Statements # 28. import numpy as np 29. 30. # External Code Imports Statements # 31. from sampleWave import sampleWave 32. from MSCM_Resistive import MSCM_Resistive 33. from exportExcel import exportExcel 34. from outDatabase import outDatabase 35. from inDatabase import inDatabase 36. from getWave import getWave 37. from getPort import getPort 38. 39. # General Imports Statements # 40. from string import ascii_lowercase 41. from datetime import datetime 42. 43. 44. 45. class Arrester(object): 46. name = "" 47. dateInstalled = "" 48. location = "" 49. comments = "" 50. timeArray = [] 51. resistCurrentArray = [] 52. freqArray = [] 53. fftPlotArray = [] 54. dataDateEntry = [] 55. dataSetAmount = 0 56.

Portable Restive Leakage Current Monitoring System Appendix E – GUI Python
66
57. 58. def __init__(self, name, dateInstalled, location, comments, timeArray, resis
tCurrentArray, freqArray, fftPlotArray, dataDateEntry, dataSetAmount): 59. self.name = name 60. self.dateInstalled = dateInstalled 61. self.location = location 62. self.comments = comments 63. self.timeArray = timeArray 64. self.resistCurrentArray = resistCurrentArray 65. self.freqArray = freqArray 66. self.fftPlotArray = fftPlotArray 67. self.dataDateEntry = dataDateEntry 68. self.dataSetAmount = dataSetAmount 69. 70. 71. 72. class ArresterGUI(tk.Frame): 73. def __init__(self, master = None): 74. tk.Frame.__init__(self, master, bg = 'grey') 75. self.initGUI() 76. 77. 78. 79. 80. 81. # Function Name: initGUI 82. # 83. # Purpose: To initialize the root GUI window which is used as a "master" fra
me for all 84. # other objects to be displayed. This function also calls createWidgets(), i
n order 85. # to set up the rest of the GUI for use. 86. # 87. # Input: None 88. # 89. # Output: None 90. # 91. # 92. def initGUI(self): 93. self.master.title('Lightning Arrester Monitor & Analysis Program') 94. self.master.minsize(1500, 1000) 95. self.master.config(background = "#FFFFFF") 96. self.grid() 97. self.createWidgets() 98. 99. 100. 101. 102. # Function Name: createWidgets 103. # 104. # Purpose: This function creates all the various widgets to be displ
ayd in the GUI. 105. # The master frame is split into several sections in order to proper
ly organize 106. # the widgets. It will also call importMasterData in order to import
all arrester 107. # data from the excel database master file. 108. # 109. # Input: None 110. # 111. # Output: None
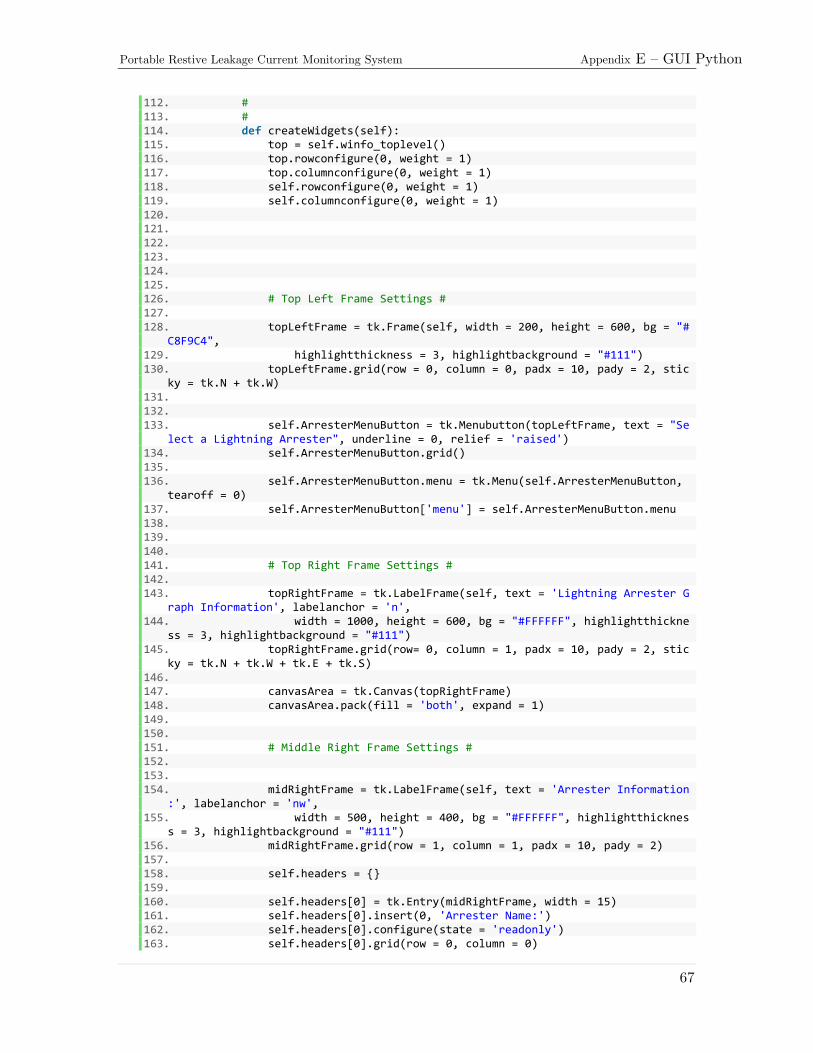
Portable Restive Leakage Current Monitoring System Appendix E – GUI Python
67
112. # 113. # 114. def createWidgets(self): 115. top = self.winfo_toplevel() 116. top.rowconfigure(0, weight = 1) 117. top.columnconfigure(0, weight = 1) 118. self.rowconfigure(0, weight = 1) 119. self.columnconfigure(0, weight = 1) 120. 121. 122. 123. 124. 125. 126. # Top Left Frame Settings # 127. 128. topLeftFrame = tk.Frame(self, width = 200, height = 600, bg = "#
C8F9C4", 129. highlightthickness = 3, highlightbackground = "#111") 130. topLeftFrame.grid(row = 0, column = 0, padx = 10, pady = 2, stic
ky = tk.N + tk.W) 131. 132. 133. self.ArresterMenuButton = tk.Menubutton(topLeftFrame, text = "Se
lect a Lightning Arrester", underline = 0, relief = 'raised') 134. self.ArresterMenuButton.grid() 135. 136. self.ArresterMenuButton.menu = tk.Menu(self.ArresterMenuButton,
tearoff = 0) 137. self.ArresterMenuButton['menu'] = self.ArresterMenuButton.menu 138. 139. 140. 141. # Top Right Frame Settings # 142. 143. topRightFrame = tk.LabelFrame(self, text = 'Lightning Arrester G
raph Information', labelanchor = 'n', 144. width = 1000, height = 600, bg = "#FFFFFF", highlightthickne
ss = 3, highlightbackground = "#111") 145. topRightFrame.grid(row= 0, column = 1, padx = 10, pady = 2, stic
ky = tk.N + tk.W + tk.E + tk.S) 146. 147. canvasArea = tk.Canvas(topRightFrame) 148. canvasArea.pack(fill = 'both', expand = 1) 149. 150. 151. # Middle Right Frame Settings # 152. 153. 154. midRightFrame = tk.LabelFrame(self, text = 'Arrester Information
:', labelanchor = 'nw', 155. width = 500, height = 400, bg = "#FFFFFF", highlightthicknes
s = 3, highlightbackground = "#111") 156. midRightFrame.grid(row = 1, column = 1, padx = 10, pady = 2) 157. 158. self.headers = 159. 160. self.headers[0] = tk.Entry(midRightFrame, width = 15) 161. self.headers[0].insert(0, 'Arrester Name:') 162. self.headers[0].configure(state = 'readonly') 163. self.headers[0].grid(row = 0, column = 0)

Portable Restive Leakage Current Monitoring System Appendix E – GUI Python
68
164. 165. self.headers[1] = tk.Entry(midRightFrame, width = 15) 166. self.headers[1].insert(0, 'Date Installed:') 167. self.headers[1].configure(state = 'readonly') 168. self.headers[1].grid(row = 1, column = 0) 169. 170. self.headers[2] = tk.Entry(midRightFrame, width = 15) 171. self.headers[2].insert(0, 'Location:') 172. self.headers[2].configure(state = 'readonly') 173. self.headers[2].grid(row = 2, column = 0) 174. 175. self.headers[3] = tk.Entry(midRightFrame, width = 15) 176. self.headers[3].insert(0, 'Comments:') 177. self.headers[3].configure(state = 'readonly') 178. self.headers[3].grid(row = 3, column = 0) 179. 180. temp1 = tk.Entry(midRightFrame, width = 30, state = 'readonly')
181. temp1.grid(row = 0, column = 1) 182. 183. temp2 = tk.Entry(midRightFrame, width = 30, state = 'readonly')
184. temp2.grid(row = 1, column = 1) 185. 186. temp3 = tk.Entry(midRightFrame, width = 30, state = 'readonly')
187. temp3.grid(row = 2, column = 1) 188. 189. temp4 = tk.Entry(midRightFrame, width = 30, state = 'readonly')
190. temp4.grid(row = 3, column = 1) 191. 192. 193. 194. 195. # Bottom Left Frame Settings # 196. 197. bottomLFrame = tk.Frame(self, width = 200, height = 600, 198. highlightthickness = 3, highlightbackground = "#111") 199. bottomLFrame.grid(row = 2, column = 0, padx = 10, pady = 2, stic
ky = tk.W) 200. 201. self.addArrester = tk.Button(bottomLFrame, text = 'Add A New Arr
ester', command = lambda: self.newArrester(midRightFrame, canvasArea)) 202. self.addArrester.grid(row = 0, column = 0, pady = 10) 203. 204. self.deleteArrester = tk.Button(bottomLFrame, text = 'Delete An
Arrester', command = self.deleteArrester) 205. self.deleteArrester.grid(row = 1, column = 0, pady = 10) 206. 207. self.editArrester = tk.Button(bottomLFrame, text = 'Edit Arreste
r Information', command = self.editArrester) 208. self.editArrester.grid(row = 2, column = 0, pady = 10) 209. 210. 211. 212. 213. # Bottom Frame Settings # 214. 215. bottomFrame = tk.Frame(self, width = 200, height = 600, highligh
tthickness = 3, highlightbackground = "#111")
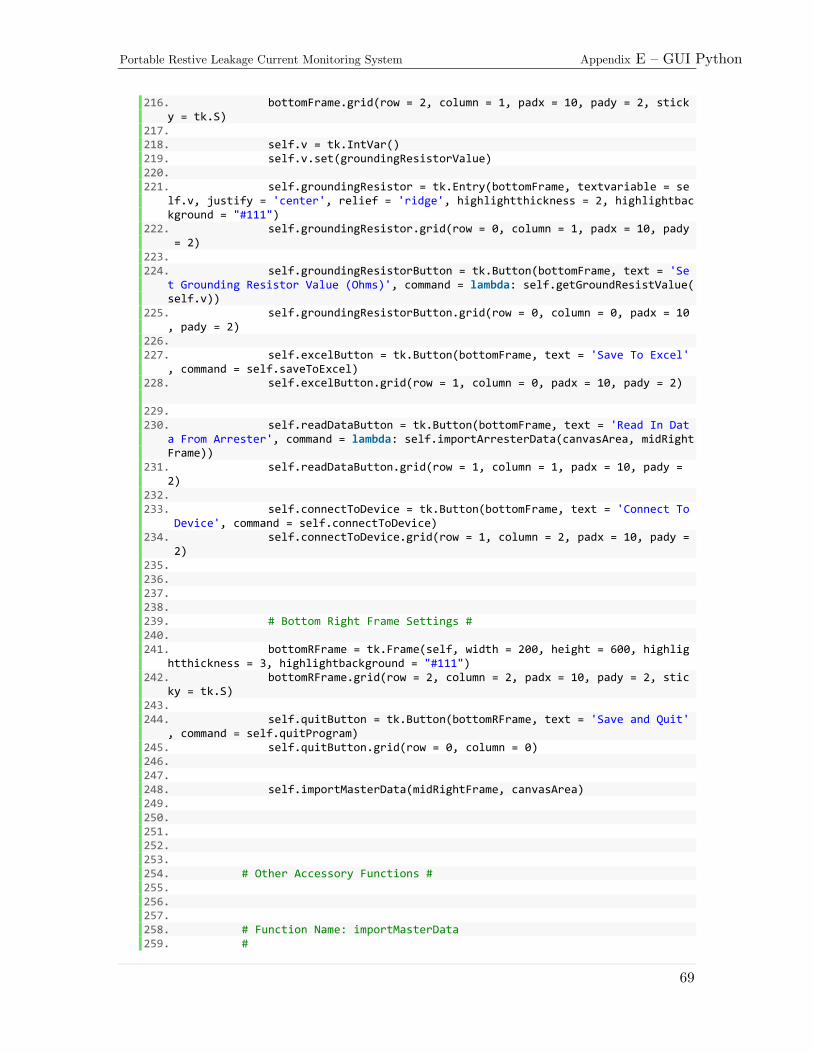
Portable Restive Leakage Current Monitoring System Appendix E – GUI Python
69
216. bottomFrame.grid(row = 2, column = 1, padx = 10, pady = 2, sticky = tk.S)
217. 218. self.v = tk.IntVar() 219. self.v.set(groundingResistorValue) 220. 221. self.groundingResistor = tk.Entry(bottomFrame, textvariable = se
lf.v, justify = 'center', relief = 'ridge', highlightthickness = 2, highlightbackground = "#111")
222. self.groundingResistor.grid(row = 0, column = 1, padx = 10, pady = 2)
223. 224. self.groundingResistorButton = tk.Button(bottomFrame, text = 'Se
t Grounding Resistor Value (Ohms)', command = lambda: self.getGroundResistValue(self.v))
225. self.groundingResistorButton.grid(row = 0, column = 0, padx = 10, pady = 2)
226. 227. self.excelButton = tk.Button(bottomFrame, text = 'Save To Excel'
, command = self.saveToExcel) 228. self.excelButton.grid(row = 1, column = 0, padx = 10, pady = 2)
229. 230. self.readDataButton = tk.Button(bottomFrame, text = 'Read In Dat
a From Arrester', command = lambda: self.importArresterData(canvasArea, midRightFrame))
231. self.readDataButton.grid(row = 1, column = 1, padx = 10, pady = 2)
232. 233. self.connectToDevice = tk.Button(bottomFrame, text = 'Connect To
Device', command = self.connectToDevice) 234. self.connectToDevice.grid(row = 1, column = 2, padx = 10, pady =
2) 235. 236. 237. 238. 239. # Bottom Right Frame Settings # 240. 241. bottomRFrame = tk.Frame(self, width = 200, height = 600, highlig
htthickness = 3, highlightbackground = "#111") 242. bottomRFrame.grid(row = 2, column = 2, padx = 10, pady = 2, stic
ky = tk.S) 243. 244. self.quitButton = tk.Button(bottomRFrame, text = 'Save and Quit'
, command = self.quitProgram) 245. self.quitButton.grid(row = 0, column = 0) 246. 247. 248. self.importMasterData(midRightFrame, canvasArea) 249. 250. 251. 252. 253. 254. # Other Accessory Functions # 255. 256. 257. 258. # Function Name: importMasterData 259. #

Portable Restive Leakage Current Monitoring System Appendix E – GUI Python
70
260. # Purpose: This function will import all arrester data from the master spreadsheet to use for the GUI.
261. # It will create arrester objects and tabs for the drop-down menu bar.
262. # 263. # Input: The frame in which to display arrester information and the
canvas widget where 264. # graph data will be displayed. 265. # 266. # Output: None 267. # 268. # 269. def importMasterData(self, midRightFrame, canvasArea): 270. 271. try: # Load exisitng excel document and import data 272. wb = load_workbook("Master_File.xlsx") 273. 274. count = 1 275. totalSheets = 0 276. 277. # Count the total number of sheets (arresters) in the databa
se 278. for sheet in wb: 279. totalSheets = totalSheets+1 280. 281. # For each arrester, load all associated info and create men
u entries for them 282. for k in range(totalSheets-1): 283. sheet = wb.active 284. name = sheet.cell(row = count, column = 1).value 285. dataSetAmount = sheet.cell(row = count, column = 2).valu
e 286. sheet = wb.get_sheet_by_name(name) 287. dateInstalled = sheet['B2'].value 288. location = sheet['B3'].value 289. comments = sheet['B4'].value 290. 291. arrester = Arrester(name, dateInstalled, location, comme
nts, [], [], [], [], [], dataSetAmount) 292. 293. self.subMenu = tk.Menu(self.ArresterMenuButton.menu) 294. 295. self.ArresterMenuButton.menu.add_cascade(label = name, m
enu = self.subMenu) 296. 297. # For each data entry, create a seperate sub-
menu entry 298. for i in range(dataSetAmount): 299. # call this function for each data subset 300. [time, resistCurrent, freq, fftPlot, dateEntry] = in
Database(wb, name, i) 301. 302. arrester.timeArray.append(time) 303. arrester.resistCurrentArray.append(resistCurrent) 304. arrester.freqArray.append(freq) 305. arrester.fftPlotArray.append(fftPlot) 306. arrester.dataDateEntry.append(dateEntry) 307. self.subMenu.add_command(label = dateEntry, command
= lambda name = name, dateEntry = dateEntry: self.displayArresterInfo(midRightFrame, canvasArea, name, dateEntry))
308.

Portable Restive Leakage Current Monitoring System Appendix E – GUI Python
71
309. arresterList.append(arrester) 310. count = count + 1 311. 312. except: # First use of program, create new spreadsheet 313. print('Either no Master_File exists or this is the first pro
gram use.') 314. 315. 316. 317. 318. 319. 320. 321. 322. 323. # Button Functions # 324. 325. 326. 327. # Function Name: getGroundResistValue 328. # 329. # Purpose: This function will take the number entered in the text va
riable box beside the "Grounding Resistor" 330. # button and set this to use as the grounding resistor value for cal
culations involved in the MSCM. 331. # 332. # Input: The integer value to be set as the grounding resistor value
in Ohms. 333. # 334. # Output: None 335. # 336. # 337. def getGroundResistValue(self, v): 338. global groundingResistorValue 339. 340. try: 341. tempValue = v.get() 342. if(type(tempValue) == int): 343. if(tempValue > 0): 344. groundingResistorValue = tempValue 345. print(groundingResistorValue) 346. else: 347. tk.messagebox.showerror("Grounding Resistor Value Er
ror", "This value is invalid.\nIt must be a whole positive number.\nPlease retry with a different value.")
348. except: 349. tk.messagebox.showerror("Grounding Resistor Value Error", "T
his value is invalid.\nIt must be a whole number.\nPlease retry with a different value.")
350. 351. 352. 353. 354. 355. 356. 357. 358. # Function Name: importArresterData 359. # 360. # Purpose: This function will read in data points from the arrester
waveform.

Portable Restive Leakage Current Monitoring System Appendix E – GUI Python
72
361. # 362. # Input: The canvas widget in which to display the arrester graph in
formation 363. # and the midRightFrame to display various information. 364. # 365. # Output: None 366. # 367. # 368. def importArresterData(self, canvasArea, midRightFrame): 369. global deviceConnectionPort 370. global groundingResistorValue 371. global graphFigure 372. waveformConfirmation = 0 373. targetArrester = None 374. arresterExists = 0 375. j = 0 376. entryAdded = 0 377. 378. # Ensure grounding resistor value is set properly 379. if(groundingResistorValue <= 0): 380. tk.messagebox.showerror("Grounding Resistor Value Error", "T
his value is invalid.\nIt must be a whole number and not zero.\nPlease retry with a different value.")
381. return 382. 383. 384. arresterName = tk.simpledialog.askstring("Import Data", "Which a
rrester would you like to import data for?") 385. 386. if arresterName: # If input was given, proceed 387. for i in arresterList: 388. if (i.name == arresterName): # If arrester does exist, p
roceed 389. targetArrester = i 390. arresterExists = 1 391. 392. if(arresterExists == 0): 393. tk.messagebox.showerror("Import Data", "%s does not exis
t.\nPlease try again with a valid arrester." %arresterName) 394. else: 395. # Ensure that the Arduino is properly connected to the t
est computer 396. if(deviceConnectionPort == None): 397. tk.messagebox.showerror("Import Arrester Data", "Dev
ice is not connected.\nPlease connect to device before starting wave sampling.")
398. #return 399. 400. #arrayData = getWave(deviceConnectionPort) 401. arrayData = sampleWave() 402. arrayData = (arrayData*1000)/(groundingResistorValue*12)
403. 404. # If a boolean false was returned, there was an error wi
th the data import. Send user back to main menu. 405. if(type(arrayData) == bool): 406. tk.messagebox.showerror("Import Arrester Data", "Eit
her connection to device was broken or data sampling didnt work.\nPlease try to connect again.")
407. return 408.

Portable Restive Leakage Current Monitoring System Appendix E – GUI Python
73
409. try: 410. 411. print("Starting graphing") 412. 413. # If a previous graph is displayed, delete it 414. if (graphFigure != None): 415. graphFigure.get_tk_widget().destroy() 416. 417. # Plot the unfiltered arrester waveform 418. f = plt.figure(figsize = (10,5), dpi = 100) 419. plt.title("Unfilitered Leakage Arrester Waveform") 420. plt.ylabel("Current (Milli-Amps)") 421. a = f.add_subplot(111) 422. a.plot(arrayData) 423. 424. # Place the waveform image on the canvas area 425. graphFigure = FigureCanvasTkAgg(f, canvasArea) 426. graphImage = graphFigure.get_tk_widget() 427. graphImage.pack(fill = 'both', expand = 1) 428. 429. print("Success The Rat") 430. 431. except: 432. tk.messagebox.showerror("Create Graph", "Unable to c
reate graph") 433. 434. # Confirm with the user that the imported waveform is ac
ceptable 435. waveformConfirmation = tk.messagebox.askyesno("Data Impo
rted", "Are you happy with this waveform?\nIf not, press 'NO' and enter a new grounding resistor value on the main screen.")
436. 437. if(waveformConfirmation == 0): 438. return 439. 440. # Run the MSCM algorithm on the imported arrester data
441. [time, resistCurrent, freq, fftPlot] = MSCM_Resistive(ar
rayData, 1) ## the 1 here needs to be changed eventually, to at least 10 properly
442. 443. 444. 445. try: 446. 447. 448. print("Starting graphing") 449. 450. # If a previous graph is displayed, delete it 451. if (graphFigure != None): 452. graphFigure.get_tk_widget().destroy() 453. 454. # Plot the post MSCM waveforms 455. f = plt.figure(figsize = (10,5), dpi = 100) 456. 457. a = f.add_subplot(211) 458. plt.title("Resistive Leakage Current") 459. plt.ylabel("Current (Milli-Amps)") 460. plt.xlabel("Time (Seconds)") 461. plt.xlim(0, 0.05) 462. plt.tight_layout()

Portable Restive Leakage Current Monitoring System Appendix E – GUI Python
74
463. a.plot(time,resistCurrent) 464. 465. b = f.add_subplot(212) 466. plt.title("FFT") 467. plt.ylabel("Peak (Milli-Amps)") 468. plt.xlabel("Frequency (Hertz)") 469. plt.xlim(0, 700) 470. plt.tight_layout() 471. b.plot(freq, fftPlot) 472. 473. # Place the waveform image on the canvas area 474. graphFigure = FigureCanvasTkAgg(f, canvasArea) 475. graphImage = graphFigure.get_tk_widget() 476. graphImage.pack(fill = 'both', expand = 1) 477. 478. print("Success The Rat") 479. 480. except: 481. tk.messagebox.showerror("Create Graph", "Unable to c
reate graph") 482. 483. 484. # Determine time for title of each specific data reading
485. dateOfEntry = str(datetime.now()) 486. 487. # Add all data values to the target arrester's data arra
ys 488. targetArrester.timeArray.append(time) 489. targetArrester.resistCurrentArray.append(resistCurrent)
490. targetArrester.freqArray.append(freq) 491. targetArrester.fftPlotArray.append(fftPlot) 492. targetArrester.dataDateEntry.append(dateOfEntry) 493. 494. targetArrester.dataSetAmount = targetArrester.dataSetAmo
unt + 1 495. 496. # Create a new sub menu entry for the target arrester 497. while (entryAdded == 0): 498. if (targetArrester.name == self.ArresterMenuButton.m
enu.entrycget(j, 'label')): 499. 500. subMenu = tk.Menu(self.ArresterMenuButton.menu)
501. 502. self.ArresterMenuButton.menu.entryconfigure(j, m
enu = subMenu) 503. 504. # For proper organization, re-
create all previous sub menu entries 505. for m in range(targetArrester.dataSetAmount -
1): 506. subMenu.add_command(label = targetArrester.d
ataDateEntry[m], command = lambda name = targetArrester.name, dateOfEntry = targetArrester.dataDateEntry[m]: self.displayArresterInfo(midRightFrame, canvasArea, name, dateOfEntry))
507. 508. # Create the newest entry in the arrester's sub
menu

Portable Restive Leakage Current Monitoring System Appendix E – GUI Python
75
509. subMenu.add_command(label = dateOfEntry, command = lambda name = targetArrester.name, dateOfEntry = dateOfEntry: self.displayArresterInfo(midRightFrame, canvasArea, name, dateOfEntry))
510. entryAdded = 1 511. j = j + 1 512. 513. self.displayArresterInfo(midRightFrame, canvasArea, targ
etArrester.name, dateOfEntry) 514. tk.messagebox.showinfo("Import Data", "Data for %s has b
een successfully imported!" %arresterName) 515. 516. 517. 518. 519. # Function Name: connectToDevice 520. # 521. # Purpose: This function will connect to the Arduino in order to rea
d in arrester data. 522. # This function must be called before reading arrester data. 523. # 524. # Input: None 525. # 526. # Output: None 527. # 528. # 529. def connectToDevice(self): 530. global deviceConnectionPort 531. 532. deviceConnectionPort = getPort() 533. 534. if(deviceConnectionPort == False): 535. tk.messagebox.showerror("Connect To Device", "No device can
be found.\nPlease try again before sampling.") 536. else: 537. tk.messagebox.showinfo("Connect To Device", "Successfully co
nnected to device!") 538. 539. 540. 541. 542. # Function Name: newArrester 543. # 544. # Purpose: This function creates a new arrester to monitor. A new ta
b will be created 545. # in the drop-
down menu bar. It will also prompt the user to input other information 546. # regarding the arrester. 547. # 548. # Input: The frame in which to display arrester information. 549. # 550. # Output: None 551. # 552. # 553. def newArrester(self, midRightFrame, canvasArea): 554. global arresterList 555. arresterExists = 0 556. 557. newName = tk.simpledialog.askstring("New Arrester", "What would
you like to call this arrester?") 558. 559. if newName: # If input was given, proceed

Portable Restive Leakage Current Monitoring System Appendix E – GUI Python
76
560. for targetArrester in arresterList: 561. if (targetArrester.name == newName): # If arrester does
exist, proceed 562. arresterExists = 1 563. 564. if (arresterExists == 1): # Arrester name already exists, er
ror 565. tk.messagebox.showerror("New Arrester", "%s already exis
ts.\nPlease try again with a different name." %newName) 566. else: # Create new arrester 567. self.subMenu = tk.Menu(self.ArresterMenuButton.menu) 568. self.ArresterMenuButton.menu.add_cascade(label = newName
, menu = self.subMenu) 569. dateInstalled = tk.simpledialog.askstring("New Arrester"
, "When was this arrester installed?") 570. location = tk.simpledialog.askstring("New Arrester", "Wh
ere is this arrester located?") 571. comments = tk.simpledialog.askstring("New Arrester", "Ar
e there any additional comments you would like to include?") 572. arrester = Arrester(newName, dateInstalled, location, co
mments, [], [], [], [], [], 0) 573. arresterList.append(arrester) 574. tk.messagebox.showinfo("New Arrester", "%s has been succ
essfully created!" %newName) 575. 576. 577. 578. # Function Name: deleteArrester 579. # 580. # Purpose: This function will completely delete all records and info
rmation for the user-given 581. # arrester. 582. # 583. # Input: None 584. # 585. # Output: None 586. # 587. # 588. def deleteArrester(self): 589. global arresterList 590. arresterDeleted = 0 591. arresterExists = 0 592. targetArrester = None 593. i = 0 594. 595. arrester = tk.simpledialog.askstring("Delete Arrester", "Which a
rrester would you like to delete?") 596. 597. if arrester: # If input was given, proceed 598. for k in arresterList: 599. if (k.name == arrester): # If arrester does exist, proce
ed 600. targetArrester = k 601. arresterExists = 1 602. if ((arresterExists == 1)): 603. confirmation = tk.messagebox.askyesno("Delete Arrester",
"Are you sure you want to delete this arrester?") 604. if confirmation == 1: # User confirms deletion 605. arresterList.remove(targetArrester) 606. while (arresterDeleted == 0):

Portable Restive Leakage Current Monitoring System Appendix E – GUI Python
77
607. if (arrester == self.ArresterMenuButton.menu.entrycget(i, 'label')):
608. self.ArresterMenuButton.menu.delete(i) 609. arresterDeleted = 1 610. i = i + 1 611. tk.messagebox.showinfo("Delete Arrester", "Arrester
has been successfully deleted.") 612. else: 613. tk.messagebox.showerror("Delete Arrester", "%s does not
exist.\nPlease try again with a valid arrester." %arrester) 614. 615. 616. 617. # Function Name: editArrester 618. # 619. # Purpose: This function allows the user to edit information regardi
ng a specific arrester. 620. # 621. # Input: None 622. # 623. # Output: None 624. # 625. # 626. def editArrester(self): 627. global arresterList 628. arresterExists = 0 629. targetArrester = None 630. 631. arresterName = tk.simpledialog.askstring("Edit Arrester", "Which
arrester would you like to edit?") 632. 633. if arresterName: # If input was given, proceed 634. for targetArrester in arresterList: 635. if (targetArrester.name == arresterName): 636. arresterExists = 1 637. targetArrester.dateInstalled = tk.simpledialog.askst
ring("Edit Arrester", 638. "Whien was this arrester installed?") 639. targetArrester.location = tk.simpledialog.askstring(
"Edit Arrester", 640. "Where is this arrester located?") 641. targetArrester.comments += ("\n") + tk.simpledialog.
askstring("Edit Arrester", 642. "Are there any additional comments you would lik
e to include") 643. 644. if(arresterExists == 1): 645. tk.messagebox.showinfo("Edit Arrester", "Arrester inform
ation has been successfully edited!") 646. elif(arresterExists == 0): 647. tk.messagebox.showerror("Edit Arrester", "%s doesn't exi
st.\nPlease try again with a valid arrester." %arresterName) 648. 649. 650. 651. 652. # Function Name: saveToExcel 653. # 654. # Purpose: This function allows the user to save information regardi
ng a specific arrester 655. # to an excel spreadsheet. The data from the last data reading is

Portable Restive Leakage Current Monitoring System Appendix E – GUI Python
78
656. # the information used to create the excel summary. 657. # 658. # Input: None 659. # 660. # Output: None 661. # 662. # 663. def saveToExcel(self): 664. targetArrester = None 665. arresterName = tk.simpledialog.askstring("Save To Excel", "Which
arrester would you like to save?") 666. 667. for i in arresterList: 668. if (i.name == arresterName): # Search for the specific arres
ter 669. targetArrester = i 670. 671. if(targetArrester == None): 672. tk.messagebox.showerror("Save To Excel", "%s does not exist.
\nPlease try again with a valid arrester." %arresterName) 673. else: 674. 675. exportExcel(targetArrester.timeArray[i.dataSetAmount-
1], targetArrester.resistCurrentArray[i.dataSetAmount-1], targetArrester.freqArray[i.dataSetAmount-1],
676. targetArrester.fftPlotArray[i.dataSetAmount-1], targetArrester.name, targetArrester.location, targetArrester.comments)
677. 678. tk.messagebox.showinfo("Save To Excel", "Arrester informatio
n has been successfully saved to excel!") 679. 680. 681. 682. # Function Name: displayArresterInfo 683. # 684. # Purpose: This function will display various information about a sp
ecfic arrester 685. # chosen by the user. 686. # 687. # Input: The name of the specific arrester to display information ab
out and 688. # the frame in which to display arrester information. It also reciev
es the canvas 689. # area in which to display the graph.As well, the specific 690. # date and time of the data entry to display. 691. # 692. # Output: None 693. # 694. # 695. def displayArresterInfo(self, midRightFrame, canvasArea, arresterNam
e, dateEntry): 696. global arresterList 697. global graphFigure 698. targetArrester = None 699. targetPosition = 0 700. 701. nameVariable = tk.StringVar() 702. dateVariable = tk.StringVar() 703. locationVariable = tk.StringVar() 704. commentsVariable = tk.StringVar() 705.

Portable Restive Leakage Current Monitoring System Appendix E – GUI Python
79
706. for i in arresterList: 707. if (i.name == arresterName): # Search for the specific arres
ter 708. targetArrester = i 709. 710. # Search for the specific target data entry for the arrester 711. for i in range(targetArrester.dataSetAmount): 712. if(targetArrester.dataDateEntry[i] == dateEntry): 713. targetPosition = i 714. 715. # Display all associated information regarding the arrester 716. 717. name = tk.Entry(midRightFrame, width = 30, state = 'readonly', t
extvariable = nameVariable) 718. nameVariable.set(targetArrester.name) 719. name.grid(row = 0, column = 1) 720. 721. date = tk.Entry(midRightFrame, width = 30, state = 'readonly', t
extvariable = dateVariable) 722. dateVariable.set(targetArrester.dateInstalled) 723. date.grid(row = 1, column = 1) 724. 725. location = tk.Entry(midRightFrame, width = 30, state = 'readonly
', textvariable = locationVariable) 726. locationVariable.set(targetArrester.location) 727. location.grid(row = 2, column = 1) 728. 729. comments = tk.Entry(midRightFrame, width = 30, state = 'readonly
', textvariable = commentsVariable) 730. commentsVariable.set(targetArrester.comments) 731. comments.grid(row = 3, column = 1) 732. 733. 734. try: 735. 736. print("Starting graphing") 737. 738. # If a previous graph is displayed, delete it 739. if (graphFigure != None): 740. graphFigure.get_tk_widget().destroy() 741. 742. # Plot the waveform graphs 743. f = plt.figure(figsize = (10,5), dpi = 100) 744. 745. a = f.add_subplot(211) 746. plt.title("Resistive Leakage Current") 747. plt.ylabel("Current (Milli-Amps)") 748. plt.xlabel("Time (Seconds)") 749. plt.xlim(0, 0.05) 750. plt.tight_layout() 751. a.plot(targetArrester.timeArray[targetPosition], targetArres
ter.resistCurrentArray[targetPosition]) 752. 753. b = f.add_subplot(212) 754. plt.title("FFT") 755. plt.ylabel("Peak (Milli-Amps)") 756. plt.xlabel("Frequency (Hertz)") 757. plt.xlim(0, 700) 758. plt.tight_layout() 759. b.plot(targetArrester.freqArray[targetPosition], targetArres
ter.fftPlotArray[targetPosition])

Portable Restive Leakage Current Monitoring System Appendix E – GUI Python
80
760. 761. # Display the waveforms on the canvas area 762. graphFigure = FigureCanvasTkAgg(f, canvasArea) 763. graphImage = graphFigure.get_tk_widget() 764. graphImage.pack(fill = 'both', expand = 1) 765. 766. print("Success The Rat") 767. 768. except: 769. tk.messagebox.showerror("Create Graph", "Unable to create gr
aph") 770. 771. 772. 773. 774. # Function Name: quitProgram 775. # 776. # Purpose: This function will confirm if the user truly wishes to cl
ose the program. 777. # If so, all the arrester information will be saved properly before
the program is 778. # ended. 779. # 780. # Input: None 781. # 782. # Output: None 783. # 784. # 785. def quitProgram(self): 786. currArrester = None 787. i = 0 788. arresterDeleted = 0 789. 790. quit = tk.messagebox.askokcancel("Quit Program", "Are you sure y
ou want to quit?", default = 'cancel') 791. if quit == 1: 792. 793. if not arresterList: # No arresters, so no file created 794. # End program 795. self.master.quit() 796. else: 797. 798. # This is the file name to save the databse file as 799. dest_filename = 'Master_File.xlsx' 800. 801. count = 1 802. 803. # Initate data saving process 804. wb = Workbook() # Create work book 805. 806. 807. # Loop through all arrestors to create a worksheet for e
ach one and insert this data 808. for i in arresterList: 809. sheet = wb.get_sheet_by_name('Sheet') 810. sheet.cell(row = count, column = 1).value = i.name 811. sheet.cell(row = count, column = 2).value = i.dataSe
tAmount # The number of data sets for the arrestor 812. sheet = wb.create_sheet(title = i.name) # create t
he sheet for the arrrstor 813. sheet['A1'] = 'Arrester Name:'

Portable Restive Leakage Current Monitoring System Appendix E – GUI Python
81
814. sheet['A2'] = 'Date Installed:' 815. sheet['A3'] = 'Location:' 816. sheet['A4'] = 'Comments:' 817. sheet['B1'] = i.name 818. sheet['B2'] = i.dateInstalled 819. sheet['B3'] = i.location 820. sheet['B4'] = i.comments 821. count = count+1 822. 823. 824. for i in arresterList: 825. for j in range(i.dataSetAmount): 826. # call this function for each data subset 827. outDatabase(wb, i.name, j, i.timeArray[j], i.res
istCurrentArray[j], i.freqArray[j], i.fftPlotArray[j], i.dataDateEntry[j]) 828. 829. # Save over original file # 830. wb.save(filename = dest_filename) 831. 832. # Delete all arresters from temporary storage and associ
ated menu entries 833. for k in arresterList: 834. index = 0 835. arresterDeleted = 0 836. 837. while (arresterDeleted == 0): 838. if (k.name == self.ArresterMenuButton.menu.entry
cget(index, 'label')): 839. self.ArresterMenuButton.menu.delete(index) 840. arresterDeleted = 1 841. index = index + 1 842. 843. for m in arresterList: 844. arresterList.remove(m) 845. 846. # End program 847. self.master.quit() 848. 849. 850. 851. 852. arresterList = [] # A temporary list of all arrester to use w
hile running the GUI 853. deviceConnectionPort = None # Variable to store the Arduino connection
port 854. groundingResistorValue = 0 # Varaible to store the value in Ohms of th
e grounding resistor 855. graphFigure = None # Variable to store the currently displayed
graph, in order to properly clear it for the next graph to be properly displayed
856. 857. def main(): 858. root = tk.Tk() 859. ArresterGUI(root).pack(fill = "both", expand = True) 860. root.mainloop() 861. 862. # Used to ensure this program is the main source file 863. if __name__ == "__main__": 864. main()

Portable Restive Leakage Current Monitoring System Appendix F – Excel Export
82
Appendix F – Excel Export
1. import openpyxl 2. from openpyxl.chart import ( 3. ScatterChart, 4. Reference, 5. Series, 6. 7. ) 8. from openpyxl.styles import Font, Fill 9. import datetime 10. import os 11. import subprocess 12. import sys 13. 14. def exportExcel(a,b,c,d,Name, Location, Comments): 15. time =a 16. resistor = b 17. freq = c 18. fftplot = d 19. 20. 21. xfile = openpyxl.load_workbook('outputsummary_template.xlsx',data_only=False
) 22. 23. sheet = xfile.get_sheet_by_name('Sheet2') 24. i = 2 25. sheet['A1'] = 'Time' 26. for place in a: 27. sheet.cell(row = i, column = 1).value = place 28. i= i+1 29. 30. i = 2 31. sheet['B1'] = 'Resistor' 32. for place in b: 33. sheet.cell(row = i, column = 2).value = place 34. i= i+1 35. i = 2 36. sheet['D1'] = 'Freq' 37. for place in c: 38. sheet.cell(row = i, column = 4).value = place 39. i= i+1 40. 41. i = 2 42. sheet['E1'] = 'FFTPlot' 43. for place in d: 44. sheet.cell(row = i, column = 5).value = place 45. i= i+1 46. #Chart 1 47. c1 = ScatterChart() 48. c1.title = "Resistive Leakage Current" 49. #c1.title.font.size = 100 50. c1.style = 3 51. c1.y_axis.title = 'Current (mA)' 52. c1.x_axis.title = 'Time (s)' 53. c1.legend = None 54. c1.height =7 55. c1.width=14

Portable Restive Leakage Current Monitoring System Appendix F – Excel Export
83
56. c1.x_axis.scaling.min = 0 57. c1.x_axis.scaling.max = .05 58. c1.scatterStyle = 'marker' 59. 60. xvalues = Reference(sheet, min_col=1, min_row=2, max_row=len(time)+1) 61. values = Reference(sheet, min_col=2, min_row=2, max_row=len(time)+1) 62. series = Series(values, xvalues, title_from_data=True) 63. c1.series.append(series) 64. 65. sheet = xfile.get_sheet_by_name('Sheet1') 66. 67. sheet.add_chart(c1, "B11") 68. 69. ##Chart 2 70. sheet = xfile.get_sheet_by_name('Sheet2') 71. c2 = ScatterChart() 72. c2.title = "FFT" 73. c2.style = 10 74. c2.y_axis.title = 'Peak (mA)' 75. c2.x_axis.title = 'Frequency (Hz)' 76. c2.legend = None 77. c2.height = 7 78. c2.width=14 79. 80. c2.x_axis.scaling.min = 0 81. c2.x_axis.scaling.max = 445 82. 83. xvalues = Reference(sheet, min_col=4, min_row=2, max_row=len(freq)+1) 84. values = Reference(sheet, min_col=5, min_row=2, max_row=len(freq)+1) 85. series = Series(values, xvalues, title_from_data=True) 86. c2.series.append(series) 87. 88. 89. sheet = xfile.get_sheet_by_name('Sheet1') 90. 91. sheet.add_chart(c2, "B27") 92. #~~~~~~~~~~~~Charts End Here~~~~~Additional SpreadSheet Output 93. now = datetime.datetime.now() 94. sheet.cell(row = 3, column = 2).value = str(now.month)+'/'+str(now.day)+'/'+
str(now.year) 95. #sheet['E1'] = str(now.day)+' '+str(now.year) 96. sheet.cell(row = 4, column = 2).value = Name 97. sheet.cell(row = 3, column = 5).value = Location 98. sheet.cell(row = 4, column = 5).value = Comments 99. sheet.cell(row = 9, column = 4).value = str(round(max(b),3))+' mA' 100. xfile.save('Output Excel Summary.xlsx') 101. 102. filepath = 'Output Excel Summary.xlsx' 103. 104. if (sys.platform == "darwin"): 105. subprocess.call(["open", filepath]) 106. else: 107. os.startfile(filepath)

Portable Restive Leakage Current Monitoring System Appendix G – Device Hardware
84
Appendix G – Device Hardware
Figure 0.1: Power Supply/Arrester Processing Subsystem Integration
Figure 0.2: Power Supply/Arrester Processing Subsytem, Integration

Portable Restive Leakage Current Monitoring System Appendix G – Device Hardware
85
a)
b)
c)

Portable Restive Leakage Current Monitoring System Appendix G – Device Hardware
86
Figure 0.3: Power Supply
Figure 0.4: Device In Test