Embed Size (px)
Citation preview

University of Minnesota Proficiency Project
FALL 2014 Evaluation Report
Center for Applied Linguistics
Margaret E. Malone, Ph.D.
Anne Donovan, M.S.
John Chi, M.S.
01 SEPTEMBER 2015

TABLE OF CONTENTS
INTRODUCTION......................................................................................................................... 1
Research Questions ..................................................................................................................... 1
METHODOLOGY ....................................................................................................................... 2
Participants .................................................................................................................................. 2
Procedures ................................................................................................................................... 3
Instruments .................................................................................................................................. 3
Data Collection ............................................................................................................................ 3
Data Analysis .............................................................................................................................. 3
FINDINGS ..................................................................................................................................... 5
RQ 1: What levels of proficiency do students demonstrate at which course levels in which
languages? ................................................................................................................................... 5
RQ 2: Do students in higher level courses demonstrate higher levels of proficiency than
students in lower levels? ........................................................................................................... 21
RQ 3: Are there patterns in responses on surveys and proficiency scores? .............................. 29
RQ 4: Are there correlations between self-assessments and actual ratings?............................. 40
RQ 5: What factors contribute to advanced proficiency in study abroad experiences (given a
sufficiently robust sample)? ...................................................................................................... 47
CONCLUSIONS ......................................................................................................................... 50
REFERENCES ............................................................................................................................ 52

TABLE OF FIGURES
Figure 1. Overall means for Spanish courses .................................................................................. 5
Figure 2. Counts of proficiency levels in SPAN 1022.................................................................... 7
Figure 3. Counts of proficiency levels in SPAN 1004.................................................................... 8
Figure 4. Counts of proficiency levels in SPAN 3105W ................................................................ 9
Figure 5. Counts of proficiency levels in SPAN 3972W .............................................................. 10
Figure 6. Counts of proficiency levels in SPAN Certificate ......................................................... 11
Figure 7. Overall means for German courses ............................................................................... 12
Figure 8. Counts of proficiency levels in GER 1004 .................................................................... 13
Figure 9. Counts of proficiency levels in GER 3012W ................................................................ 14
Figure 10. Overall means for French courses ............................................................................... 15
Figure 11. Counts of proficiency levels in FREN 1002 ................................................................ 16
Figure 12. Counts of proficiency levels in FREN 1004 ................................................................ 17
Figure 13. Counts of proficiency levels in FREN 3016 ................................................................ 18
Figure 14. Overall means for Portuguese courses ........................................................................ 19
Figure 15. Counts of proficiency levels in PORT 3001 ................................................................ 20
Figure 16. LTP proficiency counts by Spanish course levels ....................................................... 21
Figure 17. RTP proficiency counts by Spanish course levels ....................................................... 22
Figure 18. OPIc proficiency counts by Spanish course levels ...................................................... 23
Figure 19. LTP proficiency counts by German course levels ....................................................... 23

Figure 20. RTP proficiency counts by German course levels ...................................................... 24
Figure 21. OPIc proficiency counts by German course levels...................................................... 24
Figure 22. LTP proficiency counts by French course levels ........................................................ 25
Figure 23. RTP proficiency counts by French course levels ........................................................ 26
Figure 24. OPIc proficiency counts by French course levels ....................................................... 26
Figure 25. LTP proficiency counts in the Portuguese course ....................................................... 27
Figure 26. RTP proficiency count in the Portuguese course ........................................................ 28
Figure 27. OPIc proficiency count in the Portuguese course........................................................ 28
Figure 28. Proficiency ratings by level of effort ........................................................................... 39
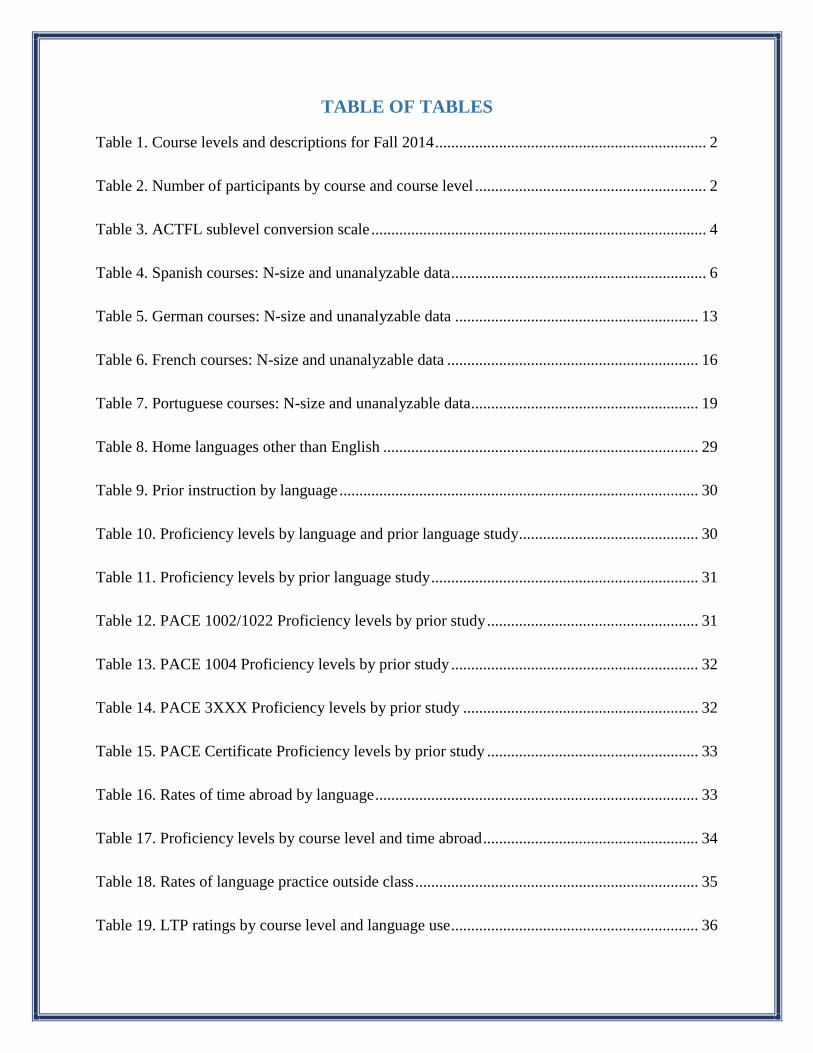
TABLE OF TABLES
Table 1. Course levels and descriptions for Fall 2014 .................................................................... 2
Table 2. Number of participants by course and course level .......................................................... 2
Table 3. ACTFL sublevel conversion scale .................................................................................... 4
Table 4. Spanish courses: N-size and unanalyzable data ................................................................ 6
Table 5. German courses: N-size and unanalyzable data ............................................................. 13
Table 6. French courses: N-size and unanalyzable data ............................................................... 16
Table 7. Portuguese courses: N-size and unanalyzable data ......................................................... 19
Table 8. Home languages other than English ............................................................................... 29
Table 9. Prior instruction by language .......................................................................................... 30
Table 10. Proficiency levels by language and prior language study............................................. 30
Table 11. Proficiency levels by prior language study ................................................................... 31
Table 12. PACE 1002/1022 Proficiency levels by prior study ..................................................... 31
Table 13. PACE 1004 Proficiency levels by prior study .............................................................. 32
Table 14. PACE 3XXX Proficiency levels by prior study ........................................................... 32
Table 15. PACE Certificate Proficiency levels by prior study ..................................................... 33
Table 16. Rates of time abroad by language ................................................................................. 33
Table 17. Proficiency levels by course level and time abroad ...................................................... 34
Table 18. Rates of language practice outside class ....................................................................... 35
Table 19. LTP ratings by course level and language use .............................................................. 36

Table 20. RTP ratings by course level and language use ............................................................. 36
Table 21. OPIc ratings by course level and language use ............................................................. 36
Table 22. Top motivating factors selected for learning the target language ................................. 37
Table 23. Proficiency levels by top motivating factors ................................................................ 38
Table 24. Proficiency levels by top choice of motivation, course level, and language ................ 38
Table 25. Self-assessment ranges by level .................................................................................... 40
Table 26. Level 1 listening self-assessments and LTP ratings ..................................................... 41
Table 27. Level 3 listening self-assessments and LTP ratings ..................................................... 41
Table 28. Level 1 reading self-assessments and RTP ratings ....................................................... 42
Table 29. Level 3 reading self-assessments and RTP ratings ....................................................... 44
Table 30. Level 1 speaking self-assessments and OPIc ratings .................................................... 45
Table 31. Level 2 speaking self-assessments and OPIc ratings .................................................... 45
Table 32. Level 3 speaking self-assessments and OPIc ratings .................................................... 46
Table 33. Summary of accuracy in self-assessments .................................................................... 46
Table 34. Duration of study abroad by course level ..................................................................... 47
Table 35. Language of instruction while abroad by course level ................................................. 47
Table 36. Living situation while abroad by course level .............................................................. 48
Table 37. Amount of time target language was used at home by living situation ........................ 48
Table 38. Frequency of target language use outside the home ..................................................... 48

1 | P a g e
University of Minnesota
Language Proficiency Evaluation Report
Fall Semester 2014
INTRODUCTION
In 2014, the National Security Education Program (NSEP)’s Language Flagship awarded
contracts to three major state universities (Michigan State University, the University of
Minnesota, and the University of Utah) to investigate language proficiency outcomes of
university students in both commonly taught languages (CTL) and less commonly taught
languages (LCTL). NSEP in general and the Language Flagship in particular have as their
mission to “graduate students who will take their place among the next generation of global
professionals, commanding a superior level of fluency in one of many languages critical to U.S.
competitiveness and security” (NSEP). At the University of Minnesota, the project is known as
the Proficiency Assessment for Curricular Enhancement Project (PACE).
In Fall 2014, the first semester of data collection for this project, data were collected from
306 students of French, German, Portuguese, and Spanish at the University of Minnesota. In
addition to administering language proficiency tests to students, the University of Minnesota
collected demographic, experiential, attitudinal and self-assessment data. The Center for Applied
Linguistics (CAL) is providing a report on the research questions provided by the university
based on the data provided by the University of Minnesota.
This report presents aggregation and analysis of data collected from students enrolled in
foreign language courses during the Fall 2014 semester at the University of Minnesota. The data,
which consist of students’ foreign language proficiency scores, coupled with their self-
assessments and surveys about their background preparation, have been collected under the
auspices of PACE. For this project, three large public universities are collecting data on student
language proficiency outcomes. In addition to administering tests to students of French, German,
Portuguese and Spanish, the University of Minnesota collected demographic, experiential,
attitudinal, and self-assessment data in Fall 2014 from 306 students.
In this report, the Center for Applied Linguistics provides an evaluation of the students’
data and attempts to answer the following research questions provided by the University of
Minnesota.
Research Questions
The research questions addressed in this report are:
1. What levels of proficiency do students demonstrate at which course levels in which
languages?
2. Do students in higher-level courses demonstrate higher levels of proficiency than
students in lower levels?
3. Are there patterns in responses on surveys and proficiency scores?
4. Are there correlations between self-assessments and actual ratings?
5. What factors contribute to advanced proficiency in study abroad experiences?

2 | P a g e
University of Minnesota
Language Proficiency Evaluation Report
Fall Semester 2014
METHODOLOGY
This section presents the methodology utilized for data collection at the University of
Minnesota, including details about the participant population, the procedures of research, the
instruments employed, the data collection, and analysis of the data.
Participants
The participants in this study are university students taking foreign language courses at
the University of Minnesota during the fall semester of 2014. Students from several course levels
across four languages participated in the study. Table 1 describes the sequencing of the courses.
Table 1. Course levels and descriptions for Fall 2014
Course Sequence
1002/1022 Second semester
1004 Fourth semester
3105W/3016/3012W Sixth semester
3001 (Portuguese only) First semester for Spanish speakers
3972W Senior seminar
Certificate Certificate candidates
Table 2 shows the breakdown of the 306 participants by language and course level.
Table 2. Number of participants by course and course level
Course Spanish German French Portuguese Total
1002/1022 43 -- 27 -- 70
1004 44 39 47 -- 130
3001 -- -- -- 16
86 3012 -- 14 -- --
3105 38 -- -- --
3016 -- -- 18 --
3972 15 -- -- -- 15
Certificate 5 5
Total 145 53 92 16 306
As Table 2 shows, a total of 306 students participated in data collection in Spanish
(N=145), German (N=53), French (N=92), and Portuguese (N=16). The largest populations of

3 | P a g e
University of Minnesota
Language Proficiency Evaluation Report
Fall Semester 2014
students come from the second semester (1002/1022) levels and the fourth semester (1004)
levels. The smallest group is the students who are certificate candidates. For analysis purposes,
in later sections of this report, all students in the advanced level courses beginning with “3” will
at times be grouped together using the code used by PACE, “3XXX”.
Procedures
The University of Minnesota used several instruments (details in the next subsection) to
collect data from the 306 students, and then sent all data to CAL in an Excel spreadsheet for
analysis. Upon receiving this data, CAL began organizing and analyzing the data to respond to
the five previously stated research questions provided.
Instruments
In order to answer the research questions, the University of Minnesota used seven
instruments for data collection. In order to assess language proficiency across modalities, PACE
utilized three instruments developed by the American Council on the Teaching of Foreign
Languages (ACTFL): the Oral Proficiency Interview-computerized (OPIc), the ACTFL
Listening Test of Proficiency (LTP), and the ACTFL Reading Test of Proficiency (RTP). In
addition to completing the instruments above, the students completed self-assessments of their
abilities in speaking, listening, and reading as well as a language experience background and
motivation questionnaire that was created by the university. The University of Minnesota
conducted all material selection/design and implementation.
Data Collection
The University of Minnesota conducted the process of data collection, including research
design, gathering of participants, material creation, testing of participants, and survey
completion. After the data collection process was completed, CAL received f data from the
University of Minnesota for analysis and evaluation.
Data Analysis
For analysis of proficiency scores, ratings on the ACTFL Proficiency Guidelines
(ACTFL, 2012) were converted to numerical values using conversions that have been previously
used in many research studies (see e.g. Dandonoli & Henning, 1990; Vande Berg, Connor-
Linton, & Paige, 2009).
Table 3 shows the conversion scale used.

4 | P a g e
University of Minnesota
Language Proficiency Evaluation Report
Fall Semester 2014
Table 3. ACTFL sublevel conversion scale
ACTFL Sublevel Numeric Conversion
Novice Low 0.1
Novice Mid 0.3
Novice High 0.8
Intermediate Low 1.1
Intermediate Mid 1.3
Intermediate High 1.8
Advanced Low 2.1
Advanced Mid 2.3
Advanced High 2.8
Superior 3.0
For reporting purposes, means will be reported numerically and/or in terms of the closest
ACTFL sublevel. For the purpose of assigning participants and group means a corresponding
ACTFL proficiency level, the numerical ratings will be rounded to the closest sublevel. For
example, a mean of 1.15 would be reported as Intermediate Low, whereas a mean of 1.22 would
be reported as Intermediate Mid.
It is important to note that the Fall 2014 data contained a large amount of unanalyzable
data. The LTP and RTP are leveled tests, and students received a test aimed at a specific range of
levels based on expectations of their proficiency. For example, students enrolled in a 1002 course
were given an LTP for the Novice High to Advanced Low levels. However, if a student’s actual
proficiency falls below that range, the test is scored “BR”, or “Below Range”. Similarly, on the
OPIc, students whose responses were not consistent or did not fit the scoring profile of the test
could have a test that is unratable (UR). Such tests were regarded as unanalyzable, and thus are
not included in the group means.
Students also completed a self-assessment that consisted of a series of “can do”
statements on which students gave themselves a rating to indicate the extent to which they could
do each described statement, for example, “When I hear the language that I study and the topic is
generally familiar to me, I can understand the gist of what I hear.” Student responses to each of
the statements were converted to a numeric total score for each skill, and converted to an ACTFL
level using a conversion chart provided by the University of Minnesota. Like the LTP and RTP,
the self-assessments are leveled; therefore students could receive a limited range of sublevels as
a rating, depending on which self-assessment they received.
5 | P a g e
University of Minnesota
Language Proficiency Evaluation Report
Fall Semester 2014
FINDINGS
RQ 1: What levels of proficiency do students demonstrate at which course levels in which
languages?
Participants’ proficiency ratings (means) were calculated for each language, skill test
(LTP, RTP, OPIc), and course level in order to address this first research question. Using the
means of the groups, this report addresses: 1) patterns for a specific language, 2) patterns for
specific skill tests, and 3) patterns for course levels in each language. Divided into each of the
four languages, the overall proficiency scores of each language course in each language are
reported along with any unanalyzable data, followed by a narrower view at each individual
course level with the number of participants at each proficiency level.
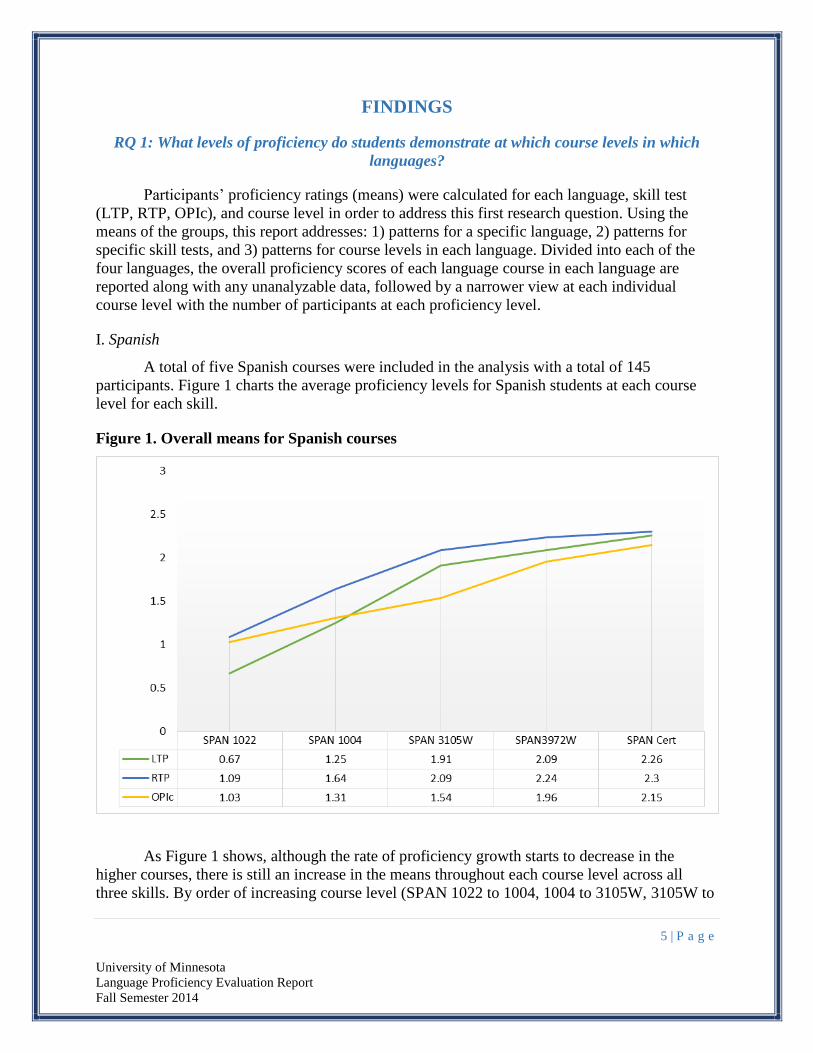
I. Spanish
A total of five Spanish courses were included in the analysis with a total of 145
participants. Figure 1 charts the average proficiency levels for Spanish students at each course
level for each skill.
Figure 1. Overall means for Spanish courses
As Figure 1 shows, although the rate of proficiency growth starts to decrease in the
higher courses, there is still an increase in the means throughout each course level across all
three skills. By order of increasing course level (SPAN 1022 to 1004, 1004 to 3105W, 3105W to

6 | P a g e
University of Minnesota
Language Proficiency Evaluation Report
Fall Semester 2014
3972W, and 3972W to SPAN Cert), the mean listening proficiency score of the participants
improved by +0.58 (from NH to IM), +0.66 (from IM to IH), +0.18 (from IH to AL), +0.17
(from AL to AM). In that same order, the mean reading increased by +0.55 (from IL to IH),
+0.45 (from IH to AL), +0.15 (from AL to AM), +0.06 (AM). Lastly, the oral proficiency rose
+0.28 (from IL to IM), +0.23 (IM), +0.42 (from IM to IH/AL), +0.19 (from IH/AL).
Table 4 shows the total sample size for each Spanish course level and the number of
examinees’ with unanalyzable data at each level.
Table 4. Spanish courses: N-size and unanalyzable data
Course
N-
size
LTP RTP OPIc
BR UR NR Total BR UR NR Total BR UR NR Total
SPAN 1022 43 0 0 0 0 0 0 0 0 0 0 0 0
SPAN 1004 44 8 0 1 9 0 0 1 1 0 0 0 0
SPAN 3105W 38 3 0 0 3 0 0 0 0 0 3 0 3
SPAN 3972W 15 0 0 0 0 0 0 0 0 0 1 0 1
SPAN Cert 5 0 0 0 0 0 0 0 0 0 1 0 1
Total 145 11 0 1 12 0 0 1 1 0 5 0 5
When reviewing the data, it is important to note a few factors. First, note that there is
unequal distribution between the total participants in the five course levels. As Table 4 shows,
the number of participants tends to drop as the course levels rise, leaving only 15 participants in
SPAN 3972W and 5 in the SPAN Certificate program. In addition to this, there are also a
number of participants with ratings of BR, UR, or NR.
A. SPAN 1022
Figure 2 shows the distribution of proficiency ratings for students in SPAN 1022.

7 | P a g e
University of Minnesota
Language Proficiency Evaluation Report
Fall Semester 2014
Figure 2. Counts of proficiency levels in SPAN 1022
Figure 2, when displaying all three skills cumulatively, shows that all the participants’
proficiency scores in SPAN 1022 (total N = 43 students) range from Novice Low to Intermediate
Mid, with the majority at Intermediate Low (50.4%), followed by Novice High (18.6%) and
Intermediate Mid (14.7%), and the rest Novice Mid and lower. Also, it is notable that the
listening scores tend to be lower than reading or oral proficiency.
All participants in SPAN 1022 had analyzable scores.
B. SPAN 1004
Figure 3 shows the distribution of proficiency ratings for students (total N = 44) in SPAN
1004.
9 9 816
1
2 5
23
13
111
26
5
0
10
20
30
40
50
60
70
NL NM NH IL IM IH AL AM AH
SPAN 1022
LTP RTP OPIC

8 | P a g e
University of Minnesota
Language Proficiency Evaluation Report
Fall Semester 2014
Figure 3. Counts of proficiency levels in SPAN 1004
Figure 3 shows that the highest number of participants’ ratings fall at Intermediate Mid
(48.4%), followed by Intermediate Low (16.4%) and Advanced Low (14.8%). The remaining
participants’ ratings are at Novice High and Intermediate High with one rating in Advanced Mid.
86.9% of the participants’ ratings in the SPAN 1004-course level fall between Intermediate Low
and Intermediate High.
For SPAN 1004, nine students received an unanalyzable score on the LTP, one on the
RTP, and none on the OPIc. This represents approximately 20.5% of the total LTP data, and thus
exclusion of the unanalyzable scores likely has an effect on the reported means.
C. SPAN 3105W
Figure 4 shows the distribution of proficiency ratings for students (total N = 38) in SPAN
3105W.
9 | P a g e
University of Minnesota
Language Proficiency Evaluation Report
Fall Semester 2014
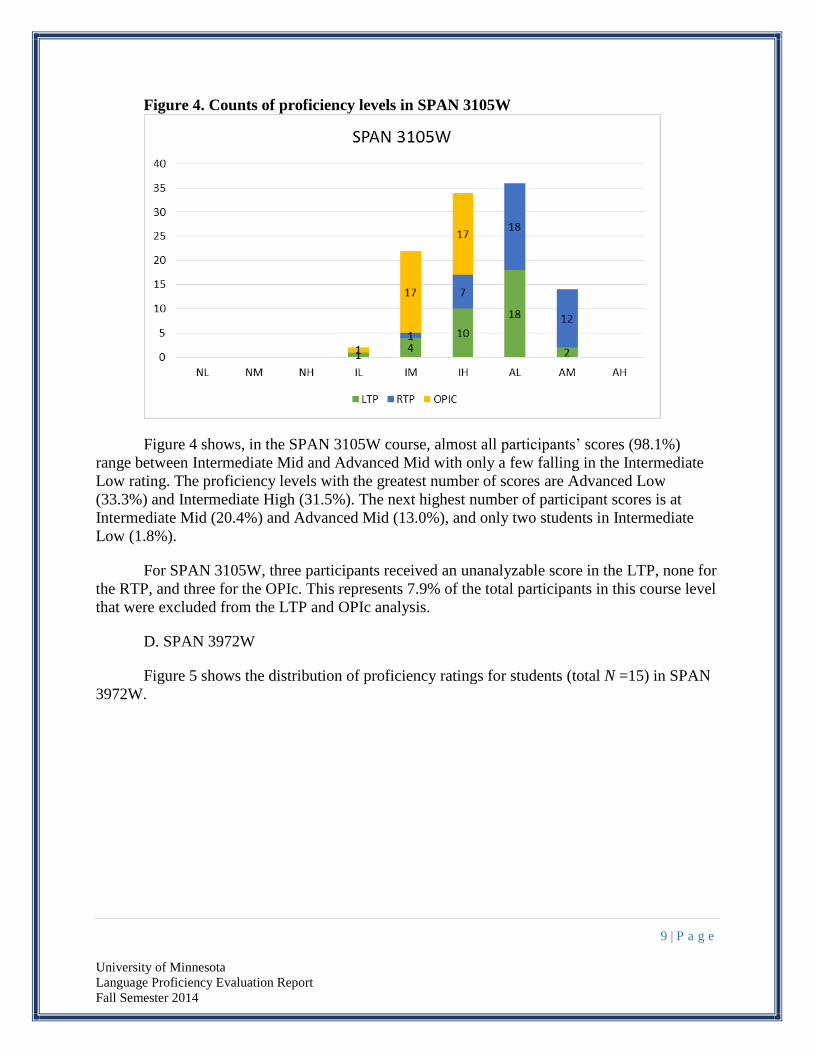
Figure 4. Counts of proficiency levels in SPAN 3105W
Figure 4 shows, in the SPAN 3105W course, almost all participants’ scores (98.1%)
range between Intermediate Mid and Advanced Mid with only a few falling in the Intermediate
Low rating. The proficiency levels with the greatest number of scores are Advanced Low
(33.3%) and Intermediate High (31.5%). The next highest number of participant scores is at
Intermediate Mid (20.4%) and Advanced Mid (13.0%), and only two students in Intermediate
Low (1.8%).
For SPAN 3105W, three participants received an unanalyzable score in the LTP, none for
the RTP, and three for the OPIc. This represents 7.9% of the total participants in this course level
that were excluded from the LTP and OPIc analysis.
D. SPAN 3972W
Figure 5 shows the distribution of proficiency ratings for students (total N =15) in SPAN
3972W.
10 | P a g e
University of Minnesota
Language Proficiency Evaluation Report
Fall Semester 2014
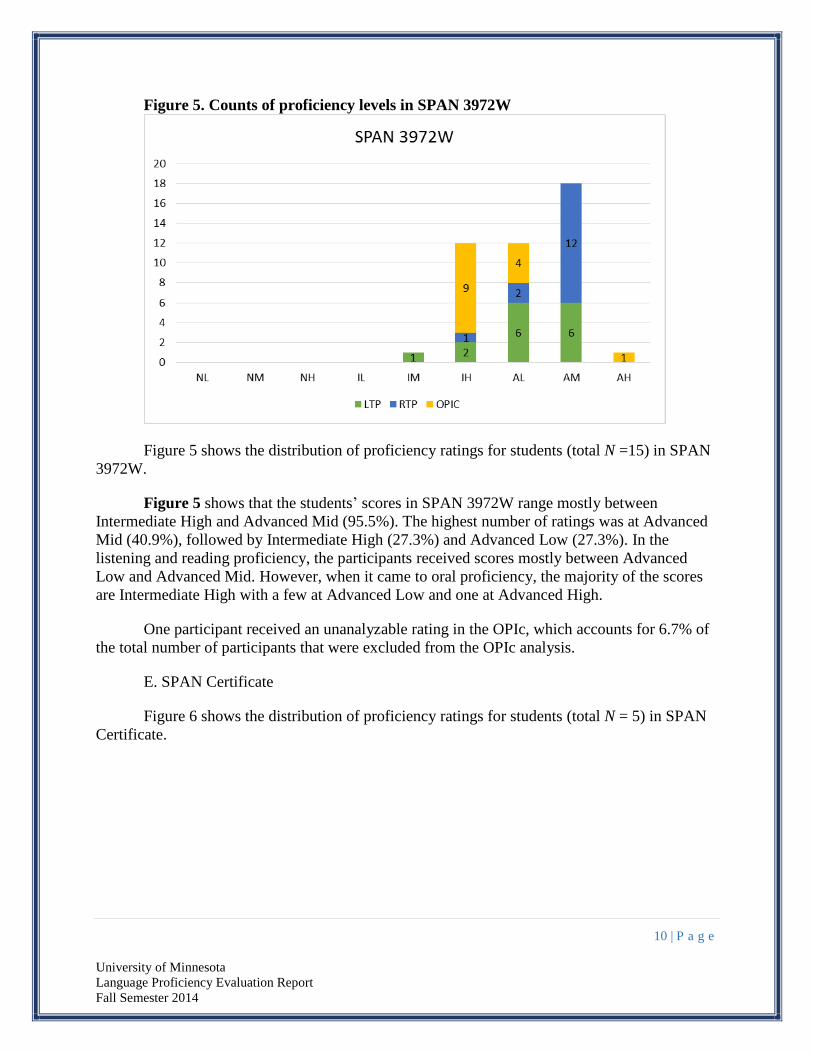
Figure 5. Counts of proficiency levels in SPAN 3972W
Figure 5 shows the distribution of proficiency ratings for students (total N =15) in SPAN
3972W.
Figure 5 shows that the students’ scores in SPAN 3972W range mostly between
Intermediate High and Advanced Mid (95.5%). The highest number of ratings was at Advanced
Mid (40.9%), followed by Intermediate High (27.3%) and Advanced Low (27.3%). In the
listening and reading proficiency, the participants received scores mostly between Advanced
Low and Advanced Mid. However, when it came to oral proficiency, the majority of the scores
are Intermediate High with a few at Advanced Low and one at Advanced High.
One participant received an unanalyzable rating in the OPIc, which accounts for 6.7% of
the total number of participants that were excluded from the OPIc analysis.
E. SPAN Certificate
Figure 6 shows the distribution of proficiency ratings for students (total N = 5) in SPAN
Certificate.
11 | P a g e
University of Minnesota
Language Proficiency Evaluation Report
Fall Semester 2014
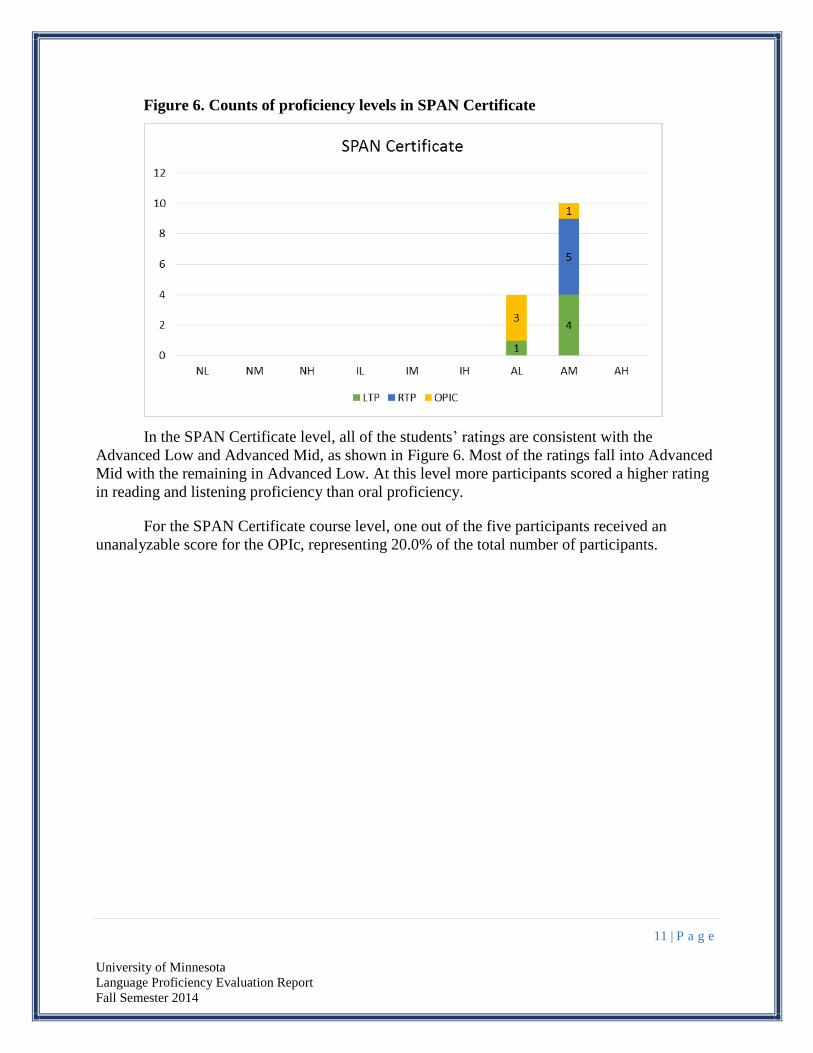
Figure 6. Counts of proficiency levels in SPAN Certificate
In the SPAN Certificate level, all of the students’ ratings are consistent with the
Advanced Low and Advanced Mid, as shown in Figure 6. Most of the ratings fall into Advanced
Mid with the remaining in Advanced Low. At this level more participants scored a higher rating
in reading and listening proficiency than oral proficiency.
For the SPAN Certificate course level, one out of the five participants received an
unanalyzable score for the OPIc, representing 20.0% of the total number of participants.
12 | P a g e
University of Minnesota
Language Proficiency Evaluation Report
Fall Semester 2014
II. German
Figure 7 shows the average proficiency levels for German students at each course level
for each skill.
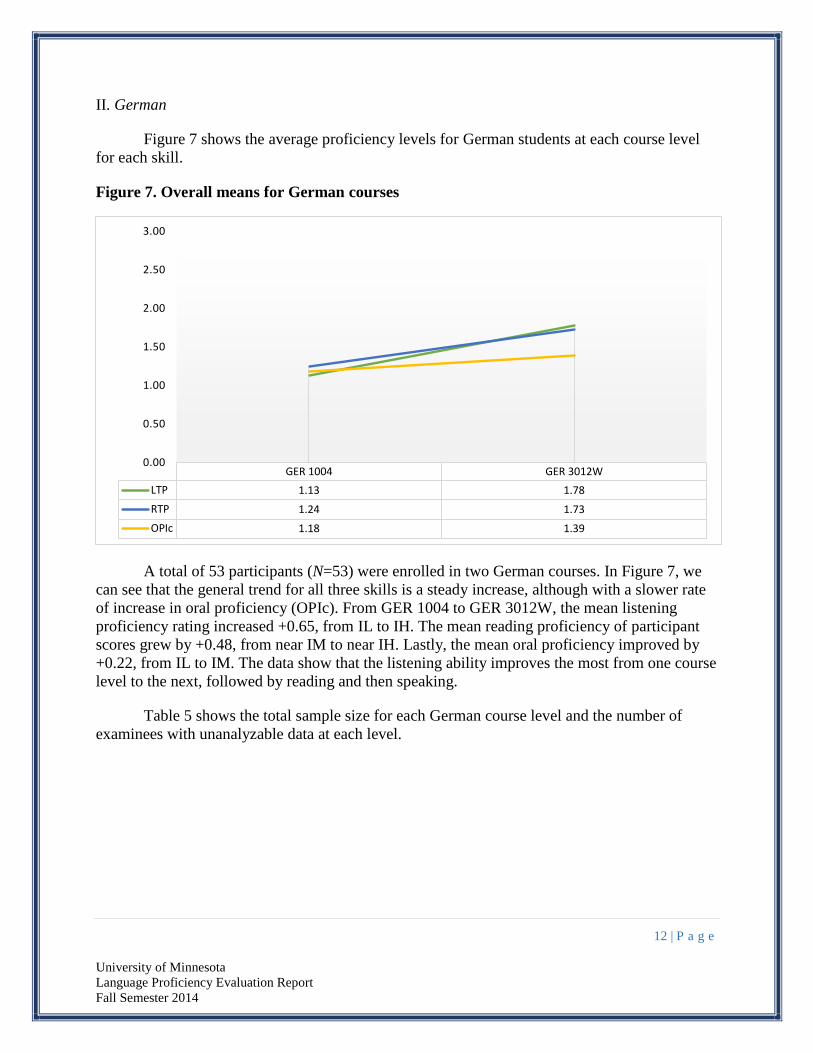
Figure 7. Overall means for German courses
A total of 53 participants (N=53) were enrolled in two German courses. In Figure 7, we
can see that the general trend for all three skills is a steady increase, although with a slower rate
of increase in oral proficiency (OPIc). From GER 1004 to GER 3012W, the mean listening
proficiency rating increased +0.65, from IL to IH. The mean reading proficiency of participant
scores grew by +0.48, from near IM to near IH. Lastly, the mean oral proficiency improved by
+0.22, from IL to IM. The data show that the listening ability improves the most from one course
level to the next, followed by reading and then speaking.
Table 5 shows the total sample size for each German course level and the number of
examinees with unanalyzable data at each level.
GER 1004 GER 3012W
LTP 1.13 1.78
RTP 1.24 1.73
OPIc 1.18 1.39
0.00
0.50
1.00
1.50
2.00
2.50
3.00

13 | P a g e
University of Minnesota
Language Proficiency Evaluation Report
Fall Semester 2014
Table 5. German courses: N-size and unanalyzable data
Course
N-
size
LTP RTP OPIc
BR UR NR Total BR UR NR Total BR UR NR Total
GER 1004 39 13 0 0 13 6 0 0 6 0 0 0 0
GER 3012W 14 2 0 0 2 3 0 0 3 0 0 0 0
Total 53 15 0 0 15 9 0 0 9 0 0 0 0
Again, the distribution of students in the two course levels are uneven (N=39 in GER
1004, N=14 in GER 3012W) and the number of unanalyzable data relative to the total number of
participants is quite large; these factors should be considered when looking at the results.
Table 5, which focuses on listening proficiency, includes 15 participants that were scored
BR (13 in GER 1004 and 2 in GER 3012W). In reading, 9 participants scored BR (6 in GER
1004 and 3 in GER 3012W). All the data from the OPIc were analyzable and included into the
means seen in Figure 7.
A. GER 1004
Figure 8 shows the distribution of proficiency ratings for students (total N = 39) in GER
1004.
Figure 8. Counts of proficiency levels in GER 1004

14 | P a g e
University of Minnesota
Language Proficiency Evaluation Report
Fall Semester 2014
In Figure 8, we can see that the majority of the participants’ proficiency ratings fall
between Novice High and Intermediate High (99.0%). Most of the participants’ results were
rated Intermediate Low (38.8%) and Intermediate Mid (29.6%), followed by Novice High
(19.4%) and then Intermediate High (11.2%). It appears that the different skills are distributed
fairly evenly in GER 1004.
In German 1004, 13 participants received an unanalyzable score for the LTP (33.3%) and
6 for the RTP (15.4%). Thus the data represents only 67.7% of the participants for the LTP and
84.6% for the RTP.
B. GER 3012W
Figure 9 shows the distribution of proficiency ratings among students (total N = 14) in
GER 3012W.
Figure 9. Counts of proficiency levels in GER 3012W
Figure 9 shows that almost all (97.3%) of the participant ratings fall between
Intermediate Mid and Advanced Low, with only one rating in Intermediate Low. The majority of
the ratings are at the Intermediate Mid proficiency level (48.6%), along with many at Advanced
Low (27.0%) and Intermediate High (21.6%). The participants’ reading and listening scores are
somewhat evenly spread between Intermediate Mid and Advanced Low; however, the oral
proficiency of the participants tends to fall mostly below Intermediate Mid.
In the GER 3012W course level, two participants (14.3%) for the LTP received an
unanalyzable rating and three participants (21.4%) for the RTP. Thus, the data represents only
85.7% of the total participants for the LTP, 78.6% for the RTP, and 100.0% for the OPIc.
15 | P a g e
University of Minnesota
Language Proficiency Evaluation Report
Fall Semester 2014
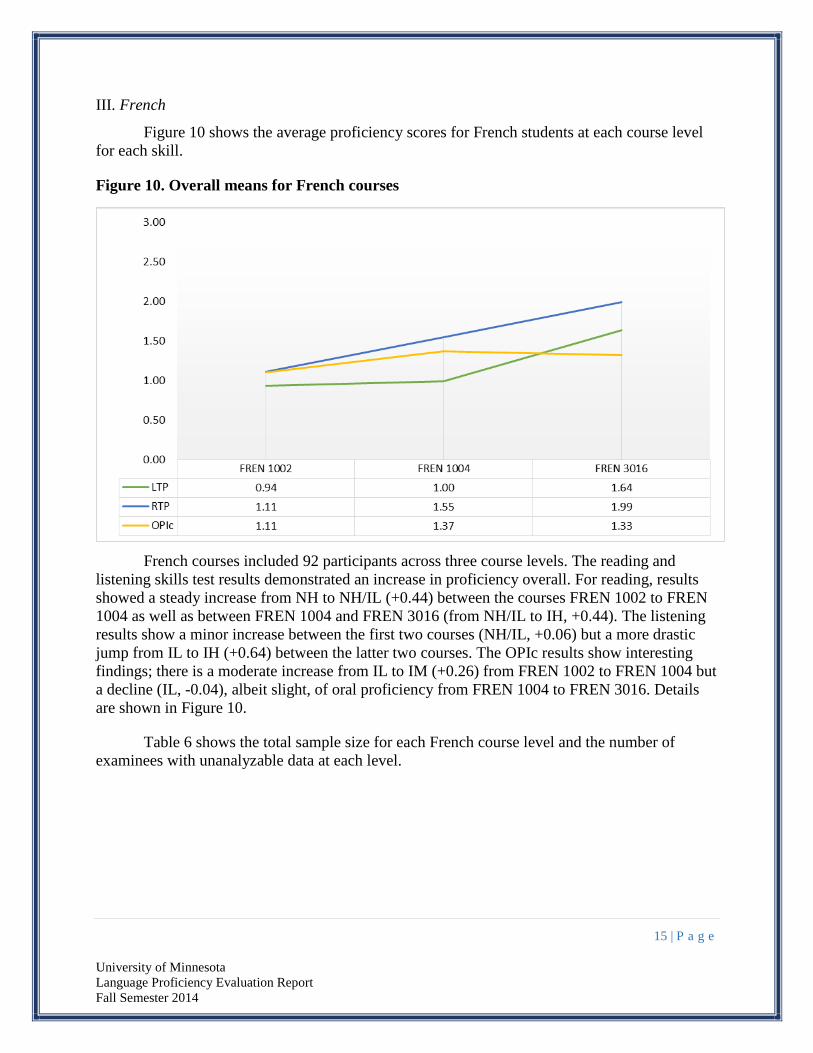
III. French
Figure 10 shows the average proficiency scores for French students at each course level
for each skill.
Figure 10. Overall means for French courses
French courses included 92 participants across three course levels. The reading and
listening skills test results demonstrated an increase in proficiency overall. For reading, results
showed a steady increase from NH to NH/IL (+0.44) between the courses FREN 1002 to FREN
1004 as well as between FREN 1004 and FREN 3016 (from NH/IL to IH, +0.44). The listening
results show a minor increase between the first two courses (NH/IL, +0.06) but a more drastic
jump from IL to IH (+0.64) between the latter two courses. The OPIc results show interesting
findings; there is a moderate increase from IL to IM (+0.26) from FREN 1002 to FREN 1004 but
a decline (IL, -0.04), albeit slight, of oral proficiency from FREN 1004 to FREN 3016. Details
are shown in Figure 10.
Table 6 shows the total sample size for each French course level and the number of
examinees with unanalyzable data at each level.

16 | P a g e
University of Minnesota
Language Proficiency Evaluation Report
Fall Semester 2014
Table 6. French courses: N-size and unanalyzable data
Course
N-
size
LTP RTP OPIc
BR UR NR Total BR UR NR Total BR UR NR Total
FREN 1002 27 15 0 0 15 0 0 0 0 0 0 0 0
FREN 1004 47 16 0 1 17 2 0 1 3 1 0 1 2
FREN 3016 18 8 0 1 9 1 0 1 2 0 0 0 0
Total 92 39 0 2 41 3 0 2 5 1 0 1 2
In the French courses, there are a large number of unanalyzable results, especially for the
LTP. A total of 39 BRs and 2 NRs in the LTP (44.6% of the total N), 3 BRs and 2 NRs in the
RTP (5.4%), and 1 BR and 1 NR in the OPIc (2.2%) were found. Table 6 describes the
distribution of these unanalyzable data throughout the course levels.
A. FREN 1002
Figure 11 shows the distribution of proficiency ratings for students (total N = 27) in
FREN 1002.
Figure 11. Counts of proficiency levels in FREN 1002
In the FREN 1002 courses, 98.5% of all proficiency ratings are between Novice High and
Intermediate Mid, as seen in Figure 11. The majority of these ratings are at Intermediate Low
(53.0%), followed by Intermediate Mid (25.8%) and Novice High (19.7%). Proportionally, the

17 | P a g e
University of Minnesota
Language Proficiency Evaluation Report
Fall Semester 2014
participants’ scores demonstrated higher results on reading, where more participant scores were
between Intermediate Low and Intermediate Mid, than listening, where most scores fall in the
Novice High range. However, the large number of unanalyzable LTP tests makes it difficult to
argue with certainty that participants do indeed show increases in proficiency. The oral
proficiency scores of the participants tend to fall somewhere in between, with the majority of the
participants scoring in the Intermediate Low range.
A total of 15 participants (55.6%) received unanalyzable ratings in the LTP, none for the
RTP or OPIc. For the LTP, only 44.4% of the data is represented in the analysis. Thus, the
exclusion of this large proportion of data is likely to have an effect on the means of the results.
B. FREN 1004
Figure 12 shows the distribution of proficiency ratings for students (total N = 47) in
FREN 1004.
Figure 12. Counts of proficiency levels in FREN 1004
In Figure 12, we can see that 95.0% of the participant ratings in FREN 1004 are between
Novice High and Intermediate High, with only a few RTP and OPIc ratings in Advanced Low.
The highest number of ratings was Intermediate Mid level (42.0%), with many at the
Intermediate High (21.0%), Intermediate Low (18.5%), and Novice High (13.4%). Similar to the
FREN 1002 data, the participants’ reading proficiency results tend to surpass their listening, and
many of the LTP ratings were Below Rating (N=16). The oral proficiency results showed a
majority of the participants scoring in Intermediate Mid.

18 | P a g e
University of Minnesota
Language Proficiency Evaluation Report
Fall Semester 2014
In FREN 1004, 17 out of the 47 participants (36.2%) had unanalyzable scores for the
LTP, 3 for the RTP (6.4%), and 2 for the OPIc (4.3%). The LTP results need to be read with
caution due to the large proportion of excluded data.
C. FREN 3016
Figure 13 shows the distribution of proficiency ratings for students (total N = 18) in
FREN 3016.
Figure 13. Counts of proficiency levels in FREN 3016
Figure 13 shows a range of proficiencies from Intermediate Low to Advanced Mid, with
the most ratings at Intermediate Mid (36.4%), followed by Intermediate High (20.5%) and
Advanced Low (20.5%), and the remainder at Intermediate Low (11.4%) and Advanced Mid
(9.1%). However, in the FREN 3016 course level, there is a different pattern as to which skills
are at a higher proficiency. Although the reading proficiency results are still the highest for the
participants in this course level, their oral proficiency results appear to be lower than the
listening. However, it should be noted that there is a proportionally large number of unanalyzable
data points for listening.
Of the 18 participants in FREN 3016, nine (50.0%) received unanalyzable ratings in the
LTP, two for the RTP (11.1%), and none for the OPIc. Thus, the amount of unanalyzable data is
likely to have an effect on the results for the LTP.

19 | P a g e
University of Minnesota
Language Proficiency Evaluation Report
Fall Semester 2014
IV. Portuguese
Figure 14 shows the average proficiency levels for Portuguese students in the PORT
3001 course for each skill.
Figure 14. Overall means for Portuguese courses
The 16 participants from Portuguese were enrolled in only one course level – PORT
3001. For that reason, no comparable analysis was conducted with the Portuguese results.
Therefore, the report only focuses on the results on participants’ proficiency results in PORT
3001 course level. Figure 14 shows that the participants’ highest scores were in reading
proficiency with a mean rating of Intermediate High (1.85), followed by oral proficiency with a
mean rating of Intermediate Mid (1.44), and lastly by listening proficiency with a mean rating
between Intermediate Low and Intermediate Mid (1.21).
Table 7 shows the total sample size for the PORT 3001 course level and the number of
examinees’ with unanalyzable data.
Table 7. Portuguese courses: N-size and unanalyzable data
Course
N-
size
LTP RTP OPIc
BR UR NR Total BR UR NR Total BR UR NR Total
PORT 3001 16 1 0 0 1 0 0 0 0 0 0 0 0
Total 16 1 0 0 1 0 0 0 0 0 0 0 0
20 | P a g e
University of Minnesota
Language Proficiency Evaluation Report
Fall Semester 2014
Unlike results from the other languages, there is only one instance of a BR score in the
LTP and none elsewhere. In addition, there is only one level of Portuguese courses included in
the data, so there is no unequal distribution of students, as with the previous language courses.
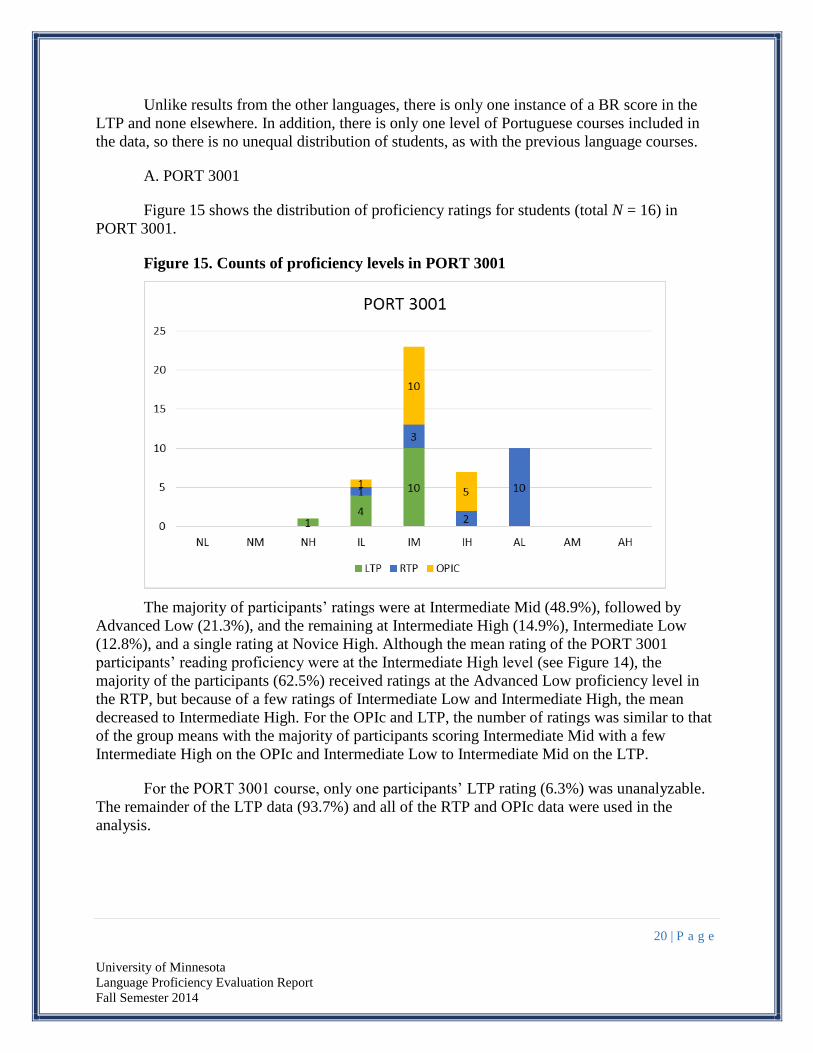
A. PORT 3001
Figure 15 shows the distribution of proficiency ratings for students (total N = 16) in
PORT 3001.
Figure 15. Counts of proficiency levels in PORT 3001
The majority of participants’ ratings were at Intermediate Mid (48.9%), followed by
Advanced Low (21.3%), and the remaining at Intermediate High (14.9%), Intermediate Low
(12.8%), and a single rating at Novice High. Although the mean rating of the PORT 3001
participants’ reading proficiency were at the Intermediate High level (see Figure 14), the
majority of the participants (62.5%) received ratings at the Advanced Low proficiency level in
the RTP, but because of a few ratings of Intermediate Low and Intermediate High, the mean
decreased to Intermediate High. For the OPIc and LTP, the number of ratings was similar to that
of the group means with the majority of participants scoring Intermediate Mid with a few
Intermediate High on the OPIc and Intermediate Low to Intermediate Mid on the LTP.
For the PORT 3001 course, only one participants’ LTP rating (6.3%) was unanalyzable.
The remainder of the LTP data (93.7%) and all of the RTP and OPIc data were used in the
analysis.

21 | P a g e
University of Minnesota
Language Proficiency Evaluation Report
Fall Semester 2014
RQ 2: Do students in higher-level courses demonstrate higher levels of proficiency than
students in lower levels?
The second research question will be answered by analyzing results of each skill test by
course level. In addition, the results will be displayed across all course levels for each language
in one figure for comparison. The numerical value in each figure corresponds to the number of
students who scored at each proficiency level. In the results displayed, the total scores only
include test instances that received a rating on the ACTFL Guidelines. (For more details on the
unanalyzable data for each course, refer back to Table 4 (Spanish),
Table 5 (German), Table 6 (French), and
Table 7 (Portuguese) in the findings for Research Question 1.) The results for Research Question
2 will be reported by language: Spanish, German, French, and then Portuguese.
I. Spanish
Figure 16 shows the LTP proficiency counts for all the Spanish course level participants.
Figure 16. LTP proficiency counts by Spanish course levels
As Figure 16 demonstrates, the majority of the SPAN 1022 (light green) participants
received proficiency scores at the lower end of the proficiency range (NL to IL). The SPAN
1004 participant scores (light blue) fall mainly in the middle range (NH to IH). The majority of
the SPAN 3105W participant scores (yellow) are in the upper middle range (IM to AL). The
SPAN 3972W participant scores are (dark green) in the upper range (IH to AM). Lastly, the
SPAN Certificate participant scores (dark blue) are mostly at the Advanced Mid proficiency
level with a few in Advanced Low. Thus, the level of listening proficiency for the majority of the
participants in each course level does tend to rise in the order of ascending course level.
22 | P a g e
University of Minnesota
Language Proficiency Evaluation Report
Fall Semester 2014
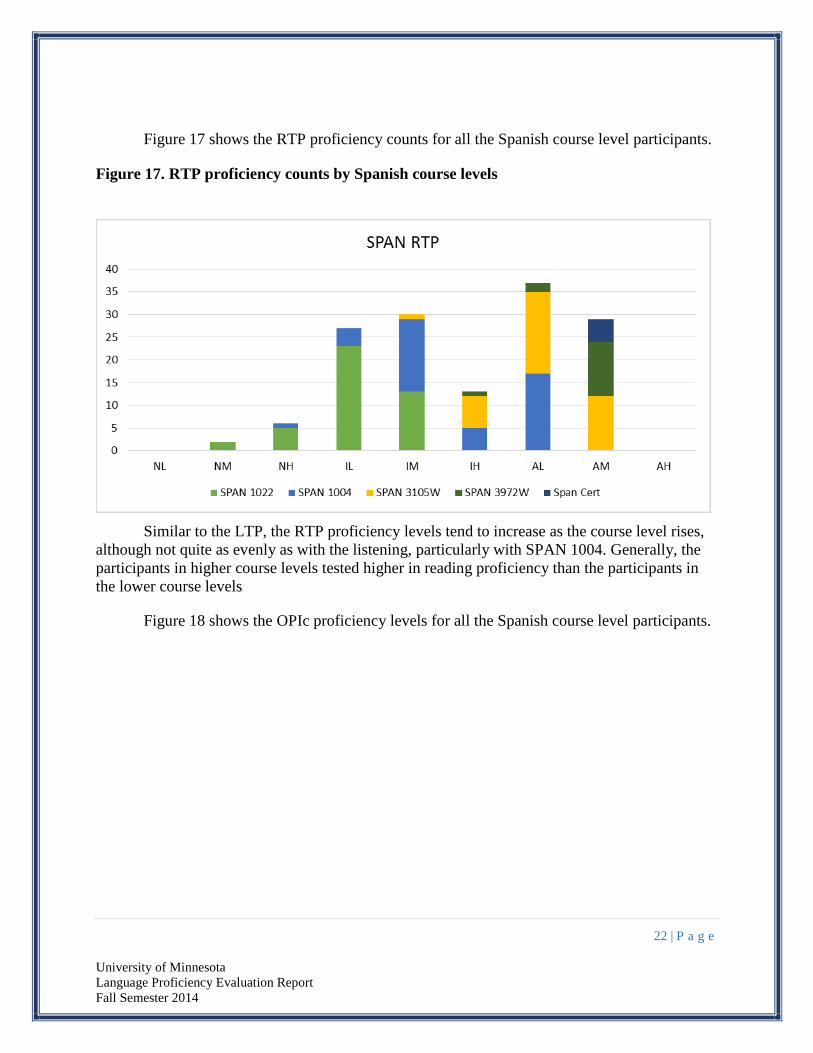
Figure 17 shows the RTP proficiency counts for all the Spanish course level participants.
Figure 17. RTP proficiency counts by Spanish course levels
Similar to the LTP, the RTP proficiency levels tend to increase as the course level rises,
although not quite as evenly as with the listening, particularly with SPAN 1004. Generally, the
participants in higher course levels tested higher in reading proficiency than the participants in
the lower course levels
Figure 18 shows the OPIc proficiency levels for all the Spanish course level participants.

23 | P a g e
University of Minnesota
Language Proficiency Evaluation Report
Fall Semester 2014
Figure 18. OPIc proficiency counts by Spanish course levels
As Figure 18 shows, OPIc ratings increase as the course levels increase. Ratings in the
lower level courses (SPAN 1022 and 1004) fall across four proficiency levels, and the ranges
narrow as course levels increase and N sizes decrease.
II. German
The German language courses represent two course levels. As previously mentioned, it
must be noted that GER 1004 has 39 participants, while GER 3012W has 14. Figure 19 shows
the LTP proficiency counts for all the German language participants.
Figure 19. LTP proficiency counts by German course levels
0
10
20
30
40
50
60
NL NM NH IL IM IH AL AM AH
SPAN OPIc
SPAN 1022 SPAN 1004 SPAN 3105W SPAN 3972W Span Cert

24 | P a g e
University of Minnesota
Language Proficiency Evaluation Report
Fall Semester 2014
As shown in Figure 19, the GER 3012W participants clearly test better in listening
proficiency than the GER 1004 participants. The GER 1004 participants have a larger range of
proficiency (NH to IH), but overall, the GER 3012W participants perform better in listening (IM
to AL).
Figure 20 shows the RTP proficiency counts for all the German course level participants.
Figure 20. RTP proficiency counts by German course levels
GER 1004 participants showed a larger range of proficiency levels in reading than in
listening with some participants even falling in the AL proficiency level. Overall, the GER
3012W participants still tend to score higher than participants in the GER 1004 course.
Figure 21 shows the OPIc proficiency results for all the German course participants.
Figure 21. OPIc proficiency counts by German course levels

25 | P a g e
University of Minnesota
Language Proficiency Evaluation Report
Fall Semester 2014
Most student proficiency results for the OPIc were at the Intermediate Mid level.
However, the difference between the enrollments for the two courses (39 in 1004 and 14 in
3012W) makes it difficult to determine whether the GER 3012W participants are actually
performing better. However, it is clear that there are a proportionally larger number of
participants in the lower range of the proficiency scale with the GER 1004 participants than the
GER 3012W participants.
III. French
There were an unequal number of participants across levels in French. The FREN 1002
course has 27 participants, FREN 1004 has 47 participants; and the FREN 3016 has 18. Figure
22 shows the LTP proficiency counts for all the French course level participants.
Figure 22. LTP proficiency counts by French course levels
Figure 22 shows that listening proficiency outcomes of the participants in the FREN 3016
course is higher (IM to AL) than the other two courses, but the difference between FREN 1002
and FREN 1004 may not be as obvious since they both range from NH to IM. Numerically, it
may appear that there are more FREN 1004 participants rated in NH, IL, and IM than FREN
1002 participants. However, a more accurate picture is shown when viewed proportionally. In
FREN 1002, 58.3% of the participants fall under NH, followed by 33.3% in IL and only 8.3% in
IM. However, in FREN 1004, 50.0% are in NH, 26.67% in IL, and 23.3% in IM. What this
means is that although a larger number of participants are in the lower end of the proficiency
scale, we see that a lesser proportion of participants are actually in NH for the FREN 1004
participants, and a higher proportion of them are actually in IM than the FREN 1002 participants.
Figure 23 shows the RTP proficiency counts for all the French course level participants.

26 | P a g e
University of Minnesota
Language Proficiency Evaluation Report
Fall Semester 2014
Figure 23. RTP proficiency counts by French course levels
In Figure 23, the RTP score counts show less ambiguity than the LTP. With the FREN
1002 participants, there is a range between NH and IM with one outlier in NL. In the FREN 1004
course level, the participants range between IL and AL. Lastly, in the FREN 3016 course level,
they range between IM and AM. Thus, in regards to reading proficiency in the French courses,
the participants in the higher course levels are performing better than the participants in the
lower.
Figure 24 shows the OPIc proficiency counts for all the French course level participants.
Figure 24. OPIc proficiency counts by French course levels
27 | P a g e
University of Minnesota
Language Proficiency Evaluation Report
Fall Semester 2014
As Figure 24 shows, the FREN 1002 proficiency range is between NH and IM, with the
majority of participants scoring in the IL range. The FREN 1004 and FREN 3016 data show
similar proficiency levels across both courses. 13.3% of the FREN 1004 participants fell under
IL, 64.4% under IM, and 17.8% under IH, with one participant in NH and another in AL. In the
FREN 3016 course level, 27.8% of the participants were in the IL proficiency level, 55.6% in
IM, and 16.7% in IH. It appears that there is a higher proportion of FREN 3016 participants in
NH and a lower proportion in IH, compared to the FREN 1004 participants. Although the
proportional difference is not very large, the data show that the FREN 1004 participants are
performing better in oral proficiency than the FREN 3016 participants. This is also consistent
with the overall mean data found in Figure 10, where the FREN 1004 mean scores in the OPIc
are also slightly higher than the FREN 3016 mean.
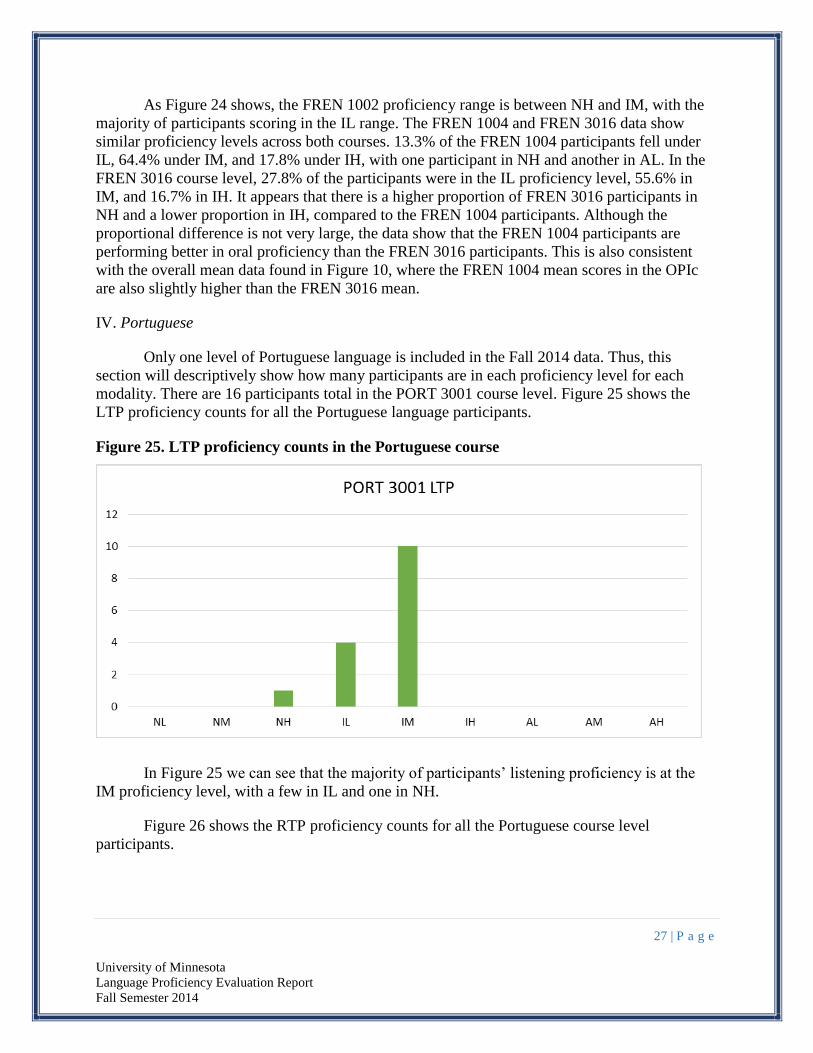
IV. Portuguese
Only one level of Portuguese language is included in the Fall 2014 data. Thus, this
section will descriptively show how many participants are in each proficiency level for each
modality. There are 16 participants total in the PORT 3001 course level. Figure 25 shows the
LTP proficiency counts for all the Portuguese language participants.
Figure 25. LTP proficiency counts in the Portuguese course
In Figure 25 we can see that the majority of participants’ listening proficiency is at the
IM proficiency level, with a few in IL and one in NH.
Figure 26 shows the RTP proficiency counts for all the Portuguese course level
participants.

28 | P a g e
University of Minnesota
Language Proficiency Evaluation Report
Fall Semester 2014
Figure 26. RTP proficiency counts in the Portuguese course
Figure 26 shows that the range of the proficiency for the RTP is between IL and AL, with
the majority of participants scoring in AL. This indicates that the PORT 3001 participants’
reading proficiency is higher than their listening proficiency.
Figure 27 shows the OPIc proficiency counts for all the Portuguese course level
participants.
Figure 27. OPIc proficiency counts in the Portuguese course
In Figure 27, we can see that the range of participants is between IL and IH, with most
participants in IM, followed by five participants in IH and one in IL. By looking at the three
figures for the Portuguese course, the participants in this course level seem to perform best in the
order of: 1) reading, 2) speaking, and 3) listening. Because there is no source of comparison
between or among any other Portuguese classes, no other conclusions can be drawn.

29 | P a g e
University of Minnesota
Language Proficiency Evaluation Report
Fall Semester 2014
RQ 3: Are there patterns in responses on surveys and proficiency scores?
In addition to taking language proficiency tests, students completed surveys detailing
their previous language and cultural experiences, current language practices, and motivation for
participating in language courses. This section provides selected data from these survey
questions to show the distribution of student survey responses and how they relate to proficiency
scores. In order to best represent this data, this section collapses the course numbers beginning
with “3”, per the PACE project tracking code for courses. These courses will be represented as
“3XXX”. Analysis for this research question is organized by the sections of the student surveys:
previous language experience, cultural experience, language practices, and motivation.
I. Previous Language Experience
The previous language experience section of the survey asked students about their home
language and primary and secondary school learning experiences. 30 of the 306 students reported
a home language other than English, as detailed in Table 8.
Table 8. Home languages other than English
Home Language Count (N=30)
Chinese 4
French 1
Hebrew 1
Hmong 2
Japanese 1
Other African 3
Persian 1
Russian 4
Spanish 5
Vietnamese 2
Other 6
Of the participating students, a total of only three were studying their home language, too
few to comprise their own group for analysis. Students also reported whether they had previously
participated in language immersion programs in which the target language was used for at least
half of the day. A total of 11 respondents reported participating in such programs. This group is
also too small to continue with any additional meaningful analysis.
Students were asked about receiving instruction in their target language in middle and
high school. The results appear in Table 9.

30 | P a g e
University of Minnesota
Language Proficiency Evaluation Report
Fall Semester 2014
Table 9. Prior instruction by language
Prior instruction?
Language No Yes Total
Spanish 7 (4.8%) 138 (95.2%) 145
German 11 (20.8%) 42 (79.2%) 53
French 23 (25.3%) 68 (74.7%) 91
Portuguese 16 (100.0%) 0 (0.0%) 16
Total 57 248 305
As Table 9 shows, the majority of respondents indicated that they had previously studied
the language in middle and/or high school, although rates vary by language. None of the
Portuguese-learning respondents had previously studied Portuguese, although all had previously
studied Spanish because the only Portuguese course included was a Portuguese for Spanish
speakers class (PORT 3001). The effect of this prior instruction will be analyzed by language,
prior length of study, and by course level. The following tables present averages on the three
skills tested, converting test ratings on the ACTFL Guidelines using the scale presented in
Table 3. Table 10 shows the differences in proficiency level based on prior study by
language.
Table 10. Proficiency levels by language and prior language study
Prior
Instruction
Average LTP
Rating (N-size)
Average RTP
Rating (N-size)
Average OPIc
Rating (N-size)
Spanish
No 1.31 (N=7) 1.74 (N=7) 1.23 (N=7)
Yes 1.37 (N=126) 1.68 (N=137) 1.38 (N=133)
German No 1.52 (N=9) 1.51 (N=8) 1.23 (N=11)
Yes 1.28 (N=29) 1.33 (N=36) 1.24 (N=42)
French No 0.95 (N=11) 1.30 (N=21) 1.17 (N=23)
Yes 1.14 (N=40) 1.56 (N=65) 1.32 (N=67)
Total No 1.23 (N=27) 1.56 (N=36) 1.26 (N=41)
Yes 1.31 (N=195) 1.59 (N=238) 1.34 (N=242)
Note: Portuguese has been excluded because no students had previously studied Portuguese.
Table 10 shows that overall, students who received instruction in the target language in
middle or high school have slightly higher proficiency ratings. However, within language
groups, these relationships do not always follow this pattern. Furthermore, this analysis does not
take into account the instruction received after high school, which varies by course level.

31 | P a g e
University of Minnesota
Language Proficiency Evaluation Report
Fall Semester 2014
Students in level 1002/1022 would have limited interference from university courses, while some
students in level 3XXX have several years of college-level study. As a result, cell sizes are too
small for any meaningful comparisons.
Table 11 shows the average ratings on all three skills when analyzed by length of prior
study in middle and/or high school.
Table 11. Proficiency levels by prior language study
Length of prior study
Average LTP
Rating (N-size)
Average RTP
Rating (N-size)
Average OPIc
Rating (N-size)
None 1.23 (N=42) 1.56 (N=52) 1.26 (N=57)
Less than 1 year 1.30 (N=1) 1.80 (N=1) 1.30 (N=1)
1 - 2 years 0.85 (N=27) 1.23 (N=36) 1.10 (N=38)
2 - 3 years 1.10 (N=37) 1.44 (N=45) 1.25 (N=47)
3 - 5 years 1.35 (N=92) 1.61 (N=112) 1.36 (N=114)
More than 5 years 1.74 (N=38) 2.00 (N=44) 1.58 (N=42)
Table 11 shows a consistent pattern among students who previously studied the language.
Averages for students (not including the single student in the “Less than 1 year” category)
increased with additional years of study. This does not hold true for students who have no prior
experience with the language, suggesting that these students’ proficiency development is
following a different pattern.
To account for level of university study, Table 12, Table 13, Table 14, and Table 15
break down the length of prior study in middle and/or high school and average proficiency
ratings by current level of study, combining all languages for each level.
Table 12. PACE 1002/1022 Proficiency levels by prior study
Length of prior study
Average LTP
Rating (N-size)
Average RTP
Rating (N-size)
Average OPIc
Rating (N-size)
None 0.79 (N=9) 1.11 (N=14) 1.04 (N=14)
Less than 1 year - (N=0) - (N=0) - (N=0)
1 - 2 years 0.46 (N=13) 1.06 (N=13) 0.96 (N=13)
2 - 3 years 0.86 (N=16) 1.07 (N=19) 1.08 (N=19)
3 - 5 years 0.79 (N=17) 1.13 (N=24) 1.10 (N=24)
More than 5 years - (N=0) - (N=0) - (N=0)
Table 12 shows that students in a second-semester course do not show a clear pattern of
proficiency outcomes related to level of prior study.
32 | P a g e
University of Minnesota
Language Proficiency Evaluation Report
Fall Semester 2014
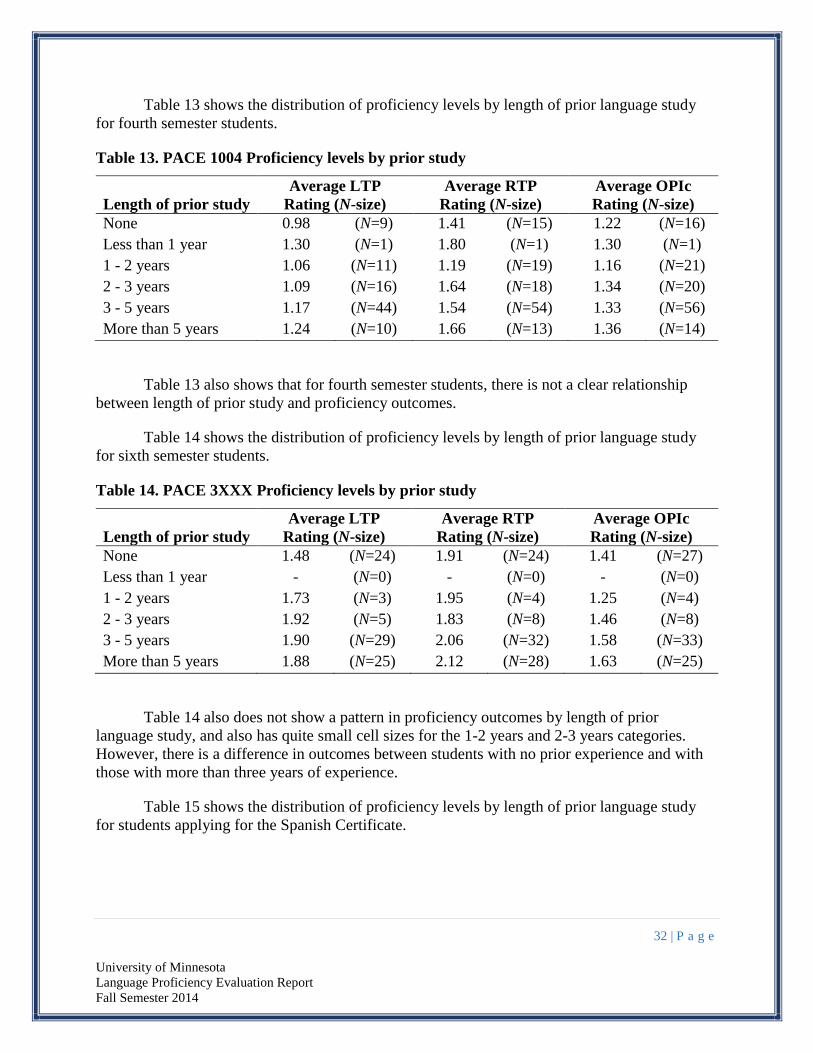
Table 13 shows the distribution of proficiency levels by length of prior language study
for fourth semester students.
Table 13. PACE 1004 Proficiency levels by prior study
Length of prior study
Average LTP
Rating (N-size)
Average RTP
Rating (N-size)
Average OPIc
Rating (N-size)
None 0.98 (N=9) 1.41 (N=15) 1.22 (N=16)
Less than 1 year 1.30 (N=1) 1.80 (N=1) 1.30 (N=1)
1 - 2 years 1.06 (N=11) 1.19 (N=19) 1.16 (N=21)
2 - 3 years 1.09 (N=16) 1.64 (N=18) 1.34 (N=20)
3 - 5 years 1.17 (N=44) 1.54 (N=54) 1.33 (N=56)
More than 5 years 1.24 (N=10) 1.66 (N=13) 1.36 (N=14)
Table 13 also shows that for fourth semester students, there is not a clear relationship
between length of prior study and proficiency outcomes.
Table 14 shows the distribution of proficiency levels by length of prior language study
for sixth semester students.
Table 14. PACE 3XXX Proficiency levels by prior study
Length of prior study
Average LTP
Rating (N-size)
Average RTP
Rating (N-size)
Average OPIc
Rating (N-size)
None 1.48 (N=24) 1.91 (N=24) 1.41 (N=27)
Less than 1 year - (N=0) - (N=0) - (N=0)
1 - 2 years 1.73 (N=3) 1.95 (N=4) 1.25 (N=4)
2 - 3 years 1.92 (N=5) 1.83 (N=8) 1.46 (N=8)
3 - 5 years 1.90 (N=29) 2.06 (N=32) 1.58 (N=33)
More than 5 years 1.88 (N=25) 2.12 (N=28) 1.63 (N=25)
Table 14 also does not show a pattern in proficiency outcomes by length of prior
language study, and also has quite small cell sizes for the 1-2 years and 2-3 years categories.
However, there is a difference in outcomes between students with no prior experience and with
those with more than three years of experience.
Table 15 shows the distribution of proficiency levels by length of prior language study
for students applying for the Spanish Certificate.

33 | P a g e
University of Minnesota
Language Proficiency Evaluation Report
Fall Semester 2014
Table 15. PACE Certificate Proficiency levels by prior study
Length of prior study
Average LTP
Rating (N-size)
Average RTP
Rating (N-size)
Average OPIc
Rating (N-size)
None - (N=0) - (N=0) - (N=0)
Less than 1 year - (N=0) - (N=0) - (N=0)
1 - 2 years - (N=0) - (N=0) - (N=0)
2 - 3 years - (N=0) - (N=0) - (N=0)
3 - 5 years 2.20 (N=2) 2.30 (N=2) 2.10 (N=1)
More than 5 years 2.30 (N=3) 2.30 (N=3) 2.17 (N=3)
The cell sizes for the data for students enrolled in the PACE Certificate program are too
small to allow meaningful analysis.
Overall, while a general pattern seems to be evident connecting students’ years of prior
experience to an upward trend in mean proficiency ratings, when the data are reconsidered by
course in order to account for the students’ likely exposure to the target language at the college
level, those patterns disappear.
II. Cultural Experience
The next section of the survey asked students about their cultural experience, in terms of
time spent in regions where the target language is spoken. Students were asked whether they had
spent at least two consecutive weeks in a country or region where the target language was the
primary language. 87 of the 305 respondents responded affirmatively. Table 16 shows the
number of students studying each language who had spent at least two weeks abroad in a target
language context.
Table 16. Rates of time abroad by language
Language No time abroad At least two weeks abroad Total
French 71 (78.0%) 20 (22.0%) 91
German 29 (54.7%) 24 (45.3%) 53
Portuguese 16 (100.0%) 0 (0.0%) 16
Spanish 102 (70.3%) 43 (29.7%) 145
Table 17 shows the average proficiency levels of students who have and have not spent
time abroad by course level.

34 | P a g e
University of Minnesota
Language Proficiency Evaluation Report
Fall Semester 2014
Table 17. Proficiency levels by course level and time abroad
Course
Time
abroad
Average LTP
Rating (N-size)
Average RTP
Rating (N-size)
Average OPIc
Rating (N-size)
PACE
1002/1022
No 0.73 (N=52) 1.09 (N=66) 1.06 (N=66)
Yes 0.77 (N=3) 1.20 (N=4) 1.10 (N=4)
PACE
1004
No 1.11 (N=66) 1.46 (N=91) 1.26 (N=98)
Yes 1.19 (N=25) 1.64 (N=28) 1.41 (N=30)
PACE
3XXX
No 1.69 (N=47) 1.98 (N=52) 1.46 (N=50)
Yes 1.88 (N=39) 2.05 (N=44) 1.59 (N=47)
PACE
Certificate
No - (N=0) - (N=0) - (N=0)
Yes 2.26 (N=5) 2.30 (N=5) 2.15 (N=4)
Table 17 shows a slight increase in mean proficiencies when comparing the participants
who spent time abroad in a country where the target language was spoken with those who didn’t.
However, it should be noted that the rates of time spent abroad are quite different across the
course levels, especially in PACE 1002/1022 and PACE 1004.
For those in PACE 1002/1022, only four students had spent time abroad and they had
slightly higher average scores. For PACE 1004, the groups were more evenly distributed, but
still more than three times as many students had not spent time abroad as those who had. For
PACE 1004, students who had spent time abroad had higher scores: 0.08 higher in LTP, 0.18
higher in RTP, and 0.15 higher in OPIc. For the PACE 3XXX participants, the proficiency of
students who had spent time abroad was 0.19 higher for listening, 0.07 higher for reading, and
0.13 higher for speaking. Additionally, the number of participants in the 3XXX course level
were more evenly distributed than the lower two PACE levels. Lastly, the PACE Certificate
participants had all spent time abroad at one point, thus no comparison could be made between
these participants.
III. Language Practices
The final section of the survey asked students to describe their current language practices
outside of the target language classroom. The survey presented a slider scale that respondents
could adjust to reflect their language practices, from 1 (Rarely or Never) to 3 (Sometimes) to
5(Often). To best represent responses, averages were calculated based on the number selected, so
that an average of “1” corresponds to “rarely or never.” Table 18 shows the rates of language
practices across all languages by course level.

35 | P a g e
University of Minnesota
Language Proficiency Evaluation Report
Fall Semester 2014
Table 18. Rates of language practice outside class
Contexts for language use
outside of class (N=305)
PACE
1002/
1022
(N=70)
PACE
1004
(N=129)
PACE
3XXX
(N=101)
PACE
Cert
(N=5)
Total
(N=305)
Listening to news broadcasts,
podcasts, or music
1.63 2.09 2.30 3.00 2.07
Watching visual media:
YouTube, TV, or movies
1.74 2.01 2.13 3.00 2.00
Reading books, newspapers, or
magazines (could be online)
1.57 1.60 2.22 2.80 1.82
Writing emails, texts, blogs, or
online discussion posts
1.41 1.60 1.76 3.40 1.64
Engaging in social media:
Facebook, Twitter, etc.
1.20 1.47 1.58 3.40 1.48
Talking with friends and family 1.46 1.64 1.74 2.60 1.65
Interacting with people who share
my academic or personal interests
(in person, at events, online)
1.43 1.72 1.81 2.40 1.70
Interacting with instructors and
fellow students
2.29 2.20 2.35 2.00 2.27
Participating in organized
language events (clubs, coffee
hour, etc.)
1.07 1.26 1.31 1.80 1.24
At my job 1.29 1.23 1.34 3.00 1.31
In religious contexts 1.04 1.08 1.05 1.20 1.06
Communicating with an assigned
conversation (TandemPlus, etc.)
partner
1.63 1.66 1.39 1.60 1.56
Playing games online 1.10 1.14 1.09 1.20 1.11
In addition to asking students about their individual activities in the target language, the
survey asked students about the total number of hours they use the target language outside of
class. Table 19, Table 20, and Table 21 show the LTP, RTP, and OPIc ratings, respectively, in
relation to the number of contact hours outside of the classroom.

36 | P a g e
University of Minnesota
Language Proficiency Evaluation Report
Fall Semester 2014
Table 19. LTP ratings by course level and language use
0-1 hours 1-3 hours 3-5 hours 5-8 hours 8+ hours
LTP N-size LTP N-size LTP N-size LTP N-size LTP N-size
PACE
1002/1022
0.79 28 0.68 17 0.68 4 0.78 5 0.10 1
PACE
1004
1.09 45 1.18 34 1.17 9 1.30 2 0.80 1
PACE
3XXX
1.77 53 1.82 20 1.61 9 1.70 2 2.20 2
PACE
Cert
- 0 2.30 2 2.2 2 - 0 2.30 1
Total -- 126 -- 73 -- 24 -- 9 -- 5
Table 20. RTP ratings by course level and language use
0-1 hours 1-3 hours 3-5 hours 5-8 hours 8+ hours
RTP N-size RTP N-size RTP N-size RTP N-size RTP N-size
PACE
1002/1022
1.13 38 1.09 20 1.18 5 0.95 6 0.80 1
PACE
1004
1.47 61 1.52 44 1.51 10 1.90 3 1.10 1
PACE
3XXX
1.97 58 2.06 24 2.10 10 2.20 2 2.30 2
PACE
Cert
- 0 2.30 2 2.30 2 - 0 2.30 1
Total -- 157 -- 90 -- 27 -- 11 -- 5
Table 21. OPIc ratings by course level and language use
0-1 hours 1-3 hours 3-5 hours 5-8 hours 8+ hours
OPIc N-size OPIc N-size OPIc N-size OPIc N-size OPIc N-size
PACE
1002/1022
1.06 38 1.06 20 1.08 5 1.05 6 0.80 1
PACE
1004
1.27 69 1.29 45 1.39 10 1.47 3 1.10 1
PACE
3XXX
1.49 60 1.49 23 1.58 10 1.55 2 2.45 2
PACE
Cert
- 0 1.06 2 2.10 1 - 0 2.30 1
Total -- 167 -- 90 -- 26 -- 11 -- 5

37 | P a g e
University of Minnesota
Language Proficiency Evaluation Report
Fall Semester 2014
Table 19, Table 20, and Table 21 do not show a consistent pattern of proficiency ratings
as students’ self-reported language contact increases.
IV. Motivation
The last section of the report asked students to select and rank their top three reasons to
learn the target language. Table 22 shows the number of students who cited a particular reason as
their first, second, or third reason, respectively, for pursuing study of that language.
Table 22. Top motivating factors selected for learning the target language
Motivating factor
Rank
Total 1 2 3
Expand my cultural knowledge 49 86 57 192
Complete graduation requirement 116 15 18 149
Travel 33 64 50 147
I like languages 40 47 58 145
Professional reasons 29 44 25 98
Prepare for, or to complete, study abroad 19 19 28 66
Communicate with relatives / friends 5 9 22 36
Access information for academic reasons 9 10 11 30
Access information for personal reasons 3 6 12 21
Widen my social circle 2 3 13 18
Table 22 shows that the motivating factor most often ranked as most important was to
complete a graduation requirement, with 62.7% of the first rank responses. Around half of
respondents (48.7%) also listed expansion of cultural knowledge as a top motivating factor,
although only 49 listed it as their top factor.

38 | P a g e
University of Minnesota
Language Proficiency Evaluation Report
Fall Semester 2014
Table 23 displays the mean proficiency ratings by first ranked motivating factor.
Table 23. Proficiency levels by top motivating factors
Top motivating factor LTP (N-size) RTP (N-size) OPIc (N-size)
Complete graduation requirement 0.88 (N=84) 1.25 (N=109) 1.14 (N=115)
Expand my cultural knowledge 1.54 (N=36) 1.83 (N=46) 1.44 (N=47)
I like languages. 1.55 (N=37) 1.88 (N=39) 1.52 (N=39)
Travel 1.28 (N=24) 1.63 (N=31) 1.35 (N=33)
Professional reasons 1.77 (N=27) 1.98 (N=29) 1.58 (N=28)
Prepare for or to complete study abroad 1.39 (N=15) 1.63 (N=17) 1.28 (N=18)
Access information for academic reasons 1.57 (N=6) 1.69 (N=9) 1.47 (N=9)
Communicate with relatives/friends 1.43 (N=4) 1.52 (N=5) 1.36 (N=5)
Access information for personal reasons 1.40 (N=3) 1.67 (N=3) 1.47 (N=3)
Widen my social circle 1.30 (N=1) 1.55 (N=2) 1.05 (N=2)
The top two categories most frequently selected by students were graduation
requirements and expansion of cultural knowledge. Table 24 displays the proficiency level by
these top two choices of motivating factors (graduation requirement and expand cultural
knowledge), by course level and language.
Table 24. Proficiency levels by top choice of motivation, course level, and language
Course
level
Graduation Requirement Expand Cultural knowledge
Language
LTP
(N-size)
RTP
(N-size)
OPIc
(N-size)
LTP
(N-size)
RTP
(N-size)
OPIc
(N-size)
PACE
1002/
1022
Spanish 0.86 (36) 1.12 (36) 1.11 (36) 1.1 (1) 1.1 (1) 1.1 (1)
French 0.66 (5) 1.08 (15) 1.03 (15) - - -
PACE
1004
Spanish 1.03 (17) 1.07 (23) 1.07 (23) 0.80 (1) 1.30 (1) 1.30 (1)
German 0.93 (10) 1.41 (13) 1.29 (19) 1.28 (4) 1.52 (6) 1.27 (6)
French 1.04 (12) 1.36 (18) 1.20 (18) 1.06 (5) 1.60 (7) 1.41 (8)
PACE
3XXX
Spanish 1.20 (1) 2.10 (1) 1.55 (1) 1.91 (15) 2.09 (17) 1.61 (16)
German 1.65 (1) 2.03 (1) 1.55 (1) 1.70 (2) 1.30 (1) 1.30 (2)
French - - - 1.30 (2) 1.97 (6) 1.24 (7)
Portuguese 2.10 (2) 1.80 (2) 1.80 (2) 1.08 (4) 1.62 (5) 1.40 (5)
PACE
Cert Spanish - - - 2.20 (2) 2.30 (2) 2.30 (1)
Total N-size 84 109 115 36 46 47

39 | P a g e
University of Minnesota
Language Proficiency Evaluation Report
Fall Semester 2014
These data show no meaningful differences between the two categories; however, what is
shown by the data is that students at the lower levels are more often motivated by graduation
requirements than expanding cultural knowledge.
Finally, the motivation section asked students to rank the amount of effort they are
putting into their language class, on a sliding scale from 1 to 10, with 1 being very little and 10
being an extraordinary amount. Figure 28 visually represents the average proficiency levels by
level of effort.
Figure 28. Proficiency ratings by level of effort
Note in Figure 28 that the two respondents who evaluated their own level of effort as 2
both had LTPs that could not be rated, which is why the average rating for LTP is not indicated;
the Ns shown in Figure 28 reflect everyone in each category, not the number of ratable tests for
those students. All other unratable scores are also not included in averages. Figure 28 shows that
most respondents rated their level of effort between 4 and 8, and these levels of effort with robust
response rates have generally similar proficiency averages. Outliers at the ends of the spectrum
are likely attributable to low sample size. Closer examination of the levels of effort by course
level revealed a similar pattern.

40 | P a g e
University of Minnesota
Language Proficiency Evaluation Report
Fall Semester 2014
RQ 4: Are there correlations between self-assessments and actual ratings?
Participants completed self-assessments for listening, reading, and speaking. These
consisted of “can do” statements for which students indicated their level of ability on a four-
point scale:
I can seldom do this, or I can't do it yet.
I can do this some of the time.
I can do this most of the time.
I can do this almost always, or always.
For listening and reading, there were two different levels of the self-assessment: one level
was given to students in the 1002/1022-course level, and the other was given to all other
students. For speaking, there were three self-assessments, one for students in 1002/1022, one for
students in 1004, and another for students in 3XXX courses. There were no self-assessment
responses for the Spanish Certificate participants.
Self-assessments were specifically tied to individual proficiency levels, so that possible
ratings were limited for each, as seen in Table 25.
Table 25. Self-assessment ranges by level
Lowest rating Highest rating
Level 1 Novice High Intermediate Mid
Level 2 Intermediate Low Intermediate High
Level 3 Intermediate Mid Advanced Low
I. Listening
For listening skills, students took one of two levels of self-assessment. Level one had a
range of Novice High to Intermediate Mid, but some participants’ results placed themselves
above that range. These participants’ self-assessment scores are labeled above range (AR). The
tables presenting the results of these comparisons are color-coded to indicate if there was a
match (green) between the self-assessment and the test score, a one-level difference (yellow), or
a two-level or more difference (red). Cells in which a relationship between the self-assessment
and test score cannot be classified due to unanalyzable data are shaded grey. Table 26 and
Table 27 show the results of the listening self-assessments in relation to the LTP ratings.
Table 26 shows the results of the level 1 self-assessments for listening in relationship to
the examinees’ LTP ratings. For the level 1 self-assessments, no students self-assessed their
proficiency as lower than their actual proficiency.
41 | P a g e
University of Minnesota
Language Proficiency Evaluation Report
Fall Semester 2014
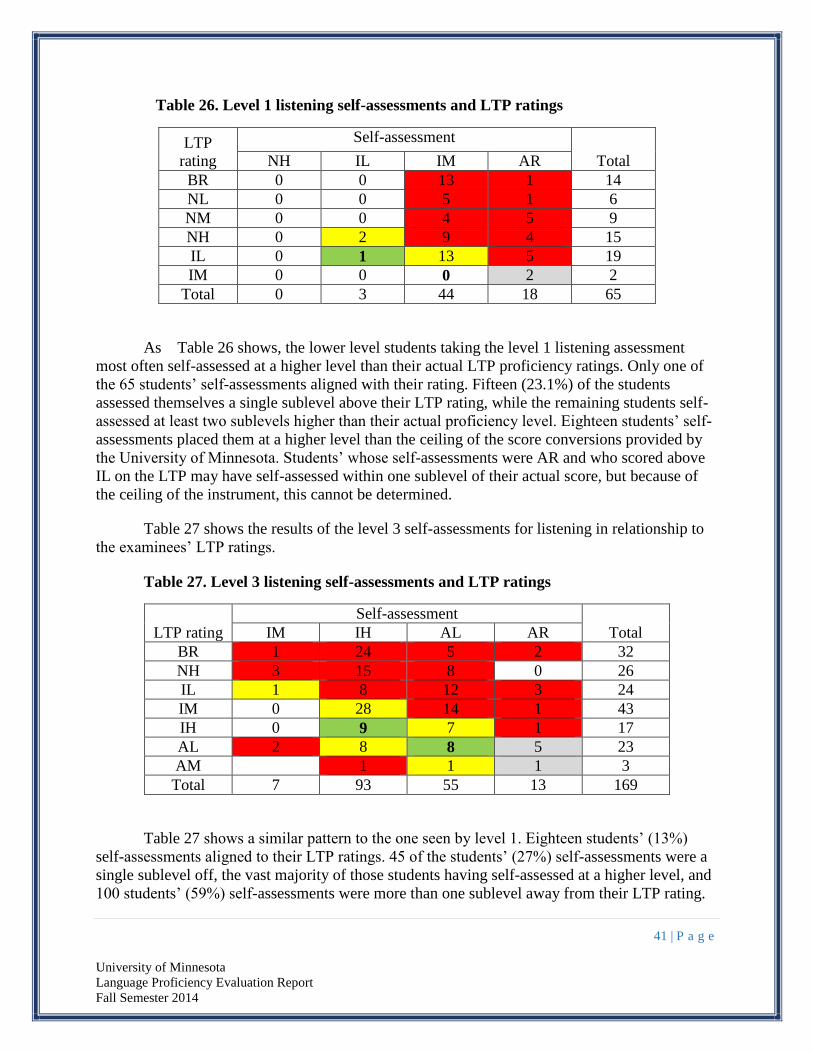
Table 26. Level 1 listening self-assessments and LTP ratings
LTP
rating
Self-assessment
Total NH IL IM AR
BR 0 0 13 1 14
NL 0 0 5 1 6
NM 0 0 4 5 9
NH 0 2 9 4 15
IL 0 1 13 5 19
IM 0 0 0 2 2
Total 0 3 44 18 65
As Table 26 shows, the lower level students taking the level 1 listening assessment
most often self-assessed at a higher level than their actual LTP proficiency ratings. Only one of
the 65 students’ self-assessments aligned with their rating. Fifteen (23.1%) of the students
assessed themselves a single sublevel above their LTP rating, while the remaining students self-
assessed at least two sublevels higher than their actual proficiency level. Eighteen students’ self-
assessments placed them at a higher level than the ceiling of the score conversions provided by
the University of Minnesota. Students’ whose self-assessments were AR and who scored above
IL on the LTP may have self-assessed within one sublevel of their actual score, but because of
the ceiling of the instrument, this cannot be determined.
Table 27 shows the results of the level 3 self-assessments for listening in relationship to
the examinees’ LTP ratings.
Table 27. Level 3 listening self-assessments and LTP ratings
LTP rating
Self-assessment
Total IM IH AL AR
BR 1 24 5 2 32
NH 3 15 8 0 26
IL 1 8 12 3 24
IM 0 28 14 1 43
IH 0 9 7 1 17
AL 2 8 8 5 23
AM 1 1 1 3
Total 7 93 55 13 169
Table 27 shows a similar pattern to the one seen by level 1. Eighteen students’ (13%)
self-assessments aligned to their LTP ratings. 45 of the students’ (27%) self-assessments were a
single sublevel off, the vast majority of those students having self-assessed at a higher level, and
100 students’ (59%) self-assessments were more than one sublevel away from their LTP rating.
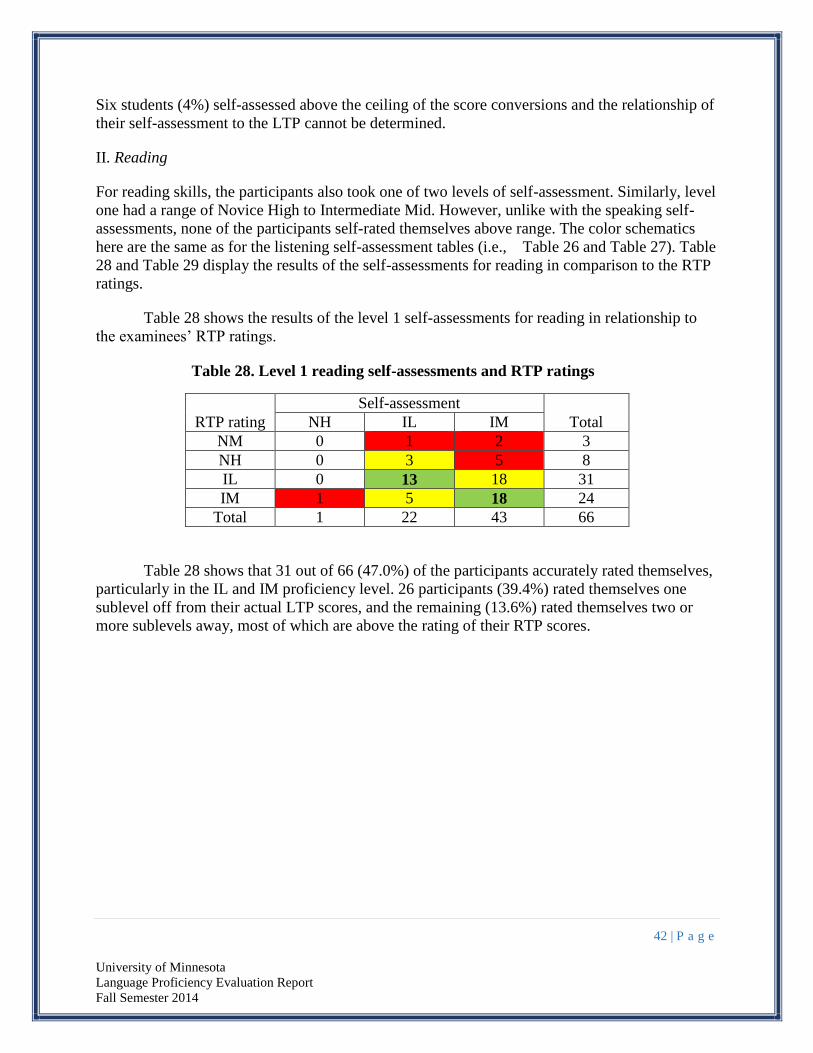
42 | P a g e
University of Minnesota
Language Proficiency Evaluation Report
Fall Semester 2014
Six students (4%) self-assessed above the ceiling of the score conversions and the relationship of
their self-assessment to the LTP cannot be determined.
II. Reading
For reading skills, the participants also took one of two levels of self-assessment. Similarly, level
one had a range of Novice High to Intermediate Mid. However, unlike with the speaking self-
assessments, none of the participants self-rated themselves above range. The color schematics
here are the same as for the listening self-assessment tables (i.e., Table 26 and Table 27). Table
28 and Table 29 display the results of the self-assessments for reading in comparison to the RTP
ratings.
Table 28 shows the results of the level 1 self-assessments for reading in relationship to
the examinees’ RTP ratings.
Table 28. Level 1 reading self-assessments and RTP ratings
Table 28 shows that 31 out of 66 (47.0%) of the participants accurately rated themselves,
particularly in the IL and IM proficiency level. 26 participants (39.4%) rated themselves one
sublevel off from their actual LTP scores, and the remaining (13.6%) rated themselves two or
more sublevels away, most of which are above the rating of their RTP scores.
RTP rating
Self-assessment
Total NH IL IM
NM 0 1 2 3
NH 0 3 5 8
IL 0 13 18 31
IM 1 5 18 24
Total 1 22 43 66

43 | P a g e
University of Minnesota
Language Proficiency Evaluation Report
Fall Semester 2014
Table 29 shows the results of the level 3 self-assessments for reading in relationship to the
examinees’ RTP ratings.

44 | P a g e
University of Minnesota
Language Proficiency Evaluation Report
Fall Semester 2014
Table 29. Level 3 reading self-assessments and RTP ratings
RTP rating
Self-assessment
Total IM IH AL
BR 1 5 0 6
NM 0 0 0 0
NH 0 5 0 5
IL 1 12 3 16
IM 1 26 15 42
IH 1 16 22 39
AL 5 15 30 50
AM 0 6 9 15
Not completed 1 0 0 1
Total 10 85 79 174
Table 29 indicates that 47 out of 173 (27.2%) of the participants rated their own reading
skills at the same proficiency level as their RTP ratings, most of who are in the IH and AL
proficiency level. A total of 74 students (42.8%) rated themselves one sublevel away from their
RTP scores, of which 49 participants (28.3%) rated above their RTP scores and 25 of them
(14.4%) under. The remaining 52 participants (30.1%) self-rated two or more sublevels from
their actual RTP proficiency scores, with the majority of them rating above their scores.
Participants who did not complete the RTP (N=1) were excluded from the analysis, thus the total
number of participants is 173 here.
III. Speaking
Participants took one of three self-assessments for their speaking skills. Level one had a
range of Novice High to Intermediate Mid; level two had a range between Intermediate Low to
Intermediate High; and lastly, level 3 had a range between Intermediate Mid to Advanced Low.
None of the participants rated themselves above range in the speaking self-assessment. Again,
the color schematics of the tables in this section are similar to the previous self-assessment
tables. Table 30, Table 31, and Table 32 display the results of the self-assessments for
speaking in relation to the OPIc ratings.
Table 30 shows the results of the level 1 self-assessments for speaking in relationship to the
examinees’ OPIc ratings.
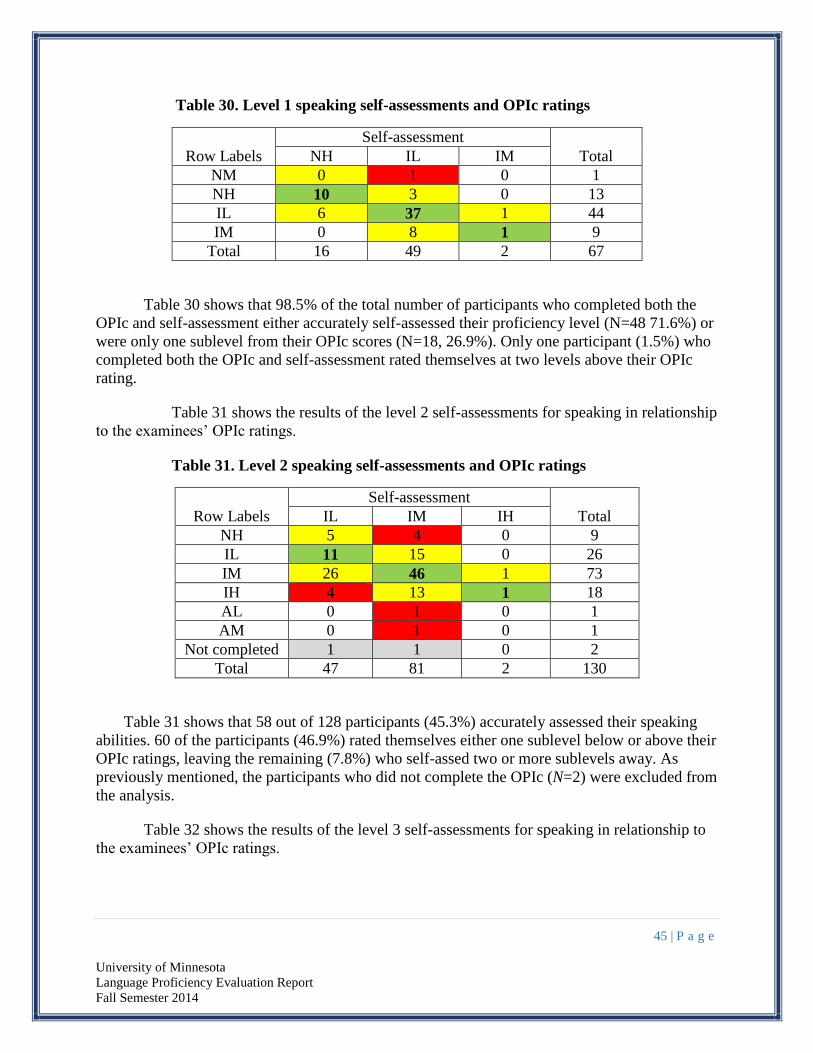
45 | P a g e
University of Minnesota
Language Proficiency Evaluation Report
Fall Semester 2014
Table 30. Level 1 speaking self-assessments and OPIc ratings
Row Labels
Self-assessment
Total NH IL IM
NM 0 1 0 1
NH 10 3 0 13
IL 6 37 1 44
IM 0 8 1 9
Total 16 49 2 67
Table 30 shows that 98.5% of the total number of participants who completed both the
OPIc and self-assessment either accurately self-assessed their proficiency level (N=48 71.6%) or
were only one sublevel from their OPIc scores (N=18, 26.9%). Only one participant (1.5%) who
completed both the OPIc and self-assessment rated themselves at two levels above their OPIc
rating.
Table 31 shows the results of the level 2 self-assessments for speaking in relationship
to the examinees’ OPIc ratings.
Table 31. Level 2 speaking self-assessments and OPIc ratings
Row Labels
Self-assessment
Total IL IM IH
NH 5 4 0 9
IL 11 15 0 26
IM 26 46 1 73
IH 4 13 1 18
AL 0 1 0 1
AM 0 1 0 1
Not completed 1 1 0 2
Total 47 81 2 130
Table 31 shows that 58 out of 128 participants (45.3%) accurately assessed their speaking
abilities. 60 of the participants (46.9%) rated themselves either one sublevel below or above their
OPIc ratings, leaving the remaining (7.8%) who self-assed two or more sublevels away. As
previously mentioned, the participants who did not complete the OPIc (N=2) were excluded from
the analysis.
Table 32 shows the results of the level 3 self-assessments for speaking in relationship to
the examinees’ OPIc ratings.
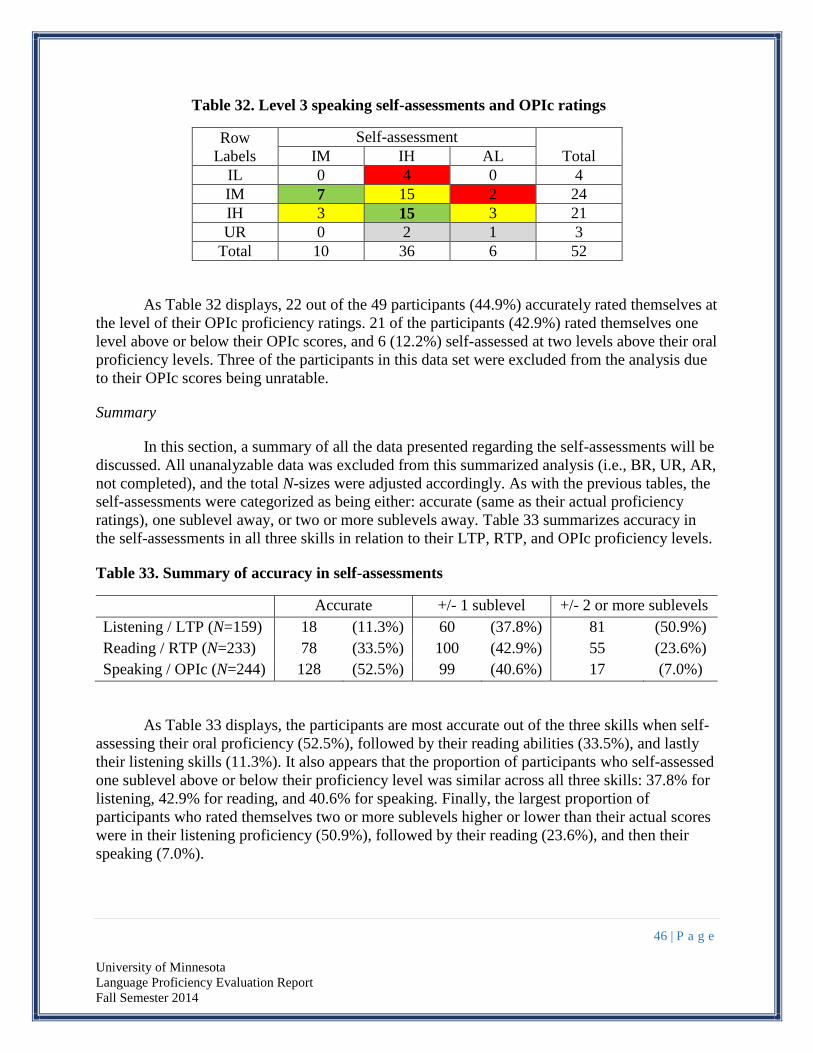
46 | P a g e
University of Minnesota
Language Proficiency Evaluation Report
Fall Semester 2014
Table 32. Level 3 speaking self-assessments and OPIc ratings
Row
Labels
Self-assessment
Total IM IH AL
IL 0 4 0 4
IM 7 15 2 24
IH 3 15 3 21
UR 0 2 1 3
Total 10 36 6 52
As Table 32 displays, 22 out of the 49 participants (44.9%) accurately rated themselves at
the level of their OPIc proficiency ratings. 21 of the participants (42.9%) rated themselves one
level above or below their OPIc scores, and 6 (12.2%) self-assessed at two levels above their oral
proficiency levels. Three of the participants in this data set were excluded from the analysis due
to their OPIc scores being unratable.
Summary
In this section, a summary of all the data presented regarding the self-assessments will be
discussed. All unanalyzable data was excluded from this summarized analysis (i.e., BR, UR, AR,
not completed), and the total N-sizes were adjusted accordingly. As with the previous tables, the
self-assessments were categorized as being either: accurate (same as their actual proficiency
ratings), one sublevel away, or two or more sublevels away. Table 33 summarizes accuracy in
the self-assessments in all three skills in relation to their LTP, RTP, and OPIc proficiency levels.
Table 33. Summary of accuracy in self-assessments
Accurate +/- 1 sublevel +/- 2 or more sublevels
Listening / LTP (N=159) 18 (11.3%) 60 (37.8%) 81 (50.9%)
Reading / RTP (N=233) 78 (33.5%) 100 (42.9%) 55 (23.6%)
Speaking / OPIc (N=244) 128 (52.5%) 99 (40.6%) 17 (7.0%)
As Table 33 displays, the participants are most accurate out of the three skills when self-
assessing their oral proficiency (52.5%), followed by their reading abilities (33.5%), and lastly
their listening skills (11.3%). It also appears that the proportion of participants who self-assessed
one sublevel above or below their proficiency level was similar across all three skills: 37.8% for
listening, 42.9% for reading, and 40.6% for speaking. Finally, the largest proportion of
participants who rated themselves two or more sublevels higher or lower than their actual scores
were in their listening proficiency (50.9%), followed by their reading (23.6%), and then their
speaking (7.0%).
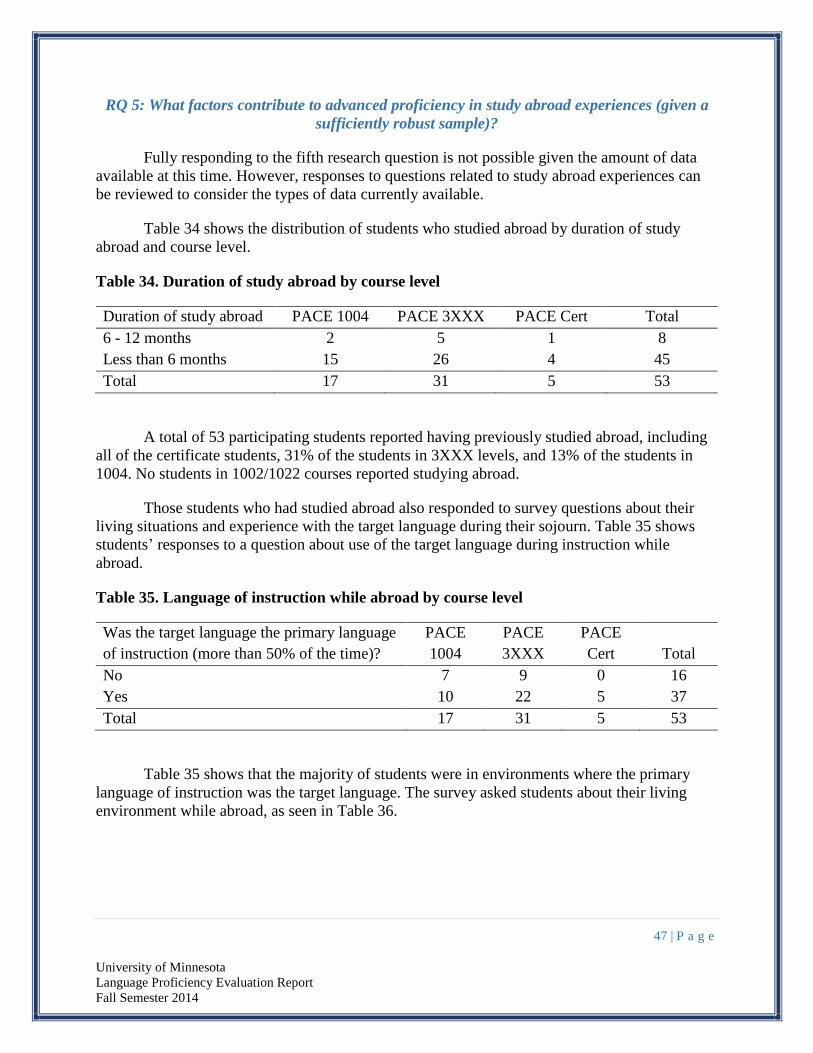
47 | P a g e
University of Minnesota
Language Proficiency Evaluation Report
Fall Semester 2014
RQ 5: What factors contribute to advanced proficiency in study abroad experiences (given a
sufficiently robust sample)?
Fully responding to the fifth research question is not possible given the amount of data
available at this time. However, responses to questions related to study abroad experiences can
be reviewed to consider the types of data currently available.
Table 34 shows the distribution of students who studied abroad by duration of study
abroad and course level.
Table 34. Duration of study abroad by course level
Duration of study abroad PACE 1004 PACE 3XXX PACE Cert Total
6 - 12 months 2 5 1 8
Less than 6 months 15 26 4 45
Total 17 31 5 53
A total of 53 participating students reported having previously studied abroad, including
all of the certificate students, 31% of the students in 3XXX levels, and 13% of the students in
1004. No students in 1002/1022 courses reported studying abroad.
Those students who had studied abroad also responded to survey questions about their
living situations and experience with the target language during their sojourn. Table 35 shows
students’ responses to a question about use of the target language during instruction while
abroad.
Table 35. Language of instruction while abroad by course level
Was the target language the primary language
of instruction (more than 50% of the time)?
PACE
1004
PACE
3XXX
PACE
Cert Total
No 7 9 0 16
Yes 10 22 5 37
Total 17 31 5 53
Table 35 shows that the majority of students were in environments where the primary
language of instruction was the target language. The survey asked students about their living
environment while abroad, as seen in Table 36.

48 | P a g e
University of Minnesota
Language Proficiency Evaluation Report
Fall Semester 2014
Table 36. Living situation while abroad by course level
Living situation PACE 1004 PACE 3XXX PACE Cert Total
Apartment with others 2 6 - 8
Dormitory 3 2 - 5
Host family 11 22 5 38
Other 1 1 - 2
Total 17 31 5 53
Table 36 shows that the majority of students lived with host families while abroad, with
only a few living in apartments, dormitories, or other housing situations. Within their living
situations, students were also asked about how often the target language was spoken at home.
Table 37 shows the amount of time the target language was spoken at home by living situation.
Table 37. Amount of time target language was used at home by living situation
<25%
25% to
50%
50% to
75%
75% to
90%
90% to
100% Total
Apartment
with others
3 1 1 2 1 8
Dormitory 3 2 - - - 5
Host family 2 3 6 4 23 38
Other 1 1 - - - 2
Total 9 7 7 6 24 53
Table 37 shows that nearly half of the students reported using the target language over
90% of the time. Students also reported how often they used the target language outside of the
living environment. Table 38 shows students’ responses about frequency of target language use
outside of home.
Table 38. Frequency of target language use outside the home
Frequency (%) Count
Less than 25% 9
25% to 50% 13
50% to 75% 17
75% to 90% 8
90% to 100% 6
Total 53

49 | P a g e
University of Minnesota
Language Proficiency Evaluation Report
Fall Semester 2014
Table 38 shows that students’ report using the target language for various amounts of
time, but over half of respondents reported using it more than 50% of the time.
At this point in data collection, cell sizes are not adequately large to make meaningful
inferences about the effect of these factors on language proficiency, but this aspect of the data
will be attended to in future reports.

50 | P a g e
University of Minnesota
Language Proficiency Evaluation Report
Fall Semester 2014
CONCLUSIONS
As this report demonstrates, the first semester of data collection for the PACE project at
the University of Minnesota resulted in establishing a database of proficiency scores and survey
responses from a total of 306 students across multiple course levels and languages. However,
because of how the students were classified across languages and course levels, cell sizes
remained somewhat small for each category of student, resulting in limitations in the analysis.
Additionally, the problem of small cell sizes was magnified by the number of students whose
proficiency tests or self-assessments were unratable. As this project continues, the cell sizes will
increase, allowing for more meaningful analysis.
In terms of the research questions, student proficiency levels were documented at each
course level. After two semesters, across languages, student proficiency was generally at the
Intermediate Low level. However, for listening proficiency and reading proficiency, many
students at this level had tests scores that could not be rated, skewing the data. After four
semesters, students’ proficiency ranged from Intermediate Low to above Intermediate Mid. After
six semesters, students’ proficiency exceeded Intermediate Mid and, for Spanish students,
approached Advanced Low. However, there was some variation between languages. For Spanish
students, there were additional students in senior seminars and pursuing certificates whose
proficiency levels were in the Advanced ranges. Finally, students in the first semester of
Portuguese for Spanish speakers had proficiency means ranging from below Intermediate Mid to
above Intermediate High, depending on the skill.
As students move through the course progressions, they generally increased in
proficiency across skills. There was only one instance where was there a decrease in proficiency
level. In the progression of French 1004 and French 3016 course levels, students’ mean speaking
scores saw a slight decrease, an issue that could be investigated further.
Survey results were challenging to analyze and compare to test results due to the small
cell sizes. Furthermore, the correlation between many survey questions’ responses and
proficiency levels can be difficult to evaluate because of confounding variables such as level and
language of study. For example, the effect of previous language study on proficiency level is
difficult to establish because a clearly confounding factor is the number of university courses in
which a student has participated, a level of analysis that further decreases cell sizes. Moreover,
consistent patterns were not observed.
The self-assessment questions showed that students generally assessed themselves most
accurately in speaking, with the least accuracy in listening. However, these results are difficult to
analyze due to the quantity of data that has to be excluded, which comes from unanalyzable test
ratings and self-assessment ratings. Furthermore, listening was the skill with the highest
incidence of unanalyzable data.
Finally, the ability to look in depth at the effects of study abroad on proficiency was
affected by small cell sizes. While many students reported prior study abroad experience, the
level of detail collected on those experiences cannot provide much illumination to the factors that
51 | P a g e
University of Minnesota
Language Proficiency Evaluation Report
Fall Semester 2014
contribute to language learning. Students indicated the length of study abroad in large increments
with the smallest increment identified as less than six months, a timeframe that could encompass
many models of study abroad. The great majority of respondents who had studied abroad
indicated this duration. Future data collection will expand these cell sizes to allow for more
meaningful comparisons.
52 | P a g e
University of Minnesota
Language Proficiency Evaluation Report
Fall Semester 2014
REFERENCES
American Council on the Teaching of Foreign Languages. (2012). ACTFL Proficiency
Guidelines 2012. Alexandria, VA: Author.
Dandonoli, P. & Henning, G. (1990). An investigation of the construct validity of the ACTFL
proficiency guidelines and oral interview procedure. Foreign Language Annals, 23(1),
11-22.
National Education Security Program. The Language Flagship. Retrieved from:
http://www.nsep.gov/content/language-flagship. 31 July 2015.
Vande Berg, M., Connor-Linton, J., & Paige, J. M. (2009). The Georgetown Consortium Project:
Interventions for student learning abroad. Frontiers: The Interdisciplinary Journal of
Study Abroad, 18, 1-75.