Embed Size (px)
Citation preview

Agricultural Markets & PolicyUniversity of Missouri
Projections for Agricultural and Biofuel Markets
March 2018
FAPRI-MU Report #01-18
Division of Applied Social Sciences
fapri.missouri.edu — amap.missouri.edu
U.S. Baseline Outlook
Published by the Food and Agricultural Policy Research Institute (FAPRI) at the University of Missouri (MU), 101 Park DeVille Drive, Suite E; Columbia, MO 65203. FAPRI–MU is part of the Division of Applied Social Sciences (DASS) in the College of Agriculture, Food and Natural Resources (CAFNR).
www.fapri.missouri.edu This material is based upon work supported by the U.S. Department of Agriculture, under Agreement No. 58-0111-17-015, and the USDA National Institute of Food and Agriculture, Hatch project number MO-HASS0024. Any opinion, findings, conclusions, or recommendations expressed in this publication are those of the authors and do not necessarily reflect the view of the U.S. Department of Agriculture nor the University of Missouri. The crop, biofuel, government cost and farm income projections in this report were prepared by the team at FAPRI-MU, including Pat Westhoff ([email protected]), Scott Gerlt ([email protected]), Jarrett Whistance ([email protected]), Julian Binfield ([email protected]), Sera Chiuchiarelli ([email protected]), Deepayan Debnath ([email protected]), Hoa Hoang ([email protected]), Byung Min Soon ([email protected]), and Wyatt Thompson ([email protected]). The livestock, poultry, dairy and consumer price projections were prepared by the MU Agricultural Markets and Policy (AMAP) team, including Scott Brown ([email protected]) and Daniel Madison ([email protected]). FAPRI-MU and AMAP are both part of the Integrated Policy Group in the MU Division of Applied Social Sciences. U.S. crop trade figures reported here were prepared with the help of Mike Helmar ([email protected]) and Malieka Landis ([email protected]) at the University of Nevada, Reno, Eric Wailes ([email protected]) and Eddie C. Chavez ([email protected]) at the University of Arkansas and Darren Hudson ([email protected]) at Texas Tech University. The Agricultural and Food Policy Center at Texas A&M University will prepare a companion set of estimates of the farm-level impacts of these projections (www.afpc.tamu.edu). The authors would like to thank participants in a workshop reviewing a preliminary version of these estimates in Washington, D.C., in December 2017. Any remaining errors are those of the authors. Permission is granted to reproduce this information with appropriate attribution to the authors and FAPRI-MU.
The University of Missouri does not discriminate on the basis of race, color, religion, national origin, sex, sexual orientation, gender identity, age, genetics information, disability or status as a protected veteran. For more information, call Human Resource Services at 573-882-4256 or the US Department of Education, Office of Civil Rights.
Table
s
Summary....................................................................................2 . Grains .......................................................................................15 . Oilseeds....................................................................................29 . Other crops..............................................................................37 . Biofuels....................................................................................47 . Livestock and dairy.................................................................53 . Aggregate indicators...............................................................61

FAPRI-MU AMAP | 2018 U.S. Baseline
2
Summary
Net farm income is projected to remain around $60 billion for the third straight year in 2018, roughly half the record
level reached in 2013. A modest increase in prices for some major crops results in slightly higher farm income in 2019.
These baseline projections for agricultural and biofuel markets were prepared using market information available in Janu-
ary 2018. Macroeconomic assumptions are based primarily on forecasts by IHS Markit, which suggest moderate growth in
the U.S. and global economies. The baseline incorporates 2014 farm bill provisions and assumes a continuation of current
policies. Except for dairy, it does not incorporate provisions of the Bipartisan Budget Act, approved in February 2018.
Commodity markets will continue to be volatile. We use our models to develop a range of projected market outcomes that
takes into account some major sources of uncertainty about future supply and demand conditions. In some of the resulting
500 outcomes, prices, quantities and values are much higher or much lower than the averages reported here.
Some key results:
A fifth straight year of global grain and oilseed yields above the long-term trend has made it difficult for crop pric-es to recover in the 2017/18 marketing year.
Projected prices for corn, soybeans and wheat all increase slightly in 2018/19 and 2019/20, but large global stocks limit the increase. Corn prices average $3.57 per bushel for the 2018/19 crop, while soybean prices average $9.38 and wheat prices average $4.89.
In contrast to most other crops, projected upland cotton and rice prices decline in 2018/19. Cotton prices fall be-cause of large carryover stocks from the 2017 crop and another year of upland cotton plantings in excess of 12 mil-lion acres. Rice prices fall on a rebound in rice acreage and production.
Strong demand supported cattle, hog, chicken and milk prices in 2017 in the face of large increases in meat and milk production. Further production increases could weigh on livestock and dairy prices in 2018 unless demand growth is excep-tionally strong.
All commodity markets remain sensitive to the health of the global economy and trade relationships. The baseline does not assume any major trade disruptions nor any new agreements that would encourage U.S. exports.
Projected net farm income increases slightly in 2019. In later years, real net farm income is fairly flat, remaining below the 2015 level through 2027.
Net farm income is much lower relative to farm debt than the 1995-2014 average. The baseline suggests continued pressure on farm finances.
Agriculture Risk Coverage (ARC) payments are expected to decline rapidly. More farmers are assumed to choose Price Loss Coverage (PLC) in 2019 if current program rules are extended by a new farm bill and producers are allowed to make a new election.
Crop insurance net outlays are projected to average more than $8 billion per year for fiscal years 2019-2027. Major commodity program outlays average a little over $6 billion per year over the same period.
Annual food price inflation was below 1 percent for the second straight year in 2017. Projected food price inflation is
about 2 percent in 2018, similar to the overall rate of inflation in the U.S. economy.

FAPRI-MU AMAP | 2018 U.S. Baseline
3
Key results
2014/15-2016/17 2019/20-2027/28
Marketing year average 2017/18 2018/19 average
Crop prices Corn farm price, dollars per bushel 3.56 3.23 3.57 3.71
Soybean farm price, dollars per bushel 9.51 9.23 9.38 9.55
Wheat farm price, dollars per bushel 4.92 4.68 4.89 4.95
Upland cotton farm price, cents per pound 63.5 68.8 64.3 69.7
Crop area planted, million acres
Corn 90.9 90.2 89.7 91.4
Soybeans 83.1 90.1 90.0 88.0
Wheat 54.0 46.0 47.2 46.9
Upland cotton 9.7 12.4 12.1 11.7
12 major crops* 259.4 257.1 258.8 257.3
2014-2016 2019-2027
Calendar year except as noted average 2017 2018 average
Livestock sector prices Fed steers, 5-area direct, dollars per cwt 141.18 121.52 115.25 120.27
Barrows and gilts, 51-52% lean, dollars per cwt 57.47 50.48 48.40 50.43
National wholesale broiler, cents per pound 93.24 93.51 89.06 93.87
All milk, dollars per cwt 19.21 17.73 16.29 18.02
Biofuel production, billion gallons
Ethanol 14.8 15.8 15.9 15.9
Corn starch-based ethanol 14.6 15.6 15.7 15.6
Biomass-based diesel 1.6 2.2 2.5 2.6
Government outlays, billion dollars, fiscal year
Commodity Credit Corporation net outlays 9.5 10.8 11.4 9.4
Major commodity programs 4.3 7.9 8.5 6.3
CRP, disaster and all other CCC net outlays 5.2 2.9 2.9 3.1
Crop insurance net outlays 6.6 4.3 4.2 8.5
Net farm income, billion dollars 78.4 63.8 60.8 78.8
In 2017 dollars 80.6 63.8 59.7 69.2
Farm balance sheet, billion dollars
Farm assets 2,938 3,040 3,023 3,003
Farm debt 359 385 392 418
Debt/asset ratio 12.2% 12.7% 13.0% 13.9%
Annual consumer food price inflation 1.5% 0.9% 2.0% 2.5%
*Includes corn, soybeans, wheat, upland cotton, sorghum, barley, oats, rice, peanuts, sunflowers, sugarcane and sugar beets.
Note: The estimates are based on market information available in January 2018. Projections are averages across 500 outcomes.
FAPRI-MU AMAP | 2018 U.S. Baseline
4
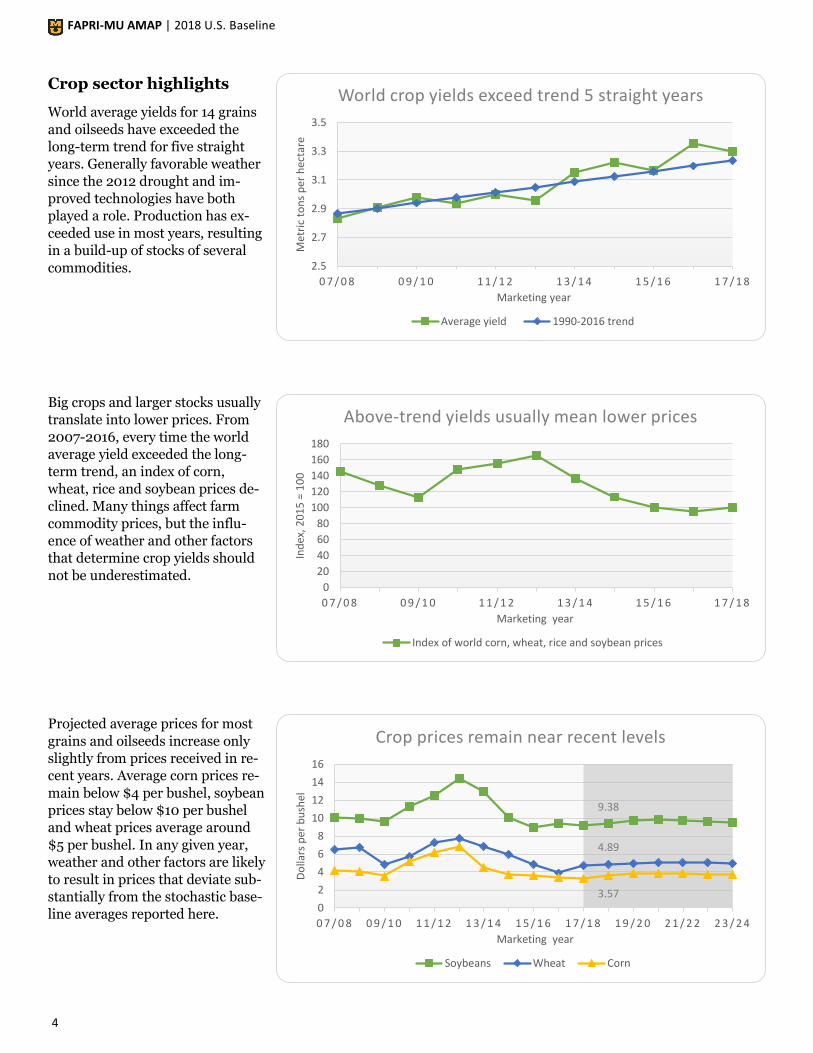
Crop sector highlights
World average yields for 14 grains
and oilseeds have exceeded the
long-term trend for five straight
years. Generally favorable weather
since the 2012 drought and im-
proved technologies have both
played a role. Production has ex-
ceeded use in most years, resulting
in a build-up of stocks of several
commodities.
Big crops and larger stocks usually
translate into lower prices. From
2007-2016, every time the world
average yield exceeded the long-
term trend, an index of corn,
wheat, rice and soybean prices de-
clined. Many things affect farm
commodity prices, but the influ-
ence of weather and other factors
that determine crop yields should
not be underestimated.
Projected average prices for most
grains and oilseeds increase only
slightly from prices received in re-
cent years. Average corn prices re-
main below $4 per bushel, soybean
prices stay below $10 per bushel
and wheat prices average around
$5 per bushel. In any given year,
weather and other factors are likely
to result in prices that deviate sub-
stantially from the stochastic base-
line averages reported here.
2.5
2.7
2.9
3.1
3.3
3.5
0 7 / 0 8 0 9 / 1 0 1 1 / 1 2 1 3 / 1 4 1 5 / 1 6 1 7 / 1 8
Met
ric
ton
s p
er h
ecta
reMarketing year
World crop yields exceed trend 5 straight years
Average yield 1990-2016 trend
9.38
4.89
3.570
2
4
6
8
10
12
14
16
0 7 / 0 8 0 9 / 1 0 1 1 / 1 2 1 3 / 1 4 1 5 / 1 6 1 7 / 1 8 1 9 / 2 0 2 1 / 2 2 2 3 / 2 4
Do
llars
per
bu
shel
Marketing year
Crop prices remain near recent levels
Soybeans Wheat Corn
0
20
40
60
80
100
120
140
160
180
0 7 / 0 8 0 9 / 1 0 1 1 / 1 2 1 3 / 1 4 1 5 / 1 6 1 7 / 1 8
Ind
ex, 2
01
5 =
10
0
Marketing year
Above-trend yields usually mean lower prices
Index of world corn, wheat, rice and soybean prices
FAPRI-MU AMAP | 2018 U.S. Baseline
5
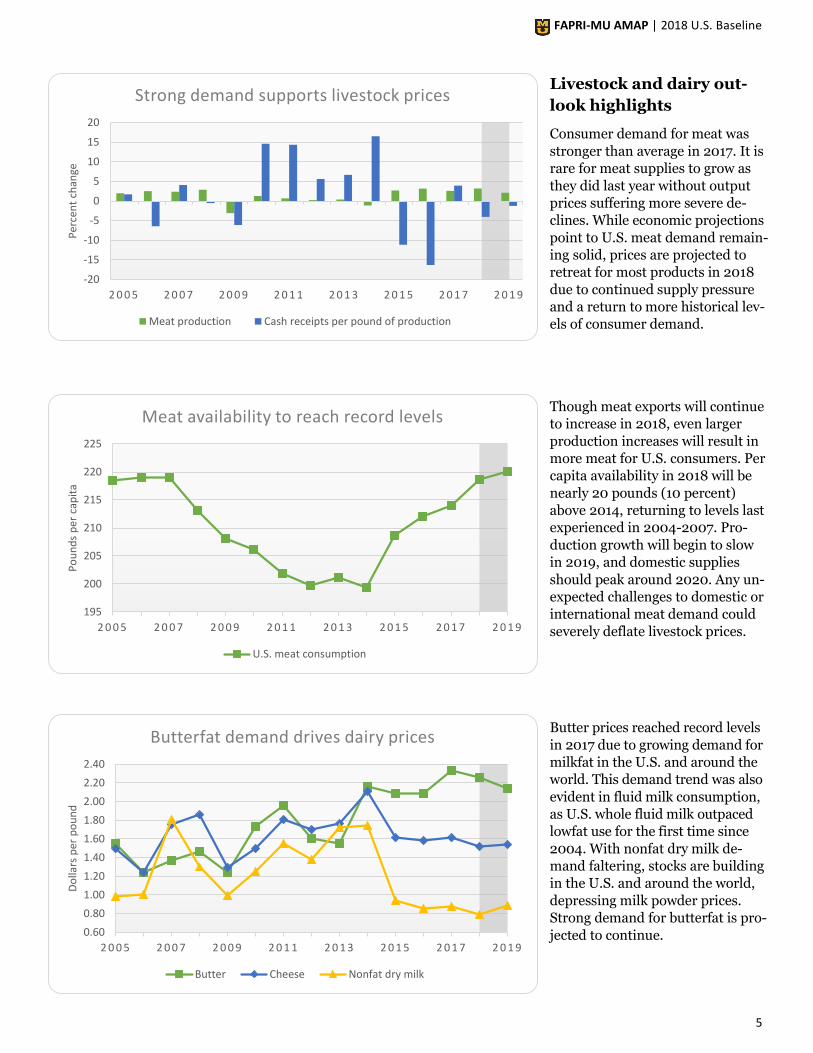
Livestock and dairy out-
look highlights
Consumer demand for meat was
stronger than average in 2017. It is
rare for meat supplies to grow as
they did last year without output
prices suffering more severe de-
clines. While economic projections
point to U.S. meat demand remain-
ing solid, prices are projected to
retreat for most products in 2018
due to continued supply pressure
and a return to more historical lev-
els of consumer demand.
Though meat exports will continue
to increase in 2018, even larger
production increases will result in
more meat for U.S. consumers. Per
capita availability in 2018 will be
nearly 20 pounds (10 percent)
above 2014, returning to levels last
experienced in 2004-2007. Pro-
duction growth will begin to slow
in 2019, and domestic supplies
should peak around 2020. Any un-
expected challenges to domestic or
international meat demand could
severely deflate livestock prices.
Butter prices reached record levels
in 2017 due to growing demand for
milkfat in the U.S. and around the
world. This demand trend was also
evident in fluid milk consumption,
as U.S. whole fluid milk outpaced
lowfat use for the first time since
2004. With nonfat dry milk de-
mand faltering, stocks are building
in the U.S. and around the world,
depressing milk powder prices.
Strong demand for butterfat is pro-
jected to continue.
-20
-15
-10
-5
0
5
10
15
20
2 0 0 5 2 0 0 7 2 0 0 9 2 0 1 1 2 0 1 3 2 0 1 5 2 0 1 7 2 0 1 9
Per
cen
t ch
ange
Strong demand supports livestock prices
Meat production Cash receipts per pound of production
195
200
205
210
215
220
225
2 0 0 5 2 0 0 7 2 0 0 9 2 0 1 1 2 0 1 3 2 0 1 5 2 0 1 7 2 0 1 9
Po
un
ds
per
cap
ita
Meat availability to reach record levels
U.S. meat consumption
0.60
0.80
1.00
1.20
1.40
1.60
1.80
2.00
2.20
2.40
2 0 0 5 2 0 0 7 2 0 0 9 2 0 1 1 2 0 1 3 2 0 1 5 2 0 1 7 2 0 1 9
Do
llars
per
po
un
d
Butterfat demand drives dairy prices
Butter Cheese Nonfat dry milk
FAPRI-MU AMAP | 2018 U.S. Baseline
6
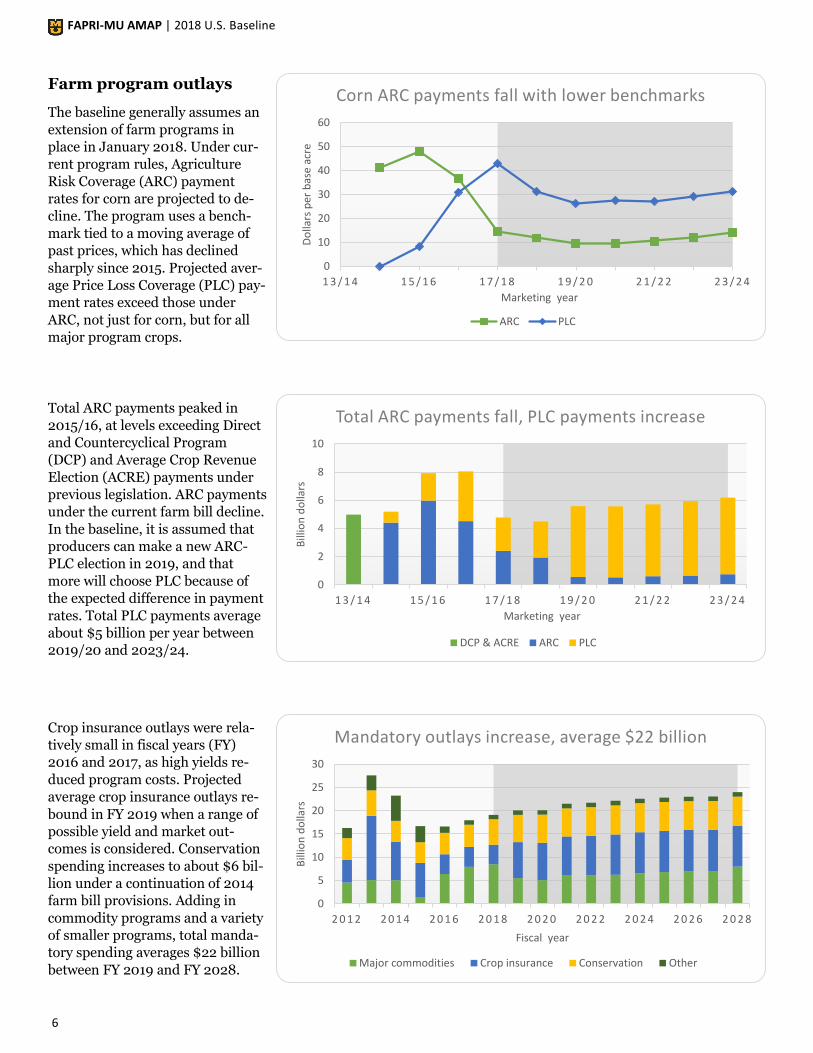
Farm program outlays
The baseline generally assumes an
extension of farm programs in
place in January 2018. Under cur-
rent program rules, Agriculture
Risk Coverage (ARC) payment
rates for corn are projected to de-
cline. The program uses a bench-
mark tied to a moving average of
past prices, which has declined
sharply since 2015. Projected aver-
age Price Loss Coverage (PLC) pay-
ment rates exceed those under
ARC, not just for corn, but for all
major program crops.
Total ARC payments peaked in
2015/16, at levels exceeding Direct
and Countercyclical Program
(DCP) and Average Crop Revenue
Election (ACRE) payments under
previous legislation. ARC payments
under the current farm bill decline.
In the baseline, it is assumed that
producers can make a new ARC-
PLC election in 2019, and that
more will choose PLC because of
the expected difference in payment
rates. Total PLC payments average
about $5 billion per year between
2019/20 and 2023/24.
Crop insurance outlays were rela-
tively small in fiscal years (FY)
2016 and 2017, as high yields re-
duced program costs. Projected
average crop insurance outlays re-
bound in FY 2019 when a range of
possible yield and market out-
comes is considered. Conservation
spending increases to about $6 bil-
lion under a continuation of 2014
farm bill provisions. Adding in
commodity programs and a variety
of smaller programs, total manda-
tory spending averages $22 billion
between FY 2019 and FY 2028.
0
2
4
6
8
10
1 3 / 1 4 1 5 / 1 6 1 7 / 1 8 1 9 / 2 0 2 1 / 2 2 2 3 / 2 4
Bill
ion
do
llars
Marketing year
Total ARC payments fall, PLC payments increase
DCP & ACRE ARC PLC
0
5
10
15
20
25
30
2 0 1 2 2 0 1 4 2 0 1 6 2 0 1 8 2 0 2 0 2 0 2 2 2 0 2 4 2 0 2 6 2 0 2 8
Bill
ion
do
llars
Fiscal year
Mandatory outlays increase, average $22 billion
Major commodities Crop insurance Conservation Other
0
10
20
30
40
50
60
1 3 / 1 4 1 5 / 1 6 1 7 / 1 8 1 9 / 2 0 2 1 / 2 2 2 3 / 2 4
Do
llars
per
bas
e ac
reMarketing year
Corn ARC payments fall with lower benchmarks
ARC PLC
FAPRI-MU AMAP | 2018 U.S. Baseline
7
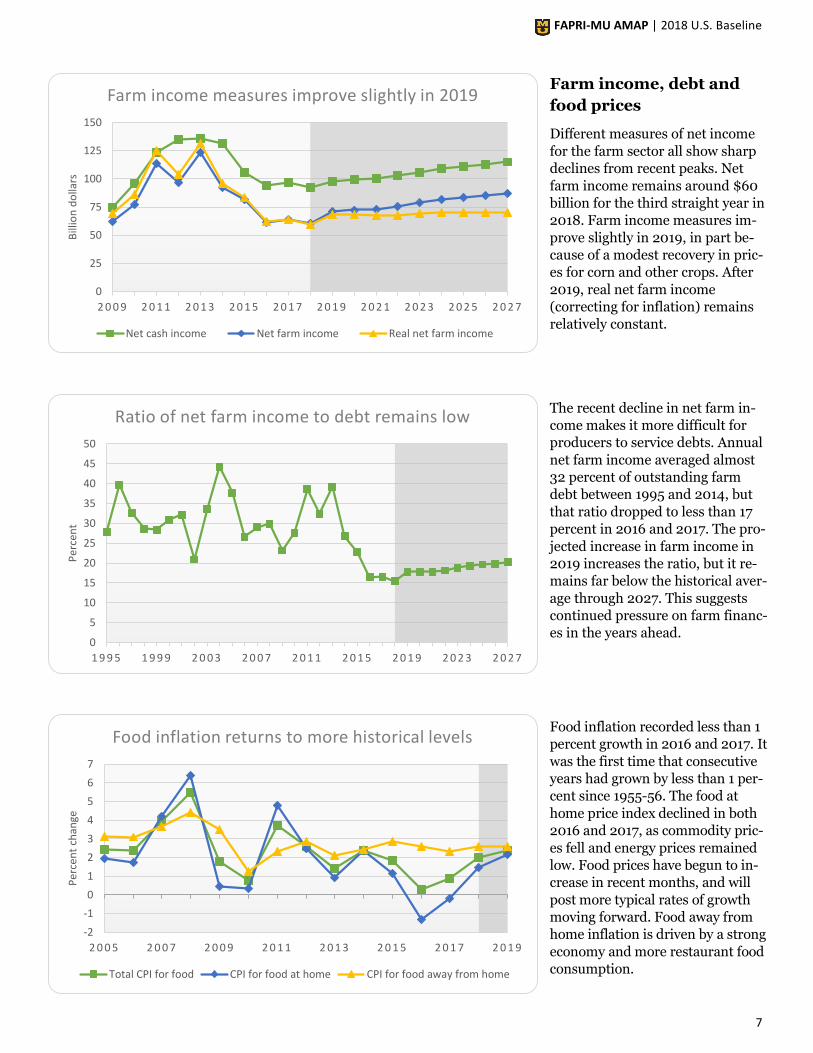
Farm income, debt and
food prices
Different measures of net income
for the farm sector all show sharp
declines from recent peaks. Net
farm income remains around $60
billion for the third straight year in
2018. Farm income measures im-
prove slightly in 2019, in part be-
cause of a modest recovery in pric-
es for corn and other crops. After
2019, real net farm income
(correcting for inflation) remains
relatively constant.
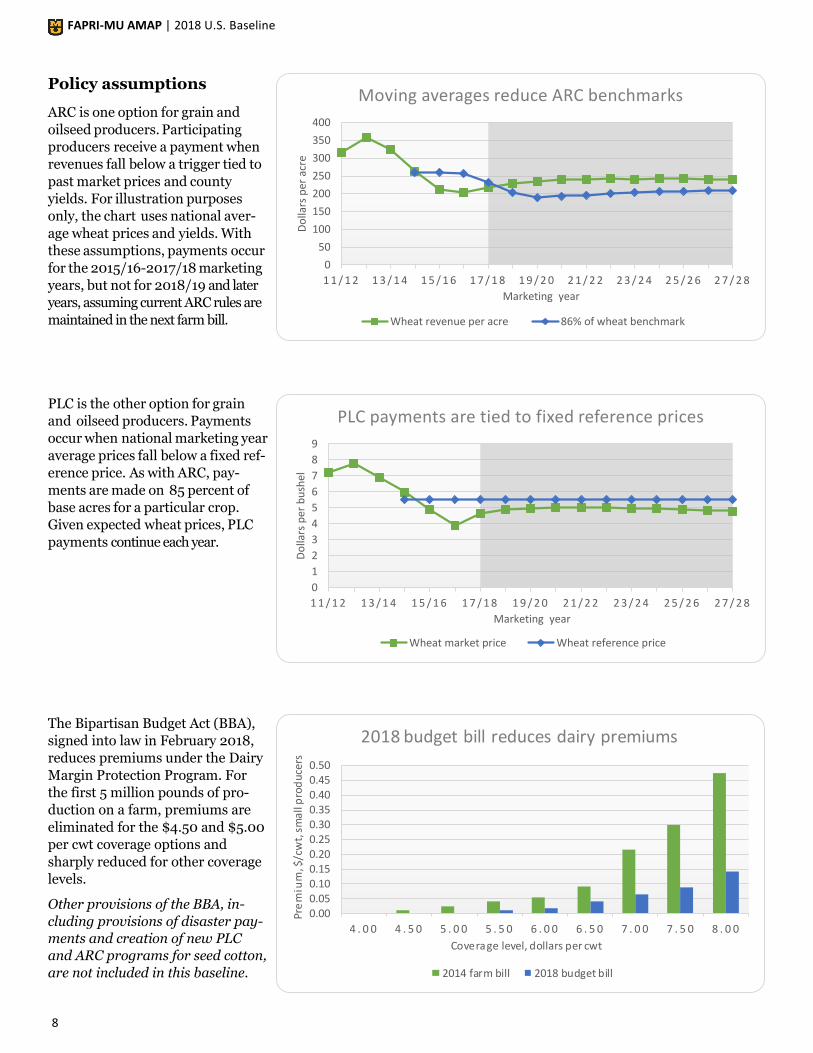
The recent decline in net farm in-
come makes it more difficult for
producers to service debts. Annual
net farm income averaged almost
32 percent of outstanding farm
debt between 1995 and 2014, but
that ratio dropped to less than 17
percent in 2016 and 2017. The pro-
jected increase in farm income in
2019 increases the ratio, but it re-
mains far below the historical aver-
age through 2027. This suggests
continued pressure on farm financ-
es in the years ahead.
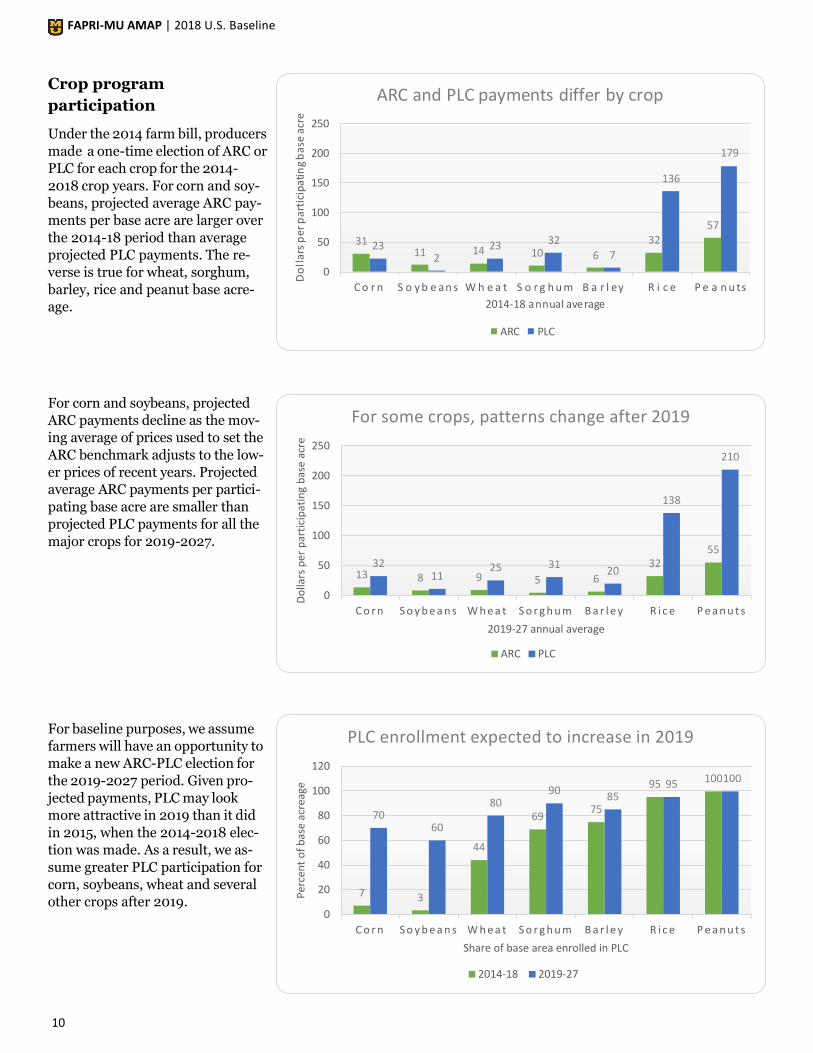
Food inflation recorded less than 1
percent growth in 2016 and 2017. It
was the first time that consecutive
years had grown by less than 1 per-
cent since 1955-56. The food at
home price index declined in both
2016 and 2017, as commodity pric-
es fell and energy prices remained
low. Food prices have begun to in-
crease in recent months, and will
post more typical rates of growth
moving forward. Food away from
home inflation is driven by a strong
economy and more restaurant food
consumption.
0
5
10
15
20
25
30
35
40
45
50
1 9 9 5 1 9 9 9 2 0 0 3 2 0 0 7 2 0 1 1 2 0 1 5 2 0 1 9 2 0 2 3 2 0 2 7
Per
cen
t
Ratio of net farm income to debt remains low
-2
-1
0
1
2
3
4
5
6
7
2 0 0 5 2 0 0 7 2 0 0 9 2 0 1 1 2 0 1 3 2 0 1 5 2 0 1 7 2 0 1 9
Per
cen
t ch
ange
Food inflation returns to more historical levels
Total CPI for food CPI for food at home CPI for food away from home
0
25
50
75
100
125
150
2 0 0 9 2 0 1 1 2 0 1 3 2 0 1 5 2 0 1 7 2 0 1 9 2 0 2 1 2 0 2 3 2 0 2 5 2 0 2 7
Bill
ion
do
llars
Farm income measures improve slightly in 2019
Net cash income Net farm income Real net farm income
FAPRI-MU AMAP | 2018 U.S. Baseline
8
Policy assumptions
ARC is one option for grain and
oilseed producers. Participating
producers receive a payment when
revenues fall below a trigger tied to
past market prices and county
yields. For illustration purposes
only, the chart uses national aver-
age wheat prices and yields. With
these assumptions, payments occur
for the 2015/16-2017/18 marketing
years, but not for 2018/19 and later
years, assuming current ARC rules are
maintained in the next farm bill.
PLC is the other option for grain
and oilseed producers. Payments
occur when national marketing year
average prices fall below a fixed ref-
erence price. As with ARC, pay-
ments are made on 85 percent of
base acres for a particular crop.
Given expected wheat prices, PLC
payments continue each year.
The Bipartisan Budget Act (BBA),
signed into law in February 2018,
reduces premiums under the Dairy
Margin Protection Program. For
the first 5 million pounds of pro-
duction on a farm, premiums are
eliminated for the $4.50 and $5.00
per cwt coverage options and
sharply reduced for other coverage
levels.
Other provisions of the BBA, in-
cluding provisions of disaster pay-
ments and creation of new PLC
and ARC programs for seed cotton,
are not included in this baseline.
0.000.050.100.150.200.250.300.350.400.450.50
4 . 0 0 4 . 5 0 5 . 0 0 5 . 5 0 6 . 0 0 6 . 5 0 7 . 0 0 7 . 5 0 8 . 0 0
Pre
miu
m, $
/cw
t, s
mal
l pro
du
cers
Coverage level, dollars per cwt
2018 budget bill reduces dairy premiums
2014 farm bill 2018 budget bill
0
50
100
150
200
250
300
350
400
1 1 / 1 2 1 3 / 1 4 1 5 / 1 6 1 7 / 1 8 1 9 / 2 0 2 1 / 2 2 2 3 / 2 4 2 5 / 2 6 2 7 / 2 8
Do
llars
per
acr
eMarketing year
Moving averages reduce ARC benchmarks
Wheat revenue per acre 86% of wheat benchmark
0
1
2
3
4
5
6
7
8
9
1 1 / 1 2 1 3 / 1 4 1 5 / 1 6 1 7 / 1 8 1 9 / 2 0 2 1 / 2 2 2 3 / 2 4 2 5 / 2 6 2 7 / 2 8
Do
llars
per
bu
shel
Marketing year
PLC payments are tied to fixed reference prices
Wheat market price Wheat reference price

FAPRI-MU AMAP | 2018 U.S. Baseline
9
Selected policy assumptions, 2017-27
Policy Description
Price Loss Coverage Makes payments when marketing year average price falls below fixed reference prices:
(PLC) Corn $3.70/bushel
Soybeans $8.40/bushel
Wheat $5.50/bushel
Rice $14.00/cwt ($16.10/cwt for Japonica)
Sorghum $3.95/bushel
Barley $4.95/bushel
Oats $2.40/bushel
Peanuts $535/ton
Sunflowers 20.15 cents/pound
Upland cotton not available
Paid on program yields and 85% of base acreage
Agriculture Risk Coverage Makes payments when revenues fall below 86% of a benchmark (ARC) County option (ARC-CO) benchmark: 5-year Olympic average of national marketing year prices
multiplied by the 5-year Olympic average of county yields per planted acre
Farm option (ARC-IC) benchmark: 5-year Olympic average of weighted farm revenue per acre
Maximum payment is 10% of benchmark value
Paid on 85% (ARC-CO) or 65% (ARC-IC) of base acreage
Available for program crops (not upland cotton)
ARC/PLC participation For 2014-2018, participation reflects elections made in 2015 In 2019, producers assumed to make a new program election Participation rates for 2019 and subsequent years are based on a comparison of expected payments
The corn PLC participation rate, for example, is increased to 70%
Sequestration Assumed to apply to PLC and ARC payments and certain conservation payments Rate: 6.8% for 2016 crop payments, 6.9% for 2017-25 crop payments and 0 for 2026 and 2027
Marketing loan program 2014 farm bill levels provisions
Supplemental coverage option Available for program crops not enrolled in ARC beginning in 2015
Area crop insurance available as a supplement to conventional insurance Covers range between 86% and individual coverage level
65% of premium subsidized
Upland cotton Does not incorporate seed cotton provisions of the 2018 Bipartisan Budget Act
Reflects 2014 farm bill provisions, implying no PLC or ARC program
STAX crop insurance program
Generic base eligible for PLC or ARC if planted to other crops
Loan rate varies in range depending on recent world cotton prices
Sugar 2014 farm bill provisions Agreement with Mexico incorporated
Conservation reserve Caps conservation reserve acreage at 24 million acres
Dairy Margin Protection Program (MPP-Dairy) Does incorporate 2018 Bipartisan Budget Act change in premium structure
FAPRI-MU AMAP | 2018 U.S. Baseline
10
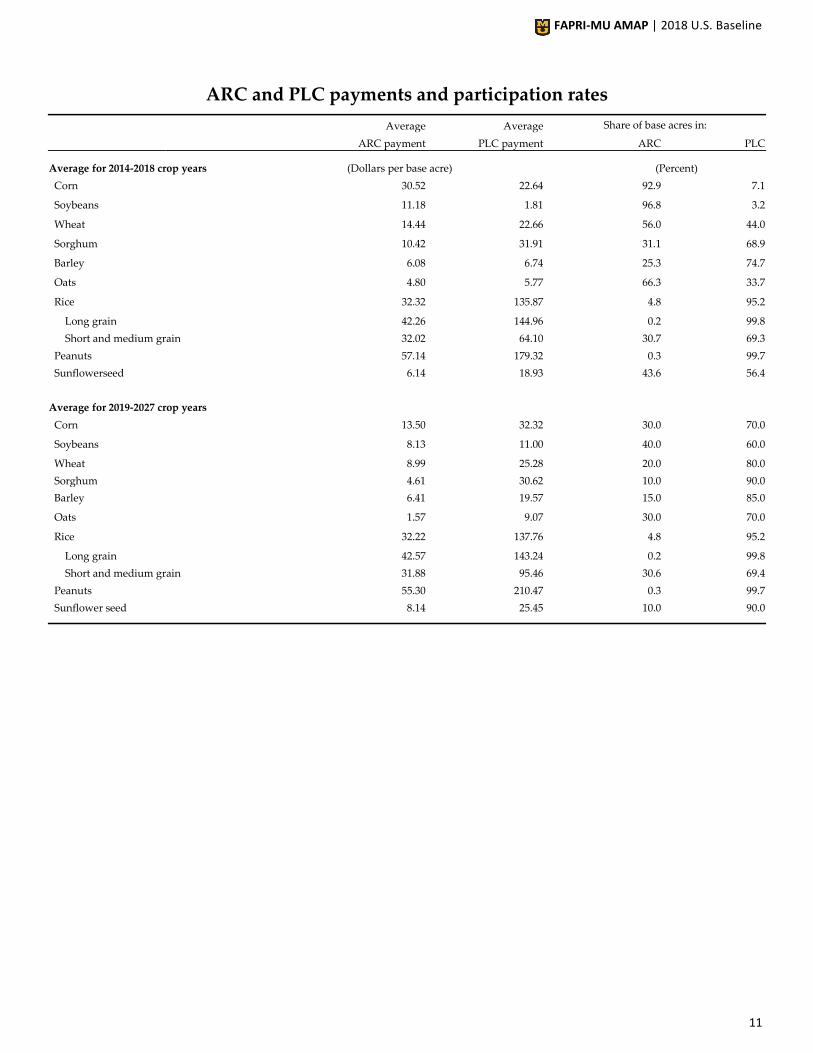
Crop program
participation
Under the 2014 farm bill, producers
made a one-time election of ARC or
PLC for each crop for the 2014-
2018 crop years. For corn and soy-
beans, projected average ARC pay-
ments per base acre are larger over
the 2014-18 period than average
projected PLC payments. The re-
verse is true for wheat, sorghum,
barley, rice and peanut base acre-
age.
For corn and soybeans, projected
ARC payments decline as the mov-
ing average of prices used to set the
ARC benchmark adjusts to the low-
er prices of recent years. Projected
average ARC payments per partici-
pating base acre are smaller than
projected PLC payments for all the
major crops for 2019-2027.
For baseline purposes, we assume
farmers will have an opportunity to
make a new ARC-PLC election for
the 2019-2027 period. Given pro-
jected payments, PLC may look
more attractive in 2019 than it did
in 2015, when the 2014-2018 elec-
tion was made. As a result, we as-
sume greater PLC participation for
corn, soybeans, wheat and several
other crops after 2019.
3111 14 10 6
3257
232
23 327
136
179
0
50
100
150
200
250
C o r n S o y b e an s W h e a t S o r g h u m B a r l ey R i c e P e a n u tsD
oll
ars
pe
r p
art
icip
ati
ng
ba
se a
cre
2014-18 annual average
ARC and PLC payments differ by crop
ARC PLC
7 3
44
6975
95 100
7060
8090
8595 100
0
20
40
60
80
100
120
C o r n S o y b e a n s W h e a t S o r g h u m B a r l e y R i c e P e a n u t s
Per
cen
t o
f b
ase
acre
age
Share of base area enrolled in PLC
PLC enrollment expected to increase in 2019
2014-18 2019-27
13 8 9 5 6
3255
3211
25 3120
138
210
0
50
100
150
200
250
C o r n S o y b e a n s W h e a t S o r g h u m B a r l e y R i c e P e a n u t s
Do
llars
per
par
tici
pat
ing
bas
e ac
re
2019-27 annual average
For some crops, patterns change after 2019
ARC PLC
FAPRI-MU AMAP | 2018 U.S. Baseline
11
ARC and PLC payments and participation rates
Average Average Share of base acres in:
ARC payment PLC payment ARC PLC
Average for 2014-2018 crop years (Dollars per base acre) (Percent)
Corn 30.52 22.64 92.9 7.1
Soybeans 11.18 1.81 96.8 3.2
Wheat 14.44 22.66 56.0 44.0
Sorghum 10.42 31.91 31.1 68.9
Barley 6.08 6.74 25.3 74.7
Oats 4.80 5.77 66.3 33.7
Rice 32.32 135.87 4.8 95.2
Long grain 42.26 144.96 0.2 99.8
Short and medium grain 32.02 64.10 30.7 69.3
Peanuts 57.14 179.32 0.3 99.7
Sunflowerseed 6.14 18.93 43.6 56.4
Average for 2019-2027 crop years
Corn 13.50 32.32 30.0 70.0
Soybeans 8.13 11.00 40.0 60.0
Wheat 8.99 25.28 20.0 80.0
Sorghum 4.61 30.62 10.0 90.0
Barley 6.41 19.57 15.0 85.0
Oats 1.57 9.07 30.0 70.0
Rice 32.22 137.76 4.8 95.2
Long grain 42.57 143.24 0.2 99.8
Short and medium grain 31.88 95.46 30.6 69.4
Peanuts 55.30 210.47 0.3 99.7
Sunflower seed 8.14 25.45 10.0 90.0
FAPRI-MU AMAP | 2018 U.S. Baseline
12
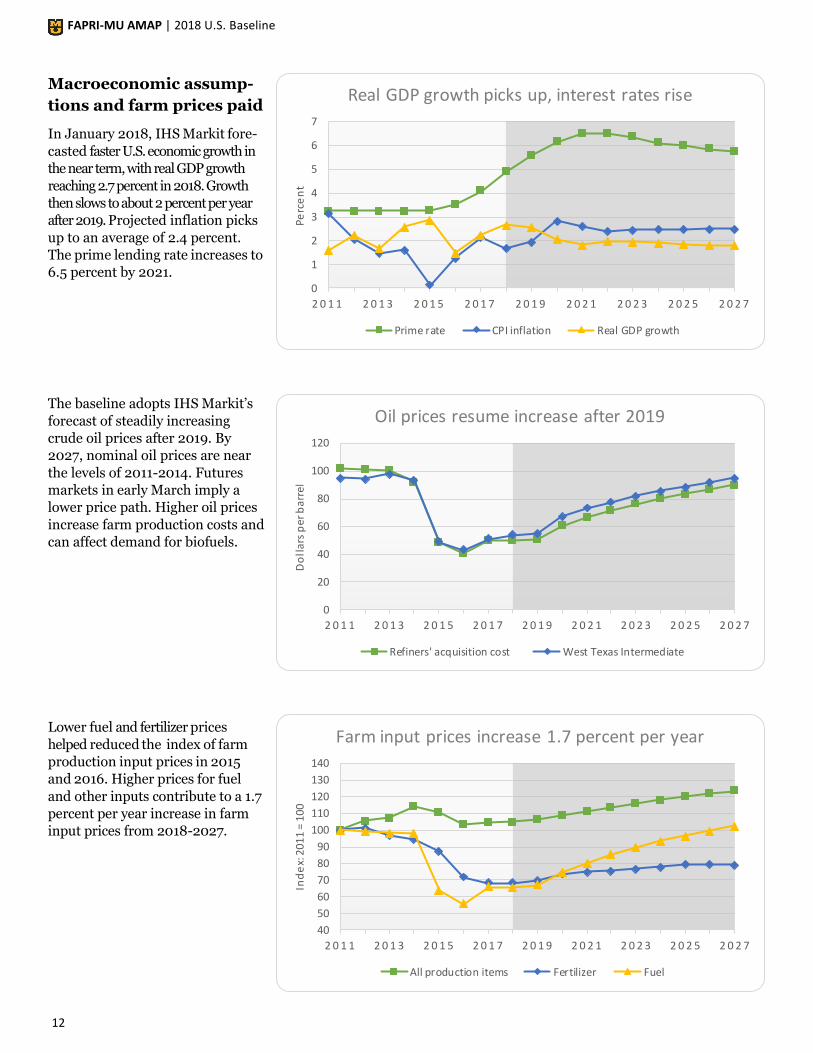
Macroeconomic assump-
tions and farm prices paid
In January 2018, IHS Markit fore-
casted faster U.S. economic growth in
the near term, with real GDP growth
reaching 2.7 percent in 2018. Growth
then slows to about 2 percent per year
after 2019. Projected inflation picks
up to an average of 2.4 percent.
The prime lending rate increases to
6.5 percent by 2021.
The baseline adopts IHS Markit’s
forecast of steadily increasing
crude oil prices after 2019. By
2027, nominal oil prices are near
the levels of 2011-2014. Futures
markets in early March imply a
lower price path. Higher oil prices
increase farm production costs and
can affect demand for biofuels.
Lower fuel and fertilizer prices
helped reduced the index of farm
production input prices in 2015
and 2016. Higher prices for fuel
and other inputs contribute to a 1.7
percent per year increase in farm
input prices from 2018-2027.
0
1
2
3
4
5
6
7
2 0 1 1 2 0 1 3 2 0 1 5 2 0 1 7 2 0 1 9 2 0 2 1 2 0 2 3 2 0 2 5 2 0 2 7Pe
rce
nt
Real GDP growth picks up, interest rates rise
Prime rate CPI inflation Real GDP growth
0
20
40
60
80
100
120
2 0 1 1 2 0 1 3 2 0 1 5 2 0 1 7 2 0 1 9 2 0 2 1 2 0 2 3 2 0 2 5 2 0 2 7
Do
llar
s p
er b
arre
l
Oil prices resume increase after 2019
Refiners' acquisition cost West Texas Intermediate
40
50
60
70
80
90
100
110
120
130
140
2 0 1 1 2 0 1 3 2 0 1 5 2 0 1 7 2 0 1 9 2 0 2 1 2 0 2 3 2 0 2 5 2 0 2 7
Ind
ex:
20
11
= 1
00
Farm input prices increase 1.7 percent per year
All production items Fertilizer Fuel

FAPRI-MU AMAP | 2018 U.S. Baseline
13
Macroeconomic assumptions
Calendar year 2017 2018 2019 2020 2021 2022 2023 2024 2025 2026 2027
Real GDP growth (Percent change from previous year)
United States 2.2 2.7 2.6 2.0 1.8 2.0 1.9 1.9 1.8 1.8 1.8
China 6.8 6.6 6.3 6.1 6.2 6.0 5.9 5.7 5.5 5.3 5.1
World 3.2 3.3 3.2 3.0 3.1 3.1 3.1 3.1 3.1 3.0 3.0
Population growth
United States 0.7 0.8 0.8 0.8 0.8 0.8 0.8 0.7 0.7 0.7 0.7
World 1.1 1.1 1.1 1.0 1.0 1.0 1.0 1.0 0.9 0.9 0.9
U.S. CPI, all urban consumers 2.1 1.7 1.9 2.8 2.6 2.4 2.4 2.5 2.5 2.5 2.5
(Percent)
U.S. unemployment rate 4.4 3.9 3.7 3.8 4.1 4.3 4.4 4.5 4.6 4.7 4.7
3-month Treasury bill rate 0.9 1.7 2.3 2.8 3.1 3.1 3.0 2.8 2.7 2.5 2.4
Prime interest rate 4.1 4.9 5.6 6.1 6.5 6.5 6.4 6.1 6.0 5.9 5.7
Petroleum prices (Dollars per barrel)
West Texas intermediate 50.91 53.76 54.76 67.01 73.10 77.65 82.08 85.88 88.72 91.67 94.94
Refiners' acquisition cost 50.04 50.05 50.71 60.39 66.39 71.56 76.22 80.22 83.62 86.79 90.04
Natural gas price (Dollars per million BTU)
Henry Hub 2.96 2.82 3.20 3.14 3.13 3.32 3.59 4.00 4.13 4.14 4.27
Exchange rates (Currency per dollar)
Euro 0.89 0.86 0.86 0.84 0.83 0.82 0.81 0.81 0.80 0.80 0.80
Chinese yuan 6.76 6.58 6.78 7.04 7.19 7.02 6.90 6.79 6.71 6.66 6.64
Source: IHS Markit, January 2018
Indices of prices paid by farmers
Calendar year 2017 2018 2019 2020 2021 2022 2023 2024 2025 2026 2027
Production items, interest, (2011=100)
taxes and wages 106.6 107.3 109.3 111.7 114.2 116.8 119.4 121.9 124.3 126.6 128.7
Production items 104.7 104.9 106.5 108.7 111.0 113.4 115.8 118.0 120.1 122.1 123.8
Feed 96.0 96.0 98.9 100.7 100.7 100.6 100.1 99.6 99.3 98.8 98.1
Livestock & poultry 106.6 101.7 99.6 97.2 100.1 105.1 111.0 115.9 119.3 122.7 125.0
Seeds 110.2 108.9 108.9 110.4 112.4 114.1 115.5 116.7 117.7 118.7 119.6
Fertilizer 68.1 68.3 69.6 73.6 74.9 75.6 76.6 78.1 79.4 79.5 79.2
Mixed fertilizer 67.6 68.1 69.4 73.4 74.8 75.6 76.6 78.0 79.1 79.1 78.8
Nitrogen fertilizer 68.4 67.5 68.7 72.9 74.0 74.3 75.3 76.9 78.8 79.2 78.9
Potash and phosph. 69.1 71.1 72.7 76.3 78.1 79.5 80.7 82.0 82.2 81.8 81.4
Agricultural chemicals 107.0 106.4 109.7 114.8 118.5 122.4 126.2 130.2 133.2 135.9 138.5
Fuels 65.9 65.6 66.9 74.8 80.2 85.3 89.7 93.5 96.6 99.5 102.4
Supplies & repairs 107.7 110.0 112.4 114.9 117.5 120.2 123.1 126.0 128.8 131.7 134.6
Autos & trucks 106.0 106.7 108.2 109.4 109.9 110.4 110.9 111.5 112.2 112.9 113.6
Farm machinery 117.9 119.9 124.0 128.4 132.4 136.0 139.7 143.3 147.2 151.2 155.1
Building material 110.5 113.3 115.9 118.2 120.0 121.8 123.5 125.3 127.0 128.7 130.4
Farm services 118.7 121.4 125.2 129.4 133.6 137.7 141.9 146.2 150.6 155.1 159.8
Interest* 111.6 116.9 123.4 128.6 132.5 135.4 138.1 140.7 143.7 146.6 149.7
Taxes** 122.8 125.8 130.4 132.8 134.0 136.3 140.1 144.1 147.9 151.6 155.5
Wage rates 119.1 122.4 126.2 130.6 135.2 139.8 144.6 149.5 154.5 159.7 165.0
*Interest per acre on farm real estate debt and interest rate on farm non-real estate debt.
**Farm real estate taxes payable per acre.
FAPRI-MU AMAP | 2018 U.S. Baseline
14
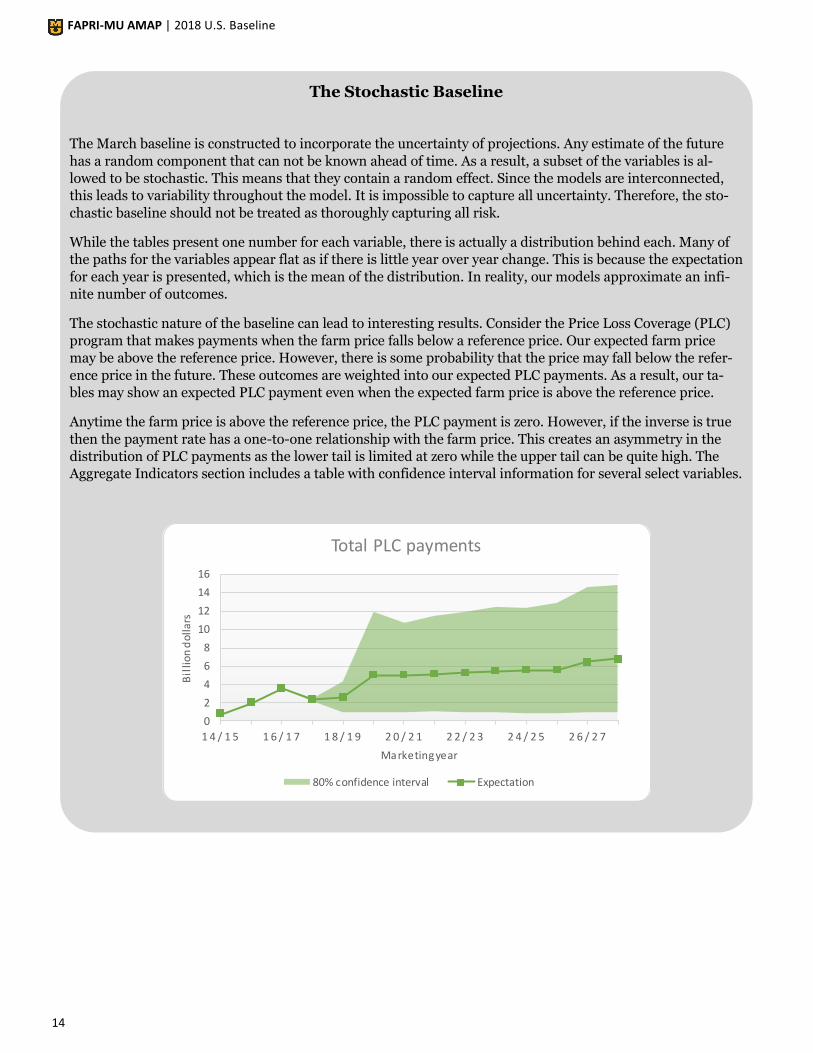
The Stochastic Baseline
The March baseline is constructed to incorporate the uncertainty of projections. Any estimate of the future
has a random component that can not be known ahead of time. As a result, a subset of the variables is al-
lowed to be stochastic. This means that they contain a random effect. Since the models are interconnected,
this leads to variability throughout the model. It is impossible to capture all uncertainty. Therefore, the sto-
chastic baseline should not be treated as thoroughly capturing all risk.
While the tables present one number for each variable, there is actually a distribution behind each. Many of
the paths for the variables appear flat as if there is little year over year change. This is because the expectation
for each year is presented, which is the mean of the distribution. In reality, our models approximate an infi-
nite number of outcomes.
The stochastic nature of the baseline can lead to interesting results. Consider the Price Loss Coverage (PLC)
program that makes payments when the farm price falls below a reference price. Our expected farm price
may be above the reference price. However, there is some probability that the price may fall below the refer-
ence price in the future. These outcomes are weighted into our expected PLC payments. As a result, our ta-
bles may show an expected PLC payment even when the expected farm price is above the reference price.
Anytime the farm price is above the reference price, the PLC payment is zero. However, if the inverse is true
then the payment rate has a one-to-one relationship with the farm price. This creates an asymmetry in the
distribution of PLC payments as the lower tail is limited at zero while the upper tail can be quite high. The
Aggregate Indicators section includes a table with confidence interval information for several select variables.
0
2
4
6
8
10
12
14
16
1 4 / 1 5 1 6 / 1 7 1 8 / 1 9 2 0 / 2 1 2 2 / 2 3 2 4 / 2 5 2 6 / 2 7
Bil
lion
do
llars
Marketing year
Total PLC payments
80% confidence interval Expectation

Gra
ins
FAPRI-MU AMAP | 2018 U.S. Baseline
16
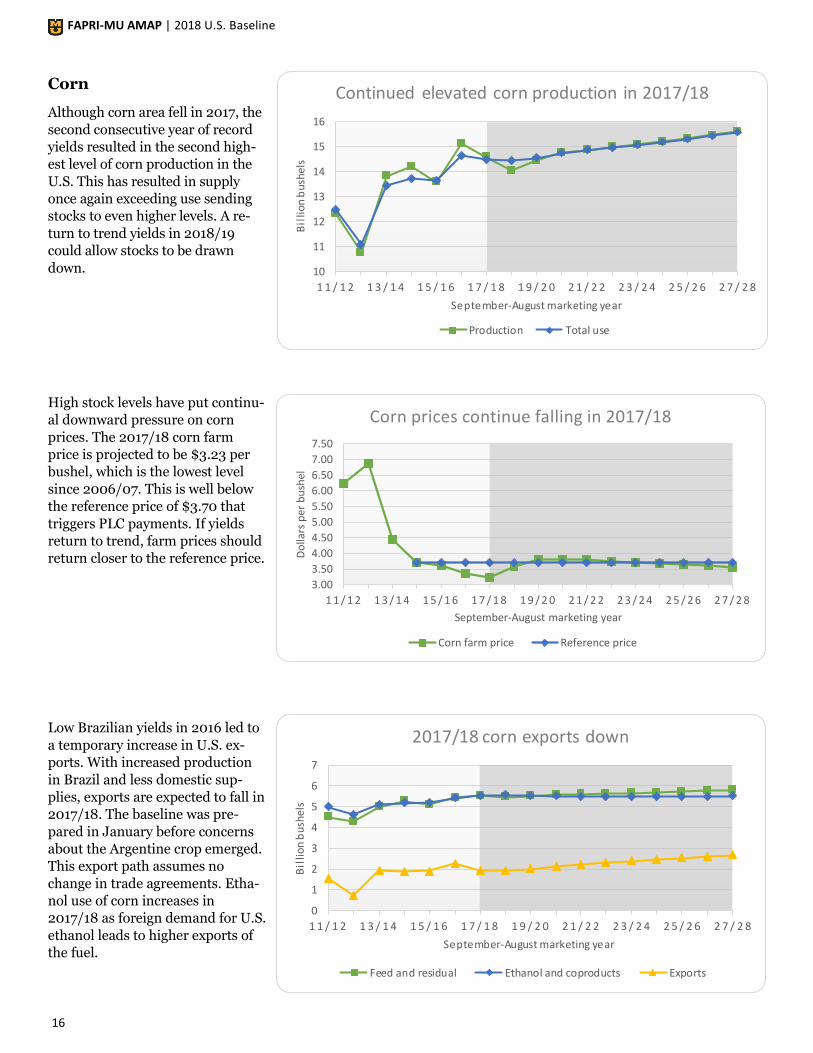
Corn
Although corn area fell in 2017, the
second consecutive year of record
yields resulted in the second high-
est level of corn production in the
U.S. This has resulted in supply
once again exceeding use sending
stocks to even higher levels. A re-
turn to trend yields in 2018/19
could allow stocks to be drawn
down.
High stock levels have put continu-
al downward pressure on corn
prices. The 2017/18 corn farm
price is projected to be $3.23 per
bushel, which is the lowest level
since 2006/07. This is well below
the reference price of $3.70 that
triggers PLC payments. If yields
return to trend, farm prices should
return closer to the reference price.
Low Brazilian yields in 2016 led to
a temporary increase in U.S. ex-
ports. With increased production
in Brazil and less domestic sup-
plies, exports are expected to fall in
2017/18. The baseline was pre-
pared in January before concerns
about the Argentine crop emerged.
This export path assumes no
change in trade agreements. Etha-
nol use of corn increases in
2017/18 as foreign demand for U.S.
ethanol leads to higher exports of
the fuel.
10
11
12
13
14
15
16
1 1 / 1 2 1 3 / 1 4 1 5 / 1 6 1 7 / 1 8 1 9 / 2 0 2 1 / 2 2 2 3 / 2 4 2 5 / 2 6 2 7 / 2 8B
illio
n b
ushe
lsSeptember-August marketing year
Continued elevated corn production in 2017/18
Production Total use
0
1
2
3
4
5
6
7
1 1 / 1 2 1 3 / 1 4 1 5 / 1 6 1 7 / 1 8 1 9 / 2 0 2 1 / 2 2 2 3 / 2 4 2 5 / 2 6 2 7 / 2 8
Bil
lion
bus
hels
September-August marketing year
2017/18 corn exports down
Feed and residual Ethanol and coproducts Exports
3.00
3.50
4.00
4.50
5.00
5.50
6.00
6.50
7.00
7.50
1 1 / 1 2 1 3 / 1 4 1 5 / 1 6 1 7 / 1 8 1 9 / 2 0 2 1 / 2 2 2 3 / 2 4 2 5 / 2 6 2 7 / 2 8
Do
llars
per
bu
shel
September-August marketing year
Corn prices continue falling in 2017/18
Corn farm price Reference price
FAPRI-MU AMAP | 2018 U.S. Baseline
17
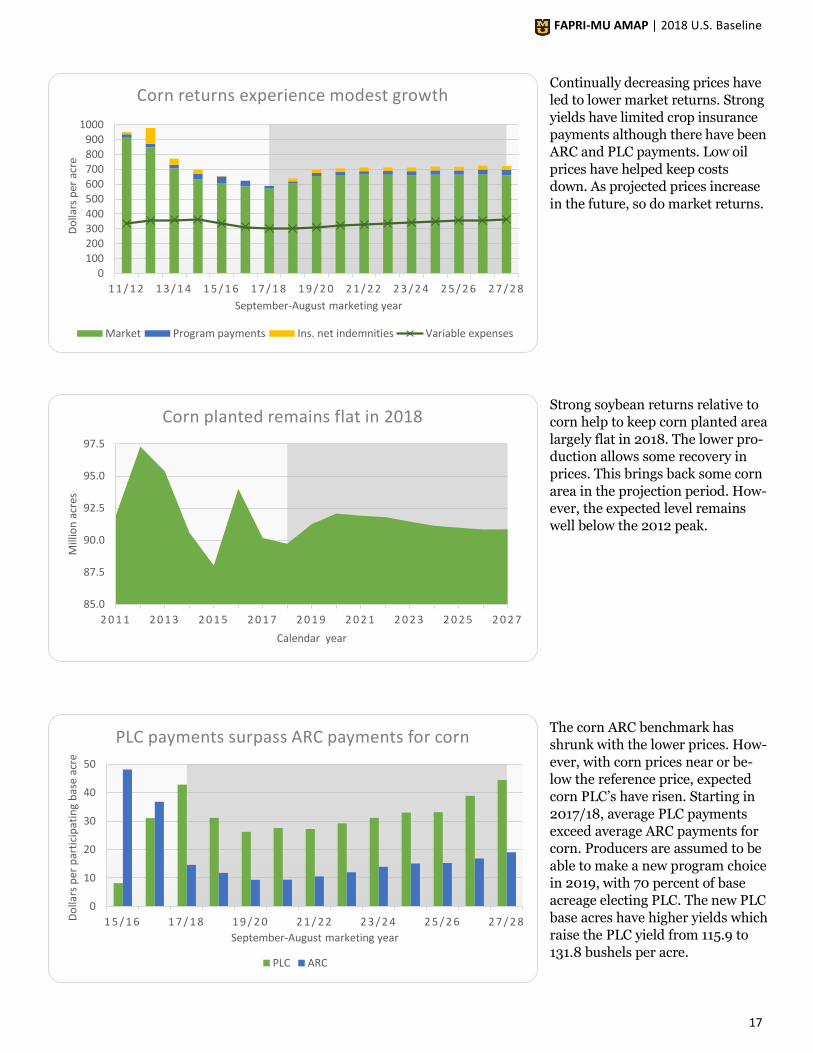
Continually decreasing prices have
led to lower market returns. Strong
yields have limited crop insurance
payments although there have been
ARC and PLC payments. Low oil
prices have helped keep costs
down. As projected prices increase
in the future, so do market returns.
Strong soybean returns relative to
corn help to keep corn planted area
largely flat in 2018. The lower pro-
duction allows some recovery in
prices. This brings back some corn
area in the projection period. How-
ever, the expected level remains
well below the 2012 peak.
The corn ARC benchmark has
shrunk with the lower prices. How-
ever, with corn prices near or be-
low the reference price, expected
corn PLC’s have risen. Starting in
2017/18, average PLC payments
exceed average ARC payments for
corn. Producers are assumed to be
able to make a new program choice
in 2019, with 70 percent of base
acreage electing PLC. The new PLC
base acres have higher yields which
raise the PLC yield from 115.9 to
131.8 bushels per acre.
0
10
20
30
40
50
1 5 / 1 6 1 7 / 1 8 1 9 / 2 0 2 1 / 2 2 2 3 / 2 4 2 5 / 2 6 2 7 / 2 8Do
llars
per
par
tici
pat
ing
bas
e ac
re
September-August marketing year
PLC payments surpass ARC payments for corn
PLC ARC
85.0
87.5
90.0
92.5
95.0
97.5
2 0 1 1 2 0 1 3 2 0 1 5 2 0 1 7 2 0 1 9 2 0 2 1 2 0 2 3 2 0 2 5 2 0 2 7
Mill
ion
acr
es
Calendar year
Corn planted remains flat in 2018
0100200300400500600700800900
1000
1 1 / 1 2 1 3 / 1 4 1 5 / 1 6 1 7 / 1 8 1 9 / 2 0 2 1 / 2 2 2 3 / 2 4 2 5 / 2 6 2 7 / 2 8
Do
llars
per
acr
e
September-August marketing year
Corn returns experience modest growth
Market Program payments Ins. net indemnities Variable expenses
FAPRI-MU AMAP | 2018 U.S. Baseline
18
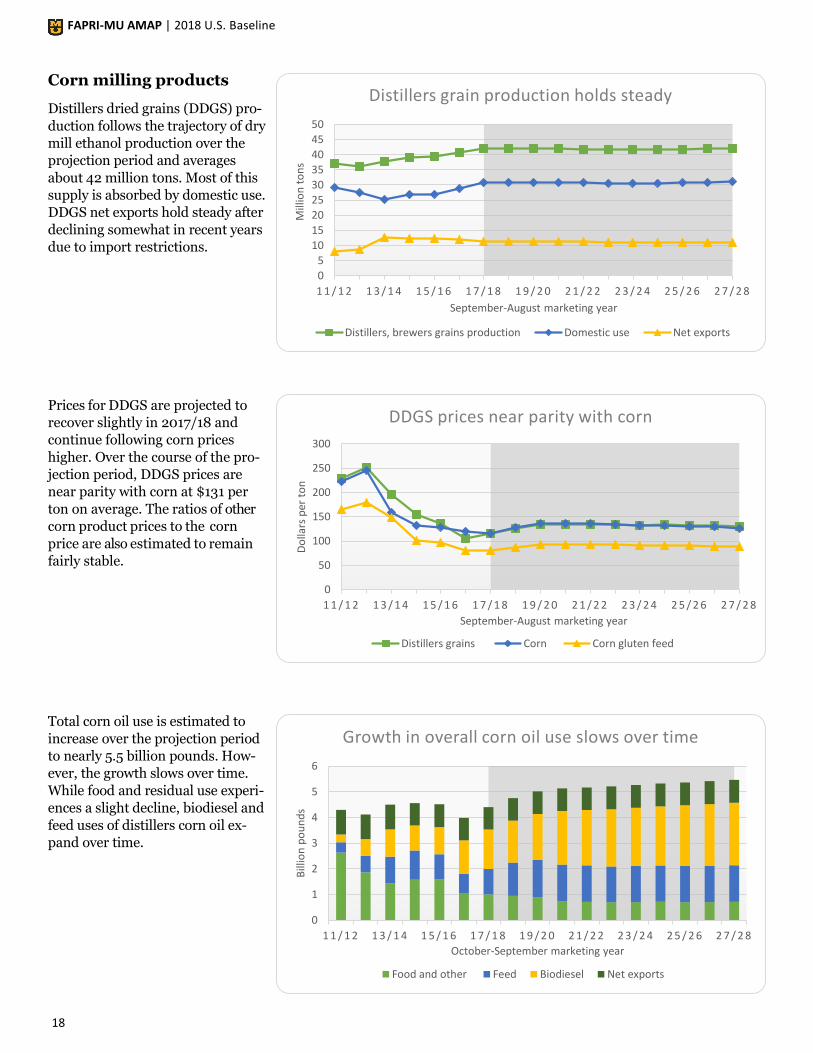
Corn milling products
Distillers dried grains (DDGS) pro-
duction follows the trajectory of dry
mill ethanol production over the
projection period and averages
about 42 million tons. Most of this
supply is absorbed by domestic use.
DDGS net exports hold steady after
declining somewhat in recent years
due to import restrictions.
Prices for DDGS are projected to
recover slightly in 2017/18 and
continue following corn prices
higher. Over the course of the pro-
jection period, DDGS prices are
near parity with corn at $131 per
ton on average. The ratios of other
corn product prices to the corn
price are also estimated to remain
fairly stable.
Total corn oil use is estimated to
increase over the projection period
to nearly 5.5 billion pounds. How-
ever, the growth slows over time.
While food and residual use experi-
ences a slight decline, biodiesel and
feed uses of distillers corn oil ex-
pand over time.
0
5
10
15
20
25
30
35
40
45
50
1 1 / 1 2 1 3 / 1 4 1 5 / 1 6 1 7 / 1 8 1 9 / 2 0 2 1 / 2 2 2 3 / 2 4 2 5 / 2 6 2 7 / 2 8M
illio
n t
on
sSeptember-August marketing year
Distillers grain production holds steady
Distillers, brewers grains production Domestic use Net exports
0
1
2
3
4
5
6
1 1 / 1 2 1 3 / 1 4 1 5 / 1 6 1 7 / 1 8 1 9 / 2 0 2 1 / 2 2 2 3 / 2 4 2 5 / 2 6 2 7 / 2 8
Bill
ion
po
un
ds
October-September marketing year
Growth in overall corn oil use slows over time
Food and other Feed Biodiesel Net exports
0
50
100
150
200
250
300
1 1 / 1 2 1 3 / 1 4 1 5 / 1 6 1 7 / 1 8 1 9 / 2 0 2 1 / 2 2 2 3 / 2 4 2 5 / 2 6 2 7 / 2 8
Do
llars
per
to
n
September-August marketing year
DDGS prices near parity with corn
Distillers grains Corn Corn gluten feed

FAPRI-MU AMAP | 2018 U.S. Baseline
19
Wheat
World wheat production has ex-
ceeded use for the past five years,
resulting in increasing stocks. This
has been driven by high yields. The
excess stocks have been weighing
on wheat prices. The 2017 world
wheat stocks to use ratio was 36
percent, up from 26 percent in
2012.
The 2017 U.S. all wheat plantings
were the lowest since it has been
recorded. The 2018 winter wheat
seedings report indicated that 32.6
million acres of winter wheat were
seeded as opposed to 32.7 million
in 2017. However, spring wheat
plantings are expected to be up
leading to an increase of 1.2 million
wheat acres in 2018.
High U.S. yields in 2016 helped ele-
vate production in that year. Most
of the increase in 2016/17 use was
in the exports and stocks catego-
ries. Lower yields and acreage in
2017 dramatically dropped produc-
tion thereby reducing many of the
gains in exports and stocks. The
shortage of production relative to
use is met by imports.
0
100
200
300
400
500
600
700
800
0 1 / 0 2 0 3 / 0 4 0 5 / 0 6 0 7 / 0 8 0 9 / 1 0 1 1 / 1 2 1 3 / 1 4 1 5 / 1 6 1 7 / 1 8
Mill
ion
met
ric
ton
s
June-May marketing year
World wheat production exceeds use
Production Use Ending stocks
30
35
40
45
50
55
60
2 0 1 1 2 0 1 3 2 0 1 5 2 0 1 7 2 0 1 9 2 0 2 1 2 0 2 3 2 0 2 5 2 0 2 7
Mill
ion
acr
es
Calendar year harvested
Winter wheat seedings almost unchanged
All wheat planted area Winter wheat seedings
1.7
1.8
1.9
2.0
2.1
2.2
2.3
2.4
2.5
1 1 / 1 2 1 3 / 1 4 1 5 / 1 6 1 7 / 1 8 1 9 / 2 0 2 1 / 2 2 2 3 / 2 4 2 5 / 2 6 2 7 / 2 8
Bill
ion
bu
shel
s
June-May marketing year
Wheat production drops sharply
Production Total use
FAPRI-MU AMAP | 2018 U.S. Baseline
20
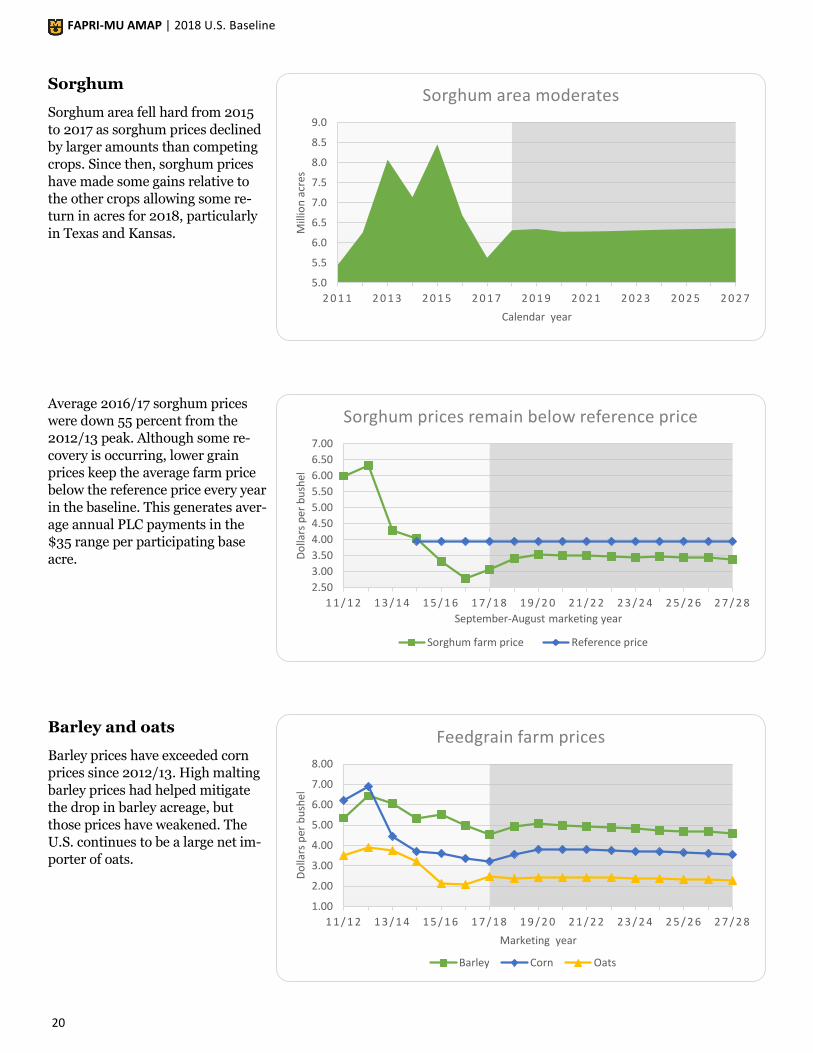
Sorghum
Sorghum area fell hard from 2015
to 2017 as sorghum prices declined
by larger amounts than competing
crops. Since then, sorghum prices
have made some gains relative to
the other crops allowing some re-
turn in acres for 2018, particularly
in Texas and Kansas.
Average 2016/17 sorghum prices
were down 55 percent from the
2012/13 peak. Although some re-
covery is occurring, lower grain
prices keep the average farm price
below the reference price every year
in the baseline. This generates aver-
age annual PLC payments in the
$35 range per participating base
acre.
Barley and oats
Barley prices have exceeded corn
prices since 2012/13. High malting
barley prices had helped mitigate
the drop in barley acreage, but
those prices have weakened. The
U.S. continues to be a large net im-
porter of oats.
5.0
5.5
6.0
6.5
7.0
7.5
8.0
8.5
9.0
2 0 1 1 2 0 1 3 2 0 1 5 2 0 1 7 2 0 1 9 2 0 2 1 2 0 2 3 2 0 2 5 2 0 2 7M
illio
n a
cres
Calendar year
Sorghum area moderates
2.50
3.00
3.50
4.00
4.50
5.00
5.50
6.00
6.50
7.00
1 1 / 1 2 1 3 / 1 4 1 5 / 1 6 1 7 / 1 8 1 9 / 2 0 2 1 / 2 2 2 3 / 2 4 2 5 / 2 6 2 7 / 2 8
Do
llars
per
bu
shel
September-August marketing year
Sorghum prices remain below reference price
Sorghum farm price Reference price
1.00
2.00
3.00
4.00
5.00
6.00
7.00
8.00
1 1 / 1 2 1 3 / 1 4 1 5 / 1 6 1 7 / 1 8 1 9 / 2 0 2 1 / 2 2 2 3 / 2 4 2 5 / 2 6 2 7 / 2 8
Do
llars
per
bu
shel
Marketing year
Feedgrain farm prices
Barley Corn Oats
FAPRI-MU AMAP | 2018 U.S. Baseline
21
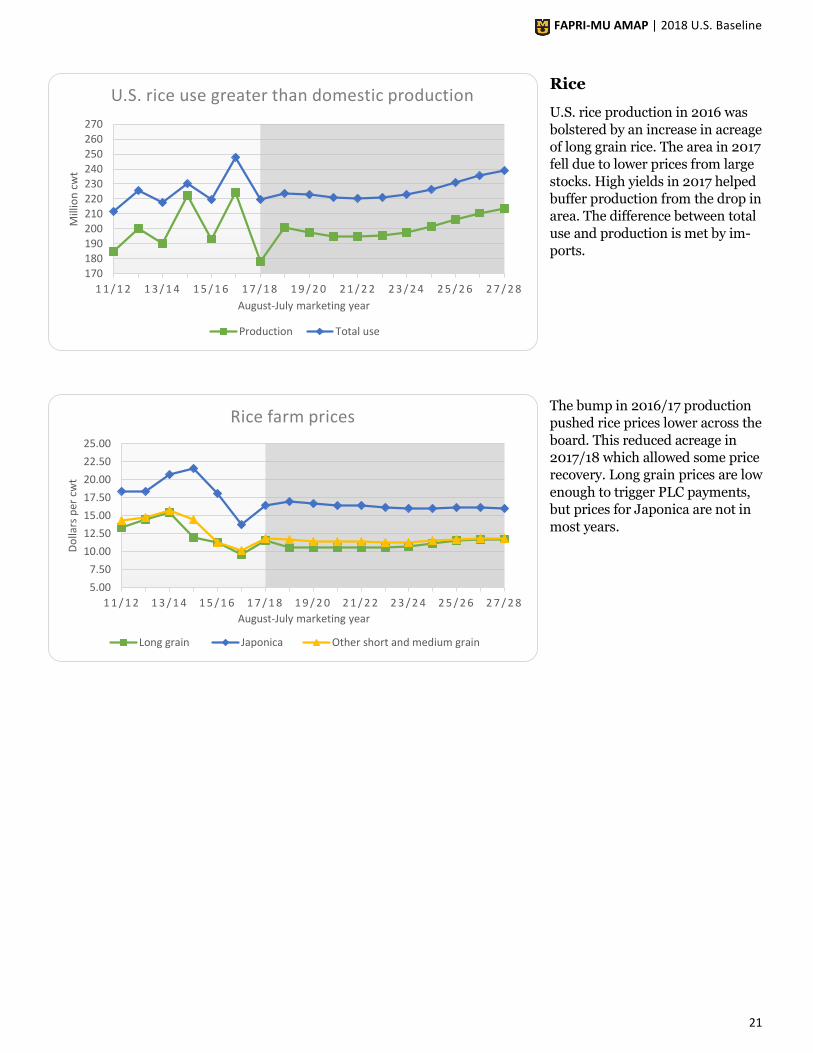
Rice
U.S. rice production in 2016 was
bolstered by an increase in acreage
of long grain rice. The area in 2017
fell due to lower prices from large
stocks. High yields in 2017 helped
buffer production from the drop in
area. The difference between total
use and production is met by im-
ports.
The bump in 2016/17 production
pushed rice prices lower across the
board. This reduced acreage in
2017/18 which allowed some price
recovery. Long grain prices are low
enough to trigger PLC payments,
but prices for Japonica are not in
most years.
5.00
7.50
10.00
12.50
15.00
17.50
20.00
22.50
25.00
1 1 / 1 2 1 3 / 1 4 1 5 / 1 6 1 7 / 1 8 1 9 / 2 0 2 1 / 2 2 2 3 / 2 4 2 5 / 2 6 2 7 / 2 8
Do
llars
per
cw
t
August-July marketing year
Rice farm prices
Long grain Japonica Other short and medium grain
170180190
200210220
230240250260
270
1 1 / 1 2 1 3 / 1 4 1 5 / 1 6 1 7 / 1 8 1 9 / 2 0 2 1 / 2 2 2 3 / 2 4 2 5 / 2 6 2 7 / 2 8
Mill
ion
cw
t
August-July marketing year
U.S. rice use greater than domestic production
Production Total use
FAPRI-MU AMAP | 2018 U.S. Baseline
22
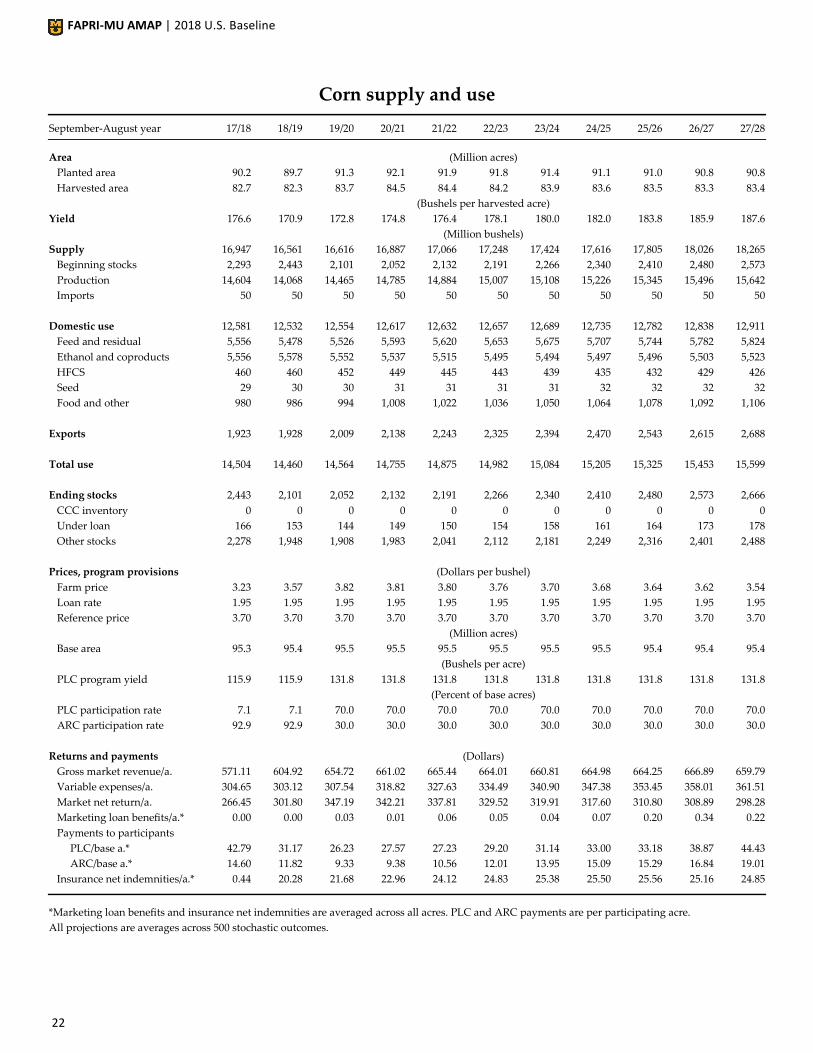
Corn supply and use
September-August year 17/18 18/19 19/20 20/21 21/22 22/23 23/24 24/25 25/26 26/27 27/28
Area (Million acres)
Planted area 90.2 89.7 91.3 92.1 91.9 91.8 91.4 91.1 91.0 90.8 90.8
Harvested area 82.7 82.3 83.7 84.5 84.4 84.2 83.9 83.6 83.5 83.3 83.4
(Bushels per harvested acre)
Yield 176.6 170.9 172.8 174.8 176.4 178.1 180.0 182.0 183.8 185.9 187.6
(Million bushels)
Supply 16,947 16,561 16,616 16,887 17,066 17,248 17,424 17,616 17,805 18,026 18,265
Beginning stocks 2,293 2,443 2,101 2,052 2,132 2,191 2,266 2,340 2,410 2,480 2,573
Production 14,604 14,068 14,465 14,785 14,884 15,007 15,108 15,226 15,345 15,496 15,642
Imports 50 50 50 50 50 50 50 50 50 50 50
Domestic use 12,581 12,532 12,554 12,617 12,632 12,657 12,689 12,735 12,782 12,838 12,911
Feed and residual 5,556 5,478 5,526 5,593 5,620 5,653 5,675 5,707 5,744 5,782 5,824
Ethanol and coproducts 5,556 5,578 5,552 5,537 5,515 5,495 5,494 5,497 5,496 5,503 5,523
HFCS 460 460 452 449 445 443 439 435 432 429 426
Seed 29 30 30 31 31 31 31 32 32 32 32
Food and other 980 986 994 1,008 1,022 1,036 1,050 1,064 1,078 1,092 1,106
Exports 1,923 1,928 2,009 2,138 2,243 2,325 2,394 2,470 2,543 2,615 2,688
Total use 14,504 14,460 14,564 14,755 14,875 14,982 15,084 15,205 15,325 15,453 15,599
Ending stocks 2,443 2,101 2,052 2,132 2,191 2,266 2,340 2,410 2,480 2,573 2,666
CCC inventory 0 0 0 0 0 0 0 0 0 0 0
Under loan 166 153 144 149 150 154 158 161 164 173 178
Other stocks 2,278 1,948 1,908 1,983 2,041 2,112 2,181 2,249 2,316 2,401 2,488
Prices, program provisions (Dollars per bushel)
Farm price 3.23 3.57 3.82 3.81 3.80 3.76 3.70 3.68 3.64 3.62 3.54
Loan rate 1.95 1.95 1.95 1.95 1.95 1.95 1.95 1.95 1.95 1.95 1.95
Reference price 3.70 3.70 3.70 3.70 3.70 3.70 3.70 3.70 3.70 3.70 3.70
(Million acres)
Base area 95.3 95.4 95.5 95.5 95.5 95.5 95.5 95.5 95.4 95.4 95.4
(Bushels per acre)
PLC program yield 115.9 115.9 131.8 131.8 131.8 131.8 131.8 131.8 131.8 131.8 131.8
(Percent of base acres)
PLC participation rate 7.1 7.1 70.0 70.0 70.0 70.0 70.0 70.0 70.0 70.0 70.0
ARC participation rate 92.9 92.9 30.0 30.0 30.0 30.0 30.0 30.0 30.0 30.0 30.0
Returns and payments (Dollars)
Gross market revenue/a. 571.11 604.92 654.72 661.02 665.44 664.01 660.81 664.98 664.25 666.89 659.79
Variable expenses/a. 304.65 303.12 307.54 318.82 327.63 334.49 340.90 347.38 353.45 358.01 361.51
Market net return/a. 266.45 301.80 347.19 342.21 337.81 329.52 319.91 317.60 310.80 308.89 298.28
Marketing loan benefits/a.* 0.00 0.00 0.03 0.01 0.06 0.05 0.04 0.07 0.20 0.34 0.22
Payments to participants
PLC/base a.* 42.79 31.17 26.23 27.57 27.23 29.20 31.14 33.00 33.18 38.87 44.43
ARC/base a.* 14.60 11.82 9.33 9.38 10.56 12.01 13.95 15.09 15.29 16.84 19.01
Insurance net indemnities/a.* 0.44 20.28 21.68 22.96 24.12 24.83 25.38 25.50 25.56 25.16 24.85
*Marketing loan benefits and insurance net indemnities are averaged across all acres. PLC and ARC payments are per participating acre.
All projections are averages across 500 stochastic outcomes.

FAPRI-MU AMAP | 2018 U.S. Baseline
23
Corn product supply and use
Marketing year 17/18 18/19 19/20 20/21 21/22 22/23 23/24 24/25 25/26 26/27 27/28
High-fructose corn syrup (Thousand tons, Oct.-Sep. year)
Production 8,283 8,284 8,161 8,127 8,064 8,041 7,986 7,937 7,900 7,851 7,813
Domestic use 6,998 6,856 6,612 6,498 6,372 6,349 6,257 6,156 6,070 5,955 5,851
Net exports 1,285 1,428 1,549 1,629 1,691 1,692 1,729 1,781 1,830 1,895 1,962
(Cents per pound, Oct.-Sep. year)
Price, 42% Midwest 33.61 35.06 35.38 36.18 36.38 37.08 37.32 37.73 38.12 38.42 38.76
HFCS price/ref. sugar price 111% 110% 112% 113% 114% 113% 113% 114% 114% 114% 115%
Distillers, brewers grains (Thousand tons, Sep.-Aug. year)
Production (dry equiv.) 41,963 42,140 42,017 41,965 41,858 41,746 41,772 41,832 41,873 41,972 42,170
Domestic use 30,736 30,908 30,810 30,773 30,681 30,577 30,612 30,668 30,729 30,827 31,030
Net exports 11,227 11,231 11,206 11,192 11,178 11,168 11,161 11,164 11,144 11,145 11,139
(Dollars per ton, Sep.-Aug. year)
Price, IL points 116.52 125.37 134.02 134.20 134.92 134.34 132.82 132.97 132.53 131.76 130.17
DDGS price/corn price 101% 98% 98% 99% 99% 100% 101% 101% 102% 102% 103%
Corn gluten feed (Thousand tons, Sep.-Aug. year)
Production 9,469 9,484 9,398 9,373 9,343 9,338 9,340 9,340 9,334 9,330 9,335
Domestic use 8,468 8,527 8,485 8,485 8,481 8,499 8,522 8,548 8,565 8,585 8,612
Net exports 1,001 957 913 888 862 839 817 793 769 745 724
(Dollars per ton, Sep.-Aug. year)
Price, 21%, IL points 81.15 87.22 92.90 92.81 93.00 92.27 91.01 90.79 90.18 89.50 88.17
CGF price/corn price 70% 68% 68% 68% 68% 69% 69% 69% 69% 69% 70%
Corn gluten meal (Thousand tons, Sep.-Aug. year)
Production 2,492 2,496 2,473 2,467 2,459 2,457 2,458 2,458 2,456 2,455 2,457
Domestic use 1,612 1,608 1,580 1,561 1,542 1,530 1,517 1,507 1,494 1,481 1,471
Net exports 880 888 894 906 916 928 940 951 962 974 985
(Dollars per ton, Sep.-Aug. year)
Price, 60%, IL points 475.07 483.37 502.17 500.86 503.47 501.54 496.18 495.81 494.61 489.18 486.47
CGM price/soymeal price 153% 152% 151% 151% 151% 151% 151% 151% 152% 152% 152%
Corn oil (Million pounds, Oct.-Sep. year)
Production 4,428 4,777 5,029 5,138 5,175 5,214 5,270 5,325 5,370 5,418 5,472
Domestic use 3,532 3,882 4,139 4,256 4,289 4,325 4,380 4,435 4,475 4,524 4,575
Biodiesel 1,539 1,641 1,786 2,091 2,153 2,230 2,257 2,305 2,358 2,402 2,435
Feed 989 1,293 1,460 1,420 1,422 1,392 1,418 1,412 1,414 1,415 1,427
Food/other 1,005 948 893 745 714 702 705 718 703 707 713
Net exports 874 876 877 877 881 884 887 887 890 892 894
Ending stocks 115 133 146 150 155 160 164 166 170 173 177
(Cents per pound, Oct.-Sep. year)
Chicago price 43.28 43.17 43.37 44.10 43.45 42.69 42.53 42.96 42.36 42.41 42.16
Corn oil price/soyoil price 129% 129% 130% 129% 130% 131% 131% 131% 132% 132% 132%
All projections are averages across 500 stochastic outcomes.
FAPRI-MU AMAP | 2018 U.S. Baseline
24
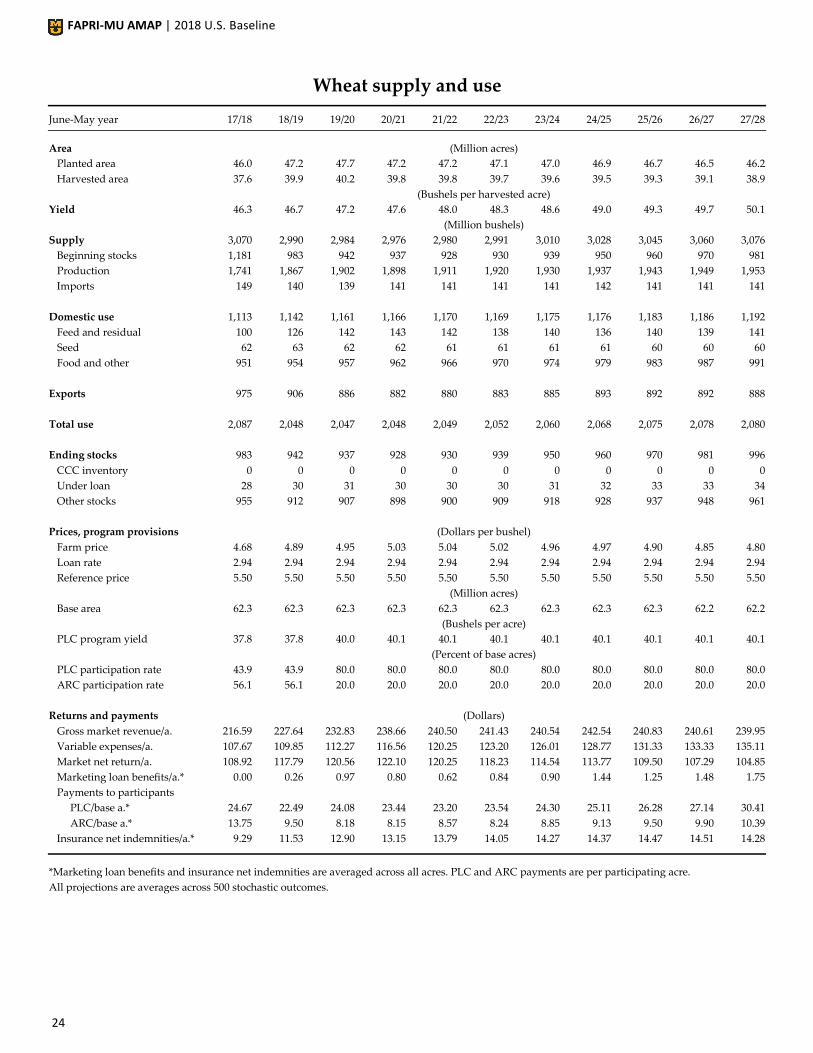
Wheat supply and use
June-May year 17/18 18/19 19/20 20/21 21/22 22/23 23/24 24/25 25/26 26/27 27/28
Area (Million acres)
Planted area 46.0 47.2 47.7 47.2 47.2 47.1 47.0 46.9 46.7 46.5 46.2
Harvested area 37.6 39.9 40.2 39.8 39.8 39.7 39.6 39.5 39.3 39.1 38.9
(Bushels per harvested acre)
Yield 46.3 46.7 47.2 47.6 48.0 48.3 48.6 49.0 49.3 49.7 50.1
(Million bushels)
Supply 3,070 2,990 2,984 2,976 2,980 2,991 3,010 3,028 3,045 3,060 3,076
Beginning stocks 1,181 983 942 937 928 930 939 950 960 970 981
Production 1,741 1,867 1,902 1,898 1,911 1,920 1,930 1,937 1,943 1,949 1,953
Imports 149 140 139 141 141 141 141 142 141 141 141
Domestic use 1,113 1,142 1,161 1,166 1,170 1,169 1,175 1,176 1,183 1,186 1,192
Feed and residual 100 126 142 143 142 138 140 136 140 139 141
Seed 62 63 62 62 61 61 61 61 60 60 60
Food and other 951 954 957 962 966 970 974 979 983 987 991
Exports 975 906 886 882 880 883 885 893 892 892 888
Total use 2,087 2,048 2,047 2,048 2,049 2,052 2,060 2,068 2,075 2,078 2,080
Ending stocks 983 942 937 928 930 939 950 960 970 981 996
CCC inventory 0 0 0 0 0 0 0 0 0 0 0
Under loan 28 30 31 30 30 30 31 32 33 33 34
Other stocks 955 912 907 898 900 909 918 928 937 948 961
Prices, program provisions (Dollars per bushel)
Farm price 4.68 4.89 4.95 5.03 5.04 5.02 4.96 4.97 4.90 4.85 4.80
Loan rate 2.94 2.94 2.94 2.94 2.94 2.94 2.94 2.94 2.94 2.94 2.94
Reference price 5.50 5.50 5.50 5.50 5.50 5.50 5.50 5.50 5.50 5.50 5.50
(Million acres)
Base area 62.3 62.3 62.3 62.3 62.3 62.3 62.3 62.3 62.3 62.2 62.2
(Bushels per acre)
PLC program yield 37.8 37.8 40.0 40.1 40.1 40.1 40.1 40.1 40.1 40.1 40.1
(Percent of base acres)
PLC participation rate 43.9 43.9 80.0 80.0 80.0 80.0 80.0 80.0 80.0 80.0 80.0
ARC participation rate 56.1 56.1 20.0 20.0 20.0 20.0 20.0 20.0 20.0 20.0 20.0
Returns and payments (Dollars)
Gross market revenue/a. 216.59 227.64 232.83 238.66 240.50 241.43 240.54 242.54 240.83 240.61 239.95
Variable expenses/a. 107.67 109.85 112.27 116.56 120.25 123.20 126.01 128.77 131.33 133.33 135.11
108.92 117.79 120.56 122.10 120.25 118.23 114.54 113.77 109.50 107.29 104.85 Market net return/a.
Marketing loan benefits/a.* 0.00 0.26 0.97 0.80 0.62 0.84 0.90 1.44 1.25 1.48 1.75
Payments to participants
PLC/base a.* 24.67 22.49 24.08 23.44 23.20 23.54 24.30 25.11 26.28 27.14 30.41
ARC/base a.* 13.75 9.50 8.18 8.15 8.57 8.24 8.85 9.13 9.50 9.90 10.39
Insurance net indemnities/a.* 9.29 11.53 12.90 13.15 13.79 14.05 14.27 14.37 14.47 14.51 14.28
*Marketing loan benefits and insurance net indemnities are averaged across all acres. PLC and ARC payments are per participating acre.
All projections are averages across 500 stochastic outcomes.
FAPRI-MU AMAP | 2018 U.S. Baseline
25
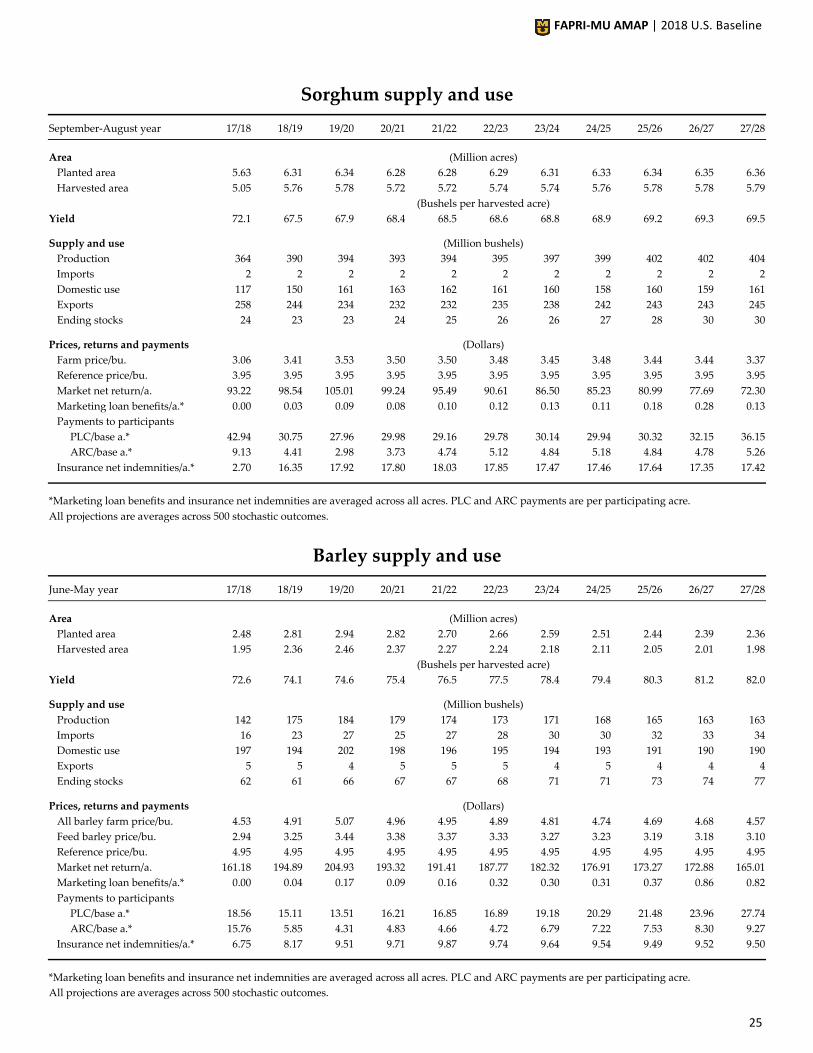
Sorghum supply and use
September-August year 17/18 18/19 19/20 20/21 21/22 22/23 23/24 24/25 25/26 26/27 27/28
Area (Million acres)
Planted area 5.63 6.31 6.34 6.28 6.28 6.29 6.31 6.33 6.34 6.35 6.36
Harvested area 5.05 5.76 5.78 5.72 5.72 5.74 5.74 5.76 5.78 5.78 5.79
(Bushels per harvested acre)
Yield 72.1 67.5 67.9 68.4 68.5 68.6 68.8 68.9 69.2 69.3 69.5
Supply and use (Million bushels)
Production 364 390 394 393 394 395 397 399 402 402 404
Imports 2 2 2 2 2 2 2 2 2 2 2
Domestic use 117 150 161 163 162 161 160 158 160 159 161
Exports 258 244 234 232 232 235 238 242 243 243 245
Ending stocks 24 23 23 24 25 26 26 27 28 30 30
Prices, returns and payments (Dollars)
Farm price/bu. 3.06 3.41 3.53 3.50 3.50 3.48 3.45 3.48 3.44 3.44 3.37
Reference price/bu. 3.95 3.95 3.95 3.95 3.95 3.95 3.95 3.95 3.95 3.95 3.95
Market net return/a. 93.22 98.54 105.01 99.24 95.49 90.61 86.50 85.23 80.99 77.69 72.30
Marketing loan benefits/a.* 0.00 0.03 0.09 0.08 0.10 0.12 0.13 0.11 0.18 0.28 0.13
Payments to participants
PLC/base a.* 42.94 30.75 27.96 29.98 29.16 29.78 30.14 29.94 30.32 32.15 36.15
ARC/base a.* 9.13 4.41 2.98 3.73 4.74 5.12 4.84 5.18 4.84 4.78 5.26
Insurance net indemnities/a.* 2.70 16.35 17.92 17.80 18.03 17.85 17.47 17.46 17.64 17.35 17.42
*Marketing loan benefits and insurance net indemnities are averaged across all acres. PLC and ARC payments are per participating acre.
All projections are averages across 500 stochastic outcomes.
Barley supply and use
June-May year 17/18 18/19 19/20 20/21 21/22 22/23 23/24 24/25 25/26 26/27 27/28
Area (Million acres)
Planted area 2.48 2.81 2.94 2.82 2.70 2.66 2.59 2.51 2.44 2.39 2.36
Harvested area 1.95 2.36 2.46 2.37 2.27 2.24 2.18 2.11 2.05 2.01 1.98
(Bushels per harvested acre)
Yield 72.6 74.1 74.6 75.4 76.5 77.5 78.4 79.4 80.3 81.2 82.0
Supply and use (Million bushels)
Production 142 175 184 179 174 173 171 168 165 163 163
Imports 16 23 27 25 27 28 30 30 32 33 34
Domestic use 197 194 202 198 196 195 194 193 191 190 190
Exports 5 5 4 5 5 5 4 5 4 4 4
Ending stocks 62 61 66 67 67 68 71 71 73 74 77
Prices, returns and payments (Dollars)
All barley farm price/bu. 4.53 4.91 5.07 4.96 4.95 4.89 4.81 4.74 4.69 4.68 4.57
Feed barley price/bu. 2.94 3.25 3.44 3.38 3.37 3.33 3.27 3.23 3.19 3.18 3.10
Reference price/bu. 4.95 4.95 4.95 4.95 4.95 4.95 4.95 4.95 4.95 4.95 4.95
Market net return/a. 161.18 194.89 204.93 193.32 191.41 187.77 182.32 176.91 173.27 172.88 165.01
Marketing loan benefits/a.* 0.00 0.04 0.17 0.09 0.16 0.32 0.30 0.31 0.37 0.86 0.82
Payments to participants
PLC/base a.* 18.56 15.11 13.51 16.21 16.85 16.89 19.18 20.29 21.48 23.96 27.74
ARC/base a.* 15.76 5.85 4.31 4.83 4.66 4.72 6.79 7.22 7.53 8.30 9.27
Insurance net indemnities/a.* 6.75 8.17 9.51 9.71 9.87 9.74 9.64 9.54 9.49 9.52 9.50
*Marketing loan benefits and insurance net indemnities are averaged across all acres. PLC and ARC payments are per participating acre.
All projections are averages across 500 stochastic outcomes.

FAPRI-MU AMAP | 2018 U.S. Baseline
26
Oats supply and use
June-May year 17/18 18/19 19/20 20/21 21/22 22/23 23/24 24/25 25/26 26/27 27/28
Area (Million acres)
Planted area 2.59 2.79 2.73 2.68 2.68 2.71 2.73 2.75 2.75 2.77 2.79
Harvested area 0.80 1.00 0.98 0.96 0.96 0.97 0.98 0.98 0.98 0.99 0.99
(Bushels per harvested acre)
Yield 61.7 65.6 66.0 66.5 66.8 67.3 67.6 67.9 68.2 68.6 69.2
Supply and use (Million bushels)
Production 49 66 65 64 65 65 66 67 67 68 69
Imports 100 101 101 100 100 98 98 97 96 95 94
Domestic use 167 164 164 162 162 162 161 161 161 160 160
Exports 2 2 2 2 2 2 2 2 2 2 2
Ending stocks 31 32 32 32 32 32 33 33 33 34 34
Prices, returns and payments (Dollars)
Farm price/bu. 2.48 2.40 2.42 2.40 2.42 2.40 2.38 2.36 2.34 2.32 2.29
Reference price/bu. 2.40 2.40 2.40 2.40 2.40 2.40 2.40 2.40 2.40 2.40 2.40
Market net return/a. 28.16 29.67 30.47 25.74 24.34 20.64 17.33 13.93 9.90 7.81 4.97
Marketing loan benefits/a.* 0.00 0.07 0.13 0.11 0.23 0.22 0.28 0.25 0.31 0.38 0.49
Payments to participants
PLC/base a.* 0.00 6.48 7.93 7.90 8.42 8.20 8.72 9.12 9.78 10.08 11.46
ARC/base a.* 5.69 2.66 1.61 1.35 1.06 1.27 1.72 1.65 1.76 1.81 1.93
Insurance net indemnities/a.* 4.25 1.54 1.65 1.67 1.71 1.73 1.66 1.63 1.69 1.60 1.65
*Marketing loan benefits and insurance net indemnities are averaged across all acres. PLC and ARC payments are per participating acre.
All projections are averages across 500 stochastic outcomes.

FAPRI-MU AMAP | 2018 U.S. Baseline
27
Rice supply and use
August-July year 17/18 18/19 19/20 20/21 21/22 22/23 23/24 24/25 25/26 26/27 27/28
Area (Million acres)
Planted area 2.46 2.65 2.59 2.54 2.52 2.51 2.51 2.54 2.57 2.61 2.62
Harvested area 2.38 2.59 2.53 2.48 2.46 2.45 2.45 2.48 2.51 2.55 2.56
(Pounds per harvested acre)
Yield 7,501 7,755 7,811 7,871 7,938 7,998 8,057 8,130 8,198 8,266 8,347
Supply and use (Million hundredweight)
Production 178.2 200.6 197.5 194.9 195.1 195.7 197.6 201.3 206.1 210.5 213.6
Imports 24.6 24.5 24.6 24.8 25.0 25.3 25.5 25.8 26.0 26.2 26.4
Domestic use 118.9 124.7 125.7 126.5 127.7 128.4 129.3 129.7 130.3 131.1 131.9
Exports 100.7 99.2 97.2 94.4 92.9 92.7 93.6 96.8 100.7 104.3 107.0
Ending stocks 28.6 29.8 29.1 27.8 27.3 27.1 27.3 27.9 29.0 30.3 31.5
Program provisions (Dollars per hundredweight)
Loan rate 6.50 6.50 6.50 6.50 6.50 6.50 6.50 6.50 6.50 6.50 6.50
Reference price
Long grain 14.00 14.00 14.00 14.00 14.00 14.00 14.00 14.00 14.00 14.00 14.00
Japonica 16.10 16.10 16.10 16.10 16.10 16.10 16.10 16.10 16.10 16.10 16.10
Other medium/short 14.00 14.00 14.00 14.00 14.00 14.00 14.00 14.00 14.00 14.00 14.00
Base area (Million acres)
Long grain 4.09 4.10 4.09 4.09 4.09 4.09 4.09 4.09 4.10 4.10 4.10
Medium/short 0.76 0.76 0.76 0.76 0.76 0.76 0.76 0.76 0.76 0.76 0.76
Countercyclical/PLC yield (Pounds per acre)
Long grain 6,019 6,019 5,925 5,925 5,925 5,925 5,925 5,926 5,926 5,926 5,926
Medium/short 7,099 7,098 7,098 7,098 7,098 7,099 7,099 7,099 7,099 7,099 7,099
PLC participation rate (Percent of base acres)
Long grain 99.8 99.8 99.8 99.8 99.8 99.8 99.8 99.8 99.8 99.8 99.8
Medium/short 69.4 69.4 69.4 69.4 69.4 69.4 69.4 69.4 69.4 69.4 69.4
ARC participation rate
Long grain 0.2 0.2 0.2 0.2 0.2 0.2 0.2 0.2 0.2 0.2 0.2
Medium/short 30.6 30.6 30.6 30.6 30.6 30.6 30.6 30.6 30.6 30.6 30.6
Prices, returns and payments (Dollars)
Farm price/cwt 12.31 11.59 11.46 11.41 11.42 11.40 11.44 11.74 12.03 12.14 12.19
Long grain 11.53 10.55 10.50 10.54 10.55 10.61 10.72 11.13 11.50 11.65 11.75
Japonica 16.47 16.94 16.65 16.38 16.42 16.15 16.04 16.02 16.10 16.14 15.99
Other medium/short 11.87 11.61 11.44 11.35 11.38 11.29 11.30 11.49 11.71 11.80 11.76
Gross market revenue/a. 923.47 898.42 895.05 898.25 906.17 911.43 921.90 954.12 986.14 1003.50 1017.45
Variable expenses/a. 550.39 554.91 562.77 584.13 601.30 617.27 632.20 647.07 660.60 672.58 683.70
Market net return/a. 373.08 343.51 332.28 314.11 304.87 294.15 289.70 307.05 325.54 330.91 333.75
Marketing loan benefits/a.* 0.00 9.19 9.21 7.21 6.69 7.86 6.71 5.05 3.65 1.98 2.82
Payments to participants
PLC/base a.* 108.09 153.37 154.42 153.38 153.97 151.20 146.85 131.08 118.02 113.13 117.75
ARC/base a.* 27.89 25.99 29.29 26.91 29.93 32.84 35.59 34.73 30.88 32.06 37.72
Insurance net indemnities/a.* 61.93 16.59 16.24 16.39 16.51 16.72 16.76 16.79 16.98 17.14 17.29
*Marketing loan benefits and insurance net indemnities are averaged across all acres. PLC and ARC payments are per participating acre.
All projections are averages across 500 stochastic outcomes.

FAPRI-MU AMAP | 2018 U.S. Baseline
28
Oils
eeds
FAPRI-MU AMAP | 2018 U.S. Baseline
30
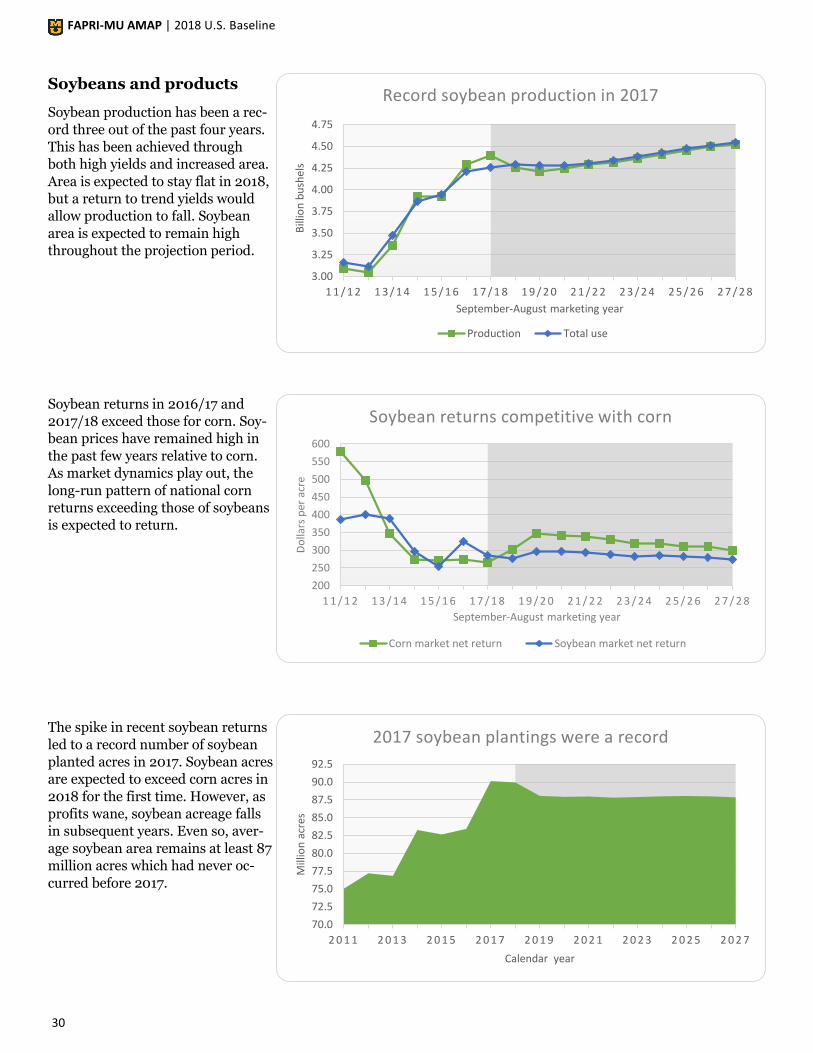
Soybeans and products
Soybean production has been a rec-
ord three out of the past four years.
This has been achieved through
both high yields and increased area.
Area is expected to stay flat in 2018,
but a return to trend yields would
allow production to fall. Soybean
area is expected to remain high
throughout the projection period.
Soybean returns in 2016/17 and
2017/18 exceed those for corn. Soy-
bean prices have remained high in
the past few years relative to corn.
As market dynamics play out, the
long-run pattern of national corn
returns exceeding those of soybeans
is expected to return.
The spike in recent soybean returns
led to a record number of soybean
planted acres in 2017. Soybean acres
are expected to exceed corn acres in
2018 for the first time. However, as
profits wane, soybean acreage falls
in subsequent years. Even so, aver-
age soybean area remains at least 87
million acres which had never oc-
curred before 2017.
200
250
300
350
400
450
500
550
600
1 1 / 1 2 1 3 / 1 4 1 5 / 1 6 1 7 / 1 8 1 9 / 2 0 2 1 / 2 2 2 3 / 2 4 2 5 / 2 6 2 7 / 2 8
Do
llars
per
acr
e
September-August marketing year
Soybean returns competitive with corn
Corn market net return Soybean market net return
70.0
72.5
75.0
77.5
80.0
82.5
85.0
87.5
90.0
92.5
2 0 1 1 2 0 1 3 2 0 1 5 2 0 1 7 2 0 1 9 2 0 2 1 2 0 2 3 2 0 2 5 2 0 2 7
Mill
ion
acr
es
Calendar year
2017 soybean plantings were a record
3.00
3.25
3.50
3.75
4.00
4.25
4.50
4.75
1 1 / 1 2 1 3 / 1 4 1 5 / 1 6 1 7 / 1 8 1 9 / 2 0 2 1 / 2 2 2 3 / 2 4 2 5 / 2 6 2 7 / 2 8B
illio
n b
ush
els
September-August marketing year
Record soybean production in 2017
Production Total use
FAPRI-MU AMAP | 2018 U.S. Baseline
31
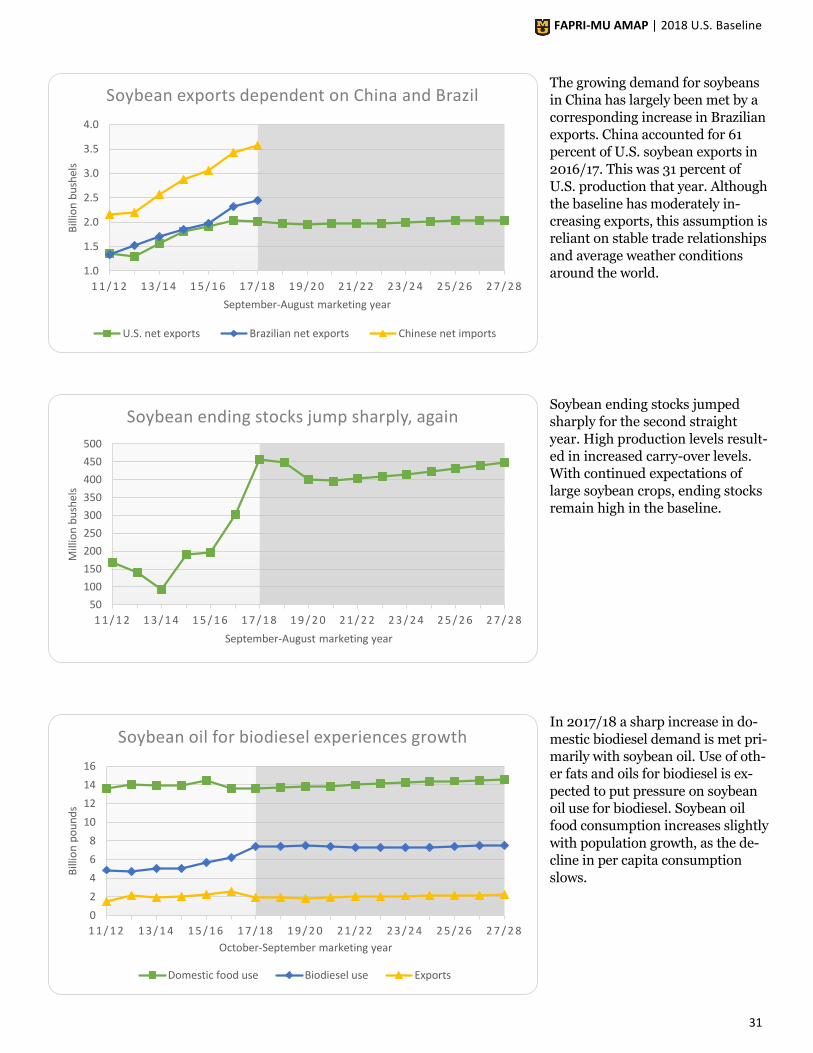
The growing demand for soybeans
in China has largely been met by a
corresponding increase in Brazilian
exports. China accounted for 61
percent of U.S. soybean exports in
2016/17. This was 31 percent of
U.S. production that year. Although
the baseline has moderately in-
creasing exports, this assumption is
reliant on stable trade relationships
and average weather conditions
around the world.
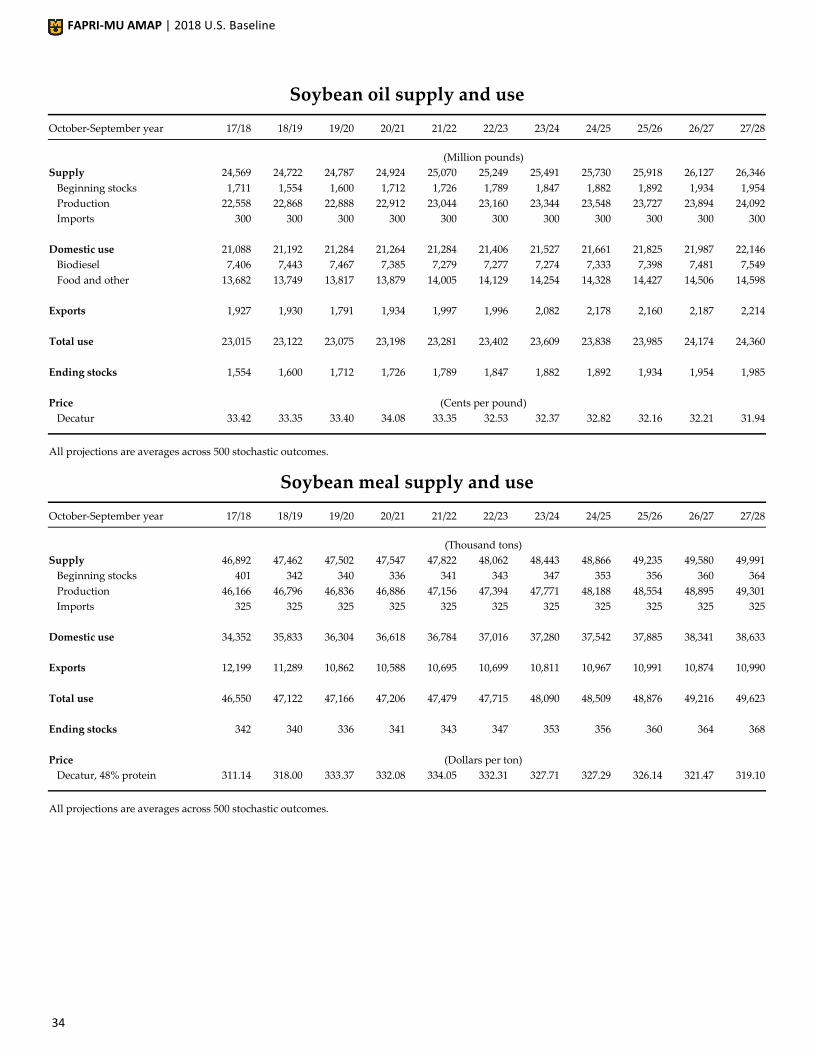
Soybean ending stocks jumped
sharply for the second straight
year. High production levels result-
ed in increased carry-over levels.
With continued expectations of
large soybean crops, ending stocks
remain high in the baseline.
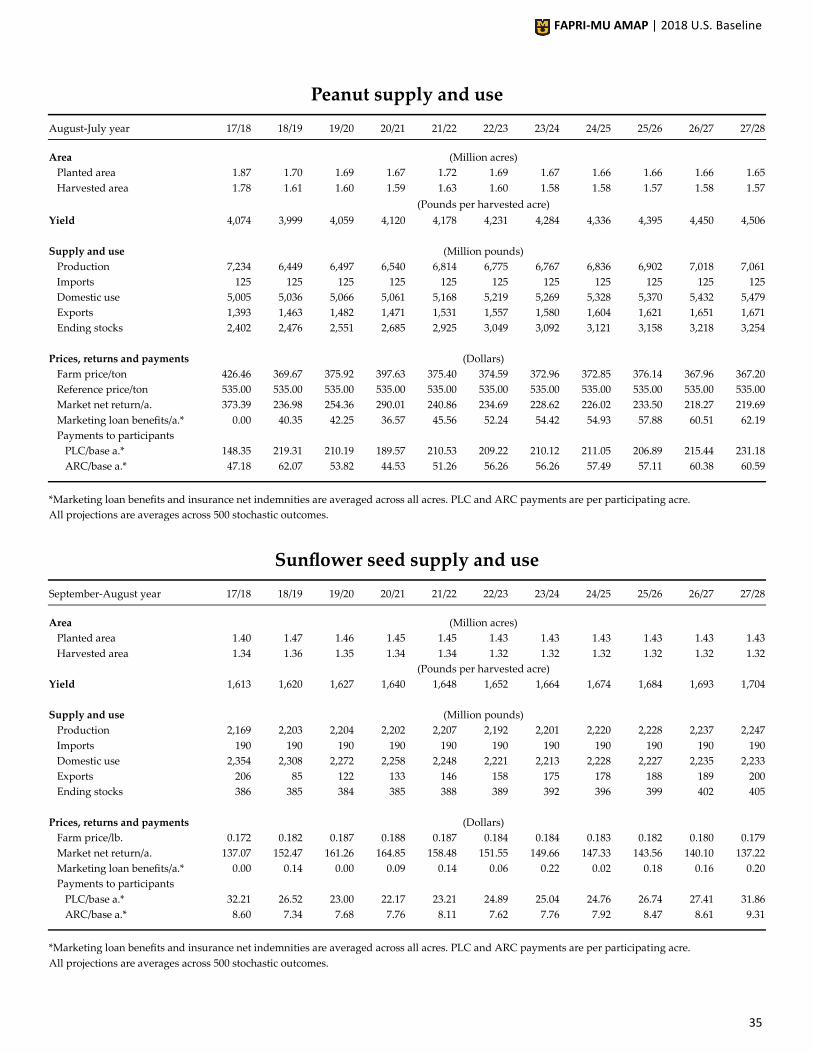
In 2017/18 a sharp increase in do-
mestic biodiesel demand is met pri-
marily with soybean oil. Use of oth-
er fats and oils for biodiesel is ex-
pected to put pressure on soybean
oil use for biodiesel. Soybean oil
food consumption increases slightly
with population growth, as the de-
cline in per capita consumption
slows.
50
100
150
200
250
300
350
400
450
500
1 1 / 1 2 1 3 / 1 4 1 5 / 1 6 1 7 / 1 8 1 9 / 2 0 2 1 / 2 2 2 3 / 2 4 2 5 / 2 6 2 7 / 2 8
Mill
ion
bu
shel
s
September-August marketing year
Soybean ending stocks jump sharply, again
1.0
1.5
2.0
2.5
3.0
3.5
4.0
1 1 / 1 2 1 3 / 1 4 1 5 / 1 6 1 7 / 1 8 1 9 / 2 0 2 1 / 2 2 2 3 / 2 4 2 5 / 2 6 2 7 / 2 8
Bill
ion
bu
shel
s
September-August marketing year
Soybean exports dependent on China and Brazil
U.S. net exports Brazilian net exports Chinese net imports
0
2
4
6
8
10
12
14
16
1 1 / 1 2 1 3 / 1 4 1 5 / 1 6 1 7 / 1 8 1 9 / 2 0 2 1 / 2 2 2 3 / 2 4 2 5 / 2 6 2 7 / 2 8
Bill
ion
po
un
ds
October-September marketing year
Soybean oil for biodiesel experiences growth
Domestic food use Biodiesel use Exports

FAPRI-MU AMAP | 2018 U.S. Baseline
32
Peanuts
Market revenues in 2017/18 are up
due to high early contracted prices
and high yields. However, peanut
farm prices are still well below the
reference price, creating large PLC
payments. Producers enrolled 99.7
percent of peanut base acres in PLC.
Until passage of the Bipartisan
Budget Act of 2018 (BBA), generic
base acres were eligible for the pay-
ments corresponding to the crops
grown on them. Peanuts have been
planted on many generic base acres.
In 2015 through 2017 total plant-
ings have been quite high in part
due to generic base acres. The base-
line does not incorporate the provi-
sions of the BBA. The BBA will like-
ly result in reduced peanut acreage
than that shown here.
Other oilseeds
Average sunflower seed and canola
prices remain below the reference
price of 20.2 cents per pound. Cano-
la area in the U.S. has been increas-
ing sharply in the past several years
with a record high in 2017. Cotton-
seed prices average less than 9.0
cents per pound through the projec-
tion period. This commodity is not a
program commodity eligible for PLC
or ARC payments, but does figure
into seed cotton prices under provi-
sions of the Bipartisan Budget Act.
1.00
1.15
1.30
1.45
1.60
1.75
1.90
2 0 1 1 2 0 1 3 2 0 1 5 2 0 1 7 2 0 1 9 2 0 2 1 2 0 2 3 2 0 2 5 2 0 2 7
Mill
ion
acr
es
Calendar year
Peanut planted area
0
5
10
15
20
25
30
35
1 1 / 1 2 1 3 / 1 4 1 5 / 1 6 1 7 / 1 8 1 9 / 2 0 2 1 / 2 2 2 3 / 2 4 2 5 / 2 6 2 7 / 2 8
Cen
ts p
er p
ou
nd
Marketing year
Oilseed prices
Sunflower seed Canola Cottonseed
0
200
400
600
800
1000
1200
1400
1 1 / 1 2 1 3 / 1 4 1 5 / 1 6 1 7 / 1 8 1 9 / 2 0 2 1 / 2 2 2 3 / 2 4 2 5 / 2 6 2 7 / 2 8D
olla
rs p
er a
cre
August-July marketing year
Peanut PLC payments maintain margins
Market Program payments Variable expenses

FAPRI-MU AMAP | 2018 U.S. Baseline
33
Soybean supply and use
September-August year 17/18 18/19 19/20 20/21 21/22 22/23 23/24 24/25 25/26 26/27 27/28
Area (Million acres)
Planted area 90.1 90.0 88.1 87.9 88.0 87.8 87.9 88.0 88.0 88.0 87.9
Harvested area 89.5 89.1 87.3 87.1 87.2 87.0 87.1 87.2 87.3 87.2 87.1
(Bushels per harvested acre)
Yield 49.1 47.8 48.3 48.7 49.2 49.6 50.0 50.5 51.0 51.5 52.0
(Million bushels)
Supply 4,718 4,741 4,686 4,673 4,708 4,743 4,794 4,847 4,902 4,949 4,992
Beginning stocks 302 457 449 402 396 405 410 415 423 431 441
Production 4,392 4,259 4,212 4,246 4,287 4,314 4,359 4,407 4,454 4,494 4,526
Imports 25 25 25 25 25 25 25 25 25 25 25
Domestic use 2,092 2,111 2,111 2,114 2,127 2,139 2,157 2,176 2,194 2,210 2,229
Crush 1,953 1,976 1,978 1,980 1,991 2,001 2,017 2,035 2,050 2,065 2,082
Seed and residual 139 135 133 134 136 138 140 142 143 145 147
Exports 2,169 2,182 2,173 2,162 2,176 2,194 2,222 2,248 2,277 2,299 2,316
Total use 4,261 4,293 4,284 4,277 4,303 4,334 4,379 4,424 4,471 4,508 4,544
Ending stocks 457 449 402 396 405 410 415 423 431 441 448
CCC inventory 0 0 0 0 0 0 0 0 0 0 0
Under loan 12 14 13 13 14 15 16 17 17 19 20
Other stocks 446 435 389 383 391 394 399 406 413 423 429
Prices, program provisions (Dollars per bushel)
Farm price 9.23 9.38 9.75 9.81 9.75 9.63 9.51 9.53 9.44 9.34 9.22
Illinois processor price 9.58 9.73 10.10 10.15 10.09 9.98 9.86 9.88 9.79 9.70 9.58
Loan rate 5.00 5.00 5.00 5.00 5.00 5.00 5.00 5.00 5.00 5.00 5.00
Reference price 8.40 8.40 8.40 8.40 8.40 8.40 8.40 8.40 8.40 8.40 8.40
(Million acres)
Base area 53.0 53.0 53.0 53.0 53.0 53.0 53.0 53.0 53.0 53.0 53.0
(Bushels per acre)
PLC program yield 35.7 35.7 38.4 38.4 38.4 38.4 38.4 38.4 38.4 38.4 38.4
(Percent of base acres)
PLC participation rate 3.2 3.2 60.0 60.0 60.0 60.0 60.0 60.0 60.0 60.0 60.0
ARC participation rate 96.8 96.8 40.0 40.0 40.0 40.0 40.0 40.0 40.0 40.0 40.0
Returns and payments (Dollars)
Gross market revenue/a. 452.56 443.90 466.06 473.63 474.63 472.49 471.82 477.60 477.73 477.21 474.97
Variable expenses/a. 168.00 167.96 170.40 176.10 180.78 185.07 188.83 192.43 195.46 198.05 200.47
Market net return/a. 284.56 275.94 295.66 297.53 293.84 287.42 282.99 285.16 282.27 279.17 274.50
Marketing loan benefits/a.* 0.00 0.09 0.12 0.02 0.14 0.10 0.06 0.13 0.05 0.11 0.26
Payments to participants
PLC/base a.* 0.00 9.04 9.16 8.67 9.91 11.50 10.81 11.11 11.04 12.65 14.20
ARC/base a.* 9.44 8.77 6.74 6.01 7.23 7.50 8.84 8.78 8.76 9.22 10.09
Insurance net indemnities/a.* -1.59 15.03 14.95 15.53 15.99 16.20 16.39 16.57 16.67 16.60 16.26
(Dollars per bushel)
Crush margin 1.63 1.66 1.66 1.66 1.68 1.66 1.65 1.67 1.66 1.64 1.68
*Marketing loan benefits and insurance net indemnities are averaged across all acres. PLC and ARC payments are per participating acre.
All projections are averages across 500 stochastic outcomes.
FAPRI-MU AMAP | 2018 U.S. Baseline
34
Soybean oil supply and use
October-September year 17/18 18/19 19/20 20/21 21/22 22/23 23/24 24/25 25/26 26/27 27/28
(Million pounds)
Supply 24,569 24,722 24,787 24,924 25,070 25,249 25,491 25,730 25,918 26,127 26,346
Beginning stocks 1,711 1,554 1,600 1,712 1,726 1,789 1,847 1,882 1,892 1,934 1,954
Production 22,558 22,868 22,888 22,912 23,044 23,160 23,344 23,548 23,727 23,894 24,092
Imports 300 300 300 300 300 300 300 300 300 300 300
Domestic use 21,088 21,192 21,284 21,264 21,284 21,406 21,527 21,661 21,825 21,987 22,146
Biodiesel 7,406 7,443 7,467 7,385 7,279 7,277 7,274 7,333 7,398 7,481 7,549
Food and other 13,682 13,749 13,817 13,879 14,005 14,129 14,254 14,328 14,427 14,506 14,598
Exports 1,927 1,930 1,791 1,934 1,997 1,996 2,082 2,178 2,160 2,187 2,214
Total use 23,015 23,122 23,075 23,198 23,281 23,402 23,609 23,838 23,985 24,174 24,360
Ending stocks 1,554 1,600 1,712 1,726 1,789 1,847 1,882 1,892 1,934 1,954 1,985
Price (Cents per pound)
Decatur 33.42 33.35 33.40 34.08 33.35 32.53 32.37 32.82 32.16 32.21 31.94
All projections are averages across 500 stochastic outcomes.
Soybean meal supply and use
October-September year 17/18 18/19 19/20 20/21 21/22 22/23 23/24 24/25 25/26 26/27 27/28
(Thousand tons)
Supply 46,892 47,462 47,502 47,547 47,822 48,062 48,443 48,866 49,235 49,580 49,991
Beginning stocks 401 342 340 336 341 343 347 353 356 360 364
Production 46,166 46,796 46,836 46,886 47,156 47,394 47,771 48,188 48,554 48,895 49,301
Imports 325 325 325 325 325 325 325 325 325 325 325
Domestic use 34,352 35,833 36,304 36,618 36,784 37,016 37,280 37,542 37,885 38,341 38,633
Exports 12,199 11,289 10,862 10,588 10,695 10,699 10,811 10,967 10,991 10,874 10,990
Total use 46,550 47,122 47,166 47,206 47,479 47,715 48,090 48,509 48,876 49,216 49,623
Ending stocks 342 340 336 341 343 347 353 356 360 364 368
Price (Dollars per ton)
Decatur, 48% protein 311.14 318.00 333.37 332.08 334.05 332.31 327.71 327.29 326.14 321.47 319.10
All projections are averages across 500 stochastic outcomes.
FAPRI-MU AMAP | 2018 U.S. Baseline
35
Peanut supply and use
August-July year 17/18 18/19 19/20 20/21 21/22 22/23 23/24 24/25 25/26 26/27 27/28
Area (Million acres)
Planted area 1.87 1.70 1.69 1.67 1.72 1.69 1.67 1.66 1.66 1.66 1.65
Harvested area 1.78 1.61 1.60 1.59 1.63 1.60 1.58 1.58 1.57 1.58 1.57
(Pounds per harvested acre)
Yield 4,074 3,999 4,059 4,120 4,178 4,231 4,284 4,336 4,395 4,450 4,506
Supply and use (Million pounds)
Production 7,234 6,449 6,497 6,540 6,814 6,775 6,767 6,836 6,902 7,018 7,061
Imports 125 125 125 125 125 125 125 125 125 125 125
Domestic use 5,005 5,036 5,066 5,061 5,168 5,219 5,269 5,328 5,370 5,432 5,479
Exports 1,393 1,463 1,482 1,471 1,531 1,557 1,580 1,604 1,621 1,651 1,671
Ending stocks 2,402 2,476 2,551 2,685 2,925 3,049 3,092 3,121 3,158 3,218 3,254
Prices, returns and payments (Dollars)
Farm price/ton 426.46 369.67 375.92 397.63 375.40 374.59 372.96 372.85 376.14 367.96 367.20
Reference price/ton 535.00 535.00 535.00 535.00 535.00 535.00 535.00 535.00 535.00 535.00 535.00
Market net return/a. 373.39 236.98 254.36 290.01 240.86 234.69 228.62 226.02 233.50 218.27 219.69
Marketing loan benefits/a.* 0.00 40.35 42.25 36.57 45.56 52.24 54.42 54.93 57.88 60.51 62.19
Payments to participants
PLC/base a.* 148.35 219.31 210.19 189.57 210.53 209.22 210.12 211.05 206.89 215.44 231.18
ARC/base a.* 47.18 62.07 53.82 44.53 51.26 56.26 56.26 57.49 57.11 60.38 60.59
*Marketing loan benefits and insurance net indemnities are averaged across all acres. PLC and ARC payments are per participating acre.
All projections are averages across 500 stochastic outcomes.
Sunflower seed supply and use
September-August year 17/18 18/19 19/20 20/21 21/22 22/23 23/24 24/25 25/26 26/27 27/28
Area (Million acres)
Planted area 1.40 1.47 1.46 1.45 1.45 1.43 1.43 1.43 1.43 1.43 1.43
Harvested area 1.34 1.36 1.35 1.34 1.34 1.32 1.32 1.32 1.32 1.32 1.32
(Pounds per harvested acre)
Yield 1,613 1,620 1,627 1,640 1,648 1,652 1,664 1,674 1,684 1,693 1,704
Supply and use (Million pounds)
Production 2,169 2,203 2,204 2,202 2,207 2,192 2,201 2,220 2,228 2,237 2,247
Imports 190 190 190 190 190 190 190 190 190 190 190
Domestic use 2,354 2,308 2,272 2,258 2,248 2,221 2,213 2,228 2,227 2,235 2,233
Exports 206 85 122 133 146 158 175 178 188 189 200
Ending stocks 386 385 384 385 388 389 392 396 399 402 405
Prices, returns and payments (Dollars)
Farm price/lb. 0.172 0.182 0.187 0.188 0.187 0.184 0.184 0.183 0.182 0.180 0.179
Market net return/a. 137.07 152.47 161.26 164.85 158.48 151.55 149.66 147.33 143.56 140.10 137.22
Marketing loan benefits/a.* 0.00 0.14 0.00 0.09 0.14 0.06 0.22 0.02 0.18 0.16 0.20
Payments to participants
PLC/base a.* 32.21 26.52 23.00 22.17 23.21 24.89 25.04 24.76 26.74 27.41 31.86
ARC/base a.* 8.60 7.34 7.68 7.76 8.11 7.62 7.76 7.92 8.47 8.61 9.31
*Marketing loan benefits and insurance net indemnities are averaged across all acres. PLC and ARC payments are per participating acre.
All projections are averages across 500 stochastic outcomes.

FAPRI-MU AMAP | 2018 U.S. Baseline
36
Cottonseed and canola production and prices
Marketing year 17/18 18/19 19/20 20/21 21/22 22/23 23/24 24/25 25/26 26/27 27/28
Production (Thousand tons, Aug.-Jul. year)
Cottonseed 6,725 6,209 6,079 6,242 6,154 6,207 6,222 6,282 6,317 6,325 6,331
(Million pounds, Jul.-Jun. year)
Canola 3,119 3,297 3,298 3,315 3,330 3,340 3,363 3,389 3,420 3,453 3,481
Prices (Dollars per ton, Aug.-Jul. year)
Cottonseed 147 166 175 174 174 172 171 170 169 168 167
Canola (Cents per pound, Jul.-Jun. year)
Farm price 17.1 17.1 17.6 17.8 17.7 17.6 17.5 17.5 17.4 17.3 17.1
Reference price 20.2 20.2 20.2 20.2 20.2 20.2 20.2 20.2 20.2 20.2 20.2
Cottonseed production, cottonseed prices and canola farm prices are averages across 500 stochastic outcomes.

Oth
er cr
ops

FAPRI-MU AMAP | 2018 U.S. Baseline
38
Upland cotton
China continues to be the main
source of uncertainty in world cot-
ton markets. Policy choices have
led to very large Chinese stocks,
which are over one year’s worth of
domestic use. This inventory has
hung over world prices for several
years. Recently, China has begun a
drawdown of stocks which has
helped alleviate the low prices.
However, prices still remain low by
historical standards.
The low upland cotton prices have
forced many acres away from the
crop. Returns in 2016 and 2017 saw
some recovery which helped bring
upland cotton acres up from 2015
levels. Incorporating the BBA could
impact U.S. cotton acres with the
elimination of generic base acres
and payments correlated to produc-
er returns.
The Bipartisan Budget Act and cotton
The Bipartisan Budget Act (BBA) became public law on February 9, 2018. It effectively eliminated the STAX
crop insurance program and generic base acres and replaced them with a new commodity called seed cotton.
Seed cotton is the pre-ginned crop that includes both the seed and lint. Unfortunately, due to the timeline of
the baseline, there was not enough time to incorporate the new programs into the baseline. The cotton pro-
grams assumed here are those established in the 2014 farm bill.
The BBA established a reference price for feed cotton of $0.367 per pound. Preliminary calculations indicate
that the expected 2018/19 seed cotton price would be around $0.31 per pound and $0.34 per pound thereaf-
ter. Total spending on the commodity will also depend upon PLC yields and allocated base acres.
30
40
50
60
70
80
90
100
1 1 / 1 2 1 3 / 1 4 1 5 / 1 6 1 7 / 1 8 1 9 / 2 0 2 1 / 2 2 2 3 / 2 4 2 5 / 2 6 2 7 / 2 8
Cen
ts p
er p
ou
nd
August-July marketing year
Upland cotton prices up, slightly
Farm price Adjusted world price Loan rate
8
9
10
11
12
13
14
15
2 0 1 1 2 0 1 3 2 0 1 5 2 0 1 7 2 0 1 9 2 0 2 1 2 0 2 3 2 0 2 5 2 0 2 7
Mill
ion
acr
es
Calendar year
Upland cotton planted area
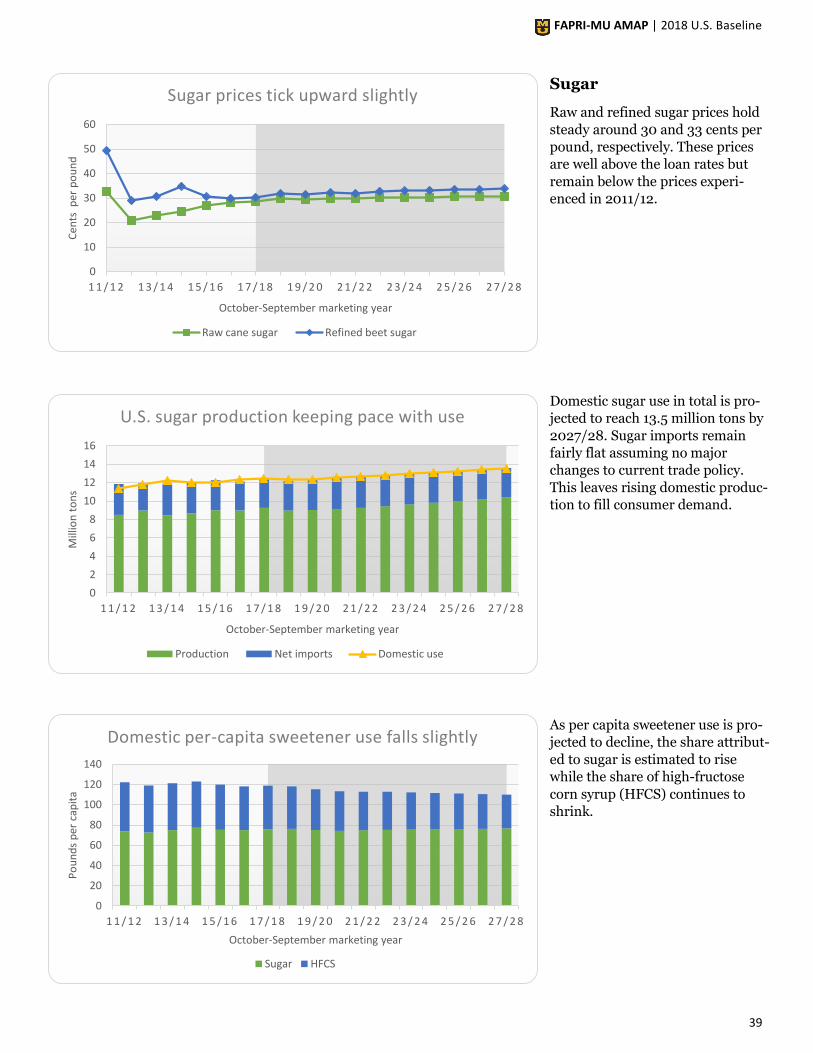
FAPRI-MU AMAP | 2018 U.S. Baseline
39
Sugar
Raw and refined sugar prices hold
steady around 30 and 33 cents per
pound, respectively. These prices
are well above the loan rates but
remain below the prices experi-
enced in 2011/12.
Domestic sugar use in total is pro-
jected to reach 13.5 million tons by
2027/28. Sugar imports remain
fairly flat assuming no major
changes to current trade policy.
This leaves rising domestic produc-
tion to fill consumer demand.
As per capita sweetener use is pro-
jected to decline, the share attribut-
ed to sugar is estimated to rise
while the share of high-fructose
corn syrup (HFCS) continues to
shrink.
0
10
20
30
40
50
60
1 1 / 1 2 1 3 / 1 4 1 5 / 1 6 1 7 / 1 8 1 9 / 2 0 2 1 / 2 2 2 3 / 2 4 2 5 / 2 6 2 7 / 2 8
Cen
ts p
er p
ou
nd
October-September marketing year
Sugar prices tick upward slightly
Raw cane sugar Refined beet sugar
0
2
4
6
8
10
12
14
16
1 1 / 1 2 1 3 / 1 4 1 5 / 1 6 1 7 / 1 8 1 9 / 2 0 2 1 / 2 2 2 3 / 2 4 2 5 / 2 6 2 7 / 2 8
Mill
ion
to
ns
October-September marketing year
U.S. sugar production keeping pace with use
Production Net imports Domestic use
0
20
40
60
80
100
120
140
1 1 / 1 2 1 3 / 1 4 1 5 / 1 6 1 7 / 1 8 1 9 / 2 0 2 1 / 2 2 2 3 / 2 4 2 5 / 2 6 2 7 / 2 8
Po
un
ds
per
cap
ita
October-September marketing year
Domestic per-capita sweetener use falls slightly
Sugar HFCS
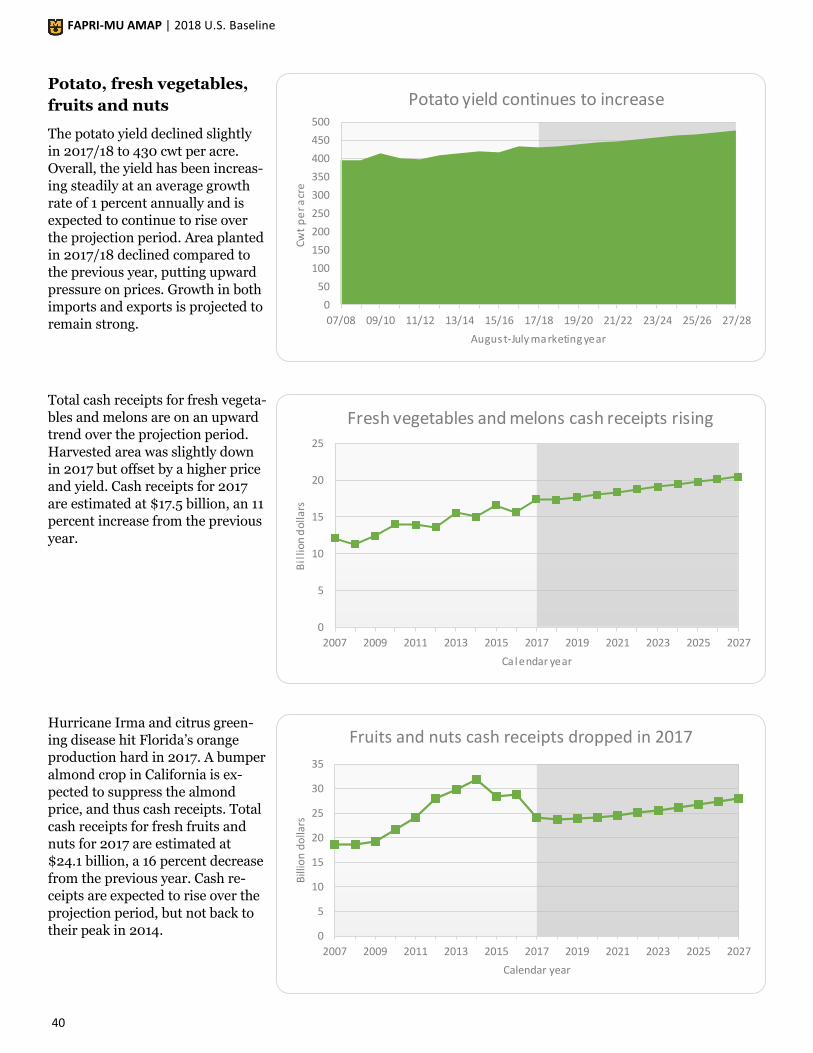
FAPRI-MU AMAP | 2018 U.S. Baseline
40
Potato, fresh vegetables,
fruits and nuts
The potato yield declined slightly
in 2017/18 to 430 cwt per acre.
Overall, the yield has been increas-
ing steadily at an average growth
rate of 1 percent annually and is
expected to continue to rise over
the projection period. Area planted
in 2017/18 declined compared to
the previous year, putting upward
pressure on prices. Growth in both
imports and exports is projected to
remain strong.
Total cash receipts for fresh vegeta-
bles and melons are on an upward
trend over the projection period.
Harvested area was slightly down
in 2017 but offset by a higher price
and yield. Cash receipts for 2017
are estimated at $17.5 billion, an 11
percent increase from the previous
year.
Hurricane Irma and citrus green-
ing disease hit Florida’s orange
production hard in 2017. A bumper
almond crop in California is ex-
pected to suppress the almond
price, and thus cash receipts. Total
cash receipts for fresh fruits and
nuts for 2017 are estimated at
$24.1 billion, a 16 percent decrease
from the previous year. Cash re-
ceipts are expected to rise over the
projection period, but not back to
their peak in 2014.
0
50
100
150
200
250
300
350
400
450
500
07/08 09/10 11/12 13/14 15/16 17/18 19/20 21/22 23/24 25/26 27/28
Cwt
pe
r acr
e
August-July marketing year
Potato yield continues to increase
0
5
10
15
20
25
2007 2009 2011 2013 2015 2017 2019 2021 2023 2025 2027
Bil
lion
dol
lars
Calendar year
Fresh vegetables and melons cash receipts rising
0
5
10
15
20
25
30
35
2007 2009 2011 2013 2015 2017 2019 2021 2023 2025 2027
Bill
ion
do
llars
Calendar year
Fruits and nuts cash receipts dropped in 2017
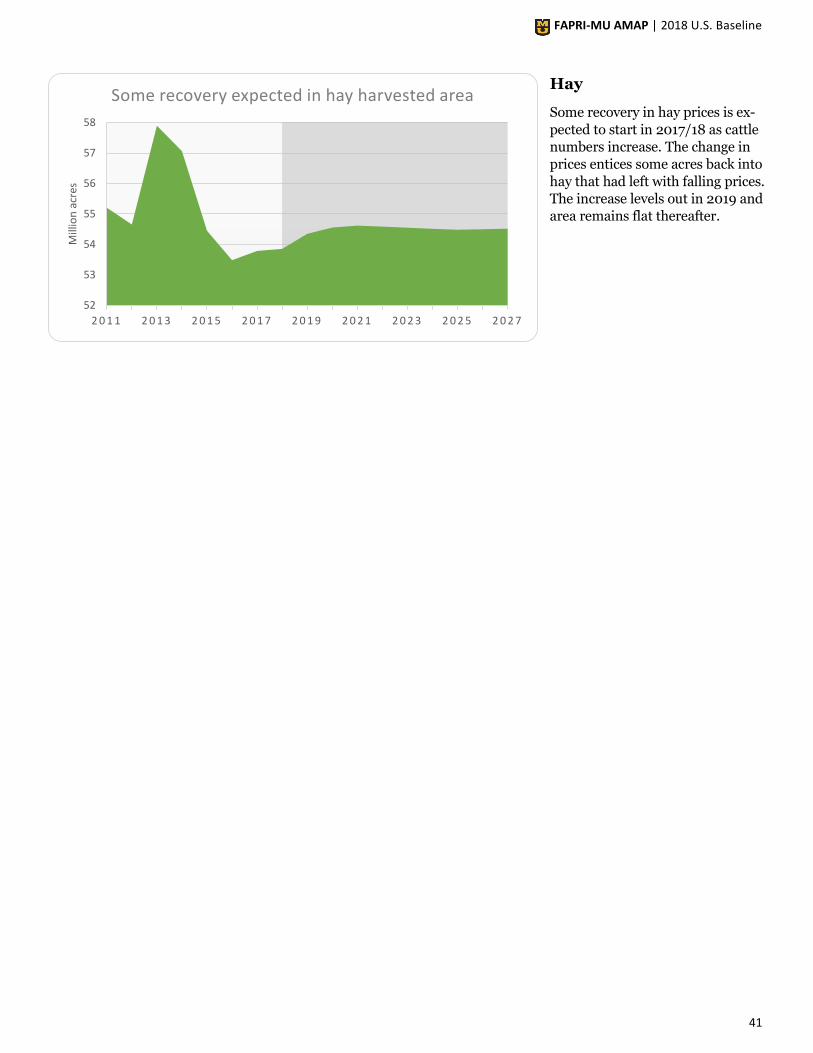
FAPRI-MU AMAP | 2018 U.S. Baseline
41
Hay
Some recovery in hay prices is ex-
pected to start in 2017/18 as cattle
numbers increase. The change in
prices entices some acres back into
hay that had left with falling prices.
The increase levels out in 2019 and
area remains flat thereafter.
52
53
54
55
56
57
58
2 0 1 1 2 0 1 3 2 0 1 5 2 0 1 7 2 0 1 9 2 0 2 1 2 0 2 3 2 0 2 5 2 0 2 7
Mill
ion
acr
es
Some recovery expected in hay harvested area
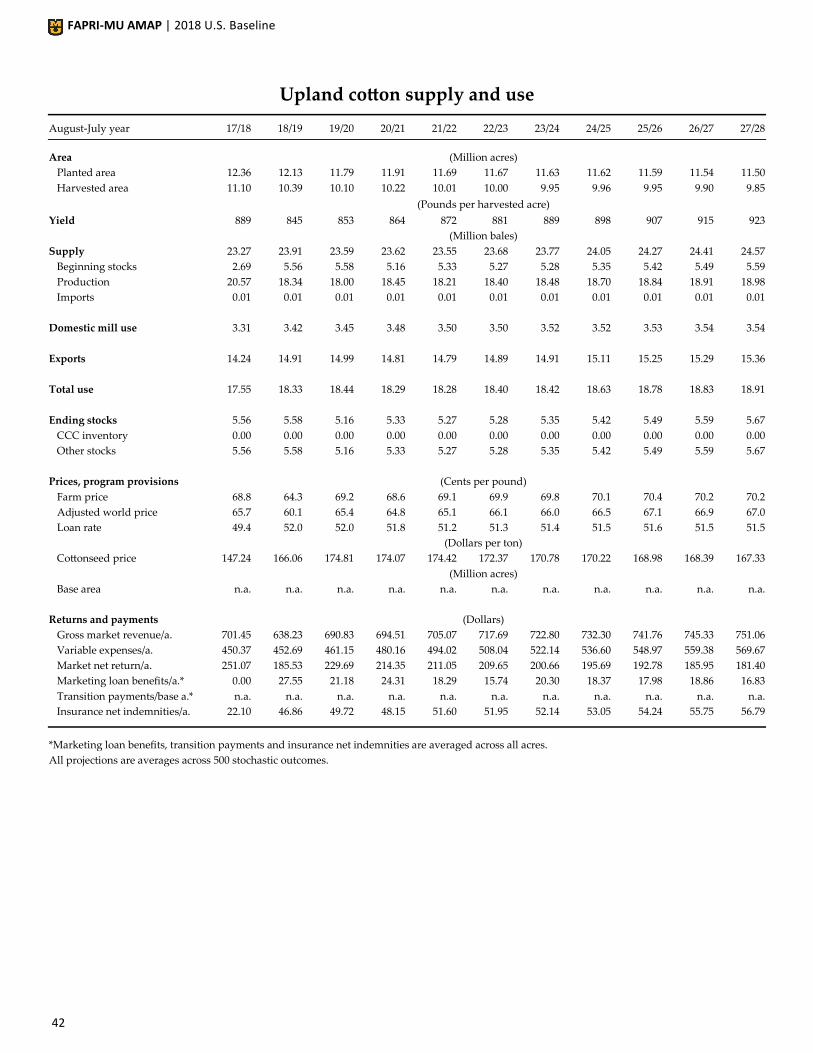
FAPRI-MU AMAP | 2018 U.S. Baseline
42
Upland cotton supply and use
August-July year 17/18 18/19 19/20 20/21 21/22 22/23 23/24 24/25 25/26 26/27 27/28
Area (Million acres)
Planted area 12.36 12.13 11.79 11.91 11.69 11.67 11.63 11.62 11.59 11.54 11.50
Harvested area 11.10 10.39 10.10 10.22 10.01 10.00 9.95 9.96 9.95 9.90 9.85
(Pounds per harvested acre)
Yield 889 845 853 864 872 881 889 898 907 915 923
(Million bales)
Supply 23.27 23.91 23.59 23.62 23.55 23.68 23.77 24.05 24.27 24.41 24.57
Beginning stocks 2.69 5.56 5.58 5.16 5.33 5.27 5.28 5.35 5.42 5.49 5.59
Production 20.57 18.34 18.00 18.45 18.21 18.40 18.48 18.70 18.84 18.91 18.98
Imports 0.01 0.01 0.01 0.01 0.01 0.01 0.01 0.01 0.01 0.01 0.01
Domestic mill use 3.31 3.42 3.45 3.48 3.50 3.50 3.52 3.52 3.53 3.54 3.54
Exports 14.24 14.91 14.99 14.81 14.79 14.89 14.91 15.11 15.25 15.29 15.36
Total use 17.55 18.33 18.44 18.29 18.28 18.40 18.42 18.63 18.78 18.83 18.91
Ending stocks 5.56 5.58 5.16 5.33 5.27 5.28 5.35 5.42 5.49 5.59 5.67
CCC inventory 0.00 0.00 0.00 0.00 0.00 0.00 0.00 0.00 0.00 0.00 0.00
Other stocks 5.56 5.58 5.16 5.33 5.27 5.28 5.35 5.42 5.49 5.59 5.67
Prices, program provisions (Cents per pound)
Farm price 68.8 64.3 69.2 68.6 69.1 69.9 69.8 70.1 70.4 70.2 70.2
Adjusted world price 65.7 60.1 65.4 64.8 65.1 66.1 66.0 66.5 67.1 66.9 67.0
Loan rate 49.4 52.0 52.0 51.8 51.2 51.3 51.4 51.5 51.6 51.5 51.5
(Dollars per ton)
Cottonseed price 147.24 166.06 174.81 174.07 174.42 172.37 170.78 170.22 168.98 168.39 167.33
(Million acres)
Base area n.a. n.a. n.a. n.a. n.a. n.a. n.a. n.a. n.a. n.a. n.a.
Returns and payments (Dollars)
Gross market revenue/a. 701.45 638.23 690.83 694.51 705.07 717.69 722.80 732.30 741.76 745.33 751.06
Variable expenses/a. 450.37 452.69 461.15 480.16 494.02 508.04 522.14 536.60 548.97 559.38 569.67
251.07 185.53 229.69 214.35 211.05 209.65 200.66 195.69 192.78 185.95 181.40 Market net return/a.
Marketing loan benefits/a.* 0.00 27.55 21.18 24.31 18.29 15.74 20.30 18.37 17.98 18.86 16.83
Transition payments/base a.* n.a. n.a. n.a. n.a. n.a. n.a. n.a. n.a. n.a. n.a. n.a.
Insurance net indemnities/a. 22.10 46.86 49.72 48.15 51.60 51.95 52.14 53.05 54.24 55.75 56.79
*Marketing loan benefits, transition payments and insurance net indemnities are averaged across all acres.
All projections are averages across 500 stochastic outcomes.
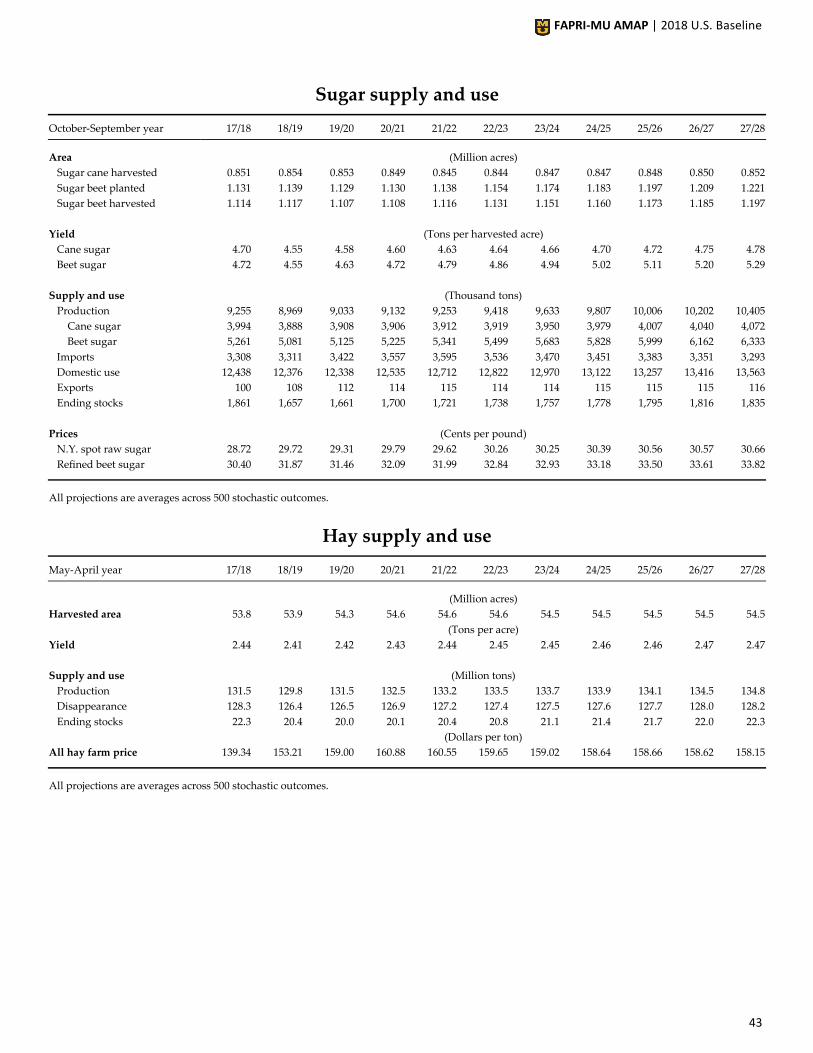
FAPRI-MU AMAP | 2018 U.S. Baseline
43
Sugar supply and use
October-September year 17/18 18/19 19/20 20/21 21/22 22/23 23/24 24/25 25/26 26/27 27/28
Area (Million acres)
Sugar cane harvested 0.851 0.854 0.853 0.849 0.845 0.844 0.847 0.847 0.848 0.850 0.852
Sugar beet planted 1.131 1.139 1.129 1.130 1.138 1.154 1.174 1.183 1.197 1.209 1.221
Sugar beet harvested 1.114 1.117 1.107 1.108 1.116 1.131 1.151 1.160 1.173 1.185 1.197
Yield (Tons per harvested acre)
Cane sugar 4.70 4.55 4.58 4.60 4.63 4.64 4.66 4.70 4.72 4.75 4.78
Beet sugar 4.72 4.55 4.63 4.72 4.79 4.86 4.94 5.02 5.11 5.20 5.29
Supply and use (Thousand tons)
Production 9,255 8,969 9,033 9,132 9,253 9,418 9,633 9,807 10,006 10,202 10,405
Cane sugar 3,994 3,888 3,908 3,906 3,912 3,919 3,950 3,979 4,007 4,040 4,072
Beet sugar 5,261 5,081 5,125 5,225 5,341 5,499 5,683 5,828 5,999 6,162 6,333
Imports 3,308 3,311 3,422 3,557 3,595 3,536 3,470 3,451 3,383 3,351 3,293
Domestic use 12,438 12,376 12,338 12,535 12,712 12,822 12,970 13,122 13,257 13,416 13,563
Exports 100 108 112 114 115 114 114 115 115 115 116
Ending stocks 1,861 1,657 1,661 1,700 1,721 1,738 1,757 1,778 1,795 1,816 1,835
Prices (Cents per pound)
N.Y. spot raw sugar 28.72 29.72 29.31 29.79 29.62 30.26 30.25 30.39 30.56 30.57 30.66
Refined beet sugar 30.40 31.87 31.46 32.09 31.99 32.84 32.93 33.18 33.50 33.61 33.82
All projections are averages across 500 stochastic outcomes.
Hay supply and use
May-April year 17/18 18/19 19/20 20/21 21/22 22/23 23/24 24/25 25/26 26/27 27/28
(Million acres)
Harvested area 53.8 53.9 54.3 54.6 54.6 54.6 54.5 54.5 54.5 54.5 54.5
(Tons per acre)
Yield 2.44 2.41 2.42 2.43 2.44 2.45 2.45 2.46 2.46 2.47 2.47
Supply and use (Million tons)
Production 131.5 129.8 131.5 132.5 133.2 133.5 133.7 133.9 134.1 134.5 134.8
Disappearance 128.3 126.4 126.5 126.9 127.2 127.4 127.5 127.6 127.7 128.0 128.2
Ending stocks 22.3 20.4 20.0 20.1 20.4 20.8 21.1 21.4 21.7 22.0 22.3
(Dollars per ton)
All hay farm price 139.34 153.21 159.00 160.88 160.55 159.65 159.02 158.64 158.66 158.62 158.15
All projections are averages across 500 stochastic outcomes.
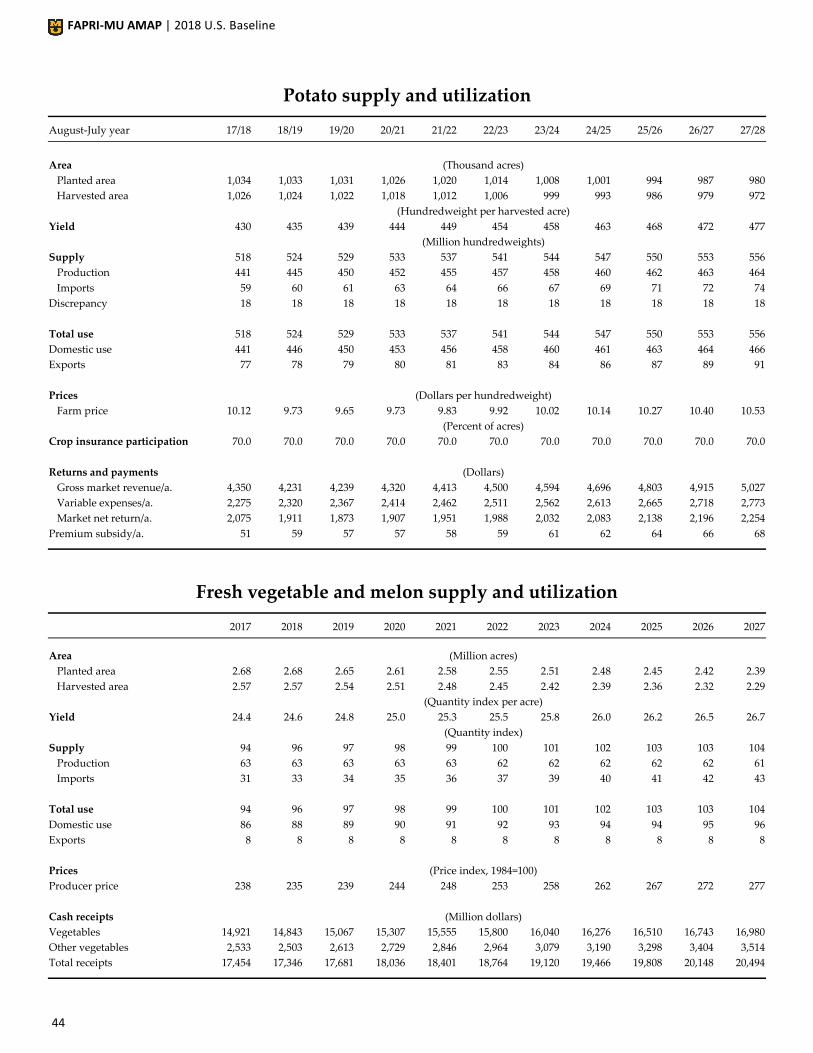
FAPRI-MU AMAP | 2018 U.S. Baseline
44
Potato supply and utilization
August-July year 17/18 18/19 19/20 20/21 21/22 22/23 23/24 24/25 25/26 26/27 27/28
Area (Thousand acres)
Planted area 1,034 1,033 1,031 1,026 1,020 1,014 1,008 1,001 994 987 980
Harvested area 1,026 1,024 1,022 1,018 1,012 1,006 999 993 986 979 972
(Hundredweight per harvested acre)
Yield 430 435 439 444 449 454 458 463 468 472 477
(Million hundredweights)
Supply 518 524 529 533 537 541 544 547 550 553 556
Production 441 445 450 452 455 457 458 460 462 463 464
Imports 59 60 61 63 64 66 67 69 71 72 74
Discrepancy 18 18 18 18 18 18 18 18 18 18 18
Total use 518 524 529 533 537 541 544 547 550 553 556
Domestic use 441 446 450 453 456 458 460 461 463 464 466
Exports 77 78 79 80 81 83 84 86 87 89 91
Prices (Dollars per hundredweight)
Farm price 10.12 9.73 9.65 9.73 9.83 9.92 10.02 10.14 10.27 10.40 10.53
(Percent of acres)
Crop insurance participation 70.0 70.0 70.0 70.0 70.0 70.0 70.0 70.0 70.0 70.0 70.0
Returns and payments (Dollars)
Gross market revenue/a. 4,350 4,231 4,239 4,320 4,413 4,500 4,594 4,696 4,803 4,915 5,027
Variable expenses/a. 2,275 2,320 2,367 2,414 2,462 2,511 2,562 2,613 2,665 2,718 2,773
Market net return/a. 2,075 1,911 1,873 1,907 1,951 1,988 2,032 2,083 2,138 2,196 2,254
Premium subsidy/a. 51 59 57 57 58 59 61 62 64 66 68
Fresh vegetable and melon supply and utilization
2017 2018 2019 2020 2021 2022 2023 2024 2025 2026 2027
Area (Million acres)
Planted area 2.68 2.68 2.65 2.61 2.58 2.55 2.51 2.48 2.45 2.42 2.39
Harvested area 2.57 2.57 2.54 2.51 2.48 2.45 2.42 2.39 2.36 2.32 2.29
(Quantity index per acre)
Yield 24.4 24.6 24.8 25.0 25.3 25.5 25.8 26.0 26.2 26.5 26.7
(Quantity index)
Supply 94 96 97 98 99 100 101 102 103 103 104
Production 63 63 63 63 63 62 62 62 62 62 61
Imports 31 33 34 35 36 37 39 40 41 42 43
Total use 94 96 97 98 99 100 101 102 103 103 104
Domestic use 86 88 89 90 91 92 93 94 94 95 96
Exports 8 8 8 8 8 8 8 8 8 8 8
Prices (Price index, 1984=100)
Producer price 238 235 239 244 248 253 258 262 267 272 277
Cash receipts (Million dollars)
Vegetables 14,921 14,843 15,067 15,307 15,555 15,800 16,040 16,276 16,510 16,743 16,980
Other vegetables 2,533 2,503 2,613 2,729 2,846 2,964 3,079 3,190 3,298 3,404 3,514
Total receipts 17,454 17,346 17,681 18,036 18,401 18,764 19,120 19,466 19,808 20,148 20,494
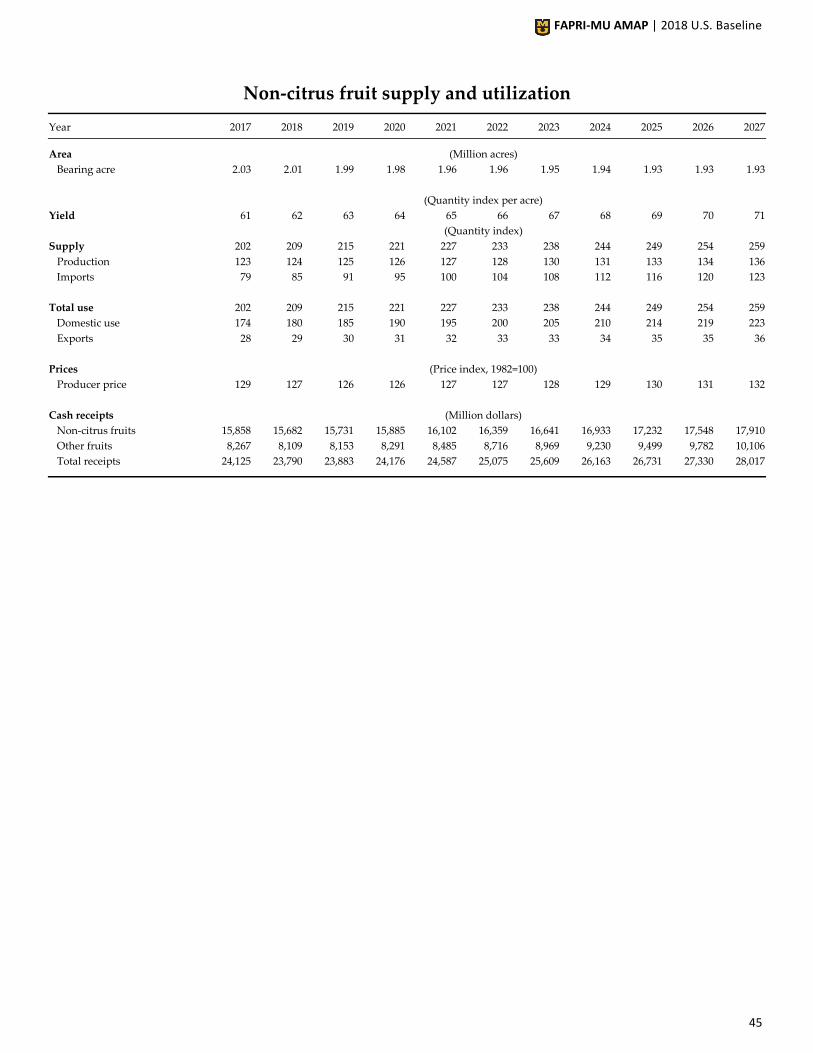
FAPRI-MU AMAP | 2018 U.S. Baseline
45
Non-citrus fruit supply and utilization
Year 2017 2018 2019 2020 2021 2022 2023 2024 2025 2026 2027
Area (Million acres)
Bearing acre 2.03 2.01 1.99 1.98 1.96 1.96 1.95 1.94 1.93 1.93 1.93
(Quantity index per acre)
Yield 61 62 63 64 65 66 67 68 69 70 71
(Quantity index)
Supply 202 209 215 221 227 233 238 244 249 254 259
Production 123 124 125 126 127 128 130 131 133 134 136
Imports 79 85 91 95 100 104 108 112 116 120 123
Total use 202 209 215 221 227 233 238 244 249 254 259
Domestic use 174 180 185 190 195 200 205 210 214 219 223
Exports 28 29 30 31 32 33 33 34 35 35 36
Prices (Price index, 1982=100)
Producer price 129 127 126 126 127 127 128 129 130 131 132
Cash receipts (Million dollars)
Non-citrus fruits 15,858 15,682 15,731 15,885 16,102 16,359 16,641 16,933 17,232 17,548 17,910
Other fruits 8,267 8,109 8,153 8,291 8,485 8,716 8,969 9,230 9,499 9,782 10,106
Total receipts 24,125 23,790 23,883 24,176 24,587 25,075 25,609 26,163 26,731 27,330 28,017

FAPRI-MU AMAP | 2018 U.S. Baseline
46
Bio
fuel
s

FAPRI-MU AMAP | 2018 U.S. Baseline
48
Ethanol
Ethanol rack prices are projected
to increase slowly, eventually
reaching $1.91 per gallon by 2027.
Although corn prices recover early
in the projection period, higher
input costs are offset by higher rev-
enues from ethanol and co-
products (e.g., DDGS and distiller’s
corn oil). Dry-mill net returns ex-
perience modest gains but these
are not sufficient to induce signifi-
cant new capacity investment.
Rising net returns lead to contin-
ued growth in ethanol production.
However, a saturated domestic
market and somewhat diminished
export prospects have led to slight-
ly lower projected conventional
ethanol production. Domestic pro-
duction is projected to remain
around 15.7 billion gallons with
non-corn sources adding an addi-
tional 0.3 billion gallons. Domestic
ethanol disappearance sees some
growth initially before leveling off
around 15 billion gallons.
In order to meet rising Renewable
Fuel Standard (RFS) requirements,
there is a modest substitution to-
ward higher level ethanol blends
(e.g., E15 and E85) at the expense
of E10. As a result, the average in-
clusion rate of ethanol increases
beyond the 10 percent level as early
as 2018 and remains higher
through the projection period.
-3.00
-2.00
-1.00
0.00
1.00
2.00
3.00
2 0 1 1 2 0 1 3 2 0 1 5 2 0 1 7 2 0 1 9 2 0 2 1 2 0 2 3 2 0 2 5 2 0 2 7D
olla
rs p
er g
allo
n
Ethanol net returns recover over time...
Ethanol revenue Corn cost Net returns, dry-mill
0.0
2.5
5.0
7.5
10.0
12.5
15.0
17.5
2 0 1 1 2 0 1 3 2 0 1 5 2 0 1 7 2 0 1 9 2 0 2 1 2 0 2 3 2 0 2 5 2 0 2 7
Bill
ion
gal
lon
s
...though ethanol production remains fairly flat
Corn starch ethanol Other ethanol Disappearance
0.0
2.5
5.0
7.5
10.0
12.5
15.0
17.5
2 0 1 1 2 0 1 3 2 0 1 5 2 0 1 7 2 0 1 9 2 0 2 1 2 0 2 3 2 0 2 5 2 0 2 7
Bill
ion
gal
lon
s
Ethanol blend rates beyond 10% expand slowly
10% blends Beyond 10% blends 10% blend level
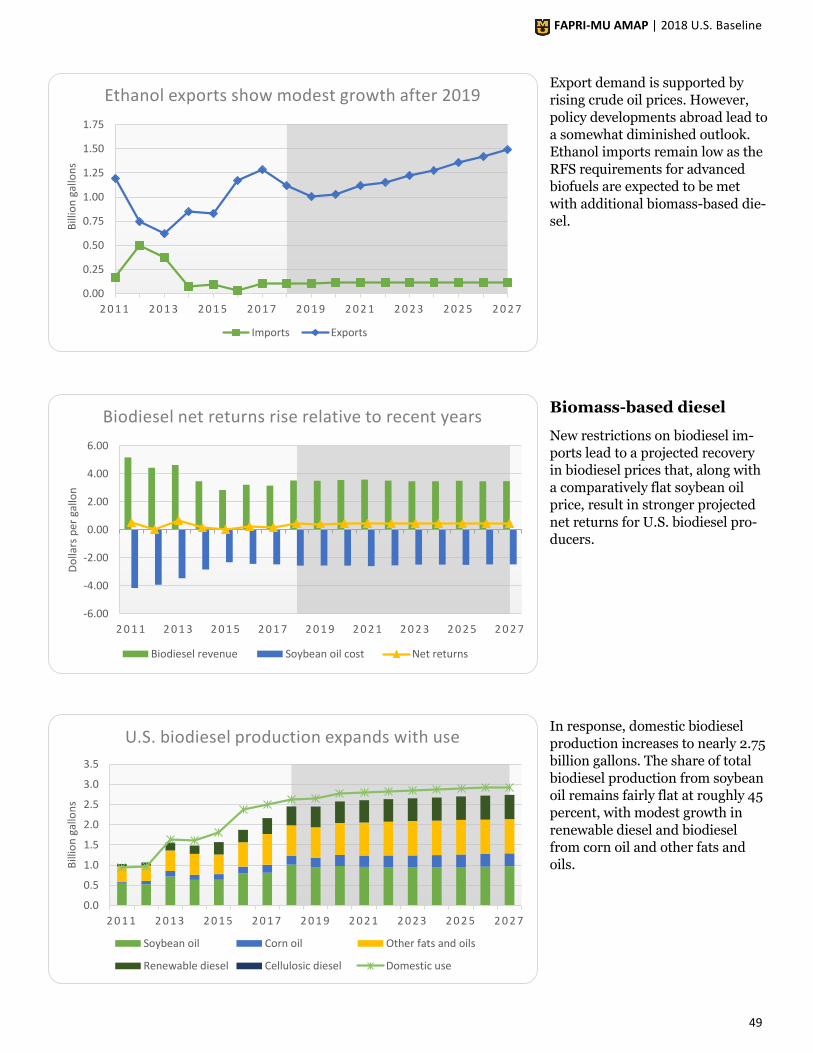
FAPRI-MU AMAP | 2018 U.S. Baseline
49
Export demand is supported by
rising crude oil prices. However,
policy developments abroad lead to
a somewhat diminished outlook.
Ethanol imports remain low as the
RFS requirements for advanced
biofuels are expected to be met
with additional biomass-based die-
sel.
Biomass-based diesel
New restrictions on biodiesel im-
ports lead to a projected recovery
in biodiesel prices that, along with
a comparatively flat soybean oil
price, result in stronger projected
net returns for U.S. biodiesel pro-
ducers.
In response, domestic biodiesel
production increases to nearly 2.75
billion gallons. The share of total
biodiesel production from soybean
oil remains fairly flat at roughly 45
percent, with modest growth in
renewable diesel and biodiesel
from corn oil and other fats and
oils.
-6.00
-4.00
-2.00
0.00
2.00
4.00
6.00
2 0 1 1 2 0 1 3 2 0 1 5 2 0 1 7 2 0 1 9 2 0 2 1 2 0 2 3 2 0 2 5 2 0 2 7
Do
llars
per
gal
lon
Biodiesel net returns rise relative to recent years
Biodiesel revenue Soybean oil cost Net returns
0.00
0.25
0.50
0.75
1.00
1.25
1.50
1.75
2 0 1 1 2 0 1 3 2 0 1 5 2 0 1 7 2 0 1 9 2 0 2 1 2 0 2 3 2 0 2 5 2 0 2 7
Bill
ion
gal
lon
s
Ethanol exports show modest growth after 2019
Imports Exports
0.0
0.5
1.0
1.5
2.0
2.5
3.0
3.5
2 0 1 1 2 0 1 3 2 0 1 5 2 0 1 7 2 0 1 9 2 0 2 1 2 0 2 3 2 0 2 5 2 0 2 7
Bill
ion
gal
lon
s
U.S. biodiesel production expands with use
Soybean oil Corn oil Other fats and oils
Renewable diesel Cellulosic diesel Domestic use
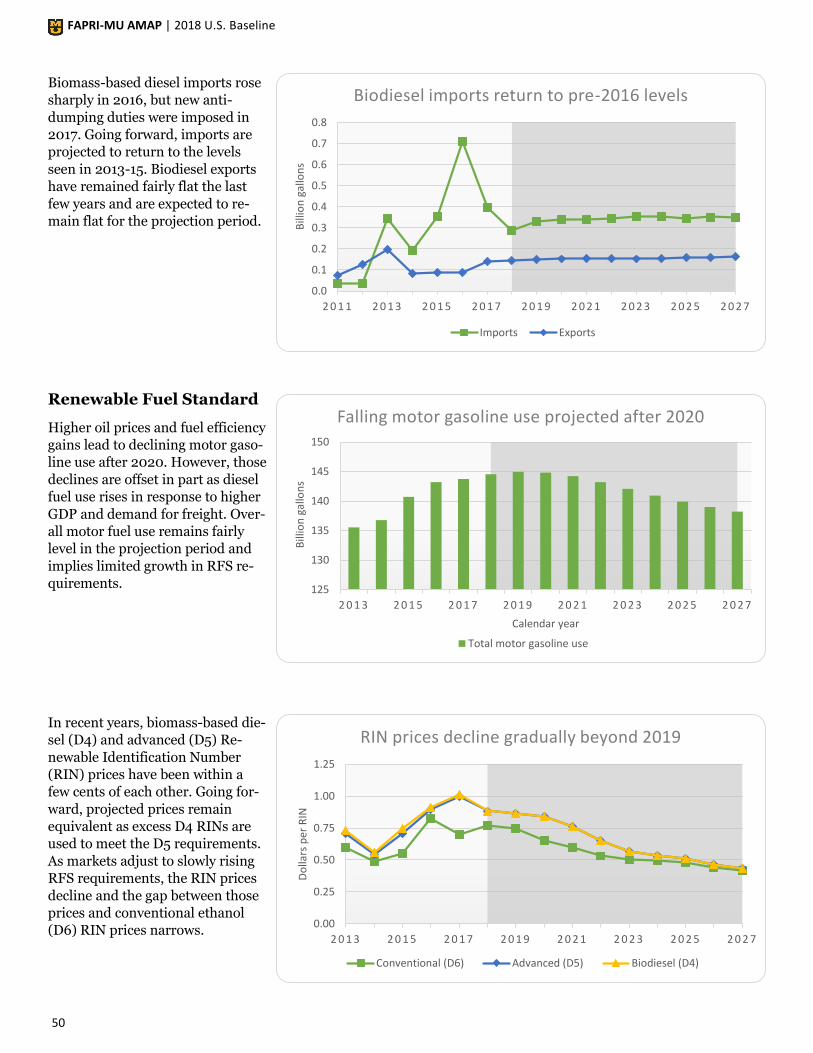
FAPRI-MU AMAP | 2018 U.S. Baseline
50
Biomass-based diesel imports rose
sharply in 2016, but new anti-
dumping duties were imposed in
2017. Going forward, imports are
projected to return to the levels
seen in 2013-15. Biodiesel exports
have remained fairly flat the last
few years and are expected to re-
main flat for the projection period.
Renewable Fuel Standard
Higher oil prices and fuel efficiency
gains lead to declining motor gaso-
line use after 2020. However, those
declines are offset in part as diesel
fuel use rises in response to higher
GDP and demand for freight. Over-
all motor fuel use remains fairly
level in the projection period and
implies limited growth in RFS re-
quirements.
In recent years, biomass-based die-
sel (D4) and advanced (D5) Re-
newable Identification Number
(RIN) prices have been within a
few cents of each other. Going for-
ward, projected prices remain
equivalent as excess D4 RINs are
used to meet the D5 requirements.
As markets adjust to slowly rising
RFS requirements, the RIN prices
decline and the gap between those
prices and conventional ethanol
(D6) RIN prices narrows.
0.0
0.1
0.2
0.3
0.4
0.5
0.6
0.7
0.8
2 0 1 1 2 0 1 3 2 0 1 5 2 0 1 7 2 0 1 9 2 0 2 1 2 0 2 3 2 0 2 5 2 0 2 7B
illio
n g
allo
ns
Biodiesel imports return to pre-2016 levels
Imports Exports
0.00
0.25
0.50
0.75
1.00
1.25
2 0 1 3 2 0 1 5 2 0 1 7 2 0 1 9 2 0 2 1 2 0 2 3 2 0 2 5 2 0 2 7
Do
llars
per
RIN
RIN prices decline gradually beyond 2019
Conventional (D6) Advanced (D5) Biodiesel (D4)
125
130
135
140
145
150
2 0 1 3 2 0 1 5 2 0 1 7 2 0 1 9 2 0 2 1 2 0 2 3 2 0 2 5 2 0 2 7
Bill
ion
gal
lon
s
Calendar year
Falling motor gasoline use projected after 2020
Total motor gasoline use

FAPRI-MU AMAP | 2018 U.S. Baseline
51
Ethanol supply and use
Calendar year 2017 2018 2019 2020 2021 2022 2023 2024 2025 2026 2027
(Dollars per barrel) Petroleum fuel prices
Petroleum, W. Texas interm. 50.91 53.76 54.76 67.01 73.10 77.65 82.08 85.88 88.72 91.67 94.94
Petroleum, refiners' acquis. 50.04 50.05 50.71 60.39 66.39 71.56 76.22 80.22 83.62 86.79 90.04
(Dollars per gallon)
Unl. gasoline, FOB Omaha 1.81 1.79 1.82 2.08 2.25 2.41 2.55 2.65 2.74 2.83 2.92
Unleaded gasoline, retail 2.41 2.40 2.43 2.68 2.85 3.01 3.14 3.25 3.35 3.43 3.52
(Million gallons)
Motor gasoline use* 143,746 144,548 144,956 144,825 144,242 143,228 142,079 140,943 139,912 139,016 138,233
Ethanol supply and use
Production 15,756 15,891 15,827 15,801 15,843 15,826 15,842 15,844 15,898 15,922 15,976
From corn 15,603 15,728 15,654 15,618 15,650 15,623 15,627 15,616 15,658 15,670 15,714
Other conventional 144 150 159 168 175 184 194 206 216 224 232
Cellulosic 8 13 14 16 17 19 21 23 25 28 30
Imports 103 107 109 111 111 111 111 111 111 110 110
Domestic disappearance 14,449 14,867 14,920 14,869 14,826 14,771 14,719 14,670 14,642 14,607 14,590
Exports 1,280 1,117 1,003 1,031 1,117 1,156 1,225 1,277 1,359 1,418 1,489
Ending stocks 950 965 978 990 1,001 1,010 1,019 1,028 1,036 1,043 1,050
Ethanol prices (Dollars per gallon)
Conventional rack, Omaha 1.45 1.52 1.64 1.70 1.72 1.76 1.80 1.85 1.88 1.89 1.91
Other advanced rack 1.75 1.63 1.76 1.88 1.88 1.88 1.87 1.89 1.91 1.92 1.93
Effective retail 1.35 1.36 1.50 1.64 1.73 1.83 1.90 1.96 2.00 2.06 2.10
Ethanol/gasoline retail 56% 57% 62% 61% 60% 61% 60% 60% 60% 60% 60%
RIN values
Conventional ethanol 0.70 0.77 0.75 0.66 0.60 0.53 0.50 0.49 0.48 0.44 0.41
Advanced ethanol 1.00 0.88 0.86 0.84 0.76 0.65 0.57 0.53 0.51 0.47 0.43
* Includes fuel ethanol
All projections are averages across 500 stochastic outcomes.
Renewable Fuel Standard
Calendar year 2017 2018 2019 2020 2021 2022 2023 2024 2025 2026 2027
Applicable percent standard
Overall 10.70% 10.67% 10.53% 10.53% 10.55% 10.58% 10.62% 10.65% 10.68% 10.70% 10.72%
Advanced biofuels 2.38% 2.37% 2.38% 2.40% 2.41% 2.42% 2.43% 2.45% 2.46% 2.47% 2.48%
Cellulosic biofuel 0.17% 0.16% 0.17% 0.18% 0.20% 0.21% 0.22% 0.23% 0.25% 0.26% 0.27%
Biomass-based diesel 1.67% 1.74% 1.75% 1.77% 1.78% 1.79% 1.80% 1.82% 1.83% 1.84% 1.85%
Required volume (Million gallons)
Overall 19,344 19,338 19,388 19,416 19,438 19,450 19,461 19,473 19,487 19,505 19,525
Advanced biofuels 4,344 4,338 4,388 4,416 4,438 4,450 4,461 4,473 4,487 4,505 4,525
Cellulosic biofuel 229 235 237 241 244 247 251 254 258 262 266
Biomass-based diesel 3,048 3,185 3,228 3,254 3,276 3,292 3,306 3,320 3,337 3,356 3,377
Gaps: Conventional 15,000 15,000 15,000 15,000 15,000 15,000 15,000 15,000 15,000 15,000 15,000
Advanced 1,067 918 923 921 917 911 905 898 892 887 882
All projections are averages across 500 stochastic outcomes.
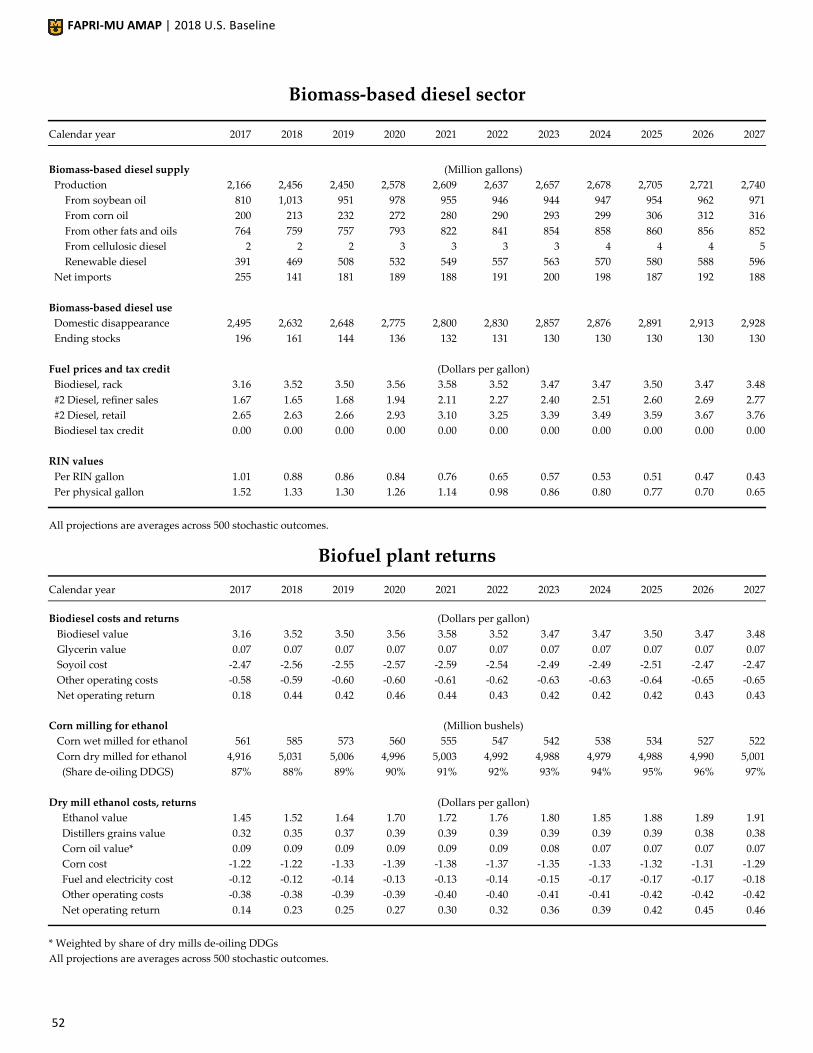
FAPRI-MU AMAP | 2018 U.S. Baseline
52
Biomass-based diesel sector
Calendar year 2017 2018 2019 2020 2021 2022 2023 2024 2025 2026 2027
Biomass-based diesel supply (Million gallons)
Production 2,166 2,456 2,450 2,578 2,609 2,637 2,657 2,678 2,705 2,721 2,740
From soybean oil 810 1,013 951 978 955 946 944 947 954 962 971
From corn oil 200 213 232 272 280 290 293 299 306 312 316
From other fats and oils 764 759 757 793 822 841 854 858 860 856 852
From cellulosic diesel 2 2 2 3 3 3 3 4 4 4 5
Renewable diesel 391 469 508 532 549 557 563 570 580 588 596
Net imports 255 141 181 189 188 191 200 198 187 192 188
Biomass-based diesel use
Domestic disappearance 2,495 2,632 2,648 2,775 2,800 2,830 2,857 2,876 2,891 2,913 2,928
Ending stocks 196 161 144 136 132 131 130 130 130 130 130
Fuel prices and tax credit (Dollars per gallon)
Biodiesel, rack 3.16 3.52 3.50 3.56 3.58 3.52 3.47 3.47 3.50 3.47 3.48
#2 Diesel, refiner sales 1.67 1.65 1.68 1.94 2.11 2.27 2.40 2.51 2.60 2.69 2.77
#2 Diesel, retail 2.65 2.63 2.66 2.93 3.10 3.25 3.39 3.49 3.59 3.67 3.76
Biodiesel tax credit 0.00 0.00 0.00 0.00 0.00 0.00 0.00 0.00 0.00 0.00 0.00
RIN values
Per RIN gallon 1.01 0.88 0.86 0.84 0.76 0.65 0.57 0.53 0.51 0.47 0.43
Per physical gallon 1.52 1.33 1.30 1.26 1.14 0.98 0.86 0.80 0.77 0.70 0.65
All projections are averages across 500 stochastic outcomes.
Biofuel plant returns
Calendar year 2017 2018 2019 2020 2021 2022 2023 2024 2025 2026 2027
Biodiesel costs and returns (Dollars per gallon)
Biodiesel value 3.16 3.52 3.50 3.56 3.58 3.52 3.47 3.47 3.50 3.47 3.48
Glycerin value 0.07 0.07 0.07 0.07 0.07 0.07 0.07 0.07 0.07 0.07 0.07
Soyoil cost -2.47 -2.56 -2.55 -2.57 -2.59 -2.54 -2.49 -2.49 -2.51 -2.47 -2.47
Other operating costs -0.58 -0.59 -0.60 -0.60 -0.61 -0.62 -0.63 -0.63 -0.64 -0.65 -0.65
Net operating return 0.18 0.44 0.42 0.46 0.44 0.43 0.42 0.42 0.42 0.43 0.43
Corn milling for ethanol (Million bushels)
Corn wet milled for ethanol 561 585 573 560 555 547 542 538 534 527 522
Corn dry milled for ethanol 4,916 5,031 5,006 4,996 5,003 4,992 4,988 4,979 4,988 4,990 5,001
(Share de-oiling DDGS) 87% 88% 89% 90% 91% 92% 93% 94% 95% 96% 97%
Dry mill ethanol costs, returns (Dollars per gallon)
Ethanol value 1.45 1.52 1.64 1.70 1.72 1.76 1.80 1.85 1.88 1.89 1.91
Distillers grains value 0.32 0.35 0.37 0.39 0.39 0.39 0.39 0.39 0.39 0.38 0.38
Corn oil value* 0.09 0.09 0.09 0.09 0.09 0.09 0.08 0.07 0.07 0.07 0.07
Corn cost -1.22 -1.22 -1.33 -1.39 -1.38 -1.37 -1.35 -1.33 -1.32 -1.31 -1.29
Fuel and electricity cost -0.12 -0.12 -0.14 -0.13 -0.13 -0.14 -0.15 -0.17 -0.17 -0.17 -0.18
Other operating costs -0.38 -0.38 -0.39 -0.39 -0.40 -0.40 -0.41 -0.41 -0.42 -0.42 -0.42
Net operating return 0.14 0.23 0.25 0.27 0.30 0.32 0.36 0.39 0.42 0.45 0.46
* Weighted by share of dry mills de-oiling DDGs
All projections are averages across 500 stochastic outcomes.
Live
stoc
k &
dai
ry
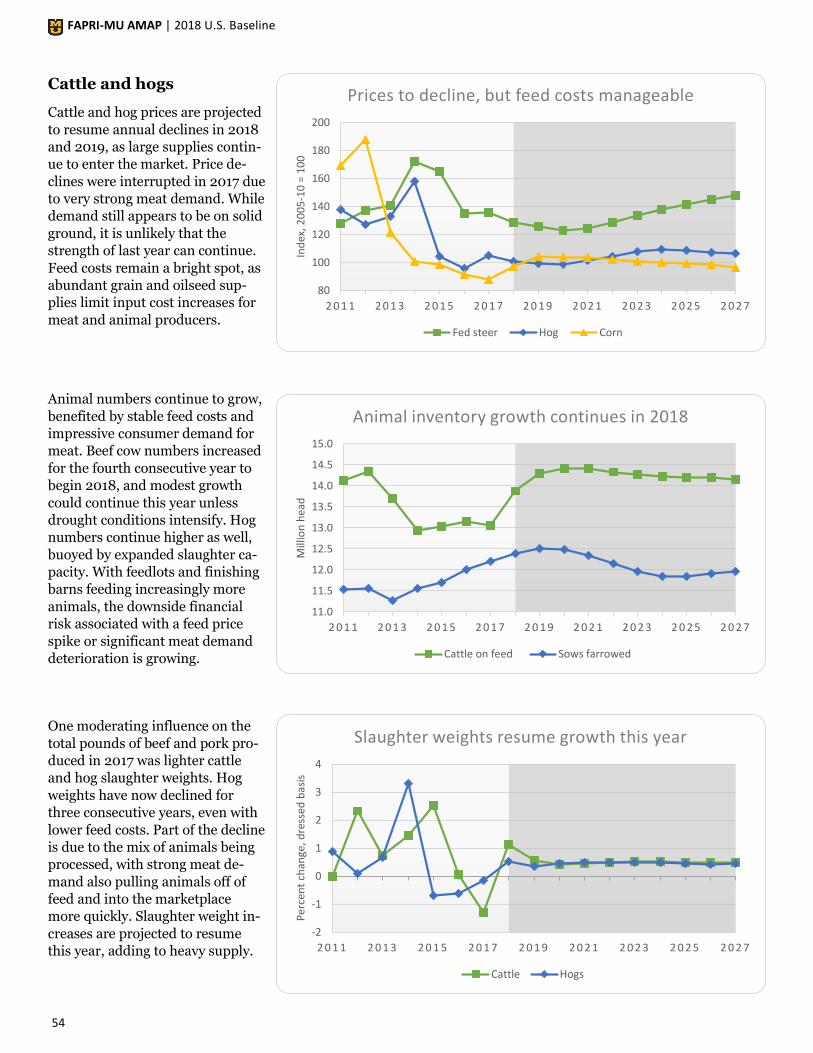
FAPRI-MU AMAP | 2018 U.S. Baseline
54
Cattle and hogs
Cattle and hog prices are projected
to resume annual declines in 2018
and 2019, as large supplies contin-
ue to enter the market. Price de-
clines were interrupted in 2017 due
to very strong meat demand. While
demand still appears to be on solid
ground, it is unlikely that the
strength of last year can continue.
Feed costs remain a bright spot, as
abundant grain and oilseed sup-
plies limit input cost increases for
meat and animal producers.
Animal numbers continue to grow,
benefited by stable feed costs and
impressive consumer demand for
meat. Beef cow numbers increased
for the fourth consecutive year to
begin 2018, and modest growth
could continue this year unless
drought conditions intensify. Hog
numbers continue higher as well,
buoyed by expanded slaughter ca-
pacity. With feedlots and finishing
barns feeding increasingly more
animals, the downside financial
risk associated with a feed price
spike or significant meat demand
deterioration is growing.
One moderating influence on the
total pounds of beef and pork pro-
duced in 2017 was lighter cattle
and hog slaughter weights. Hog
weights have now declined for
three consecutive years, even with
lower feed costs. Part of the decline
is due to the mix of animals being
processed, with strong meat de-
mand also pulling animals off of
feed and into the marketplace
more quickly. Slaughter weight in-
creases are projected to resume
this year, adding to heavy supply.
80
100
120
140
160
180
200
2 0 1 1 2 0 1 3 2 0 1 5 2 0 1 7 2 0 1 9 2 0 2 1 2 0 2 3 2 0 2 5 2 0 2 7In
dex
, 20
05
-10
= 1
00
Prices to decline, but feed costs manageable
Fed steer Hog Corn
11.0
11.5
12.0
12.5
13.0
13.5
14.0
14.5
15.0
2 0 1 1 2 0 1 3 2 0 1 5 2 0 1 7 2 0 1 9 2 0 2 1 2 0 2 3 2 0 2 5 2 0 2 7
Mill
ion
hea
d
Animal inventory growth continues in 2018
Cattle on feed Sows farrowed
-2
-1
0
1
2
3
4
2 0 1 1 2 0 1 3 2 0 1 5 2 0 1 7 2 0 1 9 2 0 2 1 2 0 2 3 2 0 2 5 2 0 2 7
Per
cen
t ch
ange
, dre
ssed
bas
is
Slaughter weights resume growth this year
Cattle Hogs
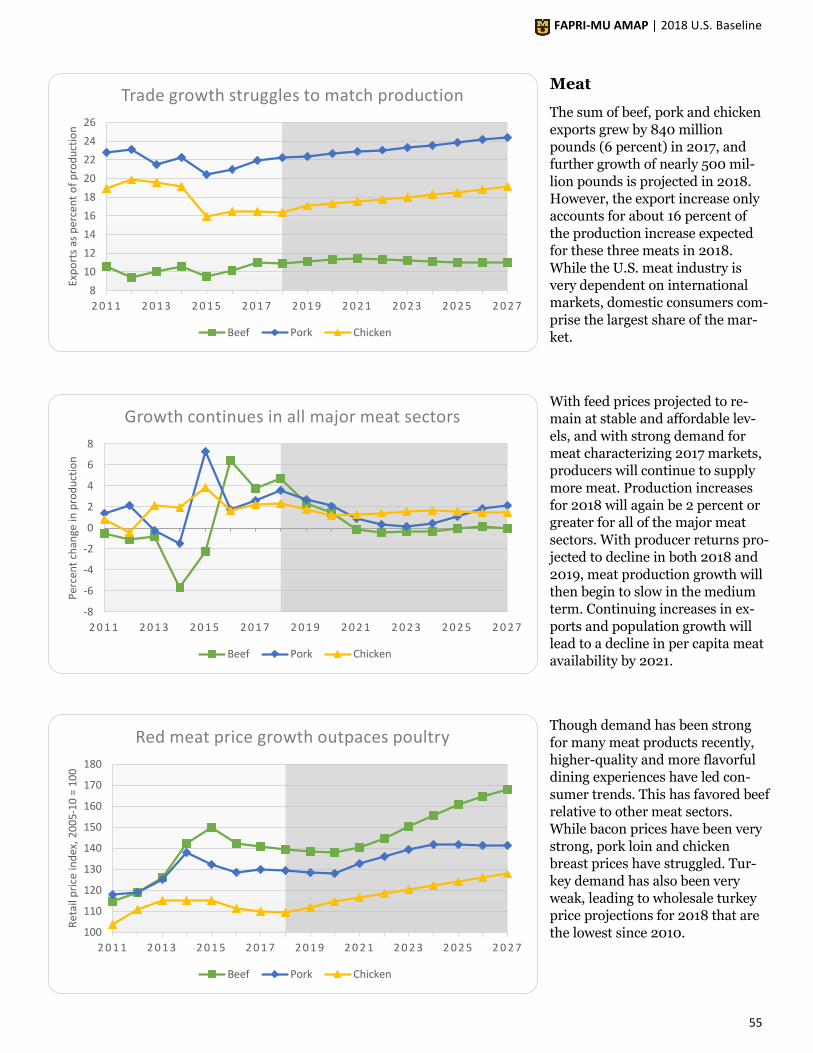
FAPRI-MU AMAP | 2018 U.S. Baseline
55
Meat
The sum of beef, pork and chicken
exports grew by 840 million
pounds (6 percent) in 2017, and
further growth of nearly 500 mil-
lion pounds is projected in 2018.
However, the export increase only
accounts for about 16 percent of
the production increase expected
for these three meats in 2018.
While the U.S. meat industry is
very dependent on international
markets, domestic consumers com-
prise the largest share of the mar-
ket.
With feed prices projected to re-
main at stable and affordable lev-
els, and with strong demand for
meat characterizing 2017 markets,
producers will continue to supply
more meat. Production increases
for 2018 will again be 2 percent or
greater for all of the major meat
sectors. With producer returns pro-
jected to decline in both 2018 and
2019, meat production growth will
then begin to slow in the medium
term. Continuing increases in ex-
ports and population growth will
lead to a decline in per capita meat
availability by 2021.
Though demand has been strong
for many meat products recently,
higher-quality and more flavorful
dining experiences have led con-
sumer trends. This has favored beef
relative to other meat sectors.
While bacon prices have been very
strong, pork loin and chicken
breast prices have struggled. Tur-
key demand has also been very
weak, leading to wholesale turkey
price projections for 2018 that are
the lowest since 2010.
8
10
12
14
16
18
20
22
24
26
2 0 1 1 2 0 1 3 2 0 1 5 2 0 1 7 2 0 1 9 2 0 2 1 2 0 2 3 2 0 2 5 2 0 2 7
Exp
ort
s as
per
cen
t o
f p
rod
uct
ion
Trade growth struggles to match production
Beef Pork Chicken
100
110
120
130
140
150
160
170
180
2 0 1 1 2 0 1 3 2 0 1 5 2 0 1 7 2 0 1 9 2 0 2 1 2 0 2 3 2 0 2 5 2 0 2 7
Ret
ail p
rice
ind
ex,
20
05-
10
= 1
00
Red meat price growth outpaces poultry
Beef Pork Chicken
-8
-6
-4
-2
0
2
4
6
8
2 0 1 1 2 0 1 3 2 0 1 5 2 0 1 7 2 0 1 9 2 0 2 1 2 0 2 3 2 0 2 5 2 0 2 7
Per
cen
t ch
ange
in p
rod
uct
ion
Growth continues in all major meat sectors
Beef Pork Chicken
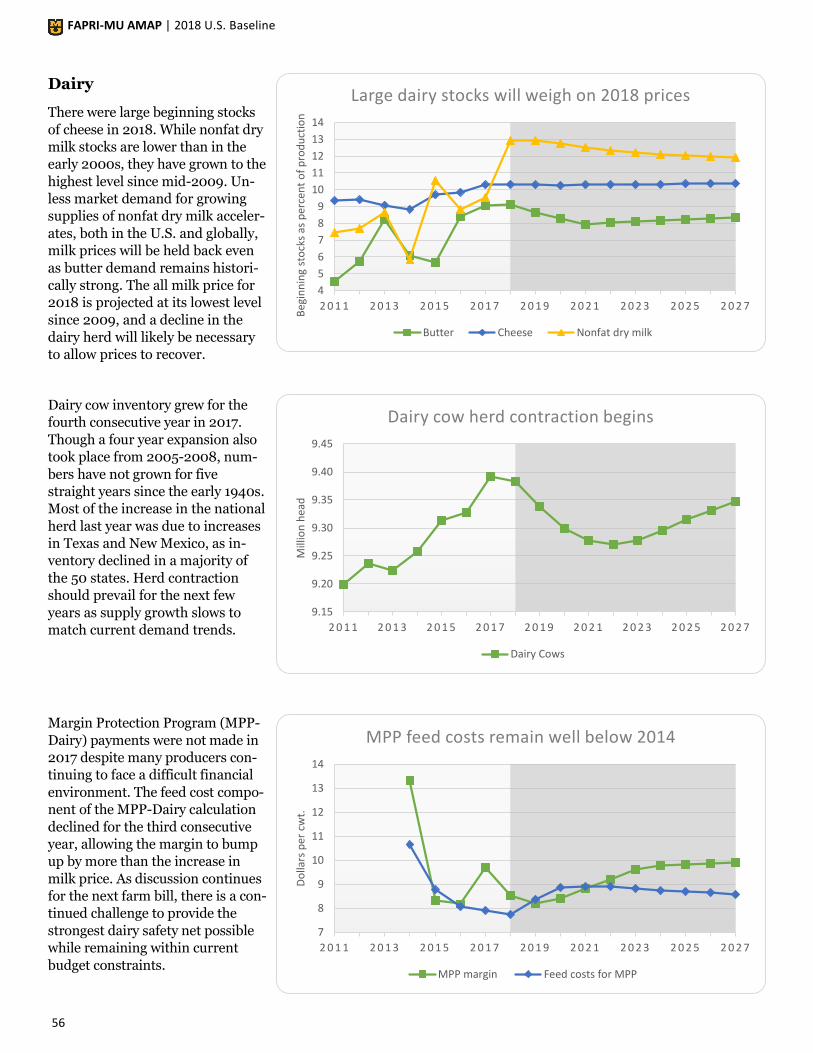
FAPRI-MU AMAP | 2018 U.S. Baseline
56
Dairy
There were large beginning stocks
of cheese in 2018. While nonfat dry
milk stocks are lower than in the
early 2000s, they have grown to the
highest level since mid-2009. Un-
less market demand for growing
supplies of nonfat dry milk acceler-
ates, both in the U.S. and globally,
milk prices will be held back even
as butter demand remains histori-
cally strong. The all milk price for
2018 is projected at its lowest level
since 2009, and a decline in the
dairy herd will likely be necessary
to allow prices to recover.
Dairy cow inventory grew for the
fourth consecutive year in 2017.
Though a four year expansion also
took place from 2005-2008, num-
bers have not grown for five
straight years since the early 1940s.
Most of the increase in the national
herd last year was due to increases
in Texas and New Mexico, as in-
ventory declined in a majority of
the 50 states. Herd contraction
should prevail for the next few
years as supply growth slows to
match current demand trends.
Margin Protection Program (MPP-
Dairy) payments were not made in
2017 despite many producers con-
tinuing to face a difficult financial
environment. The feed cost compo-
nent of the MPP-Dairy calculation
declined for the third consecutive
year, allowing the margin to bump
up by more than the increase in
milk price. As discussion continues
for the next farm bill, there is a con-
tinued challenge to provide the
strongest dairy safety net possible
while remaining within current
budget constraints.
4
5
6
7
8
9
10
11
12
13
14
2 0 1 1 2 0 1 3 2 0 1 5 2 0 1 7 2 0 1 9 2 0 2 1 2 0 2 3 2 0 2 5 2 0 2 7B
egin
nin
g st
ock
s as
per
cen
t o
f p
rod
uct
ion
Large dairy stocks will weigh on 2018 prices
Butter Cheese Nonfat dry milk
9.15
9.20
9.25
9.30
9.35
9.40
9.45
2 0 1 1 2 0 1 3 2 0 1 5 2 0 1 7 2 0 1 9 2 0 2 1 2 0 2 3 2 0 2 5 2 0 2 7
Mill
ion
hea
d
Dairy cow herd contraction begins
Dairy Cows
7
8
9
10
11
12
13
14
2 0 1 1 2 0 1 3 2 0 1 5 2 0 1 7 2 0 1 9 2 0 2 1 2 0 2 3 2 0 2 5 2 0 2 7
Do
llars
per
cw
t.
MPP feed costs remain well below 2014
MPP margin Feed costs for MPP
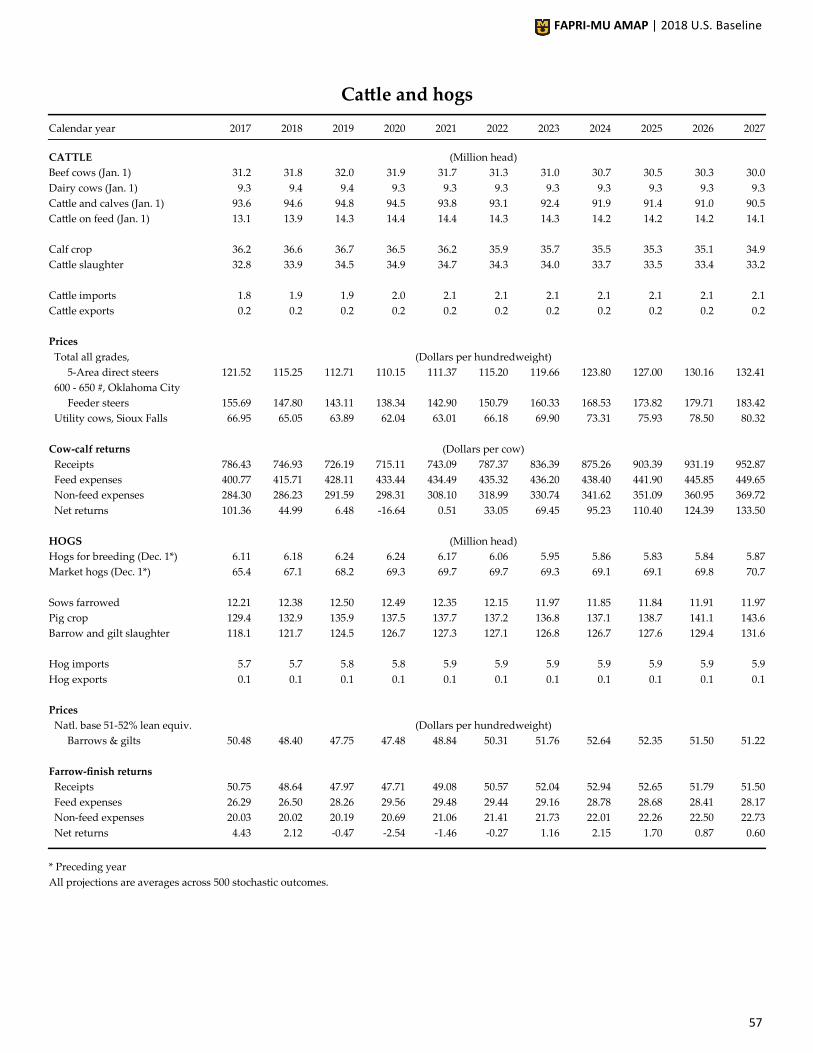
FAPRI-MU AMAP | 2018 U.S. Baseline
57
Cattle and hogs
Calendar year 2017 2018 2019 2020 2021 2022 2023 2024 2025 2026 2027
CATTLE (Million head)
Beef cows (Jan. 1) 31.2 31.8 32.0 31.9 31.7 31.3 31.0 30.7 30.5 30.3 30.0
Dairy cows (Jan. 1) 9.3 9.4 9.4 9.3 9.3 9.3 9.3 9.3 9.3 9.3 9.3
Cattle and calves (Jan. 1) 93.6 94.6 94.8 94.5 93.8 93.1 92.4 91.9 91.4 91.0 90.5
Cattle on feed (Jan. 1) 13.1 13.9 14.3 14.4 14.4 14.3 14.3 14.2 14.2 14.2 14.1
Calf crop 36.2 36.6 36.7 36.5 36.2 35.9 35.7 35.5 35.3 35.1 34.9
Cattle slaughter 32.8 33.9 34.5 34.9 34.7 34.3 34.0 33.7 33.5 33.4 33.2
Cattle imports 1.8 1.9 1.9 2.0 2.1 2.1 2.1 2.1 2.1 2.1 2.1
Cattle exports 0.2 0.2 0.2 0.2 0.2 0.2 0.2 0.2 0.2 0.2 0.2
Prices
Total all grades, (Dollars per hundredweight)
5-Area direct steers 121.52 115.25 112.71 110.15 111.37 115.20 119.66 123.80 127.00 130.16 132.41
600 - 650 #, Oklahoma City
Feeder steers 155.69 147.80 143.11 138.34 142.90 150.79 160.33 168.53 173.82 179.71 183.42
Utility cows, Sioux Falls 66.95 65.05 63.89 62.04 63.01 66.18 69.90 73.31 75.93 78.50 80.32
Cow-calf returns (Dollars per cow)
Receipts 786.43 746.93 726.19 715.11 743.09 787.37 836.39 875.26 903.39 931.19 952.87
Feed expenses 400.77 415.71 428.11 433.44 434.49 435.32 436.20 438.40 441.90 445.85 449.65
Non-feed expenses 284.30 286.23 291.59 298.31 308.10 318.99 330.74 341.62 351.09 360.95 369.72
Net returns 101.36 44.99 6.48 -16.64 0.51 33.05 69.45 95.23 110.40 124.39 133.50
HOGS (Million head)
Hogs for breeding (Dec. 1*) 6.11 6.18 6.24 6.24 6.17 6.06 5.95 5.86 5.83 5.84 5.87
Market hogs (Dec. 1*) 65.4 67.1 68.2 69.3 69.7 69.7 69.3 69.1 69.1 69.8 70.7
Sows farrowed 12.21 12.38 12.50 12.49 12.35 12.15 11.97 11.85 11.84 11.91 11.97
Pig crop 129.4 132.9 135.9 137.5 137.7 137.2 136.8 137.1 138.7 141.1 143.6
Barrow and gilt slaughter 118.1 121.7 124.5 126.7 127.3 127.1 126.8 126.7 127.6 129.4 131.6
Hog imports 5.7 5.7 5.8 5.8 5.9 5.9 5.9 5.9 5.9 5.9 5.9
Hog exports 0.1 0.1 0.1 0.1 0.1 0.1 0.1 0.1 0.1 0.1 0.1
Prices
Natl. base 51-52% lean equiv. (Dollars per hundredweight)
Barrows & gilts 50.48 48.40 47.75 47.48 48.84 50.31 51.76 52.64 52.35 51.50 51.22
Farrow-finish returns
Receipts 50.75 48.64 47.97 47.71 49.08 50.57 52.04 52.94 52.65 51.79 51.50
Feed expenses 26.29 26.50 28.26 29.56 29.48 29.44 29.16 28.78 28.68 28.41 28.17
Non-feed expenses 20.03 20.02 20.19 20.69 21.06 21.41 21.73 22.01 22.26 22.50 22.73
Net returns 4.43 2.12 -0.47 -2.54 -1.46 -0.27 1.16 2.15 1.70 0.87 0.60
* Preceding year
All projections are averages across 500 stochastic outcomes.
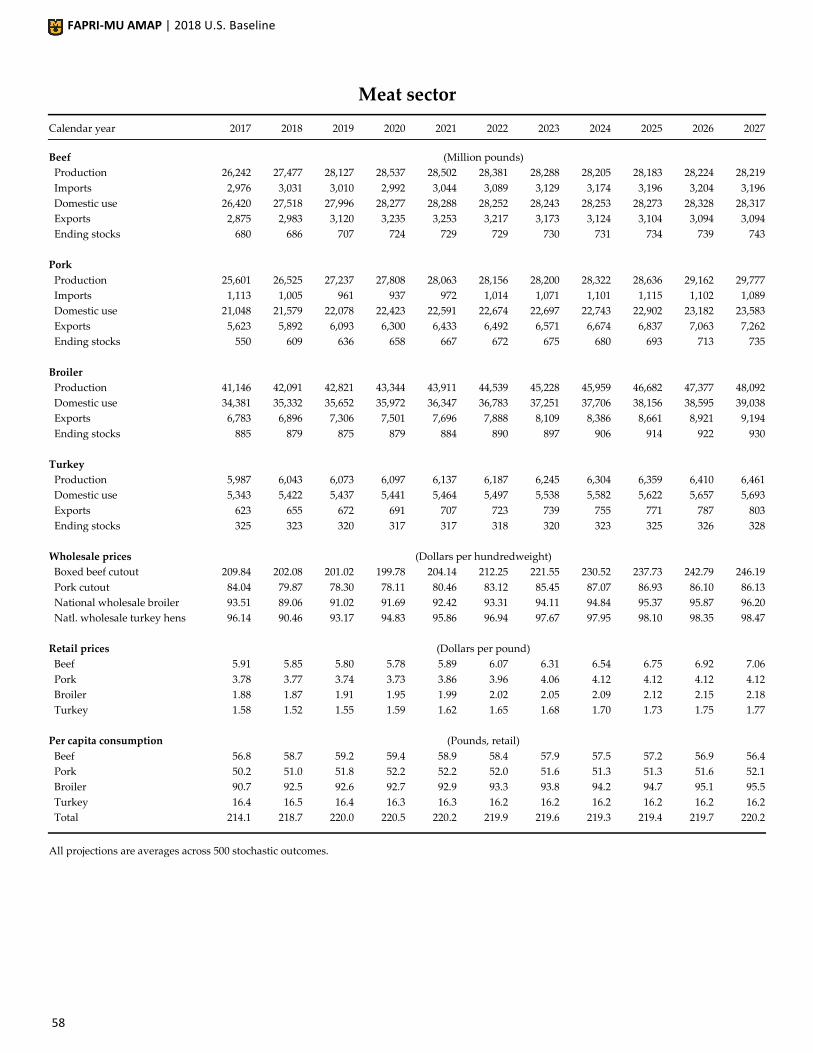
FAPRI-MU AMAP | 2018 U.S. Baseline
58
Meat sector
Calendar year 2017 2018 2019 2020 2021 2022 2023 2024 2025 2026 2027
Beef (Million pounds)
Production 26,242 27,477 28,127 28,537 28,502 28,381 28,288 28,205 28,183 28,224 28,219
Imports 2,976 3,031 3,010 2,992 3,044 3,089 3,129 3,174 3,196 3,204 3,196
Domestic use 26,420 27,518 27,996 28,277 28,288 28,252 28,243 28,253 28,273 28,328 28,317
Exports 2,875 2,983 3,120 3,235 3,253 3,217 3,173 3,124 3,104 3,094 3,094
Ending stocks 680 686 707 724 729 729 730 731 734 739 743
Pork
Production 25,601 26,525 27,237 27,808 28,063 28,156 28,200 28,322 28,636 29,162 29,777
Imports 1,113 1,005 961 937 972 1,014 1,071 1,101 1,115 1,102 1,089
Domestic use 21,048 21,579 22,078 22,423 22,591 22,674 22,697 22,743 22,902 23,182 23,583
Exports 5,623 5,892 6,093 6,300 6,433 6,492 6,571 6,674 6,837 7,063 7,262
Ending stocks 550 609 636 658 667 672 675 680 693 713 735
Broiler
Production 41,146 42,091 42,821 43,344 43,911 44,539 45,228 45,959 46,682 47,377 48,092
Domestic use 34,381 35,332 35,652 35,972 36,347 36,783 37,251 37,706 38,156 38,595 39,038
Exports 6,783 6,896 7,306 7,501 7,696 7,888 8,109 8,386 8,661 8,921 9,194
Ending stocks 885 879 875 879 884 890 897 906 914 922 930
Turkey
Production 5,987 6,043 6,073 6,097 6,137 6,187 6,245 6,304 6,359 6,410 6,461
Domestic use 5,343 5,422 5,437 5,441 5,464 5,497 5,538 5,582 5,622 5,657 5,693
Exports 623 655 672 691 707 723 739 755 771 787 803
Ending stocks 325 323 320 317 317 318 320 323 325 326 328
Wholesale prices (Dollars per hundredweight)
Boxed beef cutout 209.84 202.08 201.02 199.78 204.14 212.25 221.55 230.52 237.73 242.79 246.19
Pork cutout 84.04 79.87 78.30 78.11 80.46 83.12 85.45 87.07 86.93 86.10 86.13
National wholesale broiler 93.51 89.06 91.02 91.69 92.42 93.31 94.11 94.84 95.37 95.87 96.20
Natl. wholesale turkey hens 96.14 90.46 93.17 94.83 95.86 96.94 97.67 97.95 98.10 98.35 98.47
Retail prices (Dollars per pound)
Beef 5.91 5.85 5.80 5.78 5.89 6.07 6.31 6.54 6.75 6.92 7.06
Pork 3.78 3.77 3.74 3.73 3.86 3.96 4.06 4.12 4.12 4.12 4.12
Broiler 1.88 1.87 1.91 1.95 1.99 2.02 2.05 2.09 2.12 2.15 2.18
Turkey 1.58 1.52 1.55 1.59 1.62 1.65 1.68 1.70 1.73 1.75 1.77
Per capita consumption (Pounds, retail)
Beef 56.8 58.7 59.2 59.4 58.9 58.4 57.9 57.5 57.2 56.9 56.4
Pork 50.2 51.0 51.8 52.2 52.2 52.0 51.6 51.3 51.3 51.6 52.1
Broiler 90.7 92.5 92.6 92.7 92.9 93.3 93.8 94.2 94.7 95.1 95.5
Turkey 16.4 16.5 16.4 16.3 16.3 16.2 16.2 16.2 16.2 16.2 16.2
Total 214.1 218.7 220.0 220.5 220.2 219.9 219.6 219.3 219.4 219.7 220.2
All projections are averages across 500 stochastic outcomes.
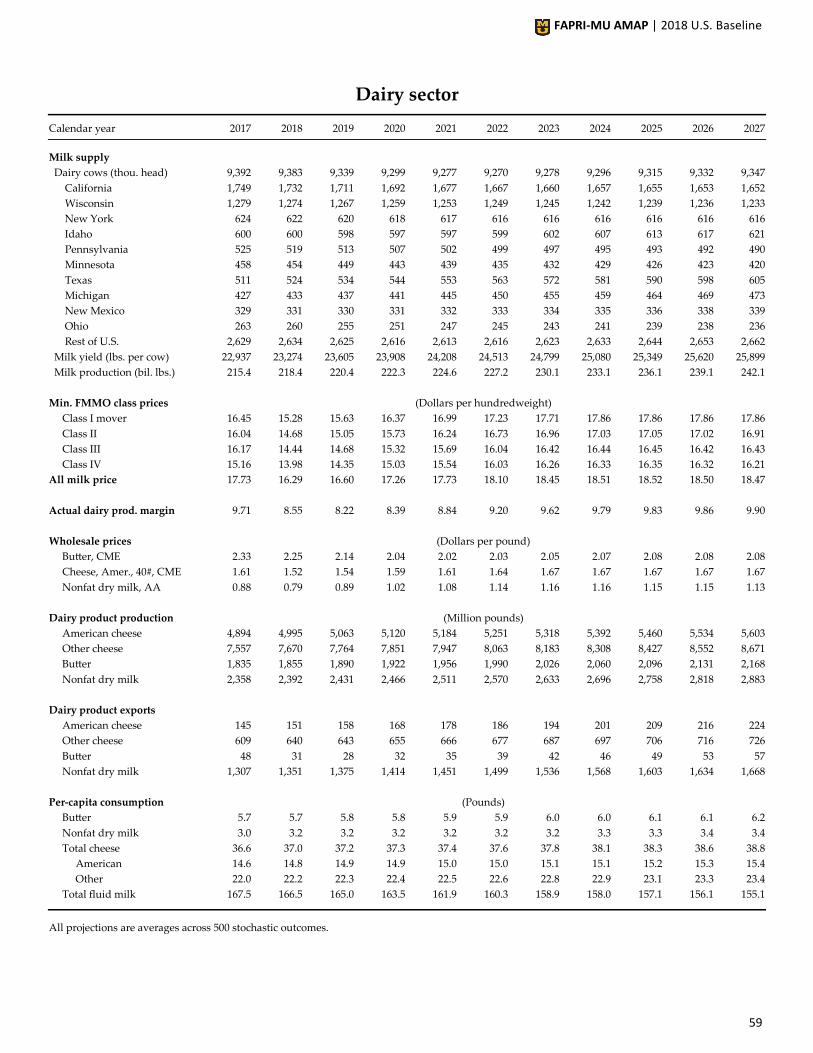
FAPRI-MU AMAP | 2018 U.S. Baseline
59
Dairy sector
Calendar year 2017 2018 2019 2020 2021 2022 2023 2024 2025 2026 2027
Milk supply
Dairy cows (thou. head) 9,392 9,383 9,339 9,299 9,277 9,270 9,278 9,296 9,315 9,332 9,347
California 1,749 1,732 1,711 1,692 1,677 1,667 1,660 1,657 1,655 1,653 1,652
Wisconsin 1,279 1,274 1,267 1,259 1,253 1,249 1,245 1,242 1,239 1,236 1,233
New York 624 622 620 618 617 616 616 616 616 616 616
Idaho 600 600 598 597 597 599 602 607 613 617 621
Pennsylvania 525 519 513 507 502 499 497 495 493 492 490
Minnesota 458 454 449 443 439 435 432 429 426 423 420
Texas 511 524 534 544 553 563 572 581 590 598 605
Michigan 427 433 437 441 445 450 455 459 464 469 473
New Mexico 329 331 330 331 332 333 334 335 336 338 339
Ohio 263 260 255 251 247 245 243 241 239 238 236
Rest of U.S. 2,629 2,634 2,625 2,616 2,613 2,616 2,623 2,633 2,644 2,653 2,662
Milk yield (lbs. per cow) 22,937 23,274 23,605 23,908 24,208 24,513 24,799 25,080 25,349 25,620 25,899
Milk production (bil. lbs.) 215.4 218.4 220.4 222.3 224.6 227.2 230.1 233.1 236.1 239.1 242.1
Min. FMMO class prices (Dollars per hundredweight)
Class I mover 16.45 15.28 15.63 16.37 16.99 17.23 17.71 17.86 17.86 17.86 17.86
Class II 16.04 14.68 15.05 15.73 16.24 16.73 16.96 17.03 17.05 17.02 16.91
Class III 16.17 14.44 14.68 15.32 15.69 16.04 16.42 16.44 16.45 16.42 16.43
Class IV 15.16 13.98 14.35 15.03 15.54 16.03 16.26 16.33 16.35 16.32 16.21
All milk price 17.73 16.29 16.60 17.26 17.73 18.10 18.45 18.51 18.52 18.50 18.47
Actual dairy prod. margin 9.71 8.55 8.22 8.39 8.84 9.20 9.62 9.79 9.83 9.86 9.90
Wholesale prices (Dollars per pound)
Butter, CME 2.33 2.25 2.14 2.04 2.02 2.03 2.05 2.07 2.08 2.08 2.08
Cheese, Amer., 40#, CME 1.61 1.52 1.54 1.59 1.61 1.64 1.67 1.67 1.67 1.67 1.67
Nonfat dry milk, AA 0.88 0.79 0.89 1.02 1.08 1.14 1.16 1.16 1.15 1.15 1.13
Dairy product production (Million pounds)
American cheese 4,894 4,995 5,063 5,120 5,184 5,251 5,318 5,392 5,460 5,534 5,603
Other cheese 7,557 7,670 7,764 7,851 7,947 8,063 8,183 8,308 8,427 8,552 8,671
Butter 1,835 1,855 1,890 1,922 1,956 1,990 2,026 2,060 2,096 2,131 2,168
Nonfat dry milk 2,358 2,392 2,431 2,466 2,511 2,570 2,633 2,696 2,758 2,818 2,883
Dairy product exports
American cheese 145 151 158 168 178 186 194 201 209 216 224
Other cheese 609 640 643 655 666 677 687 697 706 716 726
Butter 48 31 28 32 35 39 42 46 49 53 57
Nonfat dry milk 1,307 1,351 1,375 1,414 1,451 1,499 1,536 1,568 1,603 1,634 1,668
Per-capita consumption (Pounds)
Butter 5.7 5.7 5.8 5.8 5.9 5.9 6.0 6.0 6.1 6.1 6.2
Nonfat dry milk 3.0 3.2 3.2 3.2 3.2 3.2 3.2 3.3 3.3 3.4 3.4
Total cheese 36.6 37.0 37.2 37.3 37.4 37.6 37.8 38.1 38.3 38.6 38.8
American 14.6 14.8 14.9 14.9 15.0 15.0 15.1 15.1 15.2 15.3 15.4
Other 22.0 22.2 22.3 22.4 22.5 22.6 22.8 22.9 23.1 23.3 23.4
Total fluid milk 167.5 166.5 165.0 163.5 161.9 160.3 158.9 158.0 157.1 156.1 155.1
All projections are averages across 500 stochastic outcomes.

FAPRI-MU AMAP | 2018 U.S. Baseline
60

Agg
rega
te in
dica
tors
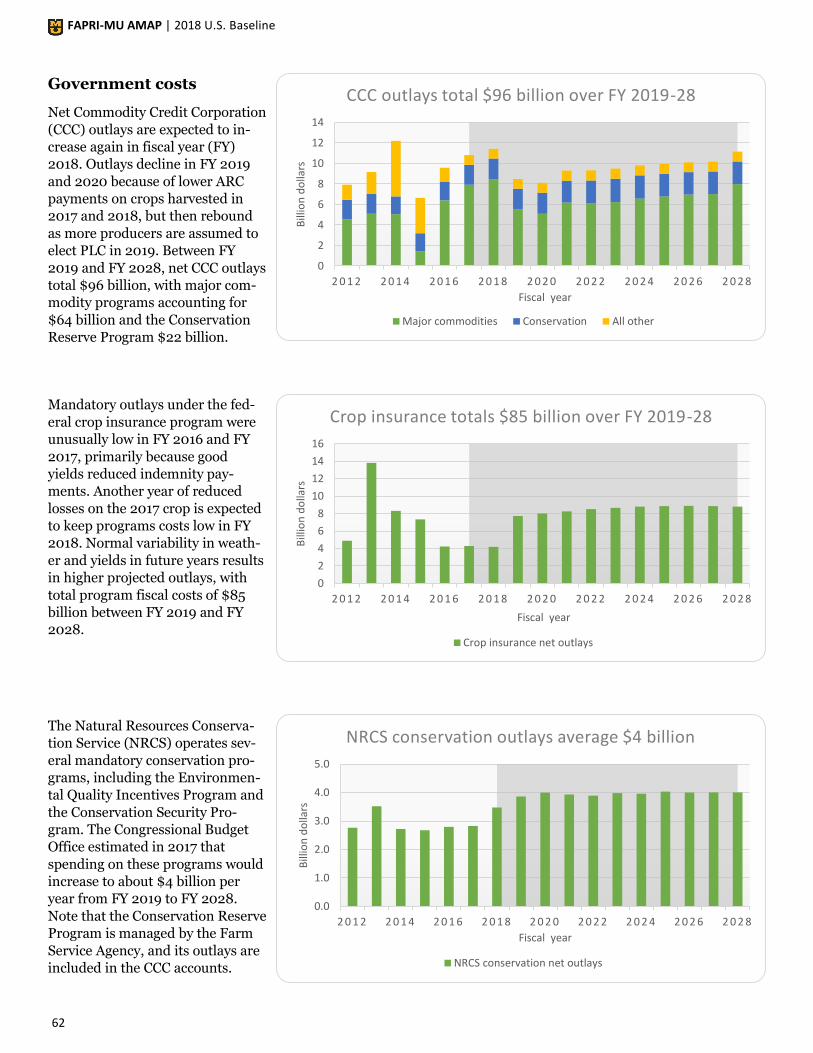
FAPRI-MU AMAP | 2018 U.S. Baseline
62
Government costs
Net Commodity Credit Corporation
(CCC) outlays are expected to in-
crease again in fiscal year (FY)
2018. Outlays decline in FY 2019
and 2020 because of lower ARC
payments on crops harvested in
2017 and 2018, but then rebound
as more producers are assumed to
elect PLC in 2019. Between FY
2019 and FY 2028, net CCC outlays
total $96 billion, with major com-
modity programs accounting for
$64 billion and the Conservation
Reserve Program $22 billion.
Mandatory outlays under the fed-
eral crop insurance program were
unusually low in FY 2016 and FY
2017, primarily because good
yields reduced indemnity pay-
ments. Another year of reduced
losses on the 2017 crop is expected
to keep programs costs low in FY
2018. Normal variability in weath-
er and yields in future years results
in higher projected outlays, with
total program fiscal costs of $85
billion between FY 2019 and FY
2028.
The Natural Resources Conserva-
tion Service (NRCS) operates sev-
eral mandatory conservation pro-
grams, including the Environmen-
tal Quality Incentives Program and
the Conservation Security Pro-
gram. The Congressional Budget
Office estimated in 2017 that
spending on these programs would
increase to about $4 billion per
year from FY 2019 to FY 2028.
Note that the Conservation Reserve
Program is managed by the Farm
Service Agency, and its outlays are
included in the CCC accounts.
0
2
4
6
8
10
12
14
2 0 1 2 2 0 1 4 2 0 1 6 2 0 1 8 2 0 2 0 2 0 2 2 2 0 2 4 2 0 2 6 2 0 2 8
Bill
ion
do
llars
Fiscal year
CCC outlays total $96 billion over FY 2019-28
Major commodities Conservation All other
0
2
4
6
8
10
12
14
16
2 0 1 2 2 0 1 4 2 0 1 6 2 0 1 8 2 0 2 0 2 0 2 2 2 0 2 4 2 0 2 6 2 0 2 8
Bill
ion
do
llars
Fiscal year
Crop insurance totals $85 billion over FY 2019-28
Crop insurance net outlays
0.0
1.0
2.0
3.0
4.0
5.0
2 0 1 2 2 0 1 4 2 0 1 6 2 0 1 8 2 0 2 0 2 0 2 2 2 0 2 4 2 0 2 6 2 0 2 8
Bill
ion
do
llars
Fiscal year
NRCS conservation outlays average $4 billion
NRCS conservation net outlays
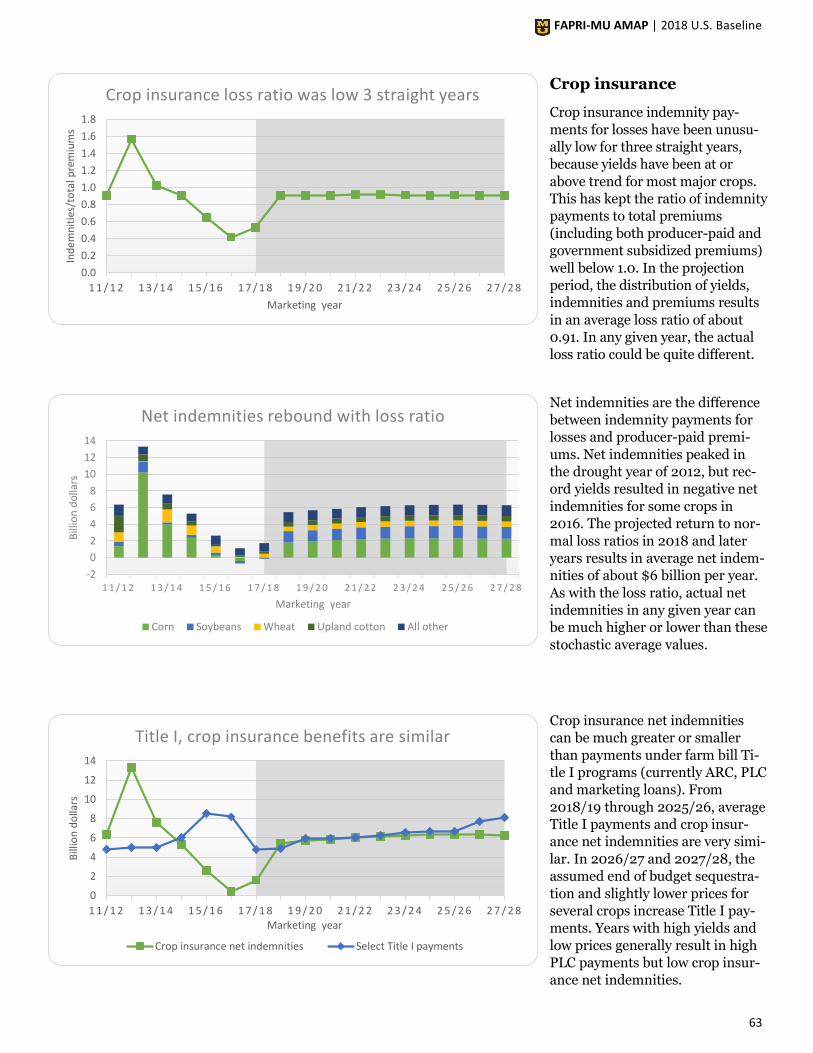
FAPRI-MU AMAP | 2018 U.S. Baseline
63
Crop insurance
Crop insurance indemnity pay-
ments for losses have been unusu-
ally low for three straight years,
because yields have been at or
above trend for most major crops.
This has kept the ratio of indemnity
payments to total premiums
(including both producer-paid and
government subsidized premiums)
well below 1.0. In the projection
period, the distribution of yields,
indemnities and premiums results
in an average loss ratio of about
0.91. In any given year, the actual
loss ratio could be quite different.
Net indemnities are the difference
between indemnity payments for
losses and producer-paid premi-
ums. Net indemnities peaked in
the drought year of 2012, but rec-
ord yields resulted in negative net
indemnities for some crops in
2016. The projected return to nor-
mal loss ratios in 2018 and later
years results in average net indem-
nities of about $6 billion per year.
As with the loss ratio, actual net
indemnities in any given year can
be much higher or lower than these
stochastic average values.
Crop insurance net indemnities
can be much greater or smaller
than payments under farm bill Ti-
tle I programs (currently ARC, PLC
and marketing loans). From
2018/19 through 2025/26, average
Title I payments and crop insur-
ance net indemnities are very simi-
lar. In 2026/27 and 2027/28, the
assumed end of budget sequestra-
tion and slightly lower prices for
several crops increase Title I pay-
ments. Years with high yields and
low prices generally result in high
PLC payments but low crop insur-
ance net indemnities.
0.0
0.2
0.4
0.6
0.8
1.0
1.2
1.4
1.6
1.8
1 1 / 1 2 1 3 / 1 4 1 5 / 1 6 1 7 / 1 8 1 9 / 2 0 2 1 / 2 2 2 3 / 2 4 2 5 / 2 6 2 7 / 2 8
Ind
emn
itie
s/to
tal p
rem
ium
s
Marketing year
Crop insurance loss ratio was low 3 straight years
-2
0
2
4
6
8
10
12
14
1 1 / 1 2 1 3 / 1 4 1 5 / 1 6 1 7 / 1 8 1 9 / 2 0 2 1 / 2 2 2 3 / 2 4 2 5 / 2 6 2 7 / 2 8
Bill
ion
do
llars
Marketing year
Net indemnities rebound with loss ratio
Corn Soybeans Wheat Upland cotton All other
0
2
4
6
8
10
12
14
1 1 / 1 2 1 3 / 1 4 1 5 / 1 6 1 7 / 1 8 1 9 / 2 0 2 1 / 2 2 2 3 / 2 4 2 5 / 2 6 2 7 / 2 8
Bill
ion
do
llars
Marketing year
Title I, crop insurance benefits are similar
Crop insurance net indemnities Select Title I payments
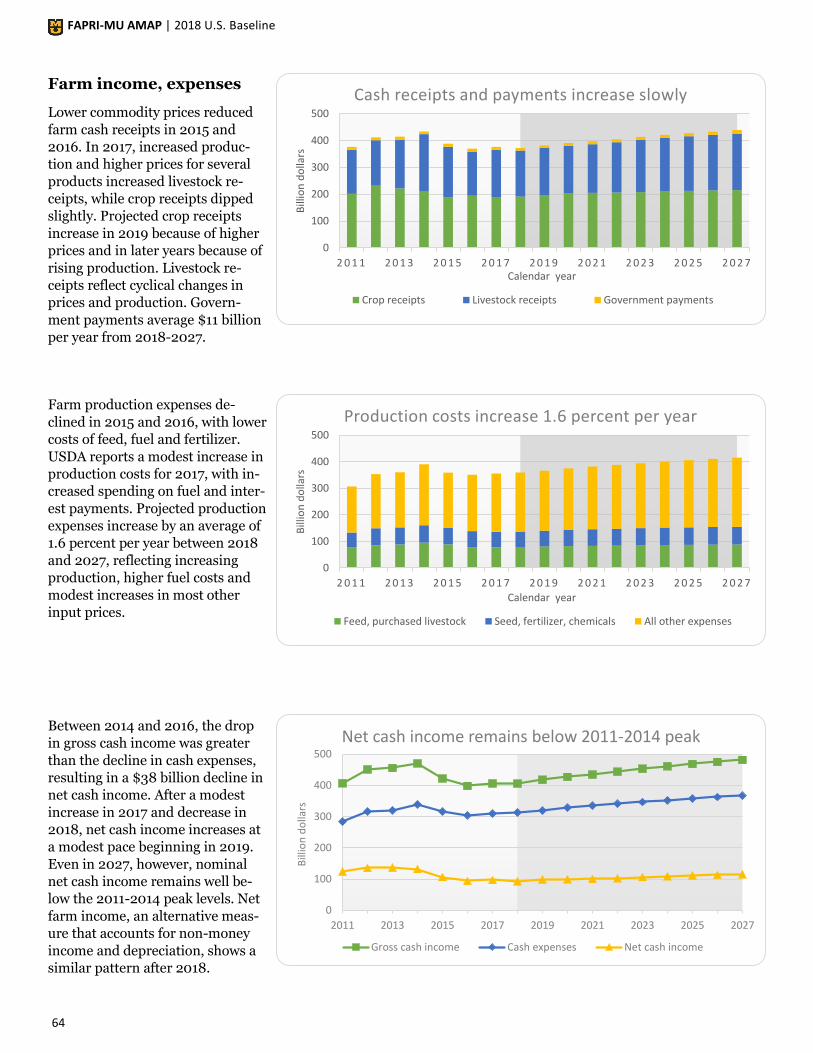
FAPRI-MU AMAP | 2018 U.S. Baseline
64
Farm income, expenses
Lower commodity prices reduced
farm cash receipts in 2015 and
2016. In 2017, increased produc-
tion and higher prices for several
products increased livestock re-
ceipts, while crop receipts dipped
slightly. Projected crop receipts
increase in 2019 because of higher
prices and in later years because of
rising production. Livestock re-
ceipts reflect cyclical changes in
prices and production. Govern-
ment payments average $11 billion
per year from 2018-2027.
Farm production expenses de-
clined in 2015 and 2016, with lower
costs of feed, fuel and fertilizer.
USDA reports a modest increase in
production costs for 2017, with in-
creased spending on fuel and inter-
est payments. Projected production
expenses increase by an average of
1.6 percent per year between 2018
and 2027, reflecting increasing
production, higher fuel costs and
modest increases in most other
input prices.
Between 2014 and 2016, the drop
in gross cash income was greater
than the decline in cash expenses,
resulting in a $38 billion decline in
net cash income. After a modest
increase in 2017 and decrease in
2018, net cash income increases at
a modest pace beginning in 2019.
Even in 2027, however, nominal
net cash income remains well be-
low the 2011-2014 peak levels. Net
farm income, an alternative meas-
ure that accounts for non-money
income and depreciation, shows a
similar pattern after 2018.
0
100
200
300
400
500
2 0 1 1 2 0 1 3 2 0 1 5 2 0 1 7 2 0 1 9 2 0 2 1 2 0 2 3 2 0 2 5 2 0 2 7
Bill
ion
do
llars
Calendar year
Cash receipts and payments increase slowly
Crop receipts Livestock receipts Government payments
0
100
200
300
400
500
2 0 1 1 2 0 1 3 2 0 1 5 2 0 1 7 2 0 1 9 2 0 2 1 2 0 2 3 2 0 2 5 2 0 2 7
Bill
ion
do
llars
Calendar year
Production costs increase 1.6 percent per year
Feed, purchased livestock Seed, fertilizer, chemicals All other expenses
0
100
200
300
400
500
2011 2013 2015 2017 2019 2021 2023 2025 2027
Bill
ion
do
llars
Net cash income remains below 2011-2014 peak
Gross cash income Cash expenses Net cash income
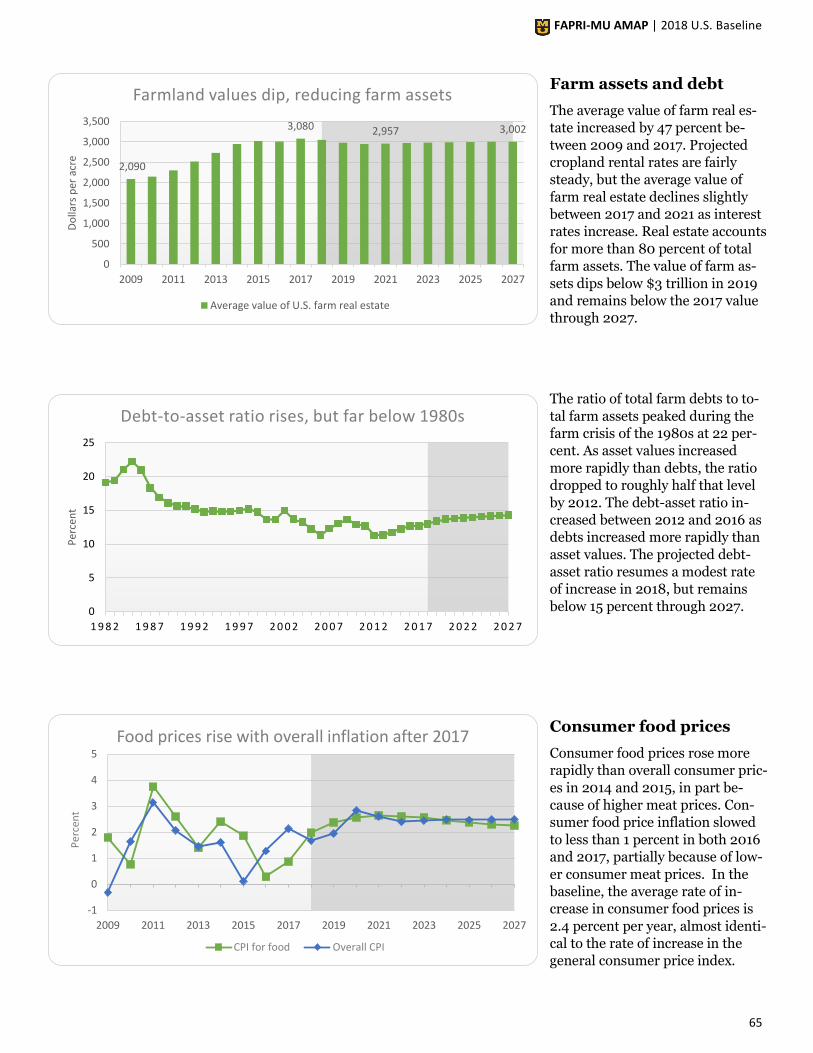
FAPRI-MU AMAP | 2018 U.S. Baseline
65
Farm assets and debt
The average value of farm real es-
tate increased by 47 percent be-
tween 2009 and 2017. Projected
cropland rental rates are fairly
steady, but the average value of
farm real estate declines slightly
between 2017 and 2021 as interest
rates increase. Real estate accounts
for more than 80 percent of total
farm assets. The value of farm as-
sets dips below $3 trillion in 2019
and remains below the 2017 value
through 2027.
The ratio of total farm debts to to-
tal farm assets peaked during the
farm crisis of the 1980s at 22 per-
cent. As asset values increased
more rapidly than debts, the ratio
dropped to roughly half that level
by 2012. The debt-asset ratio in-
creased between 2012 and 2016 as
debts increased more rapidly than
asset values. The projected debt-
asset ratio resumes a modest rate
of increase in 2018, but remains
below 15 percent through 2027.
Consumer food prices
Consumer food prices rose more
rapidly than overall consumer pric-
es in 2014 and 2015, in part be-
cause of higher meat prices. Con-
sumer food price inflation slowed
to less than 1 percent in both 2016
and 2017, partially because of low-
er consumer meat prices. In the
baseline, the average rate of in-
crease in consumer food prices is
2.4 percent per year, almost identi-
cal to the rate of increase in the
general consumer price index.
2,090
3,080 2,957 3,002
0
500
1,000
1,500
2,000
2,500
3,000
3,500
2009 2011 2013 2015 2017 2019 2021 2023 2025 2027
Do
llars
per
acr
e
Farmland values dip, reducing farm assets
Average value of U.S. farm real estate
0
5
10
15
20
25
1 9 8 2 1 9 8 7 1 9 9 2 1 9 9 7 2 0 0 2 2 0 0 7 2 0 1 2 2 0 1 7 2 0 2 2 2 0 2 7
Per
cen
t
Debt-to-asset ratio rises, but far below 1980s
-1
0
1
2
3
4
5
2009 2011 2013 2015 2017 2019 2021 2023 2025 2027
Per
cen
t
Food prices rise with overall inflation after 2017
CPI for food Overall CPI
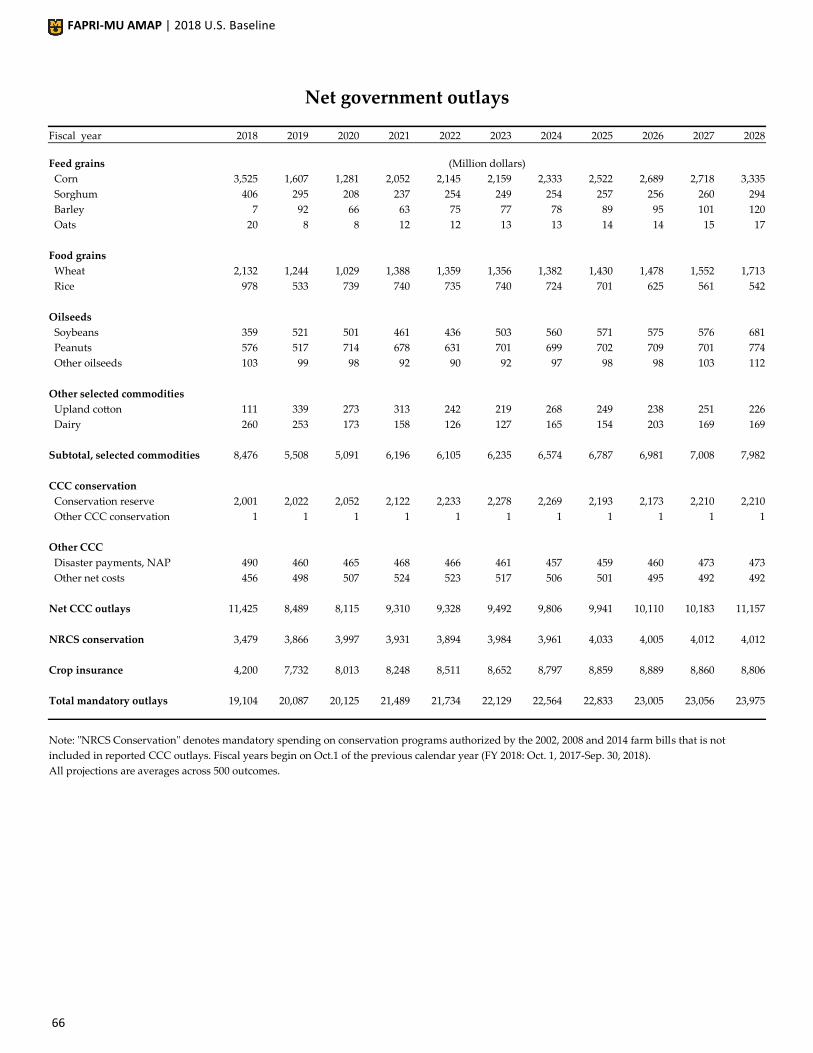
FAPRI-MU AMAP | 2018 U.S. Baseline
66
Net government outlays
Fiscal year 2018 2019 2020 2021 2022 2023 2024 2025 2026 2027 2028
Feed grains (Million dollars)
Corn 3,525 1,607 1,281 2,052 2,145 2,159 2,333 2,522 2,689 2,718 3,335
Sorghum 406 295 208 237 254 249 254 257 256 260 294
Barley 7 92 66 63 75 77 78 89 95 101 120
Oats 20 8 8 12 12 13 13 14 14 15 17
Food grains
Wheat 2,132 1,244 1,029 1,388 1,359 1,356 1,382 1,430 1,478 1,552 1,713
Rice 978 533 739 740 735 740 724 701 625 561 542
Oilseeds
Soybeans 359 521 501 461 436 503 560 571 575 576 681
Peanuts 576 517 714 678 631 701 699 702 709 701 774
Other oilseeds 103 99 98 92 90 92 97 98 98 103 112
Other selected commodities
Upland cotton 111 339 273 313 242 219 268 249 238 251 226
Dairy 260 253 173 158 126 127 165 154 203 169 169
Subtotal, selected commodities 8,476 5,508 5,091 6,196 6,105 6,235 6,574 6,787 6,981 7,008 7,982
CCC conservation
Conservation reserve 2,001 2,022 2,052 2,122 2,233 2,278 2,269 2,193 2,173 2,210 2,210
Other CCC conservation 1 1 1 1 1 1 1 1 1 1 1
Other CCC
Disaster payments, NAP 490 460 465 468 466 461 457 459 460 473 473
Other net costs 456 498 507 524 523 517 506 501 495 492 492
Net CCC outlays 11,425 8,489 8,115 9,310 9,328 9,492 9,806 9,941 10,110 10,183 11,157
NRCS conservation 3,479 3,866 3,997 3,931 3,894 3,984 3,961 4,033 4,005 4,012 4,012
Crop insurance 4,200 7,732 8,013 8,248 8,511 8,652 8,797 8,859 8,889 8,860 8,806
Total mandatory outlays 19,104 20,087 20,125 21,489 21,734 22,129 22,564 22,833 23,005 23,056 23,975
Note: "NRCS Conservation" denotes mandatory spending on conservation programs authorized by the 2002, 2008 and 2014 farm bills that is not
included in reported CCC outlays. Fiscal years begin on Oct.1 of the previous calendar year (FY 2018: Oct. 1, 2017-Sep. 30, 2018).
All projections are averages across 500 outcomes.

FAPRI-MU AMAP | 2018 U.S. Baseline
67
Selected direct government payments
Marketing year 17/18 18/19 19/20 20/21 21/22 22/23 23/24 24/25 25/26 26/27 27/28
(Million dollars)
ARC payments 2,413 1,935 549 534 603 648 746 782 792 854 946
PLC payments 2,359 2,559 5,034 5,032 5,100 5,298 5,442 5,552 5,563 6,486 6,802
Marketing loans 0 390 358 371 318 310 359 357 345 379 368
Total 4,772 4,884 5,941 5,937 6,021 6,256 6,547 6,692 6,700 7,720 8,116
Note: Includes selected payments for feed grains, food grains, oilseeds, and upland cotton.
All projections are averages across 500 outcomes.
Crop insurance
Year 2017 2018 2019 2020 2021 2022 2023 2024 2025 2026 2027
(Million dollars, crop year)
Total premiums 10,070 10,243 10,534 10,886 11,170 11,328 11,572 11,664 11,688 11,685 11,602
Producer-paid premiums 3,717 3,808 3,899 4,037 4,150 4,182 4,266 4,291 4,305 4,297 4,275
Premium subsidies 6,354 6,435 6,635 6,848 7,020 7,146 7,306 7,373 7,383 7,388 7,327
Total indemnities 5,317 9,269 9,589 9,886 10,217 10,358 10,544 10,614 10,659 10,626 10,550
Loss ratio 0.53 0.90 0.91 0.91 0.91 0.91 0.91 0.91 0.91 0.91 0.91
(Million dollars, crop year)
Net indemnities 1,600 5,460 5,690 5,849 6,066 6,176 6,278 6,323 6,354 6,329 6,274
Corn 39 1,820 1,978 2,114 2,217 2,279 2,321 2,323 2,325 2,285 2,258
Soybeans -143 1,352 1,316 1,365 1,407 1,422 1,440 1,458 1,467 1,461 1,429
Wheat 427 545 616 620 651 662 671 674 675 674 661
Upland cotton 273 569 586 574 603 606 607 616 629 643 653
All other 1,004 1,176 1,194 1,176 1,189 1,207 1,239 1,252 1,258 1,265 1,274
(Million dollars, fiscal year)
Net outlays 4,293 4,200 7,732 8,013 8,248 8,511 8,652 8,797 8,859 8,889 8,860
All projections are averages across 500 outcomes.
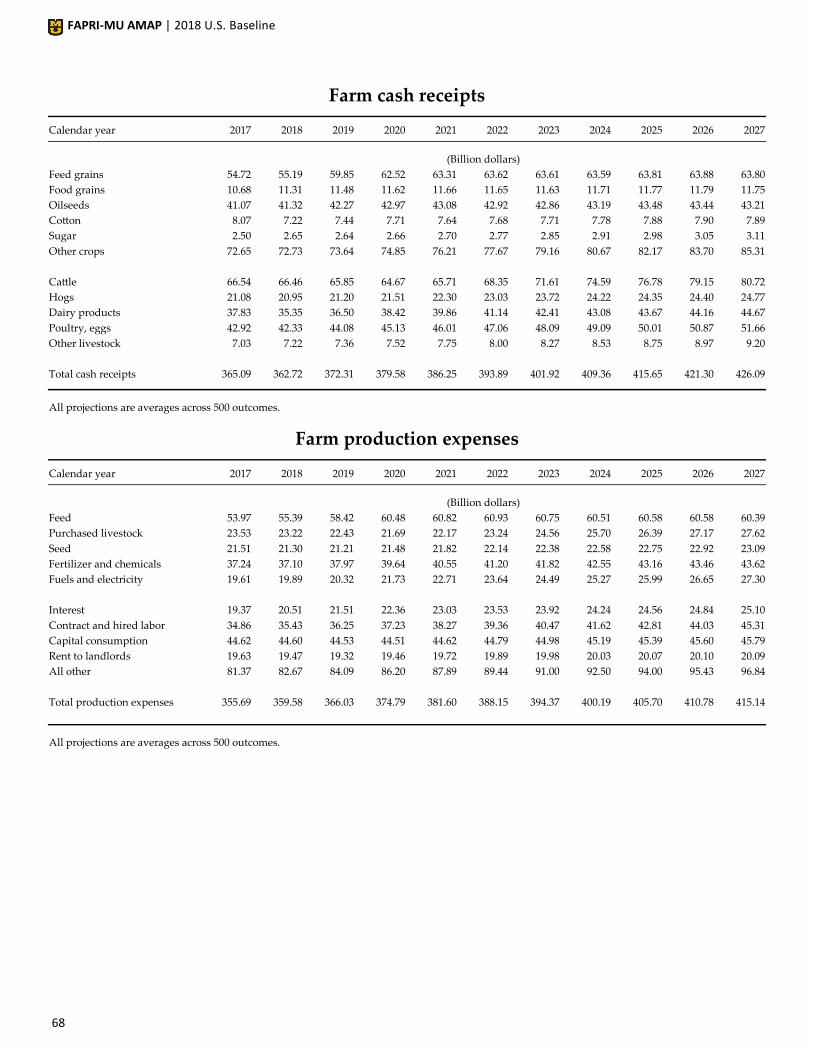
FAPRI-MU AMAP | 2018 U.S. Baseline
68
Farm cash receipts
Calendar year 2017 2018 2019 2020 2021 2022 2023 2024 2025 2026 2027
(Billion dollars)
Feed grains 54.72 55.19 59.85 62.52 63.31 63.62 63.61 63.59 63.81 63.88 63.80
Food grains 10.68 11.31 11.48 11.62 11.66 11.65 11.63 11.71 11.77 11.79 11.75
Oilseeds 41.07 41.32 42.27 42.97 43.08 42.92 42.86 43.19 43.48 43.44 43.21
Cotton 8.07 7.22 7.44 7.71 7.64 7.68 7.71 7.78 7.88 7.90 7.89
Sugar 2.50 2.65 2.64 2.66 2.70 2.77 2.85 2.91 2.98 3.05 3.11
Other crops 72.65 72.73 73.64 74.85 76.21 77.67 79.16 80.67 82.17 83.70 85.31
Cattle 66.54 66.46 65.85 64.67 65.71 68.35 71.61 74.59 76.78 79.15 80.72
Hogs 21.08 20.95 21.20 21.51 22.30 23.03 23.72 24.22 24.35 24.40 24.77
Dairy products 37.83 35.35 36.50 38.42 39.86 41.14 42.41 43.08 43.67 44.16 44.67
Poultry, eggs 42.92 42.33 44.08 45.13 46.01 47.06 48.09 49.09 50.01 50.87 51.66
Other livestock 7.03 7.22 7.36 7.52 7.75 8.00 8.27 8.53 8.75 8.97 9.20
Total cash receipts 365.09 362.72 372.31 379.58 386.25 393.89 401.92 409.36 415.65 421.30 426.09
All projections are averages across 500 outcomes.
Farm production expenses
Calendar year 2017 2018 2019 2020 2021 2022 2023 2024 2025 2026 2027
(Billion dollars)
Feed 53.97 55.39 58.42 60.48 60.82 60.93 60.75 60.51 60.58 60.58 60.39
Purchased livestock 23.53 23.22 22.43 21.69 22.17 23.24 24.56 25.70 26.39 27.17 27.62
Seed 21.51 21.30 21.21 21.48 21.82 22.14 22.38 22.58 22.75 22.92 23.09
Fertilizer and chemicals 37.24 37.10 37.97 39.64 40.55 41.20 41.82 42.55 43.16 43.46 43.62
Fuels and electricity 19.61 19.89 20.32 21.73 22.71 23.64 24.49 25.27 25.99 26.65 27.30
Interest 19.37 20.51 21.51 22.36 23.03 23.53 23.92 24.24 24.56 24.84 25.10
Contract and hired labor 34.86 35.43 36.25 37.23 38.27 39.36 40.47 41.62 42.81 44.03 45.31
Capital consumption 44.62 44.60 44.53 44.51 44.62 44.79 44.98 45.19 45.39 45.60 45.79
Rent to landlords 19.63 19.47 19.32 19.46 19.72 19.89 19.98 20.03 20.07 20.10 20.09
All other 81.37 82.67 84.09 86.20 87.89 89.44 91.00 92.50 94.00 95.43 96.84
Total production expenses 355.69 359.58 366.03 374.79 381.60 388.15 394.37 400.19 405.70 410.78 415.14
All projections are averages across 500 outcomes.

FAPRI-MU AMAP | 2018 U.S. Baseline
69
Farm income statistics
Calendar year 2017 2018 2019 2020 2021 2022 2023 2024 2025 2026 2027
(Billion dollars)
1. Farm receipts 394.77 396.02 407.63 416.06 423.83 432.41 441.36 449.67 456.81 463.27 468.80
Crops 189.69 190.41 197.31 202.33 204.61 206.30 207.82 209.85 212.10 213.75 215.07
Livestock 175.41 172.31 175.00 177.26 181.64 187.59 194.10 199.51 203.55 207.55 211.01
Farm-related 29.68 33.30 35.32 36.48 37.58 38.52 39.44 40.31 41.16 41.96 42.72
2. Government payments 11.38 9.80 9.88 11.08 11.07 11.21 11.56 11.79 11.92 11.94 12.97
3. Gross cash income 406.15 405.82 417.51 427.14 434.89 443.62 452.92 461.46 468.74 475.20 481.78
(1 + 2)
4. Nonmoney income 18.24 19.05 19.61 20.08 20.40 20.59 20.70 20.78 20.83 20.86 20.88
5. Value of inventory
Change -4.93 -4.53 0.13 0.05 -0.57 -0.51 -0.39 -0.22 -0.16 -0.17 -0.15
6. Gross farm income 419.46 420.34 437.25 447.26 454.72 463.70 473.23 482.02 489.41 495.89 502.50
(3 + 4 + 5)
7. Cash expenses 309.24 313.15 319.43 328.01 334.58 340.85 346.79 352.37 357.65 362.50 366.66
8. Total expenses 355.69 359.58 366.03 374.79 381.60 388.15 394.37 400.19 405.70 410.78 415.14
9. Net cash income 96.91 92.67 98.08 99.13 100.31 102.77 106.12 109.09 111.09 112.70 115.12
(3 - 7)
10. Realized net farm inc 68.70 65.29 71.09 72.42 73.68 76.06 79.25 82.05 83.87 85.29 87.52
(3 + 4 - 8)
11. Net farm income 63.76 60.77 71.22 72.47 73.11 75.55 78.86 81.83 83.71 85.11 87.36
(6 - 8)
Deflated (2017 $) 63.76 59.70 68.59 68.26 67.27 67.95 69.39 70.43 70.47 70.10 70.40
All projections are averages across 500 outcomes.
Land rental rates and real estate values
Year 2017 2018 2019 2020 2021 2022 2023 2024 2025 2026 2027
Rental rates (Dollars per acre)
Cropland 136.00 135.24 134.63 135.77 137.63 138.80 139.37 139.62 139.73 139.78 139.57
Pasture 12.50 12.23 11.80 11.61 11.51 11.46 11.49 11.60 11.75 11.91 12.05
Value of farm real estate 3,080 3,049 2,980 2,947 2,957 2,971 2,983 2,992 2,999 3,003 3,002
All projections are averages across 500 outcomes.
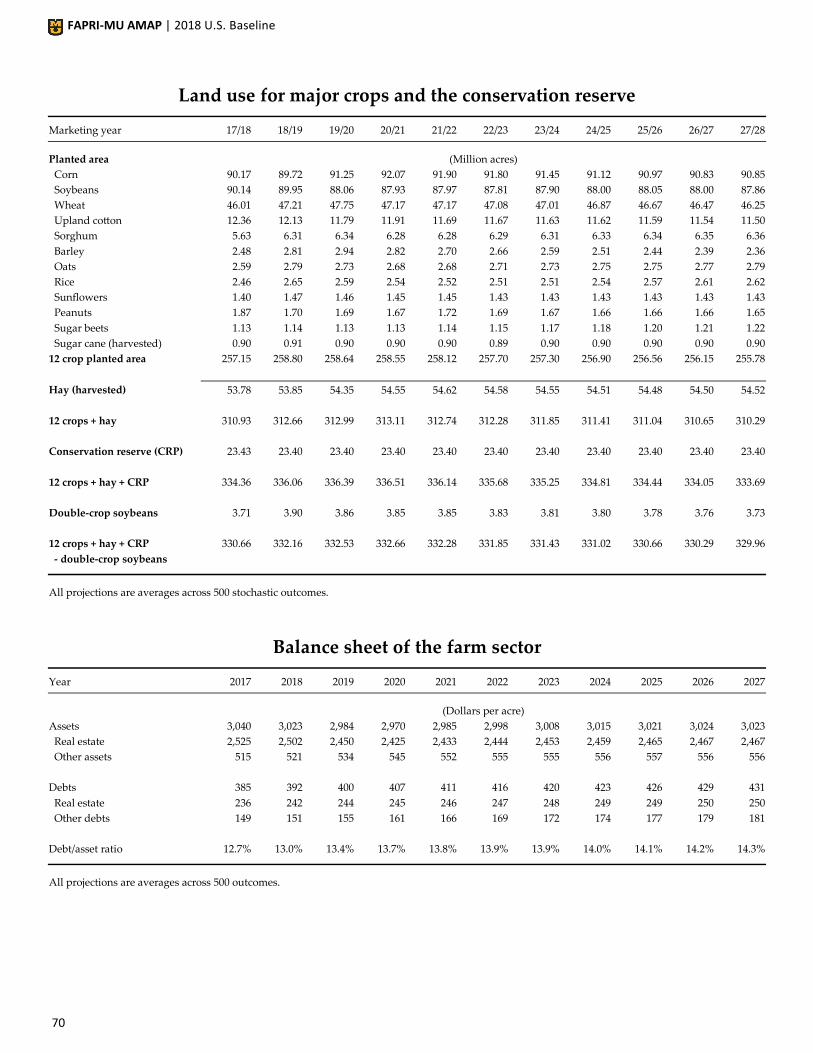
FAPRI-MU AMAP | 2018 U.S. Baseline
70
Balance sheet of the farm sector
Year 2017 2018 2019 2020 2021 2022 2023 2024 2025 2026 2027
(Dollars per acre)
Assets 3,040 3,023 2,984 2,970 2,985 2,998 3,008 3,015 3,021 3,024 3,023
Real estate 2,525 2,502 2,450 2,425 2,433 2,444 2,453 2,459 2,465 2,467 2,467
Other assets 515 521 534 545 552 555 555 556 557 556 556
Debts 385 392 400 407 411 416 420 423 426 429 431
Real estate 236 242 244 245 246 247 248 249 249 250 250
Other debts 149 151 155 161 166 169 172 174 177 179 181
Debt/asset ratio 12.7% 13.0% 13.4% 13.7% 13.8% 13.9% 13.9% 14.0% 14.1% 14.2% 14.3%
All projections are averages across 500 outcomes.
Land use for major crops and the conservation reserve
Marketing year 17/18 18/19 19/20 20/21 21/22 22/23 23/24 24/25 25/26 26/27 27/28
Planted area (Million acres)
Corn 90.17 89.72 91.25 92.07 91.90 91.80 91.45 91.12 90.97 90.83 90.85
Soybeans 90.14 89.95 88.06 87.93 87.97 87.81 87.90 88.00 88.05 88.00 87.86
Wheat 46.01 47.21 47.75 47.17 47.17 47.08 47.01 46.87 46.67 46.47 46.25
Upland cotton 12.36 12.13 11.79 11.91 11.69 11.67 11.63 11.62 11.59 11.54 11.50
Sorghum 5.63 6.31 6.34 6.28 6.28 6.29 6.31 6.33 6.34 6.35 6.36
Barley 2.48 2.81 2.94 2.82 2.70 2.66 2.59 2.51 2.44 2.39 2.36
Oats 2.59 2.79 2.73 2.68 2.68 2.71 2.73 2.75 2.75 2.77 2.79
Rice 2.46 2.65 2.59 2.54 2.52 2.51 2.51 2.54 2.57 2.61 2.62
Sunflowers 1.40 1.47 1.46 1.45 1.45 1.43 1.43 1.43 1.43 1.43 1.43
Peanuts 1.87 1.70 1.69 1.67 1.72 1.69 1.67 1.66 1.66 1.66 1.65
Sugar beets 1.13 1.14 1.13 1.13 1.14 1.15 1.17 1.18 1.20 1.21 1.22
Sugar cane (harvested) 0.90 0.91 0.90 0.90 0.90 0.89 0.90 0.90 0.90 0.90 0.90
12 crop planted area 257.15 258.80 258.64 258.55 258.12 257.70 257.30 256.90 256.56 256.15 255.78
Hay (harvested) 53.78 53.85 54.35 54.55 54.62 54.58 54.55 54.51 54.48 54.50 54.52
12 crops + hay 310.93 312.66 312.99 313.11 312.74 312.28 311.85 311.41 311.04 310.65 310.29
Conservation reserve (CRP) 23.43 23.40 23.40 23.40 23.40 23.40 23.40 23.40 23.40 23.40 23.40
12 crops + hay + CRP 334.36 336.06 336.39 336.51 336.14 335.68 335.25 334.81 334.44 334.05 333.69
Double-crop soybeans 3.71 3.90 3.86 3.85 3.85 3.83 3.81 3.80 3.78 3.76 3.73
12 crops + hay + CRP 330.66 332.16 332.53 332.66 332.28 331.85 331.43 331.02 330.66 330.29 329.96
- double-crop soybeans
All projections are averages across 500 stochastic outcomes.
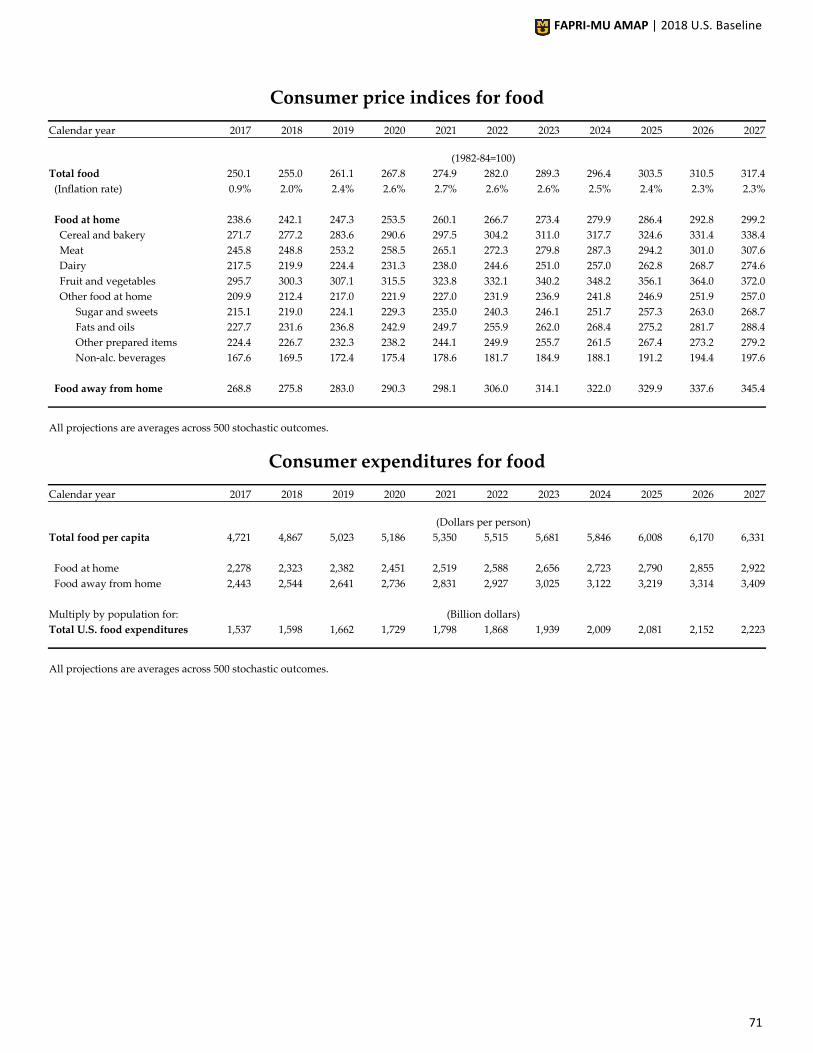
FAPRI-MU AMAP | 2018 U.S. Baseline
71
Consumer price indices for food
Calendar year 2017 2018 2019 2020 2021 2022 2023 2024 2025 2026 2027
(1982-84=100)
Total food 250.1 255.0 261.1 267.8 274.9 282.0 289.3 296.4 303.5 310.5 317.4
(Inflation rate) 0.9% 2.0% 2.4% 2.6% 2.7% 2.6% 2.6% 2.5% 2.4% 2.3% 2.3%
Food at home 238.6 242.1 247.3 253.5 260.1 266.7 273.4 279.9 286.4 292.8 299.2
Cereal and bakery 271.7 277.2 283.6 290.6 297.5 304.2 311.0 317.7 324.6 331.4 338.4
Meat 245.8 248.8 253.2 258.5 265.1 272.3 279.8 287.3 294.2 301.0 307.6
Dairy 217.5 219.9 224.4 231.3 238.0 244.6 251.0 257.0 262.8 268.7 274.6
Fruit and vegetables 295.7 300.3 307.1 315.5 323.8 332.1 340.2 348.2 356.1 364.0 372.0
Other food at home 209.9 212.4 217.0 221.9 227.0 231.9 236.9 241.8 246.9 251.9 257.0
Sugar and sweets 215.1 219.0 224.1 229.3 235.0 240.3 246.1 251.7 257.3 263.0 268.7
Fats and oils 227.7 231.6 236.8 242.9 249.7 255.9 262.0 268.4 275.2 281.7 288.4
Other prepared items 224.4 226.7 232.3 238.2 244.1 249.9 255.7 261.5 267.4 273.2 279.2
Non-alc. beverages 167.6 169.5 172.4 175.4 178.6 181.7 184.9 188.1 191.2 194.4 197.6
Food away from home 268.8 275.8 283.0 290.3 298.1 306.0 314.1 322.0 329.9 337.6 345.4
All projections are averages across 500 stochastic outcomes.
Consumer expenditures for food
Calendar year 2017 2018 2019 2020 2021 2022 2023 2024 2025 2026 2027
(Dollars per person)
Total food per capita 4,721 4,867 5,023 5,186 5,350 5,515 5,681 5,846 6,008 6,170 6,331
Food at home 2,278 2,323 2,382 2,451 2,519 2,588 2,656 2,723 2,790 2,855 2,922
Food away from home 2,443 2,544 2,641 2,736 2,831 2,927 3,025 3,122 3,219 3,314 3,409
Multiply by population for: (Billion dollars)
Total U.S. food expenditures 1,537 1,598 1,662 1,729 1,798 1,868 1,939 2,009 2,081 2,152 2,223
All projections are averages across 500 stochastic outcomes.
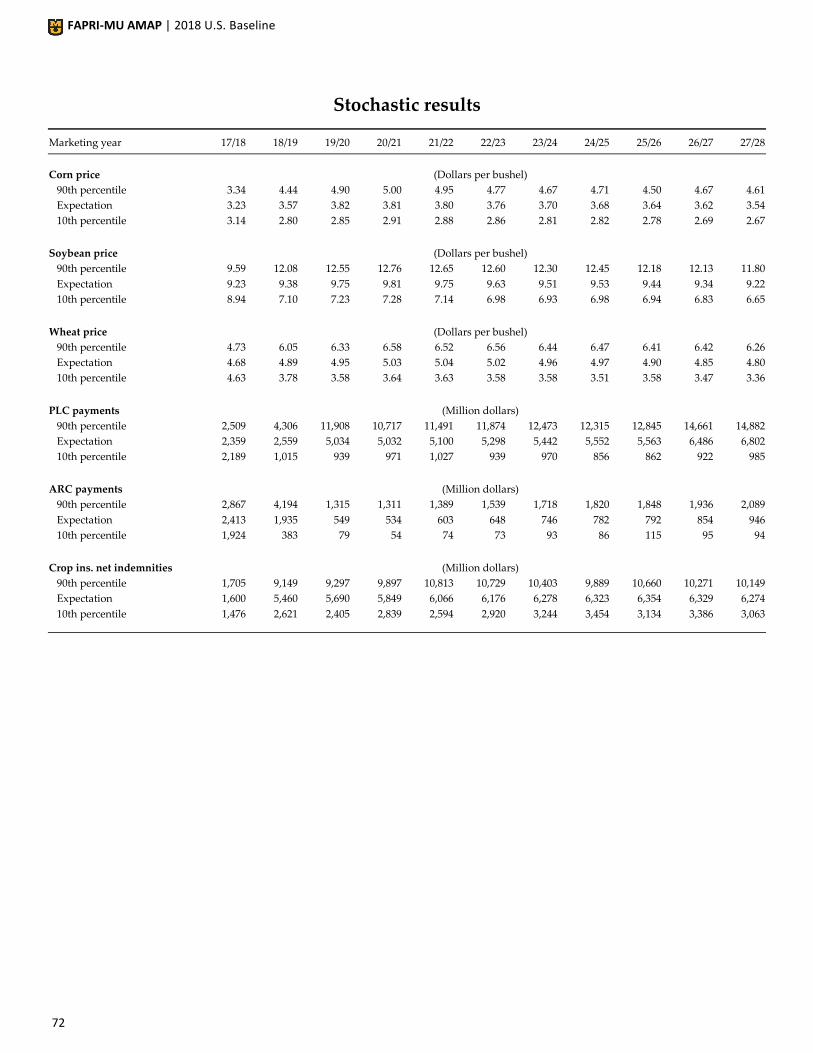
FAPRI-MU AMAP | 2018 U.S. Baseline
72
Stochastic results
Marketing year 17/18 18/19 19/20 20/21 21/22 22/23 23/24 24/25 25/26 26/27 27/28
Corn price (Dollars per bushel)
90th percentile 3.34 4.44 4.90 5.00 4.95 4.77 4.67 4.71 4.50 4.67 4.61
Expectation 3.23 3.57 3.82 3.81 3.80 3.76 3.70 3.68 3.64 3.62 3.54
10th percentile 3.14 2.80 2.85 2.91 2.88 2.86 2.81 2.82 2.78 2.69 2.67
Soybean price (Dollars per bushel)
90th percentile 9.59 12.08 12.55 12.76 12.65 12.60 12.30 12.45 12.18 12.13 11.80
Expectation 9.23 9.38 9.75 9.81 9.75 9.63 9.51 9.53 9.44 9.34 9.22
10th percentile 8.94 7.10 7.23 7.28 7.14 6.98 6.93 6.98 6.94 6.83 6.65
Wheat price (Dollars per bushel)
90th percentile 4.73 6.05 6.33 6.58 6.52 6.56 6.44 6.47 6.41 6.42 6.26
Expectation 4.68 4.89 4.95 5.03 5.04 5.02 4.96 4.97 4.90 4.85 4.80
10th percentile 4.63 3.78 3.58 3.64 3.63 3.58 3.58 3.51 3.58 3.47 3.36
PLC payments (Million dollars)
90th percentile 2,509 4,306 11,908 10,717 11,491 11,874 12,473 12,315 12,845 14,661 14,882
Expectation 2,359 2,559 5,034 5,032 5,100 5,298 5,442 5,552 5,563 6,486 6,802
10th percentile 2,189 1,015 939 971 1,027 939 970 856 862 922 985
ARC payments (Million dollars)
90th percentile 2,867 4,194 1,315 1,311 1,389 1,539 1,718 1,820 1,848 1,936 2,089
Expectation 2,413 1,935 549 534 603 648 746 782 792 854 946
10th percentile 1,924 383 79 54 74 73 93 86 115 95 94
Crop ins. net indemnities (Million dollars)
90th percentile 1,705 9,149 9,297 9,897 10,813 10,729 10,403 9,889 10,660 10,271 10,149
Expectation 1,600 5,460 5,690 5,849 6,066 6,176 6,278 6,323 6,354 6,329 6,274
10th percentile 1,476 2,621 2,405 2,839 2,594 2,920 3,244 3,454 3,134 3,386 3,063