Embed Size (px)
Citation preview
1
PROBLEMS AND PROSPECTS OF WASTE MANAGEMENT IN ENUGU
STATE. A CASE STUDY OF ENUGU STATE WASTE MANAGEMENT
AUTHORITY (ESWAMA) .
BY
OKAFOR,CHUKWUEMEKA IKECHUKWU
PG/M.SC/09/51572
A PROJECT RESEARCH SUBMITTED IN PARTIAL FULFILLMENT
OF THE REQUIREMENTS FOR THE AWARD OF MASTER OF
SCIENCE IN THE DEPARTMENT OF PUBLIC ADMINISTRATION.
UNIVERSITY OF NIGERIA, NSUKKA
APRIL, 2011
2
TITLE PAGE
PROBLEMS AND PROSPECTS OF WASTE MANAGEMENT IN ENUGU
STATE. A CASE STUDY OF ENUGU STATE WASTE MANAGEMENT
AUTHORITY (ESWAMA)
3
CERTIFICATION
OKAFOR, CHUKWUEMEKA IKECHUKWU a postgraduate student in the
Department of Public Administration and Local Government, University of
Nigeria, Nsukka with Registration No. PG/M.SC/09/51572 has satisfactorily
completed the requirements of the course and research work for the award of the
degree of Master of Science in Public Administration.
…………………………… ……………………………
Prof. Fab Onah Prof. Fab Onah
(Supervisor) (Head of Department)
…………………………………..
Prof. E.O. Ezeani
(Dean of Faculty)
…………………………………..
Rev. Fr. (Prof) A.N. Akwanya
(Dean of SPGS)
…………………………………..
(External Supervisor)
4
DEDICATION
The work is dedicated to my dear mother; Mrs Ifeoma Lucy Okafor. Mummy, you
are truly a woman of noble character.
5
ACKNOWLEDGEMENT
This research work would not have been completed all by me. Some persons
have in one way or the other assisted towards the actualization of this tasking feat.
First and foremost, I‟m grateful to God Almighty for His Loving kindness
bestowed on me throughout the period of intense intellectual activity and for
crowning my endeavors with success. His name be praised ever.
With immense gratitude, I acknowledge the fatherly and scholarly tutelage
of my supervisor, Professor Fab. O. Onah; his guidance revived me morally and
academically.
Prof. F. C. Okoli, Prof. R. C. Onah, Prof. C. Oguonu, Prof. C. Ofuebe, Dr.
Uche Nnadozie, Dr. M. A. O. Obi and Dr. A. O. Uzuegbunam are highly
appreciated for the knowledge they impacted on me which aided the writing of the
work.
My eternal gratitude goes to my dad, Mr. Patrick. I. Okafor, Nnabuenyi 1 of
Ogidi; my mum, Mrs. Ifeoma Lucy Okafor, for all their moral, financial and
spiritual support. Sincerely, I thank my siblings Chinedu, Ifeoma, Chidi and
Chinwendu for their words of encouragement and cooperation.
I deeply want to say a big thanks to my friend Ifeoma Okeke; course mate
and bossom friend Precious Uzoechi , for their un-flinching and innumerable
6
support all through my study. I am highly indebted to my colleagues Anikwe
Obinna, Musa Muhammad Sani, Magaji Yuguda, Momoh Saliu and Jim Ogbolo
Best-man for their relentless scholarly advice all through the period of putting this
work together.
Okafor, Chukwuemeka Ikechukwu
Public Administration & Local Government
Faculty of Social Sciences
University of Nigeria, Nsukka
7
ABSTRACT
The generation and disposal of waste is an intrinsic part of any developing or
industrial society. Studies have shown that the volume of waste does not actually
constitute the problem but the ability or inability of governments, individuals and
waste disposal firms to keep up with the task of managing waste and the
environment. Past and present administrations in Enugu State have made several
attempts to address the problems of waste management in the state. The
establishment of the Enugu State Waste Management Authority (ESWAMA), in
2004, has not significantly addressed the menace of waste disposal as heaps of
refuses are still seen all over the state on daily basis. Inadequate funding,
incompetent staff, people‟s attitudes and ineffective monitoring/control mechanism
are variables posing challenges to ESWAMA and as such, prompted this research.
The study investigated the extent to which fund affects the efficiency of
ESWAMA and the professional training status of staff of ESWAMA. We also
verified the impact of people‟s attitudes towards ESWAMA‟s mandate as well as
the impact of monitoring and control on the management of waste in Enugu State.
Primary and Secondary sources of data collection were employed using the simple
percentage and chi square analytical tools. The study hinged its theoretical
framework on the Functional Structural theory. Increment of the supplementary
funds allocated to ESWAMA, regularization and staff wider participation in the
training packages, merit and transparency in the recruitment exercises, among
others, were recommended.
8
TABLE OF CONTENTS
Title page ...................…………………………………………………......i
Approval/Certification ……………………………………………………..ii
Dedication ………………………………………………………………..iii
Acknowledgement …………………………………………………………iv
Abstract …………………………………………………………………..vi
Table of Contents …………………………………………………….........vii
CHAPTER ONE: INTRODUCTION
1.1 Background of the Study.......................................................................1
1.2 Statement of the Problem …………………………………………….6
1.3 Objectives of the Study ……………………………………………..10
1.4 Significance of the Study …………………………………………...10
1.5 Scope and the Limitations of the Study …………………………….12
CHAPTER TWO: LITERATURE REVIEW AND METHODOLOGY
2.1.0 Literature Review……………………………………………………13
2.1.1 Concept of Waste …………………………………………………...13
2.1.2 Waste Management ……………………………………….................29
2.1.3 Methods of Waste Disposal…………………………………………31
2.1.4 Waste Management in Nigeria………………………………………35
9
2.2 Hypothesis …………………………………………………………44
2.3 Operationalization of Key Concepts ………………………………44
2.4 Research Methodology ……………………………………………49
2.4.1 Type of Study……………………………………………………...49
2.4.2 Methods of Data Collection………………………………………..49
2.4.3 Population of Study………………………………………………...51
2.4.4 Sample and Sampling Procedure………………………………….51
2.4.5 Validity and Reliability of Instruments…………………………...53
2.4.6 Method of Data Analysis………………………………………….56
2.5 Theoretical Framework……………………………………………57
CHAPTER THREE: BACKGROUND INFORMATION ON ESWAMA
3.1 Origin of ESWAMA ……………………………………………….67
3.2 Location of ESWAMA …………………………………………….69
3.3 Vision of ESWAMA ………………………………………………70
3.4 Mission Statement of ESWAMA ………………………………….70
3.5 Clients of ESWAMA ………………………………………………71
3.6 What ESWAMA expects from the Clients ………………………...71
3.7 Complaint Handling Procedures and Dispute Handling Mechanism 72
3.8 Types of Complaints Entertained by ESWAMA…………………...73
10
3.9 ESWAMA‟s Broad Range of Marketing Methods…………………73
3.10 Organizational Structure……………………………………………73
CHAPTER FOUR: DATA PRESENTATION AND ANALYSIS
4.0 Introduction……………………………………………………........82
4.1 Data Presentation and Analysis …………………………………….83
4.1.1 Presentation and Analysis of Personal Data of Respondents……….83
4.1.2 Presentation and Analysis of the Substantive Data…………………88
4.1.3 Test of Hypothesis…………………………………………………111
4.2 Findings …………………………………………………………...127
4.3 Implications of Results and Findings ……………………………..139
CHAPTER FIVE: SUMMARY, RECOMMENDATIONS AND CONCLUSION
5.1 Summary …………………………………………………………..142
5.2 Recommendations …………………………………………………144
5.3 Conclusion ………………………………………………………...146
Bibliography ………………………………………………………149
Appendices ………………………………………………………..153
11
CHAPTER ONE
INTRODUCTION
1.1 BACKGROUND TO THE STUDY
Historically, the amount of wastes generated by human population was
insignificant mainly due to the low population densities, coupled with the fact that
there was very little exploitation of natural resources. Common wastes produced
during the early ages were mainly ashes and human & biodegradable wastes
(Biodegradable waste is a type of waste, typically originating
from plant or animal sources, which may be broken down by other living-
organisms. Waste that cannot be broken down by other living organisms may be
called non-biodegradable) and these were released back into the ground locally,
with minimal environmental impact.
Before the widespread use of metals, wood was widely used for most
applications. However, re-use of wood has been well documented. Nevertheless, it
is once again well documented that reuse and recovery of such metals have been
carried out by earlier humans.
With the advent of industrial revolution, waste management became a critical
issue. This was due to the increase in population and the massive migration of
people to industrial towns and cities from rural areas during the 18th century.
12
There was a consequent increase in industrial and domestic wastes posing threat
to human health and environment.
The generation and disposal of waste is an intrinsic part of any developing or
industrial society. Waste, both from domestic and commercial sources has grown
significantly in Nigeria over the past decade. Every time a householder shops at the
Store and open market, he contributes to the mountain of waste. It is possible to
quote figures which show that the production of waste amounts to millions of tons.
The percentage of Nigeria‟s population living in cities and urban areas has more
than doubled in the last 15 years (Jimoh, 2005). The cities and urban areas
experience continuous growth which contributes to enormous in generation of
solid and liquid waste.
The management of waste is a matter of national and international concern.
Studies have shown that the volume of waste does not actually constitute the
problem but the ability or inability of governments, individuals and waste disposal
firms to keep up with the task of managing waste and the environment. There is no
doubt that a dirty environment affects the standard of living, aesthetic sensibilities,
health of the people and thus the quality of their lives. The corollary is that
improper disposal or storage of this waste can constitute hazards to the society
through the pollution of air, land and especially water.
13
Waste management especially in urban areas of Nigeria is still very
problematic. Governments, non-governmental organizations and private
individuals have been involved in waste management through various means.
Waste management in urban areas has moved from solely public management to
private management and presently to public -private participation. The problems
associated with waste management are made more complex by the presence of
non-degradable refuse (such as polythene materials).
Indiscriminate disposal and dumping of waste has become a common
practice in Nigerian cities. Most of the waste dumps are located close to residential
areas, markets, farms, roadsides, and creeks. The composition of waste dumps
varies widely with many human activities located close to dump sites. Familiar
examples include domestic and industrial wastes. Industrial wastes are generated
from industrial activities such as chemicals, pesticides, paints, grease, inorganic
materials, oil sludge, and so on. Domestic wastes are those generated from
commercial establishments and household activities.
Enugu, like most other urban centers of the developing world is
experiencing rapid and uncontrolled growth typified by poor planning, rapid
population growth, inadequate amenities and poor sanitation (Hardoy and
Satterhwaite, 1989). The rapid growth of Enugu urban has created waste
management problems for the city.
14
Past and present administrations in Enugu state have made several attempts
to address the problems of waste management in the state. The efforts culminated
in the establishment of the Enugu State Waste Management Authority (ESWAMA)
in 2004 by the administration of Dr. Chimaroke Nnamani. The authority was set up
to replace the defunct Enugu State Environmental Protection Agency (ENSEPA),
which failed to meet the challenges of modern day waste management.
When the incumbent Governor of Enugu State, Dr Sullivan Chime, unfolded
his four cardinal objectives as he assumed office in 2007, one of them was aimed
at ensuring the cleanliness of the major cities of the state, including Enugu, the
state capital. He demonstrated his commitment towards ensuring the cleanliness of
the state when he launched the 15 waste disposal compaction vehicles and 1,000
refuse bins at Okpara Square as part of plans to keep the environment clean.
Furthermore, in an interview with the Insider weekly newspaper, the commissioner
for Information and Culture, Mr. Chuks Ugwoke said the state government was
making arrangements with the management of ESWAMA for sustainable refuse
disposal and urban waste management in the state. He restated government‟s
determination and commitment to maintain a healthy and clean environment, as
well as to ensure that the issue of waste disposal and management was taken care
of and put to rest. But long after this assurance, waste management in Enugu state,
15
rather than improve, has degenerated to the lowest ebb, with the environment
already feared to be contaminated and disease-borne.
Refuse heaps have taken over Enugu metropolis, a situation which generates
fears of an outbreak of epidemic in the state. Residents of Enugu have expressed
deep concern over the poor sanitary conditions of some parts of the state. The
situation becomes unbearable as refuse heaps are littered in unauthorized places.
Also, rubbish dumps, hitherto located at strategic locations, are found to overflow
with refuse, a development believed to pose health risks for the masses. It is
observed that, in many sections of the town, the rubbish dumps have not been
evacuated for several weeks running.
For instance, residents of parts of Enugu metropolis like Ogui New Layout, Achara
Layout, MaryLand, Uwani, Garki, Emene, Isieke junction and Ugbene in Abakpa
Nike area respectively complained to an official of a Weekly newspaper(Klin
Reports) that waste disposal officials of the state had, for inexplicable reasons, not
visited for refuse evacuation for weeks now. Residents are, further, troubled over
the stench that oozes out from the numerous abandoned refuse heaps across the
capital city. The refuse heaps have, also, remained a breeding ground for
mosquitoes which have greatly constituted a health hazard to the people. The
Insider Weekly newspaper of August 2nd
, 2010 reported that findings have shown
16
that diarrhea (commonly called running stomach), especially, among the infant
population, is on the increase in recent times. This is, often, accompanied by
catarrh, cough, cold and fever. And some medical experts have attributed the
outbreak of these diseases to the polluted air arising from waste mismanagement.
In another development, Vanguard newspaper reported that no fewer than 70
dump bins belonging to Enugu State Waste Management Authority, ESWAMA,
have been set ablaze by some angry residents of the coal city, who are protesting
the inability of the authority to evacuate refuse in their neighborhood. The report
also says that residents of Abakpa in the Urban Enugu East Local Government
Area had threatened to stop further payment of sanitation rate to the authority for
failing to discharge its duties.
In his opinion, the present Managing Director of ESWAMA, Law Egwu,
attributed the awful sight of stench-oozing refuse heaps in all the nooks and
crannies of Enugu metropolis to the break-down of waste disposal trucks and
equipments belonging to the authority.
1.2 STATEMENT OF THE PROBLEM
Solid Waste Management has become an area of major concern in Enugu state
today. It appears to be a losing battle against the harmful consequences of
unguided waste and the attainment of a clean healthy environment for all indigenes
17
of the state. It is common sight in Enugu today to see heaps / accumulation of
festering waste dumps in parts of the state. All sides of residential apartments, the
drains, the highways, corners of major or and minor streets, undeveloped plots of
land have all become waste dumps for many households. As one writer puts it,
waste increases in a geometrical progression while collection and disposal
increases at an arithmetical progression (Akinwale, 2005).
The problem associated with the management of solid waste in most urban
cities in Nigeria, like Enugu, does not completely appear to be a problem of
absence of legislative framework for solid waste management owing to the fact
that at Federal, States, and Local governments levels, there exist some form of
sanitation legislations or the other, but some other factors have come to play with
the crises experienced in the management of wastes in the Nigerian urban centre‟s.
From the background of this study, it appears that the Enugu State Waste
Management Authority (ESWAMA) has not done well in the direction of tackling
the menace of solid wastes in the state. This is even in the face of advanced
management strategies existing today for solid waste management which have
been adopted in many places. Thus, considering the efforts made by stakeholders
in waste management, one would be wondering why heaps of refuses are still seen
all over the state on daily basis.
18
Could it be that the Government of Enugu state lacks the political will needed
to ascertain congruence of actions and promises as well as fails to be meeting up
with its funding responsibilities? Meanwhile, waste management is by nature both
capital and economic intensive; this simply means that it requires huge capital
outlay if it must see the light of the day.
Or could it be that the authority in charge of waste management in the state
cannot boast of competent waste managers. Competent waste managers/engineers
are inevitable in waste management exercises and activities. Policies and
technologies don‟t function in isolation; they require personnel with technical
know-how to man them for effectiveness and efficiency.
Absence of an effective monitoring/control mechanism can bring about in
discriminatory refuse generation and disposal. This is true because no force is
coordinating all the parts to guarantee order and conformity.
Modern technology used in implementing efficient waste management
methods may be existing in papers and not in practical terms. This will make a
mockery of the activities of the waste management agency as most methods are
outdated; considering the rapid growth in population density in urban centers.
On the other hand, the people‟s negative attitudes regarding waste disposal and
its agency/ agent could pose a very big challenge to waste management. And some
19
other yet to be identified factor(s) may be responsible for the challenges of
managing waste in the state of Enugu.
Whatever constitutes the problem, the fact remains that the task of keeping the
state clean is the responsibility of the state‟s waste management authority
(ESWAMA).
In this paper, our attention would be focused on ascertaining whether the
aforementioned problems associated with waste management are responsible for
the challenges of waste management in Enugu and proffer suggestions that may
assist in addressing this issue that seems to be aborting most efforts of International
organizations, the state government, waste management authority and
professionals alike.
It is in view of these problems described above and in other to proffer
possible ways of ameliorating them, that the following questions were posited:
1. To what extent does fund affects the efficiency of ESWAMA?
2. What is the professional training status of staff of ESWAMA?
3. What impact do people‟s attitudes towards ESWAMA have on the
Authority‟s mandate of maintaining a clean environment?
4. What impact does monitoring and control have on the management of
waste in Enugu State?
20
1.3 OBJECTIVES OF THE STUDY
The aim of this study generally will be to investigate the actual problems militating
against effective and efficient waste management in Enugu State and as well
provide solutions, insights and possible ways, by enlightening and empowering the
stakeholders in the waste management sphere, of surmounting the quagmire.
The specific objectives of the study are to:
1. Investigate the extent to which fund affects the efficiency of ESWAMA.
2. Find out the professional training status of staff of ESWAMA.
3. Verify the impact of people‟s attitudes towards the Authority‟s mandate of
maintaining a clean environment.
4. Find out the impact of monitoring and control on the management of waste
in Enugu State.
1.4 SIGNIFICANCE OF THE STUDY
Any reasonable research work must be designed to be of significance to the
society. Also, the significance of a study deals with the benefits that will be
derived from it after it has been concluded. This goes further to signify that any
research carried out without defining its significance may be regarded as a waste of
time and resources.
21
Apart from the various diseases and toxic conditions inherent in and
derivable from the indiscriminate disposal and dumping of wastes; which has
become a common practice in Enugu state, the presence of waste degenerates the
aesthetic value of the environment. The findings of this study will contribute it
quota in the quest to making Enugu one of the cleanest 21st century city in the
world. When this is achieved, the aesthetic attraction of the state will begin to
boost her tourist industry, which is a source of revenue to the government and a job
creator for her masses. Again, if the recommendations and suggestions of this
study will be sincerely and adherently pursued, it will reduce, to the barest
minimum, the adverse effect of such diseases like Malaria, diarrhea, cough,
catarrh, cold, and fever. This will in turn cut down on the high rate of infant
mortality and pregnant women mortality. Also, the money being spent by
individuals/families on treating patience of waste induced diseases will be
channeled to some other needs of theirs. Worthy to mention is the fact that when
ESWAMA becomes effective and efficient in waste management, the heavy traffic
congestions caused by spill over of refuse dumps along the major roads in Enugu
will seize to be an issue.
Academically, findings of this study will serve as a platform for other
research works and add to knowledge of scholars/academicians whom will in turn
impact on the students and future assignments of state or national course.
22
To the bureaucrats, human resources managers, town planners, and the
Lawmakers, the knowledge of the problems associated with waste management in
Enugu state, and possible ways to solving them, will be a guide to them in making
rational decisions and planning effectively.
To the people as well, the findings and recommendations of this work will assist in
transforming their negatively perceived attitudes towards waste disposal, waste
management authority and its agents.
1.5 SCOPE AND LIMITATIONS OF THE STUDY
The study is restricted to Enugu urban centre (the state capital) and since the
Enugu State Waste Management Authority (ESWAMA) was established in the
year 2004, the study will be covering the problems and challenges of waste
management in the state starting from the year 2004 to 2010. The findings may not
reflect the situation in the whole state, but by and large, there is a strong belief that
what happens in Enugu urban centre can be said to apply to other urban centers in
the state.
The study is affected by lack of time, material, and money resources to see
to the whole of the State.
23
CHAPTER TWO
LITERATURE REVIEW AND METHODOLOGY
2.1 Literature Review
Certainly, it would be an incomplete work, or perhaps meaningless, if we fail to
get ourselves acquainted with the subject matter of discourse- waste management.
In order to describe, summarize, evaluate and clarify the related works of other
scholars as related to this work and also to establish a fundamental basis for this
research, the literature will be reviewed under the following sub-themes:
(i) The concept of waste
(ii) The concept of waste management
(iii) Waste Management Techniques
2.1.1. The Concept of Waste
The sixth edition of the Oxford Advanced Learners‟ Dictionary categorizes
the term “waste” into two broad perspectives. They are; waste as “Not use well”
and “Not good use”. The former has to do with doing, using, giving, or saying
something than its necessary or useful or perhaps where it is not valued in the way
that it should be. Thus when one hears things like: why waste money on the clothes
you don‟t need? You‟re wasting your time trying to explain it to him because he
will not understand? You‟re wasted as a sales manager- you should have been an
24
actor? One should bear in mind that the term is being used in the context of not-
use-well category. On the other hand, the latter sees waste from the view of
materials that are no longer needed and are thrown away. In this study, our
discussions will take it base from the latter‟s view point as it regards waste.
Nigel Bell in Akinwale (2005) defines wastes as rubbish or materials that are
not needed and are economically unusable without further processing. Here, Nigel
emphasis is that to ascertain something as a waste, it has to be economically
unusable- in other words, it is unproductive since it has lost the economic value(s)
therein. However, Nigel‟s position can be questioned because recent practices have
shown that what one party considers as unneeded materials, and of course
economically unusable, may be the most needed and of economic importance to
another party. This is to say, what is waste in a place may turn out to become non
waste in another place. For example, after drinking the liquid contents of a bottle
of champagne, the empty bottle is considered as a waste by the person who drank
the liquid content and perhaps is thrown away. But, another person may pick it up
from the point of disposal and either reuse or recycle the empty bottle for
containing another liquid substance or some other item of economic importance.
The bone of contention here is that it is not clear to say at what point an item
constitutes a waste.
25
Defra in Ogwueleka (2009) succinctly posits that there is no definitive list
of what is and is not waste. It goes further to state that whether or not a substance
is discarded as waste- and when waste ceases to be waste- are matters that must be
determined on the facts of the case and the interpretation of the law. Defra is of the
opinion that whether or not a substance is discarded s waste rests, on one hand,
with the producer or holder of such substance to decide whether it is being
discarded as waste and, on the other hand, with regulations or laws stipulating a
such.
Contrary to Defra‟s position that there is no definitive list of what is and is
not waste, the Council of the European Communities had on the 26th of March,
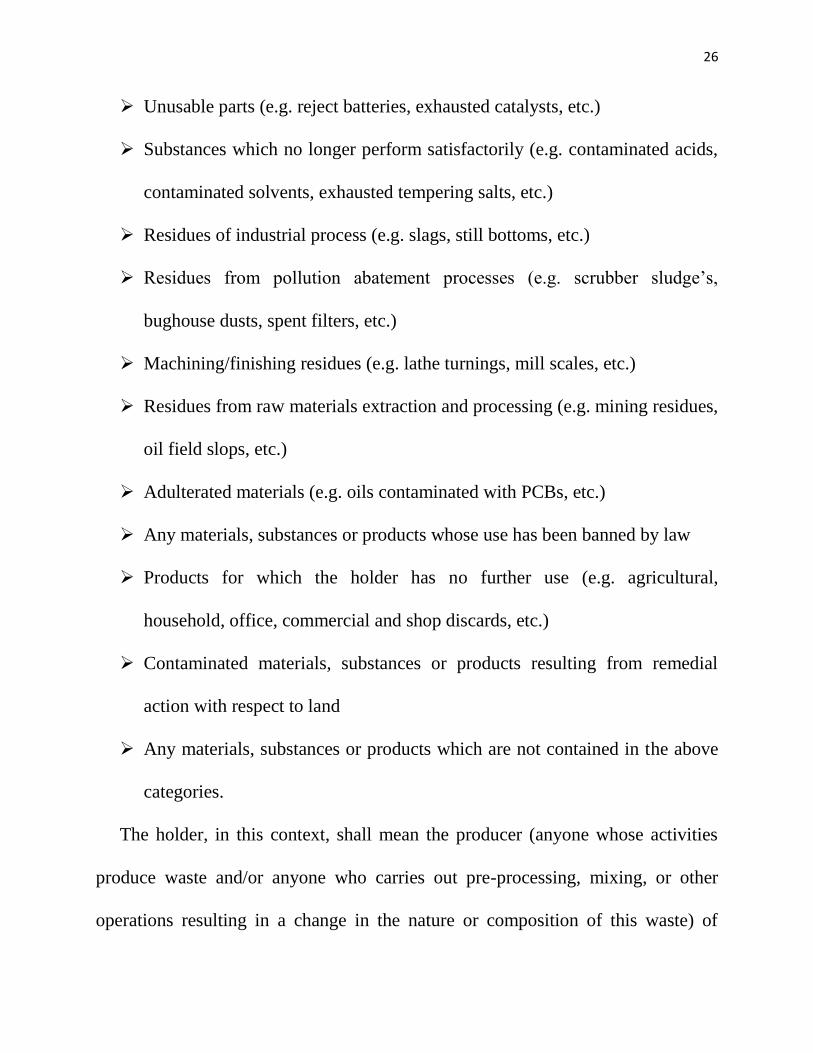
1991, adopted that waste shall mean any substance or object in the categories set
out below, which the holder discards or intends or is required to discard. The
categories include:
Production or consumption residues not otherwise specified below
Off-specification products
Products whose date for appropriate use has expired
Materials spilled, lost or having undergone other mishap, including any
materials, equipment, etc. contaminated as a result of the mishap
Materials contaminated or soiled as a result of planned actions (e.g. residues
from cleaning operations, packing materials, containers, etc.)
26
Unusable parts (e.g. reject batteries, exhausted catalysts, etc.)
Substances which no longer perform satisfactorily (e.g. contaminated acids,
contaminated solvents, exhausted tempering salts, etc.)
Residues of industrial process (e.g. slags, still bottoms, etc.)
Residues from pollution abatement processes (e.g. scrubber sludge‟s,
bughouse dusts, spent filters, etc.)
Machining/finishing residues (e.g. lathe turnings, mill scales, etc.)
Residues from raw materials extraction and processing (e.g. mining residues,
oil field slops, etc.)
Adulterated materials (e.g. oils contaminated with PCBs, etc.)
Any materials, substances or products whose use has been banned by law
Products for which the holder has no further use (e.g. agricultural,
household, office, commercial and shop discards, etc.)
Contaminated materials, substances or products resulting from remedial
action with respect to land
Any materials, substances or products which are not contained in the above
categories.
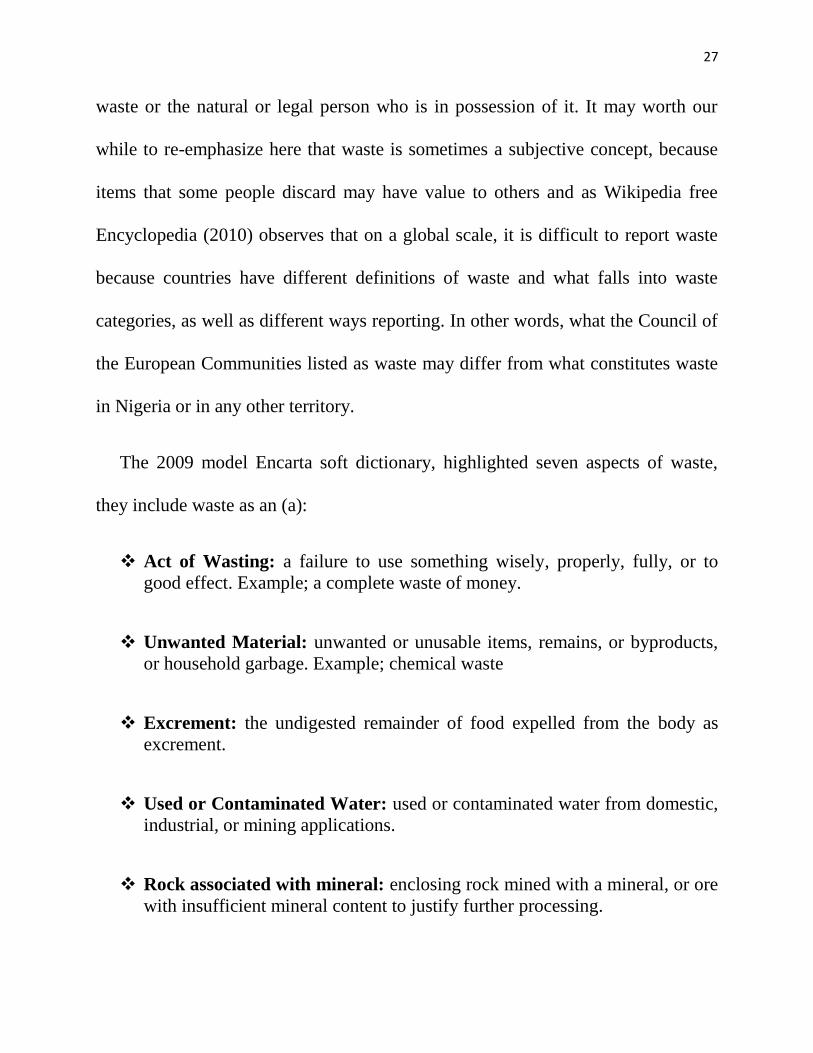
The holder, in this context, shall mean the producer (anyone whose activities
produce waste and/or anyone who carries out pre-processing, mixing, or other
operations resulting in a change in the nature or composition of this waste) of
27
waste or the natural or legal person who is in possession of it. It may worth our
while to re-emphasize here that waste is sometimes a subjective concept, because
items that some people discard may have value to others and as Wikipedia free
Encyclopedia (2010) observes that on a global scale, it is difficult to report waste
because countries have different definitions of waste and what falls into waste
categories, as well as different ways reporting. In other words, what the Council of
the European Communities listed as waste may differ from what constitutes waste
in Nigeria or in any other territory.
The 2009 model Encarta soft dictionary, highlighted seven aspects of waste,
they include waste as an (a):
Act of Wasting: a failure to use something wisely, properly, fully, or to
good effect. Example; a complete waste of money.
Unwanted Material: unwanted or unusable items, remains, or byproducts,
or household garbage. Example; chemical waste
Excrement: the undigested remainder of food expelled from the body as
excrement.
Used or Contaminated Water: used or contaminated water from domestic,
industrial, or mining applications.
Rock associated with mineral: enclosing rock mined with a mineral, or ore
with insufficient mineral content to justify further processing.
28
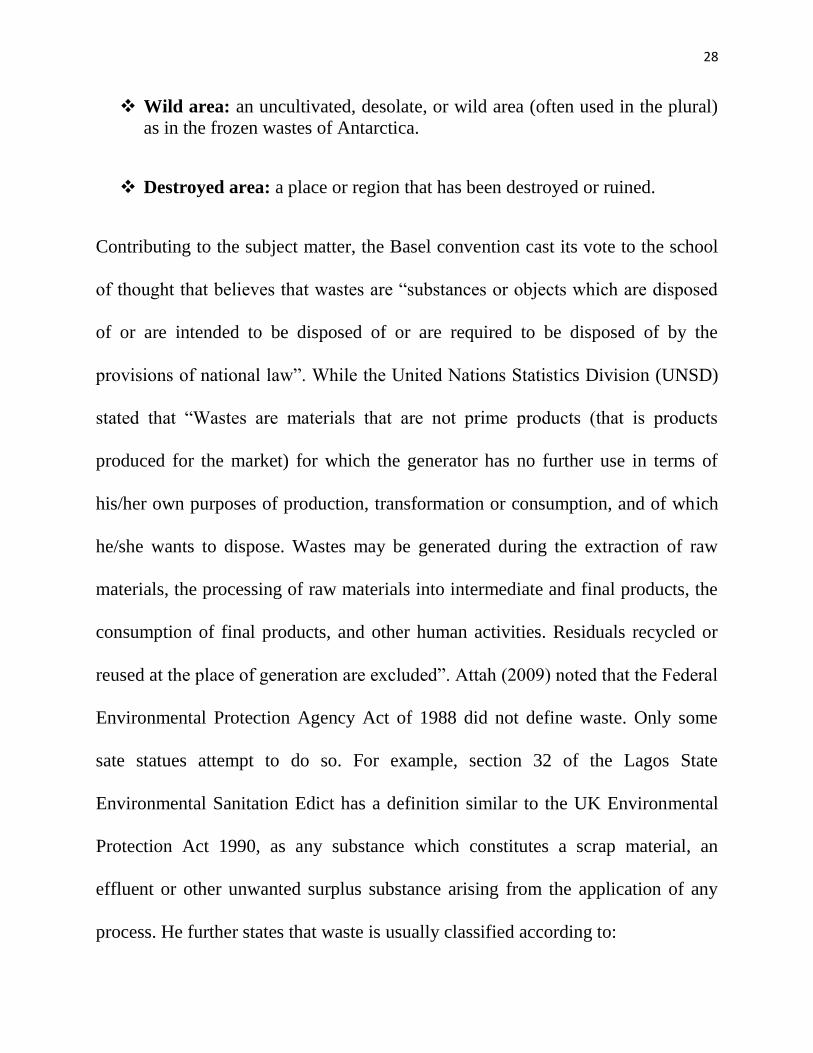
Wild area: an uncultivated, desolate, or wild area (often used in the plural)
as in the frozen wastes of Antarctica.
Destroyed area: a place or region that has been destroyed or ruined.
Contributing to the subject matter, the Basel convention cast its vote to the school
of thought that believes that wastes are “substances or objects which are disposed
of or are intended to be disposed of or are required to be disposed of by the
provisions of national law”. While the United Nations Statistics Division (UNSD)
stated that “Wastes are materials that are not prime products (that is products
produced for the market) for which the generator has no further use in terms of
his/her own purposes of production, transformation or consumption, and of which
he/she wants to dispose. Wastes may be generated during the extraction of raw
materials, the processing of raw materials into intermediate and final products, the
consumption of final products, and other human activities. Residuals recycled or
reused at the place of generation are excluded”. Attah (2009) noted that the Federal
Environmental Protection Agency Act of 1988 did not define waste. Only some
sate statues attempt to do so. For example, section 32 of the Lagos State
Environmental Sanitation Edict has a definition similar to the UK Environmental
Protection Act 1990, as any substance which constitutes a scrap material, an
effluent or other unwanted surplus substance arising from the application of any
process. He further states that waste is usually classified according to:
29
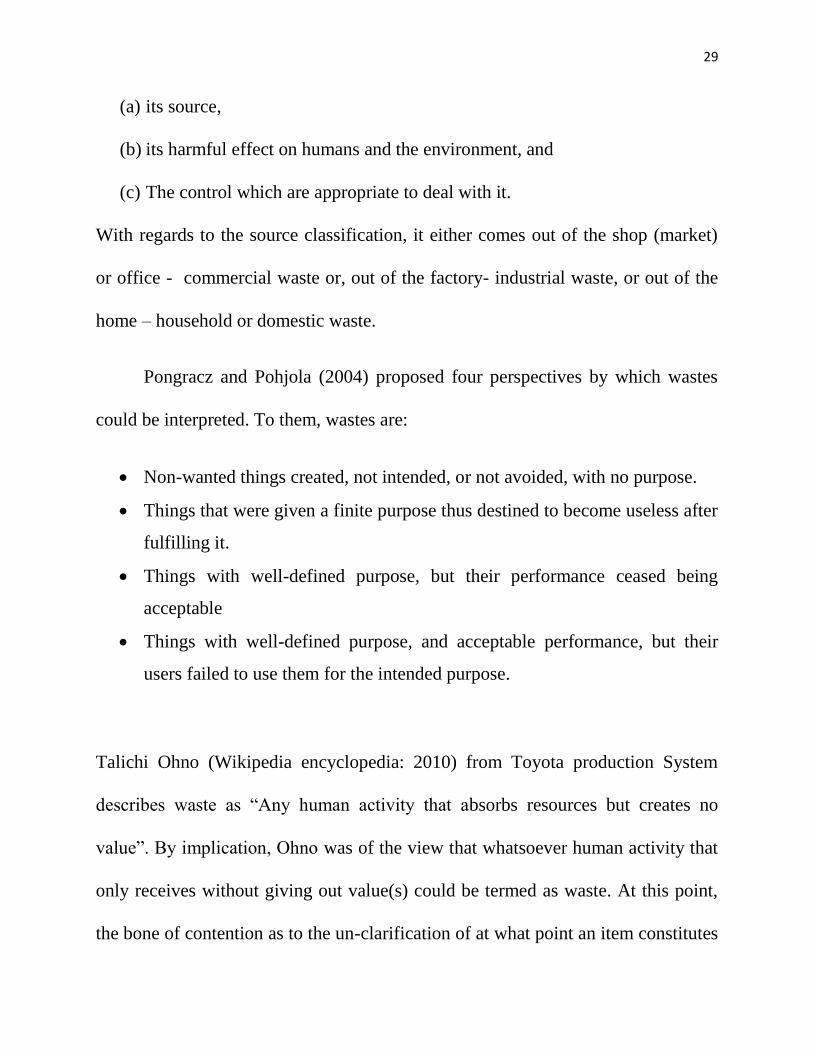
(a) its source,
(b) its harmful effect on humans and the environment, and
(c) The control which are appropriate to deal with it.
With regards to the source classification, it either comes out of the shop (market)
or office - commercial waste or, out of the factory- industrial waste, or out of the
home – household or domestic waste.
Pongracz and Pohjola (2004) proposed four perspectives by which wastes
could be interpreted. To them, wastes are:
Non-wanted things created, not intended, or not avoided, with no purpose.
Things that were given a finite purpose thus destined to become useless after
fulfilling it.
Things with well-defined purpose, but their performance ceased being
acceptable
Things with well-defined purpose, and acceptable performance, but their
users failed to use them for the intended purpose.
Talichi Ohno (Wikipedia encyclopedia: 2010) from Toyota production System
describes waste as “Any human activity that absorbs resources but creates no
value”. By implication, Ohno was of the view that whatsoever human activity that
only receives without giving out value(s) could be termed as waste. At this point,
the bone of contention as to the un-clarification of at what point an item constitutes
30
a waste could be balanced, drawing conclusion from the discussion so far. To be
brief, we shall adopt our conclusion from the consensus of the Waste Framework
Directive of the European Union (75/442/EC) that once a substance or object has
become waste, it will remain waste until it has been fully recovered and no longer
poses a potential threat to the environment or to human health. Therefore, anything
which is discarded or otherwise dealt with as if it were waste shall be presumed to
be waste unless the contrary is proved. Waste, as a concept, does not exist in
abstraction but has impacts as well as costs on nature and human. The Wikipedia
free Encyclopedia 2010 observes three different costs of waste. These costs
include:
Environmental Costs
Waste can attract rodents and insects which cause gastrointestinal parasites,
yellow fever, worms, the plague and other conditions for humans. Exposure to
hazardous wastes, particularly when they are burned, can cause various other
diseases including cancers. Waste can contaminate surface water, groundwater,
soil, and air which cause more problems for humans, other species, and
ecosystems. Waste treatment and disposal produces significant green house gas
(GHG) emissions, notably methane, which is contributing significantly to global
climate change.
31
Social costs
Waste management is a significant environmental justice issue. May of the
environmental burdens cited above are more often borne by marginalized groups,
such as racial minorities, women, and residents of developing nations. NIMBY
(not-in-my-back-yard) is a popular term used to describe the opposition of
residents to a proposal for a new development close to them. However, the need
for expansion and sitting of waste treatment and disposal facilities is increasing
worldwide. There is now a growing market in the trans-boundary movement of
waste, and although most waste that flows, between countries goes between
developed nations, a significant amount of waste is moved from developed to
developing nations.
Economic costs
The economic costs of managing waste are high, and are often paid for by
municipal governments. Money can often be saved with more efficiently designed
collection routs, modifying vehicles, and with public education. Environmental
policies such as pay as you throw can reduce the cost of management and reduce
waste quantities. Waste recovery (that is, recycling, reuse) can curve economic
costs because it avoids extracting raw materials and often cuts transportation costs.
32
The location of waste treatment and disposal facilities often has an impact on
property values due to noise, dust, pollution, unsightliness, and negative stigma.
The informal waste sector consists mostly of waste pickers who scavenge for
metals, glass, plastic, textiles, and other materials and then trade them for a profit.
This sector can significantly alter or reduce waste in a particular system, but other
negative economic effects come with the disease, poverty, exploitation, and abuse
of its workers. We shall now take a look at some of the wastes types that are of
interest to the study.
There are so many types of waste on the planet earth but a few shall be
mentioned here for the purpose of the study, these are: biodegradable waste,
biomedical waste, business (or commercial and industrial) waste, chemical waste,
medical (clinical) waste, commercial waste, construction waste, municipal solid
waste, controlled waste and hazardous waste. The Welsh Assembly Mechanical
Biological Treatment, Environment Countryside and Planning Website (2005)
defined Biodegradable Waste as a type of waste, typically originating from plant or
animal sources, which may be broken down by other living organisms. Waste that
cannot be broken down by other living organisms may be called non-
biodegradable. Biodegradable waste can be commonly found in municipal solid
waste (sometimes called biodegradable municipal waste, or BMW) as green waste,
food waste, paper waste, and biodegradable plastics. Other biodegradable wastes
33
include human waste, manure, sewage, slaughterhouse waste. Then, biomedical
waste consists of solids, liquids, sharps, and laboratory waste that are potentially
infectious or dangerous and are considered bio-waste. It must be properly managed
to protect the general public, specifically healthcare and sanitation workers who
are regularly exposed to biomedical waste as an occupational hazards. Biomedical
waste differs from other types of hazardous waste, such as industrial waste, in that
it comes from biological sources or is used in the diagnosis, prevention, or
treatment of diseases. Common producers of biomedical waste include hospitals,
health clinics, nursing homes, medical research laboratories, offices of physicians,
dentists, and veterinarians, home health care, and funeral homes.
Business (or Commercial and Industrial) waste – cover the commercial
waste and industrial waste types. Generally, businesses are expected to make their
own arrangements for the collection, treatment and disposal of their wastes. Waste
from smaller shops and trading estate where local authority waste collection
agreements are in place will generally be treated as municipal waste.
Chemical waste is a waste that is made from harmful chemicals (mostly
produced by large factories). Chemical waste may or may not be classed as
hazardous waste.
34
Medical waste, also known as Clinical waste, normally refers to waste
products that cannot be considered general waste, produced from healthcare
premises, such as hospitals, clinics, doctor‟s offices, labs and nursing homes.
Commercial waste consists of waste from premises used wholly mainly for
the purposes of a trade or business or for the purpose of sport, recreation, education
or entertainment but not including household; agricultural or industrial waste.
Construction waste consists of unwanted material produced directly or
incidentally by the construction or industries. This includes building materials such
as insulation, nails, electrical wiring, and rebar, as well as waste originating from
site preparation such as dredging materials, tree stumps, and rubble construction
waste may contain lead, asbestos, or other hazardous substances.
Controlled waste is a waste type composed of domestic, commercial and/or
industrial waste. They are regulated by governmental institutions or acts, because
of their toxicity or imminent hazardous nature, either in themselves, obtained
during biodegradation or biochemical degradation.
Municipal solid waste (MSW), also called urban solid waste, is a waste
type that includes predominantly household waste (domestic waste) with
sometimes the addition of commercial wastes collected by a municipality within a
given area. They are in either solid or semisolid form and generally exclude
35
industrial hazardous wastes. The term residual waste relates to waste left from
household sources containing materials that have not been separated out or sent for
reprocessing. Having talked about some of the waste types, this study would be
incomplete if we fail to bring to the fore what hazardous waste is all about.
The 2009 Encarta Encyclopedia observed that Hazardous Wastes are solid,
liquid, or gas wastes that can cause death, illness, or injury to people or destruction
of the environment if improperly treated, stored, transported, or discarded.
Substances are considered hazardous wastes if they are ignitable (capable of
burning or causing a fire), corrosive (able to corrode steel or harm organisms
because of extreme acidic or basic properties), reactive (able to explode or produce
toxic cyanide or sulfide gas), or toxic (containing substances that are poisonous).
Mixtures, residues, or materials containing hazardous wastes are also considered
hazardous wastes. Many dangerous substances can be used only with special
precautions that decrease their risks. When discarded, these substances are no
longer under the direct control of the user and may pose special hazards to people
or other organisms that come in contact with them. The encyclopedia further
enunciated for main sources of hazardous waste, these are;
Industrial Wastes
36
Hazardous wastes are generated by nearly every industry; those industries
that themselves generate few hazardous wastes nonetheless use products from
hazardous waste generating industries. For example, in the computer software
industry, writing software generates little hazardous waste, but the manufacture of
computers involves many industries processes. Making a computer circuit board
generates spent electroplating baths that contain metal salts, and the production of
computer chips uses acids, other caustic chemicals, and solvents. Other hazardous
wastes are generated in the manufacture of fiber optics and copper wire used in
election transmission, as well as magnetic disks, paper for technical manuals,
photographs for packaging and publicity, and trucks for the transportation of the
finished product.
Agricultural Wastes
Industry is not alone in generating hazardous wastes. Agriculture produces
such wastes as pesticides and herbicides and the materials used in their application.
Fluoride wastes are by-products of phosphate fertilizer production. Even soluble
nitrates from manure may dissolve into groundwater and contaminated drinking-
water wells; high levels of nitrates may cause health problems.
Household Wastes
37
Household sources of hazardous wastes include toxic paints, flammable
solvents, caustic cleaners, toxic batteries, pesticides, drugs, and mercury from
broken fever thermometers. Local waste-disposal systems may refuse these items.
If they are accepted, careful monitoring may be required to make sure soil or
groundwater is not contaminated. The householder may be asked to recycle or
dispose of these items separately.
Renovations of older homes may cause toxic lead paint to flake off from walls.
Insulation material on furnace pipes may contain asbestos particles, which can
break off and hang suspended in air; when inhaled, they can cause lung disease and
cancer.
Medical Wastes
Hospitals use special care in disposing of wastes contaminated with blood
and tissue, separating these hazardous wastes from ordinary waste. Hospitals and
doctor‟s offices must be especially careful with needles, scalpels, and glassware,
called “sharps”. Pharmacies discard outdated and unused drugs; testing
laboratories dispose of chemical wastes. Medicine also makes use of significant
amounts of radioactive isotopes for diagnosis and treatment, and these substances
must be tracked and disposed of carefully.
38
Hazardous wastes may pollute soil, air, surface water, or underground water.
Pollution of soil may affect people who live on it, plants that put roots into it, and
animals that move over it. Toxic substances that do not break down or bind tightly
to the soil may be taken up by growing plants; the toxic substances may later
appear in animals that eat crops grown there and possibly in people who do so. Air
may become contaminated by direct emission of hazardous wastes. The air above
hazardous waste may become dangerously contaminated by escaping gas, as can
occur in houses built on mine tailings or old dump sites. River and lake pollution,
if it is toxic enough, may kill animal and plant life immediately, or it may injure
slowly. For example, fluoride concentrates in teeth and bone, and too much
fluoride in water may cause dental and bone problems. Compounds such as
dichlorodiphenyltrichloroethane (DDT), PCBs, and dioxins are more soluble in fats
than in water and therefore tend to build up in the fats within plants and animals.
These substances may be present in very low concentrations in water but
accumulate to higher concentrations within algae and insects, and build up to even
higher levels in fish. Birds or people that feed on these fish are then exposed to
very high levels of hazardous substance. In birds, these substances can interfere
with egg production and bone formation. Even pollution that is not toxic can kill.
Phosphates and nitrates, usually harmless, can fertilize the algae that grow in lakes
or rivers. When algae grow, in the presence of sunlight, they produce oxygen. But
39
if algae grow too much or too fast, they consume great amounts of oxygen, both
when the sun is not shining and when the algae die and begin to decay. Lack of
oxygen eventually suffocates other life; some living things may be poisoned by
toxins contained in the algae. This process of algal overgrowth, called
eutrophication, can kill life in lakes and rivers. In some cases, particular algae can
also poison the drinking water of people and livestock. Irrespective of the category
or type of wastes involved, the need for an effective and efficient management of
wastes in the society becomes inevitable. According to Mowoe (1990:177) the
management of waste is a matter of national and international concern. The volume
of waste does not actually constitute the problem but the ability or inability of
governments, individuals and waste disposal firms to keep up with the task of
managing waste and the environment. There is no doubt that a dirty environment
affects the standard of living, aesthetic sensibilities, health of the people and thus
the quality of their lives. The corollary is that improper disposal or storage of this
waste can constitute hazards to the society through the pollution of air, land and
especially water as already noted above. But, what actually is waste management?
Let‟s take a look at what constitutes waste management and what‟s not.
2.1.2 Waste Management
Literally, waste management is the process of managing waste materials
(normally those produced as a result of human activities). In order to define waste
40
management, we need to include several different processes such as collection,
transport, processing, recycling, disposing, and monitoring of waste. Along this
line, the Wikipedia Web Encyclopedia 2010 defines waste management as the
collection, transport, processing, recycling or disposal and monitoring of waste
materials. According to Atsegbua L.A & et al (2003:104), waste management does
not just end at collection, transporting processing, recycling or disposal and
monitoring of wastes materials but refers to the collection, keeping, treatment and
disposal of wastes in such a way as to render then harmless to human and animal
life, the ecology and environment generally. In other words, the primary aim of
managing wastes is for the safety of human, animal, ecology and environment. We
could as well add here that any other aim that goes in contrary to the aims
mentioned above does not constitutes waste management. Attah (2009) added that
waste management could also be said to be the organized and systematic dumping
and channeling of waste through or into landfills or pathways to ensure that they
are disposed of with attention to acceptable public health and environmental
safeguard and that a proper waste management will result in the abatement or total
elimination of pollution. Attah‟s contribution raises some critical concerns with
regards to the situation in Nigeria (generally) and Enugu State (in particular).
Perhaps one would be tempted to ask questions like;
Is dumping of wastes organized and systematic in Enugu State?
41
Is attention given to acceptable public health and environmental
safeguard when it comes to waste disposal in Enugu State?
Have the activities ESWAMA resulted in the abatement or total
elimination of pollution in Enugu state? Judging by sight, we can argue
unequivocally that waste management in Enugu state does not conform to
Attah‟s definition of what waste management is. Whatever the
perspective, the term waste management, in all its ramifications
encompasses all steps taken in controlling the production, storage,
collection, transportation, processing and disposal or utilization of wastes,
in a sanitary manner (Taiwo: 2010).
2.1.3 Methods of Waste disposal
Practically, there are just two methods- those that are environmentally
friendly e.g. sanitary or engineered landfill and composting, and those that are not,
including incineration, stream dumping and open burning. Other existing methods
include: petrification, bailing, land burial and pyrolysis, just to mention a few. Also
of all the listed methods above only the sanitary landfill, stream dumping and land
burial are permanent waste disposal systems while the others are just waste
treatment i.e. meant to reduce the waste volume.
Landfill method
42
Disposing of waste in a landfill involves burying the waste, and this remains
a common practice in most countries. Landfills were often established in
abandoned or unused quarries, mining voids or borrow pits. A properly designed
and well-managed landfill can be a hygienic and relatively inexpensive method of
disposing of waste materials. Older, poorly designed or poorly managed landfills
can create a number of adverse environmental impacts such as wind-blown litter,
attraction of vermin, and generation of liquid leachate. Another common byproduct
of landfills is gas (mostly composed of methane and carbon dioxide), which is
produced as organic waste breaks down anaerobically. This gas can create odour
problems, kill surface vegetation, and is a greenhouse gas.
Design characteristics of a modern landfill include methods to contain leachate
such as clay or plastic lining material. Deposited waste is normally compacted to
increase its density and stability, and covered to prevent attracting vermin (such as
mice or rats). Many landfills also have landfill gas extraction systems installed to
extract the landfill gas. Gas is pumped out of the landfill using perforated pipes and
flared off or burnt in a gas engine to generate electricity.
Incineration method
Incineration is a disposal method that involves combustion of waste
material. Incineration and other high temperature waste treatment systems are
43
sometimes described as “thermal treatment”. Incinerators convert waste materials
into heat, gas, steam and ash. Incineration is carried out both on a small scale by
individuals and on a large scale by industry. It is used to dispose of solid, liquid
and gaseous waste. It is recognized as a practical method of disposing of certain
hazardous waste materials (such as biological medical waste). Incineration is a
controversial method of waste disposal, due to issues such as emission of gaseous
pollutants. Incineration is common in countries such as Japan where land is
scarcer, as these facilities generally do not require as much area as landfills. Waste-
to-energy (WTE) or energy-form- waste (EFW) is broad terms for facilities that
burn waste in a furnace or boiler to generate heat, steam and/or electricity.
Combustion in an incinerator is not always perfect and there have been concerns
about micro-pollutants in gaseous emissions from incinerator stacks. Particular
concern has focused on some very persistent organics such as dioxins, furans,
PAHs, which may be created within the incinerator and afterwards in the
incinerator plume which may have serious environmental consequences in the area
immediately around the incinerator. On the other hand this method or the more
benign anaerobic digestion produces heat that can be used as energy.
Plasma gasification method
Plasma is a highly ionized or electrically charged gas. An example in nature
is lightning, capable of producing temperatures exceeding 12,6000F (6,980
0C). A
44
gasifier vessel utilizes proprietary plasma torches operating at +10,0000F (5,540
0C)
(the surface temperature of the sun) in order to create a gasification zone of up to
3,0000F (1,650
0C) to convert solid or liquid wastes into a syngas. When municipal
solid waste is subjected to this intense heat within the vessel, the waste‟s molecular
bonds break down into elemental components. The process results in elemental
destruction of waste and hazardous materials. Plasma gasification offers states new
opportunities for waste disposal, and more importantly for renewable power
generation in an environmental sustainable manner (Alliance Federated Energy).
Recycling Method
The popular meaning of „recycling‟ in most developed countries refers to the
widespread collection and reuse of everyday waste materials such as empty
beverage containers. These are collected and sorted into common types so that the
raw materials from which the items are made can be reprocessed into new
products. Material for recycling may be collected separately from general waste
using dedicated bins and collection vehicles, or sorted directly from mixed waste
streams.
The most common consumer products recycled include aluminum beverage
cans, steel food and aerosol cans, HDPE and PET bottles, glass bottles and jars,
paperboard cartons, newspapers, magazines, and corrugated fiberboard boxes.
45
PVC, LDPE, PP, and PS (see resin identification code) are also recyclable,
although these are not commonly collected. These items are usually composed of a
single type of material, making them relatively easy to recycle into new products.
The recycling of complex products (such as computers and electronic equipment)
is more difficult, due to the additional dismantling and separation required. Critics
dispute the net economic and environmental benefits or recycling over its costs,
and suggest that proponents of recycling often make matters worse and suffer from
confirmation bias. Specifically, critics argue that the costs and energy used in
collection and transportation detract from (and outweigh) the costs and energy
saved in the production process; also that the jobs produced by the recycling
industry can be a poor trade for the jobs lost in logging, mining, and other
industries associated with virgin production; and that materials such as paper pulp
can only be recycled a few times before material degradation prevents further
recycling. Proponents of recycling dispute each of these claims, and the validity of
arguments from both sides has led to enduring controversy.
2.1.4 Waste management in Nigeria
In Nigeria, especially in major urban centres, solid waste management is a
critical problem. In fact, Nigerian Government has taken different steps in the past
to combat the problem without success. You don‟t need to look far before you see
mountain of refuse in most of urban centres. Earlier on, the step taken was based
46
on waste disposal on some designated landfills (that were not sanitary because they
were not constructed with underlain (LDPE) to prevent leachate problem). This
system i.e. one-fits-all does not work again because of increase in population and
urbanization that effect the land use pattern. Then, when and where the municipal
government cannot cope with waste collection and disposal successfully, people
resolve into waste dumping into storm water, during the rainfall, open dumping
and stream dumping. Based on observation, as Taiwo (2010) noted, waste
management problem in most of Nigerian communities is multidimensional in
nature. It is associated with lack of community participation in solid waste
management. Most of policies concern this issue are made without considering the
community people who are the waste generators. For instance, in a study
conducted at Orita-Aperin communities in the year 2004, it was found out that
attitudes and belief of community people affected their waste management
practices. Furthermore, Taiwo stated that in Nigeria context, waste disposal is
normally seen by the municipal government as a venture without any financial
gain. That is the issues of environmental protection and healthful living are not
very important to some health planners. In addition to this, the question of whose
responsibility is to take care of waste generated in a community has not been
clearly answered. Unless in some civilized areas, many people do not realized that
47
they are liable to the disposal of wastes generated by them as they dump them by
the road side for government workers to pick up!
Atsegbua (2003:104) observes that the problem associated with waste
management in Nigeria does not appear to be a problem of absence of legislative
framework for waste management but other factors have been identified as being
responsible for penetrating the crises experienced in the management of waste in
Nigeria. He highlighted these other factors as:
Lack of Adequate Funding and Excessive Population: waste management
is by nature both capital and economic intensive. This requires huge capital
otlay. Many state governments spend a good percentage of their funds on
domestic waste management. For examples Lagos state Government spend
between 2-25% of its funds on waste management. But what this amount
could accomplish is dwarfed by the population it caters for. Lagos state, for
instance, has a projected population of 12-18 million persons. It is estimated
that the average individual in such mega cities as Lagos generates an
average of 0.115kg of waste daily. It is that the funds available or at least
earmarked for domestic waste management is grossly inadequate, to fund the
public agencies and other private sector participants (PSP) involved in
collection and disposal of domestic waste; to fund the procurement of
equipment and materials required for effective domestic waste disposal.
48
Lack of Trained/Professional Waste Managers: There are just a few
sanitation and environment Engineers in Nigeria. In fact most private sector
operators in waste management are mainly party stalwarts; know little or
nothing about waste management.
Lack of Effective Monitoring and Control: The Waste regime in the UK
provides a quintessence of a system that makes for effective monitoring of
domestic waste prior to disposal and the steps to be taken on disposal. The
regime distinguishes between controlled and special waste. Under section 30
of the EPA, 1990, waste authorities in charge of waste administration have
three basic functions: regulation, collection and disposal. Waste disposal
authorities are to award waste disposal contracts through competitive
tendering and are to make contracts with waste disposal contractors who
may be private sector companies or companies set up by the local authority
which must be at arm‟s length from the waste authority. The waste
regulation authority is responsible for issuing a waste management license.
Under the regime, controlled waste may not be deposited, treated, kept or
disposed of without a license. The licensing method issued as a means of
controlling waste. Section 33(1)(a) of the EPA provides that it is an offence
of “treat, keep or dispose of controlled waste in a manner likely to cause
pollution of the environment or harm to human health” The offence in
49
notable for its breath. “pollution of the environment” is defined in section 29
to mean the release or escape of the waste into any medium so as to cause
harm to man or any other living organisms supported by the health of living
organisms or other interference with the ecological systems of which they
form part and in the case of man includes offence to any of his sense or harm
to his property”. Thus the offensive smell of a waste tip would be covered,
as presumably would its unattractive appearance. The offence can be
committed whether or not the offender has a license. So the offence focuses
on environmental protection, not with enforcing the licensing regime. The
penalties are quite prohibitive. Again the duty of care principle under the
EPA, designed to satisfy the European ideology on the environment that the
polluter pays is an important form of liability on producers of domestic
waste. The producer is responsible for the proper disposal of the waste. This
means that the producer must ensure it is transferred to a responsible carrier.
The producer cannot escape liability simply by passing the waste onto
anyone else who could include the fly-tipper. This unbroken chain of waste
transmission ensures that indiscriminate dumping and disposal is eliminated.
The waste management regime in Nigeria is far from what is described
above, so that the house-holder-producer of domestic waste is not deterred
by any form of sanctions, because mostly, waste management agencies or
50
contractors hardly exist in many places in Nigeria nor is monitoring and
monitoring authorities effective.
Peculiarity of the Nigerians’ Attitude: The “government-does-everything”
philosophy of many Nigerians contributes to the domestic waste
management problems in Nigeria. A careless attitude permeates the thinking
especially, those living in cities and towns. Self-help methods of domestic
waste disposal are available and could be explored by individuals and
institutions. Domestic incineration, landfill system is practicable, but most
Nigerian‟s would take to the easy way of depositing waste along the
highway and corners of street for “government” to pick up. Some have
founded this attitude on illiteracy but this would be a fallacy. Traditionally,
as is still apparent in some of our villages, where a good number of
individuals is still illiterate, residents are very conscious of the importance of
having a clean environment and this is evidenced by the sanitation
arrangements in force in these societies.
In its paper 74 of 2006, collaborative working Group on Solid Waste
Management in Low- and middle-income Countries WASH workshop at India
stated that following the failure of the pilot project in Enugu state Environmental
Protection Agency), it was quickly realized that the institutional arrangements for
waste management had to be changed if the Solid Waste Management (SWM)
51
service sector was to develop. At a meeting of the major stakeholders a new
strategic approach to SWM was developed and focused on the need for
institutional and financial reform in the sector, establishing a sound service
delivery model and promoting public awareness. Legislation was prepared to
clarify these new institutional arrangements, provide an enabling framework for
private sector participation in SWM services, and establish tariffs and fines for
different types of premises. The legal process through which disputes would be
resolved also had to be specified. In relation to the overall purpose of the
programme (Government reform), it became apparent that State Government
would be required to step back from day-to-day delivery of services, and focus
instead on its regulatory function. In short, less but more focused government. This
would inevitably demand the „right sizing‟ of the staffing levels in the public
sector, and involve some redundancies. The new law was adopted by the Enugu
House of Assembly dissolving ENSEPA, and creating a new regulatory body, the
Enugu State Waste Management Authority (ESWAMA). The paper further
emphasized for the first time in Nigeria, the law contained a stipulation that the
executive and senior managerial posts in the Authority be competitively tendered,
and given on the basis of performance based contracts and clearly defined job
descriptions. This was perceived as a major step forward and the elimination of
patronage in senior staff appointments was seen as a vital step forward in getting
52
suitably qualified personnel into key positions and a major driving force in the
introduction of transparent government. Thus, in late 2004 a new raft of senior
managers was appointed to the newly established ESWAMA, including a newly
created post of Managing Director, with the view to running this government
department more along the lines of the private sector. The posts were advertised
and candidates interviewed in a completely open and transparent process. The
same process was used to appoint SWM contractors for various parts of the city.
The simple act of changing a name did not bring about the changes necessary to
provide a good service. The organization needed a workforce fit for purpose. Once
the senior staff had been appointed and a new institutional structure designed, the
next phase focused on populating the new structure designed, the next phase
focused on populating the new structure with appropriately qualified personnel.
According to the results of work conducted within the programme, it was viewed
as necessary to halve the existing staff number. Inevitably this meant redundancies.
Again, for the first time in Nigeria, this delicate issue was addressed and, with
support from SLGP, ESWAMA emerged with a much reduced work-force, better
qualified people in key positions and a general feeling among those that remained
that they had a role within a dynamic and respectable organization. Added to this,
there was a clear issue concerning the ability of those that remained to carry out the
new duties that lay before them. No institutional reform can be effective without a
53
programme of re-training. This training was required not only to provide the
necessary knowledge and skills, but to explain why the new system of operation
was important and the logic of the changes. With this, there became a greater „buy
in‟ to the new infrastructure and means of operation.
The online Daily independent news of 20th October, 2010 reported that Gov.
Sullivan Chime‟s administration however repositioned ESWAMA by bringing a
new management and procuring equipment including 15 waste disposal trucks and
1,000 dumpsters for waste management in Enugu metropolis. It would be recalled
that Chime‟s government had, at the end of the first meeting of the State Executive
Council (SEC) in January, 2010, assured indigenes and residents that necessary
machinery had been put in motion for tackling problems of waste management in
the state. But long after this assurance, waste management in Enugu state, rather
than improve, has degenerated to the lowest ebb, with the environment already
feared to be contaminated and disease-borne (Klin Reports of 2nd
August, 2010).
The report concludes that the consensus is that all the environment-related agencies
in the state, including ESWAMA, Enugu state Environmental Protection Agency
(ENSEPA), Enugu State Ministry of Environment and, indeed, the government of
Barrister Sullivan Iheanacho Chime have failed in the environmental sanitation of
Enugu city. This study targets to investigate the extent to which fund affect the
efficiency of ESWAMA, and find out the professional training status of its staff.
54
Again, verify the impact of people‟s attitudes towards the Authority‟s mandate of
maintaining a clean environment and find out the impact of monitoring and control
on the management of waste in state.
2.2 Hypotheses
The study will examine the following hypotheses;
Inadequate funding of ESWAMA affects its efficiency.
Incompetent workforce and poor monitoring and control leave ESWAMA
below average line of its responsibilities.
People‟s attitudes toward ESWAMA can impair its performance.
2.3 Operationalization of Key Concepts
It is usually the practice in researches for the researcher to present the
meaning of the key concepts used in the study as they relate to the research in
question. This is to avoid a situation, where for example, the researcher will be
giving a concept one meaning, while the reader will be attaching a different
meaning to the same concept. This is the whole ideal about operationalization of
the key concepts, and in this work, the following key concepts in the hypotheses
have been operationalized as thus:
55
a. Incompetent: The term incompetent means incapable. It is not being
qualified or suited for something or somebody. Incompetent is a word used
to described the lack of skill or aptitude for a purpose. It is act of not doing a
good job or bungling it. It is also a relative term. A man who is incompetents
of doing something might be very good at something else. It always doesn‟t
mean inefficiency or incapability. We say that a good man is incompetent to
do anything that would hurt or harm others. Here being incompetent means
being good. However, incompetent workforce implies workforce that lacks
the skill or aptitude for a purpose. Inept, ineffectual, inadequate, unskilled
etc are the synonyms of this word. It is an adjective.
b. Inadequate: this simply means not enough or not good enough. It‟s failure
to reach an expected or required level or standard. It also mean not adequate
to fulfill a need or meet a requirement. Perhaps, when an agency,
organization, project, or programme is inadequately funded, the possibility
of not meeting up with objectives is high.
c. Efficiency: the term, in physical and engineering, refers to ratio of the
amount of power produced by a machine to the amount of power put into it.
A machine is any device used to change the size or direction of an applied
force. A machine‟s efficiency is usually expressed as a percentage.
Accomplishment of or ability to accomplish a job with a minimum
56
expenditure of time and effort is also another meaning of the term. In the
study, the term signifies the ability of ESWAMA to accomplish the task of
waste management with minimum resources available to it.
d. Agency: there is a notable variety of types of agency, although usage differs,
in the study, we are concerned with a government agency which is a
permanent or semi-permanent organization in the machinery of government
that is responsible for the oversight and administration of specific functions.
A government agency is normally district both from a Department or
Ministry, and other types of public body established by government. The
functions of an agency are normally execution in character since different
types of organization (such as commissions) are normally used for advisory
functions, but this distinction is often blurred in practice. A government or a
state government within a federal system. (The term is not normally used for
an organization created by the powers of a local government body.)
Agencies can be established by legislation or by executive powers. The
autonomy, independence and accountability of government agencies also
vary widely.
e. Workforce: this refers to all workers in a company or industry i.e. all of the
people who are employed or able to work in an establishment. Here, we talk
of all the staff of ESWAMA.
57
f. Monitoring: it means to check on something at regular intervals in order to
find out how it is progressing or developing. It also refers to watching over
somebody or something, especially in order to ensure that good order or
proper conduct is maintained. Thus, an agency should be mentoring its
activities (both within and without) so as to ensure that good order or proper
conduct is maintained.
g. Controlling: to control means to exercise power or authority over
something. Control is one of the managerial functions like planning,
organizing, staffing and directing. It is an important function because it helps
to check the errors and to take the corrective action so that deviation from
standards are minimized and stated goals of the organization are achieved in
desired manner.
According to modern concepts, control is a foreseeing action whereas earlier
concept of control was used only when errors were detected. Control in
management means setting standards, measuring actual performance and taking
corrective action. Thus, control comprises these three main activities. It is the
ability to manage or direct something. Controlling means all that but in the context
of the study, we shall consider Robert‟s (1970:14) comprehensive definition of
control as a systematic effort by business management to compare performance to
predetermined standards, plans, or objectives in order to determine whether
58
performance is in line with these standards and presumably in order to take any
remedial action required to see that human and other corporate resources are being
used in the most effective and efficient way possible in achieving corporate
objectives. It‟s continuous and management processes, embedded in each level of
organizational hierarchy, forward looking, closely linked with planning and a tool
for achieving organizational activities.
h. Average: an average means the level, amount, or degree of something that is
typical of a group or class of people or thing. For something to below
average, it implies that the thing didn‟t meet up with what it should, at least,
be.
i. Attitude: an attitude is a hypothetical construct that represents an
individual‟s degree or like or dislike for an item. Attitudes are generally
positive or negative views of a person, place, thing, or event – this is often
referred to as the attitude object. People can also be conflicted or ambivalent
toward an object, meaning that they simultaneously possess both positive
and negative attitudes toward the item in question. Attitudes are judgments.
They develop on the ABC model (affect, behavior, and cognition)[[van den
Berg et al., 2006; Eagly & Chaiken, 1998). The effective response is an
emotional response that expresses an individual‟s degree of preference for
an entity. The behavioral intention is a verbal indication or typical
59
behavioral tendency of an individual. The cognitive response is a cognitive
evaluation of the entity that constitutes an individual‟s beliefs about the
object. Most attitudes are the result of either direct experience or
observational learning from the environment.
j. Expectancy: Expectancy is a psychoactive effect that happens in response
to a person‟s expectation that an effect will occur. It is a function of
probability of win times average win minus probability of loss times average
loss (i.e. PW*AW) less (PL*AL). The expectancy of both government,
ESWAMA and Enugu residents is that the wastes produced within the state
would be properly managed, leading to a cleaner environment.
k. Performance: This simply refers to the effectiveness and efficiency or
otherwise with which an organization performs its functions. In other words
it is the quality of the output of an organization which could be in the form
of tangible goods or services. It comes to the limelight when the output of an
organization is assessed side by side with the intended output (functions) of
such an organization.
2.4 Research Methodology
2.4.1 Type of Study
The researcher used descriptive survey method for the study in which
questionnaires were carefully administered to the employees of ESWAMA.
60
2.4.2 Methods of Data Collection
The methods of data collection for this study were grouped into two. These
are primary and secondary data. Both sources of data were extensively used for the
purpose of drawing an empirical conclusion for proper analysis of the study so as
to come up with objective findings.
Primary Data
The primary data for this study were obtained through the distribution of
questionnaires and data from direct responses to interviews which were designed
for the staff of Enugu State Waste Management Authority (ESWAMA), traders,
residents of some selected areas, corporate and other establishments within Enugu
metropolis. This is to enable the researcher obtain a wider detailed, reliable and up-
to-date information on the topic. The data gathering instruments for this study
involves the following instruments.
(i) Questionnaire Instrument
The questionnaire was prepared and personally administered by the
researcher. In order to ensure that accurate information was obtained and to ensure
that the questionnaire covers the entire population, its distribution cut across the 20
respondents from ESWAMA and the 200 respondents from the sampled 12 streets.
61
(ii) Personal Interview
The researcher also made use of personal interview so as to obtain first hand
information on the topic. It is a data gathering instrument that enables the
researcher to have in-depth knowledge of the topic of the research through face to
face interaction. This instrument was used because it gives opportunity for in-depth
investigation or deeper probing into an issue under study. 50 respondents were
interviewed by the researcher on issues that concerns the topic of this research.
Secondary Data
The principal sources of the secondary data for this study were obtained
through the review of relevant literature or use of materials from text books,
website pages and journals, and also going through relevant official administrative
documents of Enugu State Waste Management Authority (ESWAMA).
2.4.3 Population of Study
This study covers the population of 50 staff which constitutes 38 junior staff
and 12 senior/management staff of ESWAMA, and about 722,664 residents of the
Enugu metropolis. This number makes the population of the study but since it will
be difficult, if not totally impossible to reach every member of the population, and
in order to ensure manageability and accurate empirical conclusion, a sample will
be drawn from the population.
62
2.4.4 Sample and Sampling Procedure
Sample of Study
Enugu, the capital of Enugu State was stratified into the three (3) Local
Government Areas that made up the metropolis namely: Enugu South, Enugu
North and Enugu East. Two (2) layouts were randomly selected from each Local
Government area. These layouts are: trans-Ekulu and Abakpa Nike (for Enugu
East LGA), Achara layout and Uwani (for Enugu South LGA), and New Heaven
Layout and Asata (for Enugu North LGA). Two (2) streets from each layout were
further selected randomly. These streets include:
1. Phase six and second avenue streets (Trans-Ekulu)
2. Ugbene and Nnaji Streets (Abakpa)
3. awkunanaw and Jonah Agbo streets (New-Haven)
4. Zik‟s avenue and Amawbia streets (Uwani)
5. Upper Chime and Nanka streets (New-Haven)
6. Owerri road and O‟ connor streets (Asata)
From each of the streets, twenty (20) respondents were sampled and twenty (20)
staff ESHWAMA was sampled as well. Therefore, out of the twelve (12) streets
sampled, a total of 240 respondents and the 30 staffs sampled from ESWAMA
63
constitute the target population of the study. In other words, the sample size of the
study was 270
Sampling procedure
The need for a representative sample in this study cannot be doubted when
one takes the size of the target population in consideration. As Nwana (1981; 48)
noted, the problem of a study is not only how to minimize large sample errors but
also how to reach at the most relevant members of our representative samples.
In order to ensure this, out of the two sampling techniques that can be
employed in the social sciences, namely, the probability and the non-probability
sampling, both were adopted for this study and within the probability sampling
technique, stratified random sampling technique and judgmental sampling
technique (within the Non-probability sampling technique) were adopted by the
researcher so as to pave way for easy calculation of the sampling errors and also to
make good estimation of the characteristics of the target population.
2.4.5 Validity and Reliability of Instruments
The success of any research fervently lies on the validity and reliability of its
data gathering instruments. Validity means the appropriateness of an instrument in
measuring what it is intended to measure. No wonder why Goode and Hart (1952;
217) avowed that a measuring instrument or a scale possesses validity when it
64
actually measures what it claims to measure. Also, Hour et al (2000;666) stated
that validity means the degree to which a research instrument serves the purpose
for which it was constructed.
In order to effectively ensure the validity of the instruments used for this
study, the instruments were subjected to content validity measurement which
involves face validity and predictive validity. The primary aim of adopting this
method is to ensure that the instruments measure what they were designed to
measure.
Furthermore, we shall ensure the validity of the instruments by ensuring that
the contents of the instruments (such as the questions in the questionnaire) provide
the needed information for the research topic, worded in simple terms by avoiding
technical terms for easy understanding by the respondents and are also logically
and systematically arranged.
The researcher will also ensure the validity of the instruments by ensuring
that the contents of the instruments are consistent with both the objectives and the
hypotheses of the study.
We shall also ensure the validity of the instruments by making sure all
aspects considered relevant to the study are adequately covered.
65
On the other hand, reliability means the ability of an instrument to produce
the same results credibly, dependably and consistently over some time when
applied to the same sample (Good and Hart, 1952; 218)
Therefore, in order to ensure that the instruments are reliable and pave way
for accurate testing of hypotheses of the study which will in turn enable a
dependable and objective deduction, inferences and conclusions, internal
consistency method will be effectively adopted. This will be achieved by cross-
checking our information alongside/against other source of data collection and by
ensuring that the facts and figures collected from other sources mentioned earlier
are accurate and would remain the same if the collection is repeated over and over
again.
Also, the reliability of this study will be ensured by making use of the pretest
method which entail piloting the instruments on a small group of respondents,
different from the target group (Oguonu and Anugwom, 2006;42), but in the same
organization. This was done several times so as to compare whether there will be
consistency between their former responses and the later.
To also ensure that the instruments have high reliability, the questionnaire
was structurally constructed in a simple, concise and unambiguous manner so as to
66
allow easy understanding of the questions by the respondents and so as to ensure
consistency in their answers.
Finally, in order to ensure this research possesses high validity, external
criterion method will be adopted which will be achieved by checking how correct
the findings of a particular instrument is by comparing the results with existing
knowledge as well as the findings of the research gotten from questionnaire. These
methods described above will be carefully employed so as to ensure the study is
highly reliable and valid.
2.4.6 Method of Data Analysis
Since multi-data gathering instruments were used in the course of this
research, it then signifies that different types of statistical tools will be employed
so as to ensure accurate analysis of the data collected.
Hence, the data collected from the respondents will be analyzed using
statistical tables. With these tables, it will be very easy to see the opinion of
respondents at a glance and conclusions easily drawn.
Simply percentages will also be used to analyze the data generated from the
study, while Chi-square (X2) method will be used to test the hypothesis formulated
for this research. The Chi-square method is one of the commonest nonparametric
statistical methods which is used to test the level of significance of data where we
67
have data that are expressed as frequencies or in terms of percentages. It indicates
whether or not a set of expected frequencies differ significantly from the
corresponding set of observed frequencies.
By definition, the Chi-square is given by the formula;
Chi-square (X2)= (o-e)
2
e
Where O = Observed frequency
e = expected frequency
= summation sign
2.5 Theoretical Framework
In this research, the Structural Functional theory by Emile Durkheim (1858-
1917) was adopted to guide our study on the problems and prospects of waste
management in Enugu state, using the Enugu State Waste Management Authority
(ESWAMA) as a case study.
Structural functionalism, or in many contexts simply functionalism, is a
broad perspective in sociology and anthropology which sets out to interpret society
as a structure with interrelated parts. Functionalism addresses society as a whole in
terms of the function of its constituent elements;
68
namely norms, customs, traditions and institutions. A common analogy,
popularized by Herbert Spencer, presents these parts of society as "organs" that
work toward the proper functioning of the "body" as a whole. In the most basic
terms, it simply emphasizes "the effort to impute, as rigorously as possible, to each
feature, custom, or practice, its effect on the functioning of a supposedly stable,
cohesive system (Talcott Parsons: 1975). Structural-functionalism takes the view
that society consists of parts (e.g. police, hospitals, schools, and farms), each of
which have their own functions and work together to promote social stability.
The prominent proponents of the structural functional theory include:
Herbert Spencer (1820-1903)
Talcott Parsons (1902-1979)
Emile Durkheim (1815 - 1917)
Robert K. Merton (1910 – 2003)
Almond and Powell
Radcliffe-Brown (1881 – 1955)
Emile Durkheim one of the leading proponents of the theory was
concerned with the question of how certain societies maintain internal stability
and survives over time. Thus, he proposed that such societies tend to be
69
segmented, with equivalent parts held together by shared values, common
symbols or systems of exchange. In modern complicated societies, members
perform very different tasks, resulting to a strong interdependence. Based on the
metaphor above of an organism in which many parts function together to sustain
the whole, Durkheim argued that complicated societies are held together by
organic solidarity (Philip; 1993:88).
Radcliffe-Brown following Comte and Durkheim‟s views, believed that
society constitutes a separate level of reality, distinct from both functionalism
explains the apparent stability and internal cohesion needed by societies to endure
overtime. Societies, according to him, are seen as coherent, bounded and
fundamentally relational constructs that function like organisms, with their various
parts (or social institutions) working together in an unconscious, quasi-automatic
fashion toward achieving an overall social equilibrium. All social and cultural
phenomena are therefore seen as functional in the sense of working together, and
are effectively deemed to have “lives” of their own. They are primary, and
analyzed in terms of this function. The individual is significant not in and or
himself but rather in terms of his status, his position in patterns of social relations,
and the behaviours associated with his status. The social structure, then, is the
network of statuses connected by associated roles.
(www.wikipedia/org/wiki/Radciffe-Brown).
70
Though, the theory declined in the 1940s through to the 1980s the works of
Herbert Spencer a British Philosopher influenced the advent of the contemporary
structural-functional theorists notably Talcott parsons was heavily influenced by
the works of Emile Durkheim.
Parson held that “the social system is made up of the actions of individuals
and institutions which he called actors. He further argued that the interaction
between two individuals faced with a variety of choices about how they might act,
are influenced and contained by a member of physical and social factor” (parsons
and shills; 1976: 190). He posits that;
“Each individual has expectations of the other‟s action
and reaction to his own behaviour, and these
expectations would be derived from the accepted norms
and values of the society they inhabit. As the
behaviours are repeated in more interactions and these
expectations are entrenched or institutionalized, a role
is created (parson; 1961: 41)
According to Craib (1992; 40) parsons defined these roles created as the
normatively-regulated participation of a person in concrete process of social
interaction with specific, concrete role partners. Though any individual can fulfill
71
any role, the individual is expected to conform to the norms governing the nature
of the role they fulfill. As also argued that a society that there is no conflict is in a
state of perfect state of equilibrium, which is a state where these expectations are
consistently met (Ritzer, 1983:193).
Robert Merton agreeing fundamentally with parsons, contributed immensely
to structural-functional theory. He argues that the roles are divided into two, which
are Manifest and latent functions: Manifest functions are referred to the conscious
intentions of actors, while latent functions are the objective consequences of their
actions, which are often unintended (Holmwood; 2005: 90-107).
Gabriel Almond and Bingham Powell both political scientists introduced the
structural-functional theory in political science in the 1070; they argued that in
order to understand a political system, it is necessary to understand not only its
institutions or structures but also their respective functions (Ezeani; 2010: 83-85).
Marshall (1994:190-191) argued that social institutions are functionally
integrated to form a stable system and that a change in one institution will
precipitate a change in other institutions; it takes the view that society consists of
parts, each of which have their own functions and work together to promote social
stability.
72
Igwe (2007:429) following the positions of the above theorists defined
structural-functionalism as “essentially consists in viewing society as a system
made up of a certain arrangement of parts (structures), which behave (functions) in
coordinated and interdependent manner to achieve the objectives intended for them
by society, these being the only means by equilibrium and peace can be maintained
within it”.
The Structural-functional theory was heavily criticized by conflict theory
and Marxism for not being able to accounts for social change, contradictions and
conflicts. It is criticized epistemologically that it describes social institutions solely
through effects and does not explain the cause of effects. It was also criticized
ontologically that society cannot have needs as human beings do, and even if
society does have needs they need not to do met (political Dictionary online).
Uses of structural Functional Theory
The following main tenets of the theory are outlined to enable us use the
theory to analyze our study, i.e. the problems of waste management in Enugu State,
with focus on the challenges faced by the Enugu State Waste Management
Authority (ESWAMA) in meeting up with its responsibilities-which have resulted
in ineffectiveness and inefficiency regarding waste management in the state:
1. Structures exist in society as interrelated parts.
73
2. Structures that exist in the society are bounded together by or based on
functions and “organic solidarity”,
3. These structures that are segmented parts are equivalently held together by
shared norms, values, common symbols and systems of exchange.
4. These interrelated parts or structures perform different tasks together
resulting in a strong inter dependence and stability, which sustains the
whole.
5. A social system is made up of actions by individuals or institutions called
actors.
6. The behaviour of each individual or institution is based on expectations from
the action and reaction of the other.
7. These expectations and behaviours are based upon the accepted and agreed
norms and values.
8. The continuous interaction of expectation and behavior, based on accepted
and agreed norms and values, creates a role which concretizes role-partners.
9. Individual or institutions, in fulfillment of their roles, must conform to the
norms and values governing the nature of the role they fulfill.
10. An Individual or institution is aware that the other expects it to perform its
role in order to have “a perfect state or equilibrium, a society with no
conflict”.
74
11. The understanding of the functions of a structure, institution or individual is
quite necessary because it makes it easier to understand a societal
phenomenon or problem.
Application of the structural functional theory to the study
Based on the above outlined main tenets/uses of the theory, as theoretical
perspectives the following perspectives are derived to analyze our work:
1) The Enugu State Waste Management Authority (ESWAMA) is
an interrelated part of the ministry of Environment, which is a
social system that carries out waste management activities.
Whereas, residents of Enugu State, where the waste
management activities of ESWAMA take place, are the clients
of ESWAMA. The inabilities of ESWAMA to perform its role
effectively impacts negatively on the aesthetics of the
metropolis and on the health of the people. The people react
negatively towards ESWAMA‟s failure to perform its role.
2) Assuming ESWAMA is equipped financially, competent staff,
mechanisms and technology to carry out its activities, it is
expected that ESWAMA maintains a clean and healthy
75
environment in line with its mandate. If ESWAMA experiences
shortages in funding. Competent staff, technological ability, it
may not perform its obligations as stated.
3) The expectations and behaviour of ESWAMA and the residents
of Enugu are guarded by the main responsibility of ESWAMA,
on one side and that of the people (clients), on the other hand.
4) These responsibilities create roles for both ESWAMA and the
residents (clients) of Enugu, and concretized them as role
partners, ESWAMA on the one hand, and the residents (clients)
on the other hand.
5) Based on the tenet that individuals or institutions, in fulfillment
their roles, must conform to the norms governing the nature of
the roles to be fulfilled. It is argued that ESWAMA‟s fulfilled
obligations would be to maintain a clean and healthy
environment in the state, anything short of this is assumed that
the obligations of ESWAMA are unfulfilled, i.e. they have
failed to fulfill their own roles as expected.
6) Following the tenet that everybody (individuals or institutions)
knows that the other expects it to perform its role in order to
have a perfect state of equilibrium, as society of no conflict.
76
ESWAMA knows that the residents play their part in order for
ESWAMA to maintain a clean and healthy environment in the
state. So, in as much as ESWAMA has the residents support, it
must perform its obligations. The residents of Enugu, on the
other hand, know that ESWAMA maintains a clean and healthy
environment through its activities; therefore, the residents must
perform their own obligations. Therefore, if one party fails to
perform its role, the other party too will fail to perform its own
role. Seems the success of one party depends on the success of
the other party.
Thus, this work wishes to adopt the discussed theoretical perspectives and
propositions to explore and investigate our research question.
77
CHAPTER THREE
BACKGROUND INFORMATION OF THE ENUGU STATE WASTE
MANAGEMENT AUTHORITY (ESWAMA)
3.1 ORIGIN OF ESWAMA
In its paper 74 of 2006, Collaborative Working Group on Solid Waste
Management in Low- and Middle-income Countries WASH workshop at India
stated that following the failure of the pilot project in Enugu (of the defunct
ENSEPA i.e. Enugu State Environmental Protection Agency), it was quickly
realized that the institutional arrangements for waste management had to be
changed if the solid waste management (SWM) service sector was to develop. At a
meeting of the major stakeholders a new strategic approach to SWM was
developed and focused on the need for institutional and financial reform in the
sector, establishing a sound service delivery model and promoting public
awareness. Legislation was prepared to clarify these new institutional
arrangements, provide an enabling framework for private sector participation in
SWM services, and establish tariffs and fines for different types of premises. The
legal process through which disputes would be resolved also had to be specified. In
relation to the overall purpose of the programme (Governance reform), it became
apparent that State Government would be required to step back from day-to-day
78
delivery of services, and focus instead on its regulatory function. In short, less but
more focused government. This would inevitably demand the „right sizing‟ of the
staffing levels in the public sector, and involve some redundancies. The new Law
was adopted by the Enugu House of Assembly dissolving ENSEPA, and creating a
new regulatory body, the Enugu State Waste Management Authority (ESWAMA).
ESWAMA was established through Law No 8 of 2004 as the regulatory body
charged with responsibility for management of solid and liquid waste in Enugu
State. The paper further emphasized for the first time in Nigeria, the Law
contained a stipulation that the executive and senior managerial posts in the
Authority be competitively tendered, and given on the basis of performance based
contracts and clearly defined job descriptions. This was perceived as a major step
forward and the elimination of patronage in senior staff appointments was seen as a
vital step forward in getting suitably qualified personnel into key positions and a
major driving force in the introduction of transparent government. Thus, in late
2004 a new raft of senior managers was appointed to the newly established
ESWAMA, including a newly created post of Managing Director, with the view to
running this government department more along the lines of the private sector. The
posts were advertised and candidates interviewed in a completely open and
transparent process. The same process was used to appoint SWM contractors for
various parts of the city. The simple act of changing a name did not bring about the
79
changes necessary to provide a good service. The organization needed a workforce
fit for purpose. Once the senior staff had been appointed and a new institutional
structure designed, the next phase focused on populating the new structure with
appropriately qualified personnel. According to the results of work conducted
within the programme, it was viewed as necessary to halve the existing staff
number. Inevitably this meant redundancies. Again, for the first time in Nigeria,
this delicate issue was addressed and, with support from SLGP, ESWAMA
emerged with a much reduced work-force, better qualified people in key positions
and a general feeling among those that remained that they had a role within a
dynamic and respectable organization. Added to this, there was a clear issue
concerning the ability of those that remained to carry out the new duties that lay
before them. No institutional reform can be effective without a programme of re-
training. This training was required not only to provide the necessary knowledge
and skills, but to explain why the new system of operation was important and the
logic of the changes. With this, there became a greater „buy in‟ to the new
infrastructure and means of operation.
3.2 LOCATION OF ESWAMA
The Enugu State Waste Management Authority (ESWAMA) has its Head
Office situated at No. 7 Ridgeway, Secretariat Complex, G.R.A Enugu.
80
3.3 VISION
The vision of ESWAMA is to restore Enugu State back to its past glory in
Environmental cleanliness through sustainable waste management in Enugu State.
3.4 MISSION STATEMENT
As part of Enugu State Ministry of Environment and mineral Resources, the
mission of ESWAMA is to develop and implement Government policies on the
management of solid and liquid wastes in Enugu State through ensuring a clean
and sustainable environment for the good health and well-being of the people of
Enugu State. To achieve this mission, the Authority‟s commitment to the people of
Enugu State is to ensure the following:
1. Effective and efficient of collection, removal, treatment and
safe disposal of all classes of wastes.
2. Prevention of illegal dumping of wastes along roadside
closures, adjoining streams in neighbour-hoods and gutters.
3. Daily monitoring of the activities of waste service providers in
the State.
4. Creation of public awareness, offering advice, receipt of
complaints and providing solutions to problems emanating from
managing wastes, and prosecutions of defaulters within the
ambit of the law.
5. Provision of waste management facilities.
81
3.5 CLIENTS
The Enugu State Waste Management Authority‟s clients are the general
Public and the organized institutions, as long as they generate and handle waste
materials.
3.6 WHAT ESWAMA EXPECTS FROM THE CLIENTS
The expectations of ESWAMA from its clients are to cooperate and
participate fully in its efforts in managing solid waste in the state. In other words,
ESWAMA expectations from its clients include:
1. Full cooperation and participation in keeping their environment
clean at all times.
2. Help bag their wastes and dispose them inside the Dumpster
nearest to them.
3. Pay approved sanitation rates through designated banks in
various zones in the State, when presented with a demand
notice (Failure to comply is offence if convicted is punishable
by fine or both.
4. Desist from littering the streets and dumping refuse into
drainages; and ensure proper use of waste bins in commercial
vehicles, as well as the refuse dumpsters positioned strategic
points around their neighbour-hoods.
5. Encourage constructive feedback through the means of
ESWAMA complaint handling procedures or call its hotline-
0803-732-6662.
82
6. Trim their over-grown grasses and hedges within 8 meters of
their premises.
7. Clear dirty or stagnant water and all form of debris from the
drainage systems running through or by their house.
8. Cooperate with us on Sanitation Days.
3.7 COMPLAINT HANDLING PROCEDURES AND DISPUTE HANDLING
MECHANISM
ESWAMA expects its clients to follow the laid down procedures and
mechanisms when disputes or differences arouse. Thus, clients should:
(a) Complain to their service provider or PSP (Private Sector
Participant) in the first place and then to ESWAMA if they do
not get the service they expected. Then the following contact
details for external dispute handling mechanisms are offered for
conflict resolution.
I. ESWAMA Complaints Desk located at the Head office, and
open to all.
II. Use of ESWAMA Hotline: 08037326662.
a. The Managing Director‟s lines: (042) 305454.
b. The Commissioner and the Permanent Secretary in the ministry
of Environment.
c. The Head of Administration.
d. Others: (080) 4489248 and (042) 487489.
III Uses of suggestion box in the office
IV Written Complaint.
83
3.8 TYPES OF COMPLAINTS ENTERTAINED BY ESWAMA
Service delivery gap
Poor standard in performance of service by ESWAMA
Staff/PSP/agents.
Abuse of office in the process of delivery service.
Abuse of right and privileges by individual staff of ESWAMA
3.9 ESWAMA’s BROAD RANGE OF MARKETING METHODS.
Holding meeting and consultations/sensitization with:
a. Staff and Management
b. Labour Unions and Management
c. Neighbour-hood, Associations/Churches/Schools
d. Media coverage‟s and Press Release.
e. Production of feature materials and hand bills
f. Production of service delivery handbook
g. Interviews, Seminars and workshops.
h. Open air campaigns and sensitization
i. Newspapers and Research aids for students
j. Consultations with relevant Agencies and Organization.
k. Mounting of billboard etc.
3.10 ORGANISATIONAL STRUCTURE
Below is a chart showing the chain of command and divisions of the Enugu
State Waste Management (ESWAMA):
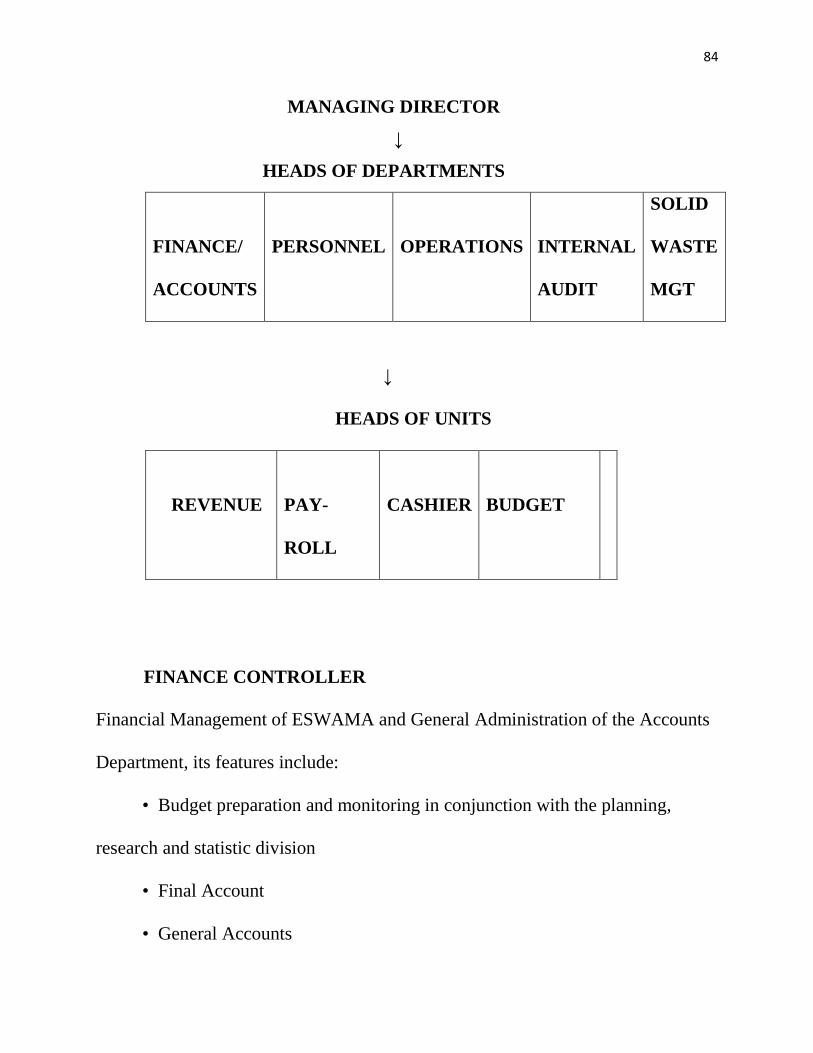
84
MANAGING DIRECTOR
↓
HEADS OF DEPARTMENTS
FINANCE/
ACCOUNTS
PERSONNEL
OPERATIONS
INTERNAL
AUDIT
SOLID
WASTE
MGT
↓
HEADS OF UNITS
REVENUE
PAY-
ROLL
CASHIER
BUDGET
FINANCE CONTROLLER
Financial Management of ESWAMA and General Administration of the Accounts
Department, its features include:
• Budget preparation and monitoring in conjunction with the planning,
research and statistic division
• Final Account
• General Accounts
85
• Revenue Accounts: Debtors Ledger
• Budget and Stock Accounts and
• Preparation of the Analysis of Daily, Weekly and Monthly home and
Expenditure
• Coordinating of the Annual stock exercise
• Preparation of the Trial Balance on a monthly basis
• Check and approved payroll monthly
• Cross checking the accuracy of the monthly:
(a) Salaries Analysis
• Checking and approves monthly returns accordingly
• Ensuring at all times proper internal control are in place to forestall any
loopholes
• Ensuring prompt preparation of monthly salaries
• General administration of both the wages personnel and its entire
operation
FEATURE OF THE INTERNAL AUDIT
Expenditures
Auditing of payment vouchers
Vouching, inspection of cash and purchase of materials
86
Checking the arithmetic accuracy of the wages preparation and ensure that salary is
prepared for staff
Revenue
Inspection of cash and cheque received to the organization by the cash office
Ensure that same is lodged to the bank daily
Check the arithmetic accuracy of the cheque and cash intake
Confirm same in the bank reconciliation monthly Preparation of revenue analysis
Store
Inspection of goods received to store
Inspection of issue out of store to user department
Random inspection of bin cards.
PERSONNEL
The Personnel department serves as the orb that coordinates the activities of
the other Departments and Units in the Organization. It is an integral force for the
execution of organizational goals and objectives. Its features are:
• Coordination of the activities of all the Departments and Units
• Human resources management
• Human capital development
87
• Staff welfare and motivation
• Industrial/Labour Relations
• Security matters
• Health and related matters
• Stores and procurement management
• Office management
• Pension Administration.
OPERATIONS
The Operations department is charged with the responsibility of ensuring
regular monitoring of the State of the Environment, enforcing Environmental Laws
on defaulters/violators and promotes strict compliance by the citizenry of Enugu
State. It is also charged with the responsibility of enlightening the public especially
market men and women on the best environmental practices in their areas.
The Department is divided into 3 Units, namely; Monitoring, Enforcement and
Compliance.
Monitoring of the State of the Environment;
Preparation of daily monitoring reports;
88
Monitoring of the State Approved PSP Operators;
Issuance of Sanitation Alarms to Government Agencies, Public
Communities and other Stakeholders;
Market Monitoring;
ESWAMA Monitoring;
Investigations on received Public Complaints relating to issues affecting
the State of the environment;
Issuance of Abatement Notices;
Enforcement of Sanitation Laws of the State;
Weekly enforcement report and pictorial representations;
Holding mediation meetings between aggrieved parties from public and
private sectors;
Document and data generation.
Monitoring Unit
(A) This Unit ensures daily monitoring of highways and roads for
Illegal Refuse dumps
Illegal Refuse littering
Illegal shanties on road setback
Illegal street trading
89
Blocked drains
Overgrown weeds
Dead bodies
Road accidents
Burst water pipes
All other nuisances
(ii) Preparation of daily monitoring report and pictorial representation.
(iii) Weekly collation of reports and pictorial representation
(iv) Issuance of Sanitation Alarm on the Authority, Government Agencies, Public
Communities and other Stakeholders.
(B) Market Monitoring
Monitoring of various markets within the State on weekly basis to
enlighten market men and women on how to sanitize their environment and also
monitoring of Market Environmental Sanitation exercise in line with the State
regulations.
(C) Documentation and Data Generation;
Covering of meetings and preparation of minutes.
Raising memos for the MD's approval on matters in the Department.
90
Enforcement
This Unit is charged with the following duties:
• Enforcement of Sanitation Laws on:
Individuals
Corporate Bodies
Organizations
All other categories of people who failed to obey the Environmental
Sanitation Laws of the State.
• Weekly enforcement report and pictorial representation.
Compliance Unit
• Investigations on public complaints relating to issues affecting the state of
the environment received from :
Managing Director
The public
Private Organizations
Other Stakeholders
• Holding of mediation meetings between aggrieved parties from the public
and private sectors.
• Issuance of Abatement Notices.
91
• Daily collation of reports on investigations with pictorial representation.
• Documentation and data representation
WASTE MANAGEMENT SERVICE
The responsibilities of this department include:
• Evacuation and prevention of refuse backlog
• Clearance of Public and Markets Wastes
• Sanitation of Major highways and street sweeping activities
• Management of Transfer Loading Station
• Management of Existing Landfill Sites
• Development of policy initiative for future Waste Management activities
• Provision of Counseling to Private Refuse Operators on Waste
Management
• Provide back–up services to Private Sectors Participants (PSP) on Waste
Collection & Transportation
• Provide Emergency Services to the State Government where necessary
• Appraisal of proposal on Establishment of Waste Management facilities
• Establishment of performance standards on Waste Management activities
• Identification of sites for development of waste Management facilities
• Monitoring of Contractors activities and verification of service contracts
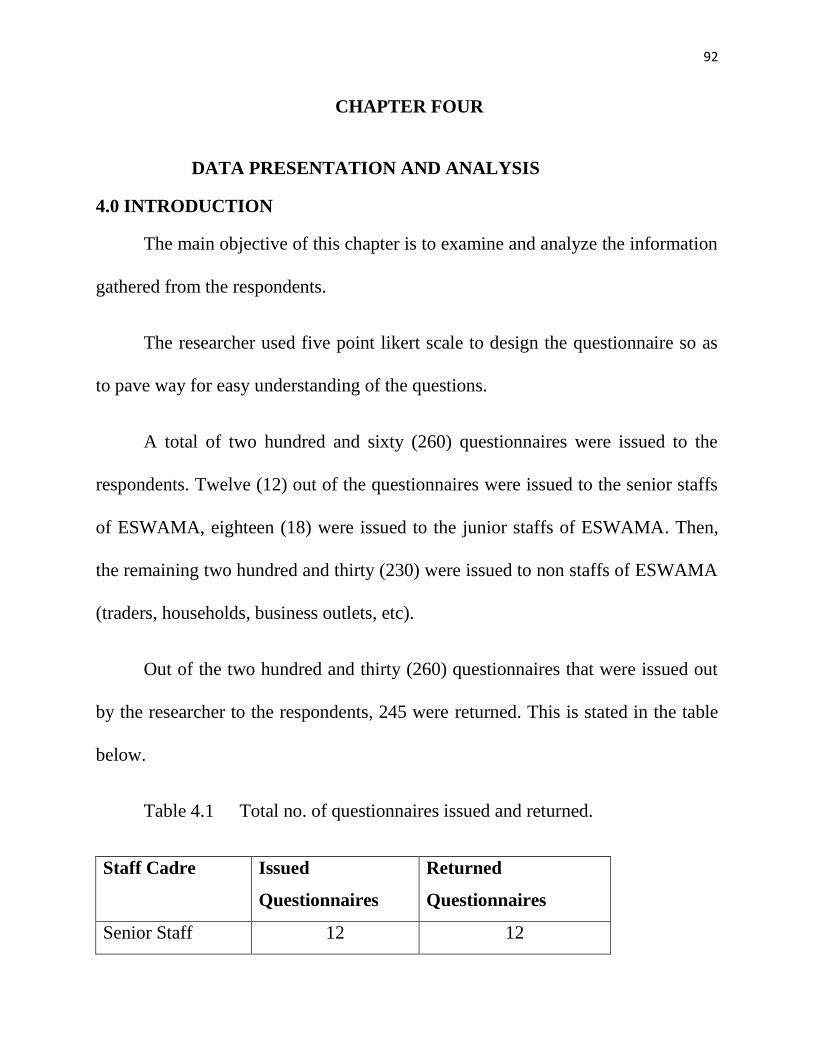
92
CHAPTER FOUR
DATA PRESENTATION AND ANALYSIS
4.0 INTRODUCTION
The main objective of this chapter is to examine and analyze the information
gathered from the respondents.
The researcher used five point likert scale to design the questionnaire so as
to pave way for easy understanding of the questions.
A total of two hundred and sixty (260) questionnaires were issued to the
respondents. Twelve (12) out of the questionnaires were issued to the senior staffs
of ESWAMA, eighteen (18) were issued to the junior staffs of ESWAMA. Then,
the remaining two hundred and thirty (230) were issued to non staffs of ESWAMA
(traders, households, business outlets, etc).
Out of the two hundred and thirty (260) questionnaires that were issued out
by the researcher to the respondents, 245 were returned. This is stated in the table
below.
Table 4.1 Total no. of questionnaires issued and returned.
Staff Cadre Issued
Questionnaires
Returned
Questionnaires
Senior Staff 12 12
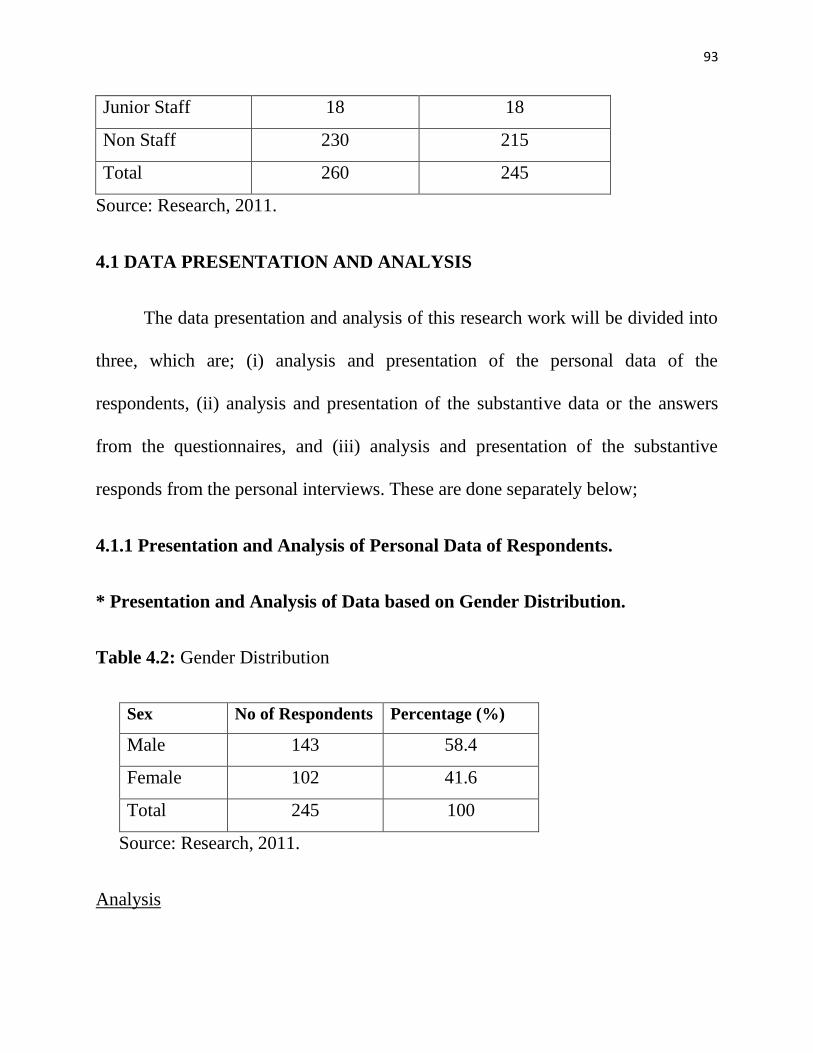
93
Junior Staff 18 18
Non Staff 230 215
Total 260 245
Source: Research, 2011.
4.1 DATA PRESENTATION AND ANALYSIS
The data presentation and analysis of this research work will be divided into
three, which are; (i) analysis and presentation of the personal data of the
respondents, (ii) analysis and presentation of the substantive data or the answers
from the questionnaires, and (iii) analysis and presentation of the substantive
responds from the personal interviews. These are done separately below;
4.1.1 Presentation and Analysis of Personal Data of Respondents.
* Presentation and Analysis of Data based on Gender Distribution.
Table 4.2: Gender Distribution
Sex No of Respondents Percentage (%)
Male 143 58.4
Female 102 41.6
Total 245 100
Source: Research, 2011.
Analysis
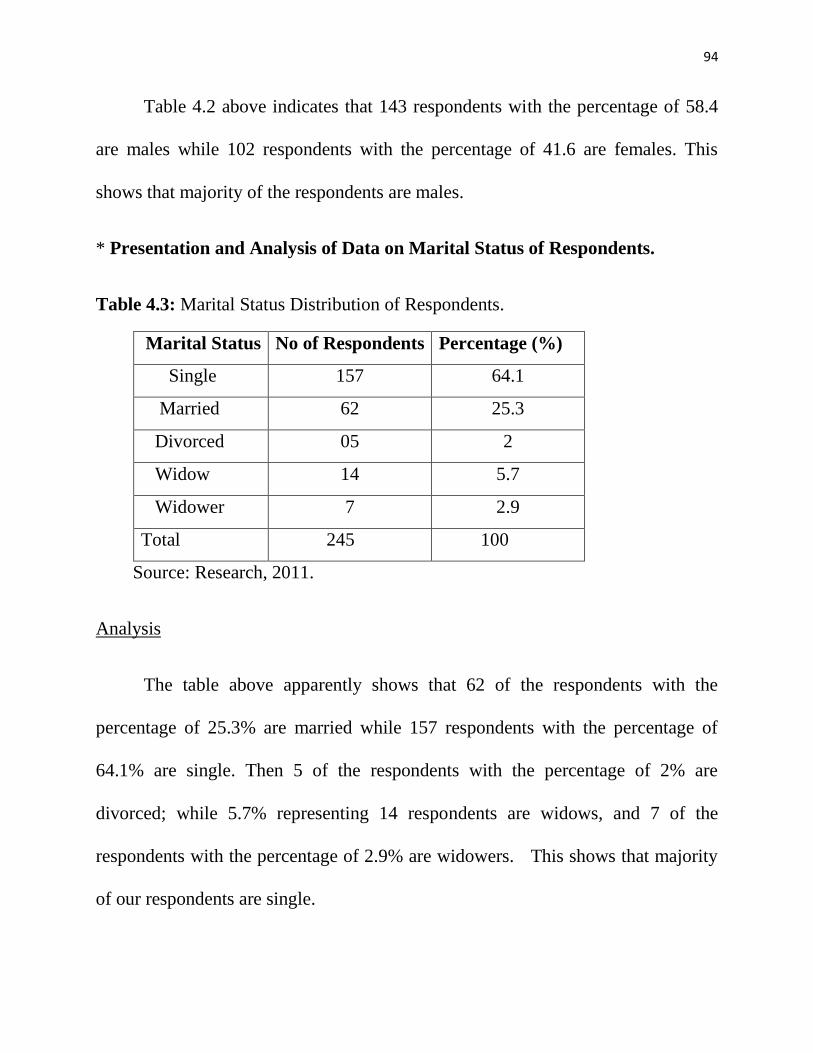
94
Table 4.2 above indicates that 143 respondents with the percentage of 58.4
are males while 102 respondents with the percentage of 41.6 are females. This
shows that majority of the respondents are males.
* Presentation and Analysis of Data on Marital Status of Respondents.
Table 4.3: Marital Status Distribution of Respondents.
Marital Status No of Respondents Percentage (%)
Single 157 64.1
Married 62 25.3
Divorced 05 2
Widow 14 5.7
Widower 7 2.9
Total 245 100
Source: Research, 2011.
Analysis
The table above apparently shows that 62 of the respondents with the
percentage of 25.3% are married while 157 respondents with the percentage of
64.1% are single. Then 5 of the respondents with the percentage of 2% are
divorced; while 5.7% representing 14 respondents are widows, and 7 of the
respondents with the percentage of 2.9% are widowers. This shows that majority
of our respondents are single.
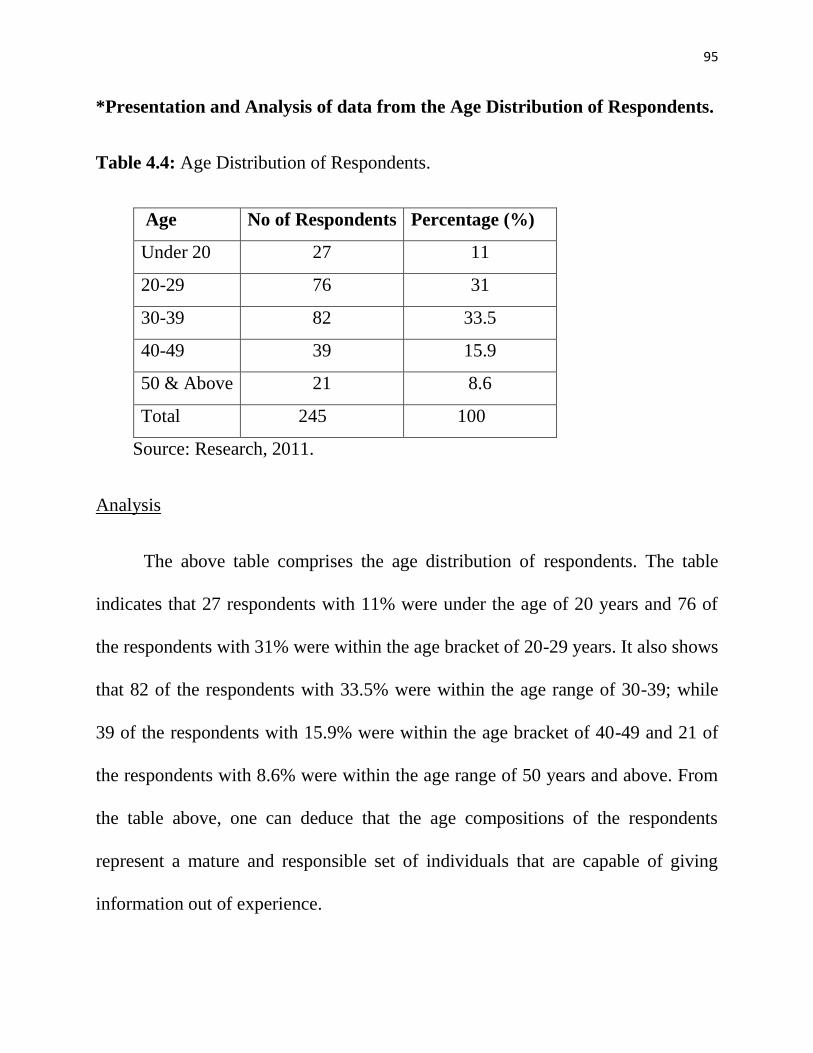
95
*Presentation and Analysis of data from the Age Distribution of Respondents.
Table 4.4: Age Distribution of Respondents.
Age No of Respondents Percentage (%)
Under 20 27 11
20-29 76 31
30-39 82 33.5
40-49 39 15.9
50 & Above 21 8.6
Total 245 100
Source: Research, 2011.
Analysis
The above table comprises the age distribution of respondents. The table
indicates that 27 respondents with 11% were under the age of 20 years and 76 of
the respondents with 31% were within the age bracket of 20-29 years. It also shows
that 82 of the respondents with 33.5% were within the age range of 30-39; while
39 of the respondents with 15.9% were within the age bracket of 40-49 and 21 of
the respondents with 8.6% were within the age range of 50 years and above. From
the table above, one can deduce that the age compositions of the respondents
represent a mature and responsible set of individuals that are capable of giving
information out of experience.
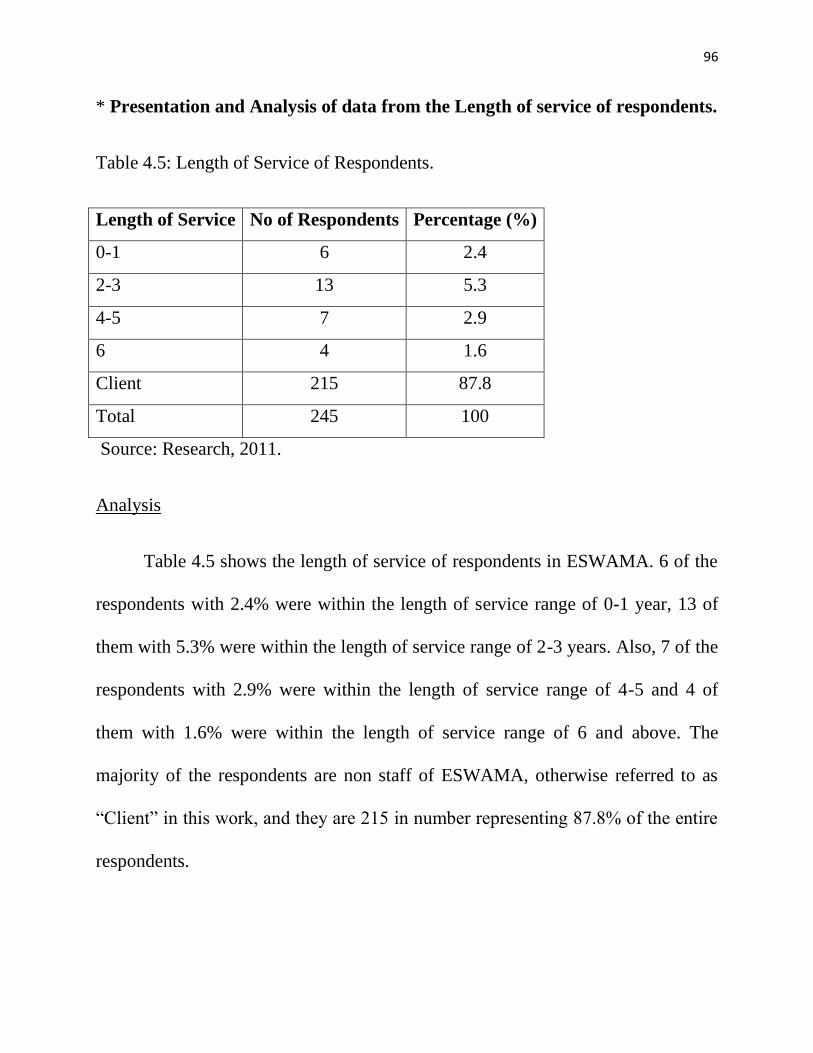
96
* Presentation and Analysis of data from the Length of service of respondents.
Table 4.5: Length of Service of Respondents.
Length of Service No of Respondents Percentage (%)
0-1 6 2.4
2-3 13 5.3
4-5 7 2.9
6 4 1.6
Client 215 87.8
Total 245 100
Source: Research, 2011.
Analysis
Table 4.5 shows the length of service of respondents in ESWAMA. 6 of the
respondents with 2.4% were within the length of service range of 0-1 year, 13 of
them with 5.3% were within the length of service range of 2-3 years. Also, 7 of the
respondents with 2.9% were within the length of service range of 4-5 and 4 of
them with 1.6% were within the length of service range of 6 and above. The
majority of the respondents are non staff of ESWAMA, otherwise referred to as
“Client” in this work, and they are 215 in number representing 87.8% of the entire
respondents.
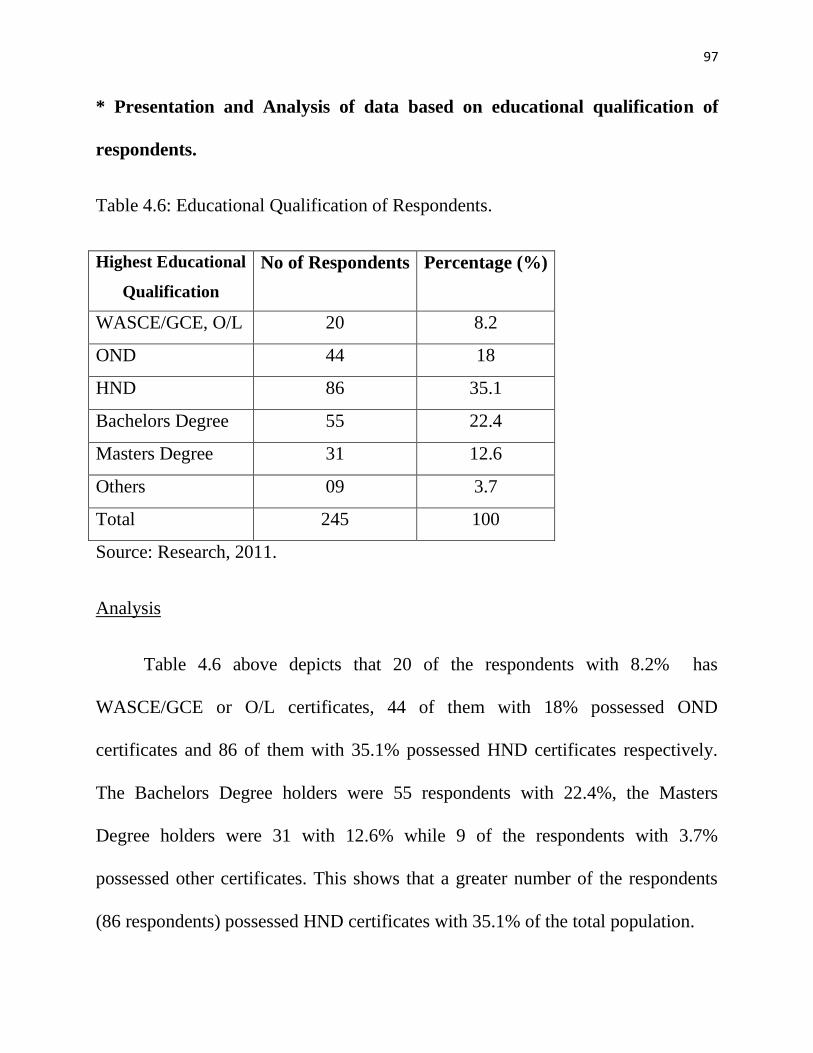
97
* Presentation and Analysis of data based on educational qualification of
respondents.
Table 4.6: Educational Qualification of Respondents.
Highest Educational
Qualification
No of Respondents Percentage (%)
WASCE/GCE, O/L 20 8.2
OND 44 18
HND 86 35.1
Bachelors Degree 55 22.4
Masters Degree 31 12.6
Others 09 3.7
Total 245 100
Source: Research, 2011.
Analysis
Table 4.6 above depicts that 20 of the respondents with 8.2% has
WASCE/GCE or O/L certificates, 44 of them with 18% possessed OND
certificates and 86 of them with 35.1% possessed HND certificates respectively.
The Bachelors Degree holders were 55 respondents with 22.4%, the Masters
Degree holders were 31 with 12.6% while 9 of the respondents with 3.7%
possessed other certificates. This shows that a greater number of the respondents
(86 respondents) possessed HND certificates with 35.1% of the total population.
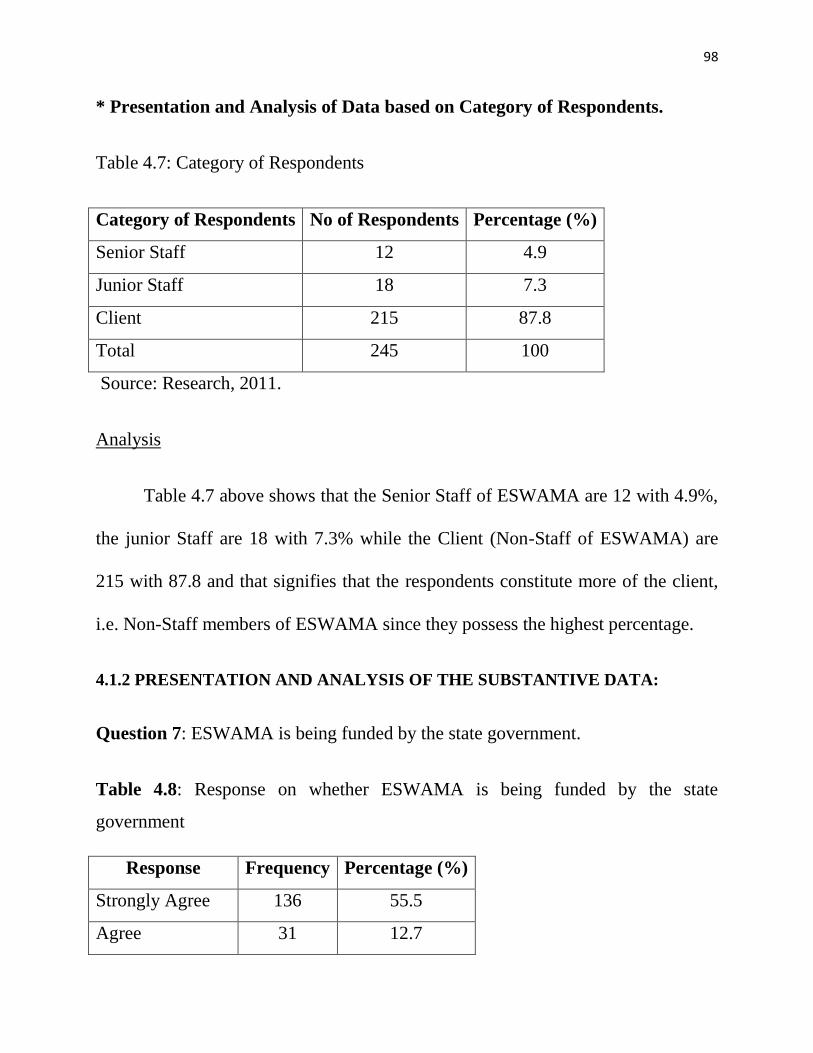
98
* Presentation and Analysis of Data based on Category of Respondents.
Table 4.7: Category of Respondents
Category of Respondents No of Respondents Percentage (%)
Senior Staff 12 4.9
Junior Staff 18 7.3
Client 215 87.8
Total 245 100
Source: Research, 2011.
Analysis
Table 4.7 above shows that the Senior Staff of ESWAMA are 12 with 4.9%,
the junior Staff are 18 with 7.3% while the Client (Non-Staff of ESWAMA) are
215 with 87.8 and that signifies that the respondents constitute more of the client,
i.e. Non-Staff members of ESWAMA since they possess the highest percentage.
4.1.2 PRESENTATION AND ANALYSIS OF THE SUBSTANTIVE DATA:
Question 7: ESWAMA is being funded by the state government.
Table 4.8: Response on whether ESWAMA is being funded by the state
government
Response Frequency Percentage (%)
Strongly Agree 136 55.5
Agree 31 12.7
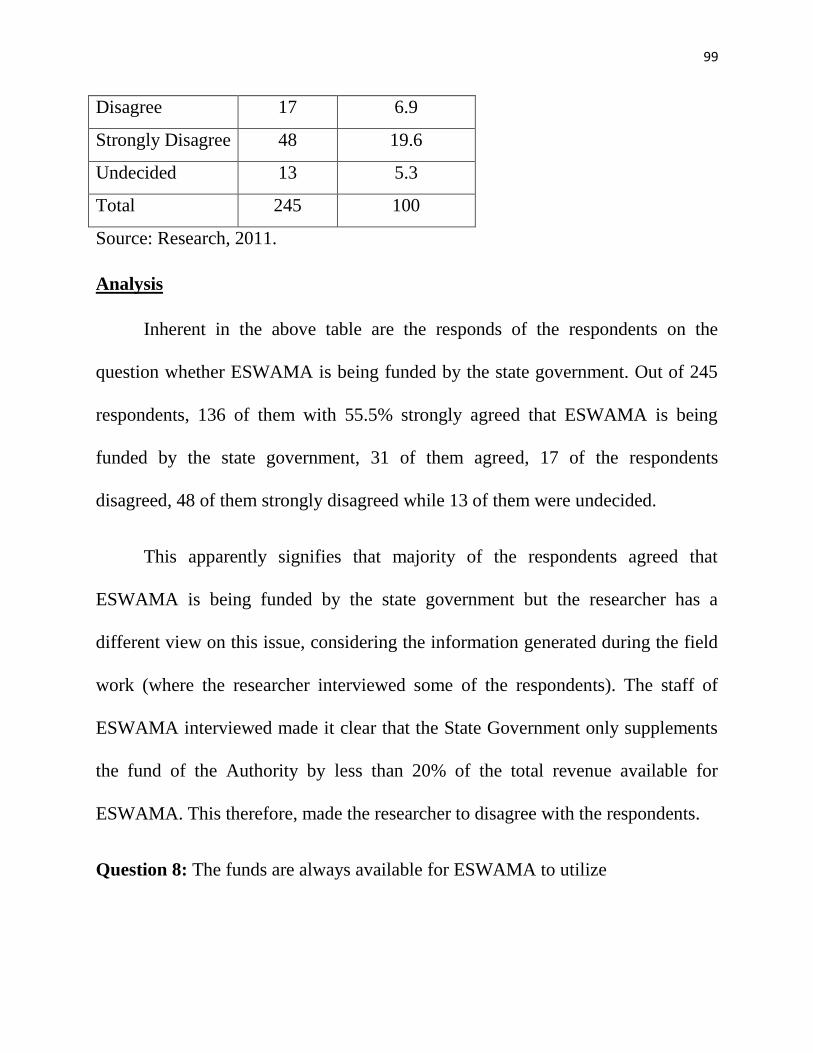
99
Disagree 17 6.9
Strongly Disagree 48 19.6
Undecided 13 5.3
Total 245 100
Source: Research, 2011.
Analysis
Inherent in the above table are the responds of the respondents on the
question whether ESWAMA is being funded by the state government. Out of 245
respondents, 136 of them with 55.5% strongly agreed that ESWAMA is being
funded by the state government, 31 of them agreed, 17 of the respondents
disagreed, 48 of them strongly disagreed while 13 of them were undecided.
This apparently signifies that majority of the respondents agreed that
ESWAMA is being funded by the state government but the researcher has a
different view on this issue, considering the information generated during the field
work (where the researcher interviewed some of the respondents). The staff of
ESWAMA interviewed made it clear that the State Government only supplements
the fund of the Authority by less than 20% of the total revenue available for
ESWAMA. This therefore, made the researcher to disagree with the respondents.
Question 8: The funds are always available for ESWAMA to utilize
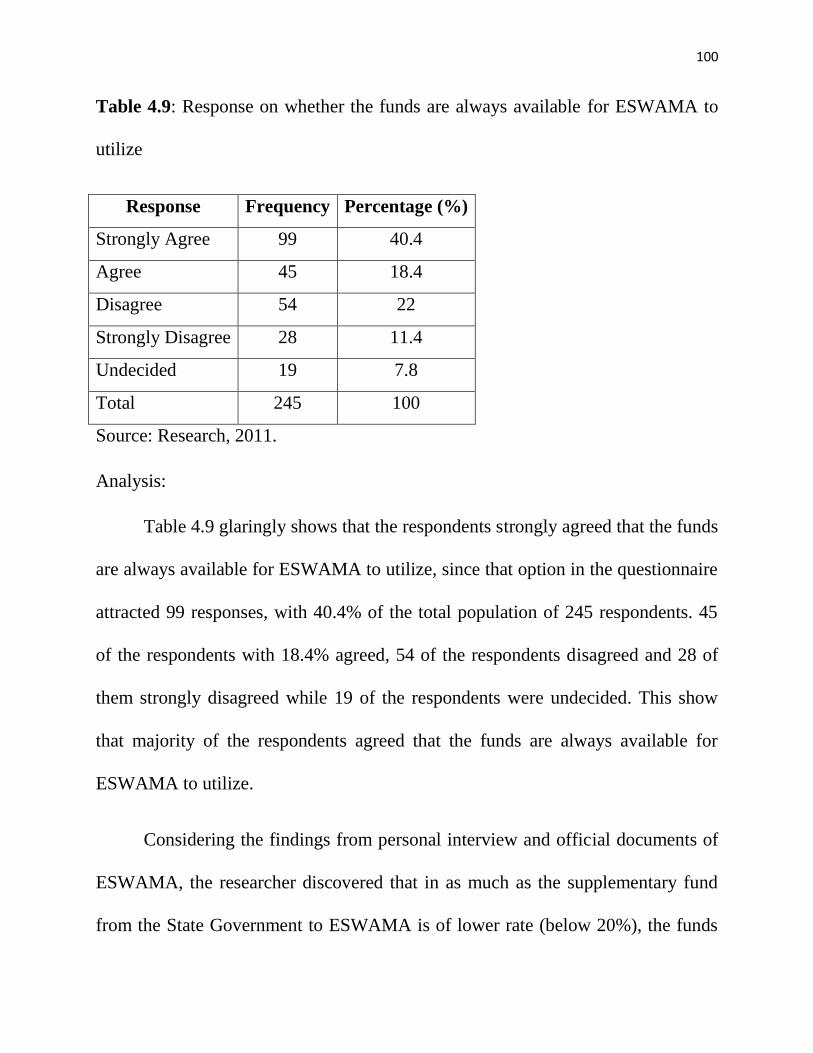
100
Table 4.9: Response on whether the funds are always available for ESWAMA to
utilize
Response Frequency Percentage (%)
Strongly Agree 99 40.4
Agree 45 18.4
Disagree 54 22
Strongly Disagree 28 11.4
Undecided 19 7.8
Total 245 100
Source: Research, 2011.
Analysis:
Table 4.9 glaringly shows that the respondents strongly agreed that the funds
are always available for ESWAMA to utilize, since that option in the questionnaire
attracted 99 responses, with 40.4% of the total population of 245 respondents. 45
of the respondents with 18.4% agreed, 54 of the respondents disagreed and 28 of
them strongly disagreed while 19 of the respondents were undecided. This show
that majority of the respondents agreed that the funds are always available for
ESWAMA to utilize.
Considering the findings from personal interview and official documents of
ESWAMA, the researcher discovered that in as much as the supplementary fund
from the State Government to ESWAMA is of lower rate (below 20%), the funds
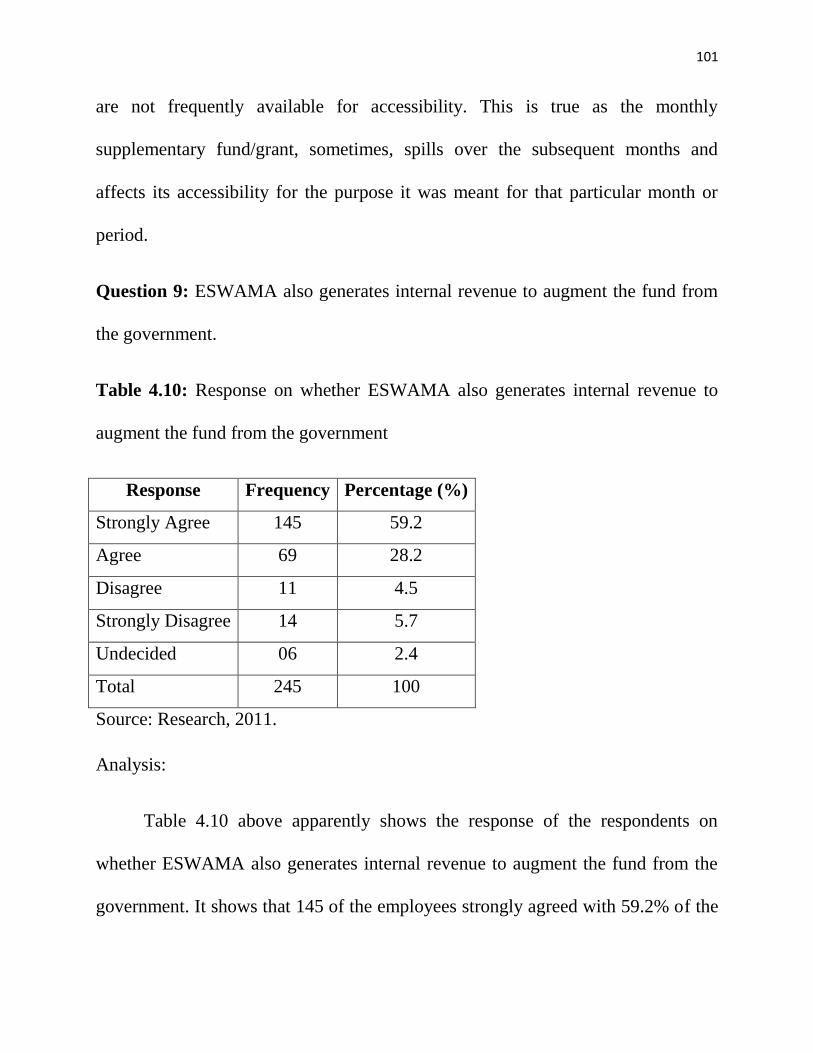
101
are not frequently available for accessibility. This is true as the monthly
supplementary fund/grant, sometimes, spills over the subsequent months and
affects its accessibility for the purpose it was meant for that particular month or
period.
Question 9: ESWAMA also generates internal revenue to augment the fund from
the government.
Table 4.10: Response on whether ESWAMA also generates internal revenue to
augment the fund from the government
Response Frequency Percentage (%)
Strongly Agree 145 59.2
Agree 69 28.2
Disagree 11 4.5
Strongly Disagree 14 5.7
Undecided 06 2.4
Total 245 100
Source: Research, 2011.
Analysis:
Table 4.10 above apparently shows the response of the respondents on
whether ESWAMA also generates internal revenue to augment the fund from the
government. It shows that 145 of the employees strongly agreed with 59.2% of the
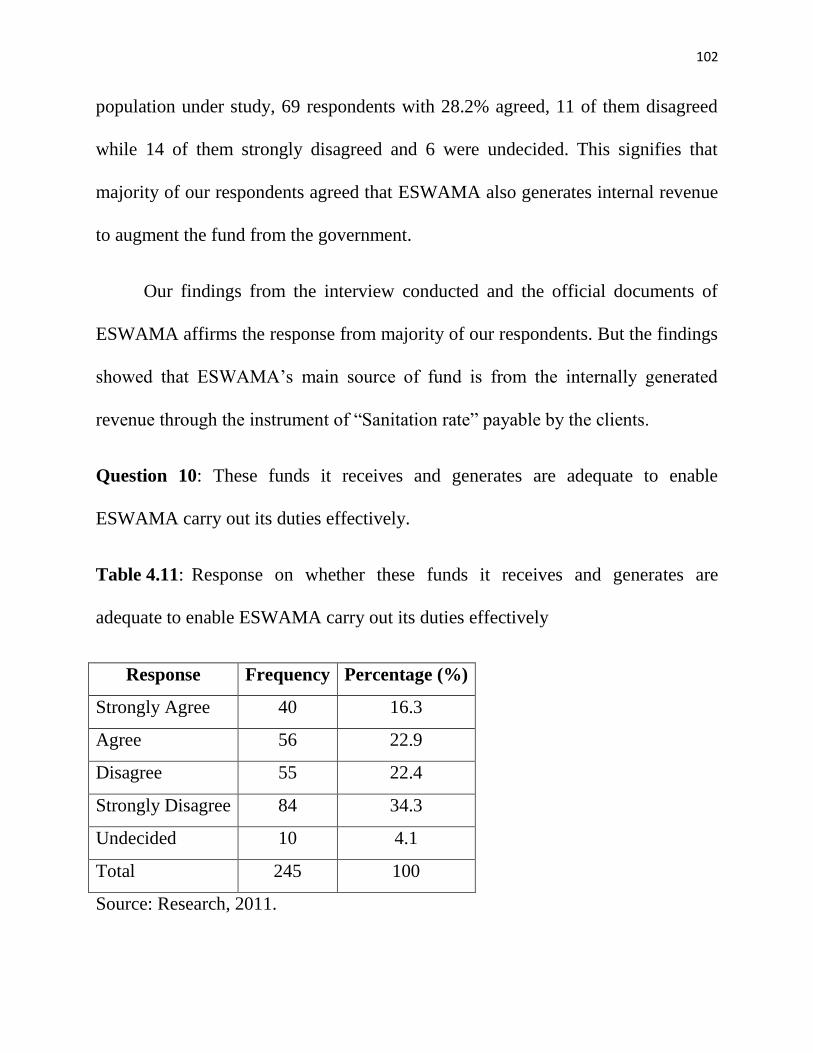
102
population under study, 69 respondents with 28.2% agreed, 11 of them disagreed
while 14 of them strongly disagreed and 6 were undecided. This signifies that
majority of our respondents agreed that ESWAMA also generates internal revenue
to augment the fund from the government.
Our findings from the interview conducted and the official documents of
ESWAMA affirms the response from majority of our respondents. But the findings
showed that ESWAMA‟s main source of fund is from the internally generated
revenue through the instrument of “Sanitation rate” payable by the clients.
Question 10: These funds it receives and generates are adequate to enable
ESWAMA carry out its duties effectively.
Table 4.11: Response on whether these funds it receives and generates are
adequate to enable ESWAMA carry out its duties effectively
Response Frequency Percentage (%)
Strongly Agree 40 16.3
Agree 56 22.9
Disagree 55 22.4
Strongly Disagree 84 34.3
Undecided 10 4.1
Total 245 100
Source: Research, 2011.
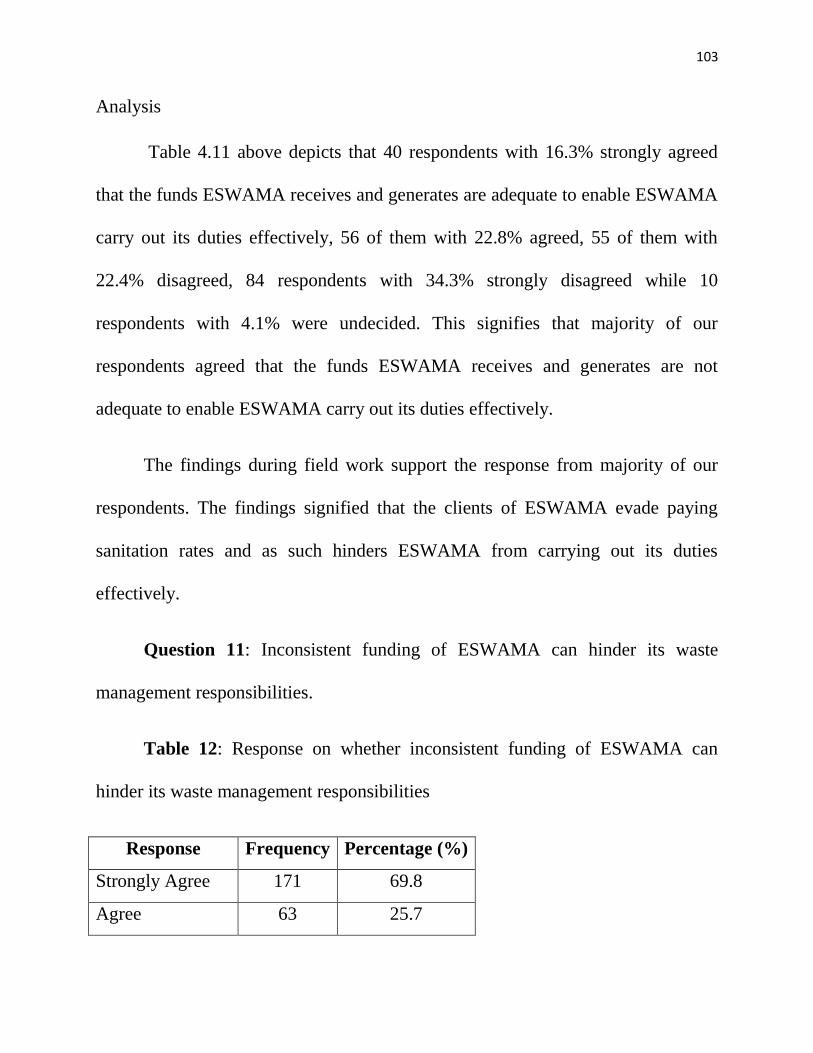
103
Analysis
Table 4.11 above depicts that 40 respondents with 16.3% strongly agreed
that the funds ESWAMA receives and generates are adequate to enable ESWAMA
carry out its duties effectively, 56 of them with 22.8% agreed, 55 of them with
22.4% disagreed, 84 respondents with 34.3% strongly disagreed while 10
respondents with 4.1% were undecided. This signifies that majority of our
respondents agreed that the funds ESWAMA receives and generates are not
adequate to enable ESWAMA carry out its duties effectively.
The findings during field work support the response from majority of our
respondents. The findings signified that the clients of ESWAMA evade paying
sanitation rates and as such hinders ESWAMA from carrying out its duties
effectively.
Question 11: Inconsistent funding of ESWAMA can hinder its waste
management responsibilities.
Table 12: Response on whether inconsistent funding of ESWAMA can
hinder its waste management responsibilities
Response Frequency Percentage (%)
Strongly Agree 171 69.8
Agree 63 25.7
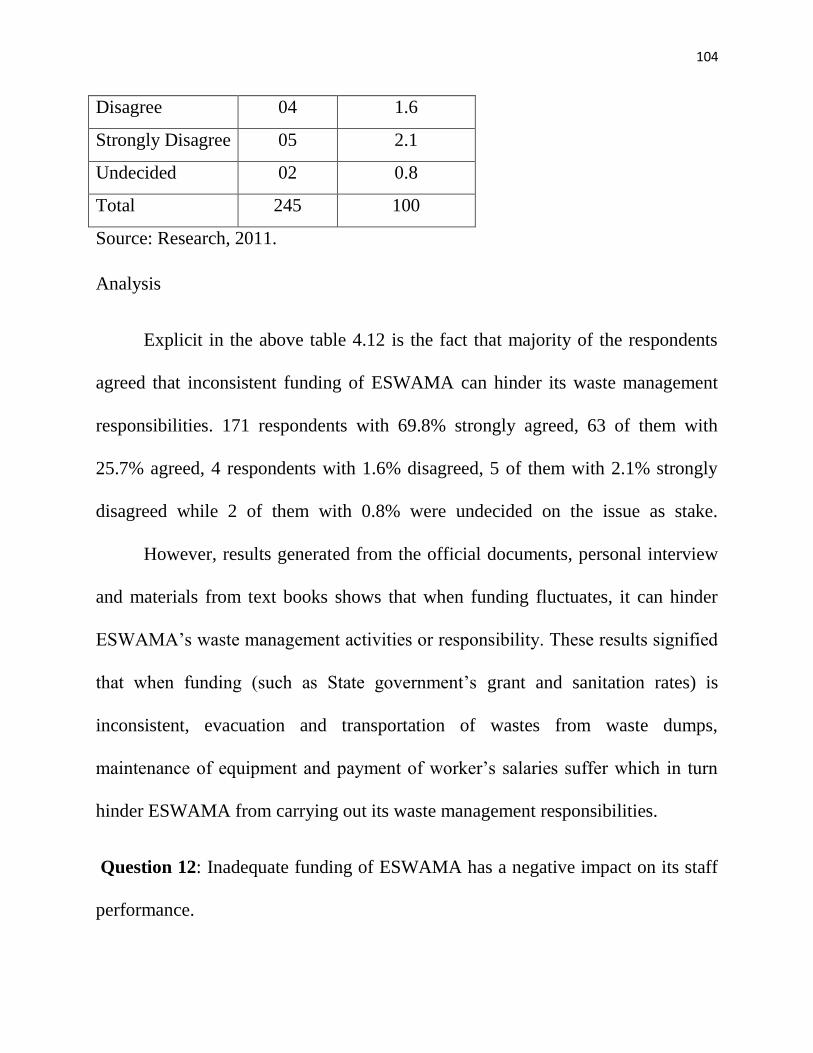
104
Disagree 04 1.6
Strongly Disagree 05 2.1
Undecided 02 0.8
Total 245 100
Source: Research, 2011.
Analysis
Explicit in the above table 4.12 is the fact that majority of the respondents
agreed that inconsistent funding of ESWAMA can hinder its waste management
responsibilities. 171 respondents with 69.8% strongly agreed, 63 of them with
25.7% agreed, 4 respondents with 1.6% disagreed, 5 of them with 2.1% strongly
disagreed while 2 of them with 0.8% were undecided on the issue as stake.
However, results generated from the official documents, personal interview
and materials from text books shows that when funding fluctuates, it can hinder
ESWAMA‟s waste management activities or responsibility. These results signified
that when funding (such as State government‟s grant and sanitation rates) is
inconsistent, evacuation and transportation of wastes from waste dumps,
maintenance of equipment and payment of worker‟s salaries suffer which in turn
hinder ESWAMA from carrying out its waste management responsibilities.
Question 12: Inadequate funding of ESWAMA has a negative impact on its staff
performance.
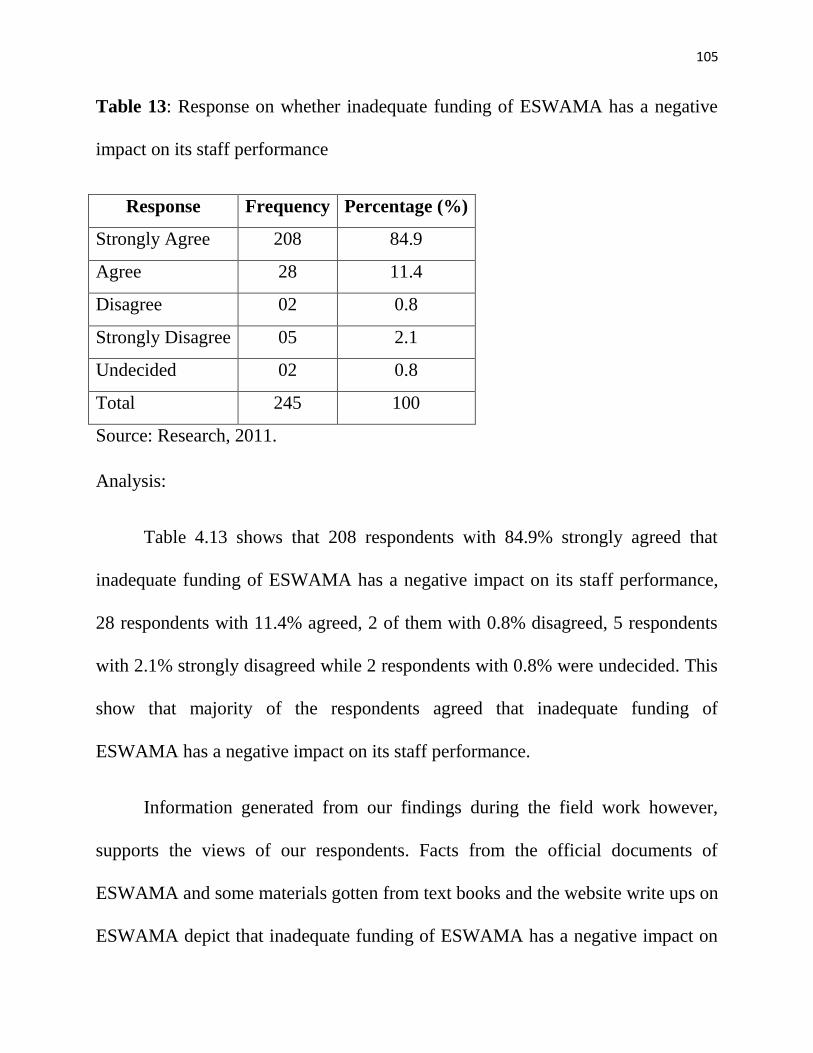
105
Table 13: Response on whether inadequate funding of ESWAMA has a negative
impact on its staff performance
Response Frequency Percentage (%)
Strongly Agree 208 84.9
Agree 28 11.4
Disagree 02 0.8
Strongly Disagree 05 2.1
Undecided 02 0.8
Total 245 100
Source: Research, 2011.
Analysis:
Table 4.13 shows that 208 respondents with 84.9% strongly agreed that
inadequate funding of ESWAMA has a negative impact on its staff performance,
28 respondents with 11.4% agreed, 2 of them with 0.8% disagreed, 5 respondents
with 2.1% strongly disagreed while 2 respondents with 0.8% were undecided. This
show that majority of the respondents agreed that inadequate funding of
ESWAMA has a negative impact on its staff performance.
Information generated from our findings during the field work however,
supports the views of our respondents. Facts from the official documents of
ESWAMA and some materials gotten from text books and the website write ups on
ESWAMA depict that inadequate funding of ESWAMA has a negative impact on
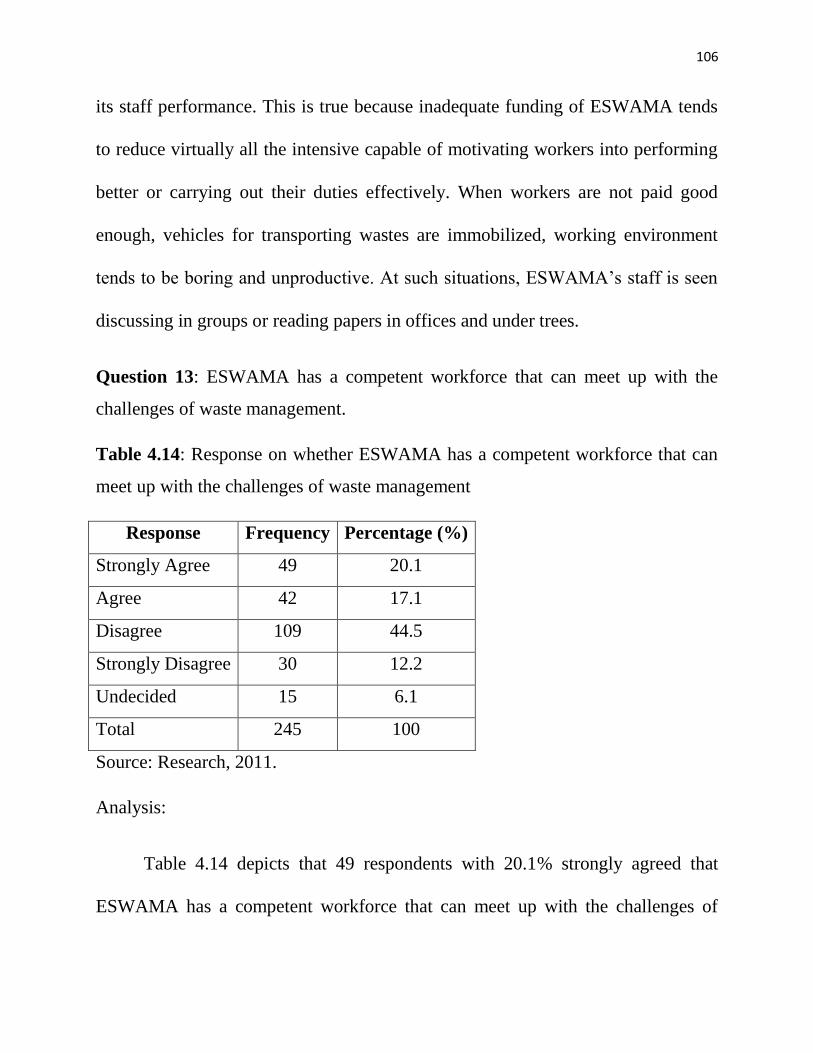
106
its staff performance. This is true because inadequate funding of ESWAMA tends
to reduce virtually all the intensive capable of motivating workers into performing
better or carrying out their duties effectively. When workers are not paid good
enough, vehicles for transporting wastes are immobilized, working environment
tends to be boring and unproductive. At such situations, ESWAMA‟s staff is seen
discussing in groups or reading papers in offices and under trees.
Question 13: ESWAMA has a competent workforce that can meet up with the
challenges of waste management.
Table 4.14: Response on whether ESWAMA has a competent workforce that can
meet up with the challenges of waste management
Response Frequency Percentage (%)
Strongly Agree 49 20.1
Agree 42 17.1
Disagree 109 44.5
Strongly Disagree 30 12.2
Undecided 15 6.1
Total 245 100
Source: Research, 2011.
Analysis:
Table 4.14 depicts that 49 respondents with 20.1% strongly agreed that
ESWAMA has a competent workforce that can meet up with the challenges of
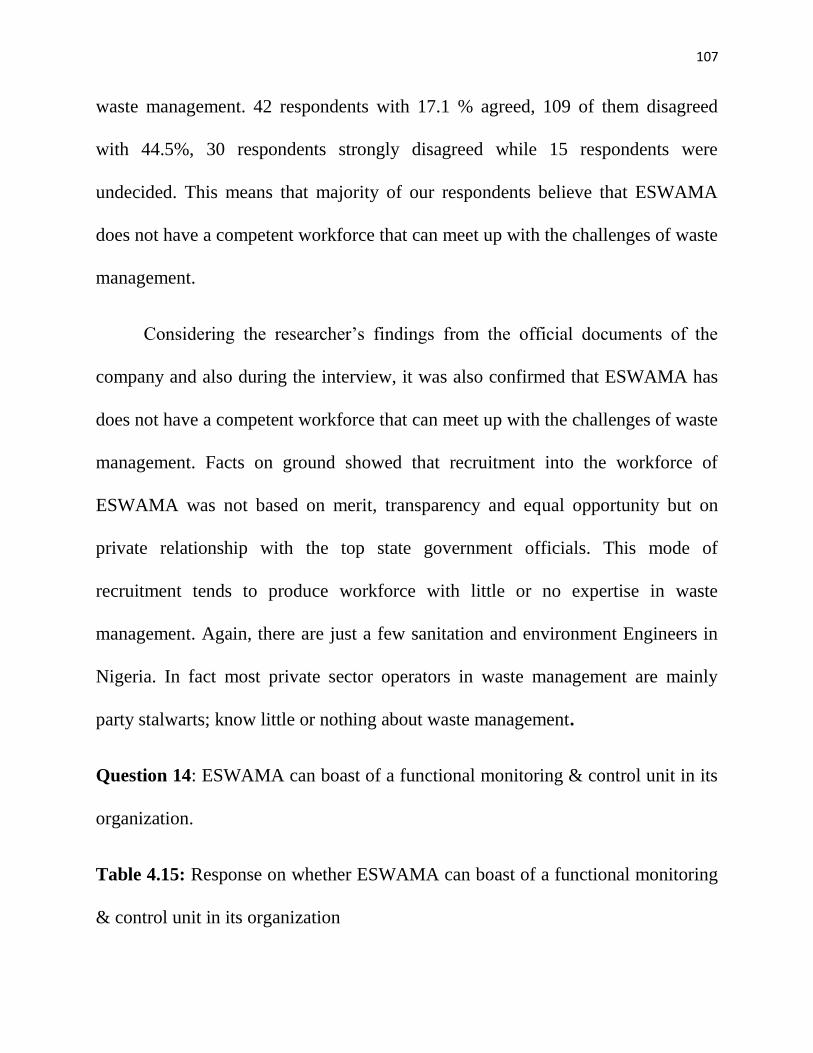
107
waste management. 42 respondents with 17.1 % agreed, 109 of them disagreed
with 44.5%, 30 respondents strongly disagreed while 15 respondents were
undecided. This means that majority of our respondents believe that ESWAMA
does not have a competent workforce that can meet up with the challenges of waste
management.
Considering the researcher‟s findings from the official documents of the
company and also during the interview, it was also confirmed that ESWAMA has
does not have a competent workforce that can meet up with the challenges of waste
management. Facts on ground showed that recruitment into the workforce of
ESWAMA was not based on merit, transparency and equal opportunity but on
private relationship with the top state government officials. This mode of
recruitment tends to produce workforce with little or no expertise in waste
management. Again, there are just a few sanitation and environment Engineers in
Nigeria. In fact most private sector operators in waste management are mainly
party stalwarts; know little or nothing about waste management.
Question 14: ESWAMA can boast of a functional monitoring & control unit in its
organization.
Table 4.15: Response on whether ESWAMA can boast of a functional monitoring
& control unit in its organization
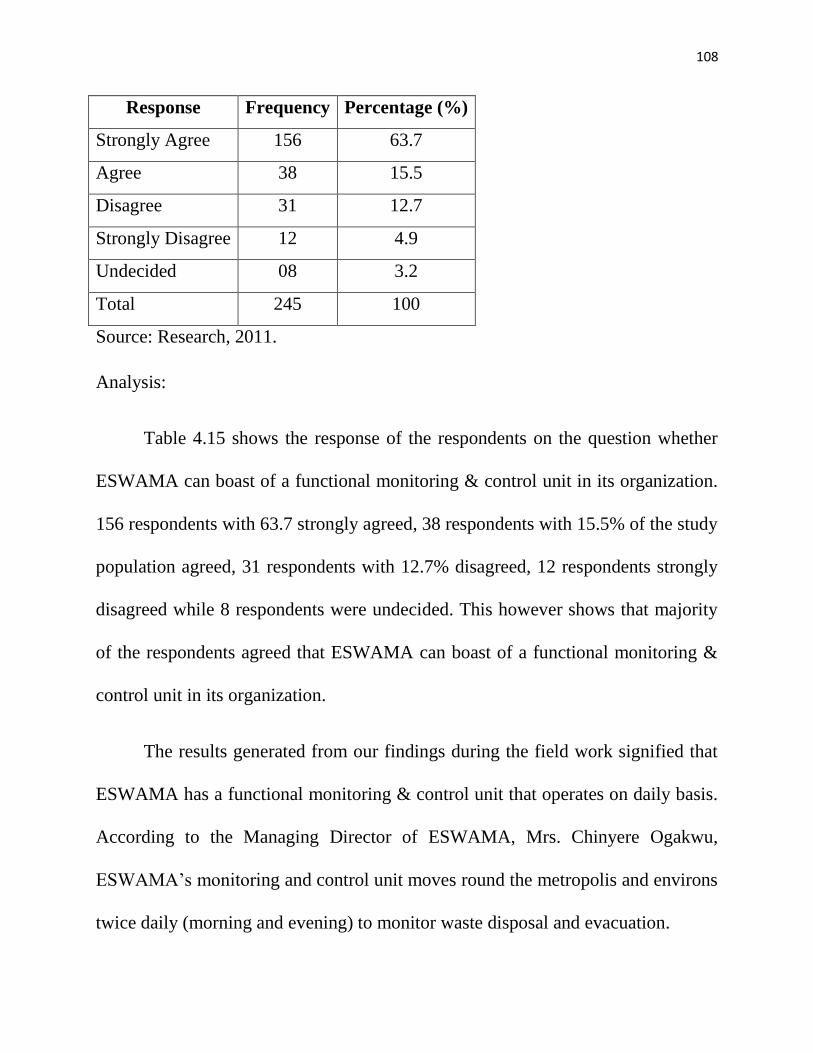
108
Response Frequency Percentage (%)
Strongly Agree 156 63.7
Agree 38 15.5
Disagree 31 12.7
Strongly Disagree 12 4.9
Undecided 08 3.2
Total 245 100
Source: Research, 2011.
Analysis:
Table 4.15 shows the response of the respondents on the question whether
ESWAMA can boast of a functional monitoring & control unit in its organization.
156 respondents with 63.7 strongly agreed, 38 respondents with 15.5% of the study
population agreed, 31 respondents with 12.7% disagreed, 12 respondents strongly
disagreed while 8 respondents were undecided. This however shows that majority
of the respondents agreed that ESWAMA can boast of a functional monitoring &
control unit in its organization.
The results generated from our findings during the field work signified that
ESWAMA has a functional monitoring & control unit that operates on daily basis.
According to the Managing Director of ESWAMA, Mrs. Chinyere Ogakwu,
ESWAMA‟s monitoring and control unit moves round the metropolis and environs
twice daily (morning and evening) to monitor waste disposal and evacuation.
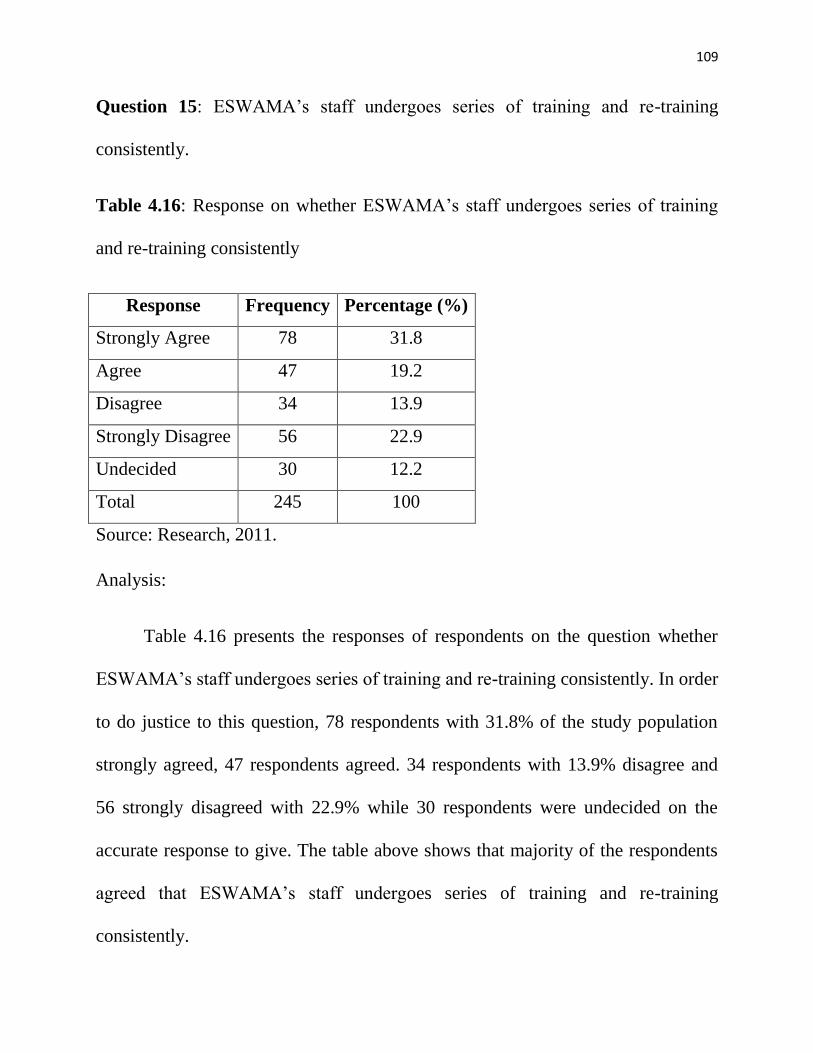
109
Question 15: ESWAMA‟s staff undergoes series of training and re-training
consistently.
Table 4.16: Response on whether ESWAMA‟s staff undergoes series of training
and re-training consistently
Response Frequency Percentage (%)
Strongly Agree 78 31.8
Agree 47 19.2
Disagree 34 13.9
Strongly Disagree 56 22.9
Undecided 30 12.2
Total 245 100
Source: Research, 2011.
Analysis:
Table 4.16 presents the responses of respondents on the question whether
ESWAMA‟s staff undergoes series of training and re-training consistently. In order
to do justice to this question, 78 respondents with 31.8% of the study population
strongly agreed, 47 respondents agreed. 34 respondents with 13.9% disagree and
56 strongly disagreed with 22.9% while 30 respondents were undecided on the
accurate response to give. The table above shows that majority of the respondents
agreed that ESWAMA‟s staff undergoes series of training and re-training
consistently.
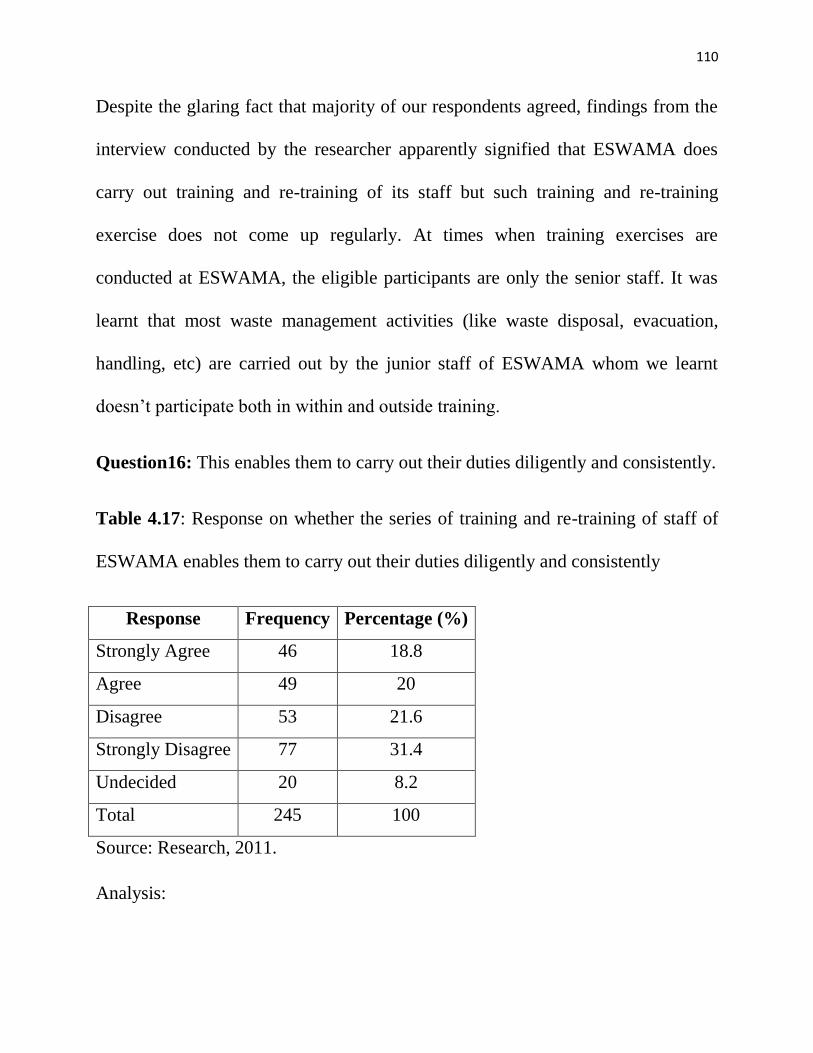
110
Despite the glaring fact that majority of our respondents agreed, findings from the
interview conducted by the researcher apparently signified that ESWAMA does
carry out training and re-training of its staff but such training and re-training
exercise does not come up regularly. At times when training exercises are
conducted at ESWAMA, the eligible participants are only the senior staff. It was
learnt that most waste management activities (like waste disposal, evacuation,
handling, etc) are carried out by the junior staff of ESWAMA whom we learnt
doesn‟t participate both in within and outside training.
Question16: This enables them to carry out their duties diligently and consistently.
Table 4.17: Response on whether the series of training and re-training of staff of
ESWAMA enables them to carry out their duties diligently and consistently
Response Frequency Percentage (%)
Strongly Agree 46 18.8
Agree 49 20
Disagree 53 21.6
Strongly Disagree 77 31.4
Undecided 20 8.2
Total 245 100
Source: Research, 2011.
Analysis:
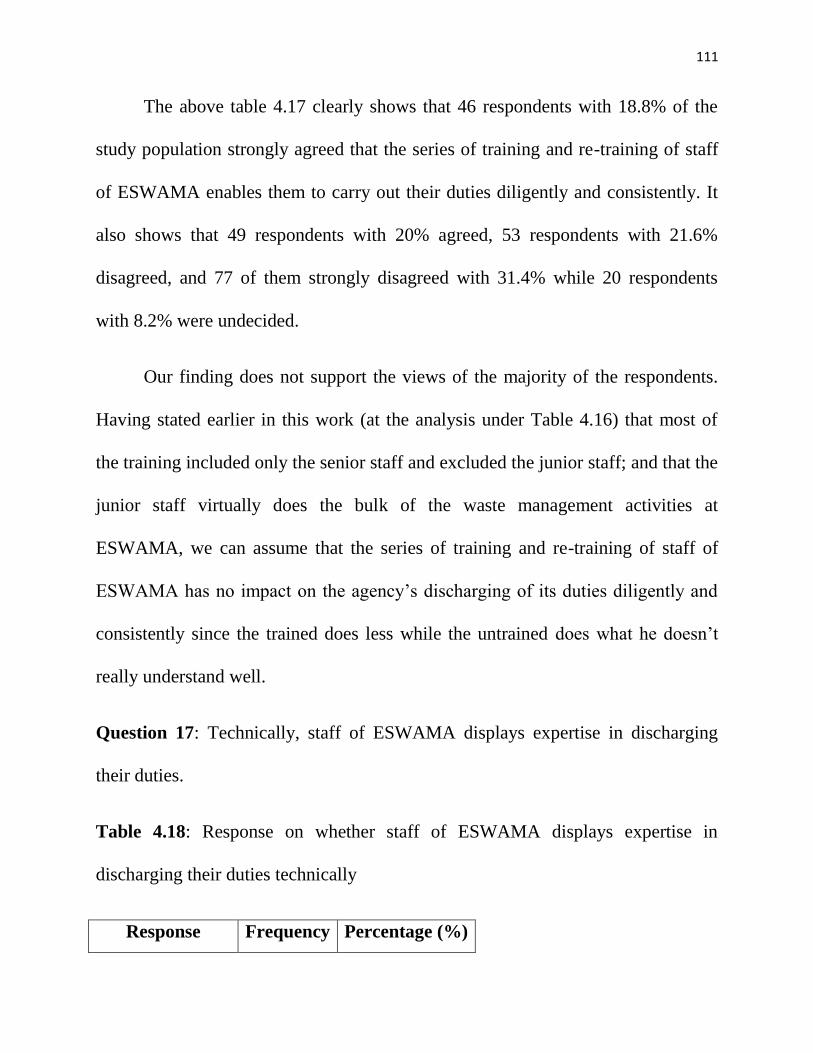
111
The above table 4.17 clearly shows that 46 respondents with 18.8% of the
study population strongly agreed that the series of training and re-training of staff
of ESWAMA enables them to carry out their duties diligently and consistently. It
also shows that 49 respondents with 20% agreed, 53 respondents with 21.6%
disagreed, and 77 of them strongly disagreed with 31.4% while 20 respondents
with 8.2% were undecided.
Our finding does not support the views of the majority of the respondents.
Having stated earlier in this work (at the analysis under Table 4.16) that most of
the training included only the senior staff and excluded the junior staff; and that the
junior staff virtually does the bulk of the waste management activities at
ESWAMA, we can assume that the series of training and re-training of staff of
ESWAMA has no impact on the agency‟s discharging of its duties diligently and
consistently since the trained does less while the untrained does what he doesn‟t
really understand well.
Question 17: Technically, staff of ESWAMA displays expertise in discharging
their duties.
Table 4.18: Response on whether staff of ESWAMA displays expertise in
discharging their duties technically
Response Frequency Percentage (%)
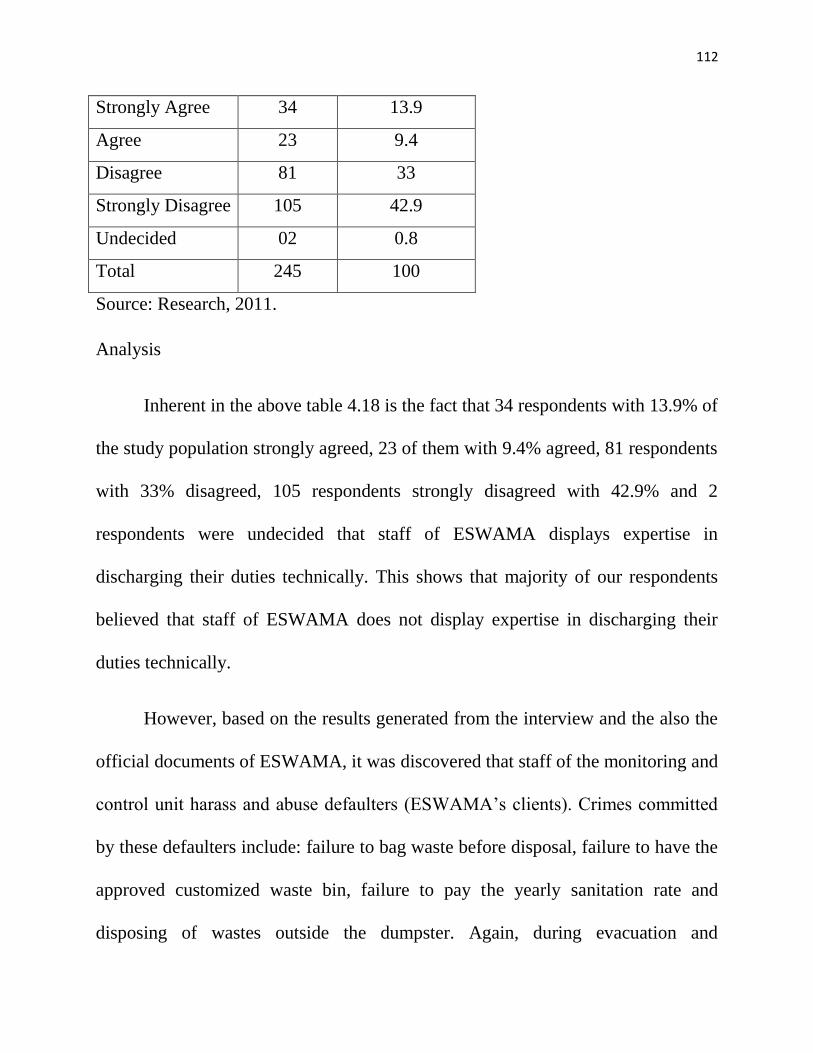
112
Strongly Agree 34 13.9
Agree 23 9.4
Disagree 81 33
Strongly Disagree 105 42.9
Undecided 02 0.8
Total 245 100
Source: Research, 2011.
Analysis
Inherent in the above table 4.18 is the fact that 34 respondents with 13.9% of
the study population strongly agreed, 23 of them with 9.4% agreed, 81 respondents
with 33% disagreed, 105 respondents strongly disagreed with 42.9% and 2
respondents were undecided that staff of ESWAMA displays expertise in
discharging their duties technically. This shows that majority of our respondents
believed that staff of ESWAMA does not display expertise in discharging their
duties technically.
However, based on the results generated from the interview and the also the
official documents of ESWAMA, it was discovered that staff of the monitoring and
control unit harass and abuse defaulters (ESWAMA‟s clients). Crimes committed
by these defaulters include: failure to bag waste before disposal, failure to have the
approved customized waste bin, failure to pay the yearly sanitation rate and
disposing of wastes outside the dumpster. Again, during evacuation and
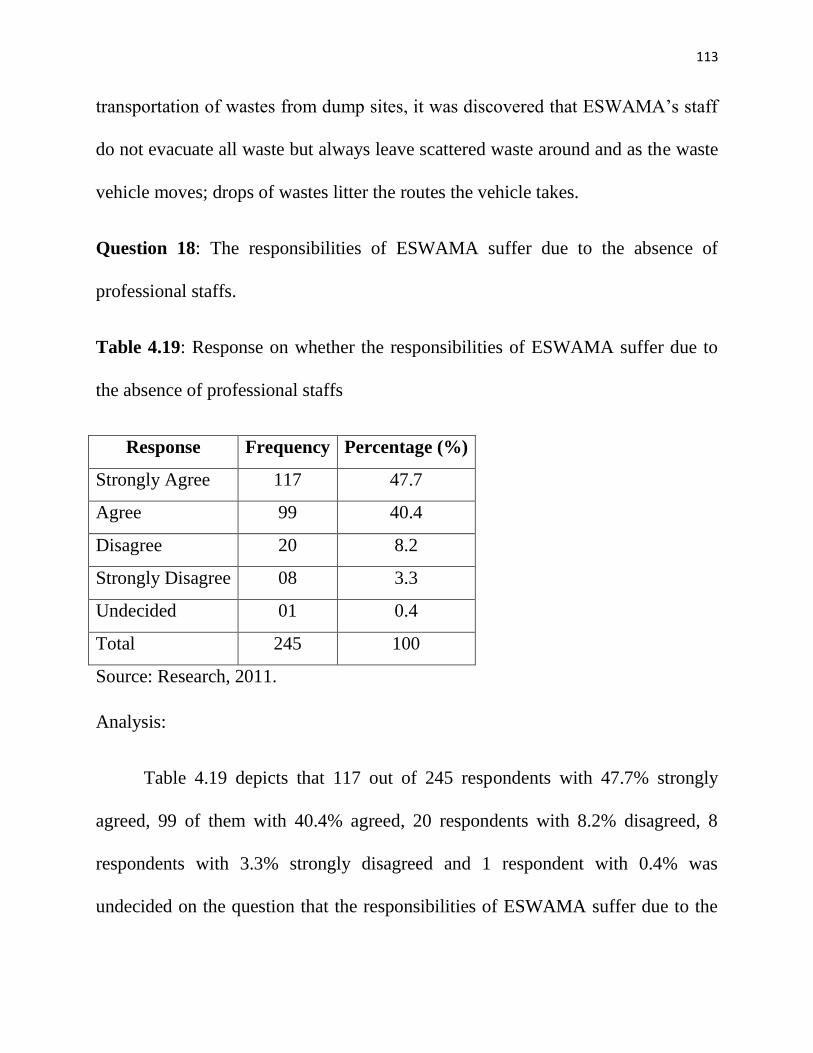
113
transportation of wastes from dump sites, it was discovered that ESWAMA‟s staff
do not evacuate all waste but always leave scattered waste around and as the waste
vehicle moves; drops of wastes litter the routes the vehicle takes.
Question 18: The responsibilities of ESWAMA suffer due to the absence of
professional staffs.
Table 4.19: Response on whether the responsibilities of ESWAMA suffer due to
the absence of professional staffs
Response Frequency Percentage (%)
Strongly Agree 117 47.7
Agree 99 40.4
Disagree 20 8.2
Strongly Disagree 08 3.3
Undecided 01 0.4
Total 245 100
Source: Research, 2011.
Analysis:
Table 4.19 depicts that 117 out of 245 respondents with 47.7% strongly
agreed, 99 of them with 40.4% agreed, 20 respondents with 8.2% disagreed, 8
respondents with 3.3% strongly disagreed and 1 respondent with 0.4% was
undecided on the question that the responsibilities of ESWAMA suffer due to the
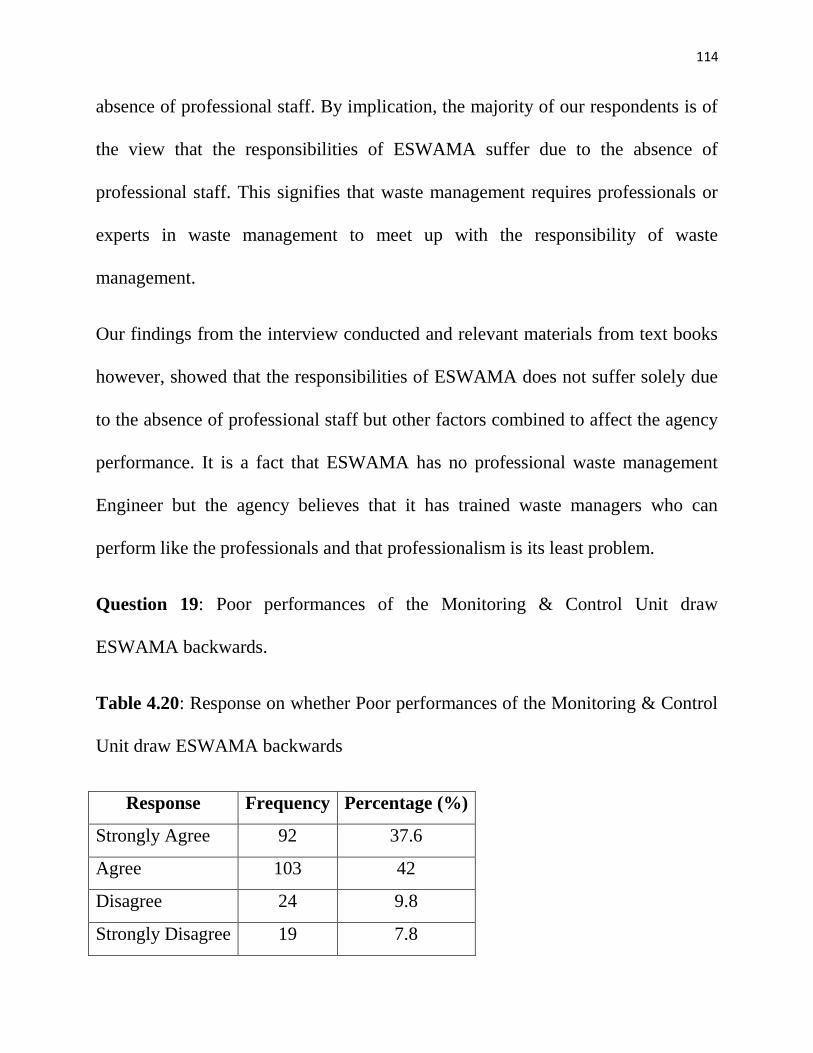
114
absence of professional staff. By implication, the majority of our respondents is of
the view that the responsibilities of ESWAMA suffer due to the absence of
professional staff. This signifies that waste management requires professionals or
experts in waste management to meet up with the responsibility of waste
management.
Our findings from the interview conducted and relevant materials from text books
however, showed that the responsibilities of ESWAMA does not suffer solely due
to the absence of professional staff but other factors combined to affect the agency
performance. It is a fact that ESWAMA has no professional waste management
Engineer but the agency believes that it has trained waste managers who can
perform like the professionals and that professionalism is its least problem.
Question 19: Poor performances of the Monitoring & Control Unit draw
ESWAMA backwards.
Table 4.20: Response on whether Poor performances of the Monitoring & Control
Unit draw ESWAMA backwards
Response Frequency Percentage (%)
Strongly Agree 92 37.6
Agree 103 42
Disagree 24 9.8
Strongly Disagree 19 7.8
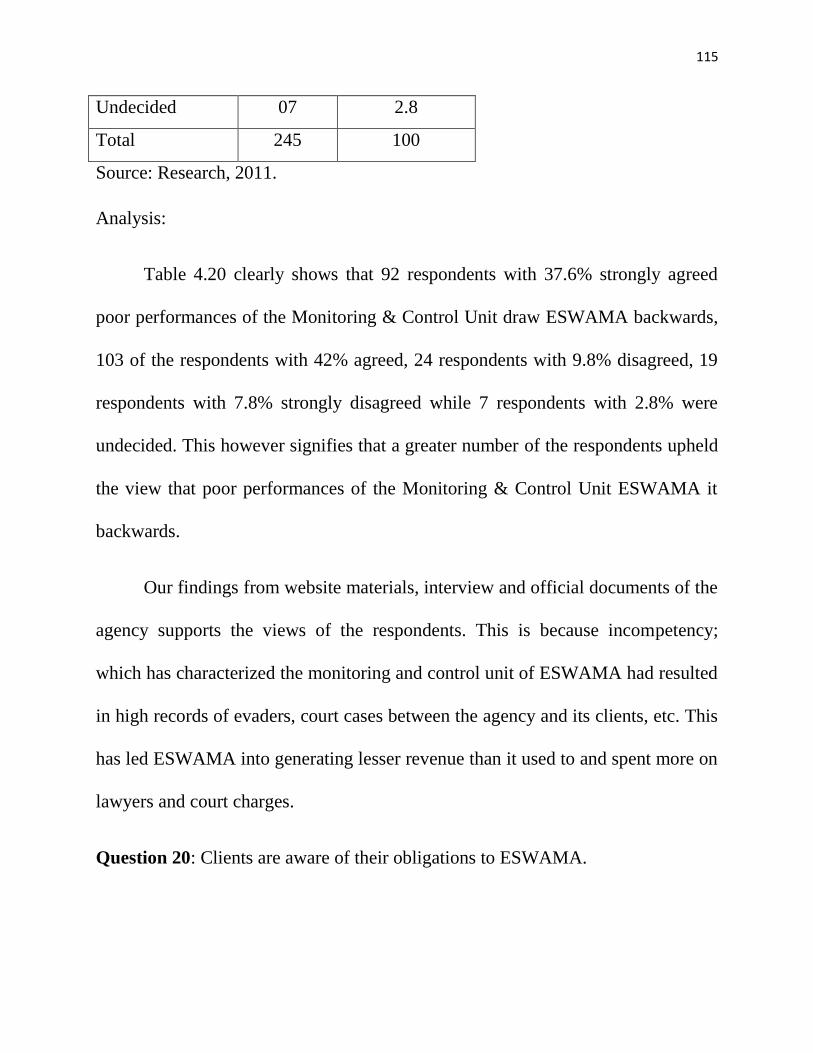
115
Undecided 07 2.8
Total 245 100
Source: Research, 2011.
Analysis:
Table 4.20 clearly shows that 92 respondents with 37.6% strongly agreed
poor performances of the Monitoring & Control Unit draw ESWAMA backwards,
103 of the respondents with 42% agreed, 24 respondents with 9.8% disagreed, 19
respondents with 7.8% strongly disagreed while 7 respondents with 2.8% were
undecided. This however signifies that a greater number of the respondents upheld
the view that poor performances of the Monitoring & Control Unit ESWAMA it
backwards.
Our findings from website materials, interview and official documents of the
agency supports the views of the respondents. This is because incompetency;
which has characterized the monitoring and control unit of ESWAMA had resulted
in high records of evaders, court cases between the agency and its clients, etc. This
has led ESWAMA into generating lesser revenue than it used to and spent more on
lawyers and court charges.
Question 20: Clients are aware of their obligations to ESWAMA.
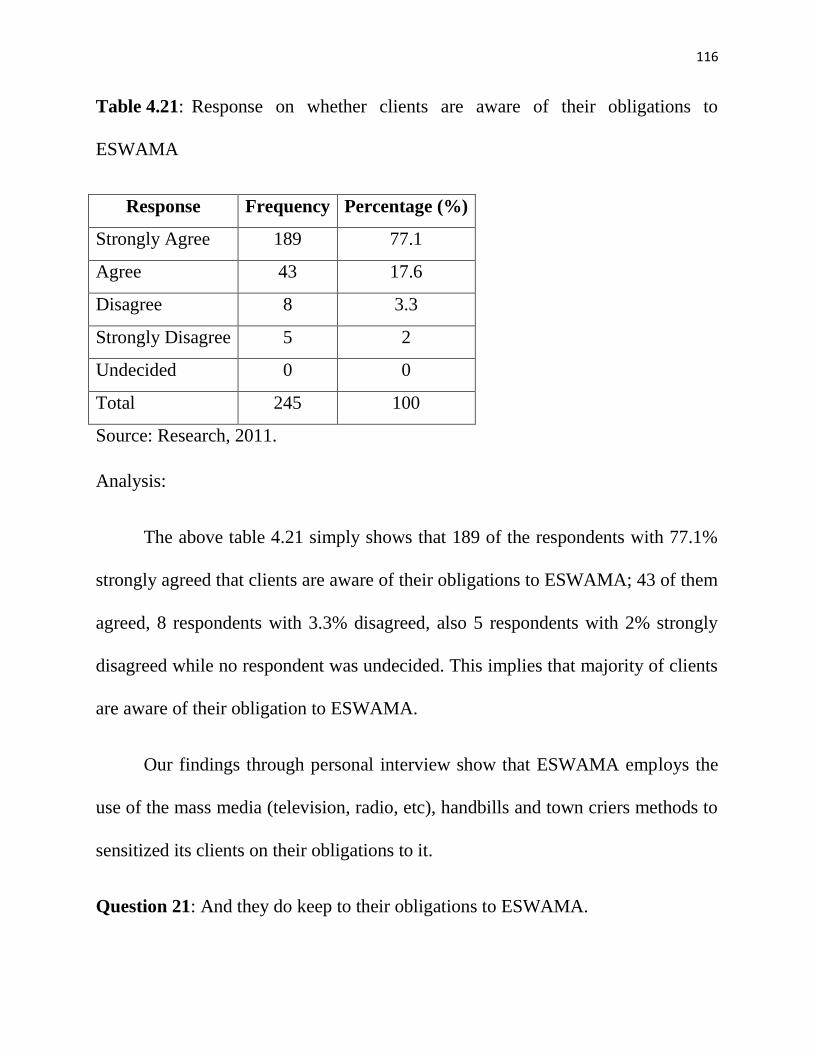
116
Table 4.21: Response on whether clients are aware of their obligations to
ESWAMA
Response Frequency Percentage (%)
Strongly Agree 189 77.1
Agree 43 17.6
Disagree 8 3.3
Strongly Disagree 5 2
Undecided 0 0
Total 245 100
Source: Research, 2011.
Analysis:
The above table 4.21 simply shows that 189 of the respondents with 77.1%
strongly agreed that clients are aware of their obligations to ESWAMA; 43 of them
agreed, 8 respondents with 3.3% disagreed, also 5 respondents with 2% strongly
disagreed while no respondent was undecided. This implies that majority of clients
are aware of their obligation to ESWAMA.
Our findings through personal interview show that ESWAMA employs the
use of the mass media (television, radio, etc), handbills and town criers methods to
sensitized its clients on their obligations to it.
Question 21: And they do keep to their obligations to ESWAMA.
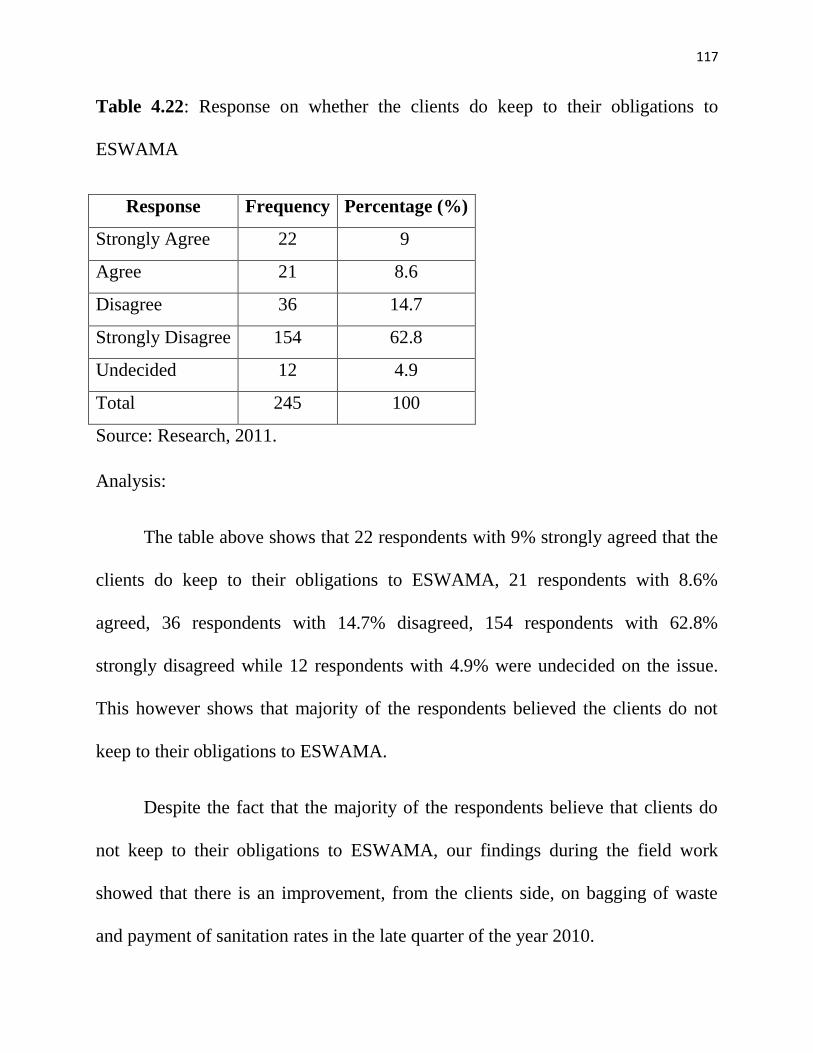
117
Table 4.22: Response on whether the clients do keep to their obligations to
ESWAMA
Response Frequency Percentage (%)
Strongly Agree 22 9
Agree 21 8.6
Disagree 36 14.7
Strongly Disagree 154 62.8
Undecided 12 4.9
Total 245 100
Source: Research, 2011.
Analysis:
The table above shows that 22 respondents with 9% strongly agreed that the
clients do keep to their obligations to ESWAMA, 21 respondents with 8.6%
agreed, 36 respondents with 14.7% disagreed, 154 respondents with 62.8%
strongly disagreed while 12 respondents with 4.9% were undecided on the issue.
This however shows that majority of the respondents believed the clients do not
keep to their obligations to ESWAMA.
Despite the fact that the majority of the respondents believe that clients do
not keep to their obligations to ESWAMA, our findings during the field work
showed that there is an improvement, from the clients side, on bagging of waste
and payment of sanitation rates in the late quarter of the year 2010.
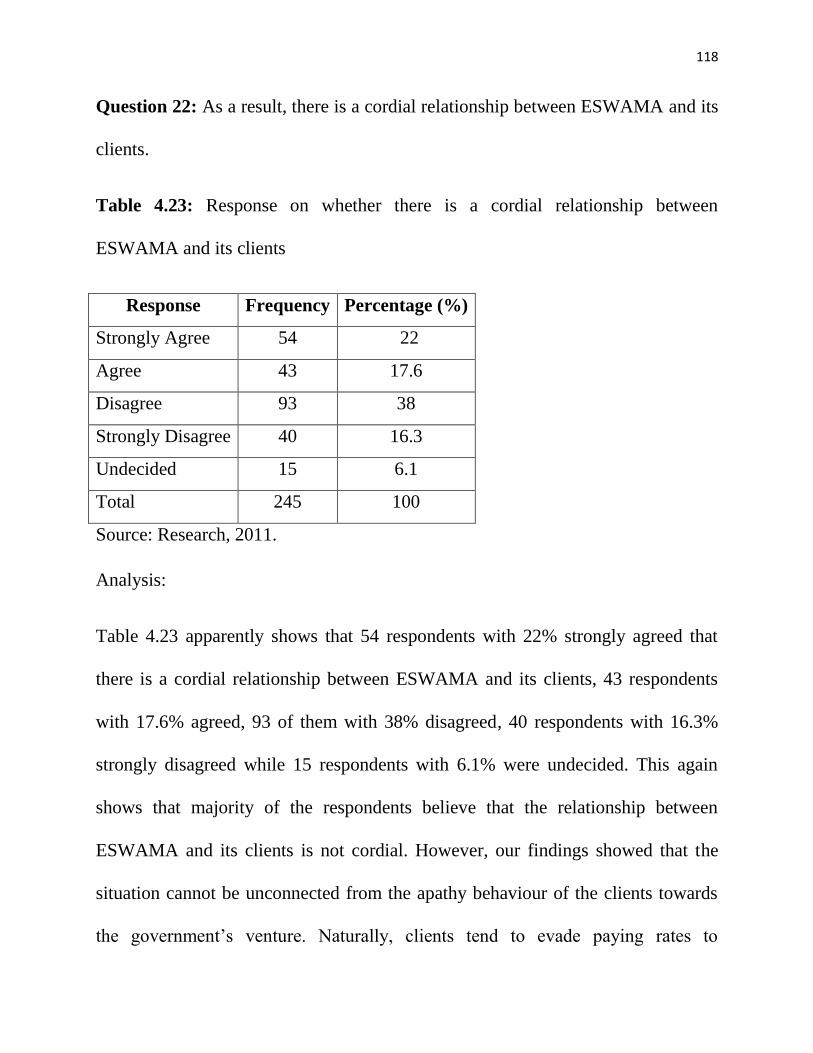
118
Question 22: As a result, there is a cordial relationship between ESWAMA and its
clients.
Table 4.23: Response on whether there is a cordial relationship between
ESWAMA and its clients
Response Frequency Percentage (%)
Strongly Agree 54 22
Agree 43 17.6
Disagree 93 38
Strongly Disagree 40 16.3
Undecided 15 6.1
Total 245 100
Source: Research, 2011.
Analysis:
Table 4.23 apparently shows that 54 respondents with 22% strongly agreed that
there is a cordial relationship between ESWAMA and its clients, 43 respondents
with 17.6% agreed, 93 of them with 38% disagreed, 40 respondents with 16.3%
strongly disagreed while 15 respondents with 6.1% were undecided. This again
shows that majority of the respondents believe that the relationship between
ESWAMA and its clients is not cordial. However, our findings showed that the
situation cannot be unconnected from the apathy behaviour of the clients towards
the government‟s venture. Naturally, clients tend to evade paying rates to
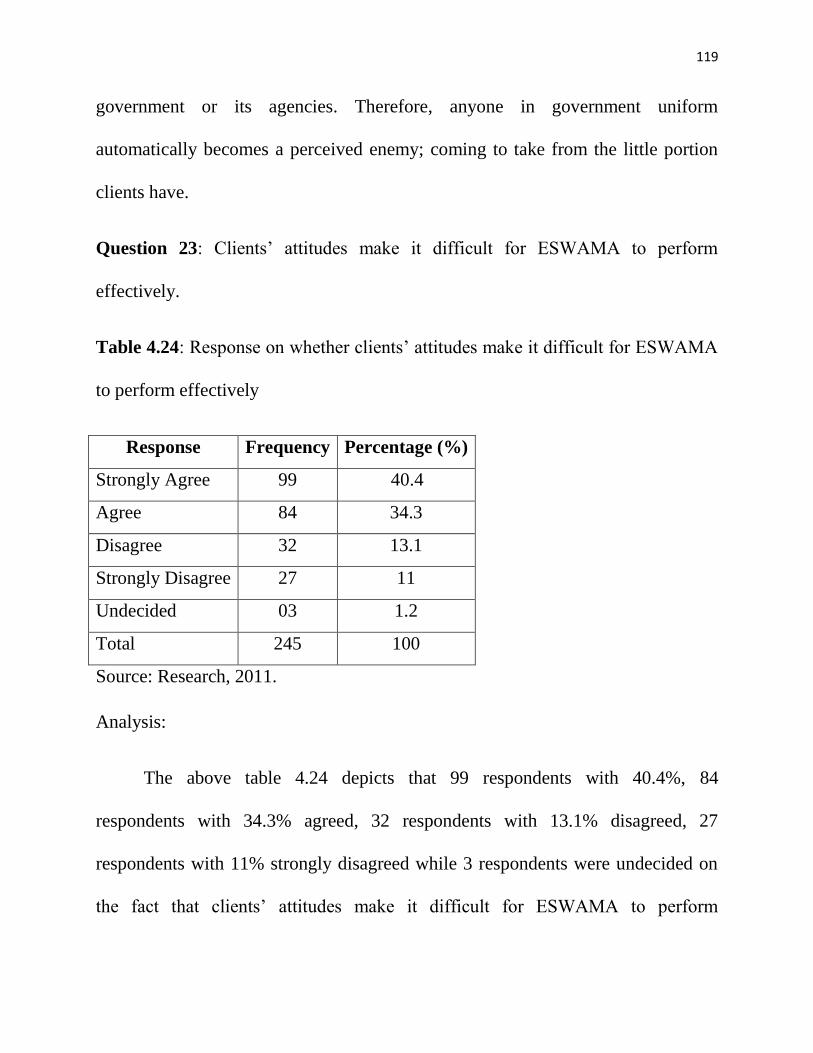
119
government or its agencies. Therefore, anyone in government uniform
automatically becomes a perceived enemy; coming to take from the little portion
clients have.
Question 23: Clients‟ attitudes make it difficult for ESWAMA to perform
effectively.
Table 4.24: Response on whether clients‟ attitudes make it difficult for ESWAMA
to perform effectively
Response Frequency Percentage (%)
Strongly Agree 99 40.4
Agree 84 34.3
Disagree 32 13.1
Strongly Disagree 27 11
Undecided 03 1.2
Total 245 100
Source: Research, 2011.
Analysis:
The above table 4.24 depicts that 99 respondents with 40.4%, 84
respondents with 34.3% agreed, 32 respondents with 13.1% disagreed, 27
respondents with 11% strongly disagreed while 3 respondents were undecided on
the fact that clients‟ attitudes make it difficult for ESWAMA to perform
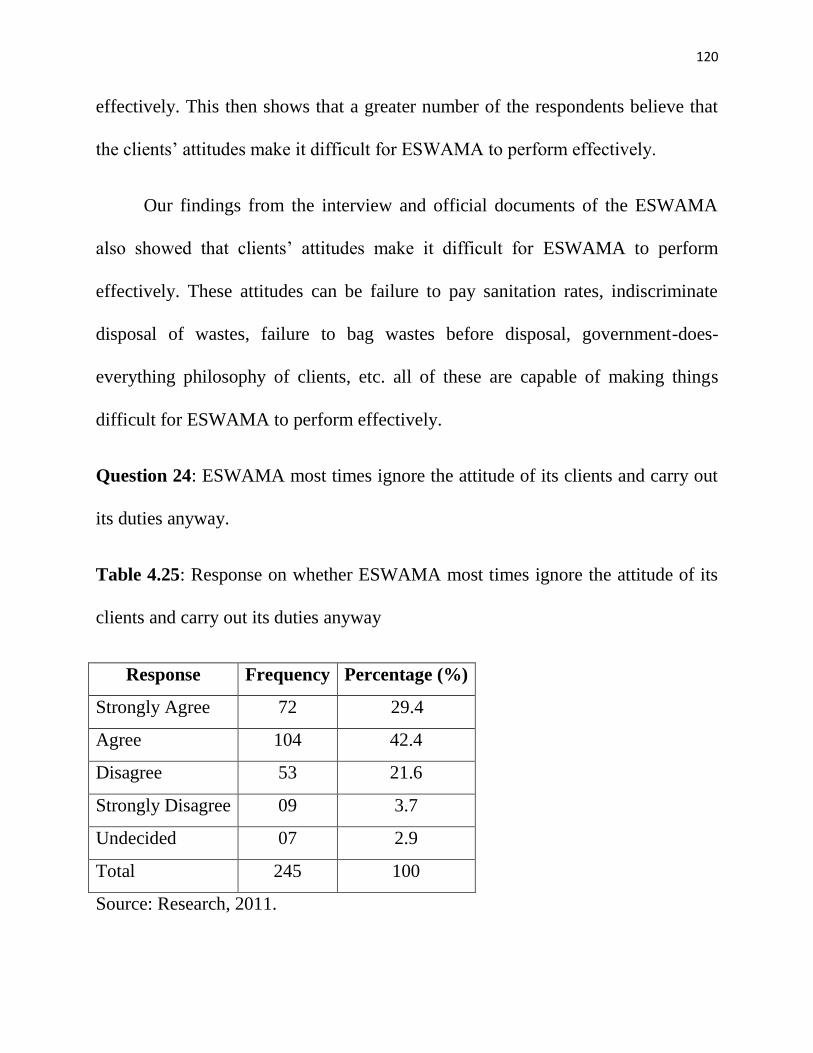
120
effectively. This then shows that a greater number of the respondents believe that
the clients‟ attitudes make it difficult for ESWAMA to perform effectively.
Our findings from the interview and official documents of the ESWAMA
also showed that clients‟ attitudes make it difficult for ESWAMA to perform
effectively. These attitudes can be failure to pay sanitation rates, indiscriminate
disposal of wastes, failure to bag wastes before disposal, government-does-
everything philosophy of clients, etc. all of these are capable of making things
difficult for ESWAMA to perform effectively.
Question 24: ESWAMA most times ignore the attitude of its clients and carry out
its duties anyway.
Table 4.25: Response on whether ESWAMA most times ignore the attitude of its
clients and carry out its duties anyway
Response Frequency Percentage (%)
Strongly Agree 72 29.4
Agree 104 42.4
Disagree 53 21.6
Strongly Disagree 09 3.7
Undecided 07 2.9
Total 245 100
Source: Research, 2011.
121
Analysis:
Table 4.25 above shows that 72 respondents with 29.4% strongly agree that the
ESWAMA most times ignore the attitude of its clients and carry out its duties
anyway; 104 respondents with 42.4% agreed, 53 respondents with 21.6% disagreed, 9
respondents with 3.7% strongly disagreed while 7 respondents were undecided. This
however signifies that majority of the respondents believe that ESWAMA most times
ignore the attitude of its clients and carry out its duties anyway. Our findings from
the official documents of ESWAMA and personal interview also showed that at
times when salaries are not paid and internally generated funds couldn‟t meet up
with the financial needs of the agency, workers still carry out their duties. Again,
despite the frequent indiscriminate disposal of wastes by the clients at dump sites,
ESWAMA is not totally discouraged from carrying out its duties.
4.1.3 TEST OF HYPOTHESIS
Three hypotheses were postulated in the course of this study and they will
now be statistically tested using the Chi-square (X2) method.
The Chi-square method is one of the commonest nonparametric statistical
methods which is used to test the level of significance of data where we have data
that are expressed as frequencies or in terms of percentages. It indicates whether or
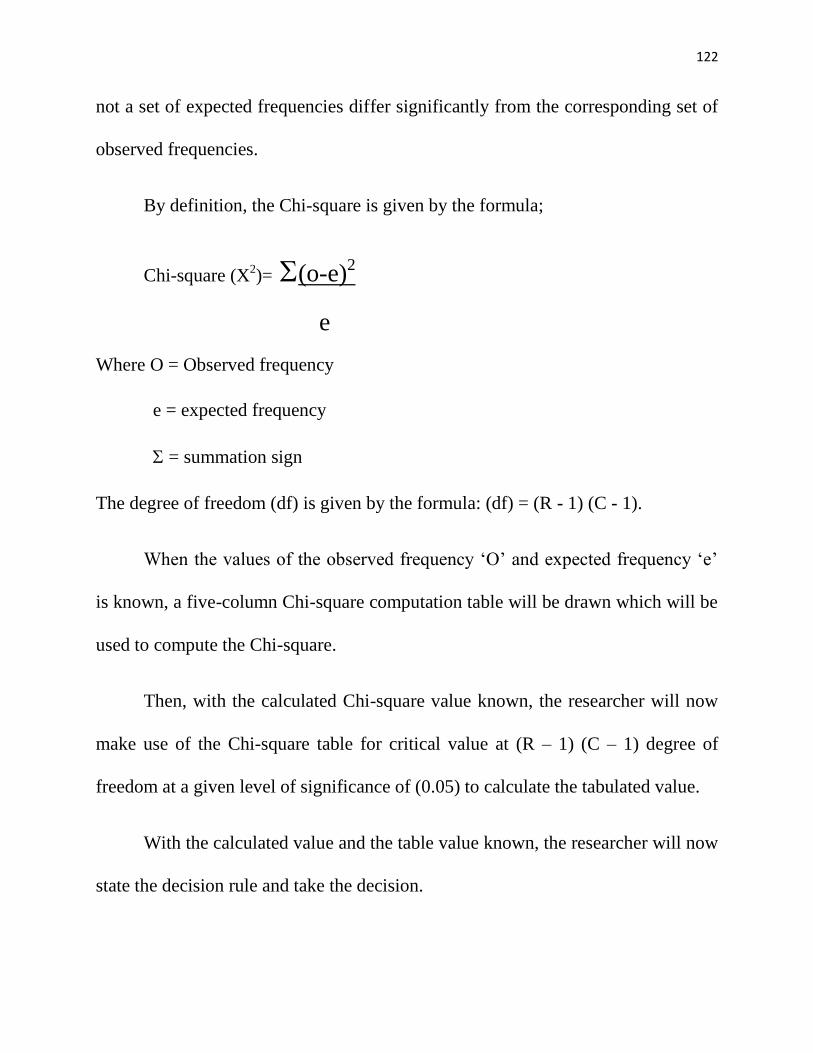
122
not a set of expected frequencies differ significantly from the corresponding set of
observed frequencies.
By definition, the Chi-square is given by the formula;
Chi-square (X2)= (o-e)2
e
Where O = Observed frequency
e = expected frequency
= summation sign
The degree of freedom (df) is given by the formula: (df) = (R - 1) (C - 1).
When the values of the observed frequency „O‟ and expected frequency „e‟
is known, a five-column Chi-square computation table will be drawn which will be
used to compute the Chi-square.
Then, with the calculated Chi-square value known, the researcher will now
make use of the Chi-square table for critical value at (R – 1) (C – 1) degree of
freedom at a given level of significance of (0.05) to calculate the tabulated value.
With the calculated value and the table value known, the researcher will now
state the decision rule and take the decision.
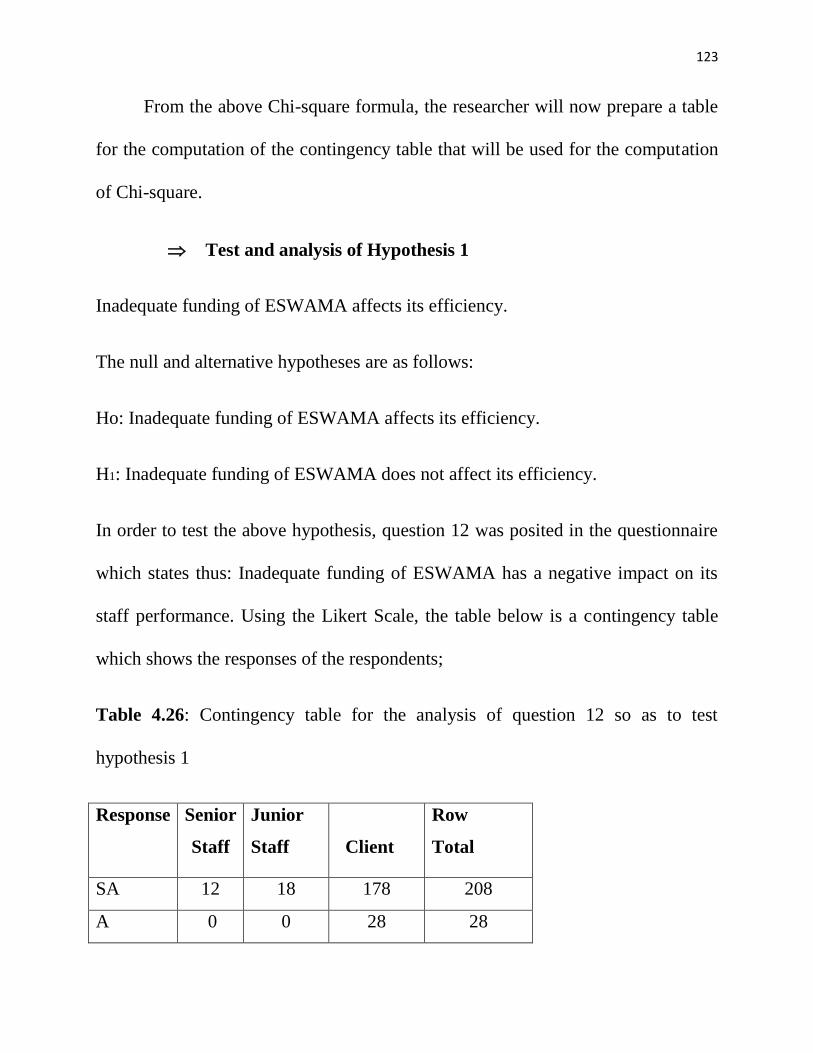
123
From the above Chi-square formula, the researcher will now prepare a table
for the computation of the contingency table that will be used for the computation
of Chi-square.
Test and analysis of Hypothesis 1
Inadequate funding of ESWAMA affects its efficiency.
The null and alternative hypotheses are as follows:
Ho: Inadequate funding of ESWAMA affects its efficiency.
H1: Inadequate funding of ESWAMA does not affect its efficiency.
In order to test the above hypothesis, question 12 was posited in the questionnaire
which states thus: Inadequate funding of ESWAMA has a negative impact on its
staff performance. Using the Likert Scale, the table below is a contingency table
which shows the responses of the respondents;
Table 4.26: Contingency table for the analysis of question 12 so as to test
hypothesis 1
Response Senior
Staff
Junior
Staff
Client
Row
Total
SA 12 18 178 208
A 0 0 28 28
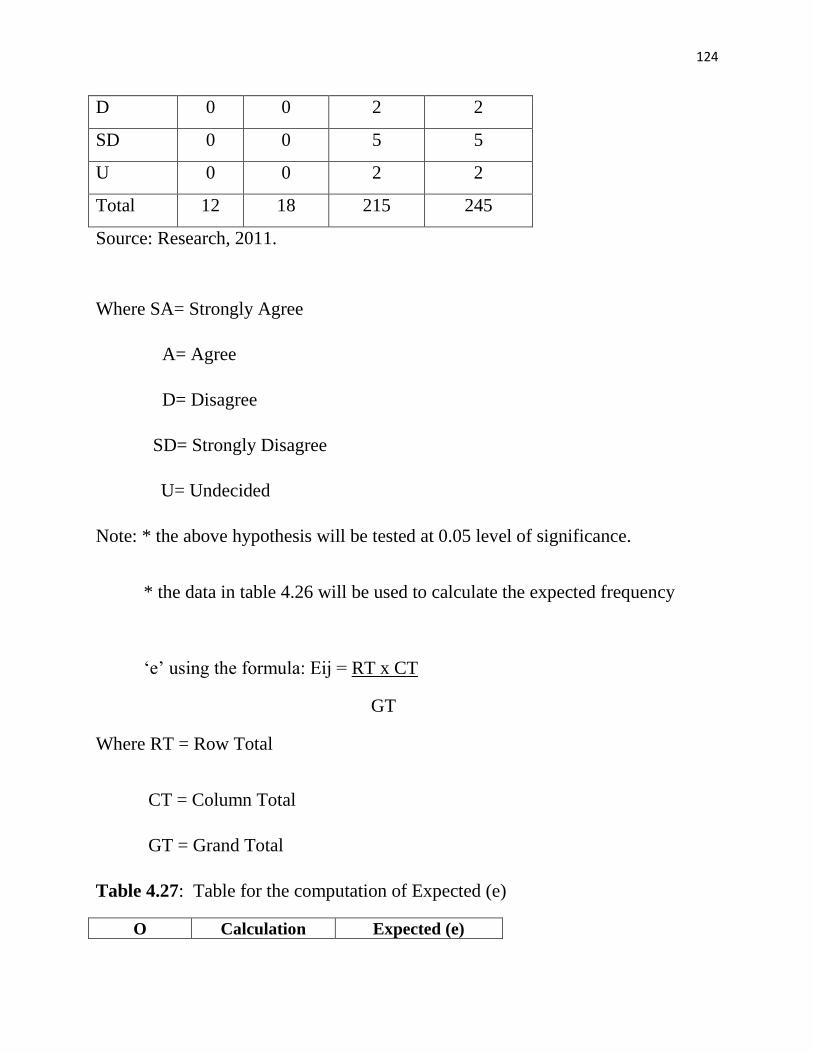
124
D 0 0 2 2
SD 0 0 5 5
U 0 0 2 2
Total 12 18 215 245
Source: Research, 2011.
Where SA= Strongly Agree
A= Agree
D= Disagree
SD= Strongly Disagree
U= Undecided
Note: * the above hypothesis will be tested at 0.05 level of significance.
* the data in table 4.26 will be used to calculate the expected frequency
„e‟ using the formula: Eij = RT x CT
GT
Where RT = Row Total
CT = Column Total
GT = Grand Total
Table 4.27: Table for the computation of Expected (e)
O Calculation Expected (e)
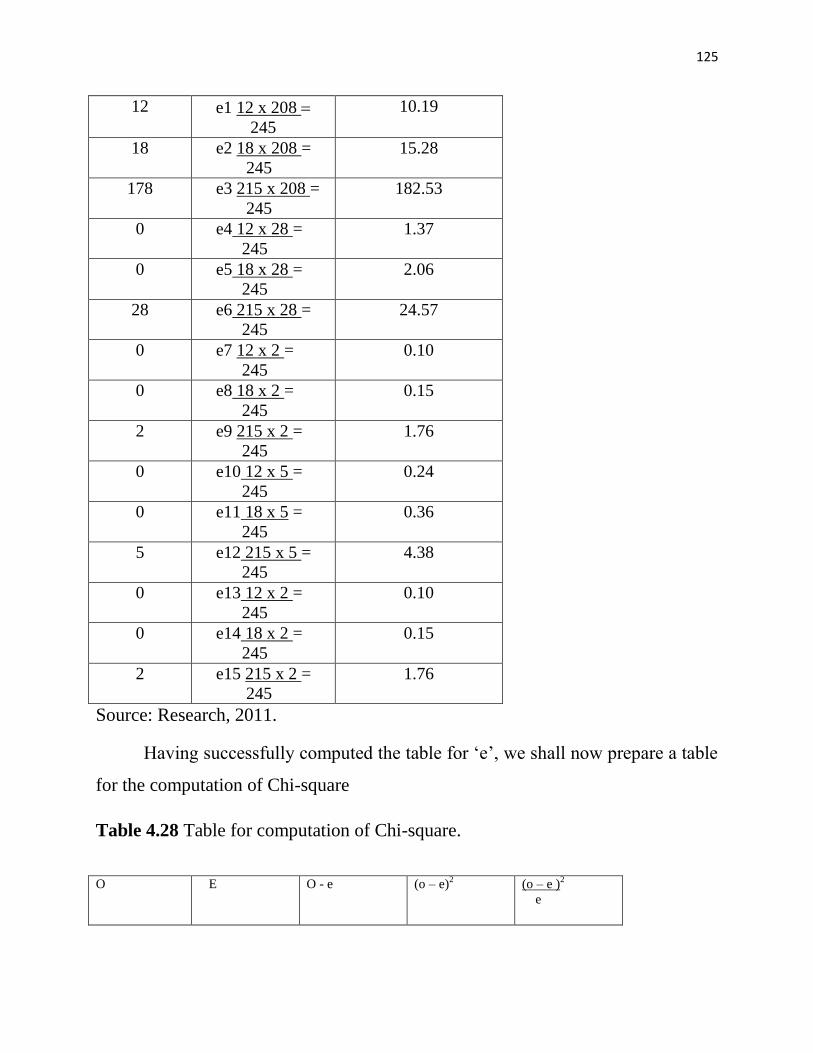
125
12 e1 12 x 208
245
10.19
18 e2 18 x 208 =
245
15.28
178 e3 215 x 208 =
245
182.53
0 e4 12 x 28 =
245
1.37
0 e5 18 x 28 =
245
2.06
28 e6 215 x 28 =
245
24.57
0 e7 12 x 2 =
245
0.10
0 e8 18 x 2 =
245
0.15
2 e9 215 x 2 =
245
1.76
0 e10 12 x 5 =
245
0.24
0 e11 18 x 5 =
245
0.36
5 e12 215 x 5 =
245
4.38
0 e13 12 x 2 =
245
0.10
0 e14 18 x 2 =
245
0.15
2 e15 215 x 2 =
245
1.76
Source: Research, 2011.
Having successfully computed the table for „e‟, we shall now prepare a table
for the computation of Chi-square
Table 4.28 Table for computation of Chi-square.
O E O - e (o – e)2 (o – e )
2
e
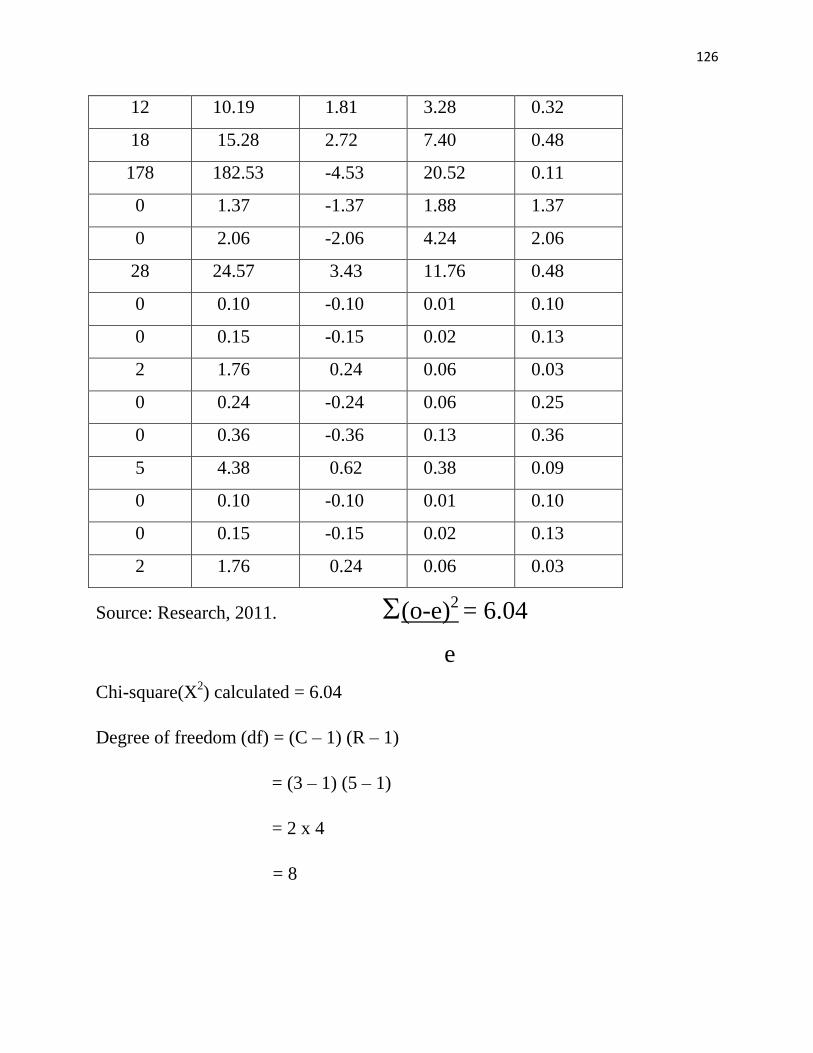
126
12 10.19 1.81 3.28 0.32
18 15.28 2.72 7.40 0.48
178 182.53 -4.53 20.52 0.11
0 1.37 -1.37 1.88 1.37
0 2.06 -2.06 4.24 2.06
28 24.57 3.43 11.76 0.48
0 0.10 -0.10 0.01 0.10
0 0.15 -0.15 0.02 0.13
2 1.76 0.24 0.06 0.03
0 0.24 -0.24 0.06 0.25
0 0.36 -0.36 0.13 0.36
5 4.38 0.62 0.38 0.09
0 0.10 -0.10 0.01 0.10
0 0.15 -0.15 0.02 0.13
2 1.76 0.24 0.06 0.03
Source: Research, 2011. (o-e)2 = 6.04
e
Chi-square(X2) calculated = 6.04
Degree of freedom (df) = (C – 1) (R – 1)
= (3 – 1) (5 – 1)
= 2 x 4
= 8
127
As earlier stated, level of significance () = 0.05 and with the degree of freedom of
8, the researcher will now refer to the table of sampling distribution Chi-square for
8 df at 0.05 level of significance.
The critical Chi-square value for 8 df and 0.05 level of significance is 15.51. With
the Chi-square calculated and Chi-square tabulated known, we now take the
decision rule.
Decision Rule:
Reject Ho, if Chi-square calculated is (greater than) Chi-square table value and
accept Ho if otherwise.
Conclusion:
Chi-square (X2) calculated = 6.04
Chi-square (X2) tabulated = 15.51.
Therefore, Ho is accepted because (X2) calculated is < (less than) (X
2) tabulated
which is 15.51.
Implication:
The implication of this result is that the null hypothesis (H0) was upheld,
which states that inadequate funding of ESWAMA affects its efficiency.
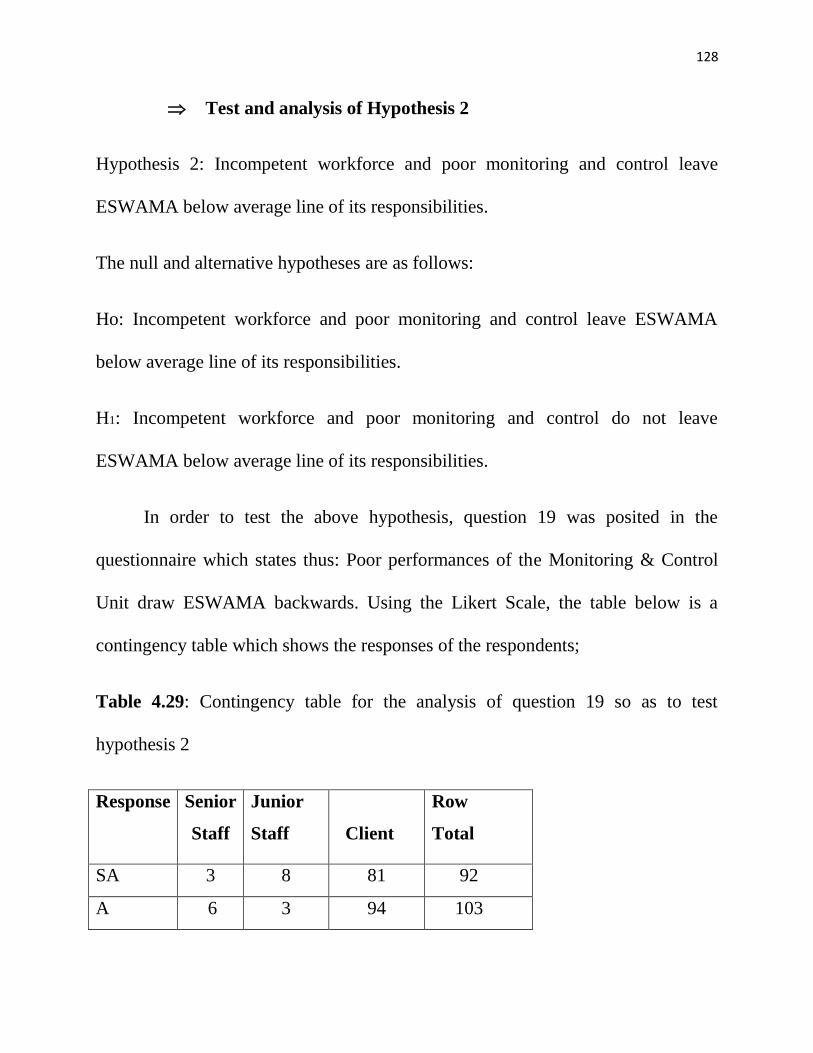
128
Test and analysis of Hypothesis 2
Hypothesis 2: Incompetent workforce and poor monitoring and control leave
ESWAMA below average line of its responsibilities.
The null and alternative hypotheses are as follows:
Ho: Incompetent workforce and poor monitoring and control leave ESWAMA
below average line of its responsibilities.
H1: Incompetent workforce and poor monitoring and control do not leave
ESWAMA below average line of its responsibilities.
In order to test the above hypothesis, question 19 was posited in the
questionnaire which states thus: Poor performances of the Monitoring & Control
Unit draw ESWAMA backwards. Using the Likert Scale, the table below is a
contingency table which shows the responses of the respondents;
Table 4.29: Contingency table for the analysis of question 19 so as to test
hypothesis 2
Response Senior
Staff
Junior
Staff
Client
Row
Total
SA 3 8 81 92
A 6 3 94 103
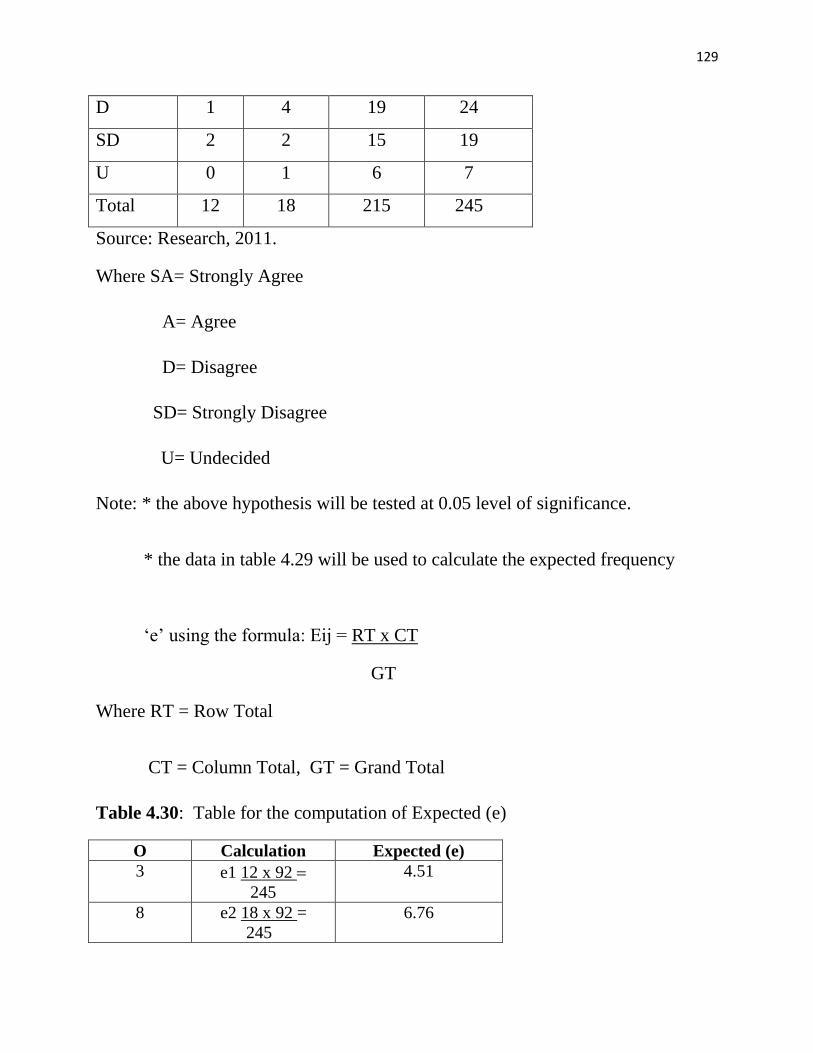
129
D 1 4 19 24
SD 2 2 15 19
U 0 1 6 7
Total 12 18 215 245
Source: Research, 2011.
Where SA= Strongly Agree
A= Agree
D= Disagree
SD= Strongly Disagree
U= Undecided
Note: * the above hypothesis will be tested at 0.05 level of significance.
* the data in table 4.29 will be used to calculate the expected frequency
„e‟ using the formula: Eij = RT x CT
GT
Where RT = Row Total
CT = Column Total, GT = Grand Total
Table 4.30: Table for the computation of Expected (e)
O Calculation Expected (e)
3 e1 12 x 92
245
4.51
8 e2 18 x 92 =
245
6.76
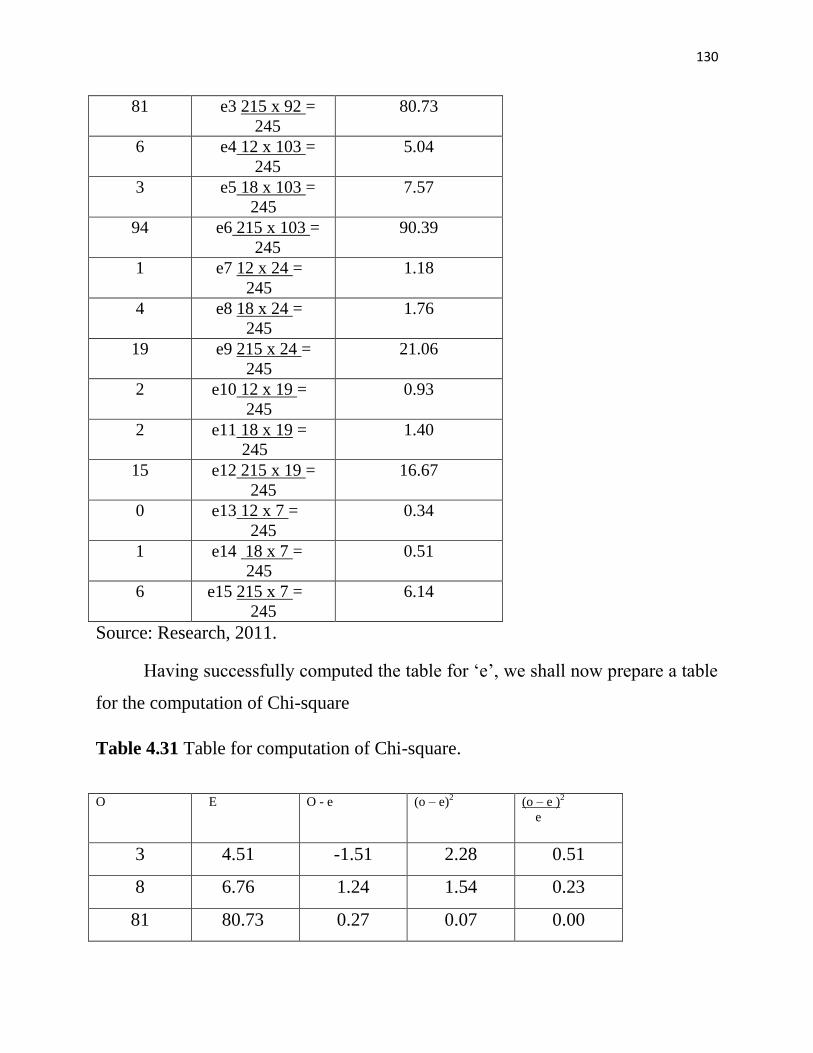
130
81 e3 215 x 92 =
245
80.73
6 e4 12 x 103 =
245
5.04
3 e5 18 x 103 =
245
7.57
94 e6 215 x 103 =
245
90.39
1 e7 12 x 24 =
245
1.18
4 e8 18 x 24 =
245
1.76
19 e9 215 x 24 =
245
21.06
2 e10 12 x 19 =
245
0.93
2 e11 18 x 19 =
245
1.40
15 e12 215 x 19 =
245
16.67
0 e13 12 x 7 =
245
0.34
1 e14 18 x 7 =
245
0.51
6 e15 215 x 7 =
245
6.14
Source: Research, 2011.
Having successfully computed the table for „e‟, we shall now prepare a table
for the computation of Chi-square
Table 4.31 Table for computation of Chi-square.
O E O - e (o – e)2 (o – e )
2
e
3 4.51 -1.51 2.28 0.51
8 6.76 1.24 1.54 0.23
81 80.73 0.27 0.07 0.00
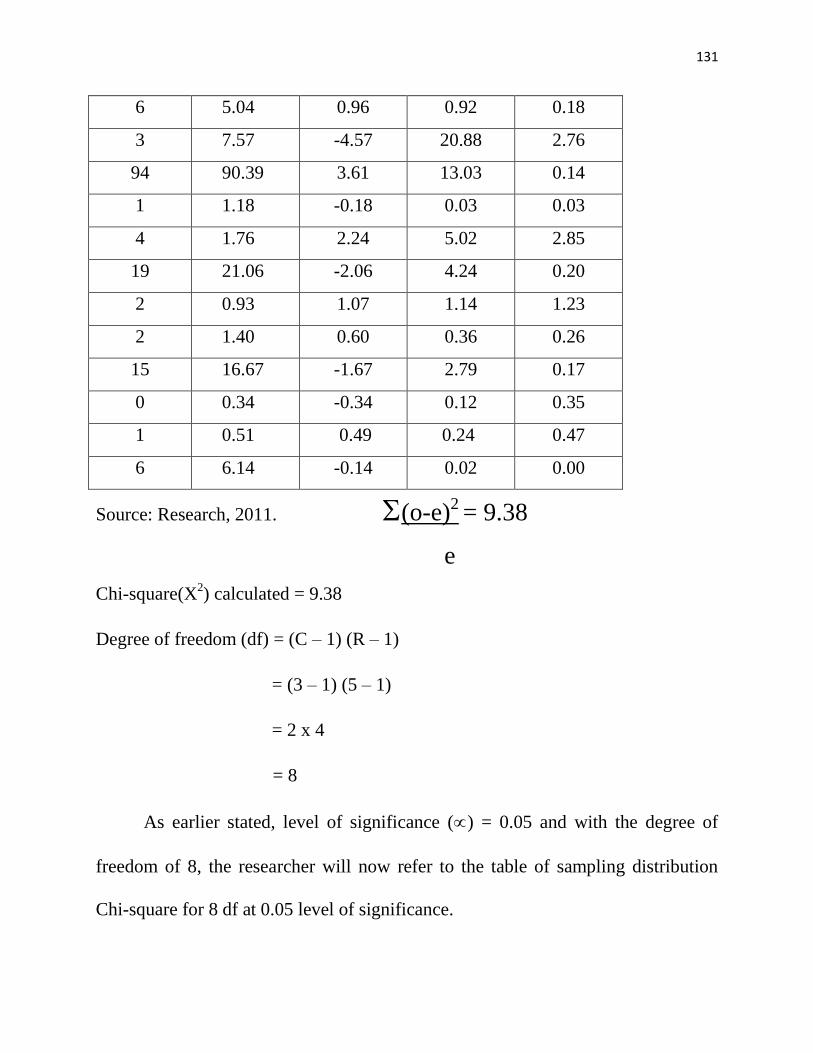
131
6 5.04 0.96 0.92 0.18
3 7.57 -4.57 20.88 2.76
94 90.39 3.61 13.03 0.14
1 1.18 -0.18 0.03 0.03
4 1.76 2.24 5.02 2.85
19 21.06 -2.06 4.24 0.20
2 0.93 1.07 1.14 1.23
2 1.40 0.60 0.36 0.26
15 16.67 -1.67 2.79 0.17
0 0.34 -0.34 0.12 0.35
1 0.51 0.49 0.24 0.47
6 6.14 -0.14 0.02 0.00
Source: Research, 2011. (o-e)2 = 9.38
e
Chi-square(X2) calculated = 9.38
Degree of freedom (df) = (C – 1) (R – 1)
= (3 – 1) (5 – 1)
= 2 x 4
= 8
As earlier stated, level of significance () = 0.05 and with the degree of
freedom of 8, the researcher will now refer to the table of sampling distribution
Chi-square for 8 df at 0.05 level of significance.
132
The critical Chi-square value for 8 df and 0.05 level of significance is 15.51. With
the Chi-square calculated and Chi-square tabulated known, we now take the
decision rule.
Decision Rule:
Reject Ho, if Chi-square calculated is (greater than) Chi-square table value and
accept Ho if otherwise.
Conclusion:
Chi-square (X2) calculated = 9.38
Chi-square (X2) tabulated = 15.51.
Therefore, Ho is accepted because (X2) calculated is < (less than) (X
2) tabulated
which is 15.51.
Implication:
The implication of this result is that the null hypothesis (H0) was upheld,
which states incompetent workforce and poor monitoring and control leave
ESWAMA below average line of its responsibilities.
Test and analysis of Hypothesis 3
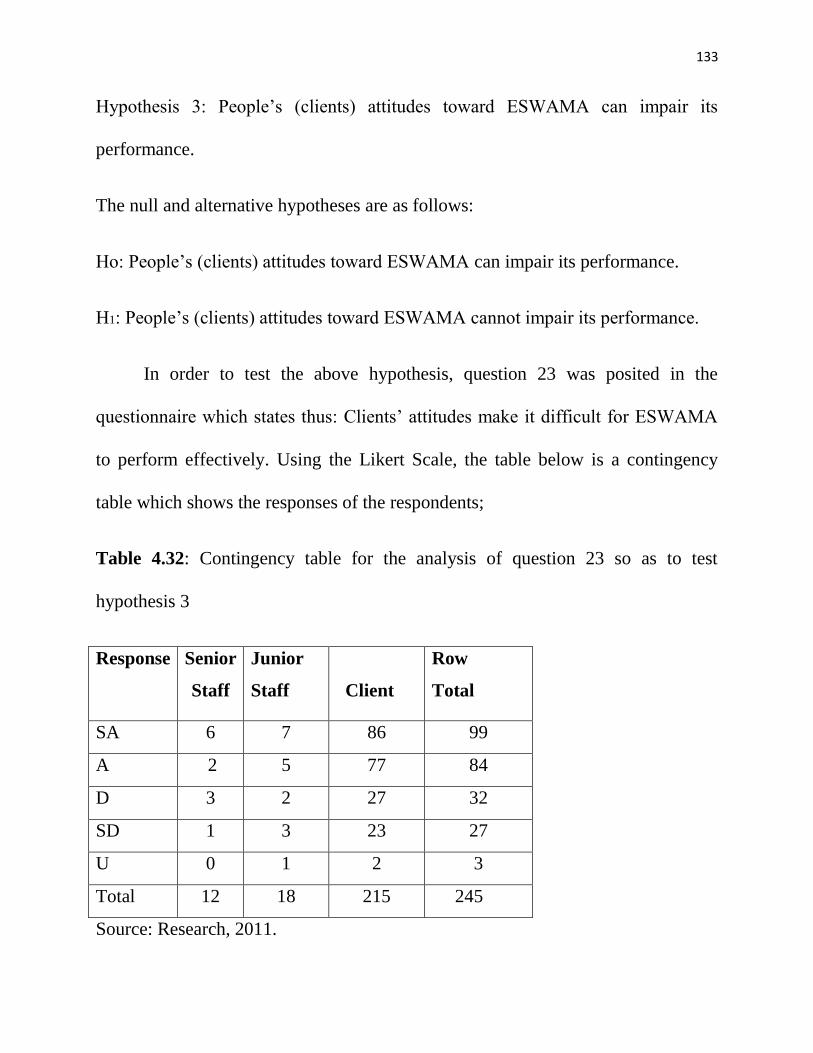
133
Hypothesis 3: People‟s (clients) attitudes toward ESWAMA can impair its
performance.
The null and alternative hypotheses are as follows:
Ho: People‟s (clients) attitudes toward ESWAMA can impair its performance.
H1: People‟s (clients) attitudes toward ESWAMA cannot impair its performance.
In order to test the above hypothesis, question 23 was posited in the
questionnaire which states thus: Clients‟ attitudes make it difficult for ESWAMA
to perform effectively. Using the Likert Scale, the table below is a contingency
table which shows the responses of the respondents;
Table 4.32: Contingency table for the analysis of question 23 so as to test
hypothesis 3
Response Senior
Staff
Junior
Staff
Client
Row
Total
SA 6 7 86 99
A 2 5 77 84
D 3 2 27 32
SD 1 3 23 27
U 0 1 2 3
Total 12 18 215 245
Source: Research, 2011.
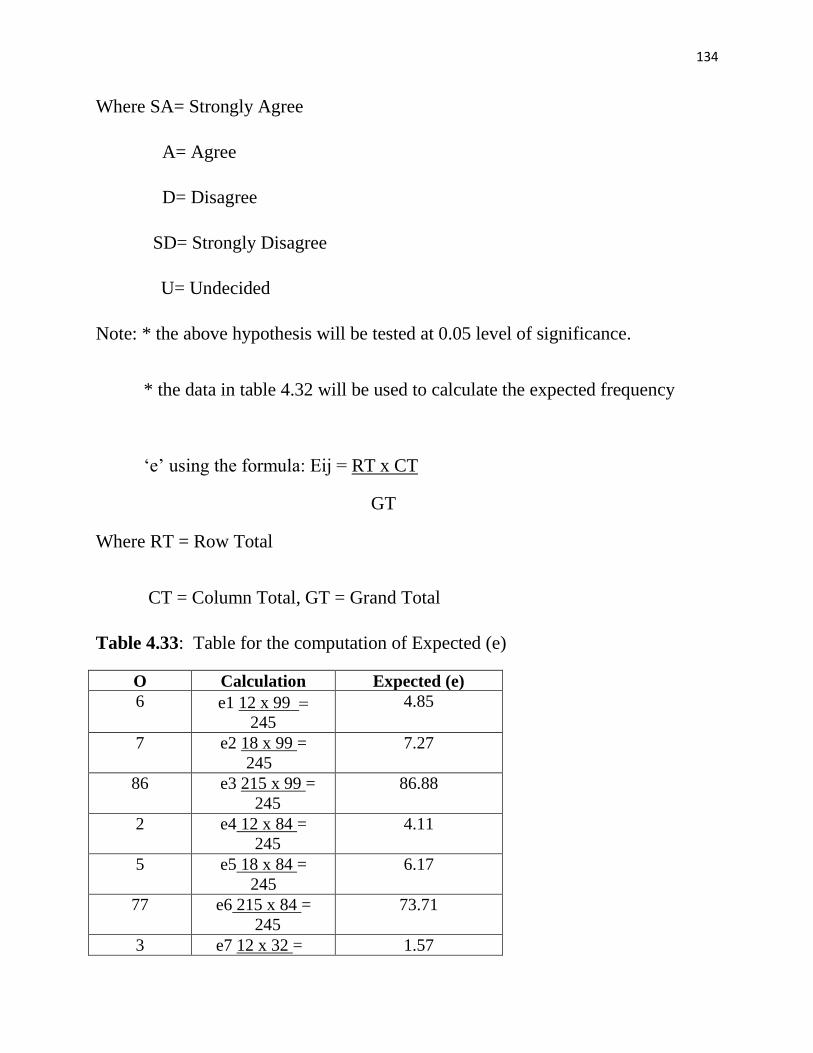
134
Where SA= Strongly Agree
A= Agree
D= Disagree
SD= Strongly Disagree
U= Undecided
Note: * the above hypothesis will be tested at 0.05 level of significance.
* the data in table 4.32 will be used to calculate the expected frequency
„e‟ using the formula: Eij = RT x CT
GT
Where RT = Row Total
CT = Column Total, GT = Grand Total
Table 4.33: Table for the computation of Expected (e)
O Calculation Expected (e)
6 e1 12 x 99
245
4.85
7 e2 18 x 99 =
245
7.27
86 e3 215 x 99 =
245
86.88
2 e4 12 x 84 =
245
4.11
5 e5 18 x 84 =
245
6.17
77 e6 215 x 84 =
245
73.71
3 e7 12 x 32 = 1.57
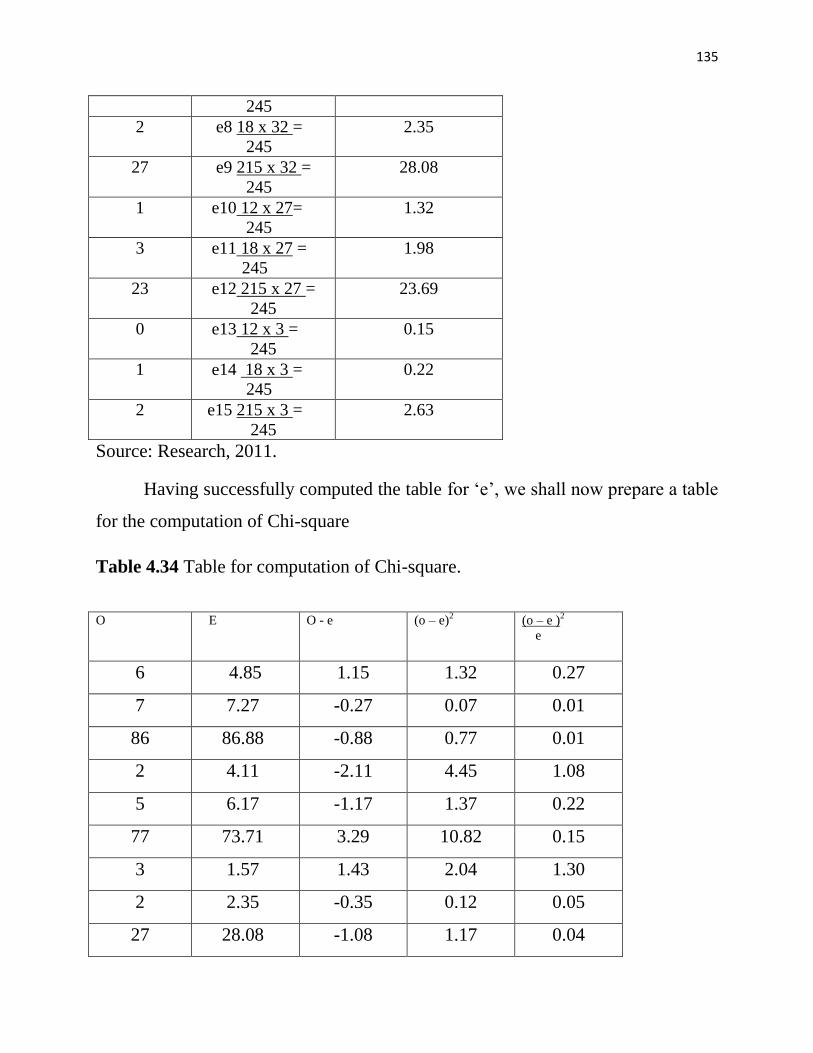
135
245
2 e8 18 x 32 =
245
2.35
27 e9 215 x 32 =
245
28.08
1 e10 12 x 27=
245
1.32
3 e11 18 x 27 =
245
1.98
23 e12 215 x 27 =
245
23.69
0 e13 12 x 3 =
245
0.15
1 e14 18 x 3 =
245
0.22
2 e15 215 x 3 =
245
2.63
Source: Research, 2011.
Having successfully computed the table for „e‟, we shall now prepare a table
for the computation of Chi-square
Table 4.34 Table for computation of Chi-square.
O E O - e (o – e)2 (o – e )
2
e
6 4.85 1.15 1.32 0.27
7 7.27 -0.27 0.07 0.01
86 86.88 -0.88 0.77 0.01
2 4.11 -2.11 4.45 1.08
5 6.17 -1.17 1.37 0.22
77 73.71 3.29 10.82 0.15
3 1.57 1.43 2.04 1.30
2 2.35 -0.35 0.12 0.05
27 28.08 -1.08 1.17 0.04
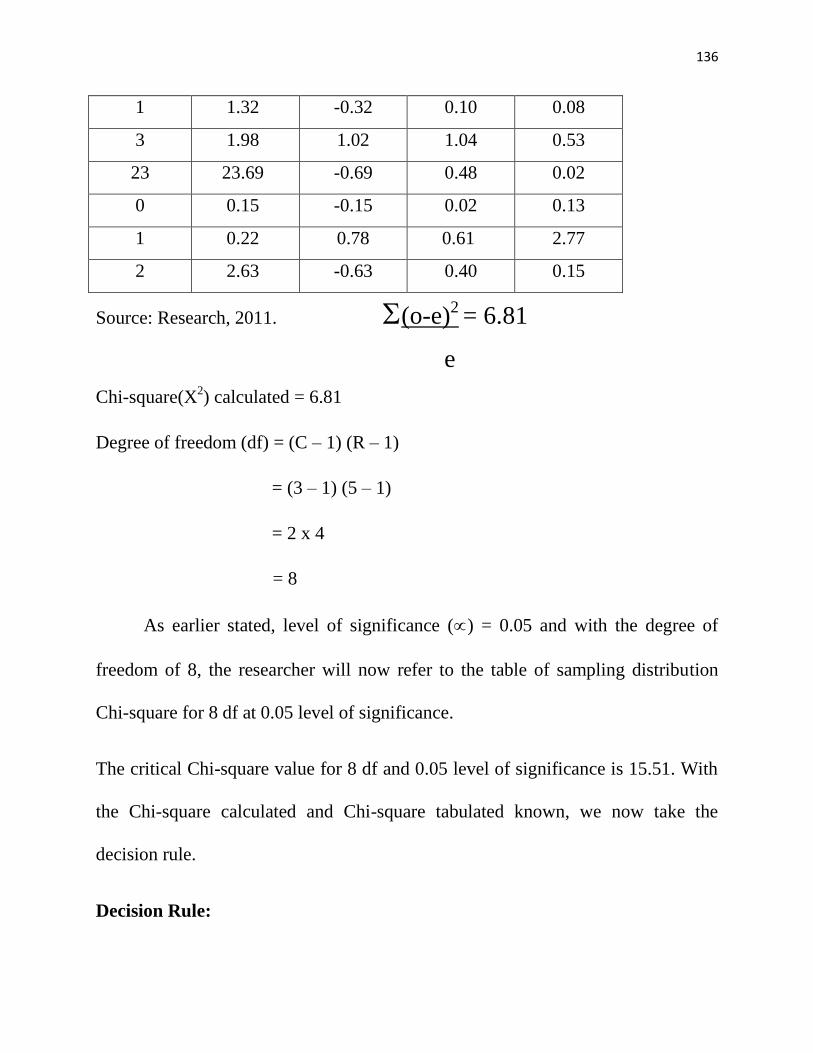
136
1 1.32 -0.32 0.10 0.08
3 1.98 1.02 1.04 0.53
23 23.69 -0.69 0.48 0.02
0 0.15 -0.15 0.02 0.13
1 0.22 0.78 0.61 2.77
2 2.63 -0.63 0.40 0.15
Source: Research, 2011. (o-e)2 = 6.81
e
Chi-square(X2) calculated = 6.81
Degree of freedom (df) = (C – 1) (R – 1)
= (3 – 1) (5 – 1)
= 2 x 4
= 8
As earlier stated, level of significance () = 0.05 and with the degree of
freedom of 8, the researcher will now refer to the table of sampling distribution
Chi-square for 8 df at 0.05 level of significance.
The critical Chi-square value for 8 df and 0.05 level of significance is 15.51. With
the Chi-square calculated and Chi-square tabulated known, we now take the
decision rule.
Decision Rule:
137
Reject Ho, if Chi-square calculated is (greater than) Chi-square table value and
accept Ho if otherwise.
Conclusion:
Chi-square (X2) calculated = 6.81
Chi-square (X2) tabulated = 15.51.
Therefore, Ho is accepted because (X2) calculated is < (less than) (X
2) tabulated
which is 15.51.
Implication:
The implication of this result is that the null hypothesis (H0) was upheld,
which states that people‟s (clients) attitudes toward ESWAMA can impair its
performance.
4.2 FINDINGS
Every good research work looks forward to obtaining valid results. In
chapter two of this work, three hypotheses were posited with a view to
investigating problems of waste management in Enugu State, the Enugu State
Waste Management Authority (ESWAMA) as a case study.
Our first hypothesis was aimed at investigating whether inadequate funding
of ESWAMA affects its efficiency. After the statistical testing and analysis of the
138
research question posited for this hypothesis using the Chi-square method, it was
discovered that inadequate funding of ESWAMA affects its efficiency. In order to
ensure that the result from the statistical testing was accurate, we compared the
results with our findings from other sources of data collection. Results generated
from the official documents, personal interview and materials from text books
depicts that inadequate funding of ESWAMA affects its efficiency. These results
signified that inadequate funding of ESWAMA tends to reduce virtually all the
intensive capable of motivating workers into performing better or carrying out their
duties effectively. When workers are not paid good enough, vehicles for
transporting wastes are immobilized, working environment tends to be boring and
unproductive. At such situations, ESWAMA‟s staff is seen discussing in groups or
reading papers in offices and under trees.
Again, our second hypothesis which states that incompetent workforce and
poor monitoring and control leave ESWAMA below average line of its
responsibilities, was statistically tested and analyzed. After the analysis using the
Chi-square method, it was discovered that incompetent workforce and poor
monitoring and control leave ESWAMA below average line of its responsibilities.
In order to test the accuracy of this result, we compared this result with our
findings from the field work. Our findings from the interview conducted and
relevant materials from text books however, showed that incompetent workforce
139
and poor monitoring and control leave ESWAMA below average line of its
responsibilities. This is due to the fact that the junior staff of ESWAMA virtually
carries out all the waste management activities and participate less in the training
and re-training exercises that go on at ESWAMA. The situation has led to a high
rate of incompetency; which has characterized the monitoring and control unit of
ESWAMA and had resulted in high records of evaders, court cases between the
agency and its clients, etc. This has led ESWAMA into generating lesser revenue
than it used to and spent more on lawyers and court charges for cases between the
agency and its clients.
The third hypothesis which states that peoples (clients) attitudes toward
ESWAMA can impair its performance was statistically tested and analyzed.
Comparing this result with our findings from text book materials, interview and
official documents of ESWAMA, we discovered that peoples (clients) attitudes
toward ESWAMA can impair its performance. These attitudes can be failure to pay
sanitation rates, indiscriminate disposal of wastes, failure to bag wastes before
disposal, government-does-everything philosophy of clients, etc. all of these are
capable of making things difficult for ESWAMA to perform effectively.
From the investigations conducted using the questionnaire, the following
findings were observed:
140
ESWAMA is being funded by the state government. Majority of the
responses from the questionnaire agreed that ESWAMA is being
funded by the state government but the researcher has a different view
on this issue considering the information generated during the field
work (where the researcher interviewed some of the respondents). The
staff of ESWAMA interviewed made it clear that the State
Government only supplements the fund of the Authority by less than
20% of the total revenue available for ESWAMA. This therefore,
made the researcher to disagree with the majority view.
The funds are always available for ESWAMA to utilize. Majority of
the respondents agreed that the funds are always available for
ESWAMA to utilize. But considering the findings from personal
interview and official documents of ESWAMA, the researcher
discovered that in as much as the supplementary fund from the State
Government to ESWAMA is of lower rate (below 20%), the funds are
not frequently available for accessibility. This is true as the monthly
supplementary fund/grant, sometimes, spills over the subsequent
months and affects its accessibility for the purpose it was meant for
that particular month or period.
141
ESWAMA also generates internal revenue to augment the fund from
the government. Our findings from the interview conducted and the
official documents of ESWAMA affirms the response from majority
of our respondents which states that ESWAMA also generates internal
revenue to augment the fund from the government. Worthy to note is
that the findings showed that ESWAMA‟s main source of fund is
from the internally generated revenue using the instrument of
“Sanitation rate” payable by the clients annually.
These funds it receives and generates are adequate to enable
ESWAMA carry out its duties effectively. Majority of our
respondents agreed that the funds ESWAMA receives and generates
are not adequate to enable ESWAMA carry out its duties effectively.
The findings during field work support the response from majority of
our respondents. The findings signified that the clients of ESWAMA
evade paying sanitation rates and as such hinders ESWAMA from
carrying out its duties effectively.
Inconsistent funding of ESWAMA can hinder its waste management
responsibilities. However, results generated from the official
documents, personal interview and materials from text books shows
that when funding fluctuates, it can hinder ESWAMA‟s waste
142
management activities or responsibility. These results signified that
when funding (such as State government‟s grant and sanitation rates)
is inconsistent, evacuation and transportation of wastes from waste
dumps, maintenance of equipment and payment of worker‟s salaries
suffer which in turn hinder ESWAMA from carrying out its waste
management responsibilities.
Inadequate funding of ESWAMA has a negative impact on its staff
performance. Information generated from our findings during the field
work however, supports the views of our respondents. Facts from the
official documents of ESWAMA and some materials gotten from text
books and the website write ups on ESWAMA depict that inadequate
funding of ESWAMA has a negative impact on its staff performance.
This is true because inadequate funding of ESWAMA tends to reduce
virtually all the intensive capable of motivating workers into
performing better or carrying out their duties effectively. When
workers are not paid good enough, vehicles for transporting wastes
are immobilized, working environment tends to be boring and
unproductive. At such situations, ESWAMA‟s staff is seen discussing
in groups or reading papers in offices and under trees.
143
ESWAMA has a competent workforce that can meet up with the
challenges of waste management. Considering the researcher‟s
findings from the official documents of the company and also during
the interview, it was confirmed that ESWAMA has does not have a
competent workforce that can meet up with the challenges of waste
management. Facts on ground showed that recruitment into the
workforce of ESWAMA was not based on merit, transparency and
equal opportunity but on private relationship with the top state
government officials. This mode of recruitment tends to produce
workforce with little or no expertise in waste management. Again,
there are just a few sanitation and environment Engineers in Nigeria.
In fact most private sector operators in waste management are mainly
party stalwarts; know little or nothing about waste management.
ESWAMA can boast of a functional monitoring & control unit in its
organization. The results generated from our findings during the field
work signified that ESWAMA has a functional monitoring & control
unit that operates on daily basis. According to the Managing Director
of ESWAMA, Mrs. Chinyere Ogakwu, ESWAMA‟s monitoring and
control unit moves round the metropolis and environs twice daily
(morning and evening) to monitor waste disposal and evacuation.
144
ESWAMA‟s staff undergoes series of training and re-training
consistently. Despite the glaring fact that majority of our respondents
agreed that ESWAMA‟s staff undergoes series of training and re-
training consistently, findings from the interview conducted by the
researcher apparently signified that ESWAMA does carry out training
and re-training of its staff but such training and re-training exercise
does not come up regularly. At times when training exercises are
conducted at ESWAMA, the eligible participants are only the senior
staff. It was learnt that most waste management activities (like waste
disposal, evacuation, handling, etc) are carried out by the junior staff
of ESWAMA whom we learnt doesn‟t participate both in within and
outside training.
This enables them to carry out their duties diligently and consistently.
Our finding does not support the views of the majority of the
respondents that the series of training and re-training of ESWAMA‟s
staff enables them to carry out their duties diligently and consistently.
Having stated earlier in this work (at the analysis under Table 4.16)
that most of the training included only the senior staff and excluded
the junior staff; and that the junior staff virtually does the bulk of the
waste management activities at ESWAMA, we can assume that the
145
series of training and re-training of staff of ESWAMA has no impact
on the agency‟s discharging of its duties diligently and consistently
since the trained does less while the untrained does what he doesn‟t
really understand well.
Technically, staff of ESWAMA displays expertise in discharging their
duties. Based on the results generated from the interview and the also
the official documents of ESWAMA, it was discovered that staff of
the monitoring and control unit harass and abuse defaulters
(ESWAMA‟s clients). Crimes committed by these defaulters include:
failure to bag waste before disposal, failure to have the approved
customized waste bin, failure to pay the yearly sanitation rate and
disposing of wastes outside the dumpster. Again, during evacuation
and transportation of wastes from dump sites, it was discovered that
ESWAMA‟s staff do not evacuate all waste but always leave scattered
waste around and as the waste vehicle moves; drops of wastes litter
the routes the vehicle takes.
The responsibilities of ESWAMA suffer due to the absence of
professional staffs. By implication, the majority of our respondents
are of the view that the responsibilities of ESWAMA suffer due to the
absence of professional staff. This signifies that waste management
146
requires professionals or experts in the field of waste management to
meet up with the responsibility of waste management. Our findings
from the interview conducted and relevant materials from text books
however, showed that the responsibilities of ESWAMA does not
suffer solely due to the absence of professional staff but other factors
combined to affect the agency performance. It is a fact that ESWAMA
has no professional waste management Engineer but the agency
believes that it has trained waste managers who can perform like the
professionals and that professionalism is its least problem.
Poor performances of the Monitoring & Control Unit draw ESWAMA
backwards. A greater number of the respondents upheld the view that
poor performances of the Monitoring & Control Unit ESWAMA it
backwards. Our findings from website materials, interview and
official documents of the agency supports the views of the
respondents. This is because incompetency; which has characterized
the monitoring and control unit of ESWAMA had resulted in high
records of evaders, court cases between the agency and its clients, etc.
This has led ESWAMA into generating lesser revenue than it used to
and spent more on lawyers and court charges.
147
Clients are aware of their obligations to ESWAMA. 189 of the
respondents with 77.1% strongly agreed that clients are aware of their
obligations to ESWAMA; 43 of them agreed, 8 respondents with
3.3% disagreed, also 5 respondents with 2% strongly disagreed while
no respondent was undecided. This implies that majority of clients are
aware of their obligation to ESWAMA. Our findings through personal
interview show that ESWAMA employs the use of the mass media
(television, radio, etc), handbills and town criers methods to sensitized
its clients on their obligations to it.
And they do keep to their obligations to ESWAMA. Despite the fact
that the majority of the respondents believe that clients do not keep to
their obligations to ESWAMA, our findings during the field work
showed that there is an improvement, from the clients side, on
bagging of waste and payment of sanitation rates in the late quarter of
the year 2010.
As a result, there is a cordial relationship between ESWAMA and its
clients. This again shows that majority of the respondents believe that
the relationship between ESWAMA and its clients is not cordial.
However, our findings showed that the situation cannot be
unconnected from the apathy behaviour of the clients towards the
148
government‟s venture. Naturally, clients tend to evade paying rates to
government or its agencies. Therefore, anyone in government uniform
automatically becomes a perceived enemy; coming to take from the
little portion clients have.
Clients‟ attitudes make it difficult for ESWAMA to perform
effectively. Our findings from the interview and official documents of
the ESWAMA also showed that clients‟ attitudes make it difficult for
ESWAMA to perform effectively. These attitudes can be failure to
pay sanitation rates, indiscriminate disposal of wastes, failure to bag
wastes before disposal, government-does-everything philosophy of
clients, etc. all of these are capable of making things difficult for
ESWAMA to perform effectively.
ESWAMA most times ignore the attitude of its clients and carry out
its duties anyway. Majority of the respondents believe that ESWAMA
most times ignore the attitude of its clients and carry out its duties
anyway. Our findings from the official documents of ESWAMA and
personal interview also showed that at times when salaries are not
paid and internally generated funds couldn‟t meet up with the
financial needs of the agency, workers still carry out their duties.
Again, despite the frequent indiscriminate disposal of wastes by the
149
clients at dump sites, ESWAMA is not totally discouraged from
carrying out its duties.
4.3 IMPLICATIONS OF RESULTS AND FINDINGS
The implications of these results and findings are as follows:
Since the supplementary fund from the State Government to ESWAMA is of
lower rate (below 20%), and the funds are not frequently available for
accessibility; the funds ESWAMA receives and generates are not adequate
to enable ESWAMA carry out its duties effectively as most clients evade
paying sanitation rates, we can rightly affirm that inadequate funding of
ESWAMA affects its efficiency to the extent that evacuation and
transportation of wastes from waste dumps, maintenance of equipment and
payment of worker‟s salaries suffer which in turn hinder ESWAMA from
carrying out its waste management responsibilities.
Though ESWAMA do carry out training and re-training of its staff, such
training and re-training exercises do not come up regularly (about three
times since 2004). At times when training exercises are conducted at
ESWAMA, the eligible participants are only the senior staff. It was learnt
that most waste management activities (like waste disposal, evacuation,
handling, etc) are carried out by the junior staff of ESWAMA whom we
150
learnt do not participate both in within and outside training. Going by the
fact that the majority of our respondents are of the view that the
responsibilities of ESWAMA suffer due to the absence of professional staff;
which by implication signifies that waste management requires professionals
or experts in the field of waste management to meet up with the
responsibilities of waste management, waste management in Enugu State
will continue to encounter problem(s) since it is a fact that ESWAMA has no
professional waste management Engineer but believes that it has trained
waste managers who can perform like the professionals and that
professionalism is its least problem. We can then say that the status of
professional training and re-training at ESWAMA is highly low.
Although there have been some improvement from the clients of ESWAMA,
findings showed that clients‟ attitudes make it difficult for ESWAMA to
perform effectively. These attitudes can be failure to pay sanitation rates,
indiscriminate disposal of wastes, failure to bag wastes before disposal,
government-does-everything philosophy of clients (most clients would take
to the easy way of depositing waste along the highway and corners of street
for “government” to pick up) etc. all of these have negative impact on
ESWAMA and had resulted into shortages of expected amount of the
151
internally generated funds, misallocation of generated fund, unpaid salaries,
non-maintenance of equipment and unnecessary psychological distress.
Since the monitoring and control unit of ESWAMA display incompetency; it
has impacted negatively on the waste management activities in Enugu State.
This is observable as the records of evaders‟ heighten; court cases between
the agency and its client‟s increases, inability to thoroughly monitor the
streets and highways, etc. This has led ESWAMA into generating lesser
revenue than it used to and spent more on lawyers and court charges. Again,
clients that deposit waste undisciplined do so because no staff of the
monitoring and control unit is keeping a look. All of these have posed a big
challenge to the waste management in Enugu State.
152
CHAPTER FIVE
SUMMARY, RECOMMENDATION AND CONCLUSION
5.1 SUMMARY
This study is an attempt to investigate the problems and prospects of waste
management in Enugu State, using the Enugu State Waste Management Authority
(ESWAMA) as a case study. This was with a view to ascertaining the extent to
which fund affects the efficiency of ESWAMA and to find out the professional
training status of ESWAMA‟s staff.
The study was also aimed at verifying the impact of people‟s attitudes towards
ESWAMA‟s mandate of maintaining a clean environment and to find out the
impact of monitoring and control on the management of waste in Enugu.
The researcher commenced this study by carrying out a critical exposition on
the background of the study which constitutes the origin of waste generation and
disposal, the advent of industrial revolution, the increase in population and the
massive migration of people to industrial towns and cities from rural areas as the
major causes of waste management problems. It also discussed the indiscriminate
disposal and dumping of wastes seen over Enugu State and the attempts made by
different governments to effectively manage waste in the state. The statement of
problem exposed most of the problems associated with waste management in
153
Enugu state which include: poor funding, lack of waste experts/professionals,
incompetent workforce, and the citizen‟s attitudes toward ESWAMA. This section
also highlighted the research questions. The objectives the study intended to
achieve at end of the research were clearly stated and this was followed by the
significance of the study which constitutes the empirical, theoretical and practical
significance of the study to the society. The scope and limitations of the study
which involves the scope which study intends to cover and limitations which
would have caused a setback in achieving the success of this research work
concluded the first chapter.
The second chapter of this work reviewed the works of other contemporary
scholars that have contributed in the bank of knowledge as it relates to the concept
of waste. Literature on waste management which also includes methods of waste
disposal, waste management in Nigeria were all reviewed. This chapter also
includes the research hypotheses and operationalization of concepts and this was
followed by the research methodology which embodied the type of study, methods
of data collection, population of study, sample and sampling procedure, data
gathering instruments, validity and reliability of instrument and lastly method of
data analysis. The last item on this section was theoretical framework and its
proponents, uses, and application to the study were extensively x-rayed.
154
Chapter three of this work comprehensively dealt with the background
information of Enugu State Waste Management Authority (ESWAMA). The study
discussed the origin and location of ESWAMA, its vision/mission statement,
clients, Organizational structure and Organogram. It also discussed its complaint
handling, broad range of marketing methods, duties of units and departments.
Data presentation and analysis was the main focus of chapter four. The
researcher presented and analyzed the data collected from the questionnaire which
constitutes the personal data and the substantive data gotten from the respondents.
This section also embodied the presentation and analysis of the hypotheses using
the chi-square statistical method.
The last chapter of the study which is chapter five was the concluding
chapter of the study and dealt with the summary, conclusion and recommendation.
5.2 RECOMMENDATIONS
In order to assist other Nigerian waste management agencies in
general and ESWAMA in particular, achieve their main objective of
maintaining a clean environment, and also in view of our analysis and
findings of this study, we hereby recommend the following:
155
Enugu state government should increase (up to above 50% of the agency‟s
required revenue) and improve on the supplementary funds allocated to
ESWAMA to carry out its waste management responsibilities. It would go a
long way at assisting them to procure better equipment for waste collection
and disposal; pay staff salaries as and when due, make for the training of
their staff and better staff motivation without mostly depending on revenue
generated from unstable sanitation rate.
ESWAMA should strengthen and regularize their training programme for
the both senior and junior staff generally and monitoring/control staff
particularly, taking them to task to their job. This would enhance effective
monitoring and control of waste from collection to disposal.
Sanitation/Environment protection courts should be established to try all
environmental pollution cases as obtainable in other jurisdictions. This
would require serious policing in the neighborhood but would go a long way
reduce or eliminate indiscriminate dumping of refuse by clients.
ESWAMA should, from time to time, organize a comprehensive public
sensitization programme to enlighten and re-orientate its client‟s attitude
towards their environment and ESWAMA as well. ESWAMA should
encourage its clients to raise a clamour when ESWAMA‟s agents do not do
their job properly. The fact that clients pay sanitation rate would give them
156
the legal basis and moral conscience to do so. We believe that as this public
sensitization programme goes on, it would strengthen the cordiality between
ESWAMA and its clients- which could let to both parties keeping their own
obligations.
The recruitment exercise should be based on nothing but merit and
transparency. The practice of sending list of candidates for employment by
those in power to compensate political party loyalists, friends or relations
should be do away with. If the practice continues, ESWAMA would spend
more money and time familiarizing personnel that know little or nothing
about waste management.
5.3 CONCLUSION
This research work was aimed at ascertaining the extent to which fund
affects the efficiency of ESWAMA, to find out the professional training status of
ESWAMA‟s staff, verifying the impact of people‟s attitudes towards ESWAMA‟s
mandate of maintaining a clean environment and to find out the impact of
monitoring and control on the management of waste in Enugu.
The study discovered that inadequate funding of ESWAMA affects its
efficiency to the extent that evacuation and transportation of wastes from waste
157
dumps, maintenance of equipment and payment of worker‟s salaries suffer which
in turn hinder ESWAMA from carrying out its waste management responsibilities.
Furthermore, the study also discovered that there is no professional waste
management engineer at ESWAMA and though ESWAMA do carry out training
and re-training of its staff, such training and re-training exercises do not come up
regularly (about three times since 2004). At times when training exercises are
conducted at ESWAMA, the eligible participants are only the senior staff. It was
learnt that most waste management activities (like waste disposal, evacuation,
handling, etc) are carried out by the junior staff of ESWAMA whom we learnt do
not participate both in within and outside training. We then conclude that the status
of professional training and re-training at ESWAMA is highly low.
We also discovered that monitoring and control unit of ESWAMA display
incompetency and have impacted negatively on the waste management activities in
Enugu State. This is observable as the records of evaders‟ heighten; court cases
between the agency and its client‟s increases, inability to thoroughly monitor waste
disposal at the streets and highways, etc.
Findings showed that clients‟ attitudes make it difficult for ESWAMA to
perform effectively. These attitudes can be failure to pay sanitation rates,
indiscriminate disposal of wastes, failure to bag wastes before disposal,
158
government-does-everything philosophy of clients (most clients would take to the
easy way of depositing waste along the highway and corners of street for
“government” to pick up) etc. all of these have negative impact on ESWAMA and
had resulted into shortages of expected amount of the internally generated funds,
misallocation of generated fund, unpaid salaries, non-maintenance of equipment
and unnecessary psychological distress.
However, there is no doubt that there might have been some salient issues in
the study that were not adequately discussed and also there might be important
issues that were not raised in the course of this work. These inadequacies might
have been caused by the limitations of this study. We therefore plead that future
research should be geared towards these inadequacies.
159
BIBLIOGRAPHY
Textbooks
Aigbokhavbo, V.O (2000). Waste Management in Nigeria; A Comparative
Analysis in Atsegbua L.A(ed) Selected Essay in Petroleum and
Environmental Laws. Benin-City: New Era.
Atsegbua, L.A, et al (2003), Environmental Law in Nigeria, Theory and Practice.
Lagos: Ababa Publishers.
Hardoy, J. E. and Satterhwaite, D., (1989). Squatter Citizen: Life in the Urban
Third World. London: Earthscan.
Ilegbune, T.O (1994), Legal Regulation of Industrial Waste Management in Ajomo
M.A, Omobolaji A. (eds.) Selected Essays in Environmental Law and
Sustainable Development. Lagos: NIALS.
Mowoe, K.M (1990), Quality of life and Environmental Pollution and Protection
in Omotola J.A (ed.), Environmental Law in Nigeria, Faculty of law,
University of Lagos, Akoka-Yaba.
Journals
Agunwamba, J.C.(1998), “Solid Waste Management in Nigeria: Problems and
Issues”. Environmental Management Vol. 22 No. 6 pp 849-856.
Chima, G. N. et al (2009), “Effects of Urban Wastes on the Quality of Asata River
in Enugu, South Eastern Nigeria”. Global Journal of Environmental
Sciences Vol. 8, No. 1: 31 – 39.
Jens, Chr. Tjell (2010), Littering - a Persistent Problem, Waste Management
Research 28: 863, DOI: 10.1177/0734242X10383188. Waste
Management & Research. Sage Publications
Michael, A. A et al (2010), Assessment of Dental Waste Management in a
Nigerian Tertiary Hospital. Waste Management Research 28: 769
originally published online 2 February 2010. DOI:
10.1177/0734242X09356017. Sage Publications
160
Ogwueleka, T. C. (2009), “Municipal Solid Waste Characteristics and
Management in Nigeria”. Iran. Journal. Environ. Health. Sci. Eng.,
Vol. 6, No. 3, pp. 173-180.
Peters, A. (2010), The role of informal sector for sustainable waste management.
Waste Management Research 28: 671.
DOI:10.1177/0734242X10377834. Sage Publications
Tamil, Nadu (2009), Solid waste, its health impairments and role of rag pickers in
Tiruchirappalli city. Southern India. Waste Management Research
2010 28: 951 originally published online 12 November 2009. DOI:
10.1177/0734242X09352705. Waste Management & Research. Sage
Publications
ULOMA, J. (2006), “Household Management of Polythene Wastes in Enugu
Urban”. Journal of Environmental Research & Policies Vol. 1 No 1,
pp 34-36
Working Papers, Briefing Papers and Discussion Papers
Andrew Gbakon, Bamidele Thomas and Philippa Haden (2007), Review of
SLGP‟s Support to Solid Waste Management IBPs”.DFID CNTR: 00
0512A SLGP Lesson Learning Report 903 (Original Number 433).
Andy, W.(2006), Solid Waste Management as a Catalyst for Governance Reform:
Micro-Licensing for Private Sector Participation in Nigeria.
Collaborative Working Group (CWG) – Water Sanitation Hygiene
(WASH) workshop, 1-5 February in Kolkata, India.
Ijere, C., (1996). Institutional and Organizational Framework for Grassroots
Environmental Management in Enugu Zone of Enugu State. Paper
Presented at the Grassroots Zonal Workshop organized by T.I.D and
Adembo Consultants for UNDP/ENSEPA. 22nd March, 1996.
Philippa Haden and Daniel Ugwu June (2005). Learning Review of Enugu Solid
Waste Management Pilot. DFID CNTR: 00 0512A SLGP Lesson
Learning Report 902 (Original Number 204) Issue Based Projects:
161
Official Documents
FEPA (Federal Environmental Protection Agency) (2004) National Guidelines and
Standards for Industrial Effluents, Gaseous Emissions and Hazardous
Waste Management in Nigeria: Interim Effluent Limitation
Guidelines in Nigeria for all Categories or Industries. FEPA (Nigeria)
Official Gazette, Nigeria, (No. 58)..
Official Journal of the Council of the European Communities on Waste, (2000) No
L 226/3
Unpublished Document
Michael Attah (2009) , Problems of Domestic Waste Management in Nigeria: Any
Repressors? Lecturer, Department of Private and Property Law, Faculty of Law,
University of Benin, Benin City.
Conference Papers and Public Lectures
Akinwale A (2005), Waste Management in Nigeria Local Governments,
International Conference on Energy, Environment and Disasters-
INCEED, Charlotte, N.C, USA- July 24-30.
Jimoh I.A (2005), A new Approach to Municipal Waste Management in Nigeria,
International Conference on Energy, Environment and Disasters-
INCEED, Charlotte N.C, USA.- July 24-30.
Encyclopedia
Engelking, Paul (2009). Hazardous Wastes. Microsoft® Encarta® [DVD].
Redmond, WA: Microsoft Corporation, 2008.
Wehmeier, S (2001),Oxford Advanced Learner’s Dictionary {Sixth Edition},
Oxford: Oxford University Press.
Internet Sources
Burnhar P., Structural Functionalism.
http://www.answers.com/library/politicaldictionary-cid-5115667.
Retrieved 15/02/2011
162
Daily Independent, Enugu Residents and ESWAMA‟s Excesses.
http://www.dailyindependentonline.com/html. Retrieved
14/09/2010
Ejike, T.(2010) Enugu Residents Set ESWAMA Dumpsters ablaze.
http://www.vanguardngr.com/enugu_residents_set_eswama_dumpsters_ablaze.html. Retrieved 12/09/2010
Innocent, B (August 2nd
, 2010), Waste Harzard. Insider Weekly Newspaper.
http://www.insiderweeklynewsonline.com/waste_diseases_mismanag
ement_html/ Retrieved 17/08/2010
Ita, M (2000), Waste-Is the developing world ready/ Science in Africa,
http://www.scienceinafrica.co.za/index.htm. Retrieved 10/11/2010.
Klin Reports (02/08/2010), Refuse Heaps Take Over Enugu
http://www.klinreports.blogspot.com/. Retrieved 23/10/2010
Pongrácz E & Pohjola VJ (2004). Re-defining waste, the concept of ownership and
the roles of waste management. Resources Conservation &
Recycling.http://en.wikipedia.org/wiki/waste#cite-ref-5. Retrieved
09/09/2010
Wikipedia, the Free Encyclopedia (2010). http://en.wikipedia.org/wiki/waste
management/file. Retrieved 04/09/2010
163
APPENDIX A
QUESTIONNAIRE
Department of Public Administration
And Local Government
University of Nigeria,
Nsukka.
8th
February, 2011.
Dear Respondent,
This research is one of the requirements for the Award of Degree of Masters
of Sciences in Public Administration in the above named University.
You are kindly requested to complete the attached questionnaire carefully
and diligently. Information provided will be treated with the strictest
confidentiality and it has nothing to do with your job or person.
I apologize for using your valuable time and I will remain very grateful for
your valued assistance which is highly needed for the successful completion of this
work.
Yours Sincerely
Okafor Chukwuemeka Ikechukwu
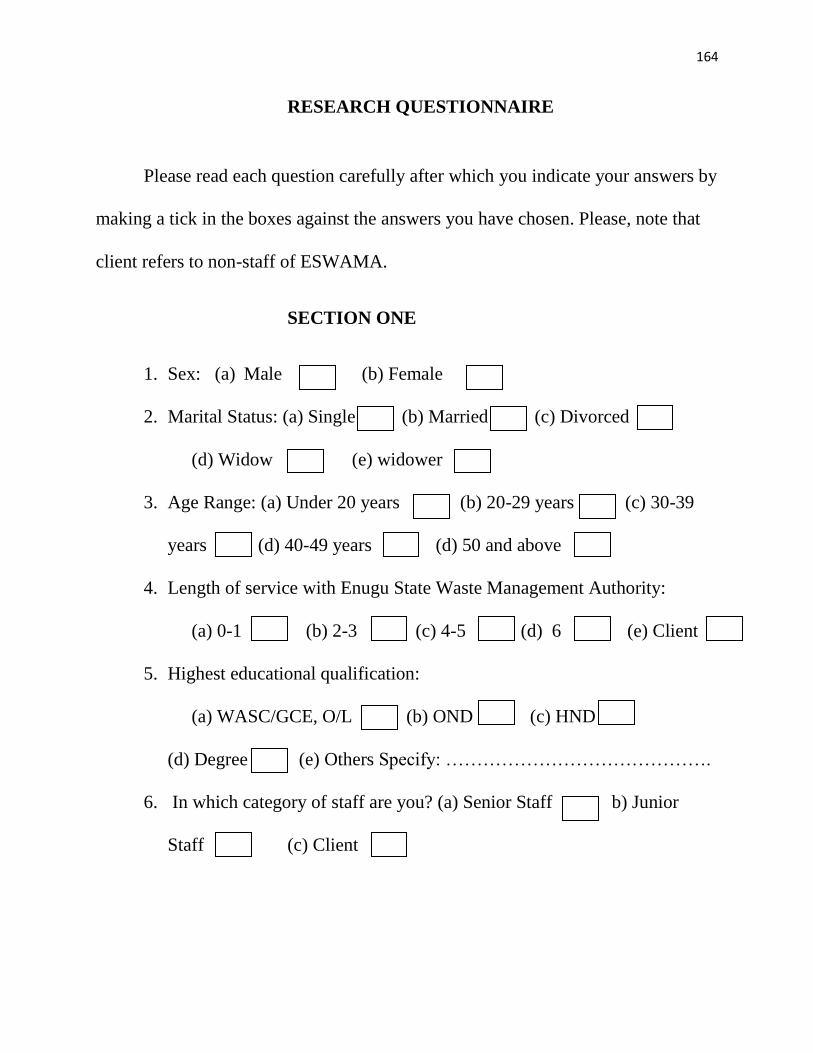
164
RESEARCH QUESTIONNAIRE
Please read each question carefully after which you indicate your answers by
making a tick in the boxes against the answers you have chosen. Please, note that
client refers to non-staff of ESWAMA.
SECTION ONE
1. Sex: (a) Male (b) Female
2. Marital Status: (a) Single (b) Married (c) Divorced
(d) Widow (e) widower
3. Age Range: (a) Under 20 years (b) 20-29 years (c) 30-39
years (d) 40-49 years (d) 50 and above
4. Length of service with Enugu State Waste Management Authority:
(a) 0-1 (b) 2-3 (c) 4-5 (d) 6 (e) Client
5. Highest educational qualification:
(a) WASC/GCE, O/L (b) OND (c) HND
(d) Degree (e) Others Specify: …………………………………….
6. In which category of staff are you? (a) Senior Staff b) Junior
Staff (c) Client
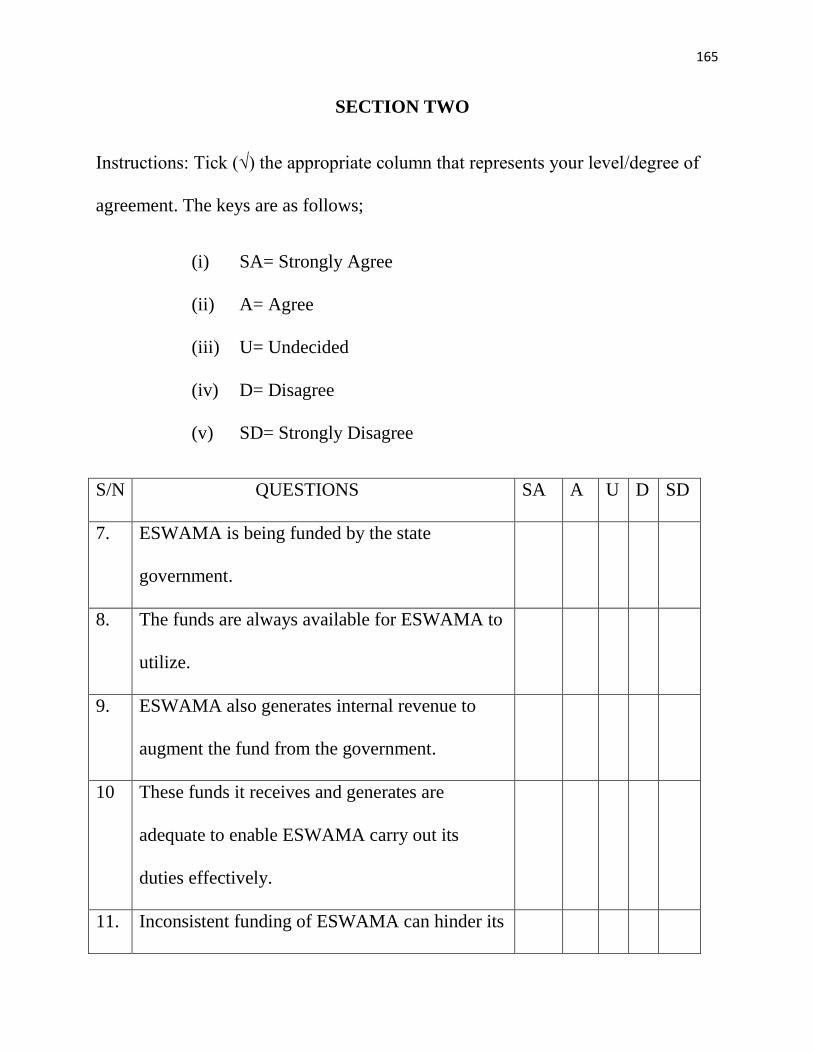
165
SECTION TWO
Instructions: Tick (√) the appropriate column that represents your level/degree of
agreement. The keys are as follows;
(i) SA= Strongly Agree
(ii) A= Agree
(iii) U= Undecided
(iv) D= Disagree
(v) SD= Strongly Disagree
S/N QUESTIONS SA A U D SD
7. ESWAMA is being funded by the state
government.
8. The funds are always available for ESWAMA to
utilize.
9. ESWAMA also generates internal revenue to
augment the fund from the government.
10 These funds it receives and generates are
adequate to enable ESWAMA carry out its
duties effectively.
11. Inconsistent funding of ESWAMA can hinder its
166
waste management responsibilities.
12. Inadequate funding of ESWAMA has a negative
impact on its staff performance.
13. ESWAMA has a competent workforce that can
meet up with the challenges of waste
management.
14. ESWAMA can boast of a functional monitoring
& control unit in its organization.
15. ESWAMA‟s staff undergoes series of training
and re-training consistently.
16. Thus, such training and re-training enable them
carry out their duties diligently and consistently.
17. Technically, staff of ESWAMA displays
expertise in discharging their duties.
18. The responsibilities of ESWAMA suffer due to
the absence of professional staffs.
19. Poor performances of the Monitoring & Control
Unit draw ESWAMA backwards.
20. Clients are aware of their obligations to
167
21.
ESWAMA;
And they do keep to these obligations.
22. As a result, there is a cordial relationship
between ESWAMA and its clients.
23 Clients‟ attitudes make it difficult for ESWAMA
to perform effectively.
24. ESWAMA most times ignore the attitude of its
clients and carry out its duties anyway.
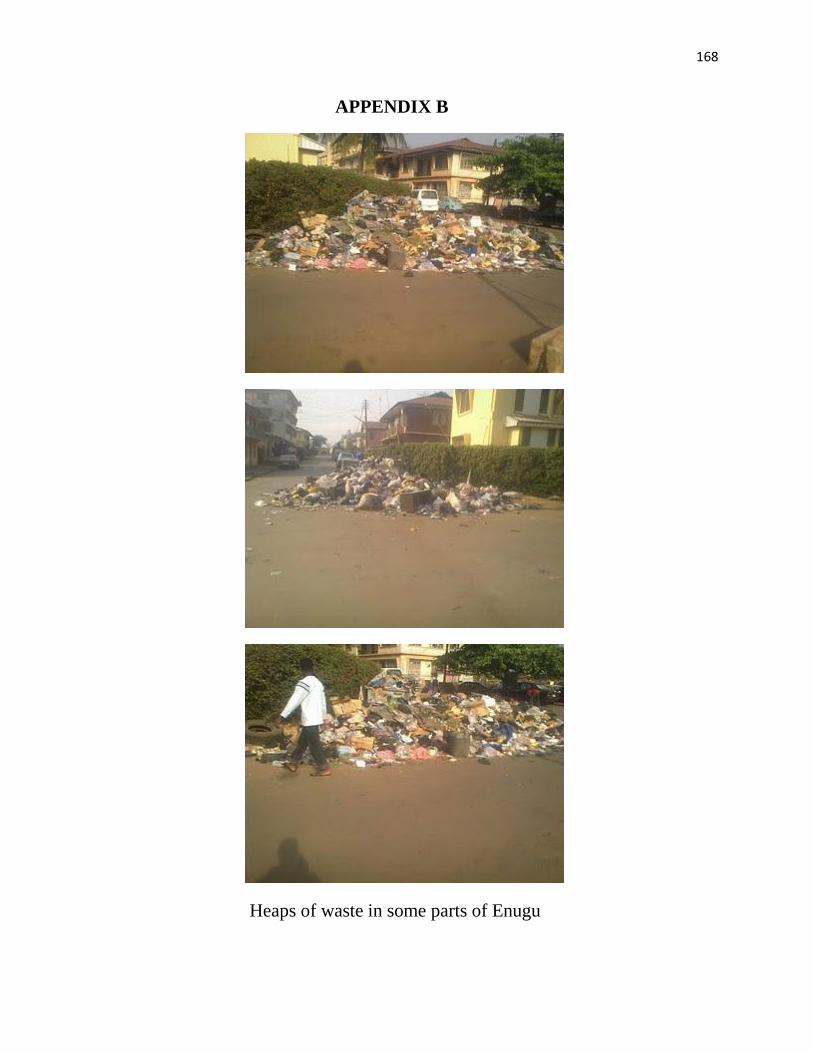
168
APPENDIX B
Heaps of waste in some parts of Enugu


![UNIVERSITY OF NIGERIA, NSUKKA 1 · IGBO/HAUSA], University of Nigeria Nsukka [BA/ED IGBO/LINGUISTICS], University ... Dr E.E. Mbah UNIVERSITY OF NIGERIA NSUKKA [B.A(ED)], UNIVERSITY](https://img.pdfslide.net/doc/110x75/5b8215817f8b9a2b678dcc3a/university-of-nigeria-nsukka-1-igbohausa-university-of-nigeria-nsukka-baed.jpg)