Embed Size (px)
Citation preview

UNIVERSITY OF SHEFFIELD School of Architectural Studies
THE BEHAVIOUR OF COMPOSITE BEAMS WITH PARTIAL INTERACTION AT ELEVATED
TEMPERATURES
by Vasif Atilla Oven
A thesis submitted in fulfilment of the requirements for the Degree of Doctor ofPhilosophy.
April, 1996

SUMMARY
When composite slabs are used in conjunction with conventional composite beam construction, the number o f shear connectors used along the length o f the beam may be limited, resulting in incomplete interaction. This is known to affect the performance o f the beam at ambient temperature, but nothing is known about its influence in fire.
•
This thesis is primarily concerned with the development o f a two-dimensional non-linear
finite element approach to investigate the structural behaviour o f unprotected composite beams at elevated temperatures by considering the influence o f slip at the interface. The shear connection is modelled as a linking medium characterised by an assumed force-slip
relationship. Semi-rigid connection characteristics are also incorporated as zero length
spring elements connected to the steel beam and reinforced concrete slab. A semi-rigid connection model optimising the connection characteristics for a composite beam with partial interaction is proposed, using a pair o f rotational springs and a linear spring. The computer model has been validated against experimental data both at ambient temperature
and at high temperatures.
A parametric study investigating the influence o f shear connection, semi-rigid joint characteristics, reinforcement ratio and different temperature profiles across the cross- section at elevated temperatures has been carried out. It is shown that the failure
temperature is little affected by the force-slip characteristics or their spacing. A notióeable improvement in fire resistance is seen when the rigidity o f the connection or reinforcement ratio in the concrete slab is increased. It is also found that the failure temperature of
composite beams can be significantly higher than that o f bare steel beams.

ACKNOWLEDGEMENT
This work was carried out in the School o f Architectural Studies at the University o f Sheffield. The author would like to express his deepest appreciation and gratitude to Prof. R.J. Plank who supervised this work, for his excellent supervision, support and encouragement throughout. The author gratefully acknowledges the help and support
given by Dr. I.W. Burgess for his many helpful criticisms and valuable advice. My sincere
thanks are also due to Dr. S.R. Najjar who helped me at critical stages o f the development
o f numerical approach of this study.
My special thanks to Turkish Ministry o f Education which made this research and my
presence in England possible, and financially supported me throughout my studies.
Words o f appreciation are also extended to Prof. B. Lawson, Head of Department and all other members o f the academic and secretarial staff in the School o f Architectural Studies.
Finally, I wish to thank my beloved wife Handan for her support, patience and understanding during the difficult times o f my research.

TABLE OF CONTENTS
Summary................................................................................................................... i.
Acknowledgement.................................................................................................... ii.
List of figures........................................................................................................... vi.
Chapter 1: Introduction................................................................................. 1.
1.1. General aspects o f fire safety and regulations...................................... 1.
1.2. Fire safety requirements for structural elem ents................................... 2.1.3. Analytical methods for predicting the fire resistance............................ 4.1.4. Composite construction o f steel and concrete..................................... 5.
1.5. The effect o f fire on composite construction........................................ 8.1.6. The aim and scope o f the thesis............................................................. 8.
Chapter 2: Literature Review...................................................................... 10.
2.1. Experimental studies............................................................................... 10.2.2. Analytical studies..................................................................................... 19.
2.2.1. Simplified analytical m ethods................................................... 19.2.2.2. Comprehensive analytical m ethods........................................ 21.
Chapter 3: Material Properties................................................................... 26.
3.1. Introduction............................................................................................. 26.3.2. Material properties o f steel and reinforcement at elevated temperatures 26.
3.3. Material properties o f concrete at elevated tem peratures................. 28.
3.4. Material properties o f shear connectors at elevated tem peratures... 30.
Chapter 4: The Mathematical Model......................................................... 33.
4.1. Introduction............................................................................................. 33.4.2. Full interaction formulation.................................................................... 33.
4.2.1. The concept o f the theoretical m odel.................................... 33.
4.2.2. Basic formulation..................................................................... 35.
4.2.3. The non-linear inelastic formulation at elevated temperatures 37.4.2.4. The stability criterion............................................................... 39

4.3. Partial interaction formulation............................................................. 40.
4.3.1. The concept o f the theoretical m odel.................................... 40.
4.3.2. The virtual work formulation................................................... 40.4.3.3. The finite element model and evaluation o f derivatives....... 46.4.3.4. The non-linear inelastic formulation at elevated temperatures 49.4.3.5. Evaluation o f cross-section properties and stress resultants 49.
C hap ter 5: M athem atical Representation of Semi-Rigid J o in ts ............... 52.
5.1. Introduction............................................................................................. 52.5.2. Mathematical representation o f connection characteristics............... 53.
5.2.1. Non-composite beam s............................................................ 53.
5.2.2. Composite beams with full interaction................................... 55.5.2.3. Composite beams with partial interaction............................. 57.
C hap ter 6: Validation of the M athem atical M o d e l...................................... 74.
6.1. Introduction............................................................................................. 74.6.2. Convergence studies at elevated tem peratures................................... 74.
6.2.1. Full interaction analysis............................................................ 77.6.2.2. Partial interaction analysis....................................................... 86.
6.3. Comparison with experimental data at ambient tem perature............. 93.
6.3.1. Full interaction analysis............................................................ 93.6.3.2. Partial interaction analysis with idealised end conditions..... 99.
6.3.2.1. Load-deflection behaviour....................................... 99.
6.3.2.2. Load-slip behaviour................................................. 111.6.3.3. Partial interaction analysis with semi-rigid end conditions ... 120.
6.4. Comparison with experimental data at elevated tem peratures......... 126.
6.5. Concluding rem arks............................................................................... 129.
C hapter 7: Param etric S tu d ies ........................................................................... 130.
7.1. Introduction............................................................................................. 130.7.2. Ambient temperature studies................................................................ 130.
7.2.1. The effect o f number o f shear connectors............................. 130.
7.2.2. The effect o f spring stiffness.................................................... 137.
7.3. Elevated temperature studies................................................................ 148.
7.3.1. The effect o f number o f shear connectors............................. 148.
7.3.2. The effect o f force-slip characteristics o f shear connectors 152.7.3.3. The effect o f spring stiffness.................................................... 157
7.3.4. The effect o f reinforcement............................................... 160
7.3.5. The effect o f temperature distribution 167
C hap ter 8: Discussion and C onclusions........................................................... 176
8.1. The computer m odel.............................................................................. 176
8.2. Studies using the computer m odel........................................................ 1788.3. Concluding rem arks............................................................................... 181
References 182

LIST OF FIGURES
Fig. 1.1 Fire safety strategies................................................................................... 3.
Fig. 1.2 Typical composite beam o f steel and concrete....................................... 6.
Fig. 1.3 Bending stress distributions....................................................................... 7.
Fig. 3.1 Typical stress-strain-temperature curves for grade 43 stee l................. 27.
Fig. 3.2 Stress-strain and thermal strain models for the steel and reinforcement 28.
Fig. 3.3 Typical stress-strain-temperature curves for concrete.......................... 29.
Fig. 3.4 Stress-strain and thermal strain models for the concrete....................... 30.
Fig. 3.5 Typical force-slip-temperature curves for shear connectors................. 31.
Fig. 3.6 Force-slip model for shear connectors..................................................... 32.
Fig. 4.1 Finite element representation o f a composite beam with full interaction 34.
Fig. 4.2 Transformation o f plate segments.............................................................. 38.
Fig. 4.3 Finite element representation o f a composite beam with partial interaction 41.
Fig. 4.4 Degrees o f freedom and cubic shape functions....................................... 47.
Fig. 5.1 Moment-rotation-temperature curves for flush and extended end plates 54.
Fig. 5.2 Semi-rigid connection models for full and partial interaction analyses ... 56.
Fig. 5.3 The influence o f the axial force due to the absence o f a linear spring .... 58.
Fig. 5.4 Assumptions for the semi-rigid model for partial interaction analysis .... 59.
Fig. 5.5 Force-displacement model for the linear spring....................................... 60.
Fig. 5.6 Typical o f the main beams used in the large building test frame by BRE 63.
Fig. 5.7 Connection models used for the optimum representation o f
semi-rigid jo in ts ............................................................................................ 64.
Fig. 5.8 Load-deflection behaviour for various types o f connection.................... 65.

Fig. 5.9 Comparisons with idealised end conditions.............................................. 67.
Fig. 5.10 The influence o f the number o f studs on different end conditions........ 68.
Fig. 5.11 Comparisons between analyses with idealised and
semi-rigid end conditions.......................................................................... 70.
Fig 5.12 Comparisons with idealised end conditions at elevated temperatures 71.
Fig 5.13 The effect o f number o f studs on semi-rigid joints
at elevated tem peratures............................................................................ 72.
Fig. 6.1 Typical floor plan o f Cardington fram e...................................................... 75.
Fig. 6.2 Details o f typical floor beam of Cardington Fram e................................... 76.
Fig. 6.3 Convergence study for simply supported beam with full interaction....... 79.
Fig. 6.4 Mechanical strains for simply supported beam with full interaction........ 80.
Fig. 6.5 Convergence study for axially unrestrained fixed end beam
with full interaction........................................................................................ 81.
Fig. 6.6 Mechanical strains for axially unrestrained fixed end beami
with full interaction........................................................................................ 82.
Fig. 6.7 Convergence study for axially restrained fixed end beam
with full interaction........................................................................................ 83.
Fig. 6.8 Mechanical strains for axially restrained fixed end beam
with full interaction........................................................................................ 84.
Fig. 6.9 Convergence study for continuous beam with full interaction................. 85.
Fig. 6.10 Convergence study for simply supported beam with partial interaction 87.
Fig. 6.11 Slip convergence for simply supported beam with partial interaction 88.
Fig. 6.12 Convergence study for fixed end beam with partial interaction........... 89.
Fig. 6.13 Slip convergence for fixed end beam with partial interaction............... 90.
Fig. 6.14 Convergence study for semi-rigidly connected beamwith partial interaction.............................................................................. 91

Fig. 6.15 Slip convergence for semi-rigidly connected beamwith partial interaction................................................................................ 92.
Fig. 6.16 Details o f test beams used for validating full interaction analysis........... 95.
Fig. 6.17 Comparison between analysis and test beam B 4-T 2 ............................. 96.
Fig. 6.18 Comparison between analysis and test beam B 4-T 4 ............................. 97.
Fig. 6.19 Comparison between analysis and test beam B 13-T 13........................ 98.
Fig. 6.20 Details o f simple beams used for validating partial interaction analysis 100.
Fig. 6.21 Comparison between analysis and test beam E l .................................... 101.
Fig. 6.22 Comparison between analysis and test beam A 1 .................................... 102.
Fig. 6.23 Comparison between analysis and test beam A 3 .................................... 103.
Fig. 6.24 Comparison between analysis and test beam A 5 .................................... 104.
Fig 6.25 Comparison between analysis and test beams A6 and U 4 ..................... 105.
Fig. 6.26 Details o f continuous beams used for validating
the partial interaction analysis.................................................................... 107.
Fig. 6.27 Comparison between analysis and test beam B 1 3 ................................. 108.
Fig. 6.28 Comparison between analysis and test beam C B 1 ................................ 109.
Fig. 6.29 Comparison between analysis and test beam C B 2 ................................ 110.
Fig. 6.30 Analytical and test load-end-slip behaviour for tests A l, A3 and A5 113.
Fig. 6.31 Analytical and test load-end-slip behaviour for tests E l and A6 .. 114.
Fig. 6.32 Analytical and test slip distribution for test beam E l ............... 115.
Fig. 6.33 Analytical and test slip distribution for test beam U 4 ............... 116.
Fig. 6.34 Analytical and test slip distribution for test beam U 5 ............... 117.
Fig. 6.35 Analytical slip distribution for test beam B 1 3 ........................................... 118.
Fig. 6.36 Analytical slip distribution for test beam C B 1 .......................................... 119

Fig. 6.37 Moment-rotation characteristics used
for the semi-rigid connection m odel......................................................... 122.
Fig. 6.38 Details o f semi-rigid beams used for validating
the partial interaction analysis.................................................................... 123.
Fig. 6.39 Comparison between analysis and semi-rigid joint testsS4F, S8F and S 12F .................................................................................. 124.
Fig. 6.40 Comparison between analysis and semi-rigidly connected test beam NR2 125.
Fig. 6.41 Details o f beams used for validating partial interaction analysis
at elevated tem peratures............................................................................ 127.
Fig. 6.42 Comparison between analysis and test beams T15 and T 1 6 ................. 128.
Fig. 7.1 Details o f the cantilever beam ...................................................................... 131.
Fig. 7.2 The effect o f number o f studs on the behaviour o f
a simply supported beam .............................................................................. 132.
Fig. 7.3 The effect o f number o f studs on the behaviour o f a cantilever beam ...... 134.
Fig. 7.4 The effect o f number o f studs on slip distribution for a cantilever beam 135.
Fig. 7.5 The effect o f number o f studs on the behaviour o f a semi-rigid beam ...... 136.
Fig. 7.6 The effect o f rotational spring stiffness on the load-deflection behaviour 139.
Fig. 7.7 The effect o f rotational spring stiffness on the load-deflection behaviour 140.
Fig. 7.8 The effect o f rotational spring stiffness on the load-deflection behaviour 141.
Fig. 7.9 The effect o f rotational spring stiffness on the load-deflection behaviour 142.
Fig. 7.10 The effect o f linear spring stiffness on the load-deflection behaviour 144.
Fig. 7.11 The effect o f linear spring stiffness on the load-deflection behaviour 145.
Fig. 7.12 The effect o f linear spring stiffness on the load-deflection behaviour 146.
Fig. 7.13 The effect o f linear spring stiffness on the load-deflection behaviour 147.
Fig. 7.14 The effect o f number o f studs at elevated temperatures
for a simple beam ......................................................................... 149

Fig. 7.15 The effect o f number of studs at elevated temperaturesfor a fixed-end beam ................................................................................... 150.
Fig. 7.16 The effect o f number o f studs at elevated temperatures
for a semi-rigid beam ................................................................................... 151.
Fig. 7.17 Experimental force-slip characteristics o f studsused in the parametric studies..................................................................... 153.
Fig. 7.18 The effect force-slip characteristics o f studs at elevated temperatures 155.
Fig. 7.19 The effect o f degrading force-slip characteristics o f studs
with tem perature........................................................................................... 156.
Fig. 7.20 The effect of rotational spring stiffness at elevated tem peratures............ 158.
Fig. 7.21 The effect o f linear spring stiffness at elevated tem peratures................... 159.
Fig. 7.22 The effect o f reinforcement at elevated temperatures with full interaction 161.
Fig. 7.23 The effect o f reinforcement at elevated temperatures
with partial interaction................................................................................. 162.
Fig. 7.24 The effect o f reinforcement at elevated temperatures with full interaction 164.
Fig. 7.25 The effect o f reinforcement at elevated temperatures
with partial interaction................................................................................. 165.
Fig. 7.26 Strains at the support at the reinforcement for a fixed-end beam .......... 166.
Fig. 7.27 Details o f beams used in studies with different temperature profiles...... 169.
Fig. 7.28 Effect o f temperature profile for a simple beam with partial interaction 170.
Fig. 7.29 Effect o f temperature profile for a semi-rigid beam
with partial interaction................................................................................. 171.
Fig. 7.30 Effect o f temperature profile for a simple beam with partial interaction 172.
Fig. 7.31 Effect o f temperature profile for a semi-rigid beamwith partial interaction.................................................................................. 173.
Fig. 7.32 Effect o f temperature profile for a simple beam with full interaction...... 174.
Fig. 7.33 Effect o f temperature profile for a semi-rigid beam in a sub-fram e........ 175.
x

CHAPTER 1. INTRODUCTION
1.1. General Aspects of Fire Safety and Regulations
Building fires are extremely destructive, causing loss o f life and property. Designers must therefore take the necessary precautions to minimise the effects o f fire. This includes
provision o f adequate escape routes, compartmentation, to limit the spread o f fire and
measures to avoid collapse. Premature structural failure can prevent occupants from
reaching their escape route, reduce the speed o f evacuation and also precipitate the spread o f fire and smoke by destroying compartmentation in the building. This in turn leads to an
increase in the rate o f injury or death and damage to the property.
The notion o f fire safety provision has evolved as a necessity from past experience o f fire
hazard. The first comprehensive studies on fire safety in buildings in the UK were the two Fire Grading Reports1’2, published in 1946 and 1952 which form the basis for current fire regulations for buildings. They defined fire safety policies to safeguard life and minimise the damage to property. This was set out in terms of;
1. Minimising the risk o f ignition
2 . Providing a safe exit for occupants
3. Restricting the spread of fire
4. Minimising the risk o f structural collapse.
Both passive and active fire protection measures were considered. Passive measures include fire protection o f structural members, means o f escape and compartmentation and
fire break walls. Active measures such as sprinklers, hand appliances, smoke detectors and dry rising mains are mainly for property protection but they also help to improve life
safety.
The Fire Building Regulations3 in England and Wales were enacted in 1965 and
introduced features such as control on linings, space separation and duct penetration. It did not use all o f the recommendations o f the earlier Fire Grading Reports. For instance,
there were no provisions for means o f escape and no allowance for active fire
extinguishing measures. In 1966 an amendment was introduced to allow compartment
size to be doubled if a sprinkler system was used, and in 1973 means o f escape were
required for every building. In 1985 the regulations4 were amended to provide a more
flexible system. Although technically there were very few changes the framework opened
1

Chapter 1: Introduction
the way for future modifications and improvements. The regulations were brief and
defined functionally, allowing the designer to use solutions other than those prescribed in demonstrating compliance.
In 1986 an important report, Fire Safety in Buildings5, defined the objectives o f fire protection in buildings as, life safety, prevention o f conflagration, and property protection. It recommended that all provisions for these three objectives should be under one regulatory system and advocated the use o f active fire protection, alternative fire engineering principles and fire safety management, especially in places where a large
number o f occupants is involved. Legislation and design methods for fire safety in
buildings are still evolving, with an increasing facility to allow designers the opportunity
o f providing satisfactory safety in a variety o f ways. A more detailed hierarchy o f fire safety strategies is illustrated in Fig. 1.1 covering all aspects o f safety. One area o f this is
the stability o f the structure when exposed to fire and it is this aspect which is dealt with in this thesis.
1.2. Fire Safety Requirements for Structural Elements
Current regulations4*5-6 classify building types into two main categories, namely residential (houses, flats, hospitals, hotels, hostels, etc.) and non-residential. The latter includes assembly (theatres, restaurants, concert halls, etc.), office, shop (shopping malls, department stores, etc.), industrial, and other non-residential (storage, car parks, etc.).
Depending on the size, occupancy and use o f the building, fire resistance times are specified, typically as 30, 60, 90, 120, 180 and 240 minutes4*5*6. In addition, for high rise
buildings the key structural elements must have a fire resistance o f at least 120 minutes5.
One way o f verifying the fire resistance performance o f load-bearing elements is to carry
out furnace tests. These are conducted in accordance with BS 476: Part 20 and Part 217.
All structural elements within the building must survive the fire for at least the specified
fire resistance time without loss o f stability, integrity and insulation functions. Integrity is
defined as the ability o f a specimen to remain free from holes and cracks and insulation is
defined as the ability to restrict the temperature rise o f the unexposed face o f the
specimen to below a specified level. Stability is defined as the ability o f a specimen to
support its test load without excessive deformation.
2

Cha
pter
1: I
ntro
duct
ion
f*1
Fig.
1.1
Fire
saf
ety
stra
tegi
es.

Chapter 1: Introduction
Regulations which rely on this approach however, have some limitations8-9-10. They are generally inflexible, requiring similar fire resistance periods in situations where the fire hazard may be different8-11. In addition the required fire resistance times increase in a stepwise manner whilst fire severity in building fires does not. Moreover little account is made for active fire protection measures and no specific provision is made for a fire engineering approach in determining fire severity or designing structural elements.
Fire tests also have some disadvantages. They are costly and time consuming, realistic
conditions are difficult to model due to limited dimensions o f the furnace, characteristics
o f the loading device and simplified end restraints8 and finally the standard heating regime
used in these tests is not necessarily representative o f real fires12-13-14.
1.3. Analytical Methods for Predicting the Fire Resistance
The shortcomings o f both building regulations and fire tests have led to the development o f alternative methods for the specification o f fire resistance requirements8. Fire engineering approach provides a basis for calculation o f fire resistance requirements by considering the severity o f a real fire in the context o f the particular building. Therefore it
can be a cost effective alternative to simple compliance with building regulations in that fire protection may be avoided or reduced in situations where the fire hazard is low and/or sufficient inherent fire resistance o f the structure can be demonstrated. Moreover it may be considered as a useful tool in understanding the real structural behaviour in a building
fire. The approach can be divided into three stages8;
1. Modelling the development o f a fire in a compartment
2. Prediction o f temperature distribution in a structural element
3. Assessment o f the structural behaviour.
The temperature rise o f structural elements is directly related to the gas temperature o f
the compartment in which they are placed. The gas temperature in the compartment
depends on the time-temperature profile o f the fire, characterised by three stages namely,
growth, full development and decay. The characteristics o f a typical time-temperature
profile for a real building fire are affected by the fire load (the amount and type of
combustible materials), the available ventilation (size and shape o f windows) and the
thermal properties o f the lining materials. All these factors can be utilised to predict the
temperature-time relationship for a fully developed fire in a compartment, for example
NATFIR15, although predicting the growth o f the fire is much more difficult.
4

Chapter 1: Introduction
Because o f the temperature-dependent nature o f material properties, the temperature distribution within the structural element is crucial for fire conditions. The shielding of parts o f an element cross-section, for example the top flange o f a steel beam where it is protected on one side by the floor slab, can give rise to temperature gradients. This is most influenced by the detail o f the steelwork in relation to the fabric o f the building, the configuration o f the cross-section and any applied fire protection. Computer programs modelling the appropriate thermal conductivity, specific heat and density for various materials have been developed for predicting temperatures within steel and composite
structural elements. For example, FIRES-T216-17 and TASEF-218 are two-dimensional
non-linear finite element models coupled with time-step integration to deal with the heat
flow problem, for steel and composite sections.
Assessment o f the structural behaviour is concerned with the prediction o f deformation and stress histoiy at elevated temperatures. This depends on a number o f factors including
the load, cross-sectional dimensions, material properties, any composite action, boundary
conditions and temperature gradient across the section and along the length. Most structural analysis programs do not carry out thermal analysis to predict temperatures but consider them as input data. Some can deal with whole framed structures, as well as individual members such as beams and columns. CEFICOSS19-20, FASBUS-210-21 and
PAFEC11 are based on two dimensional non-linear finite element models. CEFICOSS is capable o f carrying out both thermal and structural analysis on protected and unprotected composite and steel sections and includes the effects o f large displacements. FASBUS-2 deals with composite sections and incorporates the effects o f creep. NARR22-23-24 is an
efficient, well established computer model based on a secant stiffness method capable o f
analysing steel frames with composite beams such as conventional floor beams, shelf- angle beams or slim-floor beams. These approaches have been used with some success in
modelling the behaviour o f simple elements in a fire.
1.4. Composite Construction of Steel and Concrete
In recent years steel framed construction has become very popular for commercial buildings in Britain largely because o f faster construction times than for other systems.
Composite construction (Fig. 1.2) has also been an important factor offering significant savings in material compared with non-composite frames.
Composite action is usually achieved by connecting the concrete slab to the steel I-
section, using shear connectors. The most widely used type o f connector is the headed
stud. The studs are welded to the flange o f the steel I-section and embedded within the
5

Chapter 1 : Introduction
concrete slab. Other types o f connectors include bar and channel connectors which have been primarily developed for use in bridges due to their higher strength.
Reinforced Concrete Floor Slab
Steel I-section
Fig. 1.2 Typical composite beam of steel and concrete.
The amount o f slip between the concrete slab and I-section can affect the structural
behaviour considerably25. If slip is fully free to develop, the concrete slab and steel I- section will bend independently. The distribution o f bending stress for this case is
illustrated in Fig. 1.3(b). The slip at the interface at mid-span is zero and maximum at the supports. There is an opposite strain in the top fibre o f the I-section and bottom fibre in the concrete slab. If slip is completely eliminated by using infinitely stiff shear connection,
full interaction develops and plane sections can reasonably be assumed to remain plane (Fig. 1.3(a)). The design o f composite beams in practice is often based on the assumption of full interaction. However the degree of interaction depends on the effectiveness o f the shear connection. When this is reduced, some slip will inevitably develop at the interface.
In such situations partial interaction design methods must be used. The presence o f slip results in greater strains than for full interaction with a corresponding increase in stresses, curvatures and deflections. Typical bending stress distribution for this case is shown in
Fig. 1.3(c).
6

Chapter 1: Introduction
(a) Full-Interaction
t x=0________________ j x=L/2(b) Non-composite Action ,
x=0 ____'x=L/2* ------------------ * 1
Fig. 1.3 Bending stress distributions.

Chapter 1: Introduction
1.5. The Effect of Fire on Composite Construction
Structural collapse during a fire will occur when the applied load exceeds the load bearing capacity o f the structure. The temperature at which this happens depends on many factors such as the structural material, degree o f exposure and the precise form and layout o f the
structure.
As a structural material steel heats up very quickly in fire, with corresponding loss o f strength, resulting in premature collapse o f the structure. At a temperature o f 550°C26 its
yield strength is reduced to about 60% o f its ambient temperature value. Since the
atmosphere temperature in a fire very quickly reaches this level it has been generally
assumed that steelwork cannot survive a building fire without collapse, and some form of
fire protection is normally applied. However steel may exhibit sufficient inherent fire
resistance when the fire load is low, the steel section is partially shielded from fire, the applied load is less than the 'safe' load for the section or the rigidity o f the connection is increased.
The ultimate strength o f concrete and its initial tangent modulus also deteriorate with increase in temperature. This however, happens at a slower rate than for steel due to
much lower thermal conductivity o f the concrete. Thus the concrete slab in a composite
beam remains relatively cool compared with the steel I-section. This can provide improvements in fire resistance temperatures and times. Although a number o f studies have been made on the fire performance o f non-composite steel beams and deck slabs relatively little attention has been given to the behaviour o f composite steel-concrete floor beams at elevated temperatures and little design guidance is available. Therefore there is a need for extending current analytical methods to investigate composite beams in fire..
1.6. The Aim and Scope of the Thesis
The main objective o f this thesis is to investigate the structural behaviour o f steel-concrete
composite floor beams at elevated temperatures in terms o f temperature-deflection
history. For interpreting the results a limiting deflection o f L/20 or L/30 as given in design
rules, is often used. Although the prediction o f temperatures is not an objective o f the
thesis, the temperature distribution across the section is either postulated on the basis of
fire test results or calculated using FIRES-T216-17. The study involves: •
• The development o f two-dimensional non-linear inelastic finite element models for
the fire analysis o f steel-concrete composite structures with fully rigid and flexible shear connection.
8

Chapter 1: Introduction
• The idealisation o f semi-rigid joints for full and partial interaction and the incorporation o f these into the finite element analysis.
• Convergence studies to determine the optimum finite element mesh and comparative
studies using available experimental data.
• Use o f the computer programs developed firstly to determine the influence o f certain parameters which might affect the structural response to fire and secondly to gain insight into the behaviour which might lead to simple design methods based on calculations. This may lead to savings in overall construction cost compared with the
use o f current approaches.
Aspects concerning the integrity and insulation criteria are beyond the scope o f this thesis.
The analytical part o f the thesis (Chapter 4 and 5) describes the derivation o f the finite element model for full-interaction and partial-interaction and the treatment o f semi-rigid
joints. In the validation studies (Chapter 6) convergence studies are presented to optimise
the number o f elements used and some comparisons are made with experimental data. The
parametric studies (Chapter 7) include the influence o f semi-rigid connections, shear connectors, reinforcement and temperature distribution across the section.
9

CHAPTER 2. LITERATURE REVIEW
Although the behaviour o f bare steel beams under fire conditions has been studied in reasonable depth both experimentally and analytically, very little research has been conducted on partially or fully composite beams at elevated temperatures. In the first part of this chapter, previous research concerned with experimental studies to determine the
material properties and structural behaviour o f composite beams will be discussed. In the
second part, attention will be focused on analytical research. Most previous work on
partially composite beams has been carried out at ambient temperature and studies at high temperatures are very scarce. However, this, together with analytical work which has been conducted on non-composite beams in fire provides a basis for developing elevated
temperature studies for composite sections.
2.1. Experimental Studies
The analytical modelling o f partially composite beam behaviour under fire conditions requires the high temperature mechanical properties o f the materials making up a composite section, namely the steel beam, reinforcing bars, concrete and shear
connectors.
The stress-strain-temperature characteristics o f steel and related material properties such as yield strength and modulus o f elasticity are now quite well established. Generally two different test procedures have been used: the isothermal tensile test in which the specimen is subjected to increasing load under a constant temperature and the anisothermal test in
which the specimen is heated under a constant load.
The rate o f loading in the isothermal tensile tests and the rate o f heating in the
anisothermal tests can have a significant influence on these characteristics. Lu, Trubert
and Nash27 conducted isothermal tests on stainless steel. They varied the rate o f heating prior to applying load and reported that the yield strength was not affected by this.
However, the results were for one temperature only (1200°C). In contrast Willhelm and
Kattus28 presented a family o f tensile stress-strain curves at various temperatures from
37°C to 1093°C. Their results for a range o f both heating and loading rates showed that
these rates did have an influence, particularly on the yield stress. However their studies
10

Chapter 2: Literature Review
were primarily aimed at transient conditions in which both loading and heating vary
simultaneously.
There has been some debate about the effect o f creep due to different loading rates. The consensus from a number o f investigators29-33 is that the rate o f loading has a negligible effect below 370°C but is more important at higher temperatures, particularly above 600°C. Some researchers have recommended that if an isothermal testing procedure was to be adopted, a standard rate o f strain must be used so that creep would be accounted for in a consistent way. Jorgensen and Sorensen29 suggested a rate o f 0.05/min whilst Baba
and Nagura32 proposed a much slower rate o f 0.01/min. In addition it was concluded that
the mechanical properties o f steel obtained from such isothermal tensile tests may not be
appropriate in situations where the rate o f temperature rise within the member was very
slow, for example in the case o f protected steel elements, in which case the creep effect should be properly accounted for34-35. However, based on full-scale beam tests, Harmathy
and Stanzak36-38 studied the effect o f creep and concluded that this was not significant for unprotected steel elements because o f the rapid rise o f temperature.
The results from anisothermal tensile and flexural tests were reported by Witteveen, Twilt and Bijlaard39. Although the variation in heating rate (5-50°C/min.) slightly affected the test results at higher temperatures, below 400°C the heating rate had no effect on either collapse temperatures or the stress-strain relationship. In these tests a sudden increase in strain was observed as the temperature was increased from 200°C to 300°C resulting in a rapid deterioration o f stress-strain-temperature curves between these temperatures. This is referred to as thermally activated flow. Anisothermal tests are more closely related to real
conditions o f fire exposure and Kirby and Preston40 concluded that this testing procedure was more appropriate for determining the material properties o f steel for use in fire engineering studies. Although there are some variations in high temperature data for steel,
there is now a reasonable consensus about these results, which provide a sound basis for
modelling the material characteristics in fire analysis.
Experimental studies at room temperature show that the stress-strain relationship o f
concrete is highly non-linear and influenced by a number o f parameters such as cube
strength, particle size and distribution, aggregate/cement ratio, the shape and texture o f coarse particles, workability and compaction o f the mix41-45. This is due to the non-
homogenous internal structure and unpredictable cracking mechanisms in concrete46-48.
Published experimental data defining complete stress-strain relationships for concrete at
elevated temperatures is very limited. Furamura49-50 presented stress-strain-temperature
curves for a temperature range between 30°C and 700°C using isothermal compression
tests. Similar curves were derived by Anderberg et. al.5i using anisothermal compression
11

Chapter 2: Literature Review
tests. These studies indicated that both the elastic modulus and compressive strength reduce dramatically for temperatures above 500°C. Anderberg also reported that the stress-strain-temperature characteristics obtained from isothermal tests led to the prediction o f unrealistically high thermal stresses and sometimes to an erroneous collapse state when they were used in analytical models52-53.
Rather more data is available concerning the influence o f temperature on specific characteristics notably strengths. Most studies indicate that there is a little change in
strength up to a temperature o f 300°C whilst above this temperature it reduces
significantly54'57. However Mohamedbhai55 showed that the rate o f deterioration in
strength remained small up to 600°C. Contrasting conclusions have also been drawn
concerning the influence o f the age o f concrete and the water-cement ratio on the compressive strength up to temperatures o f 600°C54’57. The elastic modulus also decreases markedly as the temperature increases. This reduction has been shown to be
influenced by the water-cement ratio, the aggregate type and strength58-59.
These variations in test results highlight the difficulties in the determination o f stress- strain-temperature characteristics for concrete, which are needed in analysing the behaviour o f composite beams in fire, and in establishing strength reduction factors for
use in design.
The analysis o f partially composite beams also requires the force-slip characteristics o f the shear connectors. These are normally obtained from push-out tests. Such tests at ambient temperature60'70 have shown that the relationship is highly non-linear and the force-slip relationship depends on the surrounding concrete strength and the diameter o f stud. Both the load-slip characteristics and the ultimate strength o f studs from different tests can show a considerable scatter. However some general patterns are evident with slender
studs being stiffer60 and the strength o f studs embedded in lightweight concrete being
lower than in normal density concrete o f an equivalent grade62. The strength o f studs in metal deck construction has been shown to be less than in solid slabs and the behaviour
greatly influenced by the shape o f the deck and the stud positions66-67.
Slutter and Driscoll61 first suggested that force-slip characteristics from push-out tests
might not reflect the exact behaviour in a flexural element. This was confirmed by
Lawson68 and Crisinel70 who reported that the strength and deformation capacity o f studs
in beam tests was much greater than in push-out tests. However Robinson66 reported that
the strength o f studs from push-out tests and composite beam tests were comparable.
Crisinel concluded that results from push-out tests were easier to obtain, more standardised and they gave conservative design values.
12
Chapter 2: Literature Review
The only published research investigating the effect o f high temperatures on the force-slip
characteristics is a series o f push-out tests at elevated temperatures by Kruppa and Zhao71 for a 19mm headed stud. The results indicated that up to 400°C the reduction in the ultimate shear strength and initial tangent modulus was negligible. However at 500°C, the shear strength was found to decrease by 40%. At 600°C this reduction had increased to 62% and at 700°C was as high as 82%. The authors also noted that the temperature of the studs was around 80% o f the upper flange temperature o f the steel beam to which they were welded. The differential thermal elongation between the concrete and steel was
reported to induce significant levels of shear stress on the studs, but this was not
quantified.
It is clear that there is a reasonable amount of data on material properties for steel at high temperatures, and the results from various investigators are in reasonable agreement.
However for concrete and shear connectors the effect o f high temperatures on their
material properties is not so well established. Particularly for concrete these properties are difficult to obtain because o f its non-homogeneous internal structure and therefore most
work has been done to determine the ultimate strength o f concrete rather than full stress- strain-temperature curves. As for the studs, there has been very little research on their properties at elevated temperatures and it would be very useful to conduct more push-out
tests on different types and sizes o f shear connection under fire conditions.
Structural analysis necessitates the use o f mathematical models representing the stress- strain characteristics of the materials used in the analysed structure. These models largely rely on experimental data discussed above and can be in the form o f simple and more
sophisticated mathematical expressions. For concrete and shear connectors the representation o f the-stress-strain characteristics at high temperatures is more difficult because o f limited amount o f experimental work. For steel these are well established and models have been developed, often on the basis o f those used at ambient temperature. At
its simplest this is o f a multi-linear form72, but more complex relationships have also been
proposed73. More precise formulas were proposed by Holmquist and Nadai74 and
Ramberg and Osgood75 who introduced an exponential expression for describing the
stress-strain curve in terms of three parameters, namely Young's modulus and two secant
yield strengths.
For high temperatures the yield strength o f steel as a proportion o f its ambient
temperature value can simply be tabulated as a series o f strength reduction factors76-77.
Alternatively simple formulas expressing the reduction in yield strength, modulus of
elasticity and coefficient o f thermal expansion with increasing temperature have been
proposed29-78. However such models do not account for the highly non-linear stress-strain
13

Chapter 2: Literature Review
characteristics o f the steel at elevated temperatures. Hence more sophisticated
expressions, representing the experimental relationship at different temperatures, have also been developed. Dounas and Golrang79 proposed a linear-elliptic idealisation o f the stress-strain-temperature curve. The curve was assumed to be divided into three parts and three mathematical expressions representing each part were described. El-Rimawi22-23 modified the expression by Ramberg and Osgood75 by introducing two additional temperature/dependent constants, whilst EC4 Part 1.280 uses a curve represented by three different parts, namely elastic, non-linear and plastic. These were defined in terms o f the slope o f the linear elastic range, the proportional limit and the maximum stress level, with
the non-linear transition represented by an elliptical relationship. Such representations are
now recognised as giving a reasonable indication o f the material characteristics o f steel in
fire.
Even at ambient temperature representing the stress-strain relationship for concrete
mathematically is difficult. The shape o f the curve is highly non-linear and dependent on various parameters, requiring the use o f complicated mathematical expressions. Early formulas were developed for certain concrete strengths in the form o f simple exponential functions considering both the ascending and descending portion o f the curve81*84. Saenz85
was first to introduce two separate formulas to represent the two branches. He also introduced the E0j E ratio (E is the secant modulus and Ea is Young's modulus) as a
function o f the strength o f the concrete and defined the slope o f the curve. More recent formulas, which include this ratio41, have been developed to account for normal and lightweight concrete42, microcracked concrete44 and different cube strengths45. Further developments o f this approach by Tsai86 use two parameters to control the ascending and
descending parts o f the curve and have been shown to be in excellent agreement with
experimental results for various types o f concrete.
Although there are a number o f established formulas representing the stress-strain curve o f concrete at ambient temperature, there are few corresponding models for high
temperatures. The models by Anderberg et. al.51 and Bresler et. al.87 consider the different
strain components namely, creep strain, thermal strain, transient strain and mechanical
strain but mathematical expressions were not explicitly reported. Baldwin and North88
plotted the experimental stress-strain-temperature data by Furamura49 as a normalised
stress and strain for each temperature level and noticed that all the curves for different
temperatures lie along the same course. An empirical formula in terms o f the ultimate
stress and strain at a given temperature was then fitted to represent this. Kishysh89 used
the stress-strain formula by Saenz85 to approximate the experimental stress-strain-
temperature curves obtained by Furamura49, both in compression and tension. He also
plotted the variation in the modulus o f elasticity and compressive strength o f concrete
14

Chapter 2: Literature Review
with temperature from previous tests using different water-cement ratios, aggregate and cement types and curing and age o f the specimen. An envelope model was developed and a trilinear relationship approximating the upper and lower boundaries o f the envelope was proposed. The same basic experimental data49 has been used as the basis for the material model incorporated into EC4 Part 1.280. This represents the stress-strain-temperature curves o f concrete up to a maximum strain o f 5% as a non-linear polynomial equation. This consists o f two separate forms modelling the ascending and descending parts o f the relationship for normal and lightweight concrete.
Partial interaction analysis o f composite beams requires the force-slip characteristics of
the shear connectors. Based on regression analyses on push-out test data, simple empirical
formulas for modelling the force-slip relationship62-90 or the shear strength o f connectors
as a function o f the strength o f concrete63’65-69 have been proposed for ambient
temperature but there is no published data on modelling these characteristics at high
temperatures.
An understanding of the effect o f high temperature on the materials forming a composite beam is clearly important, and provides a basis for understanding and explaining the behaviour o f structures in fire. One way o f determining the fire resistance o f structural
elements is to conduct furnace tests in which the specimen is heated according to a standard time-temperature curve and its deflections are recorded at certain time intervals. However although a significant number o f such tests have been conducted many have been performed simply to prove a particular method o f achieving fire resistance, and
detailed results have often not been fully reported. The specimens in beam tests are typically non-composite construction and in the few tests where composite beams have
been used there was no measurement o f slip.
Tests have been conducted on both small-scale and full-scale specimens and it has
generally been found that the collapse temperature is independent o f the heating history
and unaffected by thermal expansion39-91-92. Cooke11-93 conducted a series o f model tests
to study the thermal deformations o f an unloaded simply supported bare steel beam and
found that the increase in deflections slowed down at 730°C. This was due to the change
in the metallurgical composition o f the steel at this temperature. He also investigated the collapse temperature o f a loaded simply supported steel beam and determined a failure
temperature o f 550°C.
An extensive programme o f full-scale fire tests on individual beams o f which two were
composite, has been carried out in the U.K by British Steel94. Comprehensive temperature
and deflection measurements were reported at regular time intervals. These tests included
preliminary studies o f the influence o f beam type, load level, axial restraint and end fixity.
15

Chapter 2: Literature Review
They showed significantly higher failure temperatures than previously reported, partly due to the upper flange in contact with the concrete slab remaining cooler. Where additional shielding is provided, for example in shelf-angle beams or slim floor construction, the
failure temperatures are further increased. They also demonstrated the beneficial effect o f end restraint and reduced load levels. This is consistent with the findings o f Rubert and Schaumann95 who conducted a series o f model tests to show that reducing the load and span/depth ratio resulted in an increase in fire resistance.
Similar tests on individual steel, composite and reinforced concrete beams and columns
have also been conducted by a number o f authors19’20*76’78’96. In some tests19’20-96 the area
between the flanges o f the steel section was filled with concrete, essentially providing fire
protection, and although the tested section is referred to as composite it was not typical o f
that used in building construction in the U.K. The results o f these tests were reported to
show significant scatter due to inconsistencies in material properties and testing
procedures78.
Fire tests on composite concrete slabs have been carried out97'100 but their results are
beyond the scope o f this thesis.
Experimental research considering the partial interaction between the concrete slab and
steel beam has been undertaken at room temperature. Early studies investigated composite beams with solid concrete slabs while more recent studies have used beams with concrete slabs cast on corrugated metal decks. Most references report end slip
measurements but the slip distribution along the length has been measured only by a few authors60-101-102. Generally the results show that uniform spacing o f shear connectors is
appropriate and studs with small diameters are more efficient60’61’103.
It has been found that large slip deformations have a negligible effect on the load carrying
capacity but increase the deflections considerably60’102’104'106. Chapman103 showed that even when the shear connection was designed to provide full interaction the influence of
slip on beam deflections in the plastic range was significant. Wright and Francis102
reported that the stiffness o f a composite beam was most affected for interaction levels
between 20% and 50%. Increasing the interaction level above 50% was found to have a
negligible effect on the beam stiffness under service conditions. The influence o f the
amount o f transverse reinforcement has been studied and shown to have a significant influence on both the failure load and mode105'107.
It has recently become clear that testing isolated members is unrepresentative o f the
behaviour o f individual members in a highly redundant structure, such as in real building
frames. Cooke93 tested a small-scale two-span continuous beam with rigid supports and
16

Chapter 2: Literature Review
found that the fire resistance is highly influenced by the high temperature strength o f the internal support. Cooke and Latham108 tested a full-scale two dimensional steel frame exposed to a fire o f wood cribs and found that the fire resistance temperature was 830°C, significantly higher than suggested by isolated beam tests. Tests on sub-frames have also been conducted by a number o f other researchers19-20’76*96 to validate computer models. These tests on frames are mainly for non-composite beams, Lloyd and Wright109 tested a full-scale composite frame at ambient temperature and concluded that when additional flexural restraint was provided by the surrounding frame the slip deformations and
deflection o f a composite beam is significantly lower than for isolated beam tests.
However, no corresponding studies have been conducted for fire conditions.
Although these frame tests provide an indication o f the interaction between beams and
columns they do not reflect the real behaviour o f the whole structure o f a building. Recognising the need to examine the three-dimensional behaviour o f structures, frames
including the interaction o f slabs, walls, etc. the Building Research Establishment
constructed a full-scale eight-storey steel framed building at its Cardington laboratory to carry out static, dynamic and fire tests110. The results o f these tests will provide invaluable data and will enable comparison with isolated member and sub-frame tests and also predictions from computer models. The building is conventionally framed using composite
construction but no measurements have been made o f slip. Although a number o f fire tests have now been completed unfortunately only very limited test data is available at present.
The characteristics o f the end connections o f a beam, defined by the moment-rotation relationship are known to influence structural behaviour significantly and now a
reasonable amount o f data has been assembled for both bare steel and composite connections at ambient temperature. Bare steel connections were studied by Aggarwal111’112 who determined the moment-rotation characteristics o f various
connection types including flush and extended endplates. Test results on composite
connections are generally very consistent113-120 and suggest that the ultimate moment
capacity o f a composite connection is significantly greater (1.5 to 6 times) than the bare
steel condition113-118. Increasing the slab reinforcement ratio leads to an improvement in
moment resistance o f flush endplates and the mode o f failure is either yielding o f the
reinforcement or local buckling o f the steel beam, depending on the reinforcement ratio113-
118. For instance Anderson and Najafi118 reported that varying the reinforcement ratio
from 0.55% to 1.65% resulted in an improvement in the moment resistance o f
approximately 68%. For reinforcement ratios o f 0.55% and 1.1% they found that the
failure mode was yielding o f the reinforcement whereas for 1.65% local buckling o f the steel beam was critical.
17

Chapter 2: Literature Review
The influence o f partial interaction on the connection characteristics was investigated by Puhali et. al.119 who concluded that its effect on the moment-rotation curve was very little up to 70% of the plastic moment capacity o f the connection. Some contrasting
conclusions have also been reported with regard to the influences o f concrete on connection stiffness with partial interaction. For example Puhali showed that the contribution o f the concrete slab to the connection stiffness was negligible due to early cracking o f concrete. However Jarrett and Lennon120 reported a much higher initial stiffness o f the moment-rotation curve, although this reduced significantly after cracking
of the concrete.
Only a few studies on limited types o f connection have been conducted at elevated
temperatures. Lawson and Newman121’122 presented the results o f bare steel and
composite connections using flush end plates, extended end plates and double sided web cleats under fire conditions. However due to the limited extent o f these tests full moment-
rotation-temperature curves could not be derived. The moment capacity o f the connection which was found to be about two times greater than for the equivalent bare steel connection was greatly influenced by the strength o f the upper bolts which failed at approximately 550°C. The failure temperature o f the connection was largely unaffected by the amount o f reinforcement. Currently Jones et. al.123 are conducting fire tests on bare steel and composite connections with flush end plates for small beam and column section
sizes. Initial experimental moment-rotation curves for bare steel connections show a gradual degradation as the temperature increases, and a significant moment capacity reduction between 500°C and 600°C. Further results from this work will provide
valuable information for modelling connection behaviour under fire conditions.
Structural analysis incorporating the effect o f semi-rigid connections at elevated temperatures requires the mathematical modelling o f moment-rotation-temperature
relationships. This is only possible if sufficient experimental data on a range o f connection types is available at high temperatures. At present research in this area is extremely limited
and there is clearly a need for more experimental work, particularly concerning composite
connections.
It can be seen that although there has been a significant effort in conducting fire tests most
o f these have been on isolated elements. Frame tests which can provide a better indication
o f how structures will behave in fire are relatively few. Tests generally provide invaluable
data for understanding the behaviour o f structures at elevated temperatures but they are
generally costly, possibly limited by available furnace characteristics, and often unrepresentative o f the real behaviour.
18

Chapter 2: Literature Review
2.2. Analytical Studies
The limitations o f tests referred to above have encouraged the development o f analytical methods as an alternative way o f studying structural response to fire. The approaches adopted can be generally classified into two categories: the calculation o f the fire resistance using empirical or semi-empirical methods, and modelling the full behaviour at high temperatures using more comprehensive numerical methods. The former is intended for design purposes whereas the latter is mainly for research purposes.
2.2.1. Simplified Analytical Methods
Simplified models are generally concerned with predicting only the failure temperature or
time o f the structural element rather than its deformation history prior to collapse. One such method is based on the Hp! A (nTx) concept (section factor) where 'Hp is the
perimeter o f the section directly exposed to fire and * A' is the cross-sectional area o f the steel8-10-12-77-124. Sections with a high Hpl A ratio heat up faster than those possessing low
ratios, resulting in lower fire resistance. Design charts have been prepared, relating failure temperature (determined by tests according to a limiting deflection o f L/20 or L/30) to section factor. The same concept is used in similar approaches such as the W/D ratio14,
where W is the weight per metre and 'D' is the heated perimeter o f the cross-section, and the U/A factor125 given by the surface area o f the member exposed to the fire (U) divided by the corresponding volume of the member (A). A number o f authors10-12 have adopted this approach using time-temperature characteristics from real fires while others have used
the standard heating curve11-124. Although the concept o f section factor can be used for
insulated and uninsulated members125 and both fully and partly loaded conditions124, its use is limited to simple structural elements.
Other simplified approaches have been developed based on an ultimate moment capacity concept using the reduced yield strength o f steel to predict the collapse
temperature76-77-96-126’128. Knowing the temperature profile through the critical section, the
member is divided into a number o f slices o f approximately equal temperature. The
moment capacity o f the member is then calculated by considering the strength properties o f the materials in the section. Again this method is generally limited to simply supported
beams and can often result in shorter fire resistance times than those measured in tests due
to variation in material properties and temperature, geometrical imperfections, and
different loading and restraint conditions. Recognising this problem Petterson and
Witteveen129 proposed some correction factors to achieve consistency with experimental results.
19

Chapter 2: Literature Review
The critical temperature o f a member, defined as the temperature at which its maximum deflection reaches L/20 or L/30, depends on the load that the member carries. This is accounted for in the load-ratio method77. For members in bending, the load-ratio refers to
the applied moment at the fire limit state divided by the moment capacity o f the member at room temperature. The critical temperature o f the member can be obtained using design tables based on fire tests and relating load-ratio to this temperature. An alternative model was also presented by Witteveen13 who suggested that the quantification o f the fire exposure was a problem o f heat transfer to the member. The fire resistance was assessed
using an empirical formula for calculating the temperature within a uniformly heated
element. If the member did not attain the predetermined failure temperature, it was
assumed to retain its load bearing capacity.
There are only a few simplified design methods which consider partial interaction and they
are only applicable to simply supported beams at room temperature. Crisinel70 presented an empirical formula expressing design load in terms o f the number o f shear connectors.
The relationship was derived by transforming the partially composite section into an equivalent reduced fully composite section using plastic analysis. An empirical deflection formula which accounts for varying degrees o f shear connection was also proposed. Luckyram and Vardy130 expressed the longitudinal variation o f the shear displacement as a second degree differential shear-slip equation which was then integrated to calculate the slip at any section, whilst Bradford and Gilbert131 calculated the internal forces in a composite section using the non-continuous strain profile due to slip. However, all o f
these authors have commented that simplified methods are generally inadequate for
predicting slip deformations.
Simplified design methods to account for semi-rigidly connected beams at room
temperature have been developed by various investigators114’116-118’119-132'135. These are
typically in the form o f empirical formulas expressing the rotational stiffness o f the joint
derived from regression analyses on experimental moment-rotation curves for various types o f connection. These rotational stiffnesses can then be incorporated into first order
linear elastic analysis133 or plastic analysis134. Simplified elastic connection models for
composite beams have been proposed using an axial spring connected to the
reinforcement and a rotational spring connected to the steel beam135 or three axial springs,
representing the reinforcement, the steel connection and the shear stiffness o f the studs118.
The stiffness o f the springs was derived from experimental moment-rotation curves. In
contrast very little work has been done in developing simplified design approaches
specifically for composite beams with semi-rigid support conditions under fire exposure.

Chapter 2: Literature Review
2.2.2. Comprehensive Analytical Methods
More sophisticated numerical methods to simulate structural behaviour in fire have been developed mainly for research purposes. These methods, which are typically based on computer modelling using the finite element method, are concerned not only with the fire resistance but also the full deformation history throughout exposure. Most analyses were developed for bare steel sections but some deal with fully composite sections.
Plank136 presented an analytical method for simply supported steel I-sections with uniform temperature profiles based on a moment-area approach using an iterative procedure to
determine the varying neutral axis position with increasing temperature and define the
precise stress distribution corresponding to the applied bending moment. From this the
modified beam stiffness and mid-span deflections were calculated. The method used a bilinear stress-strain relationship defined by the elastic modulus and yield strength. Using the method the author has shown that the span length and section size have very little
influence on failure temperatures. Reducing the design load did increase the failure temperature but it was not recommended because o f the less efficient use o f the section. Burgess, El-Rimawi and Plank22 proposed an efficient secant stiffness method of structural analysis for steel beams at elevated temperatures. The method was based on the transformation o f the stress-strain-temperature relationships represented using the
Ramberg-Osgood equation75 into moment-curvature-temperature curves. Both uniform and non-uniform temperature profiles across the section were considered. The model was recently extended to analyse two-dimensional steel frames with semi-rigid connections137-138. Using the computer model the authors investigated the influence o f different support conditions and the P-delta effect on fire performance. They showed that continuous and fixed-ended beams achieved significantly higher failure temperatures than the simply supported case and although the P-delta effect increased the magnitude o f
beam deflections it had very little effect on failure temperature. A single bay frame with its columns protected was also analysed indicating a fire resistance for the beam of 850°C,
an increase o f 54% compared with the simply supported case.
Other authors have performed two dimensional analyses using standard finite element
computer programs21-93 demonstrating reasonable accuracy in comparison with test data.
Thermal analysis was not incorporated in these studies but material properties were varied
with temperature and creep effects were included.
A number o f authors have developed special finite element models to deal with two
dimensional steel frames139-141. All used a similar procedure based on a step-wise constant
temperature rise and the incremental variational principle. The stress-strain-temperature
21

Chapter 2: Literature Review
curves o f steel were represented by a bilinear relationship with no strain hardening. The effects creep and initial stresses were considered.
Jain and Rao142 were the first to use the principle o f virtual work in a finite element model for structural fire analysis. The model provided an efficient computation for considering the influence o f geometrical non-linearity on the behaviour o f plane steel frames. The same approach has been adopted by a number o f other researchers.
The first computer model (CEFICOSS) capable o f an integrated thermal and structural
analysis o f steel and composite frames was developed by Schleich, Dotreppe and Franssen19. The computer model included both thermal analysis using a finite difference
method and structural analysis using finite element formulation. The thermal analysis was
carried out to determine the temperatures at one minute intervals. At each stage the
structure was assumed to be loaded incrementally until the service load was reached. After each step o f loading the Newton-Raphson process was employed to restore the
equilibrium condition o f the structure. The process was repeated until equilibrium could not be maintained. Creep was ignored but the strain hardening effect was considered and reported to have a significant influence on the calculations. A similar method was described by Dotreppe96 who extended the model to include reinforced concrete structures. Saab et. al.143 incorporated the effects o f elevated temperatures into a previously developed non-linear finite element formulation for plane steel frames at ambient temperature (INSTAF)144-145 to study the behaviour o f steel frames in fire. The equilibrium equations were constructed using the principle o f virtual work and solved
using the Newton-Raphson iteration method. Large displacements, material non-linearity and residual stresses were considered. The variation in temperature both across the section and along the length o f the beam, and thermal stresses were taken into account.
The authors analysed a two-bay frame which failed due to excessive sway o f columns and
concluded that protection o f the columns was more important than for beams.
Najjar146 further extended the computer model by Saab143 to include three-dimensional
behaviour o f steel frames and warping deformations. In order to achieve a very accurate
treatment o f geometric and material non-linearity the formulation was modified to retain all higher-order terms. Bailey147 further developed the work by Najjar146 to study the
behaviour o f composite beams with semi-rigid connections in fire and to account for the
cooling phase o f a fire. The extension o f the program involved the incorporation o f shell
elements to represent the concrete slab in three dimensions, zero length spring elements
accommodating any specified moment-rotation-temperature curve to represent semi-rigid joints, and unloading from an inelastic state to represent the cooling stage o f the fire. In
addition the geometrical effect o f shear deformations within the beam cross-section was

Chapter 2: Literature Review
included in the formulation to model lateral-torsional deformations. The temperature variation across the section o f the steel beam was considered but it was assumed to be uniform through the thickness o f the concrete slab. Some indicative studies were also performed to investigate the influence o f continuous floor slab on fire resistance. The examples used in the study were selected to represent the cases used in three fire tests conducted on the full-scale frame at Cardington110. It was shown that if cracking o f the concrete and thermal strains in the floor slab are ignored, the magnitudes o f displacements
are much lower and consequently fire resistance is much greater than in situations where
they are accounted for. Analyses ignoring these effects predicted no failure o f the beam up
to a temperature o f 950°C and a reversal o f direction o f vertical displacements at
temperatures above 500°C which was attributed to the squashing o f the concrete floor slab. For cases where cracking and thermal strains in the slab were represented severe
stresses in the concrete slab in hogging caused numerical instability at a temperature o f 711°C. Surprisingly extending the floor slab outside the test area for both cases had very
little effect on the fire resistance. Regardless o f the rotational stiffness o f the connection, restraint to thermal expansion resulted in higher vertical displacements and therefore lower fire resistances due to an induced axial force. Most importantly he showed that compared with isolated beams failure temperature for a beam on a three-dimensional frame could be very significantly higher demonstrating the contribution o f the membrane and bridging actions o f the continuous floor slab.
There has been no published analytical work investigating the influence o f partial interaction at elevated temperatures. However, a number o f numerical approaches have
been proposed to investigate this effect at ambient temperature. Based on tests Siess148 proposed an equation expressing the slip strain in terms of compressive force in the slab
and the applied external moment. Yam et. al.149 used this to derive a second order nonlinear differential equation for the equilibrium o f any section along the length o f a simply supported beam. The equation was then solved using a step-by-step method o f numerical
integration. The method assumed that the shear connection acted as a continuous medium
along the length o f the beam and the concrete slab and steel beam deflected equally so
that at any cross-section they had identical curvature. The model was laborious and
applicable only to specific end conditions. Hirst and Yeo150 incorporated an ingenious
shear connection element into a standard two-dimensional finite element computer model.
Both the steel beam and concrete slab were represented by a grid o f standard elements
and connected together by means o f standard quadrilateral elements representing the
shear connection. The connecting elements were assumed to deform in bending as well as in shear and their stiffness was derived empirically.
23

Chapter 2: Literature Review
Roberts et. al.151 described a finite difference formulation for the analysis o f composite beams with partial interaction. The cross-section was divided into two parts, namely the concrete slab and the steel I-section. The influence o f uplift forces was taken into account
by having independent vertical and rotational displacements for the concrete slab and steel beam. The non-linear material characteristics and the effects o f large displacements were incorporated later by Al-Amery et. al.152 using the layered cross-section approach, but convergence was reported to be poor. Aribert153 presented a numerical procedure based
on the solution o f two non-linear equations derived from the equilibrium o f normal forces
and bending moments in the cross section and two others derived from the strain
compatibility at the steel and concrete interface. The boundary conditions at supports
were then introduced to evaluate the unknown variables.
The first finite element program specifically designed to consider the effect o f partial
interaction was proposed by Arizumi, Hamada and Kajita154. The model was based on the
principle o f virtual work and expressed the non-linear equilibrium equations in terms of steel, concrete and shear connectors. The composite section was idealised using two separate elements, namely the steel beam and the concrete slab with identical rotational and vertical deformations but independent axial deformations. The shear connectors were
modelled as a continuous medium transferring the shear force. Based on the work by Arizumi et. al.154, Abdul Wali155 extended a two-dimensional non-linear finite element model for steel frames144-145 to incorporate the effect o f the concrete slab and shear connection. Material and geometrical non-linearities were considered but the effect o f large deformations on slip deformation was ignored. Aribert153 also reported a finite element model using two parallel beam elements, one for the steel beam and the other for the concrete slab, with shear connectors represented by two diagonal truss elements.
However details about the procedure were not presented and the model was found to be inadequate in modelling the local buckling behaviour. Wright156 proposed a three- dimensional non-linear analytical model for composite beams with profiled metal decking.
The method was based on a dummy plate element between the slab and joist whose
material properties could be changed to simulate different shear stiffnesses. Details about
the procedure were not reported.
There have been relatively few studies on considering the influence o f semi-rigid
connections under fire conditions138-148. The treatment o f semi-rigid connections in finite
element models can be achieved in two different ways. The first approach is to replace the
rotational stiffness coefficients corresponding to the semi-rigid joints with stiffness values
defined by the moment-rotation characteristics. This method was adopted in
references155-157 but it was reported to be suitable only for beam analysis and potentially
unstable. However based on this approach, El-Rimawi, Burgess and Plank138-139
24

Chapter 2: Literature Review
incorporated semi-rigid connection characteristics in fire into a secant stiffness method22. The rotational stiffness o f the connection was represented using a modified version o f the Ramberg-Osgood equation158. The computer model was validated against the results o f a
non-sway portal frame test109. Although predicted beam deflections showed a reasonable agreement with both the test and another analytical model no details were given about the semi-rigid connections characteristics assumed. El-Rimawi et. al. also conducted a series o f studies which included a non-sway portal frame and a three-bay three-storey frame,
each with semi-rigid connections. The results for single bay frame suggested that column-
led failure results in premature collapse o f the structure (575°C) and that beam-led failure
was more preferable (680°C). This was also confirmed by the three-storey frame in which
column instability occurred at 650°C before beam deflections reached the limiting
deflection o f L/30. The author concluded that the survival o f a structure could be
significantly enhanced by properly accounting for the connection stiffness, but that the
precise form o f the moment-rotation characteristics was not very important in structural
analysis.
The second approach for incorporating connection stiffness is to use 'small' spring elements connected to the actual elements using identical degrees o f freedom159-160. The
spring element generally uses a rotational stiffness defined by the moment-rotation curve, and the influence o f other stiffnesses and the coupling effect are ignored. Using the same Ramberg-Osgood equation proposed by El-Rimawi158, Bailey147 utilised this approach for the treatment o f the semi-rigid joints.
The connection characteristics used in these analyses were based largely on assumptions and therefore not conclusively established. Clearly more research in the development o f further analytical approaches considering various connection characteristics is needed.
25

CHAPTER 3. MATERIAL PROPERTIES
3.1. Introduction
The mechanical properties o f the materials making up a composite section, namely the
steel beam, reinforcing bars, concrete and shear connectors, deteriorate rapidly with
increase in temperature losing both strength and stiffness. Structural analysis o f composite
sections at elevated temperatures therefore requires the mathematical representation o f the stress-strain-temperature characteristics o f these materials. Material models are based
on experimental data and can be highly sensitive to the testing procedures. In addition,
with non-homogenous materials such as concrete, there are a large number o f other
parameters associated with its micro structure which might also affect these characteristics considerably and there are often considerable discrepancies between the results from different investigators. The properties o f steel are rather more consistent partly because o f the greater homogeneity o f its micro structure.
3.2. Material Properties of Steel and Reinforcement at Elevated Temperatures
Several investigators have carried out tests to determine the stress-strain-temperature relationship o f steel at elevated temperatures27-28’30’34-79. Results indicate a decrease in
both yield strength and Young's modulus and a small increase in the coefficient o f thermal
expansion as the temperature is increased. However the precise relationship between these
material properties and temperature varies significantly due to different rates o f loading, heating and different steel types as well as the different testing procedures on which the
experimental data is based23-30’34. In the U.K, a comprehensive anisothermal testing
programme was conducted leading to a typical set o f stress-strain-temperature curves as
shown in Fig. 3.140-77.
It can be seen that up to 200°C the effect o f temperature on material properties is negligible. Only 14% o f the steel's yield strength at ambient temperature is lost and
Young's modulus remains unaffected. Above 300°C, however, there is no a clearly
defined yield strength. The curve loses its idealised linear elastic-perfectly plastic
characteristics at ambient temperature, by developing a rounded transition region between
the elastic and plastic region. This relatively sudden loss o f strength is attributed to the
thermally activated flow39. Between 300°C and 400°C there is a little change in material
26

Chapter 3: Material Properties
behaviour, whereas beyond this temperature range the ultimate strength corresponding to a strain o f 2% and Young's modulus decrease very rapidly. The stress-strain characteristics become highly non-linear with a very short linear elastic part.
Stress (N/nim?)
Fig. 3.1 Typical stress-strain-temperature curves for grade 43 steel77.
Due to the highly rounded shape o f the stress-strain curves beyond 200°C it is difficult to
represent the material properties using a bi-linear model and therefore a more precise model specified in EC4 Part 1.280 has been adopted. The model is based on anisothermal
tensile test data for heating rates between 2 and 50°C/min. The effect o f high temperature
creep is not explicitly considered. As shown in Fig. 3.2(a), the stress-strain-temperature
curve consists o f three different parts, namely the elastic, transitional and perfectly-plastic
parts without strain hardening. The relationship in the transitional part is elliptical and expressed as a polynomial function o f proportional limit o apri6)f ultimate strength o amax(9)
and elastic modulus £ a(9). The same expression is used for steel in both compression and
tension.
In structural analysis at high temperatures the effect o f thermal deformations must be
included. The thermal strains depend on the coefficient o f thermal expansion which also
27

Chapter 3: Material Properties
varies with increase in temperature. The model defined in EC4 Part 1.280 expressing thermal strains in structural and reinforcing steel as a function o f temperature has been used (Fig. 3.2(b)). This is in the form o f a second degree polynomial for temperatures up to 750°C. Between 750°C and 850°C the coefficient is constant, and is expressed as a linear function beyond 850°C.
- 3
Temperature ( °C)
(b)
Fig. 3.2 Stress-strain and thermal strain models for the steel and reinforcement (EC4)80.
3.3. Material Properties of Concrete at Elevated Temperatures
The stress-strain characteristics o f concrete at ambient temperatures are highly non-linear because o f the gradual deterioration o f the bond between the aggregate and mortar with
increasing stress. The concrete slab in a composite beam is subjected to a two-
dimensional stress state. Therefore the stress-strain characteristics may be more realistically represented if the modelling o f these characteristics is based on biaxial testing
procedures161'163. However these tests are complicated and their results are scattered48.
Because o f this and the fact that ultimate compressive strength under biaxial compression is always higher than the uniaxial strength the concrete material properties used in this
work are based on data for uniaxial load conditions.
The influence o f isothermal and anisothermal testing procedures on the stress-strain-
temperature characteristics o f concrete has not been established conclusively87. The
findings from various investigations are based on isothermal uniaxial compression tests and show a considerable scatter54-59.

Chapter 3: Material Properties
Typical anisothermal stress-strain-temperature curves by Furamura49 are shown in Fig.3.3. As can be seen from the figure, there is no change in the ultimate strength up to a
temperature o f 300°C. This may be attributed to the accelerated hydration o f cement51-54’56’57. However the failure strain is approximately 50% higher than its value at
20°C. Further increase in temperature results in a steady decrease in both ultimate strength and elastic modulus and strains at maximum stress also increase considerably. At 700°C, 63% o f the ultimate strength o f concrete at ambient temperature is lost and the
strain at maximum stress is increased by approximately four times its value at 20°C.
Normalised Stress
Fig. 3.3 Typical stress-strain-temperature curves for concrete49.
For the purpose o f this investigation a non-linear expression specified in EC4 Part 1.280
has been used to represent the relationship as a polynomial equation based on
anisothermal test data and expressed as a function o f the ultimate compressive strength
and corresponding strain as shown in Fig. 3.4(a). The relationship is extended in the
opposite direction to include a linear tensile part up to a maximum tensile strength
equivalent to 10% o f the compressive strength. The formula does not extend beyond the
point o f maximum stress in compression or tension. A thermal strain-temperature
29

Chapter 3: Material Properties
relationship specified in EC4 Part 1.280 and expressed as a third degree polynomial between temperatures 20°C and 700°C and a constant value beyond 700°C has also been adopted (Fig. 3.4(b)).
Elastic-plastic(a)
-3
(b)
Fig. 3.4 Stress-strain and thermal strain models for the concrete (EC4)80.
3.4. Material Properties of Shear Connectors at Elevated Temperatures
The structural analysis o f composite beams in which the effect o f slip between the slab and the steel I-section is included requires the shear force-slip characteristics o f shear connection. In modem composite construction welded headed studs o f various lengths are
most common. The force-slip behaviour o f these studs is normally obtained by push-out
tests in which they are subjected to pure shear60-70 even though this testing method is not
representative o f the behaviour under bending conditions in a composite beam66-68-70. In
general the strength and ductility o f studs in beams are reported to be better than in push-
out tests68. This is because there is a considerable redistribution o f load to the less highly
stressed shear connectors. However it is reported that an assessment o f the behaviour of
studs in beams is difficult and force-slip characteristics from push-out tests are adequate
for structural analysis68.
The force-slip behaviour from push-out tests depends on a number o f parameters, such as
the compressive strength o f concrete, the tensile strength o f the stud, the slab
reinforcement, the weld collar around the shank of the stud, the size o f the stud and the
loading conditions, namely cyclic or static loading. Some tests are conducted using
profiled metal decks which may result in lower strengths for the studs in a solid concrete
30

Chapter 3: Material Properties
slab due to different stress distributions67-70. The direction o f the trough profiles parallel or perpendicular to the beam may also have a significant effect on these characteristics67-68.
Normalised Force
Fig. 3.5 Typical force-slip-temperature curves for shear connectors71.
Published research on the influence o f temperature on the force-slip characteristics o f the
studs is very limited. Kruppa71 recently presented some test results for the force-slip-
temperature characteristics o f a 19x 100mm headed stud. These curves are shown in Fig.
3.5 in terms o f normalised force and slip. It can be seen that they are highly non-linear and up to 300°C they result in very little reduction in ultimate shear force. Considering that
the temperatures within the slab rarely exceed 200°C according to test data71-97'100, the full range o f these characteristics may not be required.
In the present study the option o f degrading the force-slip characteristics has been
introduced using a trilinear model fit to the experimental data71 (Fig. 3.5). In situations
where the effect o f degrading these characteristics is ignored, experimental force-slip
curves at ambient temperature by Chapman and Balakrishnan60 have been utilised. These
curves are also idealised as a trilinear model by approximating them into three distinct
31

Chapter 3: Material Properties
parts, a linear-elastic part up to 55% of its ultimate shear capacity, a linear transitional part with a reduced tangent modulus and a perfectly-plastic part beyond 95% o f its ultimate load (Fig. 3.6). This is very similar to the representation o f the curve for temperatures less than 100°C in Fig. 3.5.
Normalised force (F/Fuit )
Fig. 3.6 Force-slip model for shear connectors.
32

CHAPTER 4. THE MATHEMATICAL MODEL
4.1. Introduction
The work presented herein concerns the development o f an analytical model for
investigating the behaviour o f composite beams under fire conditions. A typical section
consists o f a steel I-section with a reinforced concrete slab connected to its upper flange
using flexible shear connectors. The model has been developed in two different directions. In the full interaction model the influence o f slip between the concrete slab and steel beam was ignored, assuming full shear connection, whereas in the partial interaction model this
is accounted for. Both theoretical models are based on a well established two-dimensional
non-linear finite element formulation for steel frames at ambient temperatures (INSTAF)1441« .
4.2. Full Interaction Formulation
4.2.1. The Concept of the Theoretical Model
The full interaction model incorporates the influence o f the reinforced concrete slab and high temperature with minimum modification to the original formulation used in INSTAF. This is described in detail in Reference144. The general principles are set out here for completeness and modified parts o f the program will be discussed in more detail.
As shown in Fig. 4.1 the proposed model utilises a single line element to represent the
composite section with four degrees o f freedom at each node, namely the axial
displacement, axial strain, vertical displacement and rotation. The effects o f material non
linearity o f the steel, concrete and reinforcement, geometric non-linearity due to large
displacements and a non-linear strain-displacement relationship have been considered. The
following assumptions are made:
1. The member is straight, prismatic and symmetric about the Y-Z plane and the Z axis coincides with the centroidal axis o f the composite section.
2. All loads are applied in plane at nodal points.
3. Composite action is achieved by an infinitely stiff shear connection so that the slip at any point along the beam is zero.
33

Cha
pter
4: T
he M
athe
mat
ical
Mod
el
Fig.
4.1
Fin
ite e
lem
ent r
epre
sent
atio
n of
a co
mpo
site
bea
m w
ith fu
ll in
tera
ctio
n.

Chapter 4: The Mathematical Model
4.2.2. Basic Formulation
The equilibrium equation is derived utilising the Principle o f Virtual Work. For a beam element o f length 7 ' this is expressed as
5(0 = J J o z.8ez.i^4.ife-{Q}.{5^} = 0 (4.1)l A
where,
(0= virtual work;gz , e2= normal stress and strain;A= cross-sectional area o f the composite section;{Q}= vector o f nodal forces;{7}= vector o f nodal displacements.
In order to evaluate Eq. (4.1) the variation o f strain, 8e2 must be known. This is done by
using Saada's axial strain-displacement equation for large displacements144-164 as was
adopted in the original program. This can be written as
e* = w' + ! [ M 2+ (v')3 (4.2)
The terms o f this equation can be obtained from the geometry o f Fig. 4.1, assuming that
the slope at any point along the reference axes is:
' Av . „ vo = ~~~~ — sin 0
Az(4.3)
It then follows that
u = u0- y .v 0 «' = u'0 - y .v 0 (4.4)
and
v = v» - .y ( l-c o s 0 )
VV
*=■
1II (4.5)
where,
rj = cos0 = ^ l - ( v j 2 (4.6)
u > uo= horizontal displacements o f the composite section;
v > vo= vertical displacement o f the composite section;0 = rotation o f the composite section;
y = distance from centroidal axis (Fig. 4.1).
The variation in strain Se2 can now be evaluated by substituting these relationships into Eq. (4.2) and differentiating with respect to u'o, v0 and .
35

Chapter 4: The Mathematical Model
5e,=[(l+Ml)-y.v"]5wl
5vl^ ■ v 0-2 .v l2.y y 0.v0-y.(v'0)3v0+T}. ( / .v ; . ( v : ) 2) - ( / . ( v ; ) 3.(v :)2) ^
+ ^ - [ " 'n 2[>’ (1 + Ml ) + >'2-vl ] - 'n > , (vJ 2 + >;2 (vo)2-vl]5vI (4.7)
Substituting Eq. (4.7) into the virtual work equation (4.1) and using the constants a,, a 2 and a 3 the equilibrium equation can be rewritten as
5to = J [a ,. 8 u0 + a2.&v0 + a3.5v”]. dz - {£)}. {S?} = 0 (4.8)i
The derivation o f these constants is based on the evaluation o f stress resultants and described in Reference144. Since the displacements u0, v0 and at any point are functions
o f a discrete set o f six generalised nodal displacements qiy Eq. (4.8) may be expressed as
9co rv - = ^ r = i
du'„ dv' dv" a,-r JL+a2-^f-+a3— -dqt \ [ dq, dq, dq,
dz-Q i = 0 (4.9)
where,
Vi- partial derivative o f virtual work with respect to nodal displacements;
Qi= nodal force co-ordinate.
Equation (4.9) is non-linear and a solution may be obtained by using the Newton-Raphson method165 which can be represented in the following form:
T~A<7 - = -y ,. (4.10)bqj.
where,
incremental nodal displacement co-ordinate.♦
Substituting Eq. (4.9) into Eq. (4.10) leads to the general form o f non-linear equilibrium
equation, which can be expressed in matrix form as
f c ] - A ? ,= { A e } (4.11)
where [Kr ] and {AQ] are respectively the stiffness matrix and the incremental
unbalanced force vector:
[K t ] = f 9a, 9un . 9a2 9vl . 9a, dv0 .dzJ_ l 9?, dq, ’ 9q, 9q, ' 9qj 9q,
■ a - J/'a K + a K + a K L 13?, 3?, J .dz
(4.12)
(4.13)

Chapter 4: The Mathematical M odel
The Gaussian integration method165 using four Gauss points and weighting factors has been used to determine the above integrals. The iterative procedure is carried out until the incremental unbalanced force vector {AQ} is sufficiently small and therefore equilibrium
is reached.
In order to evaluate the integrals the displacements at each Gauss point along a finite element are required. These are obtained by multiplying a set o f algebraic shape functions,
which are cubic polynomials, by the generalised displacements at the nodes144-145.
4.2.3. The Non-linear Inelastic Formulation at Elevated TemperaturesThe constants a, to a 3 and their derivatives in the Eqs. (4.12) and (4.13) are functions of
internal stress resultants and they need to be determined at each Gauss point over the
cross-section. In addition parts o f the cross-section may be at different temperatures and the tangent modulus Et for the corresponding stress-strain curves may be different. Since
it is not computationally efficient to use a tangent modulus which varies continuously throughout the cross-section, a transformed-section method has been employed.
The composite cross-section is divided into 11 segments in which the variation in strain is assumed to be linear as shown in Fig. 4.2(b). The strains at the extremities o f each
segment can be calculated from Eq. (4.2).
37

Cha
pter
4: T
he M
athe
mat
ical
Mod
el
00ro
Fig.
4.2
Tra
nsfo
rmat
ion
of p
late
seg
men
ts.
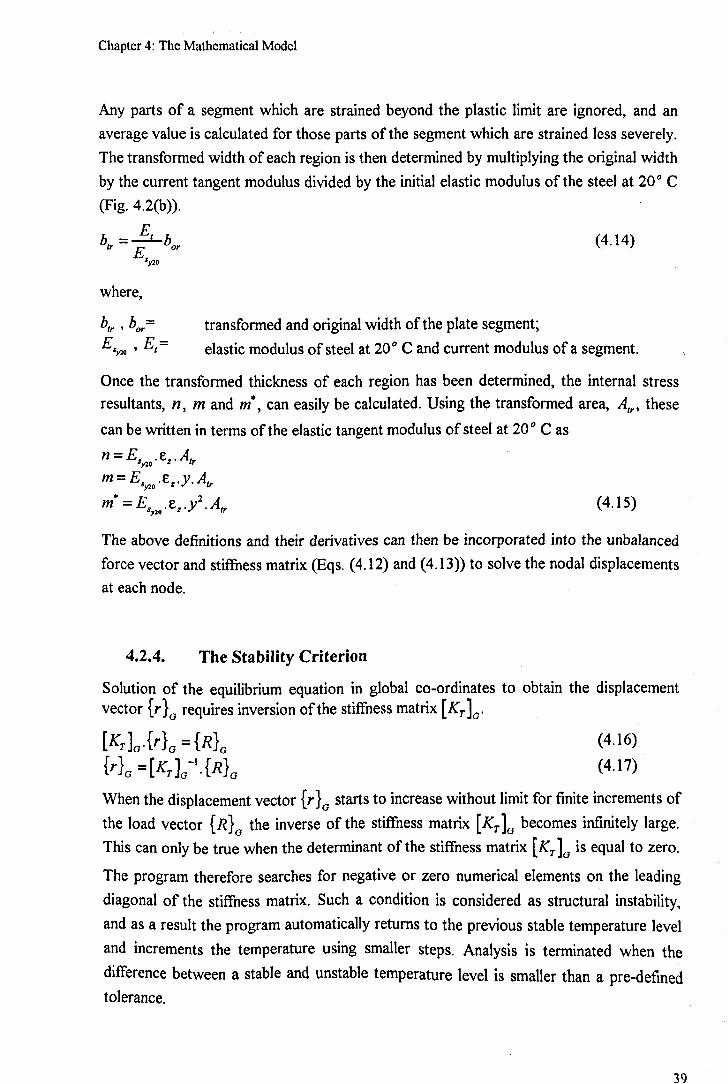
Chapter 4: The Mathematical Model
Any parts o f a segment which are strained beyond the plastic limit are ignored, and an average value is calculated for those parts o f the segment which are strained less severely. The transformed width o f each region is then determined by multiplying the original width by the current tangent modulus divided by the initial elastic modulus o f the steel at 20° C (Fig. 4.2(b)).
K E.■>20
where.
tr > borEs > E =
*y20 ’ *
(4.14)
transformed and original width o f the plate segment;
elastic modulus o f steel at 20° C and current modulus o f a segment.
Once the transformed thickness o f each region has been determined, the internal stress resultants, n, m and m*, can easily be calculated. Using the transformed area, Atr, these
can be written in terms o f the elastic tangent modulus o f steel at 20° C as
syU> 1 '
m = E s ^ - y - Atr(4.15)
The above definitions and their derivatives can then be incorporated into the unbalanced force vector and stiffness matrix (Eqs. (4.12) and (4.13)) to solve the nodal displacements at each node.
4.2.4. The Stability Criterion
Solution o f the equilibrium equation in global co-ordinates to obtain the displacement vector {r}G requires inversion of the stiffness matrix [A j.]g.
[ * r L M 0 = M „ (4-16)
W o r i ^ L - ' - M o <4-17>
When the displacement vector {r} starts to increase without limit for finite increments o f
the load vector {/?}G the inverse o f the stiffness matrix [Kt]q becomes infinitely large. This can only be true when the determinant o f the stiffness matrix [ £ j.]g is equal to zero.
The program therefore searches for negative or zero numerical elements on the leading
diagonal o f the stiffness matrix. Such a condition is considered as structural instability,
and as a result the program automatically returns to the previous stable temperature level
and increments the temperature using smaller steps. Analysis is terminated when the
difference between a stable and unstable temperature level is smaller than a pre-defmed tolerance.

Chapter 4: The Mathematical Model
4.3. Partial Interaction Formulation
4.3.1. The Concept of the Theoretical Model
The finite element analysis program INSTAF144*145 has been extended to include the reinforced concrete slab and the slip at its interface with the steel in composite construction. The original program uses a line element to represent the steel I-section
with four degrees o f freedom at each node, namely the axial displacement, axial strain,
vertical displacement and rotation. It considers material non-linearity o f the steel,
geometric non-linearity due to large displacements and a non-linear strain-displacement
relationship. In the modified model the additional effects o f material non-linearity in the
concrete and shear connectors, and the effect o f slip on large displacements, have also
been incorporated. The concrete slab and slip at the interface are taken into account by
introducing two parallel line elements representing the beam and slab. The model includes
two additional degrees o f freedom, allowing the concrete and steel to have independent axial displacements and strains. The present mathematical model makes the following assumptions in addition to those in the original version o f INSTAF:
1. The distributions o f axial strain in the concrete slab and steel I-section are assumed to be linear but different from one another.
2. Shear connectors are assumed to act as a continuous shearing medium along the length o f the beam, between the concrete slab and steel I section.
3. The vertical displacement, rotation and curvature o f the concrete slab and steel I- section are identical at the end of an element.
4.3.2. Virtual Work Formulation
In the case o f partial interaction, the axial deformations o f the slab and the beam are different and two line elements representing these two components are therefore used,
with axes positioned at the centroids o f the concrete slab and steel I-section. Six
independent degrees o f freedom are considered per node, as illustrated in Fig. 4.3.

Cha
pter
4: T
he M
athe
mat
ical
Mod
el
I jt ' I s
Fig.
4.3
Fin
ite e
lem
ent r
epre
sent
atio
n of
a co
mpo
site
bea
m w
ith p
artia
l int
erac
tion.

Chapter 4: The Mathematical M odel
The formulation utilises the Principle o f Virtual Work. The internal work must be expressed as the sum of the work done by concrete slab, steel I-section and shear connectors. Thus the virtual work equation takes the following form:
8(0 = J J c „ . 8e „ . i i 4c . i f e + J J a a .8e „ . £ i 4t . i f c + j F . 8A s . f i k - { ( 2} . { 5 } = 0 (4. 18)l Ac l A, l
where,
(0= virtual work;o s2 , eK= normal stress and strain in the steel I-section;
> ecz= normal stress and strain in the concrete slab;Ac , A= cross-sectional area o f the concrete slab and steel I-section; F= shear force per unit length;A5= slip at the interface per unit length.
The first two terms represent the virtual work done by the concrete slab and steel beam.
The third term is the virtual work done by shear connectors. If the slip modulus o f the shear connection layer is denoted as Qsh, this term may be written as
J/\8A s.t& = jQ sh.As.8As.dz (4.19)/ i
In order to evaluate Eq. (4.18) the variation o f strain, 8e„ and 8e„, and the slip per unit
length, 8As, must be known. Because o f the discontinuity at the interface between the slab and the I-section, the axial strain distributions must be derived separately for the two components using Saada's axial strain-displacement equation164 (Eq. 4.2). The terms o f
this equation for the two components can be obtained from the geometry o f Fig. 4.3, and
Eq. (4.3) as follows
U = 1/ — V VC *CO Sc * 0 uc =uco - y c.vaU ~U — V Vs **so Ss’ 0 ii i O
s (4.20)
and
v = vo - ^ ( l - c o s O )■ ' y .v’ v” (4.21)
where,
v , v „ =v ; , e =
y , > y c > y=
horizontal displacements in the steel I-section;
horizontal displacements in the concrete slab;
vertical displacement o f the composite section;
rotational displacement o f the composite section;
distance from the centroid o f the steel beam and concrete slab (Fig. 4.3).

Chapter 4: The Mathematical Model
The variations in strain 8e^ and 8e„ can now be obtained for the two components by substituting these relationships into Eq. (4.2) and differentiating with respect to u'co, uso, v0 and v^. For the concrete slab this gives
e « = ^ + 0 - 5 [ ( w J 2+ ( v J 2] - ; v v ; 1 + w~ + ^ p - + °-5^ « ( vl ) 2 1+ ^ f " (4 2 2 >
8ee2= [(l + Mra) - ^ .v ;]8 w w
+^r Ti3-vo-2.Ti2.y<;.v:.v;->/c.(vj3v:+Ti. U 2-v;.(v;)2) - ( j c2.(v;)3.(v;)2) sv;
+^ h 2h ( 1+^ ) +^ v»]-1i ^ ( v»)2 +^2(v°)2-v°]5v° (423)
and for the steel I-section
e« = «lo + 0.5[(wJ2+(v;)2]-jvvI 1 + «10+ ^ - +0.5.^2(v:)2 1 + - (4.24)
8e„ =[(i+«;0) - ^ . v;]8M;0
+ t7 [ T13' V‘,_ 2 Ti2• ^ • v‘ v‘ - ^ (v‘ )3v‘ + r |- >;2'v°-(v»)2 - ->;2 (v»)3 (v°)2]]5v°
+ ^ - [ - ,n2 [ ^ ( i + « l 0)+ > ;f2 v i] - r i .y J.(v;)2+>'2.(v;)2.v;]8v; (4.25)
The slip per unit length As at any arbitrary point along the length o f the beam can also be
determined from Fig. 4.3, as
As = — — = —(w — u + v .. v ) cosQ T| i0 “ y* o}
(4.26)
where,
y cb= distance between the centroids o f the steel I-section and concrete slab.
The variation in slip can similarly be determined by differentiating Eq. (4.26) with respect
t0 uc0-> us0 and v0. This yields(
8As = i ( 8 Mi0- 8 w J +_1
T13 Vo Uso- Uco+ycb-Vo + Svl (4.27)
Substituting Equations (4.23), (4.25) and (4.27) into the virtual work equation (4.18)
results in the equilibrium equation
43

Chapter 4: The Mathematical Model
&0 = J J ° “ {[(i + i#“ ) “ ^ - v»]Sm«l Ac
+ ^ h a- h - ( 1 + 0 ^ . v : ] - ^ . . ( v; ) J + y2A v 0)2 §v)^.dA0.dz
+J J °sz { [ ( ]5'4( At^ r i 3.v ;-2 .T i2. ^ . v ; . v ; - <yi .(v;)3v ;+ T i|^ 2.v;.(v ;)2 - ^ 2.(v;)3.(v;)2jj5v;
8v" \.dA..dz+ h a -(1+o + ^ .v:]-^.-(v:)1+>i.(v;)
~(8wi0-8wco) + “S-vJuMO-ueo+ycb.v0 + 1] Svl[m l Vo Jjdz
w ' y j -5 wl at/ w ' w y J
-{G}{8?} = 0 (4.28)
The equilibrium equation (4.28) can be expressed using the constants a\,a2,d3,a4,a5,a6,a7,ag, as
8co = J f o .Suso + a 3.&v0 + a 5 8v^].dz+ f [a2.buco + a 4.5vo +a6.bvo].dzi i
+ J [F (a 7 • 5Uso ~ ai •5W«, + Q% • 5V0 ] ^ “ {(?}■ {&?) = 0 (429)I
The derivation o f these constants is based on the evaluation o f stress resultants and constants a,, a3 and as for the steel I-section are identical to constants a2, a4 and a6 for the concrete slab. Thus only the constants for the steel beam and constants a7 and as representing the shear connection will be described.
a\ + u'~)-i»M.ve 1az=ns.vB~— ms.v0.v0 2 t f +Tl(v;)2 + ^ m lv 'o.{v0)2 ]2 + (v ;)2]
« 5 = ^ / w , [ n 2( i+ « ; j - T i ( v : ) 2]+ ^ /w ;.v :.[T i2 + ( v j 2]
1« 7 = -
111 ,
a 8 =~ T Vo 11
where.
n*=m.=
ms =
Uso-Ko+ycb-V'o +ii 2-yc
(4.30)
(4.31)
(4.32)
(4.33)
(4.34)
axial stress resultant in the steel I-section;
bending stress resultant in the steel I-section;
stress resultant due to the higher order terms in Eq. (4.23) and (4.25).
44

Chapter 4: The Mathematical M odel
The equilibrium equation (4.29) is approximate only to the extent defined by Eq. (4.3). Considering the displacements uso, uco uso v0 and v"0 at any point as functions o f a discrete set o f six generalised nodal displacements q,, it may be expressed as
9co rV , = T - = JH /
- \ F
Busr Bq,
Bus0a qt
■+a. ! H J3m
.dz + jI L
Bu,a * - £ r + a <oq,
Bv,-+ a, Bv"
a*, J.dz
■+ae Bv 1Bqt “ dqt
■dz-Qi = 0 (4.35)
Equation (4.35) is highly non-linear and a solution may be obtained by using the Newton-
Raphson method165 which can be represented in the following form:
Sy, A (4.36)
Substituting Eq. (4.35) into Eq. (4.36) leads to the general form o f non-linear equilibrium
equation, which can then be updated by allowing corrections to the displacements until equilibrium is achieved. The equilibrium equations can be expressed in matrix form as
[ * r ] M , = {A2} (4-37)
where [ * r ] and {Ag} are respectively the stiffness matrix and the incremental
unbalanced force vector and are given below. The iterative procedure is carried out until the incremental unbalanced force vector {AQ} is sufficiently small and therefore
equilibrium is reached.
fB a , Buso | B a, Bvo ( Bas Bvo
• Cfc + JB a2 B tL + Ba4 a v ; + B a6 Bvn
J_ J B qj Bq, B q j Bq, Bq} Bq, 1 [ ^ i Bq, B qj Bq, Bqj Bq, _
•I-a,) 3m„ d (F .a ,) du„ , 5 ( F a , ) Bv}
{A G} = 0 -
+ / F
I.1
Bu
Bq,
Bu'
.dz
a,l 'Bq, J Bq,
Bqj Bq, Bqj Bq, J
Bq{
.dz
(4.38)
Bv Bv" —+ a 3-^-2-+£Z5— -
„ ____a !*!~+a ^L 7 Bq, 7 Bq, 8 Bq, J
Bqim
.dz
dz + j On +aA-r^+a,6 J.dz
(4.39)
The Gaussian integration method165 using four Gauss points and weighting factors has
been utilised to determine the above integrals.
45

4.3.3. The Finite Element Model and Evaluation of Derivatives
At each Gauss point the partial derivatives involving u and v are evaluated using a set o f
algebraic shape functions which are cubic polynomials. The displacements at each Gauss point along a finite element are determined by interpolation. A typical composite element with partial interaction, its nodal displacements and the cubic shape function in terms of the non-dimensional position co-ordinate ^ , are shown in Fig. 4.4 and may be represented
algebraically as
Chapter 4: The Mathematical Model
wi0=<^>
y UCI’ ' VA
US1< UC0 = W)<UC1 II 0;
USJ UCJ v/
.USJ. ,UCJ .
(4.40)
where the cubic polynomials corresponding to each nodal displacement constitute the
shape function vector (<()),which is given explicitly in the original development o f
INSTAF144-145.
The derivatives in Eqs. (4.38) and (4.39) involving u and v can now be evaluated. The set o f derivatives involving a, to a 8 must also be determined numerically in order to construct
the stiffness matrix. The evaluation o f derivatives for the concrete slab and steel I-section (involving a, to a6) are similar so only the terms associated with steel I-section and the
interaction force are presented. For the steel beam these can be written as
9a, /. . \ 9« 9u' .. 9/w 9v"Mj 9 qj 9 q}. dqj 9 <7,
( / . \2 \
(4.41)
' aq, "■ a9,V .Vro* o
T12 +
(v l)2
Tl2
9 am,
9
“ AM,
-AM.
VoTl
2 + ( 0• \2
9vl i v„ 9 q} Tl
2 + 5 . ( v ; f . 3 . W,\4 \
Tl Tl
9vl
2Vq Vq
Tl( 0
, \2 \
9 a,9 q,
1 +n ,. \2
3vl (v;)1. \2 (
5 _
-AM.
+AM.
\ + u' +(v;)2
Tl
Mj Tl(
i +5.(v; ) ! +
Mi
4-(vl)
►Uv:)t, \2 (
T1 +
4 \9v’
Mi
Tl2
(4.42)
9 mlMj
9 ms M}
■+v. 1 +k )
n !
2 \9/m;
M i
M o , VgMi Tl
L « ! ] av;^ 2
TlV >
Mj
1+
.V Tl2
1 \2 ^ ..................f9v 2 v v
1+Mj Ti2
w- \ 2 > \
V
9v‘
M j(4.43)
46

Chapter 4: The Mathematical Model
Y
(a) Nodal displacements in local co-ordinate system
(b) Nodal displacements in global co-ordinate system
< > 4 = - ( $ - l ) ( $ + l ) H 8
(c) Shape functions
4> i - -(5 + 2X 5- 1)4
2
2
Fig. 4.4 Degrees o f freedom and cubic shape functions.

Chapter 4: The Mathematical Model
When the interaction force is within the elastic region and Qsh is the elastic modulus which
expresses the initial slope o f the load-slip relationship (see Fig. 3.6) the derivatives ct j £)(■/** a )
— ——— a n d ----- — corresponding to the shear connection may be calculated using thedqj dqj
relationship
F = Qsh -As
together with Eqs. (4.26), (4.33) and (4.34)
d{F.an) duco_dqj dq}-
+( ( y* 1+i 2 (VJ V % 2 2' ^ 0” Me0
T
9vldqj
(4.44)
(4.45)
and /
V dq}. 71T f i r t f e + « » " 2- U ' 0 ■ U CO + 6- “ s o - y j o - 6- U c o - y j o )
j f c + u l —2.uso.ueo + 2.uS0.ycbv0 — 2.uco.ycbvg)
+ ^ a * - ^ - ( 5 . r i a.(v;)a + 4 .(v J 4 +T14)
+ ^ T & [v l(2 .w i0-2 .t /eo+ 2 .y e6.v J + Ti2. ^ ] .
Kdq}.
du'so H ,_ d<Ij a<7;.
(4.46)
When the interaction force is in the plastic region these partial derivatives become
d{F a7)dqi ypi
J pi
+ ^ [ v ; ( F , - a , A * , ) ] g
Qsp^y )[(«*, - »„ + 3 vlVrf,)
(4.47)
T 3 ^ T|9“«, diicodqj dqj
(4.48)
Beyond the plastic limit the derivatives are expressed as
dq> L ’i1 dqi(4.49)
48

Chapter 4: The Mathematical Model
d{F.a%)
/ u/f= ^ { uso -‘uco+ y A l +v'oi) 1+
3(v;)2
VTKa*,
Fuitv'oTl3
¿«so duadqj dq j \
(4.50)
where,
Fy , Fult= Qsp=^y =
yield and ultimate strength o f the shear connector;
tangent modulus in the plastic region;
slip corresponding to yield strength o f the shear connector.
4.3.4. The Non-linear Inelastic Formulation at Elevated Temperatures
The stress-strain-temperature behaviour o f steel and concrete are highly non-linear and as a result the initial tangent modulus varies significantly with both increasing stress and
changing temperature. If parts o f the cross-section are subjected to a temperature gradient or different stress levels the corresponding tangent modulus E, will need to be varied. In
order to avoid the use o f a continuously varying tangent modulus the transformed-section method described in Section 4.2.3 has been utilised.
4.3.5. Evaluation of Cross-Section Properties and Stress Resultants
Once the transformed area o f each region, Av, has been determined, the first and second
moments o f area o f the total cross section can be calculated as
R - \ 4“II
«----.
A *tr A ctr
4sII4°*»
1----» 4*•»TII4s
A jtr
1 ^ = 4 .A *r A et,
¡y - = / >.. 4s
II4“=3<*> oSs
'—.
A *tr A ctr
(4.51)A jtr
The terms a, to a 6 are related to the internal stress resultants, n, m and m*. In the present
case both concrete and steel must be represented, and the stress resultants are then defined by
49
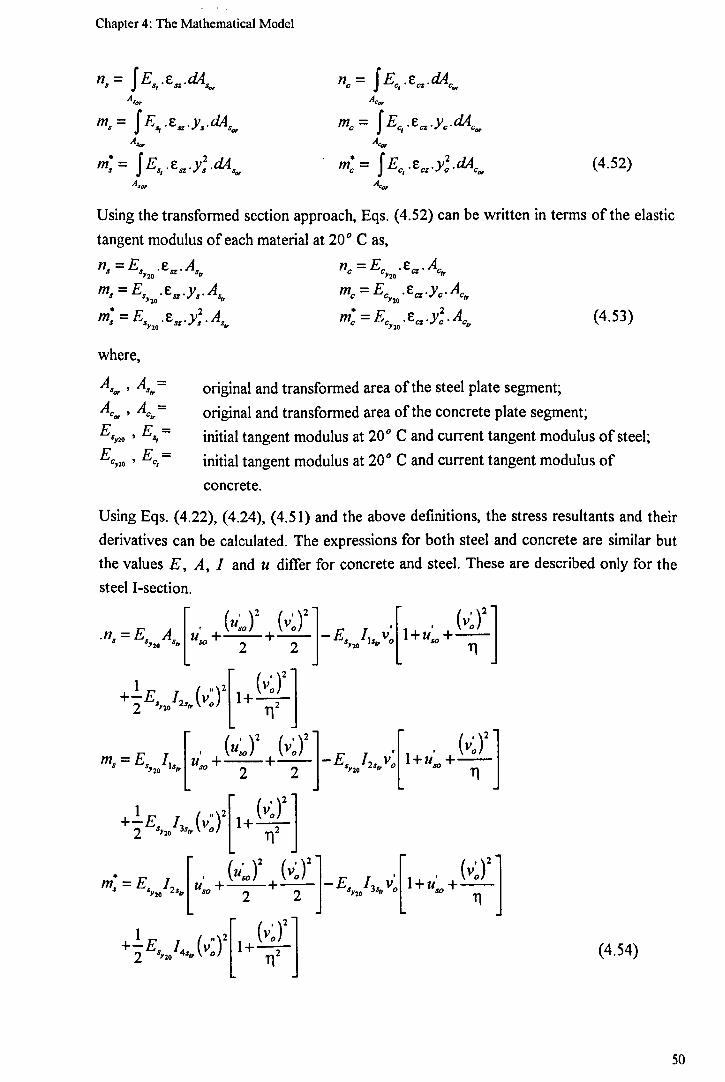
Chapter 4: The Mathematical Model
«c = ¡ E ^ . d A ^¿C o ,
m = [ E, .E„.V'.dA'S J Sf SZ <s s Sg f 1' ECi.zcl.yc.dAC"
m'= \ E Sl.eS!.y2t .dASor ™c= \Ecl-za-y2c-dAc„ (4.52)Am sot
Using the transformed section approach, Eqs. (4.52) can be written
tangent modulus o f each material at 20° C as,
in terms o f the elastic
ns =Es .ea .As3 S y 2 o S Z S f, ”c= E Cywe«-AClrmc = ECyM.za .yc.ACit
mc — ECyw (4.53)
where,
original and transformed area o f the steel plate segment;
original and transformed area o f the concrete plate segment; initial tangent modulus at 20° C and current tangent modulus o f steel;
initial tangent modulus at 20° C and current tangent modulus o f
concrete.
Using Eqs. (4.22), (4.24), (4.51) and the above definitions, the stress resultants and their derivatives can be calculated. The expressions for both steel and concrete are similar but the values E , A, 1 and u differ for concrete and steel. These are described only for the steel I-section.
(4.54)
50

Chapter 4: The Mathematical Model
The derivatives o f the stress resultants for the steel I-section can now be calculated as
dns _a?,
= E. ASy * *20
+E. L
dqf dqj j
«?, 3?, n
v k r» \2 / / ' \2 \
9/M
+-ES / 3i S>20 3i"-
11
(1 + "l0)
»9«’
1 + 9v:— + v.3?, *
V
1+
° 9 ^ J
dqj dqj T|
,.\2 ( / ,\2 \1 +
Tl2
9v'
9 qj— + V,
/
2-
1 +V
9w*= £ . / , (1 + WJ
. \ 9m' , 9v'•+ v
9^. 0 9 ^
hsS>1Q SS*
+E, 1.
„9u / , \ 9v v v"V° i r + ( 1+M-% 9 ^ Tl
V: - ( v : ) 2
iii+
( 0ii2
2\dv.
— + V,
01+
k f dvo
V3 ?/
( v ; n
r f J dqj
, w WI f
k n 3 v :dqj
, w
\dv'o
T l2 dqj
k n
i fy
dqj
> \2
■ \2
9 ^ Tl 9 ? ,
' \2
9 qj Tl 9 qs
(4.55)
These can then be incorporated into the stiffness matrix and unbalanced force vector (Eqs. (4.38) and (4.39)). The solution o f the equilibrium equation (4.37) and the stability criterion are identical to that described in the full interaction formulation in Section 4.2.4.
Above analyses form the basis o f two computer programs in FORTRAN developed to run
on a personal computer. The validation studies and some parametric studies presented in
Chapter 6 and 7 have been conducted using the programs.
51

CHAPTER 5. MATHEMATICAL REPRESENTATION OF SEMI-RIGID JOINTS
5.1. Introduction
The connections which join beams and columns in steel construction are generally
classified as simple (pin-jointed), semi-rigid and rigid (fixed). The important difference
between these connections, in the context of structural behaviour, lies in their rotational
stiffness.
With the exception o f portal frame buildings which are treated as rigid frames, most
connections are idealised as pinned. This is despite the fact that practical details can provide significant rotational stiffness132 and that treating the connection as semi-rigid might offer better structural performance with savings in material and therefore lower costs.
A considerable amount o f effort has been directed at establishing the connection characteristics for a range o f typical details, and a substantial body o f data now exist for bare steel conditions111’112’114’132’133. Several investigators115’117 have shown that construction o f composite action in semi-rigid connections further improves the moment carrying capacity o f the connection by 1.5 to 6 times that o f a non-composite one. This is
reported to be due to reinforcing bars being continuous over the supports114-115’118 and the
additional resistance to buckling provided by the concrete slab113-155.
The normal practice o f designing connections as pin-jointed provides a degree of
redundancy within the structure which may have a significant influence on its performance in fire. In order to investigate this it is necessary to represent the variation o f the moment-
rotation characteristics o f connections with increasing temperature but unfortunately little
data is available for this. Some tests have been conducted on the performance of connections in fire121'123 giving an indication o f performance and confirming that the high
temperature moment capacity o f composite connections is greater than that o f the
equivalent non-composite connection.
In order to investigate the influence o f connection rigidity on the performance o f the
complete structure in fire semi-rigid connections have been incorporated with both full
and partial interaction analysis models described in Chapter 4. Although there is a need
for further experimental work with large-scale specimens and newer fastening
52

Chapter 5: Mathematical Representation o f Sem i-Rigid Joints
techniques113, the computer model is aimed at providing a preliminary tool for understanding the influence o f such connections on structural behaviour in fire.
5.2. Mathematical Representation of Connection Characteristics
5.2.1. Non-Composite Beams
The structural performance o f a connection is generally described by its in plane moment-
rotation characteristics obtained from tests on beam-column assemblies. The behaviour is
generally non-linear with an initially stiff region followed by a marked reduction in
stiffness. Although the ambient temperature characteristics for steel-to-steel connections
are reasonably well established there is little published experimental work at elevated
temperatures.
In the present analysis, the moment-rotation-temperature characteristics are modelled using a Ramberg-Osgood equation derived by El-Rimawi158, which is fitted to the available data and an assumed end point corresponding to a rotation o f lOOmrad. At this rotation the reduction in moment capacity o f the connection is calculated on the basis o f the material strength reduction factors at 0.5% strain as given in BS5950 Part 877.
The moment-rotation characteristics are represented by
where (¡> is the rotation, M is the moment and A, B, and n are temperature dependent
constants and are given in reference158. The corresponding curves as derived by El-
Rimawi and the experimental points on which they are based are shown in Fig. 5.1(a) and
(b) for flush end plate and extended end plate connections respectively. These are based
on a 305 x 165 UB40 section and for different sections El-Rimawi proposed the following
modifications to the temperature-dependent constants.
where Am and Bm are the constants to be used in Eq. (5.1) for a section depth Dc and
(5.1)
Am = A x f - , B m= B x f 2 (5.2)
f = (Dc -5 0 ) /(3 0 3 .8 -5 0 ) (5.3)
53

Chapter 5: Mathematical Representation o f Sem i-Rigid Joints
Moment (kNm)
Moment (kNm)
Fig. 5.1 Moment-rotation-temperature curves for flush and extended end plates.

Chapter 5: Mathematical Representation o f Sem i-Rigid Joints
5.2.2. Composite Beams with Full interaction
Because o f the limited data available for composite connections, the steel-to-steel connection characteristics described above have been adopted for full interaction analysis
ignoring any stiffening effect o f the slab and reinforcement.
The connections have been modelled as zero length spring elements with four degrees o f freedom to ensure compatibility with the beam elements as shown in Fig. 5.2(a). The coupling effect between rotational, shear and axial displacements is ignored since its
influence on the overall behaviour is small in comparison with the direct stiffnesses160. The
spring element stiffness matrix can therefore be represented as follows:
--1 0 0 0 j ~Ku 0 0 0 '
0 K 0 0 ! 0 - K 0 0 u'l0 0 K 0 i 0 0 -** 0 V/0 0 0 *9 ! 0 0 0 1 1® 0;
0 0 0 l-- 0 0 0 U J
0 - K 0 0 ! o K 0 0 Uj0 0 - K 0 ' o 0 K 0 Vj0 0 0 i 0 0 0 9 1 8x8
CD
For full interaction, only the rotation is modelled, and the corresponding stiffness, ATe, is
defined by Eq. (5.1). The stiffnesses corresponding to the remaining degrees o f freedom, Ku,K'u,Kv, are assumed rigid and accordingly are represented by a very large numerical
value.
55

Chapter 5: Mathematical Representation o f Semi-Rigid Joints
Detail A
(a) Spring element for full interaction analysis.
Detail B
(b) Spring element for partial interaction analysis.
Fig. 5.2 Semi-rigid connection models for full and partial interaction analyses.
Chapter 5: Mathematical Representation o f Sem i-Rigid Joints
5.2.3. Composite Beams with Partial interaction
In the partial interaction analysis two parallel elements represent the steel beam and concrete slab, each contributing to the stiffness o f the connection. Therefore the
connection has been modelled as a pair o f rotational springs. As seen in Fig. 5.2(b), the finite element representation requires identical rotations and hence equal rotational stiffness for the spring elements representing the concrete slab and the steel I-section. In addition a linear spring element has been introduced to allow for the relative movement
between the steel and concrete at the beam end.
The need for this linear spring component can be illustrated by considering the case where
a very large number o f studs is used. This reduces the slip to a minimum and therefore the shear connection between the two spring elements may be assumed to be rigid as shown
in Fig. 5.3(a). If the relative movement at the ends o f the element is constrained this
results in a normal reaction force N' inducing an additional reaction moment which in
turn increases the rotational stiffness o f the connection compared with the full-interaction model (Fig. 5.3(b)). This does not arise in the case o f simply supported beams because the ends are free to move, nor for the fixed ended beams because end rotation is completely suppressed.
The model used to represent the semi-rigid connection is shown in Fig. 5.4, and is based on the following assumptions:
• There is a sufficient gap to prevent contact between the column flange and the steel beam.
• The concrete slab is also assumed to have no contact with the column in the direction
o f bending and is free to deform axially.
• The stiffness o f the axial spring, Ksu, is defined by the force-displacement relationship o f the reinforcing bars over a length *Drexp\
• The centre o f rotation o f the connection is at point J , for the concrete slab and at point J2 for the steel I-section as shown in Fig. 5.2(b).
• The extension of reinforcement is concentrated within a distance between the centre line o f the column and the first shear connector.
• The characteristics o f the reinforcement are modelled using a bilinear stress-strain relationship with a yield strain o f 2% (Fig. 5.5).
57

Chapter 5: Mathematical Representation of Semi-Rigid Joints
(a) Detail A. (b) Detail B
Fig. 5.3 The influence of the axial force due to the absence o f a linear spring.
58

Chapter 5: Mathematical Representation o f Semi-Rigid Joints
. A t A uW I
Fig. 5.4 Assumptions for the semi-rigid model for partial interaction analysis.

Chapter 5: Mathematical Representation o f Semi-Rigid Joints
(a) Parameters used in axial spring stiflhess.
o F
(b) Stress-strain model. (c) Force-displacement model.
Fig. 5.5 Force-displacement model for the linear spring.

Chapter 5: Mathematical Representation o f Sem i-Rigid Joints
The axial force is obtained by multiplying the yield stress by the cross-sectional area o f the reinforcing bars ( Ar) over the effective width. The displacement is calculated by
multiplying the strain by the distance between the centre line o f the column and the first shear connector (Drexp) as shown in Fig. 5.5(a). The axial stiffness is therefore constant
up to a displacement o f Alult and expressed as
Ka =Full/A luU (5.5)
where
A/u),= 0 .0 2 x D rexp (5.6)
(5.7)
and oul{ is the ultimate strength o f the reinforcing bar. For displacements greater than Aluh the model assumes that the axial stiffness is zero.
This connection model has been incorporated within the analysis using a zero length spring element stiffness matrix and the corresponding is as follows:
K m 0 0 0 0 0 - K m 0 0 0 0 0 ' ua0 0 0 0 0 11 0 0 0 0 0 u si0 0 0 0 0 0 0 - K m 0 0 0 Uq0 0 0 Km 0 0 0 0 0 - K . 0 0 u a0 0 0 0 K 0 0 0 0 0 - K y 0 v/0 0 0 0 0 *9 0 0 0 0 0
0 0 0 0 0 K m 0 0 0 0 0 USJ0 - < 0 0 0 0 0 0 0 0 0 USJ0 0 0 0 0 11 0 0 K m 0 0 0 ua0 0 0 - K . 0 0 0 0 0 0 0 ua0 0 0 0 0 0 0 0 0 K y 0 Vy0 0 0 0 0 -*e 0 0 0 0 0 *e_ 12x12
-----,o__1
If the full rotational stiffness from the moment-rotation curve is applied to both the steel
and concrete the overall rotational stiffness o f the connection will be doubled and hence the stiffness, K6, defined by the moment-rotation relationship in Eq. (5.1) was distributed
equally between the concrete slab and the steel beam. All other degrees o f freedom are
61

Chapter 5: Mathematical Representation o f Sem i-Rigid Joints
suppressed and hence the corresponding stiffnesses, are represented by a
very large numerical value. Again the coupling stiffnesses are ignored.
In order to validate this connection model load-deflection analyses were conducted at ambient temperature for a 6m beam with a centre point load (Fig. 5.6). Different connection models as shown in Fig. 5.7 were used to represent the extended end plate characteristics Fig. 5.1(b). In order to compare with full interaction, a very stiff shear
connection (100 studs along the length o f the beam) was considered. The results are
shown in Fig. 5.8.
Connection types 1 to 4 consist o f only rotational spring elements. In connection type 3
and 4, the rotational stiffness was equally distributed between the concrete and the steel
beam while in connection type 1 and 2 the full stiffness is applied to both. In connection
types 2 and 4 the axial displacement o f concrete slab is freely allowed whereas it is fully
restrained in Types 1 and 3.
Type 1 is the stiffest connection since the axial movement o f the concrete slab is fully
restrained and the total rotational stiffness o f the connection is effectively doubled. As a result the mid span deflections are much lower than the full interaction case and the predicted failure load is 723kN. Although releasing axial movement o f the concrete slab (Type 2) clearly results in slightly greater end rotations and mid-span deflections the differences are negligible. Types 3 and 4 are both more flexible because o f the reduced effective rotational stiffness. This results in increased deflections and reduced failure loads
o f 687kN for Type 3 and 676kN for Type 4.
However the behaviour is still significantly stiffer than the full interaction case, due to the
end moment induced by the axial forces (Fig. 5.3(a)). Connection types 5, 6 and 7
introduce a linear spring with a constant stiffness value o f 31500N/mm defined by the
bilinear force-displacement relationship o f reinforcing bars as shown in Fig. 5.5(c). For this particular example the variables Drexp and Ar in Eq. (5.6) and (5.7) were assumed to
be 216mm and 226mm1 respectively. The rotational spring stiffness is identical to those
used for connection types 3 to 5.
62

Chapter 5: Mathematical Representation o f Semi-Rigid Joints
134 kN
i
\
A. - ,
I
3 0 0 0
A _J
3 0 0 0
\
v-------------------------------------
6C 0 0 v
I5ÜÜ.
T= Bottom flange temp.
Section A-A and assumed temperature profile.
Fig. 5.6 Typical o f the main beams used in the large building test frame by BRE154.

Chapter 5: Mathematical Representation of Semi-Rigid Joints
Type 3 Type 4 T ype 5
Fig. 5.7 Connection models used for the optimum representation o f semi-rigid joints
64

Chapter 5: Mathematical Representation of Semi-Rigid Joints
Load (kN)
Fig. 5.8 Load-deflection behaviour for various types o f connection.
Chapter 5: Mathematical Representation o f Sem i-Rigid Joints
As expected the load-deflection behaviour for Type 5 is intermediate between Type 3 and 4 with a predicted failure load of 678kN. In Types 6 and 7, the linear spring was connected to the steel I-section. In order to determine the influence o f the axial deformation o f the concrete slab, in Type 6 the concrete slab is fully restrained against axial deformations whereas in Type 7 the axial deformation o f the concrete slab is freely allowed. As can be seen in Fig. 5.8, the load-deflection behaviour for these two cases is very similar, but both are significantly more flexible than Types 1 to 5 and the full
interaction case. Predicted ultimate load for Type 6 and 7 are 500kN and 490kN
respectively.
The influence o f slip is not significant in these studies due to the large number o f shear
connectors used. However with fewer shear connectors, the axial movement o f the concrete slab is likely to be more significant. It is therefore concluded that connection
type 7 provides the optimum representation o f the semi-rigid connection characteristics
for a composite beam with partial interaction and this model has been used in the further studies described in the following Chapters.
This connection model was also compared with pinned and fixed-end support conditions
for the same beam using both partial and full interaction analyses. The results are shown in Fig. 5.9, and indicate that the semi-rigid case predicts slightly lower deflections than the simply supported beam. In contrast the behaviour is significantly more flexible than for
fixed ended conditions. In all cases the partial interaction analysis indicates a softer response than for full interaction, as would be expected.
Fig. 5.10 shows a similar comparison with various degrees o f shear connection to represent a very soft interaction (5 studs), a typical interaction (20 studs), and a very stiff
interaction (100 studs).
In all cases the ultimate load increases as more studs are used. The failure mode for 5 and
20 studs with semi-rigid connections is stud failure. The corresponding failure loads are
310kN and 380kN respectively. As a result the full potential o f the composite section
cannot be fully utilised. For 100 studs, the failure mode is yielding o f the steel beam and therefore the failure load o f 495kN is significantly higher, indicating an improvement o f
more than 30%. These results suggest that the structural behaviour at ambient
temperature is equally sensitive to the changes in end conditions and the shear connection.
66

Chapter 5: Mathematical Representation o f Sem i-Rigid Joints
50
45
40
35
30
25
20
15
10
5
0
100 200 300 400 500 600 700 800 900
Load (kN)
Mid-span deflection (mm)
Fig. 5.9 Comparisons with idealised end conditions.

Chapter 5: Mathematical Representation o f Sem i-Rigid Joints
Load (kN)
Fig. 5.10 The influence of the number o f studs on different end conditions.

Chapter 5: Mathematical Representation o f Sem i-Rigid Joints
In the absence o f suitable independent data, these indicative studies provide a degree o f validation for the case o f partially composite beams with semi-rigid support conditions, at
ambient temperature. This is further supported by Fig. 5.11 which compares the results for idealised end conditions with those obtained by using very flexible springs (to represent simple supports) and very stiff rotational springs (to represent fixed ended supports).
In order to represent fire conditions, the comparison between partial and full interaction
analyses using three different types o f connection was repeated at elevated temperatures.
The beam utilised in the analysis is similar to the one in the ambient temperature studies but with one support free to deform axially to prevent any axial force due to restraint to thermal expansion. The assumed temperature profile is shown in Fig. 5.6.
The results are shown in Fig. 5.12, as plots o f temperature-deflection and demonstrate a similar pattern to the load-deflection curves (Fig. 5.9). Using both partial and full
interaction analysis, the failure temperatures, defined by a limiting deflection o f L/20, for
the simply supported and fixed ended beams are 700°C and 800°C respectively. The agreement between the partial and full interaction analysis for the semi-rigid beam is also satisfactory, with failure temperatures o f 750°C and 786°C respectively. The
improvement in the failure temperature over the simply supported beam is approximately 10%. The slight difference in predicted temperature is mainly because o f the axial force due to the partial restraint to thermal expansion in the semi-rigid model used in partial
interaction analysis. Nevertheless both the full interaction and partial interaction analyses indicate comparable failure temperatures and where similar end connections are used they result in consistent temperature-deflection behaviour.
A comparison in terms o f temperature-deflection behaviour using various degrees o f shear
connection namely, a very soft interaction (5 studs), a typical interaction (20 studs), and a
very stiff interaction (100 studs) is shown in Fig. 5.13. The structural behaviour for 5, 20
and 100 studs is identical up to a temperature o f 550°C. The difference in predicted
failure temperatures o f 749°C and 725°C, for 100 and 20 studs respectively, is negligible.
The failure temperature for 5 studs is 682°C, approximately 7.5% less than for 20 and
100 studs. This is a relatively small reduction suggesting structural behaviour at high
temperatures is not very sensitive to the number o f studs used. Because o f relatively cooler temperatures, the studs retain greater strength than the steel beam thus yielding o f the steel becomes more critical.
69

Chapter 5: Mathematical Representation o f Sem i-Rigid Joints
50
45
40
35
30
25
20
15
10
5
0
100 200 300 400 500 600 700 800 900
Load (kN)
Mid-span deflection (mm)Analysis with semi-rigid end connections Analysis with idealised end conditions
Flush end plate
_ ‘ i60 00
• ’ l
- Simply supportedRotational spring- stiffness = 0
''A : ff'1 '— —' , 60 I * io 1
-Extended end plate
'/A 1 w,A \ H
1 — -! 60 jo1 <
Fixed ended
Rotational spring stiffness =
Fig. 5.11 Comparisons between analyses with idealised and semi-rigid end conditions.
70

Chapter 5: Mathematical Representation o f Sem i-Rigid Joints
0 100 200 300 400 500 600 700 800 900
Temperature (°C)
Fig 5.12 Comparisons with idealised end conditions at elevated temperatures.
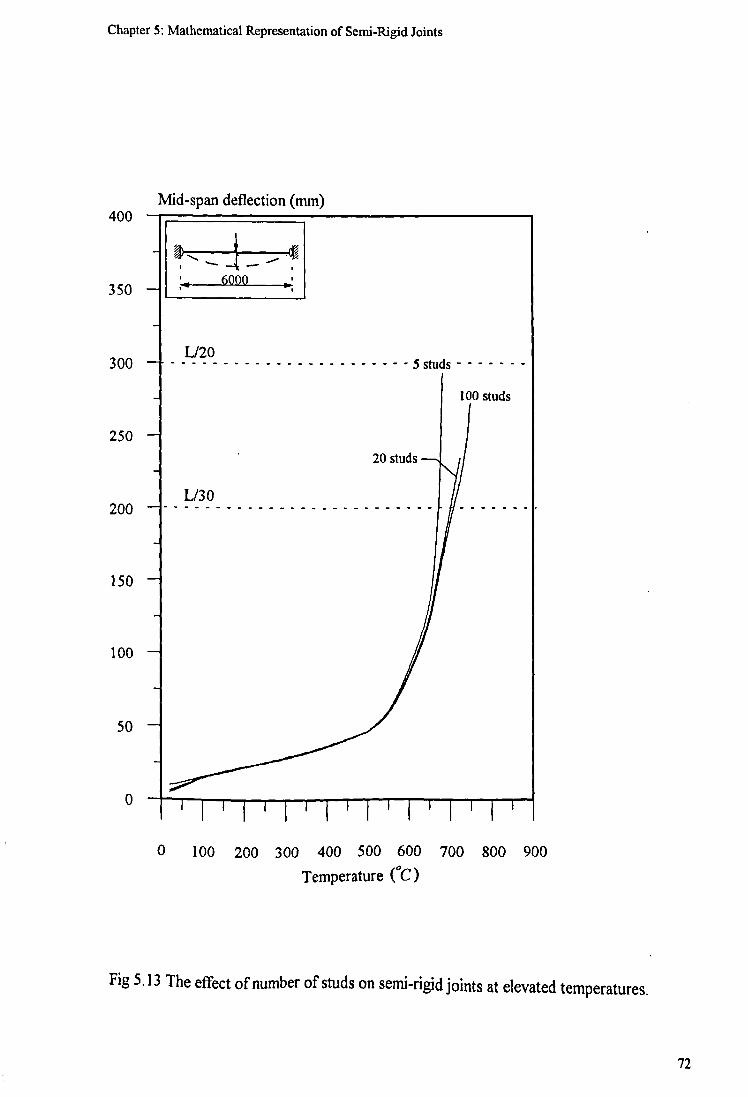
Chapter 5: Mathematical Representation o f Sem i-Rigid Joints
Mid-span deflection (mm)
0 100 200 300 400 500 600 700 800 900
Temperature (°C)
Fig 5.13 The effect o f number o f studs on semi-rigid joints at elevated temperatures.
72

Chapter 5: Mathematical Representation o f Sem i-Rigid Joints
These preliminary studies suggest that model adopted for representing the semi-rigid connection characteristics is reasonable. More rigorous validation o f the approach will only be possible when more detailed experimental data is available. The studies also emphasise the fact that the elevated temperature behaviour o f the beam may be different from the behaviour at ambient temperature. Even when the shear connection is very stiff, the semi-rigid connection model used in full interaction analysis may not be fully adequate
in representing the structural behaviour.
73

CHAPTER 6. VALIDATION OF THE MATHEMATICAL MODEL
6.1. IntroductionWith any finite element model it is necessary to carry out a series o f convergence studies
and comparisons with experimental data to demonstrate the validity o f the analytical
approach and to assess numerical stability and running speed during the execution o f the
program.
The accuracy and processing speed o f a finite element model depend upon the mesh
density. A convergence study has therefore been conducted with a varying number of elements in order to determine an optimum mesh density as well as to expose any possible mistakes in the code. In this study different types o f beam have been used with both full
and partial interaction.
In order to verify the applicability of the material and structural models utilised in the analytical model, some comparisons have also been made with published experimental data for fully and partially composite beams using various end connections at both
ambient and elevated temperatures.
6.2. Convergence Studies at Elevated Temperatures
In finite element analysis the displacements and internal forces are evaluated at the nodes
o f each element. The accuracy of the numerical integration used to determine the stiffness matrix and stress resultants depends on the number o f elements. Consequently this has a
significant influence on the results. It is generally accepted that as the number o f elements increases a better representation o f the structural behaviour is achieved. The use o f too
many elements, on the other hand, can be time consuming and may lead to potential
numerical instability. Therefore it is necessary to determine the optimum number of
elements to be used with different types o f beam. For this purpose a convergence study
using different beam types has been undertaken by increasing the number o f elements and
comparing the predicted temperature-deflection behaviour.
74

CA
RD
ING
TON
FR
AM
E PL
AN
(sc
ale: 1
.200)
Fig.
6.1
Typ
ical
flo
or p
lan
of C
ardi
ngto
n fra
me.

Chapter 6: Validation of the Mathematical Model
134 kNÌ A - 134 kNj 134 kNj B ^
B - ' û A-'
134 kN
1 0 0 0 I 1 0 0 0 . 1 0 0 0 J 1 0 0 0 J 3 0 0 0 , 1 0 0 0 J 1 0 0 0 ,
^ ________ 6 0 0 0 _____________ 2 0 0 0 _____________ , ________ 6 0 0 0 ______ ,
CÎ) Ò (3) ®(a) Typical Continuous Main Beam of Cardington Frame
14.9 kN/m a
a > . . . . . . . . . . . . . ) m M i i f l i i i i i i i i i i i i i i i i i i i i i i i i i i i i i i i i u i i . . . .G s,eei = 390 N /m n rd concrete = 3 5 N l Him2&reinforcemenF- 600 N / ÏÏW1 *"
_ _ _ _ _ _ _ _ _ 2000_ _ _ _ _ _ _ _ _ , P sntd = 1 0 0 N
(S> É )(b) Typical Secondary Beam of Cardington Frame
(d) Section A-A and assumed temperature profile
602.2
227.6T= Bottom flange temp.
(c) Section B-B and assumed temperature profile
Fig. 6.2 Details o f typical floor beam o f Cardington Frame110.

Chapter 6: Validation o f the Mathematical Model
A typical floor arrangement o f the Building Research Establishment's experimental 8- storey composite steel-framed building110 at Cardington (Fig. 6.1) has been used as the basis o f this study. The frame is typical o f a commercial office block. The main cross
frames consist o f a 9m inner span and two 6m outer spans. Two cases have been considered for these studies, namely an isolated 6m span beam with both fixed and simply supported end conditions, and the complete 3-span continuous beam. Details together with average material properties and assumed temperature profiles are shown in Fig. 6.2.
6.2.1. Full Interaction Analysis
The temperature-deflection behaviour for the simply supported beam is shown in Fig. 6.3
for increasing numbers of elements from 2 to 16. In all cases the critical temperature
based on a failure criterion o f a limiting deflection o f L/30 occurs at a temperature o f
650°C and the analysis terminated at 700°C due to a negative element on the leading diagonal o f stiffness matrix, indicating instability. It is clear that varying the number o f elements has a negligible effect on predicted deflections, and as a result it may be concluded that for simply supported beams sufficiently accurate results can be obtained by
using the minimum number of elements.
An investigation o f the strain development within individual elements indicated that failure was initiated by yielding o f the steel at mid-span at 650°C followed by crushing o f the concrete slab at 700°C. The mechanical strains at mid-span in the concrete slab and
bottom flange o f the I-section are shown in Fig. 6.4.
The same beam was analysed assuming fixed end conditions. In situations where the axial expansion o f the beam is restrained, an axial force is induced at high temperatures. In
order to investigate the influence o f this, two cases were considered. In one case
expansion is freely allowed but in the other it is fully restrained.
The results o f the axially unrestrained beam are shown in Fig. 6.5. The temperature- deflection curves are identical up to a temperature o f 650°C where the deflections start to
increase rapidly. As a result the deflected shape o f the beam cannot be accurately
represented by the shape functions using a small number o f elements. This generally leads to stiffer temperature-deflection behaviour, and this is reflected in the temperature-
deflection curves. However, the differences are relatively small. The predicted failure
temperatures using 2 and 16 elements are 800°C and 770°C respectively, a discrepancy
o f only 4%, and the corresponding deflections for all analyses exceed the limiting
deflection o f L/30. The use o f more than four elements along the length results in only
77

Chapter 6: Validation o f the Mathematical Model
negligible differences in the behaviour. Hence it may be concluded that the four element representation o f the beam provides satisfactory accuracy.
As can be seen from the strains in the top o f concrete slab at the supports (Fig. 6.6), the concrete cracks under tension at temperatures above 20°C and has very little influence on the structural behaviour. The strains in the bottom flange (Fig. 6.6) indicate that above 650°C the steel near to the supports yields and the stresses at mid-span then increase
rapidly. The failure corresponds to the formation of third plastic hinge at this point.
The temperature-deflection behaviour for the axially restrained fixed ended beam is shown
in Fig. 6.7. In all cases the predicted deflections are identical up to 500°C. As with the
axially unrestrained fixed ended beam, at higher temperatures the deflections increase
rapidly due to yielding o f the steel near to the supports (Fig. 6.8). As the number o f
elements is decreased the structural behaviour becomes stiffer because the deflected shape
o f the beam is less accurately modelled.
The failure temperature is about 9% lower than the axially unrestrained case due to the influence o f axial force. All analyses terminated as a result o f negative elements on the leading diagonal o f the stiffness matrix, with deflections slightly in excess o f L/30 and failure temperatures ranging between 725°C and 700°C indicating an error o f less than 3.5%. These results suggest that the use o f four elements for fixed ended beams is satisfactory.
The results for the continuous beam are shown in Fig. 6.9. The deflections are for the mid-span o f the 9m centre span. The number o f elements representing this span is 4, 6, 12 and 16 whereas each o f the two 6m outer spans is represented using 2, 4, 8 and 10
elements respectively.
It can be seen that up to 600°C all cases are identical. At this temperature plastic hinges
form at the supports and bending is redistributed towards the middle o f each span. The
beam fails when a third plastic hinge forms at the centre o f the inner span. The predicted failure temperature varies between 675°C and 725°C depending on the number o f elements used along the length, representing a range o f less than 7.5%. The results
indicate that six elements in the 9m inner span and four elements in the 6m outer spans
give a satisfactory representation for the beam.
78

Chapter 6: Validation o f the Mathematical Model
Mid-span deflection (mm)300
200
250 -
134 kN
Z I '' ' ._____i
U_____ 6Ûno r -
150 -
100 -
50 -
0
IS 2 Elements E 4 Elements ♦ 6 Elements o 8 Elements □ 10 Elements ■ 12 Elements 6 14 Elements 4 16 Elements
100 200 300 400 500 600 700 800
Temperature (°C)
Fig. 6.3 Convergence study for simply supported beam with full interaction.

Chapter 6 : Validation o f the Mathematical Model
Mechanical strain at mid-span
100 200 300 400 500 600 700 800
Temperature (°C)
Fig. 6.4 Mechanical strains for simply supported beam with full interaction.

Chapter 6: Validation o f the Mathematical Model
300Mid-span deflection (mm)
250 -
200
134 kN
? \ JL 60
r— ^oo ;
• ~ 1
150
100 -
50
® 2 Elements E 4 Elements ♦ 6 Elements o 8 Elements □ 10 Elements ■ 12 Elements 4 14 Elements 4 16 Elements
jâÆ B
0 100 200 300 400 500 600 700 800 900
Temperature (°C)
Fig. 6.5 Convergence study for axially unrestrained fixed end beam with full interaction.
81

Chapter 6: Validation o f the Mathematical M odel
Mechanical strain0.03
0.02
0.01
0
- 0.01
- 0.02
-0.03
-0.04
-0.05
-0.06
0 100 200 300 400 500 600 700 800
Temperature (°C)
Fig. 6.6 Mechanical strains for axially unrestrained fixed end beam with full interaction.
82

Chapter 6: Validation o f the Mathematical Model
Mid-span deflection (mm)300
250
B 2 Elements E 4 Elements♦ 6 Elements o 8 Elements □ 10 Elements
12 Elements* 14 Elements *16 Elements
200 -
134 kNr v /,.
'Û \ ^
" ! . 60
' ^ mr—00
1 ' 1
150 -
100 -
50 -
100 200 300 400 500 600
Temperature (°C)
700 800
Fig. 6.7 Convergence study for axially restrained fixed end beam with full interaction.
83

Chapter 6: Validation o f the Mathematical Model
Mechanical strain in the bottom flange
0 100 200 300 400 500 600 700 800
Temperature (°C)
Fig. 6.8 Mechanical strains for axially restrained fixed end beam with full interaction.
84

Chapter 6: Validation o f the Mathematical M odel
Mid-span deflections in the inner span (mm)
0 100 200 300 400 500 600 700 800 900
Temperature (°C)
Fig. 6.9 Convergence study for continuous beam with full interaction.

Chapter 6: Validation o f the Mathematical M odel
6.2.2. Partial Interaction Analysis
The above convergence studies for simply supported and fixed ended beams, with full interaction, have been repeated using partial interaction analysis. The same beam size, loading conditions and temperature regime were used, but the connection between the steel I-section and concrete slab was assumed to be provided by 20 headed studs along the length.
The temperature-deflection behaviour for the simply supported beam is shown in Fig.
6.10 and is clearly identical regardless o f the number o f elements used. The predicted
failure temperature is 665°C and the corresponding deflection is 223mm, exceeding the
limiting deflection o f L/30. Typical slip patterns at 20°C and 500°C are shown in Fig.
6.11 and again indicate negligible difference. This implies that the minimum number o f
elements is sufficient to represent the beam.
Fig. 6.12 and 6.13 show similar results for the fixed ended beam. Up to 400°C the
temperature-deflection behaviour is identical for all cases whereas above this temperature a slight variation in predicted deflections is observed. The steel at the supports yields at 500°C and mid-span deflections increase rapidly. As before fewer elements lead to a
stiffer response. The variation in failure temperatures is however less than 2%, with 2 element analysis predicting a temperature o f 700°C compared with 688°C for 16 elements. The corresponding deflections at failure for all analyses are in excess o f L/20.
The slips at 300°C are beyond the plastic slip value o f 0.5mm indicating that all shear connectors along the length fail due to differential thermal elongation o f the steel and concrete slab. Compared with the slip pattern for the simply supported case it may be concluded that the influence o f thermal elongation o f the beam on shear connectors is
more severe for fully fixed end conditions than for simply supported end conditions. Once
again the predicted slip patterns are almost identical and it can be concluded that the four
number o f elements are sufficient for predicting the structural behaviour within a
reasonable accuracy.
Fig. 6.14 shows similar comparisons for the same beam using semi-rigid end conditions
characterised by the model in Fig. 5.2(b). The stiffness o f the rotational spring is defined by the moment-rotation characteristics o f an extended end plate shown in Fig. 5.1(b) and
the stiffness o f the axial spring is defined by the force-elongation model shown in Fig. 5.5(c) using a constant stiffness value o f 3 1500N/mm.
86

Chapter 6: Validation o f the Mathematical Model
300Mid-span deflection (mm)
250 -
0 2 Elements E 4 Elements
6 Elements $ 8 Elements □ 10 Elements
12 Elements û 14 Elements 4 16 Elements
200 ~
134 kN
^ J_ _ 6Ûi ~ „ — ^
QQ_ _ J i
150
100 -
50 ~
0
100 200 300 400 500
Temperature (°C)
600 700
Fig. 6.10 Convergence study for simply supported beam with partial interaction.

Chapter 6: Validation o f the Mathematical Model
0.6
0.5
0.4
0.3
0.2
0.1
0
- 0.1
- 0.2
-0.3
-0.4
-0.5
- 0.6
-0.7
- 0.8
-0.9
0 500 1000 1500 2000 2500 3000
Distance from support (mm)
Slip (mm)
Fig. 6.11 Slip convergence for simply supported beam with partial interaction.
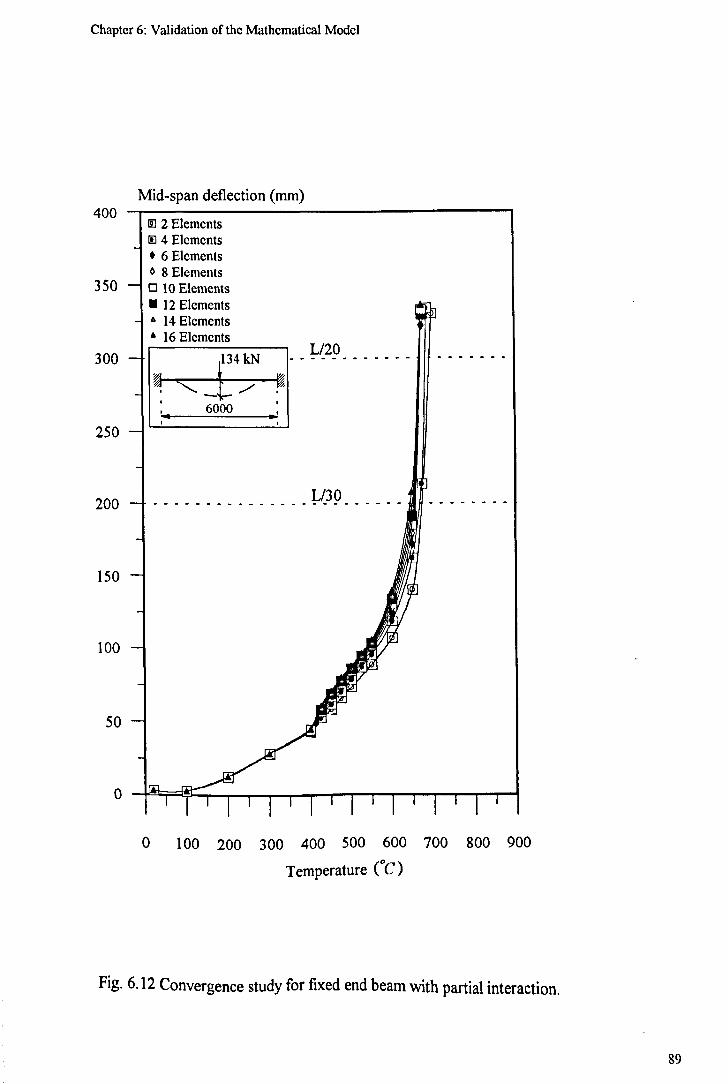
Chapter 6: Validation o f the Mathematical Model
400
350 -
Mid-span deflection (mm)
0 2 Elements E 4 Elements ♦ 6 Elements 0 8 Elements □ 10 Elements ■ 12 Elements 4 14 Elements 4 16 Elements
300 -
250 -
200 -
150
100 -
50 ~
0
y/A134 kN
X! ( 60 1
C-oo ( ;
i
0 100 200 300 400 500 600 700 800 900
Temperature (°C)
Fig. 6.12 Convergence study for fixed end beam with partial interaction.

Chapter 6: Validation o f the Mathematical Model
4.0
3.5
3.0
2.5
2.0
1.5
1.0
0.5
0
Slip (mm)
f
A 300°CA
♦▲
0
A 16 Elements a 14 Elements
0 12 Elements
♦ 10 Elements■ 8 Elements
■ 6 Elements + 4 Elements
A
♦A
A
A
0
♦0
AA
20°CaaO*
A * * A a ♦ 0aa
134 kNV/,.
! f 60
' w.t—oo r !
i
0 500 1000 1500 2000 2500 3000
Distance from support (mm)
Fig. 6.13 Slip convergence for fixed end beam with partial interaction.

Chapter 6: Validation o f the Mathematical Model
Mid-span deflection (mm)450
400
350 -
300
250 “
200
150 -
100 -
50 -
100 200 300 400 500 600 700 800 900
Temperature (°C)
Fig. 6.14 Convergence study for semi-rigidly connected beam with partial interaction.
91
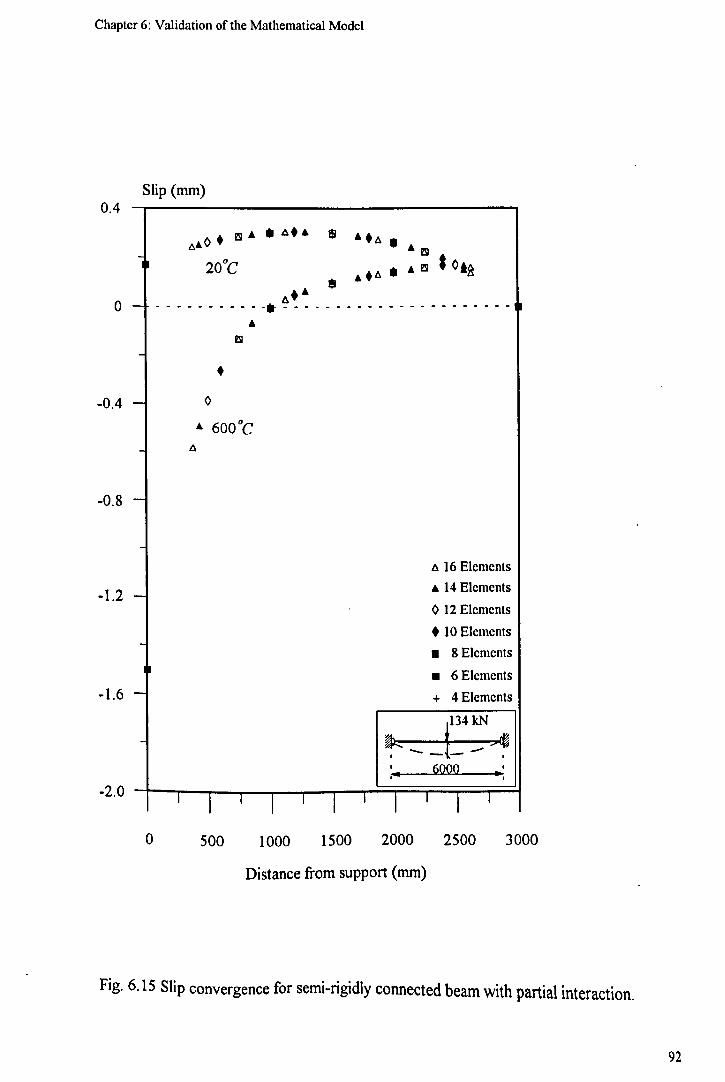
Chapter 6: Validation o f the Mathematical Model
0.4Slip (mm)
0 -■
■0.4 -
- 0.8 -
4 600 C
- 1.2
- 1.6
- 2.0
a 16 Elements a 14 Elements
0 12 Elements
#10 Elements■ 8 Elements
■ 6 Elements + 4 Elements
:134 kN
&. —' . 60
_»--- •001 ■" "|
0 500 1000 1500 2000 2500 3000
Distance from support (mm)
Fig. 6.15 Slip convergence for semi-rigidly connected beam with partial interaction.

Chapter 6: Validation o f the Mathematical Model
As for the fixed ended beam, the temperature-deflection behaviour for all cases is identical up to 650°C. At this point the steel yields at the supports and the bending is redistributed towards the mid-span o f the beam. Above this temperature analyses using denser meshes predict more rapidly increasing deflections. Nevertheless, the difference in predicted failure temperature and corresponding deflection is very small. The failure temperatures for the 2 and 16 element analyses are 750°C and 725°C respectively a discrepancy o f
about 3.5%.
Fig. 6.15 shows the typical slip distributions at 20°C and 600°C which show negligible
influence o f the number o f elements used. It can be seen that the effect o f differential thermal elongation on slips is considerably less than for the fixed ended beam.
These convergence studies demonstrate a consistency in the analytical results and indicate
that a relatively small number o f elements is sufficient to give reliable results. In the
remaining studies four to six elements have been used to represent individual beam spans.
6.3. Comparison with Experimental Data at Ambient Temperature
Some comparisons have been made with published test results for composite beams at ambient temperature assuming full and partial interaction. Both simply supported and continuous beams have been included in this validation, and where possible both load-
deflection history and slip patterns have been compared.
6.3.1. F u ll In te ra c tio n A nalysis
A comparison for the case o f full interaction has been based on tests where sufficient
studs have been used to minimise the influence o f slip. Slutter and Driscoll61 carried out
tests on twelve simply supported composite beams o f 4572mm span. The shear
connection for all beams was reported to provide full interaction, although the measured
maximum end slip values were negligible in only three tests. These have been chosen for
comparison.
The beams referenced as B4-T2 and B4-T4 were loaded symmetrically with two
concentrated loads, applied 228.6mm and 457.2mm from the centre line o f the beam. The
third beam B10-T13 was loaded with four concentrated loads at 1143mm spacing. The
cross-section of the beams and the reinforcement o f five 8mm diameter bars were the
same for all cases. The configuration o f the beams and physical properties o f the materials
used are illustrated in Fig. 6.16.
93

Chapter 6: Validation o f the Mathematical Model
The test results were plotted as deflection against moment ratio and are shown in Figs. 6.17 to 6.19 together with the current analytical results. The moment ratio was defined as
the applied test moment divided by the theoretical ultimate moment. In all cases at load levels up to 50% o f the ultimate moment capacity o f the beams the agreement between the analytical and test deflections is excellent. Between 50% and 90% o f the ultimate moment capacity, an increase in the end slips o f the test specimens is reported61 and as a result tests show greater deflections than the full interaction analyses. However the
comparisons remain very good with a discrepancy in deflection o f less than 15%. Beyond
90% of the ultimate moment capacity analysis and test results agree less well possibly
because o f increasing slips although the general pattern o f behaviour is consistent. The
reported ultimate moments for beams B4-T2 and B4-T4 were 311kNm and for beam B10-T13, 312kNm. The predicted ultimate moment for all cases is 317kNm, an
overestimate o f only 2%. The predicted mode of failure is yielding o f the steel at the point
loads whereas the failure o f test specimens was reported to be due to shearing o f the
studs. This shows that the influence o f slip may be significant even with 'fully composite' beams.
94

Chapter 6: Validation of the Mathematical Model
__________u__________1‘______ 2057.4
i i— 457.21——
. , 2057.4ii
L 4572 J
(a) Test B4-T2
|P riL ____ 1828.8
— ' 914.4! 1828 8
' ___________ ' 4572
(b) Test B4-T4
r Ip Ip JP
■571:5 IT“ h « ' 1143 * 1 143 / 571.5^-ii
4572___ '__________ 'i
(c) Test B10-T13______________a sleel = 280 N /m n rG concrete = 25 N/ttim]Gn,n<orce«,enr 600
Fig. 6.16 Details o f test beams used for validating full interaction analysis.

Chapter 6: Validation o f the Mathematical Model
Applied Moment/Ultimate Moment
Deflection (mm)
Fig. 6.17 Comparison between analysis and test beam B4-T2.

Chapter 6: Validation o f the Mathematical Model
Applied Moment/Ultimate Moment
Deflection (mm)
Fig. 6.18 Comparison between analysis and test beam B4-T4.

Chapter 6: Validation o f the Mathematical Model
0 10 20 30 40 50 60 70 80
Deflection (mm)
Fig. 6.19 Comparison between analysis and test beamB13-T13.

Chapter 6: Validation o f the Mathematical Model
6.3.2. Partial Interaction Analysis with Idealised End Conditions
In partial interaction analysis the influence o f slip on beam behaviour is considered. The program was verified by comparing both the load-deflection behaviour and the slip
patterns with available experimental results for simply supported and continuous beams. The results o f these comparisons are discussed separately as below.
6.3.2.I. Load-Deflection Behaviour
Six simply supported beams were tested by Chapman and Balakrishnan60 with results
presented as load-deflection plots. All beams have a length o f 5500mm and the same
cross-sectional dimensions and reinforcement details as shown in Fig. 6.20. The beams
referenced as E l and A1 to A6 were loaded with a central point load, whereas U4 was
uniformly loaded. The variables in these tests were the number o f studs, and the material properties o f studs, steel I-section and concrete.
Analytical and test results are compared in Figs. 6.21 to 6.25. For all cases the analytical and experimental results are in reasonable agreement and predicted failure loads are within 6%. For tests A1 and A6 predicted failure loads are 424kN and 425kN respectively compared with results o f 419kN and 408kN, indicating an overestimate o f 1.2% and 4% respectively. The predicted failure loads for tests E l and A3 are 472kN and 418kN and are also in good agreement with test values o f 498kN and 436kN indicating an
underestimate o f 5.5% and 4.2% respectively. For tests A5 and U4 the predicted ultimate loads o f 448kN and 900kN were the same as those observed in the tests. The predicted pattern o f deflections also correlates reasonably with test data up to about 70% o f the
failure load. As failure is approached, observed deflections start to increase rapidly. Given
the uncertainties associated with modelling the behaviour o f concrete at high strains and the uplift o f the concrete slab reported during the testing it might be expected that the
calculated and test deflections will diverge. As seen in Fig. 6.25, for test U4, the
discrepancy in deflections near failure is significantly less because o f the load being
applied through 18 interconnected hydraulic jacks restricting the uplift o f concrete. Nevertheless the overall pattern o f behaviour in all tests is well represented.
99

Chapter 6: Validation of the Mathematical Model
Test ^ steel ® concrete ^ reinforcement No of P'stud(N /m nt2) (N /m m 2) (N /m m 2) Studs CN )
El 462 51 600 100 64Al 414 30.5 600 84 112A3 452 26 600 68 112A5 451 42 600 44 122A6 445 41 600 32 122U4 474 43 600 32 122U5 434 32 600 32 112
(a) Centre loaded case
.m i m m m n m u279.4
1 Cl 5500279.4
(b) Uniformly loaded case
Fig. 6 . 2 0 D e t a i l s o f s i m p l e b e a m s u s e d f o r v a l i d a t i n g p a r t i a l i n t e r a c t i o n a n a l y s i s .
100

Chapter 6: Validation o f the Mathematical Model
Mid-span deflection (mm)
Load (kN)
Fig. 6.21 Comparison between analysis and test beam E l.

Chapter 6: Validation o f the Mathematical Model
Mid-span deflection (mm)
Load (kN)
Fig. 6.22 Comparison between analysis and test beam A l.

Chapter 6: Validation o f the Mathematical Model
0 100 200 300 400 500 600 700 800 900 1000
Load (kN)
Fig. 6.23 Comparison between analysis and test beam A3.

Chapter 6: Validation o f the Mathematical Model
Mid-span deflection (mm)
Load (kN)
Fig. 6.24 Comparison between analysis and test beam A5.

Chapter 6: Validation o f the Mathematical M odel
Mid-span deflection (mm)
Load (kN)
Fig 6.25 Comparison between analysis and test beams A6 and U4.

Chapter 6: Validation o f the Mathematical Model
Three continuous test beams, B13 by Slutter and Driscoll61, CB1 by Barnard and Johnson106 and CB2 by Teraszkiewics101-155, have also been used for comparison studies. Tests B13 and CB2 used a two-span beam with two concentrated loads on each span, whereas test CB1 was based on a three-span beam with a concentrated load on the inner span. The configurations o f these beams and material properties are illustrated in Fig. 6.26.
Comparisons o f analytical and test load-deflection behaviours are shown in Figs. 6.27 to
6.29. Force-slip relationships were reported only for test specimen CB2, and so the same
values as used in the comparison for simply supported beams have been assumed.
Slutter and Driscoll61 presented their test results as plots o f deflection against load ratio. The latter was defined as the applied test load divided by the ultimate load, and it is
unfortunate that the precise value for this was not reported. For the purpose o f this
comparison the ultimate load used in determining the load ratio was simply the value, 168kN, calculated by the program at collapse. The ultimate load based on simple plastic analysis and calculated design bending strengths for the composite beam o f 250kNm (mid-span) and 95kNm (support) is 142kN. Subject to this assumption it can be seen that there is good correlation between the test results and the predicted behaviour with a maximum discrepancy o f 8% throughout the load history.
For test CB1, the experimental data was presented as a moment-curvature relationship at
the loaded point. For the purpose o f comparison the analytical results are presented in a similar form in Fig. 6.28. The predicted ultimate moment is 31.5kNm compared with the test result o f 37kNm. This means correlation is less good than the previous case with the
ultimate moment being underestimated by 17%. However when account is taken o f the
uncertainties associated with testing composite beams, and the assumptions which have
been made concerning various parameters, the comparison provides support for the analytical predictions.
106

Ch
apte
r 6:
Val
idat
ion
of t
he M
athe
mat
ical
Mod
el
o
• a3C/5VO00
CNON
(NCQUc/i0)
Fig
6.2
6 D
etai
ls o
f con
tinuo
us b
eam
s us
ed f
or v
alid
atin
g pa
rtial
inte
ract
ion
anal
ysis
.

Chapter 6 : Validation o f the Mathematical Model
Deflection (mm)
Applied/Ultimate Load
Fig. 6.27 Comparison between analysis and test beam B 13.

Chapter 6: Validation o f the Mathematical Model
8Curvature (mm'1) xlO
Fig. 6.28 Comparison between analysis and test beam CB1.

Chapter 6: Validation o f the Mathematical Model
Slip (mm) Deflection (mm)
-5
0
-10
-15
-20
-25
Distance from left (mm)
Fig. 6.29 Comparison between analysis and test beam CB2.
110

Chapter 6: Validation o f the Mathematical Model
The test beam CB2 was also used by Yam and Chapman149 to validate their analysis o f composite beams with partial interaction. The experimental ultimate load o f 150kN compares with predicted values o f 139kN (current) and 137kN (Yam). Although both analyses underestimate the experimental ultimate load by 9%, the computed values from both analyses are consistent. The mode o f failure was reported to be shear failure o f the studs and this is also confirmed by the present analysis, since at 137kN the maximum
computed slips exceed the plastic limit o f 1.4mm. A complete load-deflection behaviour
of this test was not available. Instead a deflection pattern along the length, at 120kN, was
used for comparison as shown in Fig. 6.29. The maximum predicted deflections are 14mm
(current) and 19.6mm (Yam) compared with a measured deflection o f 17mm. The
difference in predicted deflections may be attributed to the different material models used in the analyses. Moreover, 120kN corresponds to 88% o f the failure load predicted by
both analyses and a small increase in load at this level will result in a considerable increase
in slip and hence deflection. As a consequence, it may concluded that although precise agreement between test and analyses cannot be achieved, the predicted deflection pattern from the present analysis compares satisfactorily with both the test and Yam's analysis.
6.3.2.2. Load-Slip Behaviour
In some o f the tests referred to above the very small slip between the steel flange and the
concrete slab which characterises partial interaction has been measured, both at the ends o f the beam and along the span.
Figs. 6.30 and 6.31 show the predicted end slip-load behaviour compared with test results for simply supported beams A l, A3, A5, A6 and E l respectively. As can be seen there is
reasonable agreement between analytical and experimental data in all cases, despite the very small magnitude o f the slips. In the case o f test A6, the calculated end slips at failure
are beyond the plastic limit o f the studs, indicating stud failure. This is consistent with the
test observations reported60. In tests A3 and A5 the studs are stressed beyond their elastic
limit but they have not reached the plastic limit. This is consistent with analytical slips for
test A3 but not for test A5 in which they are underestimated. The mode o f failure for test
A5 was reported to be simultaneous stud failure and crushing o f the concrete60. However
the analysis predicts that the concrete crushes before any significant shear slip occurs.
This might be due to the fact that the force-slip characteristics o f studs from push-out
tests are different from that under bending conditions66’68-70. The observed failure mode
for all other tests with a central load is concrete crushing, and as expected the end slips
are much lower. The discrepancy at low load levels, for all tests, may be explained by the
111

Chapter 6: Validation of the Mathematical Model
underestimation of the shear rigidity of the cantilevers extending beyond the supports, and the difficulty in measuring small slips accurately.
The distribution o f slip along the length o f the beam was recorded for tests E l , U4 and U5. These are shown in Figs. 6.32 to 6.34 respectively together with the corresponding analytical results. The magnitudes o f the slips are very small and precise agreement cannot be expected. The predicted slip patterns compare well with the tests in qualitative terms.
For Test E l the predicted slip pattern at 448.2kN, does not correlate well with Yam's
analysis or test. This is because near failure a small increase in load causes a rather large
increase in slip. As can be seen from Fig. 6.32, at 476kN predicted end slips are in much
better agreement with test and Yam's analysis. In tests E l and U4, the extra studs beyond
the support clearly lead to a reduction in slip towards the beam ends, but the rate o f
reduction is not quite the same as those measured in tests. This may again be attributed to
an underestimation o f the shear rigidity o f the cantilevers in the analysis. In test U5 the
length o f test beam U4 has been increased so that all studs lie within the span. As seen from Fig. 6.34, the slip does not reduce towards the ends, as was seen in the other cases. Both the analytical and experimental slips increase by flattening towards the support position. At load levels o f 89.51cN and 179.5kN the predicted slip distribution compares very well with the test, while at 269kN the analysis predicts higher slips. This may be due to underestimation o f slip modulus o f the shear connectors at this load level.
No experimental slip measurements were reported for the continuous beams B13 and
CB1, and hence only the analytical slip distributions are presented in Figs. 6.35 and 6.36 respectively. The slip distribution for test B13 is symmetrical about the centre support where the slip is zero. Maximum slip occurs at both ends, indicating that studs near the
end supports are stressed beyond their elastic limit. The slip behaviour o f Test CB1 is
asymmetrical and the concrete slab in the left outer span moves to the right relative to the
joist. However, the slip near the inner joints appears to change direction and not to give a
clear pattern o f slip progression. This may be attributed to the complex nature o f slip
distribution taking place in such beams. The predicted slip patterns indicate that the
maximum slip occurs near to the load and that the shear connectors are stressed to levels
well within their capacity.
112

Chapter 6: Validation o f the Mathematical Model
Load (kN)
0 0.1 0.2 0.3 0.4 0.5 0.6 0.7 0.8 0.9 1.0 1.1 1.2End-slip (mm)
Fig. 6.30 Analytical and test load-end-slip behaviour for tests A l, A3 and A5
113

Chapter 6: Validation o f the Mathematical Model
Load (kN)
0 0.1 0.2 0.3 0.4 0.5 0.6 0.7 0.8 0.9 1.0 1.1 1.2End-slip (mm)
Fig. 6.31 Analytical and test load-end-slip behaviour for tests E l and A6.

Chapter 6: Validation o f the Mathematical Model
Slip (mm)
Fig. 6.32 Analytical and test slip distribution for test beam E l.

Chapter 6: Validation o f the Mathematical Model
Slip (mm)
Distance from left (mm)
Fig. 6.33 Analytical and test slip distribution for test beam U4.

Chapter 6: Validation o f the Mathematical Model
Slip (mm)
Distance from left (mm)
Fig. 6.34 Analytical and test slip distribution for test beam U5.

Chapter 6: Validation o f the Mathematical Model
Slip (mm)
Fig. 6.35 Analytical slip distribution for test beam B 13.

Chapter 6: Validation o f the Mathematical Model
0.20
0.15
0.10
0.05
0
-0.05
- 0.10
-0.15
- 0.20
Slip (mm)
0 1000 2000 3000 4000 5000 6000 7000
Distance from left (mm)
Fig. 6.36 Analytical slip distribution for test beam CB1.

Chapter 6: Validation o f the Mathematical Model
The comparison between the experimental and analytical slip distribution at 120kN for test CB2 is presented in Fig. 6.29 together with predictions o f Yam's analysis. The
measured and computed slips from both analyses indicate that the maximum slip occurs at a distance 1153mm from the internal support in both spans near to the load. The present analysis predicts a maximum slip o f 0.482mm, the computed slip by Yam's analysis is 0.46mm and the measured slip is 0.36mm. The agreement between analytical and test slips at the beam ends is also good with the present analysis and Yam's analysis predicting a
slip o f 0.21mm and 0.17mm respectively compared with a measured value o f 0.14mm.
Again the reason why both analyses overestimate the test may be that at this stage o f
loading the slips increase very rapidly and the accuracy in measuring these slips in tests
may be affected. In general the correlation between the measured and computed slip
values throughout the whole length o f the span is very good and this gives confidence in
the ability of the program to model complicated slip patterns.
The partial-interaction computer model cannot be considered as validated until it is
compared with sufficient experimental and analytical data. However, the above comparisons with a variety o f different test data show that the analysis gives consistent results. Although there is a lack o f information on recorded slips, especially for continuous beams, the analysis appears to predict the deflection and slip behaviour at various load levels quite well. Discrepancies may be associated with the difficulty o f measuring the very small slip deformations during a test, which therefore may not be entirely reliable. The results o f push-out tests may also introduce some uncertainties if used as load-slip characteristics with the shear connectors stressed in bending under real conditions.
6.3.3. Partial Interaction Analysis with Semi-Rigid End Conditions
Generally beams are designed assuming fully rigid or pinned ends. However, in reality
these idealised conditions are seldom achieved and the beam behaviour is not the same as
initially designed for. The partial interaction program is capable o f investigating the combined influence o f slip and semi-rigid joints to give a more realistic insight into structural behaviour o f composite beams.
In order to validate the computer model, three cruciform specimens consisting o f two
composite cantilevers 1500mm long as tested by Anderson and Najafi118, and a single
7000mm long composite beam tested in a sub-frame by BRE120 have been used for
comparison. In all specimens the beam-to-column connection was a flush end plate and
the concrete slab was cast on a metal deck. The partial interaction computer model, in its
120

Chapter 6: Validation o f the Mathematical Model
present form, is not capable o f analysing frames or composite beams with metal decks, and hence all analyses have been conducted on isolated cantilevers or beams with solid concrete slabs. The semi-rigid model used in the analyses is illustrated in Fig. 5.2(b). The moment-rotation characteristics o f the rotational spring for the cruciform specimens are as shown in Fig. 6.37(a). For the BRE test however, these have not been specified and therefore the relationship for a flush end plate proposed by El-Rimawi158 has been adopted. This is illustrated in Fig. 6.37(b). The stiffness o f the axial spring is defined by
the model shown in Fig. 5.5(c). Details o f the specimens and material properties for both
tests are shown in Fig. 6.38.
The experimental data for the cantilever beams was plotted as a moment-rotation
relationship at the connection. For the purpose o f comparison the analytical results are
presented in a similar form in Fig. 6.39. The correlation between the test and predicted
behaviour is excellent up to about 80% o f the ultimate moment whereas for higher
moments the analysis overestimates rotations. The predicted ultimate moment capacities for S4F and S12F are 170kNm and 292kNm respectively and compare very well with the corresponding test values o f 175kNm and 300kNm. For test S8F however the agreement is less good. Analysis predicts a maximum moment capacity o f 226kNm whereas the test moment is 250kNm, an underestimate o f 12%. It was reported that in all tests the slip at the free end was negligible118. However the analysis indicates shearing o f the studs at a moment o f approximately 80% of the maximum test moment and it is this point that the
test and analytical results start to diverge. This may be due to the fact that force-slip
characteristics based on push-out tests underestimate the true behaviour in bending68.
The experimental load-deflection behaviour, together with analytical predictions for the
BRE composite beam (referred to as NR2) are shown in Fig. 6.40. Predicted deflections are in very good agreement with test deflections up to 200kN whereas beyond this load
the test deflections increase much faster than predicted. The ultimate loads are 324kN
(analysis) and 240kN (test). This discrepancy may be attributed to the excessive rotations
o f the column around the joint when the beam flanges contact the column flange. Indeed it
was reported that both end plates yielded and deformed sufficiently for contact to be
made between the lower flange o f the beam and the column flange120. Another reason for
this discrepancy might be the fact that the assumed moment-rotation characteristics used
in the analysis overestimate the rotational stiffness o f joint. It was also reported that there
was extensive deformation o f the studs close to the connection120. This is consistent with the predicted slip at the joint being beyond the plastic limit at failure.
121
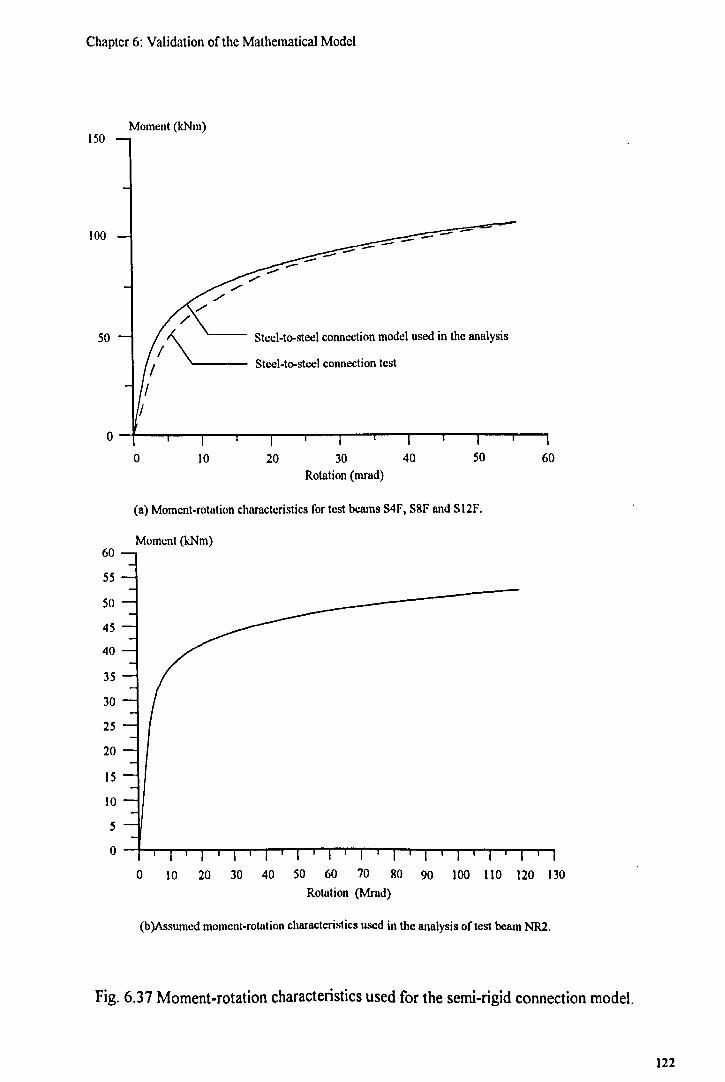
Chapter 6: Validation o f the Mathematical Model
Moment (kNm)
(a) Moment-rotation characteristics for test beams S4F, S8F and S12F.
Moment (kNm)
(b)Assumed moment-rotation characteristics used in the analysis of test beam NR2.
Fig. 6.37 Moment-rotation characteristics used for the semi-rigid connection model.
122

<_ ha
ptcr
b:
vali
dati
on o
l th
e M
athe
mat
ical
Mod
el
m<N
c* r-i rs r* n r*s s s s s s5 JB 5 S 5 5
>n o oo >n O ooo VsD o vo ^<N m — <N cn rt - h
II II IL II II II IL IIi £
to g <U 0* |- S JS,
3 § f |is S 5 f 1o p o ^ <o p e ^O o
<N
ft
■a(b
) BRE
Tes
t
Fig.
6.3
8 D
etai
ls of
sem
i-rig
id b
eam
s us
ed fo
r val
idat
ing
parti
al in
tera
ctio
n an
alys
is

Chapter 6: Validation o f the Mathematical M odel
Moment (kNm)
Rotation (mrad)
Fig. 6.39 Comparison between analysis and semi-rigid joint tests S4F, S8F and S12F.
124

Chapter 6: Validation of the Mathematical Model
Load (kN)
0 50 100 150
Deflection (mm)
Fig. 6.40 Comparison between analysis and semi-rigidly connected test beam NR2.
125

Chapter 6: Validation o f the Mathematical Model
Given the uncertainties associated with the modelling o f stud behaviour and connection characteristics the partial interaction analysis with semi-rigid connections compares sufficiently well with previously published test data and therefore justifying its use for
further analytical studies.
6.4. Comparison with Experimental Data at Elevated Temperatures
There is a limited number o f composite beam tests conducted at elevated temperatures.
British Steel94 have carried out two simply supported composite beam tests (referred to as
T15 and T16) with a span o f 4530mm. The only difference between these tests was the
applied load. Both beams were subjected to four concentrated loads. In test T16 the load
was calculated assuming full composite action between the steel and the concrete slab
whereas in test T15 only the strength o f the steel I-section was taken into account. The temperature profile in the analysis has been determined using the recorded temperatures across the cross-section. The temperature distribution in the section together with other details o f the beams are shown in Fig. 6.41.
The results o f this comparison are plotted in terms o f deflections and bottom flange temperatures in Fig. 6.42. The predicted failure temperatures for test T16 and T15 are 637°C and 790°C and the corresponding test temperatures are 666°C and 762°C
respectively. This indicates a discrepancy o f 4% for both tests. For test T15, the
agreement between analytical and test deflections throughout heating is also very good whereas for test T16, up to 475°C, this is less good. This may be attributed to the slight
discrepancy o f deflection measurements in test T16. As can be seen from Fig. 6.42,
despite the fact that the applied load o f T16 is greater than for T15, the deflections up to
475°C are smaller. Above this temperature however, the correlation between test and analysis appears to be reasonably good.

Chapter 6: Validation of the Mathematical Model
32.47kN ^32.47kN ^32.47kN 32.47kN
^ 566-25' - l 1 3 2 .5 J - 1 1 3 2 ,5
i
* 1133 .5“ *■ '5 6 6 .2 ^ -1 i
i 1 i ' ' i
: ' ' 4 5 3 0 '_____________ J
(a ) T e s t T 1 5
62.36kN
1
62.36kN
1
62.36kN
J _____________
62.36kN
566.25- 1132.5 1132.5
4530
i l i l T j 566.2ff—
(b) Test T16 a sted = 286 N /m n r^ concrete = 30 N /m m iVreWorcemenF 600 N /n w fPstud - 15 N
Fig. 6.41 Details o f beams used for validating partial interaction analysistemperatures.
elevated

Chapter 6: Validation of the Mathematical Model
Mid-span deflection (mm)350
300
250
200
150
100
50
100 200 300 400 500 600 700 800 900 1000
Temperature (°C)
Fig. 6.42 Comparison between analysis and test beams T15 and T16.

Chapter 6: Validation o f the Mathematical Model
6.5. Concluding Remarks
The convergence studies using both full and partial interaction analyses indicate that two elements are sufficient for representing the simply supported beam and four elements for representing the fixed ended or continuous beam. If too many elements are used the Gauss points along an element can become too closely positioned, leading to numerical
instability.
The available experimental data, especially at elevated temperatures, on composite beams
is very limited. Semi-rigid joint characteristics and stud properties from push-out tests at
ambient temperature show a significant scatter and experimental work at elevated
temperatures has only been undertaken by a few investigators. The program therefore
makes use o f certain mathematical models which are based on a limited amount o f
published data and/or assumptions. Moreover, due to the complexity o f the material
behaviour and the variables involved, (stud properties, different end conditions and testing procedures) composite beam behaviour is more difficult to monitor and the test
measurements may not be entirely reliable. Hence it is unreasonable to expect perfect agreement between analysis and experimental results. Nevertheless, the comparisons for both full or partial interaction, are generally very good and consistent.
129

C H A P T E R 7 . P A R A M E T R I C S T U D I E S
7.1. Introduction
The studies in this chapter concentrate mainly on elevated temperature behaviour
although some preliminary studies have been conducted at ambient temperature. Where
appropriate, comparisons between fully and partially composite beam behaviour are
included. The studies are divided into four categories:
1. The influence o f shear connectors,
2. The influence o f connection rigidity,
3. The influence o f different temperature profiles,
4. The influence o f reinforcement.
In most cases the beams used in these examples represent the typical main and secondary beams used in the large building test facility110 constructed by BRE at Cardington as shown in Fig. 6.2.
7.2. Ambient Temperature Studies
7.2.1. The Effect of Number of Shear Connectors
The influence o f the number o f shear connectors has been investigated at ambient
temperature for a 6m long simply supported beam and a 1.5m cantilever (Fig. 7.1).
Fig. 7.2 shows the predicted load-deflection behaviour for the simply supported beam
with varying number o f connectors ranging from 1 to 100. Also shown for comparison
are the results from fully composite and non-composite analyses. The non-composite beam fails at 200kN and the fully composite beam at 480kN. As expected the results o f
the partial interaction analyses lie between these two extreme cases and the load-
deflection paths progress steadily from non-composite to fully composite behaviour as the
number o f shear connectors is increased. The predicted failure load is most sensitive to
the changes in the number o f shear connectors between 10 and 25. Increasing the shear
connectors beyond 75 or reducing them below 10 has little effect on the predicted ultimate loads.
130

Chapter 7: Parametric Studies
( a ) F i n i t e e l e m e n t r e p r e s e n t a t i o n o f t h e c a n t i l e v e r b e a m
( b ) C r o s s - s e c t i o n a l d e t a i l s o f t h e c a n t i l e v e r b e a m
F i g . 7 . 1 D e t a i l s o f t h e c a n t i l e v e r b e a m .
131

Chapter 7: Parametric Studies
Mid-span deflection (mm)
0 100 200 300 400 500 600 700
Load (kN)
Fig. 7.2 The effect o f number o f studs on the behaviour o f a simply supported beam.
132

Chapter 7: Parametric Studies
Fig. 7.3 shows the effect o f increasing the number o f shear connectors on the load- deflection behaviour for the cantilever. A cantilever beam that is free to rotate at its support is unstable but in this case stability is afforded by the longitudinal shear strength between the two line elements used in the partial interaction model. The failure o f this type o f beam is dictated largely by the strength o f the studs and it is therefore a useful
example for examining this failure mode.
On the basis o f this simplified representation, there are two possible modes o f failure,
namely, shearing o f the studs and cracking of concrete in tension. For modest degrees o f
shear connection - fewer than 10 studs along the length - the failure mode was found to
be the fracture o f the studs. The failure load for 10 studs is lOOkN and for fewer studs the
failure load decreases in proportion.
If more than 10 studs are used, fracture o f the studs is avoided and the failure mode becomes the cracking of the concrete slab followed by yielding o f the reinforcing bars.
The predicted ultimate load at which the concrete slab fails and instability occurs is 11 lkN regardless o f how many additional studs are used. This is confirmed by considering a simple model in which the concrete slab and steel beam are subject to equal and opposite axial forces, compression and tension respectively. This system constitutes a couple which is equal to the applied bending moment. The minimum number o f studs required to avoid
shear failure can be determined by equating the shear force in the studs to the tensile force
in the concrete. In this case it was found that a minimum o f 10 studs was needed. The
corresponding ultimate load for 10 studs was then calculated to be 105kN. Furthermore plastic analysis assuming the concrete is under pure tension and the steel section under
pure compression was also used to determine the load level at which the concrete slab
cracks in tension. This was found to be 112kN. The analytical results appear to be
consistent with these simple calculations.
Up to 75kN the load-deflection behaviour for the fully composite cantilever is stiffer than
the partially composite conditions. Beyond this load the concrete slab cracks in tension
and a sudden increase in deflections is observed. Compared with the partial interaction
case the concrete cracks at a lower load because it is subject to greater stresses. However
since the beam is fully restrained against rotation, the reinforcement and steel section
continue to carry load as a non-composite beam. The ultimate load capacity is reached when the steel section at the support yields at 250kN.
133

Chapter 7: Parametric Studies
Deflection (mm)
Load (kN)
Fig. 7.3 The effect o f number o f studs on the behaviour o f a cantilever beam.

Chapter 7: Parametric Studies
Relativ« slip (mm)
Distance from support (mm)
Relative ibp (mm)
Distano« from suppest (mm)
Relative slip (mm) Relative lïp (mm)
Distance from rapport (mm) Datane, from support (mm)
Fig. 7.4 The effect o f number o f studs on slip distribution for a cantilever beam.
135

Chapter 7: Parametric Studies
Mid-span deflection (mm)
Load (kN)
Fig. 7.5 The effect of number of studs on the behaviour o f a semi-rigid beam.
136

Chapter 7: Parametric Studies
The slip distributions along the length at various load levels for 5, 10, 20 and 80 studs are shown in Fig. 7.4. The slip distribution for stiffer shear connections varies significantly
with greater slip at the support and very little slip near to the free end. In contrast the slip distribution for weaker shear connections is more linear with very large slips along the
length o f the beam.
The influence o f varying the number o f shear connectors on the load-deflection behaviour
o f composite beams with semi-rigid joints has also been examined and the results, in terms
of load-deflection behaviour for the 6m beam, are shown in Fig. 7.5. The rotational and
axial spring stiffnesses are kept constant with stiffness values o f 1 .5x l010Nmm/rad and
2 x l0 4N/mm respectively.
It can be seen that the load-deflection paths progress consistently from the non-composite
to fully composite cases as the number o f shear connectors is increased. The predicted ultimate loads range from 51 lkN for a single stud to 630kN for 40 studs. Further increase in the number o f shear connectors results in only negligible increase in ultimate load. The use o f less than 20 studs prevents the full utilisation o f the strength o f the composite section due to large slips at the interface. For all cases failure is initiated by a plastic hinge at mid-span and the beam fails when the steel I-section yields at the support under
compression.
As the number o f studs is increased the load level at which the plastic hinge forms at mid
span increases but failure, defined by the point when the load-deflection curve start to
become very steep, is more sudden. This is because the mid-span and support moments
are much closer in value and therefore there is less opportunity for redistribution of bending once the first plastic hinge at mid-span is formed.
7.2.2. The Effect of Spring Stiffness
In these analyses, the semi-rigid joint model shown in Fig. 5.2(b) with two rotational
spring elements and one axial spring was used. The influence o f these spring stiffnesses on
the behaviour o f the 6m beam using 100, 40, 20 and 10 studs was investigated by varying
each in turn. Therefore the axial spring stiffness was kept constant while the rotational
spring stiffness was varied from zero to a very large numerical value (1020Nmm/rad). The
study was repeated by fixing the rotational spring stiffness to a maximum and varying the axial spring stiffness from zero to 1020N/mm.
Results for varying rotational spring stiffness and using 100 studs along the length are
presented in Fig. 7.6 in terms o f load-deflection. This shows that when the beam is fully
137

Chapter 7: Parametric Studies
restrained against rotation the predicted failure load is 777kN. Reducing the rotational spring stiffness to zero results in a failure load o f 640kN, a reduction o f about 20%.
Examination o f the strains for a spring stiffness o f 1020Nmm/rad indicates that the steel
section yields under negative bending at the supports at a load o f 675kN. At the failure
load (777kN) the steel section additionally yields at mid-span under positive bending.
Using a rather more flexible spring stiffness (5x lO ,0Nmm/rad) the mode o f failure differs
in that the steel section yields first at mid-span at 603kN followed by failure at the
supports at a load o f 750kN. However as the spring stiffness is reduced further
redistribution o f bending from the middle o f the beam to the supports is limited and the
beam fails after the first plastic hinge forms at mid-span.
The range o f spring stiffnesses in which a small change in stiffness produces the greatest variation in load-deflection behaviour is between 109and 5x lO ,0Nmm/rad. These values correspond approximately to the initial stiffness o f a flush and extended end plate connection respectively. The corresponding predicted failure loads are 654kN and 775kN,
indicating an increase in failure load of 18%.
The influence o f varying the rotational spring stiffness while keeping the axial stiffness constant was repeated using 40, 20 and 10 studs along the length o f the beam. The results
are shown in Fig 7.7 to 7.9 respectively. As expected beams with greater shear connection have a higher ultimate load level. For 40 studs and a fully restrained rotational spring the
failure load is 698kN. This decreases by 38% to 431kN when the ends are free to rotate. For 20 studs the corresponding figures are 615kN (fully restrained) and 341kN
(unrestrained). Further reducing the number o f studs to 10 results in ultimate loads o f
575kN and 308kN for the fully restrained and unrestrained cases respectively. In all cases,
as the rotational stiffness is varied from fully fixed to pinned the reduction in failure load
is approximately 45%.
Although the failure loads reduce as the slips at the interface increase, the failure mode in all cases is similar. For a constant rotational spring value o f 102°Nmm/rad and using 40 or
20 studs the supports are stressed slightly more than at mid-span while for 10 studs or
with more flexible spring stiffnesses (1010Nmm/rad) this is reversed. In situations where
zero spring stiffness is used, the mode o f failure is the yielding o f the steel beam under positive bending at mid-span.
In all cases, the load-deflection behaviour appears to be more sensitive between stiffness
values o f 109Nmm/rad and 5xl0'°Nm m /rad. In this range the increases in failure load for 40, 20 and 10 studs are 53%, 61% and 66% respectively.
138

Chapter 7: Parametric Studies
Mid-span deflection (mm)
Load (kN)
Fig. 7.6 The effect o f rotational spring stiffness on the load-deflection behaviour.
139

Chapter 7: Parametric Studies
Mid-span deflection (mm)
Load (kN)
Fig. 7.7 The effect o f rotational spring stiffness on the load-deflection behaviour.
140

Chapter 7: Parametric Studies
Mid-span deflection (mm)
Load (kN)
Fig. 7.8 The effect o f rotational spring stiffness on the load-deflection behaviour.
141

Chapter 7: Parametric Studies
250
200
150
100
50
0
Mid-span deflection (mm)
100 200 300 400 500 600 700
Load (kN)
Fig. 7.9 The effect o f rotational spring stiffness on the load-deflection behaviour.
142

Chapter 7: Parametric Studies
Results for analyses with fixed rotational stiffness but variable axial stiffness and using 100 studs are shown in Fig. 7.10 in terms of load-deflection curves. It can be seen that analysis using a very large stiffness predicts a failure load of 776kN. When the axial spring is very flexible the predicted failure load is found to be 725kN, a reduction in failure load o f 7%. The increase in failure load with increasing spring stiffness is progressive, although
the most notable changes occur when the stiffness is increased from 105N/mm to
5 x l 0 6N/mm.
The influence o f varying the axial spring stiffness on the load-deflection behaviour for 40,
20 and 10 studs was shown in Figs. 7.11 to 7.13 respectively. The failure loads for 40
studs range from 690kN (fully restrained) to 635kN (unrestrained), indicating a reduction
in failure load o f 8%. For 20 studs or less, changing the axial spring stiffness has no effect
on the load-deflection behaviour. This indicates that, due to inadequate interaction, the shear force cannot be fully transferred to the steel section and therefore the axial spring is not mobilised. It is clear from these results that the load-deflection behaviour is more
sensitive to the variation in rotational spring stiffness than axial stiffness.
143

Chapter 7: Parametric Studies
Mid-span deflection (mm)
Load (kN)
Fig. 7,10 The effect of linear spring stiffness on the load-deflection behaviour.
144

Chapter 7: Parametric Studies
Mid-span deflection (mm)
Load (kN)
Fig. 7.11 The effect o f linear spring stiffness on the load-deflection behaviour.

Chapter 7: Parametric Studies
Mid-span deflection (mm)
Load (kN)
Fig. 7.12 The effect of linear spring stiffness on the load-deflection behaviour.
146

Chapter 7: Parametric Studies
Mid-span deflection (mm)
100 200 300 400 500 600 700
Load (kN)
Fig. 7.13 The effect of linear spring stiffness on the load-deflection behaviour.

Chapter 7: Parametric Studies
7.3. Elevated Temperature Studies
7.3.1. The Effect of Number of Shear Connectors
The influence o f the degree o f shear connection has been investigated by varying the
number o f studs from 1 to 100 for the 6m beam. Three different end conditions namely
simply supported, semi-rigid and fixed ended were considered. The temperature regime is
similar to those used in the previous studies (Fig. 6.2).
Fig 7.14 shows the results for the simply supported beam compared with non-composite
and fully composite sections. All analyses extend beyond the limiting deflection o f L/30,
and show a steady progression from non-composite to fully composite behaviour as the
number o f studs is increased. The failure temperature, defined by a limiting deflection of L/20, ranges from 615°C to 690°C, an increase o f 12%.
For the fixed ended beam the failure temperatures at L/20 vary between 680°C and 700°C as the number o f studs is increased, indicating an increase o f 3% (Fig. 7.15). For
low degrees o f shear connection the slip at supports is considerably greater than the simply supported case and therefore a bigger spread o f behaviour at lower deflections is
observed. With less than 20 studs, the mode o f failure is shearing o f the studs. With 20 or
more studs the slip is reduced significantly and the deflections show a significant decrease.
Between 400°C and 450°C the steel section at the supports yields and a subsequent redistribution o f bending to the mid-span takes place. The beam fails with the formation of a third plastic hinge at mid-span.
For the fixed ended beam, it may be concluded that, although the behaviour at low
temperatures varies with the number o f studs, the effect o f slip on the predicted failure
temperature is negligible. For the simply supported beam little slip occurs, even with low
degrees o f shear connection, and therefore both the behaviour and the failure temperature are not significantly affected by the number o f studs.
Fig. 7.16 shows the influence o f varying the number o f studs on the temperature-
deflection behaviour o f a beam with semi-rigid end connections. In order to examine the
influence o f shear connection, the rotational and axial spring stiffnesses were kept
constant with stiffness values o f 1 .5xl010Nmm/rad and 2 x l 0 4N/mm respectively. A
comparison with a similarly sized non-composite and fully composite section using a
constant rotational spring stiffness o f 1.5xlO,0Nmm/rad is also shown. In these cases the
axial expansion o f the beam is freely allowed.
148

Chapter 7: Parametric Studies
Mid-span deflection (mm)
0 100 200 300 400 500 600 700 800Temperature (°C)
Fig. 7.14 The effect o f number o f studs at elevated temperatures for a simple beam.
149

Chapter 7: Parametric Studies
Mid-span deflection (mm)
0 100 200 300 400 500 600 700 800 900
Temperature (°C)
Fig. 7.15 The effect o f number o f studs at elevated temperatures for a fixed-end beam.
150

Chapter 7: Parametric Studies
M i d - s p a n d e f l e c t i o n ( m m )
0 100 200 300 400 500 600 700 800 900
Temperature ( °C)
Fig. 7 .16 The effect o f number o f studs at elevated temperatures for a semi-rigid beam.
151

Chapter 7: Parametric Studies
Again an increase in failure temperature is observed as the number o f studs is increased but the influence is very small. The predicted failure temperature, defined by a limiting deflection o f L/30, ranges from 698°C to 750°C. This shows an increase in the failure temperature o f 11% and 5% over the simply supported and fixed ended beams respectively. Compared with the semi-rigid beam, the lower failure temperature o f the
fixed ended beam is because o f the restraint to thermal expansion.
In all cases at temperatures up to 650°C the stresses at the supports increase more rapidly
than the stresses at mid-span. At this stage the slips are not sufficient to cause shearing of
the studs and the concrete slab moves to the right relative to the beam due to both
thermally and mechanically induced slips. The plastic hinges at the supports form at
660°C and redistribution o f bending to the middle o f the beam takes place. The beam starts to behave as a simply supported beam and as a result the slips change direction. The
mode of failure for less than 20 studs is the shearing o f the studs and the yielding of the steel at mid-span occurring almost simultaneously. For 20 or more studs failure is
associated only with yielding o f the steel and therefore the failure temperature is slightly
greater.
7.3.2. The Effect of Force-Slip Characteristics of Shear Connectors
The force-slip characteristics o f studs can vary significantly depending on their size and the strength o f the surrounding concrete. In order to examine the effect o f this on
structural behaviour at elevated temperatures, five different types o f force-slip
characteristic, shown in Fig. 7.17, for various types o f connector and concrete strength
have been used60.
Experimental results on composite beams and slabs show that the average concrete slab
temperature at failure, is below 250°C71-97' 100. Assuming that the temperature o f the shear
connectors is similar, the degradation in force-slip characteristics with temperature is
negligible71. Therefore in elevated temperature analyses the required stiffness o f the shear
connectors can be defined simply by the force-slip characteristics at ambient temperature. The force-slip curves at ambient temperature (Fig. 7.17) used in this analysis are based on
these obtained from experimental studies by Chapman and Balakrishnan60. The studs
referred to as PA2, PA4 and PA5 are all 19mm in diameter 101.6mm in length. Their
force-slip characteristics vary because o f different strengths o f concrete used in push-out
tests. The stud T1 is a tee connector and PEI is a more flexible stud o f 12.7mm diameter and 50.8mm long.

Chapter 7: Parametric Studies
Slip (mm) Slip (mm)
P / P , P / P„
Slip (mm) Slip (mm)
Fig. 7.17 Experimental force-slip characteristics o f studs used in the parametric studies.

Chapter 7: Parametric Studies
The studies have been carried out using a 9m beam - this is typical o f the secondary beams used in the BRE large building test facility at Cardington110 (Fig. 6.2) - with simply supported and semi-rigid end conditions under uniformly distributed load. Partial
composite interaction is achieved by means o f 36 uniformly spaced shear connectors. The
temperature o f the concrete slab, top flange and web is assumed to be constant and equal
to 20%, 80% and 100% o f the bottom flange temperature respectively (Fig 6.2).
The results are presented in Fig. 7.18 as temperature-deflection curves. For all cases the
difference in structural behaviour is negligible. This implies that the shape o f the force-slip
characteristics and the ultimate strength o f the connectors have very little influence on
behaviour at elevated temperatures. This is due to the fact that the studs remain cool up
to failure and they are not stressed beyond their elastic limit. Therefore the failure o f the beam is dictated mainly by softening o f the steel. Because o f the negligible degradation of
the stress-strain curve for steel between 300°C and 400°C the increase in deflection is very little for the semi-rigid beam. This, however, does not occur in the simply supported case because the axial and rotational displacements are freely allowed.
There has been very little information published on the force-slip characteristics o f studs
at elevated temperatures. However Kruppa71 presented some experimental curves for a 19mm headed stud based on push-out tests at elevated temperatures. These have been
approximated as trilinear relationships as shown in Fig. 3.5 in order to investigate the effect o f the deterioration o f the force-slip characteristics on beam behaviour. A 6m beam
with simply supported and fixed-end conditions was the subject o f these studies. As reported by Kruppa the stud temperature was increased at a ratio o f 80% with respect to
the temperature o f the upper flange which in turn was 80% o f the bottom flange
temperature. The results are compared with those obtained assuming the studs remain at
ambient temperatures in Fig. 7.19.
For the simply supported case it can be seen that degradation o f the force-slip
characteristics o f the studs with increase in temperature has very little effect on the
structural behaviour. The failure temperatures at a limiting deflection o f L/30 are 638°C
for degrading the stud properties and 650°C for constant stud properties at 20°C.
Results are similar for the fixed ended case with a failure temperature, corresponding to L/30, o f 680°C for both heated and cool studs.

Chapter 7: Parametric Studies
Mid-span deflection (mm)
Temperature (°C)
Fig. 7.18 The effect force-slip characteristics o f studs at elevated temperatures.

Chapter 7: Parametric Studies
Mid-span deflection (mm)
0 100 200 300 400 500 600 700 800
Temperature (°C)
Fig. 7.19 The effect o f degrading force-slip characteristics o f studs with temperature.

Chapter 7: Parametric Studies
In both cases the maximum stud temperature at failure is below 435°C. The force-slip- temperature curves in Fig. 3.5 show that at this temperature the studs lose only 15% of their ultimate shear strength and 30% o f their initial stiffness compared with ambient
temperature. The reduction in strength and stiffness is not significant until the temperature
o f the stud is in excess o f 450°C. It may therefore be concluded that the shear connectors
may not cause any significant deterioration in the fire resistance o f composite beams
unless the bottom flange temperature at failure is in excess o f 700°C.
7.3.3. The Effect of Spring Stiffness
The effect o f spring stiffness has been investigated for the 6m beam with 20 studs along its length. Details o f the beam and the temperature profile across the cross-section are as
shown in Fig. 6.2. Fig. 7.20 shows the influence o f varying the rotational spring stiffness while keeping the axial stiffness fixed at 1020N/mm and Fig. 7.21 shows the influence of
axial stiffness while the stiffness o f the rotational spring is kept at a maximum of 1020Nmm/mrad.
The failure temperatures for pinned and fixed end conditions are 545°C and 687°C
respectively, representing a 26% increase in failure temperature. Because o f the high degree o f restraint to thermal expansion afforded by the axial stiffness o f the connection
the beam is subject to an axial force. This is very different from the observations made in the ambient temperature studies for the same beam where the axial spring stiffness had
only a negligible effect on the load-deflection behaviour. The thermally induced axial force
causes a rapid increase in mid-span deflections especially for beams with flexible end
conditions. For a constant rotational stiffness o f 109Nmm/mrad or more the mode of
failure is yielding o f the steel at supports and at the middle o f the beam. Plastic hinges
form at the supports at 500°C and 600°C for rotational stiffnesses o f 102°Nmm/mrad and
109Nmm/mrad respectively and the corresponding failure temperatures, when the steel
yields additionally at mid-span, are 687°C and 660°C. For rotational stiffnesses o f less than 109Nmm/mrad, the failure mode is yielding o f the steel under combined bending and compression at mid-span, and this occurs at approximately 550°C.
157

Chapter 7: Parametric Studies
Mid-span deflection (mm)
Temperature (°C)
Fig. 7.20 The effect o f rotational spring stiffness at elevated temperatures.

Chapter 7: Parametric Studies
Mid-span deflection (mm)
Fig. 7.21 The effect o f linear spring stiffness at elevated temperatures.

Chapter 7: Parametric Studies
As can be seen from Fig. 7.21, keeping rotational stiffness constant and increasing the axial stiffness results in a reduction in failure temperature because o f the additional axial force caused by restraint to thermal expansion. For a large and very flexible stiffness the
failure temperatures are 688°C and 775°C respectively, an increase o f 13%. This
contrasts with similar studies at ambient temperatures, where it was found that the axial
spring stiffness had a negligible effect on the behaviour.
7.3.4. The Effect of Reinforcement
Increasing the amount o f slab reinforcement over the supports o f a composite beam is
reported to improve the ultimate load capacity at ambient temperature significantly113' 115’117. This is because the concrete cracks under tension and the stiffness o f the beam near
to the support is determined by the strength o f the steel I-section, connection and the
reinforcement. A preliminary study into the effect o f this on the temperature-deflection
behaviour for fully composite and partially composite beams has been conducted. In the analyses the reinforcing bars are represented as a continuous strip running across the width o f the concrete slab. The thickness o f this strip is defined as the area o f the reinforcing bars divided by the width o f the concrete.
The 6m beam - this is typical o f the main beams used in the large building test facility at Cardington110- with simply supported and fixed ended conditions has been used assuming
full and partial interaction. Details o f the beam and the assumed temperature profile are
shown in Fig. 6.2. For partial interaction cases the shear connection is provided by 20
studs uniformly spaced along the length o f the beam. The reinforcement used in the slab is
A 142 mesh. The influence o f reinforcement was examined by varying its area. The effect
o f restraint to axial expansion has also been included by analysing the fixed ended beam
with and without restraint.
Figs. 7.22 and 7.23 show results for the simply supported beam case using full and partial
interaction analyses respectively. The reinforcement contributes very little to the bending
strength o f the beam in sagging and since the failure mode for the simply supported beam
is the yielding o f the steel beam at mid-span, the amount o f reinforcement has a negligible
effect on the temperature-deflection behaviour. The predicted failure temperatures are
almost independent o f the reinforcement ratios, at 667°C for partial interaction and
709°C for full interaction. The behaviour throughout heating is also very similar with a
small variation at temperatures between 200°C and 550°C due to greater thermal bowing with increased reinforcement.
160

Chapter 7: Parametric Studies
Mid-span deflection (mm)
Temperature (°C)
Fig. 7.22 The effect o f reinforcement at elevated temperatures with full interaction.
161

Chapter 7: Parametric Studies
Mid-span deflection (mm)
0 100 200 300 400 500 600 700 800 900
Temperature (°C)
Fig. 7.23 The effect o f reinforcement at elevated temperatures with partial interaction.
162

Chapter 7: Parametric Studies
As shown in Fig. 7.24, the results for the axially restrained fixed ended beam assuming full interaction also reveal very little difference in temperature-deflection behaviour. This is mainly because o f the additional axial force induced by restraint to thermal expansion. The
predicted failure temperature varies from 690°C to 725°C with increased reinforcement,
resulting in a maximum difference o f 5%. The plateau between 300°C and 400°C in the temperature-deflection behaviour is due to the very slow rate o f material degradation
between these temperatures.
Also shown in Fig. 7.24 are the results o f the axially unrestrained fixed ended beam. For
normal and double reinforcement the improvement in failure temperature over the case
with no reinforcement is very little but increasing the reinforcement by a factor o f 10 leads
to a failure temperature in excess o f 900°C, an increase o f 14%. In fact the beam still had a reserve o f strength when analysis was terminated at 900°C due to inadequate material data beyond this temperature level.
Fig. 7.25 shows similar results assuming partial-interaction. In the axially restrained case the predicted failure temperature is 675°C for both normal and double reinforcement. Increasing the reinforcement by a factor o f 10 results in a failure temperature o f 750°C, an increase o f 11% whereas with no reinforcement the failure temperature is 567°C, a reduction o f 16%. Compared with full interaction analysis there is a greater variation in
fire resistance as the amount o f reinforcement is increased. This is due to the fact that in the partial interaction analysis the concrete slab is free to deform axially and therefore there is less thermally induced axial force than with the full interaction analysis.
Fig. 7.25 also shows the partial interaction analysis results for the axially unrestrained
fixed ended beam. When the axial expansion o f both the concrete slab and steel beam are
freely allowed, the predicted failure temperatures for normal and double reinforcement
corresponding to L/20 are 790°C and 816°C. Increasing the reinforcement by a factor o f 10 raises the failure temperature to 867°C, an increase o f approximately 8% whereas the
failure temperature with no reinforcement is 750°C, a reduction o f 6.5%.
The development o f mechanical strains in the reinforcement as the temperature increases is shown in Fig. 7.26 for the axially restrained fixed ended beam assuming partial
interaction. It is clear that at temperatures above 400°C the strains for normal and double
reinforcement increase very rapidly due to the softening o f the steel beam at supports.
Yielding o f the reinforcing bars occurs at a temperature o f 500°C. Increasing the
reinforcement by a factor o f 10 allows it to remain in the elastic range throughout.
163

Chapter 7: Parametric Studies
Mid-span deflection (mm)
Temperature (°C)
Fig. 7.24 The effect o f reinforcement at elevated temperatures with full interaction.
164

Chapter 7: Parametric Studies
Mid-span deflection (mm)
Temperature (°C)
Fig. 7.25 The effect o f reinforcement at elevated temperatures with partial interaction.
165

Chapter 7: Parametric Studies
Mechanical strains at the reinforcement
0 100 200 300 400 500 600 700 800 900
Temperature (°C)
Fig. 7.26 Strains at the support at the reinforcement for a fixed-end beam.
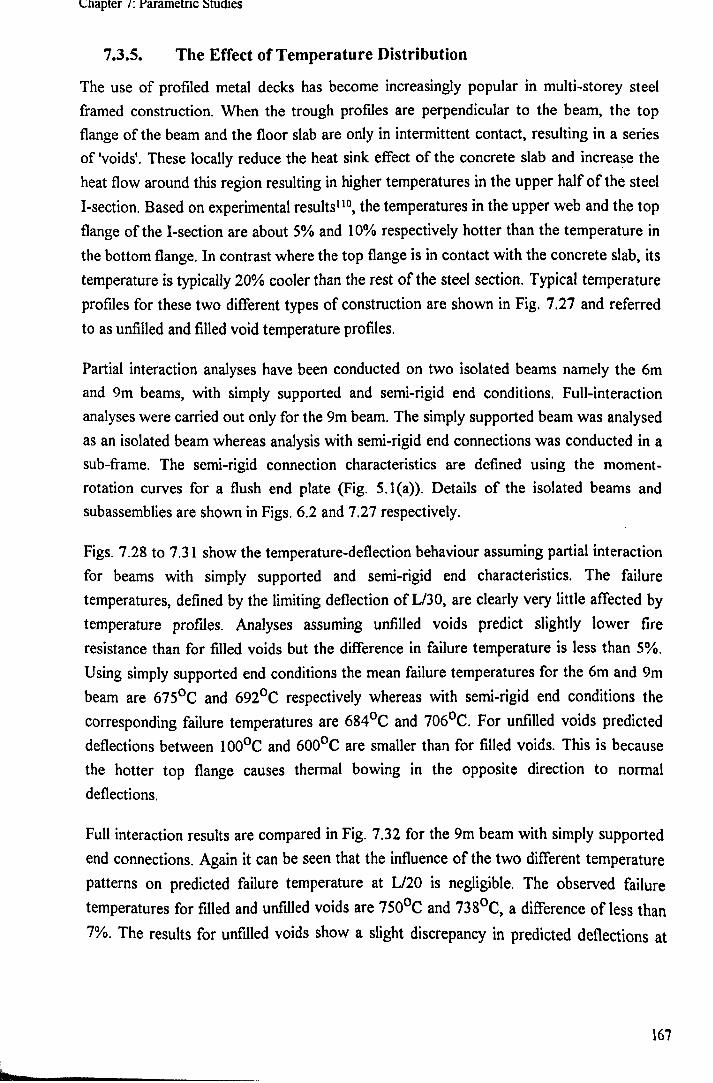
Chapter 7: Parametric Studies
7.3.5. The Effect of Temperature Distribution
The use o f profiled metal decks has become increasingly popular in multi-storey steel framed construction. When the trough profiles are perpendicular to the beam, the top flange o f the beam and the floor slab are only in intermittent contact, resulting in a series of 'voids'. These locally reduce the heat sink effect o f the concrete slab and increase the heat flow around this region resulting in higher temperatures in the upper half o f the steel
I-section. Based on experimental results110, the temperatures in the upper web and the top
flange o f the I-section are about 5% and 10% respectively hotter than the temperature in
the bottom flange. In contrast where the top flange is in contact with the concrete slab, its
temperature is typically 20% cooler than the rest o f the steel section. Typical temperature
profiles for these two different types of construction are shown in Fig. 7.27 and referred
to as unfilled and filled void temperature profiles.
Partial interaction analyses have been conducted on two isolated beams namely the 6m and 9m beams, with simply supported and semi-rigid end conditions. Full-interaction analyses were carried out only for the 9m beam. The simply supported beam was analysed as an isolated beam whereas analysis with semi-rigid end connections was conducted in a sub-frame. The semi-rigid connection characteristics are defined using the moment- rotation curves for a flush end plate (Fig. 5.1(a)). Details o f the isolated beams and subassemblies are shown in Figs. 6.2 and 7.27 respectively.
Figs. 7.28 to 7.31 show the temperature-deflection behaviour assuming partial interaction
for beams with simply supported and semi-rigid end characteristics. The failure temperatures, defined by the limiting deflection o f L/30, are clearly very little affected by
temperature profiles. Analyses assuming unfilled voids predict slightly lower fire resistance than for filled voids but the difference in failure temperature is less than 5%.
Using simply supported end conditions the mean failure temperatures for the 6m and 9m
beam are 675°C and 692°C respectively whereas with semi-rigid end conditions the
corresponding failure temperatures are 684°C and 706°C. For unfilled voids predicted deflections between 100°C and 600°C are smaller than for filled voids. This is because the hotter top flange causes thermal bowing in the opposite direction to normal
deflections.
Full interaction results are compared in Fig. 7.32 for the 9m beam with simply supported
end connections. Again it can be seen that the influence o f the two different temperature
patterns on predicted failure temperature at L/20 is negligible. The observed failure
temperatures for filled and unfilled voids are 750°C and 738°C, a difference o f less than
7%. The results for unfilled voids show a slight discrepancy in predicted deflections at
167

Chapter 7: Parametric Studies
temperatures between 100°C and 550°C due to thermal bowing in the opposite direction
to normal deflections.
Results for the 9m beam with semi-rigid end connections in a sub-frame are shown in Fig. 7.33. The temperature-deflection behaviour is consistent with that for the isolated beams,
and predicted failure temperature with filled and unfilled voids is 700°C. Compared with the isolated beam with simply supported end connections the predicted failure
temperature is 6.5% lower. This might be explained partly by the axial force due to
restraint to thermal expansion in the semi-rigid beam and partly by large column
deformations at the supports.
Although, at temperatures between 100°C and 600°C, the structural behaviour o f
composite beams with profiled metal decks shows a different pattern from composite
beams with solid slabs, the failure temperatures remain the same. In this particular case
isolated beams showed a slightly greater fire resistance than beams in a sub-frame. As expected analyses assuming full interaction predict slightly greater failure temperatures than analyses assuming partial interaction but the increase is less than 8%. In these
analyses the effect o f studs on failure temperatures is negligible and the use o f less complicated full interaction analysis may be adequate.
168

138k
N
804k
N
<r>oo v->oo O n
VOHO
H

Chapter 7: Parametric Studies
Mid-span deflection (mm)
Temperature (°C)
Fig. 7.28 Effect o f temperature profile for a simple beam with partial interaction.

Chapter 7: Parametric Studies
Mid-span deflection (mm)
0 100 200 300 400 500 600 700 800
Temperature (°C)
Fig. 7.29 Effect o f temperature profile for a semi-rigid beam with partial interaction.
171

Chapter 7: Parametric Studies
Mid-span deflection (mm)
0 100 200 300 400 500 600 700 800
Temperature (°C)
Fig. 7.30 Effect o f temperature profile for a simple beam with partial interaction.

Chapter 7: Parametric Studies
Mid-span deflection (mm)
0 100 200 300 400 500 600 700 800
Temperature (°C)
Fig. 7.31 Effect o f temperature profile for a semi-rigid beam with partial interaction.
173

Chapter 7: Parametric Studies
Mid-span deflection (mm)
0 100 200 300 400 500 600 700 800
Temperature (°C)
Fig. 7.32 Effect o f temperature profile for a simple beam with full interaction.

Chapter 7: Parametric Studies
Mid-span deflection (mm)
Fig. 7.33 Effect o f temperature profile for a semi-rigid beam in a sub-frame.

CHAPTER 8. DISCUSSION AND CONCLUSIONS
In recent years there has been a growing trend towards using analytical methods to
predict the performance o f steel structures, protected or unprotected, under fire
conditions. The work presented in this thesis is a development o f this and is concerned
mainly with the development o f an analytical approach to investigate the structural
behaviour o f unprotected composite beams at elevated temperatures. In particular the influence o f slip between the steel and concrete and the effect o f semi-rigid connections
have been incorporated. The analysis has been validated against published experimental
data for various types o f beam and subsequently used to determine the influence o f
various parameters which might affect the structural behaviour at elevated temperatures.
8.1. The Computer Model
The analysis is based on a non-linear finite element model 'INSTAF originally developed
for studying the behaviour o f two-dimensional non-composite steel structures. This has
been extensively modified to deal with composite beams at elevated temperatures for both
full and partial interaction. The original program included geometrical and material non
linearity and a non-linear strain-displacement relationship but the influence o f thermal
strains and non-uniform temperature distribution across the cross-section and along the
length o f an element had to be incorporated. The procedures used for full and partial
interaction analyses were essentially different, and hence two separate computer programs were developed using FORTRAN 77 for IBM compatible personal computers.
In the case o f full interaction the influence o f slip is neglected and the finite element model
consists o f a single line element representing both the reinforced concrete slab and steel
beam. The original program INSTAF was extended to include the reinforced concrete
slab, the degradation o f material properties at high temperatures and semi-rigid
connections. The basic formulation is similar to INSTAF and therefore the program is
capable o f analysing both frames and isolated composite beams, although the current
work has largely concentrated on beams only.
In the partial interaction model the influence o f slip between the concrete slab and the
steel beam was considered by introducing two parallel line finite elements connected
together by a continuous shearing medium along the length o f the beam, characterised by

Chapter 8: Discussion and Conclusions
an assumed force-slip relationship. The treatment o f slip allowed for conditions involving large displacements, since under fire exposure, beam deformations which are much bigger
than under normal circumstances must be considered. Numerical procedures were
developed to account for this effect and then incorporated into the original formulation o f
INSTAF.
The connections have been modelled as zero length spring elements corresponding to the
degrees o f freedom in the beam elements. In the full interaction model only a rotational
spring, characterised by the moment-rotation relationship o f a steel-to-steel connection,
was used. In the partial interaction model the treatment o f the semi-rigid connections
requires more care due to its more complicated representation. The rotational stiffness o f
the connection was represented by a pair o f rotational springs one connected to the concrete slab and the other to the steel I-section. Applying the full rotational stiffness
from the moment-rotation curve will effectively double the stiffness o f the connection. In order to avoid this the rotational spring stiffness was assumed to be divided equally
between the concrete slab and the steel beam. Because o f the truss-like behaviour o f the two line elements used in the partial interaction analysis, a normal reaction force is
induced in the bottom line element corresponding to the steel I-section and this increases the connection rigidity significantly. This necessitates the introduction o f a linear spring
connected to the steel beam which will allow for the relative movement between the steel
and concrete at the beam ends. The force-elongation characteristics assumed in this study
were based, for convenience, on the reinforcement. In both analyses the coupling effect
between rotational, shear and axial displacements was ignored.
The behaviour for this semi-rigid model was consistent with similar cases using full
interaction analysis both at ambient and elevated temperatures. However the distribution
o f stiffness used in this model is indicative rather than representative o f actual conditions..
A more detailed study including additional tests is required in order to establish a rational basis for representing the connection.
In order to validate the computer model some convergence studies and comparisons with
published experimental data were carried out. The convergence studies also helped
determine an appropriate mesh density, demonstrating acceptable accuracy. Typically it
was found that good accuracy could be obtained with four to six elements and this helped
to define modelling arrangements for subsequent studies.
Although a number o f fire tests have been conducted on bare and protected steel beams,
there is very little test data published for composite beams at elevated temperature. Even
for those tests which have been reported, the slip between the steel and concrete was not
measured. This would be very difficult and the primary purpose o f the tests was to
177

Chapter 8: Discussion and Conclusions
establish survival times rather than study any deterioration in composite action. Therefore most validation studies for partial composite action were carried out with published
experimental data at ambient temperature.
For the purpose o f analysis semi-rigid connections are represented as a series o f moment-
rotation curves. The precise form o f this relationship can influence the analytical results
very significantly. Although ambient temperature characteristics for a range o f bare steel connections are available, experimental data for composite connections is rather limited
and shows considerable scatter. Moreover most ambient temperature test reports on
composite beams with partial interaction and realistic (semi-rigid) support conditions do
not include details o f the connection characteristics.
Even at ambient temperature there are a number o f sources o f discrepancy when
comparing analysis and test results. In many cases reports o f tests on partially composite beams do not include the force-slip characteristics o f the studs used in the specimen. Even when they are reported the force-slip characteristics o f studs from standard push-out tests may differ in bending and the small measurements o f slip deformations might not be entirely reliable, especially when the beam is near to failure and its deflection is increasing very rapidly.
Research on the degradation o f connection, stud and concrete properties with increasing
temperature is very limited. In the present analysis the temperature in the concrete slab
rarely exceeds 200°C and therefore the change in the properties o f the studs and concrete
may be less significant than that o f the steel. However in situations where the concrete
slab is heated more severely these may have a greater effect on the behaviour. More fire
tests on partially composite beams including measurement o f slip deformations would be
valuable for fully validating the analysis at high temperatures.
Despite all these uncertainties comparisons both at ambient and elevated temperatures
were generally good. The analysis predicts a logical response to variations in parameters,
and also to changes in the finite element mesh density used. It may therefore be claimed
that the model provides a reliable means o f predicting the behaviour o f partially composite beams in fire, in the context o f the current state o f knowledge.
8.2. Studies Using the Computer Model
A range o f idealised connection representations were studied to establish the most
appropriate form, and this was then used to conduct a parametric study in order to
examine the influence o f shear connectors, varying semi-rigid connection stiffness and

Chapter 8: Discussion and Conclusions
reinforcement ratio, and temperature profile across the section. For the purpose o f comparison, the studies concerning the shear connectors and semi-rigid connections were
carried out both at ambient and elevated temperatures.
The partial interaction analyses varying the number o f studs along the length from a very
small to a very large number showed a logical progression from non-composite to fully
composite conditions, with a corresponding increase in failure temperature defined by a limiting deflection o f L/20 or L/30. However, this range was surprisingly small. For a
simply supported beam the fully composite beam failed at a temperature 12% higher than
the non-composite beam, whilst for the fixed ended beam the difference was even smaller
at 3%. As might be expected, results for the beam with semi-rigid end restraints were
intermediate between these two figures. This suggests that the effect o f the number o f studs is less influential at high temperatures than at ambient temperature and may be
explained by the relatively rapid deterioration o f material properties o f the steel causing yielding earlier than the shearing o f the studs.
For fully fixed end conditions in which horizontal movement as well as rotation is
prevented an axial force is induced due to restraint to thermal expansion. This in turn leads to a reduction in failure temperature o f 7% compared with the semi-rigid beam where the linear spring allows some thermal expansion.
Fully fixed end restraints and differential thermal expansion between the steel I-section
and concrete slab can cause severe slip deformations o f the studs even with higher
degrees o f shear connection, reducing the benefits o f composite behaviour significantly.
Consequently increasing the number o f studs has negligible influence on the failure
temperature which is largely determined by the high temperature strength o f the steel I-
section acting non-compositely. The difference in failure temperature for a fully composite
and non-composite section is also very little because in both cases the mode o f failure is the same.
For simply supported end conditions the slip deformations are very small because thermal slips are opposite to the direction o f mechanical slips. This suggests that simply supported
beams behave essentially as fully composite, even with low degrees o f shear connection.
Therefore, for practical degrees o f shear connection, the full interaction analysis may
provide adequate accuracy in predicting composite beam behaviour at elevated
temperatures but not at ambient temperature.
The influence o f the strength o f the shear connectors on structural behaviour was
investigated, assuming stud temperatures remained cool. The results indicated that for
simply supported beams the failure temperature was not affected because the common

Chapter 8: Discussion and Conclusions
mode o f failure was yielding o f the steel. This is entirely consistent with the observation that the number o f studs has only a small influence on failure temperature.
Further analyses were carried out to investigate the effect o f degrading the force-slip
characteristics o f the studs as this temperature increases. Comparisons were made with
cases where the stud temperature remained cool, showing a negligible difference in
predicted failure temperatures. The stud temperatures at failure were found to be below
435°C at which the stud has lost only 15% o f its strength at ambient temperature.
It is possible to study frames with full interaction only. This introduces a range o f additional parameters, namely relative size, length, load ratio o f the beam and column,
connection stiffness and also other failure modes, notably column failure. Limited studies
on isolated beams assuming partial interaction showed a slight improvement (6% greater)
in failure temperature compared with beams in a sub-frame assuming full interaction. This was possibly due to column failure (column exposed) in the sub-frame analysis. Clearly the behaviour o f composite beams within a more extensive frame requires further detailed study, but this is largely beyond the scope o f the current work.
The influence o f the connection on the behaviour o f beams has been studied by
conducting a series o f sensitivity studies varying the values o f the spring stiffnesses used
to model the connection. These showed that at ambient temperature the structural
behaviour was more sensitive to the rotational stiffness with an increase in failure load o f
about 80% for an effectively fixed ended beam compared with the simply supported case.
However at elevated temperatures it was equally sensitive to both rotational and axial
stiffness. For low degrees o f shear connection increasing the axial stiffness resulted in
negligible effect on the failure load because it can only be mobilised when there is
adequate interaction between the concrete slab and steel beam. For higher degrees o f
interaction however, increasing the axial stiffness led to a significant improvement in
failure load. In contrast, the studies at elevated temperatures showed that the axial
stiffness had a significant influence even with low degrees o f shear connection. This is due
to the restraint provided to thermal expansion. This induces an axial force which in turn
reduces the fire resistance temperature. Compared with the axially unrestrained fixed-end condition, the failure temperature o f 688°C is reduced by 14%.
Preliminary studies were conducted to investigate the effect o f continuous reinforcement
over the supports on the behaviour at elevated temperatures by varying the reinforcement
ratio. This has very little effect on the failure temperature for the simply supported case
whereas the effect for the unrestrained fixed ended case is significant due to the increased
strength in hogging at the support. The increase in failure temperature was 15% as the
reinforcement ratio was increased from 0 to 1.16%. For the axially restrained fixed ended
180

Chapter 8: D iscussion and Conclusions
beam, however, the reinforcement ratio does not affect the failure temperature. In this case the axial force due to restraint to thermal expansion leads to a more rapid
deterioration o f the steel and reinforcement at the supports.
The temperature profile across the cross-section o f a composite beam with a profiled
metal deck is different from a beam with a solid concrete slab. This effect was investigated
by comparing the analytical results for temperature distributions corresponding to filled
and unfilled 'void'. For unfilled void temperatures thermal bowing in the direction opposite
to normal deflections was observed. As a result predicted deflections between 100°C and
600°C were slightly lower than for filled void temperatures but for both cases the
difference in predicted failure temperature was negligible.
8.3. Concluding Remarks
It has been shown that the computer model developed provides a useful and efficient tool for predicting composite beam behaviour at elevated temperatures. Experimental studies
on composite beams, connections and studs at elevated temperatures are very scarce and
additional experimental data on these would enable more complete validation o f the computer model. The new parts regarding the concrete slab, shear connection, semi-rigid connections and high temperature aspects were incorporated into self-contained subroutines so that future modifications can be introduced easily.
Due to the heat sink effect o f the concrete slab, the steel beam in composite floor
construction may not need full fire protection. The studies presented here indicated failure
temperatures in excess o f 660°C, an increase o f 20% compared with the critical temperature o f 550°C for bare steel beams.
Future work might involve the development o f the partial interaction analysis into a three
dimensional frame analysis with composite or bare steel columns. This would enable the
conduct o f an intensive parametric study to provide guidance on simplified approaches to
modelling the behaviour o f composite frames in fire. However indications are that
incomplete interaction is relatively unimportant and that the beam behaviour is relatively
insensitive to this. It may therefore be assumed that for practical degrees o f shear
connection, full-interaction is adequate for the analysis o f composite beams under fire conditions.
181

REFERENCES
1. Fire Grading o f Buildings, Part 1, General Principles and Structural Precautions, Post-War Building Studies No 2, London, HMSO, 1946.
2. Fire Grading o f Buildings, Part 2, Fire Fighting Equipment, Part 3 Personal Safety, Part 4 Chimneys and Flues, Post-War Building Studies No 29, London,
HMSO, 1952.
3. Building and Buildings, Building Regulations 1965, SI 165 No 1373, HMSO,
London, 1965.
4. Building and Buildings, Building Regulations 1985, SI 1985 No 1065, HMSO, London, 1985.
5. Malhotra, H.L., Fire Safety in Buildings, Building Research Establishment Report, December 1986.
6. Shields, T J . and Silcock, G.W.H., Buildings and Fire, Longman Scientific & Technical, John Wiley & Sons, Inc., New York, 1987.
7. British Standard BS476: Fire tests on Building Materials and Structures, Part 20, Method for the Determination o f the Fire Resistance o f Elements o f Construction (General Principles), Part 21, Method for the Determination o f the Fire Resistance o f Load Bearing Elements o f Construction, 1987.
8. Kirby, B.R., Modern Fire Protection Systems and Design Methods, Fire Resistance o f Steel Structures, British Steel Corporation, January 1985.
9. Uddin, T. and Culver, C.G., Effects o f Elevated Temperatures on Structural
Members, Journal o f the Structural Division, 101, (ST7), July 1975.
10. Smith, C.I., Structural Steel Fire Protection for Multi-Storey Buildings-Recent Developments, Steel Construction, 20, (2), 1986.
11. Cooke, G.M.E., Session 1, Developments in Multi-Storey Buildings, Practical Fire Engineering: Part A: The Context, National Structural Steel Conference, 1984.
12. Latham, D. J., Developments in Multi-Storey Buildings, Practical Fire Engineering: The Use o f Unprotected Steelwork in Buildings, National Structural Steel
Conference, 1984.
182

References
13. Witteveen, J., Design Methods for Fire Exposed Steel Structures, Steel in Building, IABSE-ECCS Symposium, Luxembourg, 1985.
14. Lie, T.T. and Stanzak, W.W., Structural Steel in Fire, -More Realistic Analysis, ASCE National Structural Engineering Meeting, Cincinnati, April 1974,
Engineering Journal, American Institute o f Steel Construction, Second Quarter,
1976.
15. RPSReport, No. 08/90, Arbed Recherches, Luxembourg, 1990.
16. Becker, J., Bizri, H. and Bresler, B., F1RES-T A Computer Program for the Fire Response o f Structures-Thermal, Report No. UCB FRG 74-1, Fire Research Group,
Structural Engineering, University o f California, Berkeley, 1974.
17. Hill., A.J., Fire Tests and the Response o f Structural Steelwork, M.Phil. Thesis,
Department o f Civil and Structural Engineering, University o f Sheffield, March 1990.
18. Wickstrom, U., TASEF-2 A Computer Program for Temperature Analysis o f Structures Exposed to Fire, Report No. 79-2, Department o f Structural Mechanics, Lund Institute o f Technology, Sweden, 1979.
19. Schleich, J.B., Dotreppe, J.C. and Franssen, J.M., Numerical Simulations o f Fire Resistance Tests on Steel and Composite Structural Elements or Frames, Fire
Safety Science, Proceedings o f the First International Symposium, October, 1985.
20. Schleich, J.B., Fire Engineering Design o f Steel Structures, Steel Construction Today, 2, 1988, pp. 39-52.
21. Preston, R.R. and Kay, T.R., Deformation o f Steel Beams During Fire Tests, Metals and Materials, 2, (5), May, 1986.
22. Burgess, I.W., El-Rimawi, J.A. and Plank, R.J., A Secant Stiffness Approach to the
Fire Analysis o f Steel Beams, Journal o f Constructional Steel Research, 11, (2), 1988, pp. 105-122.
23. El-Rimawi, J.A., The Behaviour o f Flexural Members Under Fire Conditions, PhD .
Thesis, Department o f Civil and Structural Engineering, University o f Sheffield, April 1989.

References
24. Burgess, I.W., El-Rimawi, J.A. and Plank, R.J., Analysis o f Beams with Non- Uniform Temperature Profile Due to Fire Exposure, Journal o f Constructional Steel Research, 16, (13), 1990, pp. 169-192.
25. Johnson, R.P., Composite Structures o f Steel and Concrete, Beams, Columns, Frames and Applications in Building, Vol. 1, Granada Publishing Ltd., London,
1982.
26. Langdon-Thomas, G.J., Fire Safety in Buildings-Principle and Practice, Adam &
Charles Black, London, 1972.
27. Lu, S.Y., Trubert, M. and Nash, W.A., Elevated Temperature Characteristics o f
Type 347 Stainless Steel, American Society for Testing and Materials, Proceedings, 61, 1961.
28. Willhelm, A.C. and Kattus, J.R., Stress-strain Characteristics o f Metals Under Conditions o f Transient Heating and Loading, American Society for Testing and Materials, Proceedings, 63, 1963.
29. Jorgensen, J.R. and Sorensen, A.H., Fire Resistance o f Load-Bearing Structures Testing Procedures and Test Results, Project 4, Mechanical Properties o f Structural Steel at Elevated Temperatures, Institute for Bygningsteknik, July 1980.
30. Anderberg, Y., Behaviour o f Steel at High Temperatures, R1LEM, Lund Institute o f
Technology, Sweden 1983.
31. Holmes, M., Anchor R.D., Cook G.M.E., and Crook R.N., The Effects o f Elevated
Temperatures on the Strength properties o f Reinforcing and Prestressing Steels, The Structural Engineer, 60B, (1), March 1982.
32 Baba, S. and Nagura, H., Effect o f Material Properties on the Deformation of Steel
Frame in Fire, Proc. ofJSCE StructuralEng./Earthquake Eng., 2, (1), April 1985.
33. Purkiss, J.A., Developments in the Fire Design o f Structural Steelwork, Journal o f Constructional Steel Research, 11, 1988, pp. 149-173.
34. Harmathy, T.Z. and Stanzak, W.W., Elevated-Temperature Tensile and Creep
Properties o f Some Structural Prestressing Steel, Fire Test Performance, American Society for Testing and Materials, (STP 464), 1970, pp. 186-208.
35. Harmathy, T.Z. and Stanzak, W.W., Behaviour o f Steel Flexural Members in Fire, Application o f Solid Mechanics, Study no. 7, University o f Waterloo, 1972.
184

References
36. Stanzak, W.W., Fire Tests on Wide-Flange Steel Beams Protected with Gypsium Sanded Plaster, Fire Study No. 16 o f the Division o f Building Research, National
Research Council o f Canada, June 1967.
37. Harmathy, T.Z., Deflection and Failure o f Steel-Supported Floors and Beams in
Fire, ASTM, (Special Technical Publication 422), 1967, pp. 40-62.
38. Stanzak, W.W. and Harmathy, T.Z., Effect o f deck on Failure Temperature o f Steel
Beams, Fire Technology, 4, 1968, pp. 265-270.
39. Witteveen, J., Twilt, L. and Bijlaard, F.S.K., Theoretical and Experimental Analysis o f Steel Structures at Elevated Temperatures, IABSE, 10th Congress, Tokyo, Final
Report, Zurich, 1977.
40. Kirby, B.R., and Preston, R.R., High Temperature Properties o f Hot Rolled Structural Steels For Use in Fire Engineering Studies, Fire Safety Journal, 13, 1988,
41. Popovics, S., A numerical Approach to the Complete Stress-Strain Curve o f Concrete, Cement and Concrete Research, 3, (5), 1973, pp. 583-599.
42. Wang, P.T., Shah, S.P. and Naaman, A.E., Stress-Strain Curves o f Normal and Lightweight Concrete in Compression, Journal o f the American Concrete Institute, 75, (11), November 1978.
43. Noor, F.A. and Wijayasri, S., Modelling the Stress-Strain Relationship o f Structural
Concrete, Magazine o f Concrete Research, 34, (118), March 1982.
44. Carreira, D.J. and Chu, K.H., Stress-Strain Relationship for Plain Concrete in
Compression, Journal o f the American Concrete Institute, 82, (6), November- December 1985.
45. Tomaszewics, A., Stress-Strain Relationship for Concrete in Compression, Journal o f the American Concrete Institute, 83, (5), September-October 1986.
46. Hsu, T.T.C., Slate, F.O., Sturman, G.M. and Winter, G., Microcracking of Plain
Concrete and the Shape o f the Stress-Strain Curve, Journal o f the American Concrete Institute, 60, February 1963, pp. 209-223.
47. Knshnaswamy, K.T., Microcracking o f Plain Concrete Under Uniaxial Compressive
Loading, Indian Concrete Journal, 66, April 1969, pp. 143-145.
185

References
48. Kupfer, H., Hilsdorf, H.K. and Rusch, H., Behaviour o f Concrete Under Biaxial Stresses, Journal o f the American Concrete Institute, 66, August 1969, pp. 656-
665.
49. Furamura, F., The Stress-Strain Curve o f Concrete at High Temperatures, Annual
Meeting o f the Architectural Institute o f Japan, Paper No. 70004, Part 1, 1966.
50. Fire Resistance o f Concrete Structures, Report o f a Joint Comittee, The Instituion
o f Structural Engineers, The Concrete Society, August 1975.
51. Anderberg, Y. and Thelandersson, S., A Constitutive Law for Concrete at Transient
High Temperature Conditions, Douglas McHenry International Symposium on
Concrete and Concrete Structures, American Concrete Institute, Publication SP-55, Detroit, 1978.
52. Anderberg, Y., Magnusson, S.E., Pettersson, O., Thelandersson, S. and Wickstrom, U., An Analytical Approach to Fire Engineering Design o f Concrete Structures,
Douglas McHenry International Symposium on Concrete and Concrete Structures, American Concrete Institute, (Publication SP-55), Detroit, 1978.
53. Anderberg, Y., Fire-Exposed Hyperstatic Concrete Structures: An Experimental and
Theoretical Study, Douglas McHenry International Symposium on Concrete and Concrete Structures, American Concrete Institute, (Publication SP-55), Detroit, 1978.
54. Malhotra, H.L., The Effect o f Temperature on the Compressive Strength o f
Concrete, Magazine o f Concrete Research, 8, (23), August 1956, pp. 85-94.
55. Mohamedbhai, G.T.G., The Residual Strength o f Concrete Subjected to Elevated Temperatures, Concrete, December 1983, pp. 22-27.
56. Fahmi, H.M. and Nuri, D., Influence o f High Temperatures on Compressive and
Tensile Strengths o f Concrete, Journal o f Building Research, 5, (2), 1986, pp. 86- 102.
57. Ahmed, A.E., Al-Shaikh, A.H. and Arafat, T.I., Residual Compressive and Bond
Strengths o f Limestone Aggregate Concrete Subjected to Elevated Temperatures,
Magazine o f Concrete Research, 44, (159), June 1992, pp. 117-125.
58. Philleo, R., Some Physical Properties o f Concrete at High Temperatures, Journal of the American Concrete Institute, 29, (10), April 1958, pp. 857-867.

References
59. Cruz, C.R., Elastic Properties o f Concrete at High Temperatures, Journal o f the PCA, Research and Development Laboratories, 8, (1), January 1966, pp. 37-45.
60. Chapman, J.C. and Balakrishnan, S., Experiments on Composite Beams, The Structural Engineer, 42, (11), November 1964.
61. Slutter, R.G. and Driscoll, G.C., Flexural Strength o f Steel-Concrete Composite Beams, Journal o f the Structural Division, Proceedings o f the American Society o f
Civil Engineers, 91, (ST2), Part 1 o f 2 Parts, April 1965.
62. Menzies, J.B., CPI 17 and Shear Connectors in Steel-Concrete Composite Beams Made with Normal-Density or Lightweight Concrete, The Structural Engineer, 49,
(3), March 1971.
63. Ollgaard, J.G., Slutter, R.G. and Fisher, J.W., Shear Strength o f Stud Connectors in
Lightweight and Normal-Weight Concrete, American Institute o f Steel Construction Engineering Journal, 8, (2), April 1971.
64. Oehlers, D.J and Coughlan, C.G., The Shear Stiffness o f Stud Shear Connection in Composite Beams, Journal o f Constructional Steel Research, 6, 1986, pp. 273-284.
65. Oehlers, D.J. and Johnson, R.P., The Strength o f Stud Shear Connection in
Composite Beams, The Structural Engineer, 65B, (2), June 1987.
66. Robinson, H., Multiple Stud Shear Connections in Deep Ribbed Metal Deck, Canadian Journal o f Civil Engineering, 15, 1988.
67. Mottram, J.T. and Johnson, R.P., Push Tests on Studs Welded through Profiled Steel Sheeting, The Structural Engineer, 68, (10), May 1990.
68. Lawson, R.M., Shear Connection in Composite Beams, Composite Construction in
Steel and Concrete: Proceedings o f an Engineering Foundation Conference, Trout Lodge, Potosi, Missouri, June 1992, American Society o f Civil Engineers, 1993.
69. Oehlers, J. and Sved, G., Composite Beams with Limited-Slip-Capacity Shear
Connectors, Journal o f Structural Engineering, 121, (6), June 1995, pp. 932-938.
70. Crisinel, M., Partial-Interaction Analysis o f Composite Beams with Profiled Sheeting
and Non-welded Shear Connectors, Journal o f Constructional Steel Research, 15,
1990, pp. 65-98.
71. Kruppa, J. and Zhao, B., Fire Resistance o f Composite Beams to Eurocode 4 Part
1.2, Journal o f Constructional Steel Research, 33,1995, pp. 51-69.
187

References
72. Donell, L.H., Suggested New Definitions for Proportional Limit and Yield Point, Mechanical Engineering, 60, (11), 1938, pp. 837-838.
73. Esser, H. and Ahrend, H., Kann die 0.2 Uberin Kommenfreie Dehngrenze Ersetzt
Werden, Arch, f Eisenhuttenw., 13, (13), 1939-40, pp. 425-428.
74. Holmquist, J.L. and Nadai, A., A Theoretical and Experimental Approach to the problem o f Collapse o f Deep-Well Casing, Paper Presented at 20th Annual Meeting,
American Petroleum Institute, Chicago, November 1939.
75. Ramberg, W. and Osgood, W.R., Description o f Stress-Strain Curves by Three Parameters, National Advisory Committee for Aeronautics, Technical N ote No.
902, 1943.
76. Kruppa, J., Collapse Temperature o f Steel Structures, Journal o f Steel Structural Division, 105, (ST9), September 1979.
77. British Standard BS5950, Code o f Practice for the Fire Protection o f Structural Steelwork, Part 8, 1985.
78. Proe, D.J., Thomas, I.R. and Bennetts, I.D., Simulation o f the Fire Testing o f
Structural Elements by Calculation- Mechanical Response, Steel Construction, 19, (4), February 1986
79. Dounas, S. and Golrang, B., Stals Mekaniska Egenskaper vidHoga Temperaiurer, Lund Institute o f Technology, Sweden, 1982.
80. Eurocode4, Design o f Composite Steel and Concrete Structures, Part 1.2: Structural Fire Design, Second Draft 1992.
81. Hognestad, E. and Hanson, N.W., Me. Henry D., Concrete Stress-Distribution in
Ultimate Strength Design, Proceedings o f the AC1, 52, (Pt. 1), December 1955.
82. Desayi, P. and Krishnan, S., Equation for the Stress-Strain Curve o f Concrete, Journal o f the American Concrete Institute, 61, (3), March 1964.
83. Kabaila, A., Equation for the Stress-Strain Curve o f Concrete, Discussion o f the
Paper by Desayi, P. and Krishnan, S., Journal o f the American Concrete Institute, Proceedings, 61, (9), September 1964.
84. Tulin, L.G. and Gerstle, K.H., Equation for the Stress-Strain Curve o f Concrete,
Discussion o f the Paper by Desayi, P. and Krishnan, S., Journal o f the American Concrete Institute, Proceedings, 61, (9), September 1964.

References
85. Saenz, L.P., Equation for the Stress-Strain Curve o f Concrete, Discussion o f the
Paper by Desayi, P. and Krishnan, S., Journal o f the American Concrete Institute, Proceedings, 61, (9), September 1964.
86. Tsai, W.T., Uniaxial Compressional Stress-Strain Relation o f Concrete, ASCE, Journal o f Structural Engineering, 114, (9), September 1988.
87. Bresler, B. and Iding, R.H., Effects o f Normal and Extreme Environment on
Reinforced Concrete Structures, Douglas McHenry International Symposium on
Concrete and Concrete Structures, American Concrete Institute, (Publication SP-
55), Detroit, 1978.
88. Baldwin, R. and North, M.A., A Stress-Strain Relationship for Concrete at High
Temperatures, Magazine of Concrete Research, 25, (85), December 1973.
89. Kishysh, K.O., Finite Element Analysis o f Fire Exposed Reinforced Concrete Column, Ph.D. Thesis, Department of Civil and Structural Engineering, University o f Sheffield, July 1986.
90. Yam, L.C.P and Chapman, J.C., The Inelastic Behaviour of Continuous Composite
Beams o f Steel and Concrete, Proc. o f Institution o f Civil Engineers, 53, December 1972, pp. 487-501.
91. Witteveen, J. and Twilt, L., Behaviour o f Steel Column Under Fire Action,
International Colloqium of Column Strength, Paris 1972, Proc. IABSE, 23, 1973.
92. Witteveen, J., Twilt, L. and Bijlaard, F.S.K., The Stability o f Braced and Unbraced Frames at Elevated Temperatures, Stability o f Steel Structures, Preliminary Report, Liege, April 1977.
93. Cooke, G.M.E., Session I: Developments in Multi-Storey Buildings, Practical Fire Engineering: Part D: Applications o f Steel Models Research, National Structural Steel Conference, 1984.
94. Wainman, D.E. and Kirby, B.R., Compendium o f UK Standard Fire Test Data, Unprotected Structural Steel-1, British Steel Corporation, Swinden Laboratories,
Ref. No. RS/RSC/S10328/1/87/B, Rotherham, 1988.
95. Rubert, A. and Schaumann, P., Structural Steel and Plane Frame Assemblies Under
Fire Action, Fire Safety Journal, 10, 1986, pp. 173-184.
189

References
96. Dotreppe, J.C., Structural Models for Fire Analysis, IABSE Periodica, 3, 1986, pp.
101- 111.
97. Construction Industry Research and Information Association, Data Sheet: Fire Resistance o f Composite Slabs, CIRIA Special Publication 42, London, 1986.
98. British Steel Corporation, Report on the Results o f Fire Tests on Three Composite Concrete Steel Floor Decks and Verification o f the Design Recommendations, BSC
Welsh Labs., Report WL/FP/1464/87/D, 1987.
99. Cooke, G.M.E., Lawson, R.M. and Newman, G.M., Fire Resistance o f Composite
Deck Slabs, The Structural Engineer, 66, (16/16), August 1988.
100. Hamerlinck R. and Twilt L., Fire Resistance o f Composite Slabs, Journal o f Constructional Steel Research, 33, 1995, pp. 71-85.
101. Teraszkiewicz, J.S., Static and Fatigue Behaviour o f Simply Supported and Continuous Composite Beams o f Steel and Concrete, Ph.D. Thesis, Department o f Civil Engineering, University o f London, 1967.
102. Wright, H.D. and Francis, R.W., Tests on Composite Beams with Low Levels o f
Shear Connection, The Structural Engineer, 68, (15), August 1990, pp. 293-298.
103. Chapman, J.C., Composite Construction in Steel and Concrete-the Behaviour o f
Composite Beams, The Structural Engineer, 42, (4), April 1964.
104. Barnard, P.R., A Series o f Tests on Simply Supported Composite Beams, Journal o f the American Concrete Institute, 62, April 1965, pp. 443-456.
105. Barnard, P.R. and Johnson, R.P., Ultimate Strength o f Composite Beams, Institution o f Civil Engineers, Proceedings, 32, 1965.
106. Barnard, P.R. and Johnson, R.P., Plastic Behaviour o f Continuous Composite
Beams, Institution o f Civil Engineers, Proceedings, 32, 1965.
107. Johnson, R.P., Longitudinal Shear Strength o f Composite Beams, Journal o f the American Concrete Institute, Proceedings, 67, (6), June 1970.
108. Cooke, G.M. and Latham, D.J., The Inherent Fire Resistance o f Loaded Steel
Framework, Steel Construction Today, 1, 1987, pp. 49-58.
109. Lloyd, R.M. and Wright, H.D., In Situ Testing o f A Composite Floor System, The Structural Engineer, 70, (12), June 1992.
190

References
110. Armer, G.S.T. and Moore, D.B., Full-Scale Testing on Complete Multi-Storey Structures, The Structural Engineer, 72, (2), January 1994, pp. 21-24.
111. Aggarwal, A.K., Behaviour o f Flexible Endplate Beam-to-Column Joints, Journal o f Constructional Steel Research, 16, 1990, pp. 111-134.
112. Aggarwal, A.K., Comparative Tests on Endplate Beam-to-Column Connections,
Journal o f Constructional Steel Research, 30, 1994, pp. 151-175.
113. Leon, T.R., Semi-Rigid Composite Connection, Journal o f Constructional Steel Research, 15, 1990, pp. 99-120.
114. Dalen, K.V. and Godoy, H., Strength and Rotational Behaviour o f Composite Beam-Column Connections, Canadian Journal o f Civil Engineering, 9, (2), 1982,
pp. 313-322.
115. Davison, J.B., Lam, D. and Nethercot, D.A., Semi-Rigid Action o f Composite Joints, The Structural Engineer, 68, (24), 1990, pp. 489-499.
116. Kemp, A.R., Trinchero, P. and Dekker, N., Ductility Effects o f End Details in Composite Beams: Proceedings o f an Engineering Foundation Conference, Trout
Lodge, Potosi, Missouri, June 1992, American Society o f Civil Engineers, 1993.
117. Xiao, Y., Choo, B.S. and Nethercot, D.A., Composite in Steel and Concrete,
Experimental Behaviour o f Composite Beam-Column Connections, Journal o f Constructional Steel Research, 31, 1994, pp. 3-30.
118. Anderson, D. and Najafi, A. A., Performance o f Composite Connections: Major Axis
End Plate Joints, Journal o f Constructional Steel Research, 31, 1994, pp. 31-57.
119. Puhali, R., Smotlak, I. and Zandonini, R., Semi-Rigid Composite Action:
Experimental Analysis and a Suitable Model, Journal o f Constructional Steel Research, 15, 1990, pp. 121-151.
120. Jarrett, N.D. and Lennon, T., Composite Sub-frame Tests, Report No. 3, Results From Test NR2, Building Research Establishment Note N 141 /92, 1992.
121. Lawson, R.M., Behaviour o f Steel Beam-to-Column Connections in Fire, The Structural Engineer, 68, (14), 1990, pp. 263-271.
122. Lawson, R.M. and Newman, G.M., Fire Resistance o f Steel Beam-to-Column
Connections and Composite Beams, Steel Construction Today, November 1991.
191

References
123. Lennon, T. and Jones, L.C., Elevated Temperature Moment Rotation Tests, Building
Research Establishment, NoteN135/94, October 1994.
124. Preston, R.R. and Kay, T.R., Fire Resistance o f Structural Steel Beams, Metals and Materials, 2, (1), January 1986.
125. Gehri, E., The Fire Resistance o f Steel Structures, Fire Technology, 21, (1),
February 1985.
126. Newman, G.M., Session 1: Developments in Multi-Storey Buildings, Practical Fire Engineering: Part B: Structural Applications, National Structural Steel Conference,
1984.
127. Proe, D.J., Thomas, I.R. and Bennets, I.D., Simulation o f the Fire Testing o f Structural Elements by Calculation, -Overall Behaviour, Steel Construction, 19, (4),
February 1986.
128. Oven, V.A., The Behaviour o f Shelf-Angle Beams at Elevated Temperatures, M.Phil. Thesis, School o f Architectural Studies, University o f Sheffield, May 1992.
129. Petterson, O. and Witteveen, J., On the Fire Resistance o f Structural Steel Elements Derived From Standard Fire Test or by Calculation, Fire Safety Journal, 2, 1979/80,
pp. 73-87.
130. Luckyram, J. and Vardy, A.E., Shear Displacement in Bonded Structures, Journal o f Constructional Steel Research, 16, 1990, pp. 71-84.
131. Bradford, M.A. and Gilbert, R.I., Composite Beams with Partial Interaction Under
Sustained Loads, Journal o f Structural Engineering, 118, (7), July 1992, pp. 1871- 1882.
132. Cunnigham, R., Some Aspects o f Semi-Rigid Connections in Structural Steelwork, The Structural Engineer, 68, (5), 1990.
133. Jaspart, J.P. and Maquoi, R., Guidelines for the Design o f Braced Frames with Semi-
Rigid Connections, Journal o f Constructional Steel Research, 16, 1990, pp. 319- 328.
134. Li, T.Q., Choo, B.S. and Nethercot, D.A., Determination o f Rotation Capacity
Requirements for Steel and Composite Beams, Journal o f Constructional Steel Research, 32,1995, pp. 303-332.
192

References
135. Zandonini, R. and Zanon, P., Semi-Rigid Joint Action in Composite Frames: Numerical Analysis and Design Criteria: Proceedings o f an Engineering Foundation
Conference, Trout Lodge, Potosi, Missouri, June 1992, American Society o f Civil
Engineers, 1993.
136. Plank, R., The Collapse Behaviour o f Steel Beams in Fire -An Analytical Treatment, International Conference on Steel and Aluminium Structures, Cardiff,
1987, pp. 110.
137. El-Rimawi, J.A., Burgess, I.W. and Plank, R.J., The Analysis o f Steel Beams in Fire, International Conference on Steel and Aluminium Structures, ICS AS 91, Singapore,
22-24 May 1991.
138. El-Rimawi, J.A., Burgess, I.W. and Plank, R.J., The Analysis o f Semi-Rigid Frames
in Fire-A Secant Approach, Journal o f Constructional Steel Research, 33, 1995, pp. 125-146.
139. Cheng, W. and Mak, C.K., Computer Analysis o f Steel Frame in Fire, Journal o f the Structural Division, 101, (ST4), April 1975.
140. Furamura, F. and Shinohara, Y., Inelastic Behaviour o f Protected Steel Beams and Frames in Fire, Report o f the Research Laboratory o f Engineering Materials, Tokyo
Institute o f Technology, No. 3, 539.433:6999:81, Tokyo, Japan, 1978.
141. Cheng, W.C., Theory and Application on the Behaviour o f Steel Structures at
Elevated Temperatures, Computers and Structures, 16, (1-4), 1983, pp. 27-35.
142. Jain, P.C. and Rao, M.N.G., Analysis o f Steel Frames Under Fire Environment,
International Journal for Numerical Methods in Engineering, 19, 1983, pp. 1467- 1478.
143. Saab, H.A. and Nethercot, D.A., Modelling Steel Frame Behaviour Under Fire Conditions, Engineering Structures, 13, October 1991, pp. 371-382.
144. El-Zanaty, M.H., Murray, D.W. and Bjorhovde, R., Inelastic Behaviour o f Multi- Storey Steel Frames, Structural Engineering Report No. 83, Department o f Civil
Engineering, University o f Alberta, Canada, April 1980.
145. El-Zanaty, M.H. and Murray, D.W., Non-Linear Finite Element Analysis o f Steel
Frames, A S C E Jo u r n a l o f S tru ctu ra l D iv is ion , 109, (ST2), 1983, pp. 353-368.
193

References
146. Najjar, S.R., Three-Dimensional Analysis o f Steel Frames and Subframes in Fire, Ph.D. Thesis, Department o f Civil and Structural Engineering, University o f
Sheffield, 1994.
147. Bailey, C.G., Simulation o f the Structural Behaviour o f Steel-Framed Buildings in Fire, Ph.D. Thesis, Department o f Civil and Structural Engineering,, University o f
Sheffield, May 1995.
148. Siess, C.P., Tests and Analysis o f Composite Beams With Incomplete Interaction,
Proc. Soc. Exp. Stress Analysis, 9, (1), 1951, pp. 75-92.
149. Yam, L.C.P and Chapman, J.C., The Inelastic Behaviour o f Simply Supported Composite Beams o f Steel and Concrete, Institution o f Civil Engineers Proceedings, 41, 1968.
150. Hirst, M.J.S. and Yeo, M.F., The analysis o f Composite Beams Using Standard Finite Element Programs, Computers and Structures, 11, 1980, pp. 233-237.
151. Roberts, T.M., Finite Difference Analysis o f Composite Beams with Partial
Interaction, Computers and Structures, 21, (3), 1985, pp. 469-473.
152. Al-Amery, R.I.M. and Roberts, T.M., Non-linear Finite Difference Analysis o f
Composite Beams with Partial Interaction, Computers and Structures, 35, (1), 1990,
pp. 81-87.
153. Aribert, J.M., Application and Recent Development o f a Numerical Model for Composite Beams with Partial Shear Connection: Proceedings o f an Engineering
Foundation Conference, Trout Lodge, Potosi, Missouri, June 1992, American
Society o f Civil Engineers, 1993.
154. Arizumi, Y., Hamada, S. and Kajita, T., Elastic-Plastic Analysis o f Composite
Beams with Incomplete Interaction by Finite Element Method, Computers and Structures, 14, (5-6), 1981, pp. 453-462.
155. Abdul Wali, A.A., The Behaviour o f Semi-Continuous Composite Beams, Ph.D.
Thesis, Department o f Civil and Structural Engineering, University o f Sheffield,
September 1992.
156. Wright, H.D., The Deformation o f Composite Beams with Discrete Flexible
Connection, Journal o f Constructional Steel Research, 15,1990, pp. 49-64.
194

References
157. Lee, S.L. and Basu, P.K., Secant Method for Non-linear Semi-Rigid Frames, Journal o f Constructional Steel Research, 14, 1989, pp. 273-299.
158. El-Rimawi, J.A., Burgess, I.W. and Plank, R.J., NARR2 A Program for the Structural Analysis o f 2-D Steel Frames at Elevated Temperatures, Department o f
Civil and Structural Engineering, University o f Sheffield, Version 1.0, July 1992.
159. Poggi, C., A Finite Element Model for the Analysis o f Flexibly Connected Steel Frames, International Journal for Numerical Methods in Engineering, 26, 1988, pp.
2239-2254.
160. Li, T.Q., Choo, B.S. and Nethercot, D.A., Connection Element Method for the Analysis o f Semi-Rigid Frames, Journal o f Constructional Steel Research, 32, 1995, pp. 143-171.
161. Wegmuller, A.W. and Amer, H.N, Non-linear Response o f Composite Steel- Concrete Bridges, Computers and Structures, 7, 1977, pp. 161-169.
162. Elkelish, S. and Robinson, H., Effective Widths o f Composite beams with Ribbed
Metal Deck, Canadian Journal o f Civil Engineers, 13, January 1986, pp. 575-582.
163. Choi, C.K. and Kwak, H.G., The Effect o f Finite Element Mesh Size in Non-linear Analysis o f Reinforced Concrete Structures, Computers and Structures, 36, 1990, pp. 807-815.
164. Saada, A.S., Elasticity Theory and Applications, Pergamon Press Inc., New York, 1974.
165. Macon, N., Numerical Analysis, John Wiley and Sons Inc., New York, 1963.
195