Embed Size (px)
Citation preview

G. B. Gratton Airworthiness Evaluation Techniques f or Small Light Aeroplanes
1
UNIVERSITY OF SOUTHAMPTON
FACULTY OF ENGINEERING AND APPLIED SCIENCE
DEPARTMENT OF AEROSPACE ENGINEERING
Doctor of Philosophy
A THEORETICAL AND EXPERIMENTAL APPRAISAL OF
AIRWORTHINESS EVALUATION TECHNIQUES FOR SMALL LIGHT AEROPLANES
by
By Guy Brian Gratton
February 2005
This thesis has been completed as a requirement for a higher degree of the University of Southampton

G. B. Gratton Airworthiness Evaluation Techniques f or Small Light Aeroplanes
2
ABSTRACT
A thorough evaluation of the airworthiness of a manned aircraft is vitally important, regardless of the size or function of the aircraft. However, the methods used in light
and particularly microlight aircraft certification were largely based upon rules of
thumb or methods better suited to larger, higher energy, aircraft programmes.
A programme of research has been carried out to develop means by which microlight aircraft certification could be carried out appropriately to this class of aircraft.
The stall and immediately post-stall behaviour of an aircraft are shown to be a
function of the deceleration rate prior to the stall; therefore it is necessary to use a
representative deceleration rate when determining the acceptability of stall and post-stall handling qualities. This research has found means by which the range of
deceleration rates likely to be seen in a particular type can be estimated, so that flight
test programmes can ensure these rates are included, and thus aircraft are confirmed to
have acceptable stalling characteristics.
Weightshift controlled microlight aeroplanes, using a Rogallo type wing, rarely show
a conventional (square law) relationship between stalling speed and loading; the
reason being identified as aeroelastic deformation of the wing with loading. A means
by which stalling speed may be estimated for such aircraft at a variety of loadings has
been developed. This will allow designers the maximum flexibility in determining operating limits and shows how the stall speed at various flight conditions may be
predicted in aircraft operating documentation.
The spin is a serious and potentially fatal mode of flight; a spinning evaluation, even
for non-aerobatic aeroplanes, is therefore essential. A best practice has been developed and tested for the spin-resistance or spinning evaluation of microlight
aeroplanes, including equipment, aircraft and crew preparation, and reporting. The
developed methodology is shown to be successful, using the results of certification
flight test programmes, and the in-service safety record of aircraft which had been
evaluated using these methods.
The tumble mode is a little known mode of departure from controlled flight
experienced by weightshift controlled microlight aeroplanes. It has been a very
significant factor in fatal accident records, being non-recoverable without the use of
external safety devices. The mode consists of a nose-down autorotation at a rate of up to 400°/s. The tumble entry mechanism is explained, and advice to operators
developed which should prevent tumble entry. Evidence is shown of the nature of the
developed tumble – both modelled and through wind tunnel results, which explain
how the autorotation occurs. It is also shown how this theory may be applied during
testing of an aircraft to develop a tumble resistant aircraft.

G. B. Gratton Airworthiness Evaluation Techniques f or Small Light Aeroplanes
3
VERBUM SAPIENTI
This thesis contains advice regarding the conduct of certain aspects of aeroplane flight trials and airworthiness assessment. Used within the context of formal training in
these subjects, it is intended that this information will permit aircraft safety
investigations to be carried out more safely and efficiently. Used without that
supporting education and training, it has potential to do the opposite.
Use of the information herein cannot replace proper training in the fields of
airworthiness, aircraft certification and flight testing, only supplement it.
In addition, it is cautioned that no theoretical method should be used to prove the
safety (or otherwise) of an aircraft without substantiation by flight test.
AUTHOR’S DECLARATION
The work contained within this thesis is substantially the author’s own, and is
original. In particular the following are claimed as original work by the author.
- Modelling of the decleration rate of a microlight aircraft between engine failure and the stall.
- Experimental proof of the Venton-Walters relationship between loading
and stall speed for Rogallo wings, and demonstration of how this may be
used within the aircraft certification process.
- Proposal and experimental justification of the controls-central spin recovery actions for microlight aeroplanes.
- Identification of the characteristics of the tumble mode in weightshift
controlled microlight aeroplanes, together with the means of entry.
Proposal of commonality between the microlight tumble mode, and
departures from controlled flight previously seen on rigid flying wing aircraft.
- The GPS racetrack method for airspeed indicator calibration.
- The timed / segmented method for conservative estimation of aircraft take-
off and landing distances.

G. B. Gratton Airworthiness Evaluation Techniques f or Small Light Aeroplanes
4
TABLE OF CONTENTS

G. B. Gratton Airworthiness Evaluation Techniques f or Small Light Aeroplanes
5
Notation ................................................................................................................12 1 The “small light aeroplane” or “microlight aeroplane”..............................20
1.1 The legal definition of a microlight aeroplane. .............................................20
1.2 The practical definition of a microlight aeroplane. .......................................20
1.3 A brief history of microlight aviation in the United Kingdom ......................22
1.4 The environment within which a microlight aeroplane operates...................26 1.5 General Peculiarities of microlight aircraft performance and handling. .......26
1.6 Description Of The Main Design Features And Operation Of Weightshift
Controlled Microlight Aeroplanes.................................................................28
2 Rate of deceleration towards the stall of a microlight aeroplane. ...............42
2.1 The fact and significance of stall entry rate...................................................42 2.2 The definition of the stall and stall warning from the perspective of the pilot..
............................................................................................................43
2.3 The significance and magnitude of the stall entry rate..................................46
2.4 Measuring and Estimating Stall Entry Rate...................................................46
2.5 Physical significance of τ d ..........................................................................62
2.6 Recommendations..........................................................................................62 3 Stalling speeds and determination of manoeuvre speed for conventional
flexwing microlight aeroplanes. .............................................................63
3.1 Background to non-square-law stalling speed to loading relationship..........63
3.2 The significance of VA. ..................................................................................65
3.3 Experimental investigations into a non-square-law stall speed to loading relationship for three aircraft: the Air Creation KISS-400, KISS 450 and
iXess ............................................................................................................67
3.4 Problems with developing a theoretical model..............................................78
3.5 An alternative application of the non square law relationship between Vs and
Nz: modification of N1 and N2.......................................................................79 3.6 Historical precedent – normal acceleration limits for the Pegasus Quantum
15. ............................................................................................................81
4 Spinning evaluation of 3-axis controlled microlight aeroplanes .................83
4.1 The Spin Mode. .............................................................................................83
4.2 Scope of this Research...................................................................................89 4.3 The spin recovery technique for microlight aeroplanes. ...............................90
4.4 Certification requirements. ............................................................................93
4.5 The philosophy behind spinning assessment for a non-aerobatic aircraft .....93
4.6 Preparation for a spinning trial ......................................................................94
5 The tumble departure mode in weightshift controlled microlight aeroplanes................................................................................................................99
5.1 Introduction to the tumble. ............................................................................99
5.2 The mechanism of the established tumble...................................................101
5.3 A simple estimate of the magnitude of induced camber during the tumble.105
5.4 Longitudinal static stability of a weightshift microlight: development of a model intended to aid analysis of tumble entry...........................................111
5.5 Wind tunnel testing of a scaled model to consider the flow around a tumbling
aircraft. .........................................................................................................122
5.6 Discussion, induced inflow and vortex generation during the tumble entry.....
..........................................................................................................130

G. B. Gratton Airworthiness Evaluation Techniques f or Small Light Aeroplanes
6
5.7 Discussion – behaviour of the aircraft during the sustained tumble............131
5.8 Avoiding the tumble. ...................................................................................131
5.9 Effect of aircraft mass upon the tumble.......................................................132 5.10 A simple model of the tumble equations of motion ....................................135
5.11 Effect of wing settings. ................................................................................141
5.12 Initiation of the tumble. ...............................................................................144
5.13 First proposed mechanism, the whip-stall. ..................................................144
5.14 Second proposed mechanism, Spiral instability combined with loss of visual horizon.........................................................................................................145
5.15 Third proposed mechanism – failed loop manoeuvre..................................148
5.16 Fourth proposed mechanism, flight through own wake vortex. ..................153
5.17 Historical note 1 – the Northrop YB-49 “Flying Wing Bomber” ...............154
5.18 Historical Note 2, the Northrop XP-79 “Flying Ram” experimental fighter..... ..........................................................................................................156
5.19 Historical Note 3, The de Havilland DH108 “Swallow”.............................158
5.20 Historical Note 4, the BKB-1......................................................................160
5.21 Conclusions concerning the tumble.............................................................162
6 Conclusions ...............................................................................................164 6.1 Stall entry rates in the planning of flight testing..........................................164
6.2 Form of the O-A curve in Rogallo winged microlight aeroplanes. .............164
6.3 Spinning evaluation of 3-axis controlled microlight aeroplanes. ................165
6.4 The tumble mode. ........................................................................................165
7 Scope for further work in the fields of research described in this thesis...167 7.1 Use of stall entry rates in the planning of flight testing...............................167
7.2 Form of the O-A curve in Rogallo winged microlight aeroplanes. .............167
7.3 Spinning evaluation of 3-axis controlled microlight aeroplanes. ................168
7.4 The tumble mode. ........................................................................................169
8 Acknowledgements ...................................................................................171 Appendix A – Other test techniques developed to assist in the investigation of aircraft
flying qualities. .....................................................................................174
A1 Manual methods for data recording.............................................................177
A2 Use of GPS for airspeed indicator calibration. (The racetrack method).....187
A3 Alternative GPS based methods for ASI calibration: the triangular, and box-pattern methods, also the non-GPS based ground course method...............193
A4 Methodology for Spin-Testing of Microlight Aeroplanes...........................197
A5 A timed method for the conservative estimation of take-off distances,
eliminating the requirement for external measurement devices. .................214
A6 A timed method for the conservative estimation of landing distances, eliminating the requirement for external measurement devices. .................224
Appendix B – Characteristics And Illustrations Of The Main Aircraft Types Referred
To In This Thesis..................................................................................228
B1 Aviasud Mistral. ..........................................................................................229
B2 Eurowing Goldwing.....................................................................................230 B3 Easy Raider..................................................................................................231
B4 KISS-400 .....................................................................................................233
B5 Air Creation iXess .......................................................................................234
B6 Mainair Gemini Flash 2 and Flash 2a..........................................................235
B7 Mignet HM1000 Balerit. .............................................................................236 B8 CFM Shadow...............................................................................................237
B9 Raj Hamsa X’Air Mk.1 and Mk.2. (Falcon)................................................238

G. B. Gratton Airworthiness Evaluation Techniques f or Small Light Aeroplanes
7
B10 Southdown (now Medway) Raven-X..........................................................240
B11 Spectrum T1.................................................................................................241
B13 Thruster TST Mk.1 and Thruster T300.......................................................242 B12 Thruster T600 and T600 Sprint ...................................................................243
B13 Flightdesign / Pegasus CT2K......................................................................244
B14 Sky Ranger UK............................................................................................245
B15 Naval Aircraft Factory N3N-3.....................................................................246

G. B. Gratton Airworthiness Evaluation Techniques f or Small Light Aeroplanes
8
Tables - Contents
No. Title Page No
Table 1, CAS:TAS comparison for different heights ..................................................53
Table 2, Comparison of theory with test data for stall deceleration rates....................55
Table 3, determination of deceleration time constant ..................................................57
Table 4, Wing loadings for test aircraft at time of each stalling test ..........................58
Table 5, Demonstrating the accuracy of (2-27) ...........................................................59 Table 6, Stalling Speeds at various loadings for Air Creation KISS-400....................68
Table 7, Stalling Speeds at various loadings for Air Creation KISS-450....................68
Table 8, Stalling Speeds at various loadings for iXess ................................................69
Table 9, Spin Terminology ..........................................................................................86
Table 10, Inertia and aileron effects upon the spin mode............................................95 Table 11, Conditions used for tumble simulation ......................................................109
Table 12, Local angle of attack (degrees) ..................................................................109
Table 13, Pitching moments about hangpoint............................................................116
Table 14, Effect of trike mass upon inflow angle for constant pitching moment ......134
Table 15, Characteristics of typical aircraft ...............................................................139 Table 16, Results of test to demonstrate weightshift spiral instability ......................147
Table 17, ASI calibration data reduction table ..........................................................192
Table 18, Test grid for a simple flapless aeroplane ...................................................200
Table 19, Test grid for a simple flapped aeroplane....................................................202
Table 20, Summary of known spinning test results...................................................207 Table 21, Take-off test data for HM1000 Balerit at 420kg. ......................................219
Table 22, Take-off test data for N3N-3 Aeroplane....................................................221
Table 23, Landing test data for HM1000 Balerit at 420kg........................................225
Table 24, Landing test data for N3N-3 Aeroplane.....................................................226

G. B. Gratton Airworthiness Evaluation Techniques f or Small Light Aeroplanes
9
Figures - Contents
No. Title Page No
Figure 1, Mainair Gemini Flash 2 alpha ......................................................................21
Figure 2, Chevvron 2-32c 3-axis microlight aeroplane ...............................................22
Figure 3, Raj Hamsa X'Air Mk.1 3-axis microlight aeroplane ....................................22
Figure 5, size of British registered microlight aircraft fleet.........................................24 Figure 6, Mainair Blade 912 in side view (courtesy of Mainair Sports Ltd)...............28
Figure 7, Wing internal structure in planform. ............................................................29
Figure 8, Typical flexwing pitching moment curve.....................................................30
Figure 9, Aircraft with Raven wing, showing fin. .......................................................31
Figure 10, Wing Frame main components...................................................................33 Figure 11, Rear end view of Southdown Raven-X aircraft..........................................34
Figure 12, Conventional trike “breaking” mechanism.................................................40
Figure 13, Rear View of Mainair Gemini Trike Main Undercarriage ........................41
Figure 14, Generic polar for total drag upon a subsonic aircraft .................................49
Figure 15, Deceleration constant versus wing loading (Goldwing and Thruster TST Omitted)...............................................................................................................58
Figure 16, Deceleration constant versus wing loading (Goldwing and Thruster TST
Omitted), with straight lines plotted giving greatest and least magnitude
acceleration rates..................................................................................................61
Figure 17, Theoretical stalling speeds for Raven wing................................................64 Figure 18, Classical flight envelope diagram...............................................................66
Figure 19, Actual and classically predicted stalling speeds for Air Creation KISS-400
..............................................................................................................................70
Figure 20, Actual and classically predicted stalling speeds for Air Creation KISS-450
..............................................................................................................................71 Figure 21, Actual and classically predicted stalling speeds for Air Creation iXess ....72
Figure 22, Stall Speed versus bank angle diagram from KISS-400 operators manual 73
Figure 23, Stall Speed versus bank angle diagram from KISS-450 operators manual 75
Figure 24, Stalling section from UK operators manual for Air Creation iXess...........76
Figure 25, Illustration of variation in stall speed with loading for three different values of CAe - with Vs=30kn.........................................................................................81
Figure 26, Illustration of lift, drag and angle of attack of an autorotative spinning
aeroplane ..............................................................................................................84
Figure 27, Illustration of lift, drag and angle of attack at the wings of an aeroplane
likely to enter a spiral dive from an attempted spin entry....................................85 Figure 28, Illustration of aircraft flightpath and main parameters during a developed
erect spin to the right............................................................................................88
Figure 29, Excerpt from BCAR Section S, showing spinning requirements...............93
Figure 30, Tail shape considered with relation to rudder blanking and thus spin
recovery (diagrams are illustrative only and not to scale) ...................................96 Figure 31, Sycamore Seed with wing casing, showing similarity to trike with damaged
wing....................................................................................................................101
Figure 32, Positions of aircraft in normal flight(A) and tumble(B)...........................102
Figure 33, position of whole aircraft CG...................................................................102
Figure 34, illustration of induced camber during tumble...........................................103 Figure 35, Illustration of the effect of localised induced camber ..............................104
Figure 36, Illustration of aerodynamic forces sustaining the tumble.........................105

G. B. Gratton Airworthiness Evaluation Techniques f or Small Light Aeroplanes
10
Figure 37, Illustration of tumble parameters..............................................................106
Figure 38, Local velocity components of airflow over a wing element ....................107
Figure 39, Determination of local angle of attack. ....................................................108 Figure 40, Local angle of attack variation .................................................................110
Figure 41, BHPA hang-glider test facility at Rufforth, Yorkshire............................112
Figure 42, Sign conventions used in tumble analysis ................................................113
Figure 43, Forces, distances and angles relevant to the longitudinal stability model 114
Figure 44, typical aircraft (Mainair Gemini Flash 2a) in flight .................................119 Figure 45, Pitching Moment of trike about hangpoint, zero thrust............................120
Figure 46, Characteristics of Mainair Flash 2 alpha wing.........................................121
Figure 47, Illustration of induced flow, superimposed upon aircraft image (Pegasus
Quantum 15-912)...............................................................................................122
Figure 48, Scale model of Mainair Gemini Flash 2 alpha aircraft, used in wind tunnel tests.....................................................................................................................123
Figure 49, Illustration of flow near the wing root during nose-down tumble rotation
............................................................................................................................124
Figure 50, Illustration of flow near the wing tip during nose-down tumble rotation 125
Figure 51, Series of illustrations of flow around aircraft during one tumble cycle. (All illustrations in same orientation)........................................................................126
Figure 52, Illustrating the shift in vertical CG with passenger and fuel loading
changes...............................................................................................................133
Figure 53, Co-ordinate system for tumbling aircraft .................................................135
Figure 54, Defining motion of the wing ....................................................................135 Figure 55, Coordinate System in Wing......................................................................137
Figure 56, Illustration of tumble motion, XCG=0.5m.................................................139
Figure 57, Illustration of tumble motion, XCG=0.7m.................................................140
Figure 58, Illustration of tumble motion, XCG=0.3m.................................................141
Figure 59, Effect of different rigging conditions upon Mainair Flash 2 alpha wing.142 Figure 60, Illustration of spiral instability as a function of engine power: Raven-X 148
Figure 61, Illustration of a fatal tumble after a failed loop ........................................150
Figure 62, Northrop YB-49 experimental flying wing bomber. ................................155
Figure 63, Northrop XP-79B "Flying Ram" ..............................................................157
Figure 64, de Havilland DH108 Swallow..................................................................158 Figure 65, Illustration of BKB-1...............................................................................161
Figure 66, BKB-1 in flight .........................................................................................162
Figure 67, Typical kneeboards ...................................................................................177
Figure 68, Typical spring balance..............................................................................178
Figure 69, Illustration of sawtooth flightpath............................................................179 Figure 70, Typical test cards showing sawtooth climbs and glides ...........................180
Figure 71, Analysed results of sawtooth climbs for N3N-3 aircraft ..........................181
Figure 72, Analysed results of sawtooth glides for N3N-3 aircraft ...........................182
Figure 73, Results from a continuous climb for the N3N-3 aircraft ..........................183
Figure 74, Results from two continuous long glides for N3N-3 aircraft ...................184 Figure 75, Climb performance section from N3N-3 operators manual (UK public
transport version)...............................................................................................186
Figure 76, Typical modern handheld GPS receivers .................................................187
Figure 77, Met office form 214 wind forecast, showing (columns from left) altitude,
wind heading, wind strength, and OAT at specific locations. ...........................189 Figure 78, Typical pressure chart (USAFE type) ......................................................190
Figure 79, Illustration of “racetrack” flightpath.........................................................191

G. B. Gratton Airworthiness Evaluation Techniques f or Small Light Aeroplanes
11
Figure 80, Sample ASI calibration plot from GPS method .......................................193
Figure 81, Sample kneeboard test card for spinning tests..........................................203
Figure 82, Photographs of a whole-aircraft recovery parachute being deployed ......205 Figure 83, Illustration of take-off segments...............................................................215
Figure 84, Geometry of Sandown airport as used for N3N field performance
estimation (not to scale) .....................................................................................222
Figure 85, Aerial View of Sandown Airport, in similar orientation to figure above,
showing approximate camera position...............................................................223 Figure 86, Chart of distance along runway centreline versus distance across video
monitor screen, showing quadratic best fit curve. .............................................223
Figure 87, Aviasud Mistral ........................................................................................229
Figure 88, Eurowing Goldwing fitted with Rotax 377 engine...................................230
Figure 89, Easy Raider J2.2(1)...................................................................................232 Figure 90, Air Creation KISS-400 .............................................................................233
Figure 91, Air Creation iXess ....................................................................................234
Figure 92, Mainair Gemini Flash 2............................................................................235
Figure 93, Mignet HM1000 Balerit ...........................................................................236
Figure 94, Shadow CD...............................................................................................237 Figure 95, Raj Hamsa X'Air Mk.1 (UK) with Rotax 582/48-2V engine and Ivoprop
propeller .............................................................................................................239
Figure 96, Southdown Raven-X with Rotax 447 engine. ..........................................240
Figure 97, Spectrum T1 .............................................................................................241
Figure 98, Thruster TST Mk.1...................................................................................242 Figure 99, Thruster T600N Sprint..............................................................................243
Figure 100, Flightdesign CT2K .................................................................................244
Figure 101, Sky Ranger UK.......................................................................................245
Figure 102, Naval Aircraft Factory N3N-3................................................................246

G. B. Gratton Airworthiness Evaluation Techniques f or Small Light Aeroplanes
12
Notation
θ Angle between local airflow, and a forward perpendicular line from the
hangpoint. = φαW
−
α Wing angle of attack
φW
Wing control angle (0 places wing perpendicular to monopole)
ηP
Propeller efficiency
φg
Angle between monopole and earth Z-Axes
φT
Thrust angle (0 places thrustline perpendicular to monopole)
σ Relative air density
φ Bank angle
τ d Deceleration time constant (defined at equation 2-25)
ρ Air density
SCAS
IAS
∂
∂
Partial derivative of Indicated airspeed with respect to Calibrated Air Speed,
determined at or near to the stall condition.
ω (Pitch) Rotational velocity during tumble
ψ Azimuth angle during sustained tumble.
ζ Vorticity
ηP
Propeller efficiency
A Rotational inertia of an aircraft about the longitudinal axis (rolling inertia)
A&AEE Aeroplane and Armaments Experimental Establishment, located at Boscombe
Down Airfield, Wiltshire. Now part of Qinetiq.
a1 (During take-off) Acceleration from brakes off to rotation (Must be positive).
a1 (During landing) Acceleration along flightpath from point at which aircraft
descends through screen height to touchdown point.

G. B. Gratton Airworthiness Evaluation Techniques f or Small Light Aeroplanes
13
a2 (During take-off) Acceleration from rotation to unstick
a2 (During landing) Acceleration along ground for segment of ground roll whilst
aircraft is running on two wheels.
a3 (During take-off) In flightpath acceleration from unstick to achieving screen
height
a3 (During landing) Acceleration along ground from point at which all three
wheels touch the ground until aircraft stops. (Must be negative).
AAIB (United Kingdom) Air Accidents Investigations Branch
ARB (UK) Airworthiness Requirements Board (mandatory review body until it was
dissolved in 2003 for new and changed airworthiness legislation). [Note, this
abbreviation was also previously used to refer to the Air Registration Board, a
precursor of the CAA. It is not used in this context within this thesis.]
ARB LAC Light Aircraft Committee of the ARB
ASI Air Speed Indicator
B Rotational inertia of an aircraft about the lateral axis (pitching inertia)
BCAR British Civil Airworthiness Requirements
BHPA British Hang-gliding and Paragliding Association
BMAA British Microlight Aircraft Association
BRS Ballistic Recovery (parachute) System
C Rotational inertia of an aircraft about the vertical axis (yawing inertia)
CAA (United Kingdom) Civil Aviation Authority
CAe Aeroelastic coefficient for a wing (used in determining stalling speed under
load).
CAS Calibrated Air Speed (also see RAS)
CD Drag coefficient of aircraft
CDi Induced drag coefficient
CDo Zero lift drag coefficient of aircraft
CDs Drag coefficient of aircraft at point of stall
CG Centre of Gravity (Centre of Mass)

G. B. Gratton Airworthiness Evaluation Techniques f or Small Light Aeroplanes
14
CL Lift Coefficient of aircraft
CL.max Maximum (stall point) lift coefficient of aircraft
CLE Lift coefficient at the best range glide condition
CofA Certificate of Airworthiness (the term normally implies an ICAO compliant
document)
CR Cruise Configuration, normally flaps-up gear up airbrakes retracted. In an
aircraft lacking retractable gear, flaps or airbrake this will co-incide with all
other normally referred configurations (PA, LAND, TO), in which case the
terminology of configurations will not be used.
DT Trike drag
DW Wing drag
ETPS Empire Test Pilots School (based at Boscombe Down, Wiltshire, UK)
FAI Fédération Aéronautique Internationale (European Airsports Federation)
FTO Flight Test Observer (in aircraft)
g Acceleration due to gravity (9.80665 N/kg, or m/s²)
G Best glide ratio
GPS Global Positioning System (satellite navigation)
GS Ground Speed
H Altitude
IAS Indicated Air Speed
ICAO International Civil Aviation Organisation (International treaty based
organisation setting international standards for overflight)
IMC Instrument Meteorological Conditions (defined by being below acceptable
minima of visibility or clearance from cloud for visual flight control)
ISA International Standard Atmosphere (also sometimes known as US Standard
Atmosphere).
JAA Joint (European) Aviation Authorities
JAR Joint (European) Aviation Requirements

G. B. Gratton Airworthiness Evaluation Techniques f or Small Light Aeroplanes
15
k
Gradient of CDi/CL² (( )
∂
∂
D
L
C
C2
)
k Radius of gyration
KDT Trike drag coefficient = D/V²
L Lift
LAND Configuration for landing, normally full flaps gear down. Usually co-incident
with PA in a fixed-gear aircraft.
LCGW
Distance of wing CG behind the hangpoint
M Wing aerodynamic pitching moment
M Mass
MAUW Maximum Authorised Weight (effectively an alternative term to MTOW for
any conventional aircraft)
MCP Maximum Continuous Power
MTOP Maximum Permitted Take-Off Power
MTOW Maximum (Authorised) take-off weight. (Also see MAUW)
n Alternative term for Normal acceleration
N1 Aircraft structural positive normal acceleration design limit at VA
N2 Aircraft structural positive normal acceleration design limit at VD
N3 Aircraft structural negative normal acceleration design limit at VD
N4 Aircraft structural negative normal acceleration design limit at VA
NZ Normal acceleration.
NACA National Advisory Committee for Aeronautics (US government research
organisation, existing from circa WW1 until 1950s when superseded by
NASA, the National Aeronautics and Space Administration).
NTPS National Test Pilots School (based at Mojave, California, USA)
OAT Outside Air Temperature
P Engine power output

G. B. Gratton Airworthiness Evaluation Techniques f or Small Light Aeroplanes
16
PA Configuration Powered Approach, normally flaps down gear up airbrake
deployed. Usually co-incident with LAND in a fixed-gear aircraft.
PFA Popular Flying Association: UK representative body for amateur constructed
light aircraft.
PFL Practice Forced Landing (normally following a simulated engine failure)
PLF Power required to maintain Level Flight
POH Pilots Operating Handbook
PPL Private Pilot’s License
QFE Altimeter setting giving an indication of zero height on the ground at a
destination aerodrome. Given in hPa (heptopascals) or mb(millibars) the units
being identical, ISA sea-level value being 1013.25
R² Coefficient of determination, defining the quality of a line fit1, has value
R²=1 for perfect line fit, R²=0 for totally random distribution.
RAS Rectified Air Speed, alternative term to CAS.
S Reference wing area (including a canard, if fitted, but not tailplane)
S1 (During take-off) Distance from brakes-off to rotation
S1 (Landing) Distance along ground from directly below point at which aircraft
descends through screen height, until touchdown
S1’ (Landing) Straight line distance from point at which aircraft descends through
screen height, until touchdown.
S2 (During take-off) Distance from rotation to unstick
S2 (Landing) Distance aircraft is on two wheels during ground roll
S3 (During take-off) Straight line distance measured along the ground from
unstick point to directly below point at which screen height is achieved
S3 (Landing) Distance from all three wheels being on the ground until aircraft is
stopped
1 Defined by
( ) ( ) ( ) ( )2222 yynxxn
yxxynR
∑−∑∑−∑
∑∑−∑=
G. B. Gratton Airworthiness Evaluation Techniques f or Small Light Aeroplanes
17
S3’ (During take-off) Straight line distance from unstick point to point at which
screen height is achieved
sHp Standard Pressure Altitude (altimeter reading with 1013.25 hPa set on
subscale)
t1 (During take-off) T ime from brakes off to rotation
t1 (During landing) T ime from screen height to touchdown
t2 (During take-off) T ime from rotation to unstuck
t2 (During landing) T ime spent on two wheels during ground roll
t3 (During take-off) T ime from unstick to achieving screen height
t3 (During landing) T ime spent from all three wheels touching down until aircraft
stops.
TAS True Air Speed
TO Configuration for take-off, normally mid flaps gear down.
TP Test Pilot
USAFTPS United States Air Force Test Pilots’ School
V Aircraft translational velocity
V1 (During take-off) True airspeed at rotation.
V1 (During landing) True airspeed at screen height
V2 (During take-off) True airspeed at unstick
V2 (During landing) True airspeed at touchdown
V3 (During take-off) True airspeed at screen height.
V3 (During landing) True airspeed at point when all three wheels touch the
ground.
VA Manoeuvre Speed (maximum speed at which aircraft will stall before
exceeding structural limits in the normal axis)
VD Design airspeed limit (normally quoted in EAS)
VDF Flight test maximum achieved airspeed (normally quoted in CAS or EAS)
VE Best range glide speed

G. B. Gratton Airworthiness Evaluation Techniques f or Small Light Aeroplanes
18
VF Maximum permitted speed with flaps selected. (May be a single value, or
specified at different speeds for different flap settings, depending upon aircraft
type).
VFR Visual Flight Rules
VH Maximum achievable airspeed in level flight.
VMC Visual Meteorological Conditions2 (defined as a minimum visibility of 3km
below 3,000ft or 5km above 3,000ft, clear of cloud below 3,000ft or 1000ft
vertical separation and 1.5km horizontal separation above 3,000 ft ,
maintaining sight of the surface at all t imes). In most countries this also
implies daylight.
VNE Maximum permitted operating speed (Velocity, Never Exceed).
VOR VHF (radio frequency) Omni-directional Range (navigation device)
VRA Recommended maximum speed for flight in severe turbulence (“Rough Air”).
VREF Recommended final approach speed (normally given in IAS)
VS Stalling speed
VS1 Stalling speed at MTOW in a defined (or by default, cruise) configuration.
Vso Stalling speed, at MTOW, in the landing configuration.
W Actual weight of an aircraft.
W/S Wing loading (normally quoted for MTOW)
Wf Mass (or quantity) of fuel carried on board an aircraft.
WT Weight of trike
WW Weight of wing
Wx Weather
XCG.T Perpendicular distance of trike CG forwards of monopole
ZCG.T Distance below hangpoint of trike CG (in axis parallel to the monopole)
2 Note: altitude is conventionally quoted in feet and visibility in kilometres. Whilst not standard SI
units, this convention is continued in this definition of VMC.

G. B. Gratton Airworthiness Evaluation Techniques f or Small Light Aeroplanes
19
ZDT Distance from hangpoint to intercept between monopole and line of action of
drag (assumed to be the centroid of area in front view)
ZT Distance from hangpoint to intercept between monopole and thrustline

G. B. Gratton Airworthiness Evaluation Techniques f or Small Light Aeroplanes
20
1 The “small light aeroplane” or “microlight aeroplane”
1.1 The legal definition of a microlight aeroplane.
Microlight aircraft are artificially defined: that is a low energy aircraft definition which
allows simplified (and hence reduced cost) certification, construction, and operating rules.
Whilst the existence of reduced regulation (or deregulated) low energy aircraft occurs in
most countries, the precise definition and the terminology used varies. Terms used outside
the United Kingdom include ultralight (USA, Australia, Canada), ultra-leger motorisée
(France) and ultraleichtflugzeuge (Germany, Austria)
The terms “small light aeroplane” (sometimes abbreviated to “SLA”) and “microlight
aeroplane” may be considered interchangeable. In practice, the term “microlight aeroplane”
is most commonly used, whilst “small light aeroplane” is used by BCAR Section S[1], the
UK certification standard for aeroplanes in this class (it was also a temporary legal
definition used in the UK between 1999 and 2002 to indicate aircraft meeting the definition
below but not the previous definition as described in 1.3 below .
• For landplanes: MTOW not exceeding 450kg for 2-seat aircraft, or 300kg for
single seat aircraft
• For seaplanes and amphibians, MTOW not exceeding 495kg, or 330kg for
single seat aircraft.
• Vso not exceeding 35 kn CAS. (Note, in the UK only, an acceptable
alternative is a wing loading not exceeding 25 kgf.m-2
).
• A maximum of 2 seats.
1.2 The practical definition of a microlight aeroplane.
Microlight aeroplanes have become a mainstream part of recreational aviation. At July
2004, they account for 23% of civil aircraft registered in the United Kingdom, and a similar
proportion in most other affluent countries. They may be divided into three different control
systems, although only two are considered in the course of this thesis, that is, three-axis and
weightshift. The United Kingdom has 6 manufacturers of such aircraft, and numerous
others exist worldwide.

G. B. Gratton Airworthiness Evaluation Techniques f or Small Light Aeroplanes
21
The most common type of microlight aircraft is the “weightshift” or “flexwing aircraft”, an
example of which is shown in Figure 1. A description of these aircraft and their operation
may be found in [2]. In the UK, about 2,600 such aircraft exist.
Figure 1, Mainair Gemini Flash 2 alpha
Less common, but still very popular (about 1,100 such aircraft in the UK), is the 3-axis
controlled aeroplane. These have much in common with a conventional light aircraft, and in
many cases are indistinguishable save by an inspection of documentation – the dividing line
being only the legal definition given above. Two typical aircraft are shown below in Figure
2 and Figure 3.

G. B. Gratton Airworthiness Evaluation Techniques f or Small Light Aeroplanes
22
Figure 2, Chevvron 2-32c 3-axis microlight aeroplane
Figure 3, Raj Hamsa X'Air Mk.1 3-axis microlight aeroplane
Further examples of typical aircraft, particularly those referred to within the text of this thesis, are
included in Appendix B, with illustrations and main technical details.
1.3 A brief history of microlight aviation in the United Kingdom
Whilst recreational aviation in various forms has existed in the United Kingdom since the
19th century, there was a particular surge in interest in the early 1970s. Operating outside of
regulation, two imported technologies in particular appealed to a desire amongst certain

G. B. Gratton Airworthiness Evaluation Techniques f or Small Light Aeroplanes
23
people to fly without restriction. The first was the Rogallo winged hang-glider, which had
been developed from some NASA research into foldable lightweight wings, the second was
attempts primarily in the USA and Australia to develop very lightweight single-seat fixed
wing aircraft such as the Australian Wheeler Scout, and the American Chotia Weedhopper.
These two technologies to some extent converged, with powered hang-gliders and
lightweight aeroplanes becoming relatively commonplace by the late 1970s, and sharing
flying sites, and many components – particularly engines, propellers and undercarriage
parts.
By the early 1980s, microlight aeroplanes were becoming increasingly common, but they
were also becoming a matter of public concern. A combination of noise nuisance, and a
high fatal accident rate (peaking at 18 deaths in the UK in one year[3]) caused questions to
be asked in the houses of parliament. As a result, the UK Civil Aviation Authority was
instructed to regulate microlight aeroplanes; therefore in 1981 mandatory pilot licensing was
introduced, in 1984 it became mandatory that all aircraft with a empty weight exceeding
70kg met newly introduced safety requirements (BCAR Section S, based upon JAR-VLA
and JAR-22) and in 1987 it became mandatory that all microlight aeroplanes should meet
these requirements – albeit that “grandfather rights” were granted to aircraft with some
established history of safe operation. During the same period mandatory noise emission
testing was also introduced, as were requirements for periodic (usually annual) inspection
and flight testing of all microlight aeroplanes. After some variation, the microlight
definition was established as being a single or two-seat aeroplane, with an MTOW not
exceeding 390kg and a wing loading (W/S) not greater than 25 kg/m². Additional
limitations permitted a fuel capacity of no more than 50 litres and required that with a
maximum seat occupancy of 90kg per seat (later revised to 86kg) and full fuel the aircraft
should not exceed its MTOW.
Figure 4, Chotia Weedhopper

G. B. Gratton Airworthiness Evaluation Techniques f or Small Light Aeroplanes
24
Hence by 1987 the current pattern of regulation in British microlight aviation was
established. That is that in order to fly (except under flight test conditions) all aircraft had to
have been issued with a permit to fly, the basis for issuance of which was BCAR Section
S[4]. That permit requires revalidation annually via an inspection and check flight, both by
qualified persons [5].
During the late 1980s and the early 1990s the British industry matured, and numerous new
designs were introduced, mostly indigenous, the overall size of the fleet increasing
substantially as indicated by Figure 5 below. The reasons were various, including improved
public perception, improved accident rates, and reduced noise nuisance, as well as a
continued large cost advantage relative to conventional General Aviation.
Figure 5, size of British registered microlight aircraft fleet
Number of UK registered microlights at 1 January each year
0
500
1000
1500
2000
2500
3000
3500
4000
4500
1984 1989 1994 1999 2004
Year
A further change was forced by the fact that this British microlight definition had diverged
significantly from that which had become standardised across Europe – the European
definition being based upon a sporting definition adopted by the Fédération Aéronautique

G. B. Gratton Airworthiness Evaluation Techniques f or Small Light Aeroplanes
25
Internationale (FAI). Therefore in 1999, after several years of national debate, the UK
adopted the European microlight definition, which included [6] aeroplanes having no more
than two seats, Vso not exceeding 35 knots CAS, and a maximum take-off mass of no more
than:-
- 300 kg for a landplane, single seater; or
- 450 kg for a landplane, two-seater; or
- 330 kg for an amphibian or floatplane, single seater; or
- 495 kg for an amphibian or floatplane
The previous wing loading limits and fuel limitation ceased to apply, and the empty weight
limit was revised to require that with 86kg per seat and one hours fuel at maximum
continuous power the aircraft should not exceed it’s MTOW.
This revision to the British microlight definition also co-incided with a re-issue of BCAR
Section S at issue 2, which had been substantially revised to reflect the (correctly)
anticipated greater kinetic energy and complexity of these “450kg” aircraft that started to
appear, primarily through imports from the European mainland, once the microlight
definitions had converged.
During the same period, various countries other than the United Kingdom also developed
indigenous microlight safety standards. Of greatest significance was Germany (formerly
West Germany) which developed a standard initially very similar to BCAR Section S,
named BFU-95[7]; this was more recently superseded by a newer standard named RTF-UL
[8]. The other country known to have introduced a rigorous design code against a similar
microlight definition to the United Kingdom was the Czech Republic, whose design code
UL2 part 1 is essentially a translation into Czech of the German code BFU-95. There has
not been any successful attempt to converge the various requirements for microlight
aeroplanes, but a degree of natural convergence has tended to occur, primarily because these
various requirements have all to a greater or lesser extent been based upon JAR-22[9] and
JAR-VLA[10].

G. B. Gratton Airworthiness Evaluation Techniques f or Small Light Aeroplanes
26
1.4 The environment within which a microlight aeroplane operates.
It is not possible to properly understand the design of an aircraft without also understanding
the operating environment. In many respects microlight aircraft are operated in a similar
manner to any other privately owned light aeroplane. However, there are significant
differences which are important when considering the design of these aircraft.
In the United Kingdom, as in many other countries, the law prevents the use of microlight
aircraft for commercial work, other than for flight training, or during airworthiness flight
testing (although the hiring of aircraft has recently become permissible under certain
circumstances [11]). For this reason, and the low cost of ownership compared to other
classes of aircraft, most aircraft are privately owned by individual pilots. Because these
aircraft are associated with the search for low-cost aviation, this usually means that the
aircraft are stored in less than ideal facilities (trailers, barns, sheds) and they are operated
from what are normally semi-prepared or unprepared short (below 500m) grass airstrips
which would probably be impracticable for larger or more conventional aircraft.
In addition, the routine maintenance on these aircraft is most often conducted by the aircraft
owner, who often will have very little formal training or experience in aircraft maintenance.
These characteristics demand certain features from most microlight aircraft; specifically
portability, ruggedness, and simplicity.
The pilots who fly microlight aircraft should also be considered. In the United Kingdom,
they are trained to a relatively simple syllabus which can be completed in as few as 25
flying hours [12]. This relative lack of training and experience that can be expected from
some private pilots puts a large onus upon those evaluating the airworthiness of an aircraft
to ensure great clarity of operating instructions, and a good level of flying qualities.
1.5 General Peculiarities of microlight aircraft performance and handling.
Microlight aircraft inevitably possess low mass, and usually possess a relatively high form
drag. This combination means that the speed and height can change very quickly,
particularly in the event of power loss.
Such aeroplanes are almost universally fitted with uncertified engines, which may then be
maintained by the operator who does not hold formal servicing qualifications. The

G. B. Gratton Airworthiness Evaluation Techniques f or Small Light Aeroplanes
27
consequence of this is that such aircraft are more prone to engine failure than other classes.
This necessitates good engine-off handling qualities, and relatively good (or at least
predictable) glide performance.
Associated with the requirement for good glide performance, is the need for good low speed
handling qualities. This is partly ensured by the certification requirement that either VSO
does not exceed 35 kn CAS, or that W/S does not exceed 25 kg/m². However equally, it is
necessary that aircraft have flying controls which will allow full control to be maintained in
all axes controlled down to a very low stalling speed – this implies in many cases greater
control authority over the aircraft at low speeds than most larger “light” aircraft would
possess.
A further effect of the low mass combined with the requirement for a low stall speed
(implying a generally low wing loading), is that the effects of turbulence or other air
disturbance is comparatively great. Pilots become familiar with large lateral or normal
disturbances (potentially 45° of undemanded bank or ±1g NZ) during flying in visual
conditions. These not only require sufficient structural integrity and strength, but sufficient
control authority to correct such disturbances quickly enough to prevent loss of control.
However, whilst the above impose particular restrictions, in some areas designers and
airworthiness investigators may be more relaxed. Microlight aircraft are not permitted to fly
other than in day-VMC conditions whilst maintaining sight of the surface at all times. This
means that navigation instruments need not be approved to the standards required for other
aircraft classes (or in some cases, fitted at-all). Handling qualities need not be suitable for
flight in IMC (for example, many microlight aircraft suffer neutral to divergent spiral
stability, a characteristic only normally acceptable in aircraft flown with a constant visual
horizon). Also, microlight aircraft (including all flexwing microlight aircraft, due to the
tumble mode) are normally prohibited from flying aerobatics, so inverted oil and fuel
systems, extreme handling characteristics beyond moderate pilot mishandling, and large
propeller manoeuvring loads need not be considered with great rigour.

G. B. Gratton Airworthiness Evaluation Techniques f or Small Light Aeroplanes
28
1.6 Description Of The Main Design Features And Operation Of Weightshift Controlled
Microlight Aeroplanes.
The main components
Figure 6 below, shows a typical weightshift microlight aircraft (a Mainair Blade 912).
The aircraft comprises of two distinct parts, the trike and the wing. Whilst the interaction
between them is essential to the characteristics of the aircraft, it is convenient initially to
consider them separately.
Figure 6, Mainair Blade 912 in side view (courtesy of Mainair Sports Ltd)
The Wing - Aerodynamics
The weightshift wing is a tailless delta which has positive static stability in all three axes, it
is normally of 8-10m wingspan, and 2.5 - 3.5m from nose to tip trailing edge. There is no
pendular stability, since the trike (the unit hung below the wing, containing crew,
undercarriage and powerplant) is suspended at the hangpoint through a joint which is free to
rotate in pitch and roll without hindrance.

G. B. Gratton Airworthiness Evaluation Techniques f or Small Light Aeroplanes
29
Longitudinal stability is provided by a combination of washout and wingsweep (thus
producing a downforce at the wingtips, which are significantly behind the CG), and reflex (a
reversed curvature of the aerofoil section at the inboard trailing edge). At high speeds, the
fabric covering of the wing (the sail) will tend to flatten, reducing static stability. This is
unacceptable and therefore two devices are incorporated into the wing design to prevent this
loss of longitudinal stability. Firstly tipsticks (see Figure 7), also known as minimum
washout rods are cantilever rods protruding perpendicular to the leading edge of the wing
beneath (or occasionally within) the sail. These prevent the washout at the tips reducing
below a preset value (usually about 3°) at low or negative angles of attack. Secondly, luff
lines are a series of fixed length lines attached to the kingpost (a rod perpendularly above the
centre of the wing) and the trailing edge. These are effective in maintaining reflex at low
angles of attack. Although luff lines have always been used in microlight aircraft, their
advent in hang-gliders in the early 1980s produced a marked reduction in the hang-glider
fatal accident rate [13]. The luffing dive was a neutral pitch control point, at which the pilot
was denied any pitch control over the wing, usually resulting into an unrecoverable
accelerating dive. Figure 8 shows a typical pitching moment .v. AoA curve for a flexwing
microlight wing.
Figure 7, Wing internal structure in planform.

G. B. Gratton Airworthiness Evaluation Techniques f or Small Light Aeroplanes
30
Figure 8, Typical flexwing pitching moment curve
On some modern wings (most notably the Pegasus Q2 wing, Mainair Blade wing, and the
KISS series of wings) the luff lines also are used to provide a pitch trim mechanism. A
tensioning device, controlled from the cockpit, can alter the trim speed through alteration of
the amount of reflex – although sometimes with the undesirable side-effect of modifying roll
power as a function of pitch trimmer setting [14]. Some hang-gliders make use of the
washout rods to control pitch trim in flight [15], but no microlight aeroplane is currently
believed to be using this mechanism.
Directional Stability is provided in the known fashion of any swept wing. This is usually
supplemented by either a keel pocket (a weighted pocket suspended from the wing’s
structural keel) such as may be seen in Figure 6, or less commonly a fin, protruding above
the aft part of the wing (Figure 9). Directional stability of current designs seems to have
reached an ideal mid point between the requirement for adequate directional stability to
ensure balanced turns, and the need to provide adequate control in turbulence; there have
been attempts to fit “tip-fins” to such wings, which have largely resulted in aircraft virtually
uncontrollable in turbulence due to excessive directional stability.

G. B. Gratton Airworthiness Evaluation Techniques f or Small Light Aeroplanes
31
Figure 9, Aircraft with Raven wing, showing fin.
Photograph courtesy of Medway Microlights
Lateral Stability is provided primarily by a combination of wingsweep and angle of attack, in
the same manner as for any classical delta winged aeroplane. It is extremely significant that
at high angles of attack the lateral stability becomes extremely high such that roll power
becomes weak, whilst susceptibility of the wing to undemanded rolling due to gusts becomes
high. For this reason, pilots must fly at comparatively high speeds (occasionally as high as
2.0Vs), and thus low AoA during approach or climb-out in particularly turbulent conditions,
so that adequate control over the aeroplane can be maintained [16]. Nonetheless, lateral
stability can still be unacceptably high, for which reason the wing will employ billow shift.
The billow shift mechanism is as follows: -
a) Bank is initiated by direct application of a rolling moment through the basebar.
b) The trailing edge of the downgoing wing tends to move upwards, whilst the trailing edge
of the upgoing wing tends to move downwards.
c) This movement, is amplified by the lufflines, which are able to slide through a mechanism
at the top of the kingpost. In effect, the wing has differential ailerons!
A similar mechanism also occurs at the wingtips, which are outboard of the lufflines, and
thus provided with no automatic differential. This is known as Leach.

G. B. Gratton Airworthiness Evaluation Techniques f or Small Light Aeroplanes
32
These mechanisms reduce lateral stability and so permits reasonably low control forces and
deflections for comparatively high bank angles (most wings should be able to achieve 60° of
bank with perhaps 200mm of lateral bar deflection). In a wing with low sail tension, this
mechanism can however lead to an excessively high value of Roll Mode Time Constant
(Rτ ) giving handling problems - because of this it is a certification requirement that such
aircraft do not require centring or reversal of roll control when rolling from 60° to 60° before
passing through wings level [17, 18].
The Wing - Structure
The wing structure of a flexwing microlight (Figure 10) is complex, and somewhat unlike a
that of a conventional wing. The primary parts of the structure are the leading edges - two
segmented tubes typically 4.5 - 5.5 metres long, which are joined at the nose to the keel tube
which runs the length of the wing and can be seen protruding from the trailing edge in
Figure 96, Figure 6, and Figure 9. Stretched over these is the sail manufactured from a
high-strength synthetic nonporous fabric such as Polyester Dacron. The whole structure is
put under considerable internal loads during rigging, ensuring rigidity and form by cross-
tubes which are hinged at approximately half span to the leading edges, and hinged to each
other above the keel tube. Although they can and must move laterally relative to the keel
tube, they are attached to the rear of the keel with a tensioning cable - it is this cable, running
the length of the keel which ensures the form of the wing. The mechanism by which the
cross-tubes and keel may move laterally compared to each other is referred to as a floating
keel.
G. B. Gratton Airworthiness Evaluation Techniques f or Small Light Aeroplanes
33
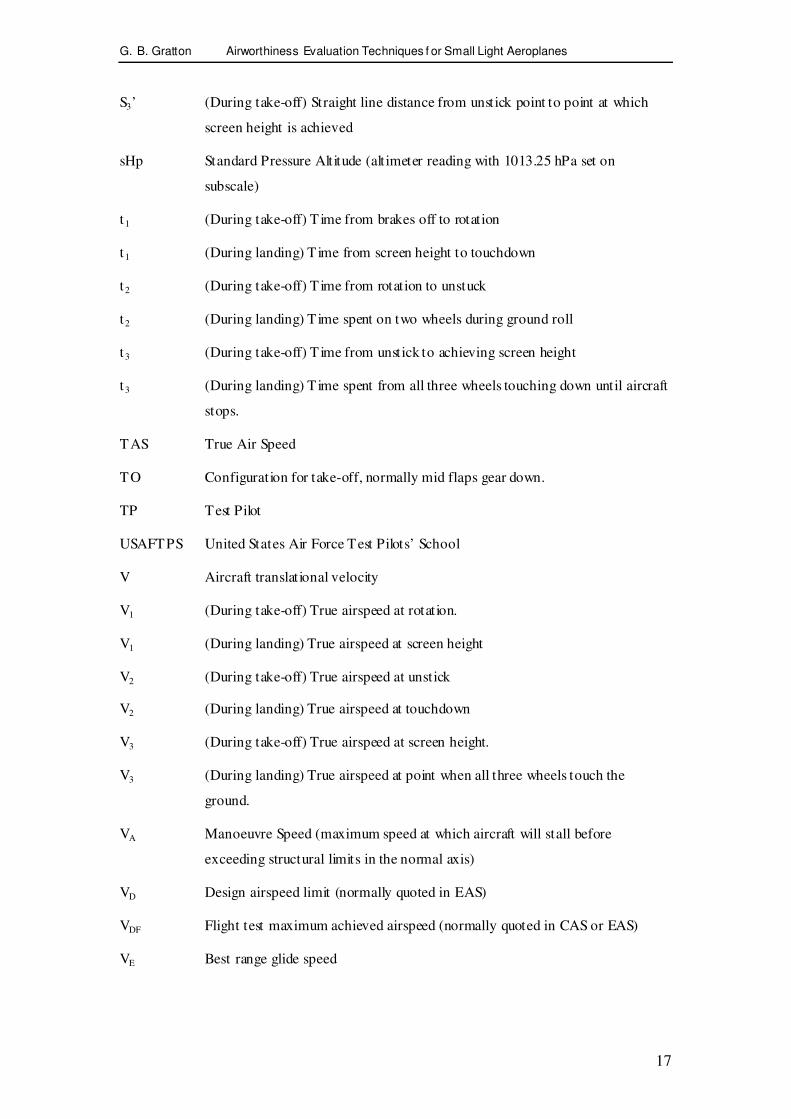
Figure 10, Wing Frame main components
Above the wing is a kingpost, attached through a flexible joint above the keel
tube. To this is attached the lufflines, landing wires (which are attached to the
leading edge / cross-tube junction), and usually leading and trailing edge wires
to hold it in position. This can be seen in Figure 6 and Figure 10
Looking at the wing in end view (see Figure 11 below), the A-frame,
consisting of two uprights and a basebar are clearly visible. In normal flight,
the basebar is not only the primary flight control, providing both roll and pitch
control, but also is primary structure, carrying in tension, via the flying wires
much of the wing loads outboard of the cross-tube / leading edge junction. The
inboard sections of the leading edge, and the A-frame uprights are for the most
part in compression.

G. B. Gratton Airworthiness Evaluation Techniques f or Small Light Aeroplanes
34
Figure 11, Rear end view of Southdown Raven-X aircraft
The position of the basebar is critical to correct control of the aeroplane, the ideal
position relative to the pilot being referred to as the “piano playing position”.
Adjustment of the position of the basebar, when developing a wing, can usually be
done by adjusting the front wires and rear wires which run from the ends of the
basebar to the nose and rear keel respectively. These wires locate the basebar,
whilst also transmitting pitch control forces to the wing.
It can clearly be seen that the “wires” in the weightshift wing are extremely critical
to the structure of the aircraft. All the structural wires are normally duplicated by
parallel wires, perhaps 20 - 60mm away. The exception to this is the lufflines
which, whilst aerodynamically critical, take very little actual load in flight. These
are generally simplex, and of considerably reduced diameter compared to other
structural wires (perhaps 2mm diameter, compared to 4 - 6mm diameter for flying
wires).
The sail in older designs is usually of a single surface, that is the upper surface of
the aerofoil with no separate lower surface. As the design of flexwings developed
during the 1980s, increasingly the forward part of the sail used a lower surface also;
modern wings almost universally have both upper and lower aerofoil surfaces
throughout. The aerofoil section is maintained by battens, which are formed rods

G. B. Gratton Airworthiness Evaluation Techniques f or Small Light Aeroplanes
35
inserted into pockets in the sail then put under compressive load. A modern wing
may have 12 - 20 battens per side. The shape of these battens is highly critical, and
they are subject to regular removal and checking as part of the routine inspection
and maintenance of the wing [19].
The Trike - Aerodynamics
To the whole aircraft, the trike does not contribute significant lift, but inevitably a
large segment of the drag and all of the thrust through a pusher engine / propeller
combination in the 30 - 75 kW (40 - 100 hp) range. Propellers are usually large (1.5
- 1.7m diameter) compared to light aircraft propellers, and connected to either a 2 or
4 stroke engine through a reduction drive. 2 stroke engines are considerably more
common, as are gearbox reduction mechanisms (as compared to belt reduction
mechanisms). The reduction mechanism is necessary because of the high (typically
4000 - 7000 rpm) operating speeds of aircraft two stroke engines, which would
otherwise cause supersonic tip speeds. Reduction ratios vary, although the most
common value is 2.58:1. Ratios as high as 3.47:1 are used, but “simple” values such
as 2:1, 3:1 or 4:1 are avoided because of the risk of sympathetic vibrations between
engine and propeller, given that most propellers are either 2 or 3 bladed. An
additional advantage for the designer, of a gearbox between propeller and engine, is
the ability to easily introduce a torsional shock absorber, protecting the engine
crankshaft from torque fatigue-inducing torque fluctuations; this is particularly
necessary with modern composite propellers which may possess rotational inertia as
high as 5000 kg.cm², compared to perhaps 2000 kg.cm² for a simple 2-bladed
wooden propeller.
Aerodynamically the trike often has a significant effect upon directional stability[20].
The pod, which protrudes considerably forward of the trike CG, can often have a
destabilising effect in yaw, particularly combined with a powerful engine. For this
reason more modern, powerful aircraft, tend to use large aerofoil section wheel spats
(as may be seen on the Mainair Blade in Figure 6). Older, less highly powered
aircraft such as the Raven in Figure 11 have less need of this. An interesting
demonstration of this problem was the Pegasus XL-Q, an aircraft manufactured in
G. B. Gratton Airworthiness Evaluation Techniques f or Small Light Aeroplanes
36
the late 1980s / early 1990s which had a comparatively powerful engine and a large
forward pod area. Some examples of this aircraft would display a divergent Dutch
Roll mode at high speeds, driven partly by poor trike directional stability, and partly
by poor wing roll damping. The latter was particularly noticeable on aircraft with a
multicoloured undersurface, the dyeing process of which had marked effects upon
the fabric’s elastic properties. This is one of the few recorded cases of an aircraft’s
colour scheme affecting the handling qualities - but any Engineer dealing with fabric
covered aircraft should be aware of the risk. The author’s personal experience of
flying a “Rainbow-Q” aircraft, was also of a high Rτ giving less ‘crisp’ roll control
than more soberly coloured wings..
In pitch, the trike mass has the effect of setting the trim speed of the aircraft. The
hangpoint (point on the trike keel at which the trike’s monopole is attached to the
wing) is not at CP, therefore the pitching moment of the trike as suspended from the
wing affects the trim speed of the aircraft. In practice it is the position of the
hangpoint which affects the trim speed far more than the weight of the trike. In a
Medway Raven-X aircraft (Figure 9), a 70 mm change in hangpoint position could
alter the trim speed in the range 35 - 60 knots, whilst a 50% increase in trike
suspended weight might increase the trim speed by 3 - 4 knots; a similar response has
been found during flight testing of an experimental variable hangpoint on a Mainair
Gemini Flash 2 alpha . This effect will be discussed in greater depth later in this
appendix. However at this point it is important to appreciate that the wing
aerodynamics alone, whilst important, cannot just be regarded separately from the
dynamics of the whole, combined system.
Because of the nature of the hangpoint, the trike has no effect upon lateral stability
other than by increasing or decreasing the load upon the wing, and thus the trimmed
AoA value.
The Trike - Structure
The most important part of the trike is the monopole: this is the “vertical” mast
extending from the mainwheels to the hangpoint. Engine, wing, seat frame and

G. B. Gratton Airworthiness Evaluation Techniques f or Small Light Aeroplanes
37
mainwheels are all attached to this component which is structurally highly critical.
Generally, the monopole will consist of two concentric aluminium alloy tubes, with
an interference fit between them. Whilst this design should give adequate protection
against failure due to fatigue crack propagation around the monopole, most designers
also fit a further backup cable through the centre of the monopole which connects the
lower engine mount, or sometime undercarriage attachment, to the hangpoint.
Horizontally from the base of the monopole runs the trike keel tube to which will be
attached the forward part of the seat frame, and the nosewheel. From the front of
the trike keel tube (also known as the snoot) to the monopole, just below the
hangpoint, runs the front strut. Although this has the appearance of primary
structure, in most flight modes its primary function is of a control stop - preventing
the basebar from travelling so far forward that the propeller may strike the rear part
of the wing keel. It does however serve a function in preventing collapse or
inadvertent distortion of the trike frame during either heavy landings, or high normal
acceleration manoeuvres. The front strut is held in place by a single removable pin
at top and bottom; it is essential that it can be easily removed to permit the wing to
be removed during derigging. The rigging and derigging operations will be
discussed later.
The Combined Aircraft
The combined structure of the wing and trike become a complete aircraft. They are
joined by a single bolt in quadruple shear at the hangpoint, known as the “hangbolt”
or more commonly and colloquially as the “Jesus Bolt”, reflecting the available
alternatives in the event of a bolt failure - thankfully an almost unknown occurrence.
Most designs will also incorporate a backup strap or cable, attached to the monopole
below the hangpoint, which runs loosely around the keel tube. This, is in case of a
hangbolt failure, is expected to keep the wing and trike together, albeit with control
restriction and likely damage to the keel, is intended to keep the wing and trike
together long enough for a landing to be executed. No recorded instance can be
found of this backup mechanism being tested following an actual hangbolt failure.

G. B. Gratton Airworthiness Evaluation Techniques f or Small Light Aeroplanes
38
So far as the wing and its longitudinal stability is concerned, the CG is located at the
hangpoint. The trike CG, compared to that of a conventional aeroplane, is
comparatively unimportant. It is essential that the trike CG is such that when
suspended, the mainwheels hang at least 30mm below the nosewheel (so as to
prevent any risk of a nosewheel-first landing), but beyond that current theory does
not consider trike longitudinal CG to be significant in aircraft stability. However, it
is important that the basebar position, which the designer may alter by changing the
lengths of front and rear flying wires, is in a roughly central position between the
pilot’s chest and the front strut, thus ensuring adequate longitudinal control in both
the nose-up and nose-down senses. Thrust does have a significant effect upon the
“hang-angle” of the trike, and thus although not affecting the trim speed, will alter
the ratio of pitch control authority in the nose-up to nose-down directions (i.e. at
higher thrust, the trike tends to hang more nose-up, and thus the nose-up pitch
authority increases since there is greater distance between the basebar and front strut
in the trimmed condition.)
The trim speed of the aircraft is the airspeed at which the aircraft will tend to fly
hands-off, variations from which requiring a continuous force to be applied at the
control bar. Apart from some modern types which use the lufflines to provide a pitch
trimmer effect, the majority of weightshift microlights do not have any kind of
trimmer and thus the pilot will tend to climb, cruise, and descend at constant speed.
The value of the trim speed is dictated by four factors: -
• The form of the CM-α curve for the wing.
• The form of the CL-α curve for the wing.
• The weight of the trike.
• The distance from the hangpoint to the wing Centre of Pressure (CP).
The trim speed will be that speed at which the form of the CM-α curve shows a
pitching moment at the value of CL necessary for 1g flight at the aircraft weight, equal
and opposite to the pitching moment generated by the weight of the trike multiplied by
the moment arm between the hangpoint and CP. Both the CM-α and CL-α curves will

G. B. Gratton Airworthiness Evaluation Techniques f or Small Light Aeroplanes
39
vary in shape and dimensions as a function of airspeed, due to the aeroelastic
deformation of the wing surface.
The subject of longitudinal static stability of the weightshift aircraft is obviously far
more complex than the simplified explanation above, but it is not proposed to discuss
the subject, which is still not well understood, further herein. However reference [21]
attempts to analyse the problem for hang-gliders which, although lacking a propulsion
device, have similar characteristics.
Design Implications of the Operating Environment
In the United Kingdom, as in many other countries the use of microlight aeroplanes is
restricted; specifically to private use, instruction, airworthiness flight testing [22], and
hire only under certain limited conditions [23]. For this reason, and the low cost of
ownership compared to other classes of aircraft, most aircraft are privately owned by
individual pilots. Because these aircraft are associated with the search for “cheap”
aviation, this usually means that the aircraft are stored in less than ideal facilities
(trailers, barns, sheds) and they are operated from what are normally semi-prepared or
unprepared short (<500m) grass airstrips which would probably be impracticable for
larger or more conventional aircraft.
Almost universally also, the routine maintenance on these aircraft is conducted by the
aircraft owner, who often will have very little formal training or experience in aircraft
maintenance.
These characteristics demand certain features from a flexwing microlight aircraft;
specifically portability, ruggedness, and simplicity.
Derigging of a weightshift microlight is in two stages. Firstly the front strut is
removed, permitting the monopole to be inclined forwards until the basebar and nose
of the wing rest upon the ground. This allows the hangbolt to be removed, and the
wing and trike separated. The monopole inclines forward by use of hinged joints at
the base of the monopole, and at the centre and each end of the seat frame (see Figure

G. B. Gratton Airworthiness Evaluation Techniques f or Small Light Aeroplanes
40
12 below). Some more modern trikes such as the Pegasus Quantum eliminate the seat-
folding mechanism by locating the monopole slightly further forward and using a gas-
filled compression strut between the monopole and trike keel.
Figure 12, Conventional trike “breaking” mechanism.
The second stage of derigging is for the link between the nose and crosstubes to be
removed, taking the tension from the system, permitting the leading edges and
crosstubes to be folded parallel with the wing keel, and allowing the battens to be
removed. The A-frame is also collapsed by removal of the forward flying wire, and
then removal of the basebar, permitting the pin-jointed A-frame structure to be folded
again parallel with the wing keel. This entire process, including folding of the fabric,
which remains attached to the wing frame takes 20-30 minutes and leaves the wing in
readily transportable state - a cylinder roughly 5.5m x 0.3m. The two component parts
(wing and trike) of a 2-seat aircraft will have empty weights of approximately 50kg
and 100-130kg respectively and are now easily storable or transportable.
The advantages of this system of routine derigging are routine removal of the wing
fabric from exposure to degrading UV radiation, the forced regular inspection of much
of the primary aircraft structure by the pilot, and the ability to store or transport the
aircraft inexpensively. The primary disadvantages are inconvenience to the pilot, and
wear and tear upon the aircraft structure, particularly the sail.

G. B. Gratton Airworthiness Evaluation Techniques f or Small Light Aeroplanes
41
Ruggedness and simplicity in the design of flexwing microlights go together.
Virtually all of the structure of the aircraft is constructed from bolted or pinjointed
alloy tube, which is a form of structure that tends to be very elastic under load. Also,
because of the simplicity of this, in the event of structural damage, repair is almost
invariably by direct replacement, a task which requires very little skill. Virtually all
primary structure is duplicated, usually by internal or external sleeving, or internal
backup cables.
Undercarriages, which traditionally are the most damage susceptible parts of a light
aircraft are again manufactured from a pin-jointed tubular structure. Shock absorption
is from large tyres, with spring action created by steel cables between the mainwheel
hubs (see Figure 13 below). This system is aerodynamically very inefficient, but is
capable of sustaining very large landing shocks, whilst being inexpensive to construct,
and largely maintenance free. More modern microlights have used undercarriage
shock absorption more similar to that used on a light aircraft, but the system described
continues to be the most common and inexpensive design solution.
Figure 13, Rear View of Mainair Gemini Trike Main Undercarriage
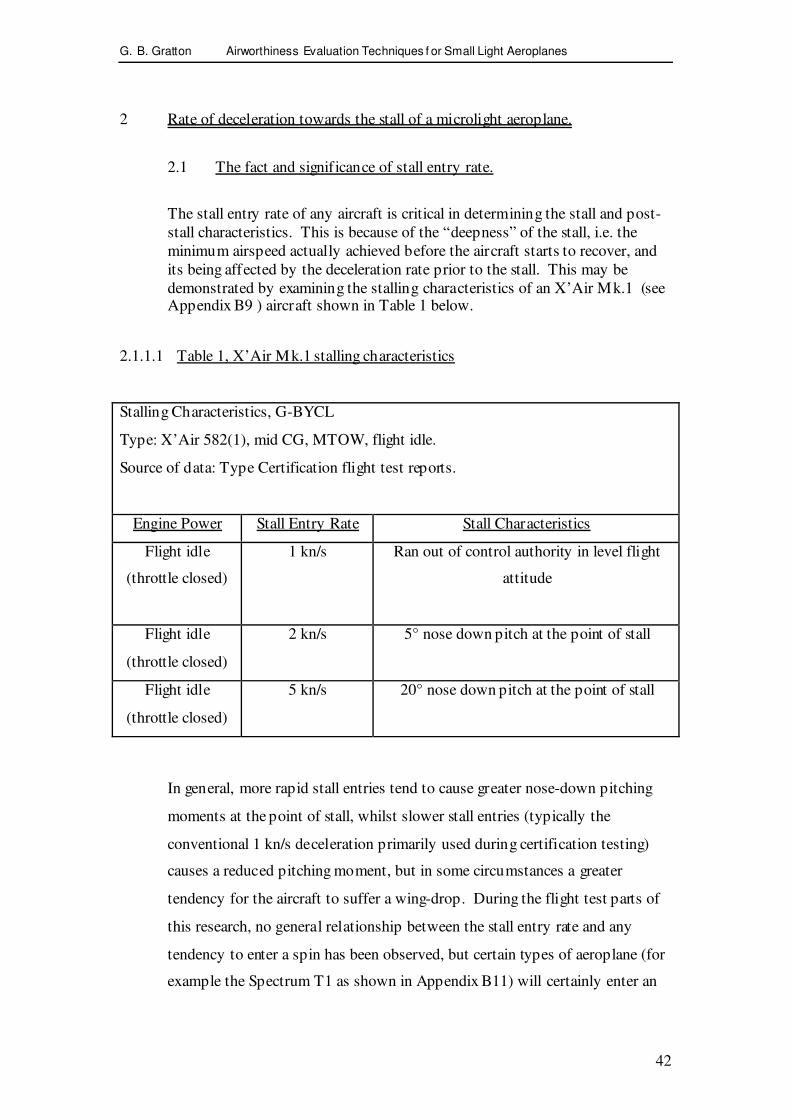
G. B. Gratton Airworthiness Evaluation Techniques f or Small Light Aeroplanes
42
2 Rate of deceleration towards the stall of a microlight aeroplane.
2.1 The fact and significance of stall entry rate.
The stall entry rate of any aircraft is critical in determining the stall and post-
stall characteristics. This is because of the “deepness” of the stall, i.e. the
minimum airspeed actually achieved before the aircraft starts to recover, and
its being affected by the deceleration rate prior to the stall. This may be
demonstrated by examining the stalling characteristics of an X’Air Mk.1 (see Appendix B9 ) aircraft shown in Table 1 below.
2.1.1.1 Table 1, X’Air Mk.1 stalling characteristics
Stalling Characteristics, G-BYCL
Type: X’Air 582(1), mid CG, MTOW, flight idle.
Source of data: Type Certification flight test reports.
Engine Power Stall Entry Rate Stall Characteristics
Flight idle
(throttle closed)
1 kn/s Ran out of control authority in level flight
attitude
Flight idle
(throttle closed)
2 kn/s 5° nose down pitch at the point of stall
Flight idle
(throttle closed)
5 kn/s 20° nose down pitch at the point of stall
In general, more rapid stall entries tend to cause greater nose-down pitching
moments at the point of stall, whilst slower stall entries (typically the
conventional 1 kn/s deceleration primarily used during certification testing)
causes a reduced pitching moment, but in some circumstances a greater
tendency for the aircraft to suffer a wing-drop. During the flight test parts of
this research, no general relationship between the stall entry rate and any
tendency to enter a spin has been observed, but certain types of aeroplane (for
example the Spectrum T1 as shown in Appendix B11) will certainly enter an

G. B. Gratton Airworthiness Evaluation Techniques f or Small Light Aeroplanes
43
incipient spin mode from a rapid stall entry, whilst this does not occur
following a more gradual deceleration.
2.2 The definition of the stall and stall warning from the perspective of the
pilot.
It is important to appreciate that the stall, as seen by the pilot, is not identical
to the stall as would be understood classically by an aerodynamicist. The
following definition, which is extracted from BCAR Section S, is typical of
the definitions contained in most civil certification standards:-
(From S201(a)) Stall demonstrations must be conducted by reducing the speed
by approximately 1kn/s from straight and level flight until either a stall results
as evidenced by a downward pitching motion or downward pitching and
rolling motion not immediately controllable or until the longitudinal control
reaches the stop.
A more simple definition, which is a variation upon that taught in the military
test pilots schools such as the Empire Test Pilots School at Boscombe Down,
Wiltshire (ETPS), is that a stall is the point following deceleration at which
the pilot ceases to have full control over the aeroplane. This is compatible
with the definition above, since an uncontrolled motion or the longitudinal
control being on the stop are clear indicators that the pilot does not have full
control over the aircraft in all axes; however, wing rocking (undemanded
rolling oscillations, initially of low amplitude but potentially enough to roll an
aircraft inverted if not controlled), or other low-speed departures from
controlled flight may also be included.
This definition is different to the stall as commonly explained in purely
aerodynamic terms. Such conventional explanations (for example section 8.2.
of [24]) would most normally either define the stall when considering lift
versus AoA characteristics as the point at which lift ceases to increase with
increasing AoA, by reference to a flow visualisation as the point where a given
degree of flow detachment occurs from the lifting surface, or as the point at

G. B. Gratton Airworthiness Evaluation Techniques f or Small Light Aeroplanes
44
which there is a marked increase in the gradient of α∂
∂C M . However, whilst
these features are essential to aerodynamic research, not all (or sometimes
any) of these will be immediately apparent in those forms to a pilot and
depending upon severity may not be considered by a pilot to mark the stall in
any case.
During a test programme, the test team must define the stall for a specific
aircraft. Notwithstanding that other definitions may be useful in certain
circumstances, the three most common definitions are:-
- The longitudinal control being on the nose-up control stop (often
termed “mush” by pilots). This is most common at forward CG /
hangpoint states where insufficient nose-up control authority exists to
fully aerodynamically stall the wing.
- A downward pitching motion (often termed a “pitch break”). This is
caused by a loss of lift at the mainplane (or canard) altering the balance
of forces and moments on the aircraft and causing a net nose-down
pitching moment. This is most common at aft CG/hangpoint states,
where there is sufficient nose-up control authority to fully
aerodynamically stall the wing.
- A wing drop, sometimes accompanying a pitch break. This occurs
where the two sides of the mainplane do not stall simultaneously and
may be caused by a small amount of uncorrected sideslip, a rigging
asymmetry in the wings and airframe, or by an inadvertent control
input.
The term stall warning describes those characteristics of the aircraft which
indicate to a pilot that he or she is flying at conditions close to the stall and
caution may be needed. Stall warning characteristics will vary between

G. B. Gratton Airworthiness Evaluation Techniques f or Small Light Aeroplanes
45
aircraft and should normally be noted in the operators manual. The following
are typical stall warnings:-
- Airframe buffet, as localised airflow starts to detach.
- Stick buffet, as localised airflow, usually over the wing root in a
conventional 3-axis/tailplane aircraft, detaches and strikes the tail
control surfaces.
- Artificial stall warning devices, normally either based upon an AoA
sensor [25]or a localised airflow pressure sensor[26], [27].
- An aircraft pitch attitude which is perceptibly more nose-up than that
normally seen in level flight.
- The aircraft’s primary pitch control being noticeably displaced in the
nose-up sense compared to its position in level flight.
- Lack of control responsiveness.
During the airworthiness evaluation process for any aircraft, the following
questions need to be addressed:-
- What are the stalling characteristics at representative deceleration
rates? Are these characteristics acceptable?
- What are the stall warning cues? Are they adequate?
- Is the aircraft fully controllable during deceleration down to the point
of stall?
- Can the aircraft, post-stall, be returned to controlled flight without the
use of exceptional piloting skill, or whilst suffering an unacceptable
degree of height loss or uncommanded manoeuvre?

G. B. Gratton Airworthiness Evaluation Techniques f or Small Light Aeroplanes
46
Finally, operating data (most particularly the Pilots Operating Handbook, or
POH) must be confirmed to accurately and safely address the stalling
characteristics of the aeroplane.
2.3 The significance and magnitude of the stall entry rate
Historical experience[28] is that in most light aircraft, the combination of
inertia and drag are such that in the event of mishandling or sudden loss of
power, the rate of deceleration can reasonably be expected to be around the
1kn/s used for the determination of stall speed (and acceptable handling
characteristics at the point of stall) contained within most certification codes.
However, for microlight aircraft, this is not necessarily true; the combination
of low mass and relatively high drag (particularly caused by unfaired or
externally braced structures) can result in far higher deceleration rates. The
consequence of this is that the handling characteristics following a genuinely
inadvertent stall, can differ significantly from those which would be found if
testing was only carried out at 1kn/s deceleration.
Realising this, most accepted test schedules such as [29],[30] insist upon
acceptable stalling characteristics at increased deceleration rates of up to
5kn/s. This value however is entirely empirical and the reason for this value
has not historically been justified. To address this lack of rigour, the
following investigation seeks to establish a means to estimate a deceleration
rate, representative of what would occur in a mishandling or sudden loss of
power case, which might be used during certification flight testing to
determine whether stalling characteristics are acceptable.
2.4 Measuring and Estimating Stall Entry Rate
The following assumptions are made:
- In this class of aircraft, the pilot will initially either enter a descent or
maintain level flight in the event of a sudden engine failure. (In high energy
aircraft such as fighters the immediate action would be to climb to increase

G. B. Gratton Airworthiness Evaluation Techniques f or Small Light Aeroplanes
47
potential energy; however this behaviour is inappropriate and is not taught in
small light aeroplanes.)
- CDo is constant between VS and VE
- The partial derivative of lift with respect to induced drag squared is
constant between VS and VE
- The aircraft is moving within a fixed air mass (i.e. inertial effects due
to movement of that air mass are insignificant).
Basic equations:
Basic lift equation
L = ½ ρ V²SCL (2-1)
Basic drag equation
D = ½ρ V²SCD (2-2)
Components of Drag
CD = CDo + k CL²
(2-3)
Note that the term k above represents something more complex than a simple
coefficient, however for the purposes of this analysis will be treated as a constant
value for ( )∂
∂
D
L
CC
2 and its greater physical significance will not be discussed. A detailed
discussion of the significance of this constant may be found particularly in chapter XI
of reference [31] and also repeated in more recent texts.
Consider the Aircraft at the stall
Drag at the point of stall
[from (2-3)], assuming
CLmax occurs at the stall.
2
maxLDoDs kCCC += (2-4)
Re-arranging (2-1):-
SV
MgC
S
L 2
21
max
ρ=
(2-5)

G. B. Gratton Airworthiness Evaluation Techniques f or Small Light Aeroplanes
48
Inserting (2-5) into (2-4):- 2
2
21
+=
SV
MgkCC
S
DoDsρ
(2-6)
Inserting (2-6) into (2-2):-
+=
2
2
21
22
1
SV
MgkCVD
S
DoSsρ
ρ
(2-7)
Applying Newton’s second
law to (2-7)
+
−=
2
2
21
0
2
21
SV
MgkC
M
SV
dt
dV
S
D
S
S ρ
ρ Where
the acceleration rate, dt
dVshould have a
negative sign during the deceleration towards
the stall.
(2-8)
In order to solve equation (2-8) we only require CDo and k, since all other
parameters are known. These missing terms will be found by use of the best
range glide condition - since at this condition CDo = kCL² and the best glide
ratio, G, exists. G will normally have been determined and is quoted in the
aircraft operating manual.
(Note: proof that CDo = kCL². Total subsonic aircraft drag is conventionally
regarded as being made up of two components [32] which are induced drag,
defined by 22
..½ Li CkSVD ρ= and profile (or form) drag which is defined by
CVD DS
ii
2½ ρ= . Figure 14 below is shown a generic graph for these two
components and the total value of drag, defined by Pi
DDD += . )

G. B. Gratton Airworthiness Evaluation Techniques f or Small Light Aeroplanes
49
Figure 14, Generic polar for total drag upon a subsonic aircraft
Airspeed
Dra
g
Induced Drag
Total drag
Profile Drag
By inspection, total drag is at a minimum at the airspeed where Profile drag is
equal to induced drag. Therefore at this speed,
DoL SCVCkSV 222
21..
21 ρρ = and hence, DoL CCk ≡2. .)
(Note: proof that (L/D)MAX is identical to the best glide ratio. The curve of
total drag against speed is known from all available experimental data to show
a clear minimum. Since
=
L
DLD and assuming level flight or a shallow
glide angle WL = ,
=
L
DWD . Thus the speed at which the minimum value
of drag occurs is co-incident with the point where L/D is at a maximum. It is
known that L/D is identical to the glide ratio, and thus to the best glide ratio
since it is at a maximum at this speed.)
Hence, at this condition: CC LEDok
2=
(2-9)
And also, from (2-1) CSV LEnMgL
E
2
21 ρ== (2-10)

G. B. Gratton Airworthiness Evaluation Techniques f or Small Light Aeroplanes
50
Therefore, and assuming
that n=1 (nominally level
flight)
SVC
E
LE
Mg2
21 ρ
=
(2-11)
We know that at this
condition, CC LEDok
2=
thus:-
C
C
LE
Dok2
=
(2-12)
And since CC
D
LG = at this point
CC
CC
Do
LE
D
LEG2
==
(2-13)
Thus:-
G
CC
LE
Do 2=
(2-14)
Substituting (2-14) into (2-
12) gives:- CCC
LELE
LE
GGk
2
1
22
==
(2-15)
and substituting (2-11) into
(2-15) gives:- MgG
kSV E
2
21
2
1 ρ
=
(2-16)
So, from (2-16) one may now calculate k, since all other terms are known.
Now, from (2-9), (2-16) and
(2-11):-
==
SV
Mg
Mg
SVCC
E
E
Gk
LEDo 22
1
22
1
2
1
2
2
ρ
ρ
=∴ C Do
G2
1
SV
Mg
E2
21 ρ
(2-17)
Then, inserting (2-16) and (2-17) into (2-8) this gives an estimate for the aircraft’s
longitudinal acceleration at the point of stall:-
+
=
2
2
21
2
21
2
21
2
21
2
1
2
1
SV
Mg
Mg
SV
GSV
Mg
GM
SV
dt
dV
S
E
E
S
S ρ
ρ
ρ
ρ
(2-18)

G. B. Gratton Airworthiness Evaluation Techniques f or Small Light Aeroplanes
51
It may be seen, that all terms in M, ½ρ ,S cancel out in (2-18), giving:-
+
=
g
V
V
GV
g
GV
dt
dV
S
E
E
s
S
4
2
2
2
2
1
2
1
(2-19)
+=
2
2
2
2
2S
E
E
S
V
V
V
V
G
g
(2-20)
This gives a value, from readily available aircraft data for the maximum
magnitude of acceleration (which will have a negative sign) immediately prior
to the stall event, when an aircraft is not in manoeuvring or climbing flight.
The airspeed values, since they divide into each other may be treated in any
convenient unit, g is conventionally in ms-2
and the value is for all normal
purposes fixed. However, the equation (2-20) will give a value in ms-2
, which
is inconvenient for flight use. Therefore a standard value of g=9.80665 will be
applied and a conversion of 0.514 from ms-2
to kn/s will be applied. This
gives the following:-
Therefore:-
+=
2
2
2
254.9
S
E
E
S
S V
V
V
V
Gdt
dVkn/s
(2-21)
Before progressing further, it is appropriate to consider the nature of the
airspeeds under discussion. An aircraft will indicate results in IAS, which for
current purposes will be treated as CAS (Calibrated Airspeed) and the errors
disregarded. It is theoretically possible that deceleration could instead be
measured using an accelerometer, but the combination of a comparatively low
rate of deceleration and presence of pre-stall airframe buffet are such that this
is not considered a sensible possibility. This would also entail fitting non-
standard flight instrumentation; this has therefore not been explored. The
origin of this analysis - equations (2-1) to (2-4) use TAS. In equation (2-20)
the values are worked upon as ratios and so it is unimportant whether they are
TAS or CAS since the ratio will be identical. But the result is expressed as
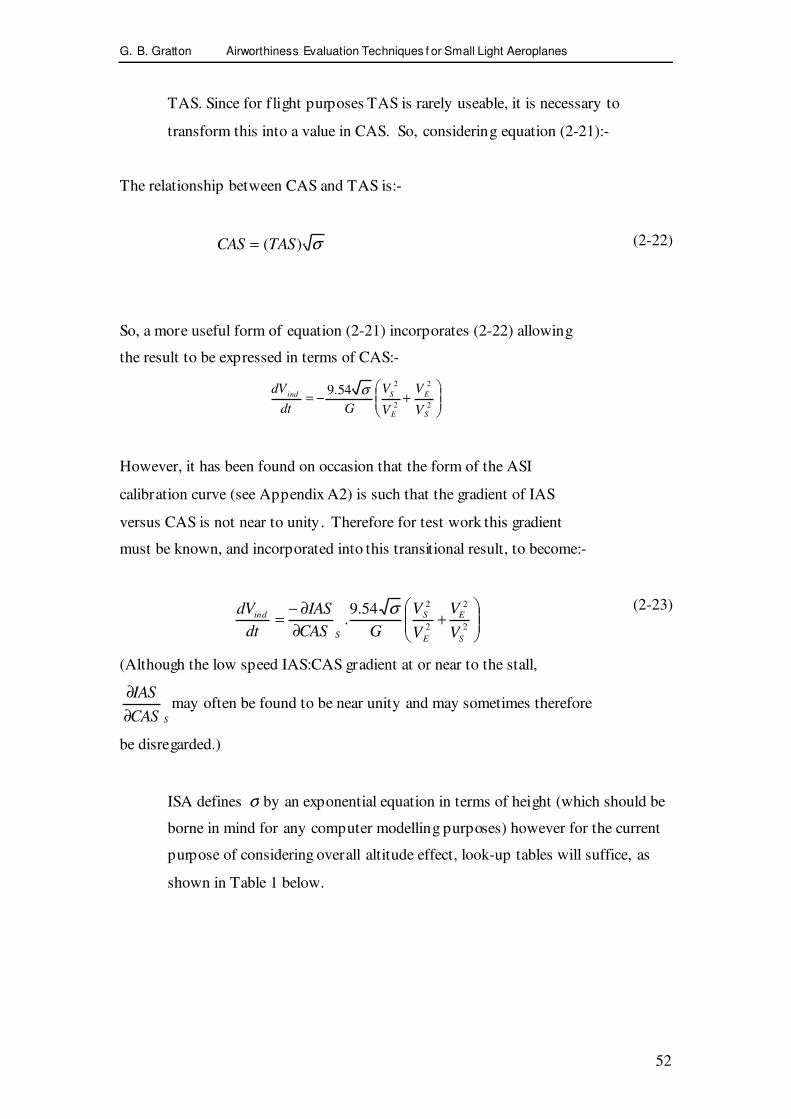
G. B. Gratton Airworthiness Evaluation Techniques f or Small Light Aeroplanes
52
TAS. Since for flight purposes TAS is rarely useable, it is necessary to
transform this into a value in CAS. So, considering equation (2-21):-
The relationship between CAS and TAS is:-
σ)(TASCAS =
(2-22)
So, a more useful form of equation (2-21) incorporates (2-22) allowing
the result to be expressed in terms of CAS:-
+−=
2
2
2
254.9
S
E
E
Sind
V
V
V
V
Gdt
dV σ
However, it has been found on occasion that the form of the ASI
calibration curve (see Appendix A2) is such that the gradient of IAS
versus CAS is not near to unity. Therefore for test work this gradient
must be known, and incorporated into this transitional result, to become:-
+
∂
∂−=
2
2
2
254.9.
S
E
E
S
S
ind
V
V
V
V
GCAS
IAS
dt
dV σ
(2-23)
(Although the low speed IAS:CAS gradient at or near to the stall,
SCAS
IAS
∂
∂may often be found to be near unity and may sometimes therefore
be disregarded.)
ISA defines σ by an exponential equation in terms of height (which should be
borne in mind for any computer modelling purposes) however for the current
purpose of considering overall altitude effect, look-up tables will suffice, as
shown in Table 1 below.

G. B. Gratton Airworthiness Evaluation Techniques f or Small Light Aeroplanes
53
Table 1, CAS:TAS comparison for different heights
Assuming that a value of 2.4 kn/s TAS had been obtained.
Standard
Pressure
Altitude
TAS
deceleration
σ σ
CAS
Deceleration
= TAS σ
(ft) (kn/s) (kn/s)
(a) (b) (c ) (d) (e)
0 2.4 1 1 2.4
5,000 2.4 0.862 0.928 2.23
10,000 2.4 0.738 0.859 2.06
15,000 2.4 0.629 0.793 1.90
Thus: (1) The sea level condition (represented by TAS) is the worst case
(2) Up to 10,000 ft the IAS stall entry rate may reduce by up to 14% - which is
significant enough to require adjustment of flight test results. However,
since an accuracy of deceleration rate of 30% is as good as might
reasonably be hoped for from a test pilot, the sea level result may be used
when calculating the stall entry rates to be used for flight test planning at
any altitude. Microlight flight testing will not normally be carried out
above 10,000 ft because above that height supplementary oxygen is
required, which is not normal equipment in this class of aircraft. In any
case, a normal height bracket for stall tests would be 3,000 to 5,000 ft sHp
(Standard Pressue Altitude) where the maximum error is trivially small.
Notwithstanding the table above, a -1kn/s acceleration rate (1 kn/s
deceleration) towards the stall event will still be required (for determination of
performance stalling speeds). The worst case sea level value of deceleration
rate should therefore be used when determining the safe proof case for flight
test purposes (i.e. that is the deceleration rate into the stall up to which the
aircraft must not show unacceptable stalling characteristics). Any further

G. B. Gratton Airworthiness Evaluation Techniques f or Small Light Aeroplanes
54
adjustments for CAS should be performed only where quantitative comparison
with actual flight test data is required.
In order to provide any confidence in this result, it is essential to compare this
to actual flight test data. Table 2 following is based upon flight test data for
individual aircraft as listed.
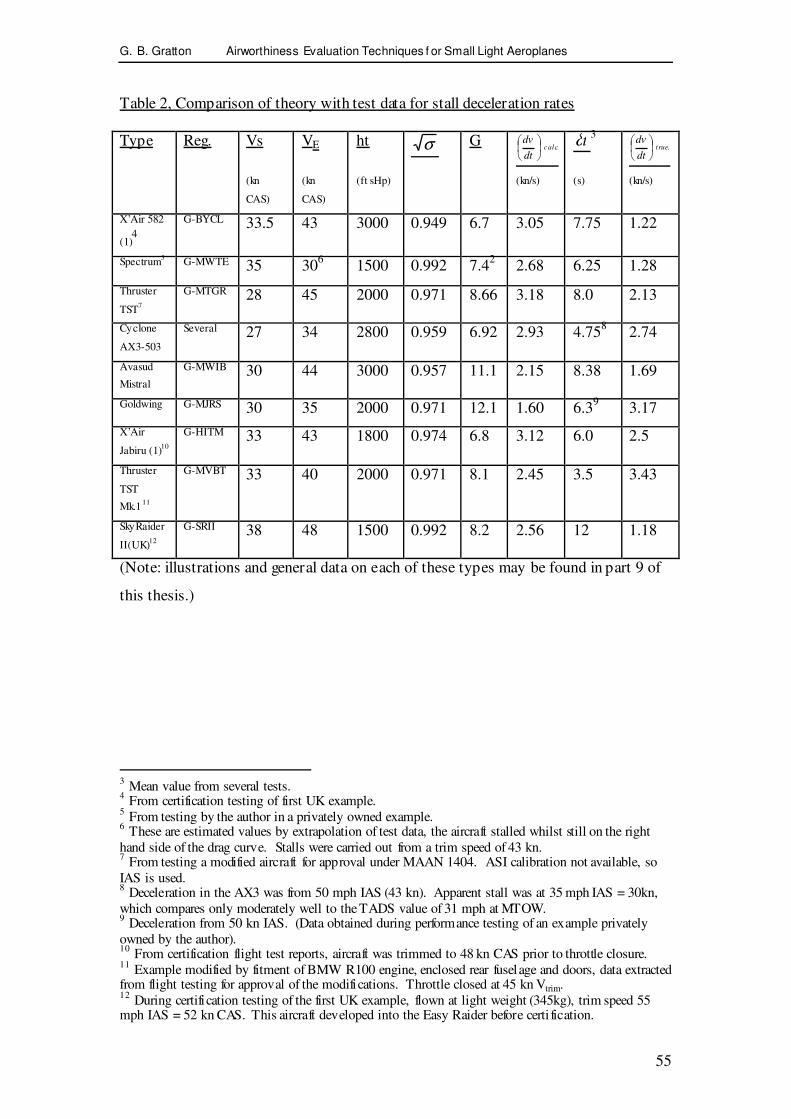
G. B. Gratton Airworthiness Evaluation Techniques f or Small Light Aeroplanes
55
Table 2, Comparison of theory with test data for stall deceleration rates
Type Reg. Vs VE ht σ G .calc
dt
dv
tδ 3
.true
dt
dv
(kn
CAS)
(kn
CAS)
(ft sHp) (kn/s) (s) (kn/s)
X’Air 582
(1)4
G-BYCL 33.5 43 3000 0.949 6.7 3.05 7.75 1.22
Spectrum5 G-MWTE 35 30
6 1500 0.992 7.4
2 2.68 6.25 1.28
Thruster
TST7
G-MTGR 28 45 2000 0.971 8.66 3.18 8.0 2.13
Cyclone
AX3-503
Several 27 34 2800 0.959 6.92 2.93 4.758 2.74
Avasud
Mistral
G-MWIB 30 44 3000 0.957 11.1 2.15 8.38 1.69
Goldwing G-MJRS 30 35 2000 0.971 12.1 1.60 6.39 3.17
X’Air
Jabiru (1)10
G-HITM 33 43 1800 0.974 6.8 3.12 6.0 2.5
Thruster
TST
Mk.111
G-MVBT 33 40 2000 0.971 8.1 2.45 3.5 3.43
SkyRaider
II(UK)12
G-SRII 38 48 1500 0.992 8.2 2.56 12 1.18
(Note: illustrations and general data on each of these types may be found in part 9 of
this thesis.)
3 Mean value from several tests.
4 From certification testing of first UK example.
5 From testing by the author in a privately owned example.
6 These are estimated values by extrapolation of test data, the aircraft stalled whilst still on the right
hand side of the drag curve. Stalls were carried out from a trim speed of 43 kn. 7 From testing a modified aircraft for approval under MAAN 1404. ASI calibration not available, so
IAS is used. 8 Deceleration in the AX3 was from 50 mph IAS (43 kn). Apparent stall was at 35 mph IAS = 30kn,
which compares only moderately well to the TADS value of 31 mph at MTOW. 9 Deceleration from 50 kn IAS. (Data obtained during performance testing of an example privately
owned by the author). 10
From certification flight test reports, aircraft was trimmed to 48 kn CAS prior to throttle closure. 11
Example modified by fitment of BMW R100 engine, enclosed rear fuselage and doors, data extracted from flight testing for approval of the modifications. Throttle closed at 45 kn Vtrim. 12
During certification testing of the first UK example, flown at light weight (345kg), trim speed 55 mph IAS = 52 kn CAS. This aircraft developed into the Easy Raider before certi fication.

G. B. Gratton Airworthiness Evaluation Techniques f or Small Light Aeroplanes
56
During flight tests, it was often noted that for microlight aircraft, the stalling
characteristics are poorly defined, such that there is some uncertainty
concerning the precise starting moment of the stall event. Therefore there was
probably considerable lag between the aerodynamic stall and the perception of
the stall. It must be remembered that at all times, apparent characteristics
must be used in flight testing. Also however, it is known from published
literature on unsteady aerodynamics that CLmax is greater when a rapid pitch-
up occurs; clearly the greater the deceleration rate, the greater the pitch rate
and so a greater deceleration rate is likely to result in a lower apparent stalling
speed. A lack of appropriate facilities (e.g. a 15m+ section wind tunnel
combined with a movable sting capable of pitch rates better than 30°/s nose-
down motion in order to meaningfully simulate the post-stall pitch break) for
conducting tests for this on wings with a 9 - 12m wingspan prevent this being
quantified.
Therefore it is proposed to insert an additional term into (2-23), as shown
below:-
+
−=
2
2
2
254.9
S
E
E
Sdind
V
V
V
V
Gdt
dV στkn/s
(2-24)
Where the new term, τ d is introduced, which will be termed the “deceleration
time constant”. This is estimated for the types previously considered in Table
3 below.

G. B. Gratton Airworthiness Evaluation Techniques f or Small Light Aeroplanes
57
Table 3, determination of deceleration time constant
Type Reg. Vs .calc
dt
dv
S
.true
dt
dv
S
.
calc
true
dt
dvdt
dv
S
S
= τ d
(kn CAS) (kn/s) (kn/s)
X’Air 582 (1) G-BYCL 33.5 3.05 1.22 0.400
Spectrum G-MWTE 35 2.68 1.28 0.478
Thruster TST G-MTGR 28 3.18 2.13 0.670
Cyclone AX3-503 Various 29 2.93 2.74 0.935
Aviasud Mistral G-MWIB 30 2.15 1.69 0.785
Goldwing G-MJRS 30 1.60 3.17 1.98
X’Air Jabiru(1) G-HITM 33 3.12 2.50 0.801
Thruster TST Mk.1 G-MVBT 33 2.45 3.43 1.4
SkyRaider II(UK) G-SRII 38 2.56 1.18 0.461
At first sight this shows a very large variation in values ofτ d , hence this was
explored further. Personal experience had shown that aircraft in this class tend
to show a far more well-defined stall at higher wing loadings, and so the
relationship with wing loading was explored. Table 4 shows the wing loading
of each of the test aircraft described above, and Figure 15 plots the
determined value of τ d versus the wing loading W/S at the time of each test.
(The figure omits the results for the Goldwing and Thruster TST.1, which
otherwise significantly skew the best-fit curve away from all other points.
Both of these are older designs which are known to have pitch control
characteristics that might not necessarily be accepted if current practices were
followed – very shallow apparent longitudinal static stability in the case of the
Goldwing, and a very wide trim speed band in the case of the Thruster TST. It
is suspected that the unusual pitch control characteristics of these aircraft
significantly affect the pilot’s perception of the stalling characteristics.)

G. B. Gratton Airworthiness Evaluation Techniques f or Small Light Aeroplanes
58
Table 4, Wing loadings for test aircraft at time of each stalling test
Type Reg. W/S
(kg/m²)
X’Air 582 (1) G-BYCL 28
Spectrum G-MWTE 25
Thruster TST G-MTGR 19
Cyclone AX3-503 Various 22
Aviasud Mistral G-MWIB 2013
Goldwing14
G-MJRS 20
X’Air Jabiru (1) G-HITM 26
Thruster TST Mk.1 G-MVBT 25
SkyRaider II(UK) G-SRII 35
Figure 15, Deceleration constant versus wing loading (Goldwing and Thruster TST
Omitted)
y = 15.11x-0.9988
R2 = 0.4129
0
0.2
0.4
0.6
0.8
1
15 20 25 30 35 40
W/S
De
ce
lera
tio
n T
ime
Co
nsta
nt
The curve shown is a power regression of the form y=Ax-1
, which gives a
moderate (R²=0.413) fit. The relationship, shown on the graph is
13
The Aviasud Mistral is a biplane. 14
Including Canard. The Goldwing is the only canard aircraft listed.

G. B. Gratton Airworthiness Evaluation Techniques f or Small Light Aeroplanes
59
(2-25)
d
A
WS
τ =
Where A is a derived term of value A=15.1 m²/kg.
Final form of the equation
We therefore find that the acceleration rate of a microlight aircraft as it
approaches the stall, is defined by the following equation, where the aircraft
has suffered a sudden power failure and the pilot attempts to maintain level
flight.
+=
2
2
2
254.9
S
E
E
Sdind
V
V
V
V
Gdt
dV τ σ (2-27)
Where, τ d , the deceleration time constant is determined by the formula
d WS
τ =151.
; G is the best glide ratio for the aircraft; Vs is the stall speed; and
VE is the best range glide speed. Although the term is retained for analysis
purposes, when planning flight tests, it is safe and more convenient to assume
that 1=σ . The accuracy of (2-27) is investigated in Table 5 below.
Table 5, Demonstrating the accuracy of (2-27)
Type Reg. Vs VE ht σ G W/S .calc
dt
dv
.true
dt
dv
(kn
CAS)
(kn
CAS)
(ft sHp) (kg/m²) (kn/s) (kn/s)
X’Air 582
(1)
G-BYCL 33.5 43 3000 0.949 6.7 28 1.2 1.2
Spectrum G-MWTE 35 30 1500 0.992 7.4 25 1.6 1.3
Thruster
TST
G-MTGR 28 45 2000 0.971 8.66 19 2.5 2.1
Cyclone
AX3-503
Various 27 34 2800 0.959 6.92 22 2.0 2.7
Aviasud
Mistral
G-MWIB 30 44 3000 0.957 11.1 20 1.6 1.7

G. B. Gratton Airworthiness Evaluation Techniques f or Small Light Aeroplanes
60
Type Reg. Vs VE ht σ G W/S .calc
dt
dv
.true
dt
dv
(kn
CAS) (kn
CAS) (ft sHp) (kg/m²) (kn/s) (kn/s)
Goldwing G-MJRS 30 35 2000 0.971 12.1 20 1.2 2.0
X’Air
Jabiru (1)
G-HITM 33 43 1800 0.974 6.8 26 1.8 2.5
Thruster
TST Mk.1
G-MVBT 33 40 2000 0.971 8.1 25 1.5 3.4
SkyRaider
II(UK)
G-SRII 38 48 1500 0.992 8.2 35 1.1 1.2
However this formula (demonstration of the accuracy of which is given in the
next table) gives the best estimate; this is by definition since it uses the best fit
curve to the available data. What is actually needed is the worst-case
deceleration rate.
Given that in most cases the stalling characteristics are more severe at higher
deceleration rates (and if they are not, then the 1kn/s case must in any case be
examined so as to satisfy specific certification requirements) an alternative
approach is to determine a value of τ d which will give the greatest magnitude
value of deceleration. This can be achieved by defining the linear relationship
(data not existing to justify a higher order curve in this case) which gives the
greatest value of deceleration amongst the values in the analysis above. A
worst-case straight line may be marked on the previous figure as shown in
Figure 16:-

G. B. Gratton Airworthiness Evaluation Techniques f or Small Light Aeroplanes
61
Figure 16, Deceleration constant versus wing loading (Goldwing and Thruster TST
Omitted), with straight lines plotted giving greatest and least magnitude acceleration
rates.
0
0.2
0.4
0.6
0.8
1
15 20 25 30 35 40W/S
De
ce
lera
tio
n T
ime
Co
nsta
nt
These two lines define the bounds of maximum and minimum acceleration
that should be experienced in the event of level flight being maintained
following an engine failure. These may be defined by the following:-
Greatest magnitude acceleration: S
Wd
036.074.1 −=τ (2-28)
Least magnitude acceleration: S
Wd
032.028.1 −=τ (2-29)
Inserting (2-28) and (2-29) into (2-27) one obtains two predictions for the
greatest and least magnitude level-flight acceleration rate that are likely to be
experienced prior to an inadvertent stall, which are:-
(Greatest) ( )
+
−=
2
2
2
234.02.12
S
E
E
Sind
V
V
V
V
G
SW
dt
dV σ (2-30)

G. B. Gratton Airworthiness Evaluation Techniques f or Small Light Aeroplanes
62
(Least) ( )
+
−=
2
2
2
231.02.12
S
E
E
Sind
V
V
V
V
G
SW
dt
dV σ (2-31)
2.5 Physical significance of τ d
An investigation has not been attempted into the physical significance of τ d ;
however, the fact that it is shown to be a function of wing loading indicates
that there must be some relationship to an aircraft’s design and loading; it is
likely that other variables will also be significant – for example the apparent
longitudinal static stability, and the severity of the aircraft’s post-stall
gyrations (in particular of any pitch break) are likely to be significant in
determining τ d ’s value. Whilst not explored herein, it is likely that the
physical significance, and the factors leading to a given value of τ d will adopt
greater importance within any subsequent development of this work.
2.6 Recommendations.
Whilst the conventional 1kn/s decleration rate stall is still required, it is also
recommended that handling of a microlight aircraft immediately prior to, at
the point of, and immediately following a piloting stall is investigated where
the tests are carried out using a accelerations of the aircraft immediately prior
to the stall event, in knots per second, at least as great and as small as given by
(2-30) and (2-31) above.

G. B. Gratton Airworthiness Evaluation Techniques f or Small Light Aeroplanes
63
3 Stalling speeds and determination of manoeuvre speed for conventional
flexwing microlight aeroplanes.
3.1 Background to non-square-law stalling speed to loading relationship.
It has been observed for many years that the stall speed of weightshift
controlled microlight aeroplanes does not necessarily follow the pattern
considered “normal” for a fixed wing aeroplane as loading is increased, that
is:-
= N
MTOW
WVV ZS gMTOW
S
21
0 1,
(3-1)
In practice, this class of aircraft is known to display higher stalling speeds at
high loadings (for example in a steep turn) than are necessarily predicted by
(3-1) above and would be considered normal for a conventional, rigid-winged,
aeroplane. It is believed that this phenomenon was first observed by Roy
Venton-Walters, who designed the Sprint and Raven wings in the early 1980’s
(for greater detail of the Raven aircraft, see Appendix B10). Venton-Walters
stated that the behaviour could be shown to follow the following relationship
[33]:-
Ae
gMTOW
C
ZSOSN
MTOW
WVV
=
1. (3-2)
CAe will be referred to here as the “Aeroelastic Coefficient” for the wing
(author’s terminology, not Venton-Walters’ who uses α ). In discussion
with Venton-Walters [34], he has stated that he does not know of a formal
aeroelastic model which supports the relationship, but nonetheless had
found this empirical model to work extremely well. It is however Venton-
Walter’s assertion that the term CAe will have a fixed value which is
dependent upon the characteristics of the wing. He has stated that the
value of this coefficient, which would be 0.5 for a perfectly stiff wing, has

G. B. Gratton Airworthiness Evaluation Techniques f or Small Light Aeroplanes
64
greater values for wings which tend at higher aircraft weights, ; for the
Raven wing (the more modern of his two designs) he states the value to be
C Ae=0.80. Taking the known value that Vso=29kn at the MTOW of 367
kgf, a theoretical comparison may be made as shown in Figure 17.
Figure 17, Theoretical stalling speeds for Raven wing.
0
200
400
600
800
1000
1200
1400
1600
0 20 40 60 80 100
Vs, kn
Lo
ad
, W
.Nz (
kg
f)
Conventionally
predicted
stalling speed
Venton-Walters
predicted
stalling speed
One significance of this is that greater caution needs to be observed by pilots
during steep turns. For example, in an aircraft loaded to 350 kgf, making a 2g
(60° banked) turn, conventional theory would give a stall speed of about 40
kn, whilst the Venton-Walters approach would give a stall speed of about 50
knots. Given that a 60° banked turn is a permitted manoeuvre, and a typical
cruising speed would be about 40-45 knots, the risk of an inadvertent stall

G. B. Gratton Airworthiness Evaluation Techniques f or Small Light Aeroplanes
65
during a turn is very real. Although the reasons for this have not historically
been quantified, pilots in this class of aircraft are indeed taught to pull the bar
in (accelerate) before initiating a steep turn[35].
Further significance is seen when considering the operating limits for the
aircraft. Vne for the Raven wing is 87 kn and the positive normal acceleration
limit is +4g [36]. Using the more conventional model for stalling speed, this
combination necessitates a manoeuvre speed, VA to be defined, in this case at
58 kn. However if the Venton-Walters model is accepted, then at 4g and
MTOW, the total loading is 1460 kgf and the stalling speed at this loading
would be 88 kn – or slightly greater than VNE. The consequence of this, if the
relationship is truly the case, is a degree of natural protection which may be
used to allow “carefree” handling of the aircraft with respect to structural
limits up to VNE – particularly in regard to gust limits (the normal practice in
microlights and simpler light aircraft being to limit flight in turbulent
conditions to below VA, rather than introduce a separate VRA term.) The
potential usefulness of this characteristic, if it could be proven, led this
research effort to explore means of doing so.
3.2 The significance of VA.
VA which is termed the manoeuvre speed is highly significant both to the
technical certification effort, and to the operation of the aircraft. It is defined
by all fixed wing airworthiness requirements (such as [37],[38], [39], [40]) as
the airspeed at which, on the conventional V-N (flight-envelope) diagram
[41], the positive g stall line (often referred to as the O-A curve, see Figure 18
below) intercepts the maximum permitted positive normal acceleration limit.
Thus it is the speed above which structural limits may be exceeded before
aerodynamic characteristics in the form of a stall will reduce lift.

G. B. Gratton Airworthiness Evaluation Techniques f or Small Light Aeroplanes
66
Figure 18, Classical flight envelope diagram
It has further structural significance in an aircraft with movable primary
control surfaces (generally not the case in a weightshift aircraft) because it is
conventional for airworthiness requirements to mandate that these surfaces
and their supporting or controlling structure can withstand full deflection up to
VA (as well as up to 1/3 deflection at VNE).
To a pilot, the primary significance of VA is that up to this speed he or she has
the ability to apply full primary control deflection without risk of overstressing
the airframe; it being taught that at any speed above that only 1/3 control
deflection should be applied. Additionally, it is conventionally taught [42] in
the operation of most smaller aircraft types, including microlights, that VA is
the maximum speed at which the aircraft should be flown in severe
turbulence, so as to reduce the risk of airframe overstress due to gust loadings.
However, the conventional definition of VA, is NVV SA
21
10= ,. In such aircraft,
both lateral and directional stability are proportional to angle of attack [43],
[44], and thus inversely proportional to airspeed. At low speeds, rolling and
yawing excursions will thus be more severe. For that reason a high speed,

G. B. Gratton Airworthiness Evaluation Techniques f or Small Light Aeroplanes
67
greater than would be permitted by this classical definition of VA, may be
advisable in some conditions. This is particularly the case when descending at
speed through particularly turbulent air, for example when approaching to land
through rotor15
, descending through an inversion or thermal, or attempting to
dive out of rising air at the base of a cumulonimbus cloud [45].
Hence, if justification can be found for an increase in VA for a weightshift
controlled microlight aeroplane, then operating safety of the aircraft can be
improved by allowing flight through severe turbulence at speeds that reduce
the risk of uncommanded and potentially dangerous rolling or yawing
excursions. There is at least one incidence reported of a flexwing microlight
suffering a severe rolling excursion close to the ground (on that occasion
during the initial climb-out after take-off) which was attributed to flight at too
low an airspeed through moderate to severe turbulence, causing a fatal
accident [46].
3.3 Experimental investigations into a non-square-law stall speed to
loading relationship for three aircraft: the Air Creation KISS-400,
KISS 450 and iXess
During UK certification testing of the Air Creation KISS-400 (for illustration
and details see Appendix B4), KISS-450 and later iXess aircraft (Appendix
B5) the aircraft were stalled over as large a range of wing loading as could
safely be achieved – from single crew / minimum fuel at 1g, to MTOW in
steep turns with an installed g-meter providing a value for NZ immediately
prior to the stall. The results in Table 6, Table 7 and Table 8 were obtained:-
15
“ Rotor” in this context refers to a large closed eddy in the prevailing airflow, which commonly exists
downwind of a large obstruction to the wind (such as trees, hills or large buildings). A fuller explanation of this effect may be found in pp38-40 of reference [45].

G. B. Gratton Airworthiness Evaluation Techniques f or Small Light Aeroplanes
68
Table 6, Stalling Speeds at various loadings for Air Creation KISS-400
Test No. W.NZ
(kgf)
Vs
(kn CAS)
1 315 29.6
2 400 32.2
3 560 39.1
4 800 52.2
5 1000 62.6
Table 7, Stalling Speeds at various loadings for Air Creation KISS-450
Test No. W.NZ
(kgf)
Vs
(kn CAS)
1. 300 27.7
2. 345 29.8
3. 450 32.7
4. 450 34.2
5. 450 34.2
6. 518 35.6
7. 675 42.2
8. 900 56.7
9. 1125 63.9

G. B. Gratton Airworthiness Evaluation Techniques f or Small Light Aeroplanes
69
Table 8, Stalling Speeds at various loadings for iXess
Test No. W.NZ
(kgf)
Vs
(kn CAS)
1 320 28.0
2 450 33.0
3 457 34.0
4 480 35.0
5 640 41.0
6 675 39.0
7 685 40.4
8 900 45.2
9 914 52.2
10 1143 61.0
These results are plotted in Figure 19, Figure 22 and Figure 20 below,
showing in each case both the best fit curve using 3-2 above, and also the
curve which would have been predicted using conventional theory, based upon
the known value of Vso at MTOW.

G. B. Gratton Airworthiness Evaluation Techniques f or Small Light Aeroplanes
70
Figure 19, Actual and classically predicted stalling speeds for Air Creation KISS-400
0
200
400
600
800
1000
1200
1400
1600
0 20 40 60 80 100
Vs, kn
Lo
ad
, W
.Nz,
kg
f
Conventionally
predicted line using
known Vso at
MTOW
Best fit y=ax^b curve,
with extrapolation
above 1000 kgf

G. B. Gratton Airworthiness Evaluation Techniques for Small Light Aeroplanes
71
Figure 20, Actual and classically predicted stalling speeds for Air Creation KISS-450
0
200
400
600
800
1000
1200
1400
1600
0 20 40 60 80 100
Vs, kn
Lo
ad
, W
.Nz,
kg
fConventionally predicted
line using known Vso at
MTOW
Best fit Y-ax^b curve,
with extrapolation
above 1125 kgf

G. B. Gratton Airworthiness Evaluation Techniques for Small Light Aeroplanes
72
Figure 21, Actual and classically predicted stalling speeds for Air Creation iXess
0
200
400
600
800
1000
1200
1400
1600
1800
0 20 40 60 80 100
Vs, kn
Lo
ad
, W
.Nz,
kg
fConventionally
predicted line using
known Vso at
MTOW
Best fit y=ax̂ b curve,
with extrapolation
above 1143 kgf
Discussion – KISS-400
The best fit curve to the actual results shown in Figure 19 above is indeed of
the form of 3-2, although in this case the aeroelastic constant, CAe=0.66. The
R²>0.98 line-fit is extremely good and gives high confidence in the result,
although it should again be emphasised that no theoretical basis exists for this
relationship. In this case a value of VA for the wing of 83 kn CAS is shown,
which is greater than VNE of 76 kn CAS [47]. Carefree handling in pitch may
therefore be assumed for this aircraft insofar as any pitch mishandling or flight
in turbulence, up to VNE may be considered unlikely to cause any overstress of
the aircraft through exceedence of the normal acceleration limit.
Based upon the work above, which was carried out during the UK certification
programme for the aircraft, two decisions were made with regard to the

G. B. Gratton Airworthiness Evaluation Techniques for Small Light Aeroplanes
73
operating limitations. These were firstly that because the VA has been
calculated at 83 kn CAS, which is greater than the VNE of 76 kn CAS it was
not included in the normal operating documentation (although it still lies
slightly below the flight test limit of VDF=85 kn CAS, and therefore is still
listed in the series test schedule and type data sheet). Secondly, that specific
data based upon this relationship was included in the operators manual
showing stalling speeds at various bank angles, so as to warn pilots of the risk
of inadvertent stall in steep turns. Below, in Figure 22 is reproduced the
diagram which was included in the operators manual [48], the bank angle limit
for the aircraft, as is common practice for most microlight aircraft, is 60°,
which is why the bank-angle scale does not extend beyond this value. The
actual relationship plotted is given in 3-3, below the graph.
Figure 22, Stall Speed versus bank angle diagram from KISS-400 operators manual
KISS 400 stalling speed
0
10
20
30
40
50
60
0 15 30 45 60
Bank angle, degrees
Sta
ll s
pe
ed
, k
n C
AS 400 kg
300 kg
Reproduced courtesy of Flylight Airsports Ltd
(Note: MTOW=400kgf, typical empty weight= 200kgf).
=
MTOW
WVV
C Ae
SS
.cos0
φ (3-3)

G. B. Gratton Airworthiness Evaluation Techniques for Small Light Aeroplanes
74
Discussion – KISS-450
The best fit curve to this is of the form of 3-2 above, although in this case the
aeroelastic constant, CAe=0.65. The R²>0.97 line-fit again gives high
confidence in the result, whilst not disregarding that theoretical justification
does not exist. In this case a value of VA for the wing of 84 kn CAS is
predicted, which is, as with the KISS 400 described in paragraph 3.3 above,
greater than the VNE of 75 kn CAS [49]. Carefree handling in pitch may
therefore be assumed for this aircraft insofar as any pitch mishandling or flight
in turbulence, up to VNE may be considered unlikely to cause any overstress of
the aircraft through exceedence of the normal acceleration limit.
As a result VA was calculated at 84 kn CAS, which is well above the VNE of
75 kn CAS it was thus not included in the normal operating documentation
(although it still lies slightly below the flight test limit of VDF=83 kn CAS, and
therefore is still listed in the series test schedule and type data sheet). Below
in Figure 23 is reproduced the diagram which was included in the operators
manual [50], the bank angle limit for the aircraft, as is common practice for
most microlight aircraft, is again 60°, for which reason the bank-angle scale
does not extend much beyond this value.

G. B. Gratton Airworthiness Evaluation Techniques for Small Light Aeroplanes
75
Figure 23, Stall Speed versus bank angle diagram from KISS-450 operators manual
KISS-450, s tall ing speed with bank angle (balanced turns)
20
25
30
35
40
45
50
55
60
65
70
0 10 20 30 40 50 60
Bank angle, degrees
Sta
ll speed,
kn C
AS
450 kg
300 kg
Reproduced courtesy of Flylight Airsports Ltd
(Note: MTOW=450kgf, typical empty weight = 200kgf)
Discussion - iXess
The Air Creation iXess is a new type that was certified in the UK under BMAA
supervision during 2003 and 2004. It is a relatively high performance aircraft
compared to the KISS-400 and KISS-450 aircraft previously mentioned, designed to
fly at greater speeds using larger powerplants than most weightshift controlled aircraft
of the 1980’s and 1990’s; it would appear that this performance improvement (in both
level speed and climb rate) is mostly achieved through modification of the aerofoil
section and stiffness of the wing, supplemented by profile drag reduction measures
throughout the aircraft.
Whilst showing a less marked departure from “convention”, the iXess still displays
the same general characteristics as were seen for other types. In this case, it shows a
value of CAe=0.751. Relating to the Vso of 33 KCAS, this shows a VA of 72 KCAS.
This difference is not marked, but does show an increased safety margin for flight in
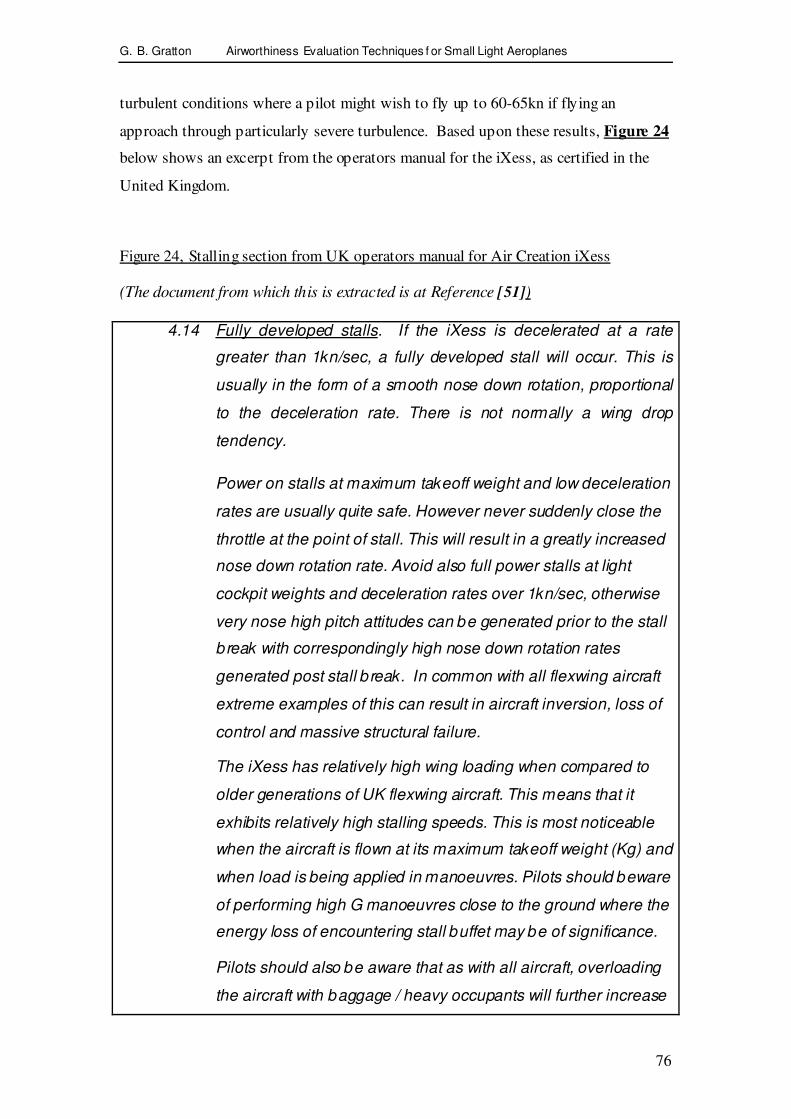
G. B. Gratton Airworthiness Evaluation Techniques f or Small Light Aeroplanes
76
turbulent conditions where a pilot might wish to fly up to 60-65kn if flying an
approach through particularly severe turbulence. Based upon these results, Figure 24
below shows an excerpt from the operators manual for the iXess, as certified in the
United Kingdom.
Figure 24, Stalling section from UK operators manual for Air Creation iXess
(The document from which this is extracted is at Reference [51])
4.14 Fully developed stalls. If the iXess is decelerated at a rate
greater than 1kn/sec, a fully developed stall will occur. This is
usually in the form of a smooth nose down rotation, proportional
to the deceleration rate. There is not normally a wing drop
tendency.
Power on stalls at maximum takeoff weight and low deceleration
rates are usually quite safe. However never suddenly close the
throttle at the point of stall. This will result in a greatly increased
nose down rotation rate. Avoid also full power stalls at light
cockpit weights and deceleration rates over 1kn/sec, otherwise
very nose high pitch attitudes can be generated prior to the stall
break with correspondingly high nose down rotation rates
generated post stall break. In common with all flexwing aircraft
extreme examples of this can result in aircraft inversion, loss of
control and massive structural failure.
The iXess has relatively high wing loading when compared to
older generations of UK flexwing aircraft. This means that it
exhibits relatively high stalling speeds. This is most noticeable
when the aircraft is flown at its maximum takeoff weight (Kg) and
when load is being applied in manoeuvres. Pilots should beware
of performing high G manoeuvres close to the ground where the
energy loss of encountering stall buffet may be of significance.
Pilots should also be aware that as with all aircraft, overloading
the aircraft with baggage / heavy occupants will further increase

G. B. Gratton Airworthiness Evaluation Techniques f or Small Light Aeroplanes
77
the stalling speeds, as well as the usual drawbacks of reduced
performance and structural safety margins.
4.15 In Turning Flight. Stalling speeds are increased with bank
angle. Flexwing aircraft do not increase stalling speed in
proportion to load factor in the same way as conventional
aircraft. Below is a graph specific to the iXess .
Stall Speed Against Bank Angle at 450Kg
0
5
10
15
20
25
30
35
40
45
50
55
0 5 10 15 20 25 30 35 40 4 5 50 55 60
Bank Angle (Degrees)
Sta
ll S
pee
d (
KC
AS)
Reproduced courtesy of Flylight Airsports Ltd

G. B. Gratton Airworthiness Evaluation Techniques f or Small Light Aeroplanes
78
3.4 Problems with developing a theoretical model.
The author has made several unpublished attempts to develop a theoretical
justification for the relationship between Vs and Nz which is described above.
To date, these attempts have been unsuccessful.
Such a model might be constructed by dividing the wing into chordwise strips.
Each strip may then be considered to be a small finite aerofoil section which
has discrete aerodynamic characteristics.
Starting at a fixed reference (the wing root, fixed as it is to the keel tube, being
the obvious datum), it may be assumed that the strip immediately outboard of
the keel will then have the same angle of attack as at the root and aerodynamic
characteristics as determined by the airspeed, angle of attack, and aerodynamic
characteristics of the aerofoil.
Considering then the next strip outboard, a further piece of information is
required – that is the aeroelastic relationship from the first strip. Integration of
this aerodynamic and aeroelastic model spanwise would then permit
estimation of total lift. However, to do so requires the following information:-
- An accurate model or sufficient test data of the relationship
between shape, angle of attack and chordwise pressure
distribution (or at-least the lift and pitching moment
characteristics) for any section under given airspeed
conditions.
- An accurate model of the chordwise and spanwise torsional
stiffness of the wing at any section.
- An accurate estimation of the torsional centre of the wing at
any section.
Whilst the last item may reasonably be assumed to act at the leading edge tube
(being torsionally rigid) the first two of these quantities are presently

G. B. Gratton Airworthiness Evaluation Techniques f or Small Light Aeroplanes
79
unobtainable. Facilities do not currently exist to measure the shape of a full
scale wing under aerodynamic load, to determine the chordwise pressure
distribution of a full scale wing, or to determine the torsional stiffness
characteristics of a wing section under aerodynamic loads. Equally the time
and resources required to produce a finite element model of the whole wing,
for aeroelastic prediction purposes, would be significant.
It may be possible to produce a general demonstration of the general (rather
than type specific) characteristics using an instrumented scale model of a wing
within a wind tunnel. This would not necessarily permit accurate
extrapolation to a full scale wing (since the aerodynamic and aeroelastic
characteristics will not scale identically), but would allow a further
justification of the form of (3-2). This would be of academic interest,
however at present is outside of the resources available to the microlight
aircraft industry; in addition there is little justification to expend such
resources when (notwithstanding the lack of theoretical justification) the
experimental form of the curve can be determined relatively inexpensively –
as has been demonstrated in section 3.3 above.
3.5 An alternative application of the non square law relationship between
Vs and Nz: modification of N1 and N2.
Having defined the true form of the O-A curve using this relationship, it has
been found that there are two ways in which the theory may usefully be
applied in the certification of an aircraft.
Modification of N1 and N2
N1 and N2 define the positive NZ limits for an aircraft at VA and VD
respectively. Light aircraft certification standards will define minimum values
of N1, N2 (in general N1=N2= +4g for this aircraft class) and VA. However, VA
typically is defined within certification codes (such as BCAR Section S) by:-

G. B. Gratton Airworthiness Evaluation Techniques f or Small Light Aeroplanes
80
NVV SA 1= (3-4)
Where N1 in this context is the minimum value
And even when VA is permitted to vary from this value, it is normal that it is
only required not to have a value less than that defined by (3-4) and is not
necessarily required to have any greater value (for example, JAR-VLA [10]).
Thus, it is possible to define VA as given in (3-4) but to use the form of O-A
curve as given in (3-2). It is possible to combine (3-2) and (3-4), whilst
treating N1 as a variable. To do this, first assume that the aircraft is at MTOW
and modify (3-2), giving the following result:-
NVV
CAe
A S 10
= (3-5)
These are apparently incompatible, but can be made to work together if it is
accepted that the value of N1 in (3-4) is a variable, and that in (3-4) is based
upon the requirements given in the certification standard, which will now be
re-termed N1.cert. Thus:-
NVNVVCAe
CERTA SS 1.100
== (3-6)
Which becomes: NNCAe
.CERT 1
5.0
1 = (3-7)
And thus: CAe
CERTNN.2
1
.11= (3-8)
Thus, it is justifiable to reduce the value of N1 and thus reduce primary
structural mass, without reducing the magnitude of VA. It may be noted that
as CAe tends towards 0.5 (a perfectly rigid wing), the relationship tends
towards. N1.cert = N1. This is illustrated below in Figure 25 (which effectively
shows the upper left part of the V-N diagram as shown in Figure 18 above).

G. B. Gratton Airworthiness Evaluation Techniques f or Small Light Aeroplanes
81
It may be seen from this figure, that the stalling speed, and thus VA, will be
greater for any given value of W.NZ, for a greater value of CAe.
Figure 25, Illustration of variation in stall speed with loading for three different values
of CAe - with Vs=30kn
0
1
2
3
4
5
0 10 20 30 40 50 60 70 80 90 100
Airspeed, knots
No
rma
l a
cce
lera
tio
n, g
CAe=0.55
Typical +4g limit
CAe=0.5
CAe=0.6
3.6 Historical precedent – normal acceleration limits for the Pegasus
Quantum 15.
A variation upon this method was successfully carried out in 1991 by Pegasus
Aviation during the certification programme for the Pegasus Quantum-15
aircraft[52]. During that programme it was demonstrated experimentally that
the maximum normal acceleration that could be achieved through diving the
aircraft to VNE or above and applying a step input of the pitch control to
maximum nose-up (the basebar to the front strut) the aircraft was capable of a
transient loading not exceeding 2.4g before a stall occurred.
Increasing CAe

G. B. Gratton Airworthiness Evaluation Techniques for Small Light Aeroplanes
82
Following this demonstration by the manufacturer, Pegasus Aviation, it was
successfully argued to the CAA that it was not necessary to require a value of
N1=4g, and it was reduced to 3.8g, although VA remained at 2VS. This may be
considered conservative since if N1 = 3.8g, then there is a structural
redundancy factor of 1.58 above the maximum achievable NZ, combined with
which it may be considered that although the true value of co-incidence of the
O-A curve with N1 is unknown, it will certainly be at a speed greater than 2Vs.
Subsequent service experience, which has comprised manufacture of over
1000 aircraft, the oldest of which have, at time of writing, been in service for
over 12 years, without any in-flight structural failure, tends to support the
belief that the aircraft’s structure is capable of withstanding loads significantly
in excess of maximum flight loads.
There is an important additional point made by this specific experience. It
should be noted that in this case VA = 2VS = 4½VS > 3.8
½VS . So, N1 has been
reduced (thus permitting a lighter structure on the aircraft), whilst VA is
greater than the minimum value permitted (thus permitting higher speed flight
in turbulence, albeit by only 2 mph). Whilst the most appropriate values of VA
and N1 are subject to the judgement of the certification team, this example
demonstrates that it can be acceptable to modify both VA and N1 away from
the “classical” values without jeopardising the operational safety of the
aircraft. The methods presented in 3.3 above may equally be applied in this
manner, if it is necessary or appropriate to do so. This gives the certification
team the ability to fine-tune limitations to give the maximum operating
flexibility for the aircraft without degrading necessary structural safety factors.
Clearly conservatism is reduced by this approach, but only to a value not less
than that accepted by the certification basis, and thus acceptable; as with any
class of aircraft, greater than essential conservatism in flying limitations has
potential to either increase mass or to restrict operating limitations, and thus is
deliberately avoided.

G. B. Gratton Airworthiness Evaluation Techniques for Small Light Aeroplanes
83
4 Spinning evaluation of 3-axis controlled microlight aeroplanes
4.1 The Spin Mode.
The spin mode is well understood [53, 54, 55, 56, 57, 58, 59, 73]; that is a
combined roll:yaw autorotation occurring post-stall. It is known historically
that most 3-axis controlled aeroplanes have the potential to enter a spin,
although the characteristics such as apparent pitch attitude, oscillations, rate of
rotation, readiness to spin, and ease of recovery, can vary widely. Because of
the known risk of spin entry from manoeuvring flight or flight at or near the
stall, it is an almost universal requirement in the certification of fixed wing
aircraft that the spin is investigated. The rigour and nature of this
investigation will, however, vary considerably between aircraft; whilst an
aerobatic aircraft would be subjected to a wide range of spinning tests
including prolonged fully developed spins, an airliner would probably not be
tested beyond the first signs of incipient spin. A non-aerobatic light aircraft
would normally be tested for resistance to spin entry, and for recovery from
one and two-turn spins.
The entry to the spin occurs normally when the main lifting surface is stalled
whilst there is significant sideslip. This might inadvertently occur when an
aircraft is stalled in an unbalanced turn, or the rudder is not correctly set to
balanced flight when an aircraft is stalled in level flight, or airframe
asymmetry causes an aircraft to stall markedly one wing first causing large
wing-drop, due to slow-flight in turbulence, or following a mishandled
aerobatic manoeuvre.
A deliberate spin entry will normally be attempted in one of two ways. Either
full rudder will be applied as the aircraft is decelerating and the airspeed is
about 5 knots above the stall, or full rudder, opposite to the direction of turn is
applied at or just above a turning flight stall.
Following entry, the aircraft will normally pitch up, suffer some brief rolling
or yawing motion, before normally after several seconds establishing a spin in

G. B. Gratton Airworthiness Evaluation Techniques for Small Light Aeroplanes
84
one direction, at which the nose with pitch down giving an apparently steep
nose-down pitch attitude (although this should not be confused with angle of
attack, the wing is still stalled). Rotation rates vary, extremes being from
around 200°/s (in the Bulldog T Mk.1, Cessna 152 and MXP 740 Savannah)
to 40°/s (in the X’Air Mk.1). However, most smaller (microlight and light)
aircraft will tend to spin at rates of around 100°/s to 150°/s where the spin rate
is defined as the rate of heading change as identified from the cockpit.
Aerodynamically, the yaw rate causing the sideslip induces the outer wing of
the yawing motion to be flying faster than the inner wing. Lateral stability
then causes the aircraft to roll in the direction of the yaw, causing the outer
wing (due to roll rate) to experience a lower angle of attack than the inner
wing. This stalls the inner wing and may stall the outer wing, but probably
does not. The result is a difference in angle of attack between the wings, and
hence a difference in lift and drag. This is shown below in ; as may be seen,
lift is greater on the upgoing wing and drag is greater on the downgoing wing.
This is normal and essential to the spin.
Figure 26, Illustration of lift, drag and angle of attack of an autorotative spinning
aeroplane
Lif
t a
nd
dra
g
A n g le o f a t t a c k
D
L
U p g oin g w in g
D o w n go in g
w ing

G. B. Gratton Airworthiness Evaluation Techniques for Small Light Aeroplanes
85
If, however both lift and drag are greater on the downgoing wing, then the
aircraft is more likely to enter a spiral dive during which airspeed will
increase. This is particularly associated with “elevator limited” aircraft such
as the CFM Shadow which lack sufficient pitch authority to fully stall the
mainplane. The risk with such aeroplanes is primarily that the spin mode
cannot be investigated and may be met for the first time in-service through
unrepeatable factors such as a sudden upgust during low speed unbalanced
flight.
Figure 27, Illustration of lift, drag and angle of attack at the wings of an aeroplane
likely to enter a spiral dive from an attempted spin entry
Lif
t an
d d
r ag
A ngle of attack
D
L
U pgoing wing
D ow ngoing
wing

G. B. Gratton Airworthiness Evaluation Techniques for Small Light Aeroplanes
86
It is useful, prior to a detailed discussion of the subject, to define some of the
terminology associated with the spin mode. Table 9 and Figure 28 below show
the main terms in regular use.
Table 9, Spin Terminology
Term Meaning
Developed
Spin
The period of sustained autorotation between the incipient spin, and
recovery.
Erect Spin A spin where the rolling and yawing motions are in the same sense
Flat spin A spin where the pitch attitude is close to that of normal flight. These
tend to be associated with difficulty in recovering.
Incipient spin The period of time between spin-entry, and a steady and developed
spin being achieved. This can last between 1 and 6 turns although
most test pilots and authorities do not consider it to extend beyond 2
turns.
In-spin
aileron
Deflection of the roll control with the direction of the spin (e.g. a right
stick input = starboard aileron up in a left hand spin).
Inverted Spin A spin where the rolling and yawing motions are in opposite senses.
These are normally only assessed on aerobatic aeroplanes unless an
inverted spin has been found to occur, possibly as a result of a
mishandled spin-entry.
Left Hand
Spin
A spin where the yawing motion is in the sense nose to the left
Oscillatory
spin
A spin where the rates of roll and/or yaw are varying, causing a
potentially violent and apparently random motion of the aircraft
during the spin.
Out-spin
aileron
Deflection of the roll control opposite to the direction of the spin.
(E.g. a left-stick input = port aileron up in a left hand spin).
Pull-out Recovery from the dive or spiral-dive which is normally the attitude
found immediately following a spin recovery.
Recovery The point at which the spin has stopped, insofar as the mainplane has
become unstalled. It does not imply a recovery to normal level flight.

G. B. Gratton Airworthiness Evaluation Techniques for Small Light Aeroplanes
87
Term Meaning
Right Hand
Spin
A spin where the yawing motion is in the sense nose to the right
Spiral Dive An accelerating (or constant high speed) descent combined with a
continuous turn. This mode can be mistaken for a spin when
considering only visual cues, and is often the mode into which an
aircraft recovers from the spin.
Standard
Entry
Where a spin is induced by making a full yaw inceptor (rudder) input
when a decelerating aircraft is just above the stall.
Turning
Entry
Where a spin is induced by applying full yaw inceptor (rudder) input
opposite to the turn, when in a steep turn just above the stall.
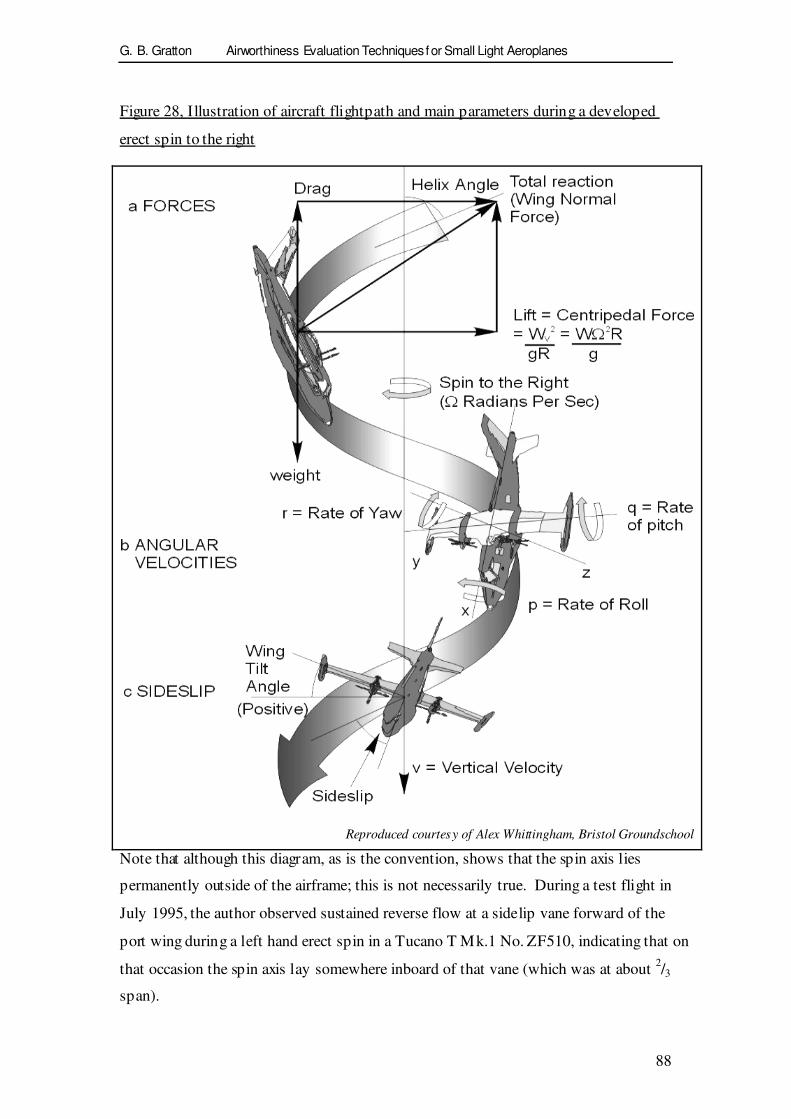
G. B. Gratton Airworthiness Evaluation Techniques for Small Light Aeroplanes
88
Figure 28, Illustration of aircraft flightpath and main parameters during a developed
erect spin to the right
Reproduced courtesy of Alex Whittingham, Bristol Groundschool
Note that although this diagram, as is the convention, shows that the spin axis lies
permanently outside of the airframe; this is not necessarily true. During a test flight in
July 1995, the author observed sustained reverse flow at a sidelip vane forward of the
port wing during a left hand erect spin in a Tucano T Mk.1 No. ZF510, indicating that on
that occasion the spin axis lay somewhere inboard of that vane (which was at about 2/3
span).

G. B. Gratton Airworthiness Evaluation Techniques for Small Light Aeroplanes
89
4.2 Scope of this Research
This discussion will reserve itself to the spinning assessment of smaller
aircraft which are not intended for deliberate spinning or aerobatics, and
primarily microlight aeroplanes. It might be (and often is) asked why this is
considered necessary when these aircraft will not be deliberately spun in
service. The answer to this is that if an aircraft is capable of entering a spin, it
should be known what conditions will cause the spin to occur, how it can be
identified, and what actions should be taken by the pilot to recover the aircraft
from the spin. The evidence of accident reports such as references [60], [61],
[62], [63], [64], [65] in addition to anecdotal evidence show that it would not
be a safe assumption that all spins will be intentional, or that pilots will be
sufficiently knowledgeable or skilful to identify a spin without prior guidance.
This is further supported by the fact that none of the private pilots licence
(PPL) syllabi as used in Britain[66], require a pilot to have experienced (or
recovered from) a developed spin.
This research is limited entirely to 3-axis controlled microlight aeroplanes. At
present, all weightshift controlled microlight aeroplanes in the United
Kingdom, and the majority worldwide, use Rogallo type delta planforms.
These possess very high lateral and directional stability values, which
simultaneously makes the aircraft prone to enter and remain in a stable spiral
dive mode, yet extremely reluctant to enter a spin. There is no recorded
instance of a spin to a weightshift controlled microlight aeroplane in the
United Kingdom, and thus the topic cannot readily be studied, neither is there
any good reason to do so. Some weightshift controlled aircraft may, if
subjected to what might be considered typical pro-spin actions (a rapid stall
entry in conditions where sideslip is present) enter an initial loss of control
which rapidly becomes an accelerating spiral dive [67], despite the pitch
control remaining in the fully nose-up position. Whilst to an extent anecdotal,
this re-enforces the view that weightshift aircraft are inherently spin-resistant.

G. B. Gratton Airworthiness Evaluation Techniques for Small Light Aeroplanes
90
The spiral dive mode has historically caused safety problems in that class of
aircraft [68], but is not currently considered a matter for concern – for this
reason no research funding is available, and equally the spiral dive mode is
considered outside of the scope of this thesis.
Assessments have been carried out on 2-axis controlled microlight aeroplanes,
such as the HM1000 Balerit, however data available for study is limited, and
also no such aircraft has as-yet shown any tendency to spin. For these reasons,
the spinning characteristics of these aircraft are also not considered here.
Whilst this section restricts itself to the theory and general practice of spinning
assessments, appendix A4 shows in greater detail specific spinning test plans
developed in the course of this research, the results of test plans, and detail of
the advice now being given to microlight test pilots conducting spinning
assessments, which is based upon the detailed experience of spinning trials in
microlight aeroplanes. So far, the results contained in that Appendix indicate
full success in that the controls-central spin recovery drill has been universally
successful, and no aircraft considered satisfactory following these assessments
has subsequently suffered any spinning related accident.
4.3 The spin recovery technique for microlight aeroplanes.
The “standard spin recovery” or SSR, as defined since before 1939 by many
texts on aerobatics or the operators manuals for many light aircraft [69],[70],
[71], [72] is “close throttle, centralise stick, apply full opposite rudder, move
stick forward until the rotation stops”. This recovery presents three problems
for the pilot of a microlight aircraft:-
(i) It assumes a degree of recognition of the spin (and spin
direction) which an average microlight pilot may not
possess - also many microlights are not equipped with a
turn co-ordinator or sideslip gauge (slip ball). Indeed,
even for pilots whose training should have supposedly

G. B. Gratton Airworthiness Evaluation Techniques for Small Light Aeroplanes
91
included spin awareness and spin recovery, there is
significant evidence that those pilots also lack sufficient
familiarity [73] that a rapid and correct spin recovery
can be relied upon on each occasion.
(ii) Because of the tendency of a microlight to change
energy state very quickly combined with strong rudder
power at low speeds, there is a theoretical risk that use
of opposite rudder may simply reverse the direction of
spin.
(iii) The standard spin recovery is only useful in the
developed spin; in the incipient spin stage many aircraft
will not yet have fallen into a particular spin direction.
It is unhelpful to force a pilot to wait until the spin is
properly established before being able to recover,
particularly if the aircraft may be close to the ground.
Because of these factors, it has been concluded within the UK microlight
certification community that, where possible, the following spin recovery
should be used for microlight aeroplanes.
- Close throttle
- Centralise all controls
- Wait for spin to stop.
Both spin recoveries are then followed by some variation on “roll wings level
and gently ease out of any ensuing dive, applying power as the level flight
attitude is reached”.
So far, all microlight aeroplane assessment programmes during the course of
this research have found this recovery to be successful in all cases where the
aircraft was able to enter a spin. The largest concern then becomes the failure
of a pilot to identify and take proper recovery action from a spiral dive if that

G. B. Gratton Airworthiness Evaluation Techniques for Small Light Aeroplanes
92
proves to be the mode of recovery from the spin. However, the spiral dive and
recovery are a part of the training syllabus for microlight pilots, so this risk is
considered small. There has however been at-least one occasion where a pilot
who may have recovered from an inadvertent spin at low level into a spiral
dive, failed to realise the change in flight mode and as a consequence flown
into the ground [74]. However on that occasion the pilot was qualified in
larger aircraft types, and had received no formal training in microlight aircraft.
This was legal (although considered poor practice) at the time. Future
recurrence should be prevented by subsequent regulatory changes [75], [76]
that now require pilots of other aircraft classes to receive formal training in
microlight aircraft handling, and to pass an assessment of competence, before
being permitted to fly as an unsupervised pilot in command.
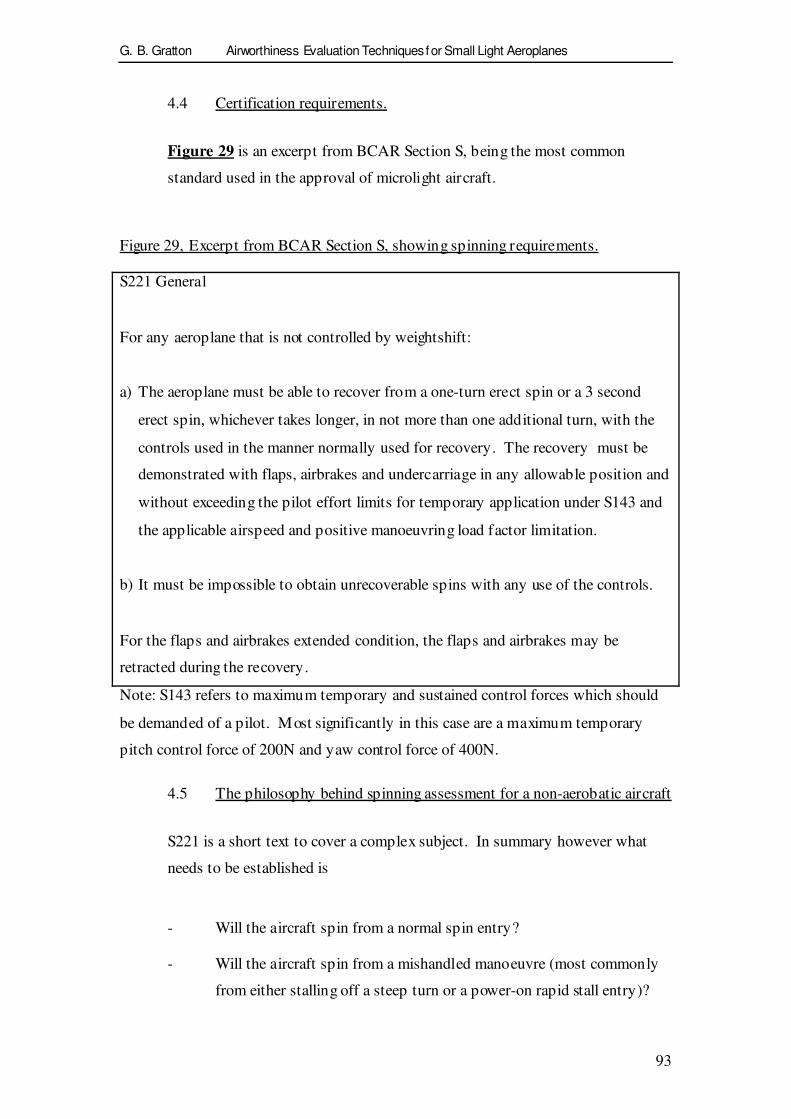
G. B. Gratton Airworthiness Evaluation Techniques for Small Light Aeroplanes
93
4.4 Certification requirements.
Figure 29 is an excerpt from BCAR Section S, being the most common
standard used in the approval of microlight aircraft.
Figure 29, Excerpt from BCAR Section S, showing spinning requirements.
S221 General
For any aeroplane that is not controlled by weightshift:
a) The aeroplane must be able to recover from a one-turn erect spin or a 3 second
erect spin, whichever takes longer, in not more than one additional turn, with the
controls used in the manner normally used for recovery. The recovery must be
demonstrated with flaps, airbrakes and undercarriage in any allowable position and
without exceeding the pilot effort limits for temporary application under S143 and
the applicable airspeed and positive manoeuvring load factor limitation.
b) It must be impossible to obtain unrecoverable spins with any use of the controls.
For the flaps and airbrakes extended condition, the flaps and airbrakes may be
retracted during the recovery.
Note: S143 refers to maximum temporary and sustained control forces which should
be demanded of a pilot. Most significantly in this case are a maximum temporary
pitch control force of 200N and yaw control force of 400N.
4.5 The philosophy behind spinning assessment for a non-aerobatic aircraft
S221 is a short text to cover a complex subject. In summary however what
needs to be established is
- Will the aircraft spin from a normal spin entry?
- Will the aircraft spin from a mishandled manoeuvre (most commonly
from either stalling off a steep turn or a power-on rapid stall entry)?

G. B. Gratton Airworthiness Evaluation Techniques for Small Light Aeroplanes
94
- How may a pilot recognise the spin?
- How may the spin recovery be performed?
Regardless of the simplistic wording in BCAR Section S, spin assessment is
considered vitally important in the assessment of a new aeroplane; it has
ceased to be regarded within the airworthiness community acceptable (as has
happened in the past) for the first experience of the spin to be accidental and
some time after introduction of the type into service. It was for this reason
that this programme of test method development, partly out of perceived
necessity and partly in response to a direct tasking from the Light Aircraft
Committee of the UK Airworthiness Requirements Board (ARB LAC) [77],
that the author initiated the development of spinning guidance for microlight
aircraft in 1998. This guidance is contained in reference [78], but the
following indicates the main components of this, and actual test results
obtained since then.
4.6 Preparation for a spinning trial
An examination of the direction of propeller rotation will show that one spin
direction will be against the propeller torque reaction, the other in the same
direction. Spins should always be executed with the roll direction against the
propeller first, then with it. Spins “with” the propeller may be more stable but
more resistant to recovery, spins “against” the propeller rotation may be more
oscillatory but should recover more quickly[79]. If an aircraft recovers from
the spin against the torque, but is reluctant to recover with the torque,
preparation and briefing must have included the possibility of needing to
switch the engine off in flight.
Also, the ratio of pitching to rolling inertias B/A must be considered. The
yawing inertia is the largest – approximately being defined by ABC +≈ , and
thus its actual value tends not be significant in determining the spinning
characteristics. It is the two smaller rotational inertia values, B and A, and
specifically their ratio, which tends to define the spin mode and the response
to roll (aileron) input during the spin. When B/A<1, the aircraft may be

G. B. Gratton Airworthiness Evaluation Techniques for Small Light Aeroplanes
95
referred to as “wing dominated” which tends to imply a spin-prone aircraft.
When B/A>1, the aircraft may be referred to as “fuselage dominated” or
“pitch dominated”, which tends to imply spin-resistance. One obvious
implication of this is that biplanes or aircraft with wing-mounted engines will
tend to be more spin-prone than monoplanes or aircraft with fuselage mounted
engines; although, it is important to appreciate that this is a trend and not an
absolute rule.
Ailerons act in the normal sense during the spin. Thus if the aircraft is wing-
dominant, in-spin aileron will tend to cause the roll to couple with yaw,
increasing the spin rate (an aircraft well documented for showing this
characteristic is the Scottish Aviation Bulldog [80]), also tending to flatten the
spin. The converse will also be true, this is illustrated in Table 10.
Table 10, Inertia and aileron effects upon the spin mode.
Fuselage dominant aircraft Wing dominant aircraft
In-spin aileron Reduces spin rate Increases spin rate and
flattens spin
Out-spin aileron Increases spin rate and
flattens spin
Reduces spin rate
A further consideration taken is that of tail shape. Unless wind tunnel
facilities are available (which would be unusual for a microlight certification
programme) general rules may be applied. The most important aspect of the
design of the tail is that at-least 1/3 of the rudder must remain outside the
wake from the horizontal stabiliser. Experience has shown that if a line is
drawn on a side view of the aircraft upwards at 60° above the chord line from
the leading edge of the surface, and a second at 30° above the trailing edge of
the surface, the area between these two lines may be considered the wake, and
sufficient rudder area must lie outside that. The cruciform shape of tail, as
found on the Thruster, AX and X’Air series of aircraft for example are very
good in this respect since at-least 50% of the rudder will invariably lie outside

G. B. Gratton Airworthiness Evaluation Techniques for Small Light Aeroplanes
96
the wake. Other designs such as the Spectrum T1 offer significant concerns as
to the safety of spin recovery. These issues of tail shape are illustrated briefly
in Figure 30 below, and in greater depth at reference [81].
Figure 30, Tail shape considered with relation to rudder blanking and thus spin
recovery (diagrams are illustrative only and not to scale)
Low-fwd horizontal stabiliser
Considered high risk, almost total
blanking of the rudder.
(Example, EV-97 Eurostar)
Cruciform
Considered medium risk (usually
acceptable), only partial blanking of
rudder by horizontal stabiliser.
(Example, X’Air Mk.2 Falcon)

G. B. Gratton Airworthiness Evaluation Techniques for Small Light Aeroplanes
97
Low—rear horizontal stabiliser
Considered medium risk (usually
acceptable), low stabiliser but partial
blanking of rudder through horizontal
displacement of the horizontal stabiliser.
(Example, Pegasus / Flightdesign CT2K)
T-tail
Considered low risk, a totally unblanked
rudder. (Note, only the spinning
perspective is considered here with
respect to tailplane design and such tail
shapes may present non spin-related
handling deficiencies.)
(Example, Shadow CD)
Whatever mode seems least hazardous should always be flown first. This is in
line with normal flight test practice of progressing from least to greatest risk in
small steps. In practice, the planning team will tend to create, following their
G. B. Gratton Airworthiness Evaluation Techniques for Small Light Aeroplanes
98
best available judgement, a hierarchy of risk, and progress along the test plan
towards the test considered to have greatest risk.
It is also important to make some estimation of the possible aileron effects
before commencing spinning with mishandled aileron. In an aircraft with a
particularly large wing, in-spin stick is likely to flatten and speed up the spin
(and make recovery harder), whilst out-spin stick is likely to reduce the spin
rate and push the nose down (assisting recovery). In an aircraft with a
dominant fuselage, in-spin stick is likely to create a yawing moment aiding
recovery; conversely out-spin (see section 4.6) stick may again make the spin
faster and harder to recover from. Order of tests must take this into account.

G. B. Gratton Airworthiness Evaluation Techniques for Small Light Aeroplanes
99
5 The tumble departure mode in weightshift controlled microlight aeroplanes
5.1 Introduction to the tumble.
Since their appearance in the late 1970s, weightshift controlled microlight
aircraft[82], have enjoyed a remarkable growth to become a large part of
recreational aviation[83]. This has in part been due to their low cost, and in
part due to an excellent safety record [84] consistently below 30 fatal
accidents per million flying hours.
However, during investigations following a particular fatal accident in 1997, it
was found that there had been a number of accidents, usually fatal, to
weightshift controlled microlights, which could not be explained through any
conventional cause. The reason for these accidents, which involved a
departure from controlled flight followed by aircraft structural failure
(generally including mechanical failure of the basebar, wingtips and leading
edge), became known as the “tumble”.
There has been a previously published attempt to analyse the tumble, in that
case for hang-gliders (where it had first been identified), at reference [85].
This section does not contradict that work, but does progress the analysis
further than the previous work, introducing aeroelastic, transient aerodynamic,
and induced camber effects.
References [86, 87, 88, 89, 90, 91, 92, 93, 94] report a number of accidents to
Weightshift controlled Microlight Aircraft. With a few exceptions on specific
points, these reports show a number of common factors.
- A departure from controlled flight either following gross
mishandling, flight to the stall, or during flight in potentially
highly turbulent conditions.
- In most cases, the aircraft was being flown at a comparatively
low weight.

G. B. Gratton Airworthiness Evaluation Techniques for Small Light Aeroplanes
100
- Damage to the aircraft consistent with very large negative g
overload of the wing (usually failure of the top wires, and also
failure downwards of the wing-tips)
- Evidence of the wing being forced to a very high nose-up pitch
attitude relative to the trike (impact of the basebar with the
front strut, usually resulting in a failure of one of these two
components, causing the propeller subsequently to impact the
keel tube). Where a pilot has survived the departure it is
normal that they have subsequently reported the basebar being
“snatched from their hands” [95]. [The term “trike” is used here
to describe all of the aircraft that is not the wing or hangbolt.
The wing and trike are hinged in pitch and roll at the hangpoint,
of which the hangbolt is the central component, whose removal
allows the two to be separated for derigging.]
- Rapid autorotation of the aircraft in nose-down pitch, generally
followed by…
- Break-up of the aircraft in flight, preventing it from sustaining
flight and usually resulting in a fatality.
Note: Sycamoring failure mode. It has been recorded in a number of accidents that
the wing basebar has failed following impact with the front strut. The result of this
would appear to have been that immediately following this failure, the loss of
structural integrity has caused a subsequent failure of the wing leading edge (and
cross-tube), at the root on one side only. This has resulted in a new wingform that is
approximately “L-shaped” as seen in forward view. It is reported that a wing which
has failed in this way develops a spiral motion that tends to arrest the aircraft’s
descent, in the manner of a sycamore seed (Figure 31 below) ,hence the accepted
term, “sycamoring” which has become adopted to describe the nature of descent. It
is believed from anecdotal evidence, although documentary evidence to either support
or dispute this case is weak, that all tumble accidents which have been survived have
involved basebar failure and sycamoring descent . Similarly there does not appear to

G. B. Gratton Airworthiness Evaluation Techniques for Small Light Aeroplanes
101
be any recorded tumble accident, where the front strut failed, which was survived.
For this reason, all British microlight manufacturers eliminated any previous use of
re-enforcing cables within the basebar from the late 1980s[96].
Figure 31, Sycamore Seed with wing casing, showing similarity to trike with damaged
wing.
.
5.2 The mechanism of the established tumble.
The tumble behaviour of the two piece airframe that is a Weightshift
Microlight contains what initially appears to be a paradox. The tumble rotation
is known to be nose down whilst the basebar is known to be on the front strut
– the control position associated with a nose-up pitching motion in normal
flight. There must therefore be some mechanism which sustains these
apparently contradictory conditions.
Figure 32 below illustrates the situation with the Microlight in normal attitude
and when the wing is fully nose up relative to the pilot.

G. B. Gratton Airworthiness Evaluation Techniques for Small Light Aeroplanes
102
Figure 32, Positions of aircraft in normal flight(A) and tumble(B)
Whilst Figure 33 shows diagrammatically the centre of gravity of the
complete aircraft.
Figure 33, position of whole aircraft CG
The tumble therefore comprises a translational motion coupled with rotation
about a point of the aircraft close to the centre of gravity and the incident
airflow over the wing will be as shown in Figure 34 (A) below. This type of
(A)
(B)

G. B. Gratton Airworthiness Evaluation Techniques for Small Light Aeroplanes
103
airflow can be experienced by a pitching wing in normal flight which gives
rise to unsteady aerodynamic phenomena. In particular the airflow over the
leading and trailing edges of the wing are appropriate to the incident flow over
a sharply cambered wing as shown in Figure 34 (B). This effect can be
considered to be an induced camber and will generate negative lift. Figure
34 (C) shows a photograph of an actual wingtip.
Figure 34, illustration of induced camber during tumble
(C) Photograph of actual wingtip from below (Pegasus Q1 wing, not under
flight loads), also showing location on aircraft.
(A)
(B)
N e t F lo w
R o tat io n a l F low
(A)
(B)
N e t F lo w
R o tat io n a l F low

G. B. Gratton Airworthiness Evaluation Techniques for Small Light Aeroplanes
104
As the aircraft tumbles nose down, the inertial effects upon the wingtip trailing
edge components will tend to force them in a direction from upper to lower
surface. These trailing edge components are unlike those at the leading edge
in that they are not constrained by a spar (although Figure 34 (C) shows the
“tipstick” extending from the leading edge, which is intended to limit
deformation towards the lower surface). In consequence, the inertial loading
will tend to deform the trailing edge structure towards the lower surface and
therefore produce a localised positive camber. This will generate an additional
positive lift in the trailing edge region which will, in turn, increase the nose
down pitching moment. This is illustrated in Figure 35; it is also worthy of
note that the wreckage of most aircraft which have suffered a tumble-related
structural failure have shown failure of the wingtips, in the sense of the tip
bending towards its lower surface.
Figure 35, Illustration of the effect of localised induced camber
This therefore shows the situation of a wing-trike combination locked into a
configuration with the wing fully nose-up. The tumble rotation having begun
causes the trailing edge panels to deflect downwards generating some
additional localised trailing edge camber through aeroelastic effects. This
camber will generate aerodynamic forces, which, in turn, will increase the
nose down moment. This moment, when considered with the microlight’s
centre of gravity location, causes the wing to rotate whilst translating. The
wing sees the airflow as an effective camber, which therefore generates a
downward lift force; this sustains the nose-down motion. Figure 36 shows the
combination of these aerodynamic effects, which helps to explain the
phenomenon and the apparent paradox.
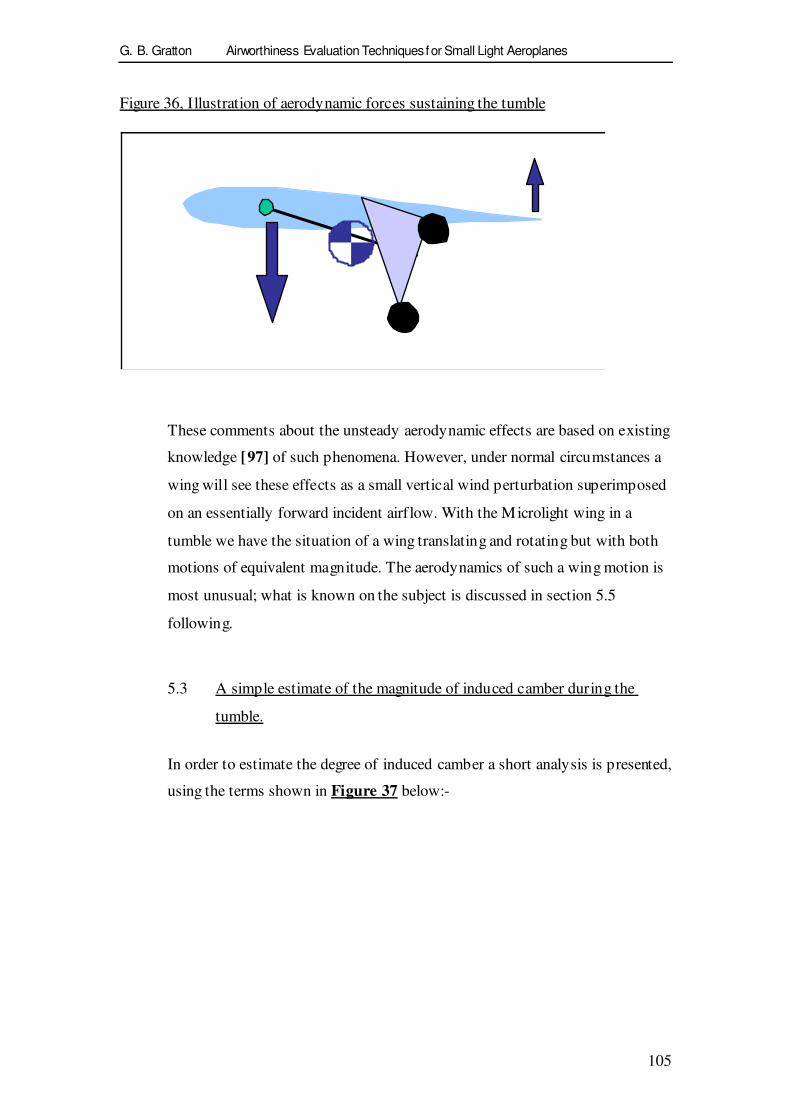
G. B. Gratton Airworthiness Evaluation Techniques for Small Light Aeroplanes
105
Figure 36, Illustration of aerodynamic forces sustaining the tumble
These comments about the unsteady aerodynamic effects are based on existing
knowledge [97] of such phenomena. However, under normal circumstances a
wing will see these effects as a small vertical wind perturbation superimposed
on an essentially forward incident airflow. With the Microlight wing in a
tumble we have the situation of a wing translating and rotating but with both
motions of equivalent magnitude. The aerodynamics of such a wing motion is
most unusual; what is known on the subject is discussed in section 5.5
following.
5.3 A simple estimate of the magnitude of induced camber during the
tumble.
In order to estimate the degree of induced camber a short analysis is presented,
using the terms shown in Figure 37 below:-

G. B. Gratton Airworthiness Evaluation Techniques for Small Light Aeroplanes
106
Figure 37, Illustration of tumble parameters
ψ
Vω
x
y
A wing section is fixed to an axis rotating about a point which is descending
vertically. With reference to Figure 37 above, by considering an element of
the wing, which is distance y towards the leading edge from a reference point
at which a radial line (length x) from the centre of gravity (CG) of the aircraft
meets the wing chord line at 90°. This element is rotating about the CG at a
rate ω and at any given moment the line between the CG and perpendicular to
the wing chord, and the entire system direction of movement is ψ=ωt, where ψ
is the azimuthal co-ordinate. The rate of vertical, translational movement is V.
The motion of this element may therefore be expressed by the various
components of translation and rotation as indicated in Figure 38 :-
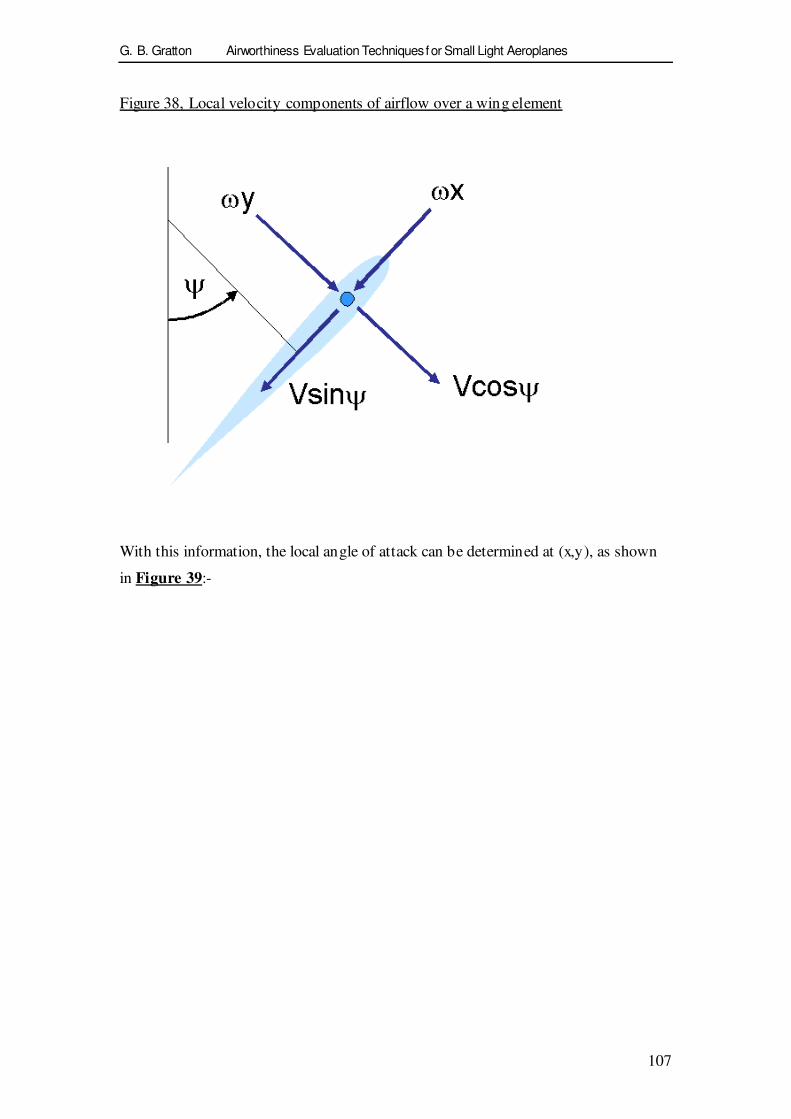
G. B. Gratton Airworthiness Evaluation Techniques for Small Light Aeroplanes
107
Figure 38, Local velocity components of airflow over a wing element
With this information, the local angle of attack can be determined at (x,y), as shown
in Figure 39:-

G. B. Gratton Airworthiness Evaluation Techniques for Small Light Aeroplanes
108
Figure 39, Determination of local angle of attack.
From these, the following expression may be written for the local angle of
attack:-
−
−= −
ψϖ
ψϖα
sin
costan 1
Vx
Vy
(5-1)
or
−
−= −
ψω
ψωα
sin1
costan 1
xV
xV
xy
(5-2)
(An alternative form,
in terms of time would
be:- )
−
−= −
tx
V
tx
Vx
y
.sin1
.costan 1
ωω
ωωα
(5-3)

G. B. Gratton Airworthiness Evaluation Techniques for Small Light Aeroplanes
109
From (5-2) a typical incident flow angle variation across the wing chord is given by
Table 12, which is based upon conditions given in Table 11 preceding it.
Table 11, Conditions used for tumble simulation
Tumble Rotation Rate 400º/sec
Tumble Translation Speed 5 m/s
Wing Chord 3m
Perpendicular distance from CG to wing
chord 2.0m, intercepting at 0.6 smc.
Table 12, Local angle of attack (degrees)
Chordwise Station (%)
Azimuth
(°°°° ) 0 20 40 60 80 100
0 28.45 13.60 -3.33 -19.70 -30.25 -33.35
30 35.70 19.45 -0.71 -20.69 -33.10 -36.62
60 46.26 31.39 9.94 -14.55 -30.36 -34.78
90 54.50 43.07 25.05 0.00 -19.32 -25.05
120 57.41 48.47 34.78 14.55 -3.81 -9.94
150 55.85 47.95 36.62 20.69 5.92 0.71
180 51.52 43.77 33.35 19.70 7.58 3.33
210 45.75 37.67 27.36 14.74 4.13 0.49
240 39.48 30.74 20.09 7.78 -2.01 -5.27
270 33.53 23.84 12.46 0.00 -9.41 -12.46
300 28.82 17.81 5.27 -7.78 -17.14 -20.09
330 26.58 13.81 -0.49 -14.74 -24.41 -27.36
360 28.45 13.60 -3.33 -19.70 -30.25 -33.35

G. B. Gratton Airworthiness Evaluation Techniques for Small Light Aeroplanes
110
This may be illustrated graphically as shown in Figure 40 below.
Figure 40, Local angle of attack variation
Inflow Angles during Tumble Rotation
-90
-60
-30
0
30
60
90
0 60 120 180 240 300 360
Azimuth
Infl
ow
An
gle
0
20
40
60
80
100
75
Thus a significant induced camber effect may be seen throughout the sustained
tumble.
The 75% chord result is highlighted in Figure 40 above. Analysis of a
pitching and plunging aerofoil using thin aerofoil theory [98], indicates that
the lift force can be considered to be acting at the 25% chord based on an
incidence determined by conditions at the 75% chord. In addition, a pitching
moment is generated in opposition to the pitching rate and thus acts as a
viscous aerodynamic damper. This figure shows that for approximately 80%
of the rotation cycle the rotation imparts a negative incidence, giving a
negative lift. This negative lift force sustains the nose down tumbling motion
of the aircraft. The variation of the 75% incidence shows that the pitching

G. B. Gratton Airworthiness Evaluation Techniques for Small Light Aeroplanes
111
moment is not constant and a “pulsing type” of rotation rate would be likely.
Observation of the tumbling incident described in Figure 61 appears to
confirm this behaviour.
5.4 Longitudinal static stability of a weightshift microlight: development
of a model intended to aid analysis of tumble entry.
A weightshift controlled microlight aeroplane may under normal conditions be
treated as having two separate and distinct longitudinal stability modes: that of
the wing, and that of the trike. In normal flight, when the basebar is between
the pilot and front strut, but touching neither, these are separate. When
pitching moments are taken about the hangpoint, the aerodynamic pitching
moment of the wing is balanced by the wing’s own weight. Similarly, the
pitching moments of the trike about the hangpoint (due to weight, drag and
thrust) must sum to zero.
It is believed, mostly from the evidence of accident investigation reports, that
the tumble occurs when some combination of conditions causes the basebar to
be pushed against the front strut (equivalent to the control input used by a pilot
to apply the maximum nose-up pitching moment), whilst the sum of pitching
moments upon the aircraft cause are strongly nose-down. Wing aerodynamic
data is available from tests using the BHPA test facility at Rufforth, Yorkshire
(Figure 41). However, a theoretical model is required for the whole aircraft
that predicts CM as a function of aircraft pitch attitude. It should then be
possible to combine the data for both wing and trike, to indicate at what
combination of conditions the aircraft may continue to rotate nose-down,
initiating and sustaining the tumble. This may then be used to determine
whether an aircraft design offers any significant risk of tumble entry, given
knowledge of the wing’s aerodynamic characteristics, and the desired or
existing flight and manoeuvre envelope.

G. B. Gratton Airworthiness Evaluation Techniques for Small Light Aeroplanes
112
Figure 41, BHPA hang-glider test facility at Rufforth, Yorkshire
Consider the following model of a weightshift microlight in side view,
disregarding for the time being the aerodynamic pitching moment of the wing.
All pitching moments will be taken about the hangpoint.

G. B. Gratton Airworthiness Evaluation Techniques for Small Light Aeroplanes
113
Figure 42, Sign conventions used in tumble analysis
- Z axis along monopole, positive downwards.
- Z,X=0 at centre of hangbolt (centre of circle shown on diagram)
- X axis perpendicular to Z axis, positive forwards.
- Pitching moments and angles are positive nose-up.
- Aircraft pitching moments are calculated about the hangpoint.
The model will make use of the following assumptions and variables:-
- The aircraft is in an unaccelerated state.
- Trike drag acts in the wind axis
- Wing lift and drag act at the hangpoint.
Z (+Ve)
X (+Ve)

G. B. Gratton Airworthiness Evaluation Techniques for Small Light Aeroplanes
114
Figure 43, Forces, distances and angles relevant to the longitudinal stability model
DT
T
L
DW
WW
WT
Wing
Mo
no
po
leZCGT
XCGT

G. B. Gratton Airworthiness Evaluation Techniques for Small Light Aeroplanes
115
ZDT
ZT
θθθθT
θθθθ
φφφφW
DT
T
φφφφg
LCGW
WT is the weight of the trike. As shown in Figure 43, it acts through the trike CG, which
is located ZCGT below the hangpoint (in a direction parallel to the monopole), and XCGT
forward of the monopole axis (in a direction perpendicular to the monopole). The weight
acts at an angle φg relative to the monopole axis. φg =0 when the monopole is
perpendicular to the surface of the earth increasing with the aircraft’s nose-up attitude.
T is the thrust due to the engine. It acts through the monopole at a point ZT below the
hangpoint, and at an angle θT relative to a perpendicular to the monopole such that if θT
=0 the thrustline is perpendicular to the monopole. θT is positive as the thrustline
becomes more nose-up.
DT is the drag due to the trike. It acts through the monopole at a point ZDT below the
hangpoint, and at an angle θ relative to a perpendicular to the monopole such that if θ=0
the monopole is perpendicular to the relative airflow, and if θ is positive the monopole is
more nose-up.
WW is the weight of the wing. It acts through the wing centre of gravity which is on the

G. B. Gratton Airworthiness Evaluation Techniques for Small Light Aeroplanes
116
wing keel a distance LCGW behind the hangpoint. The wing itself is at an angle φW nose-
up compared to a perpendicular to the monopole. The weight acts at an angle φg relative
to the monopole axis. φg =0 when the monopole is perpendicular to the surface of the
earth, becoming more positive with the aircraft’s attitude increasing nose-up.
L is the lift due to the wing. It acts through the hangpoint at an angle perpendicular to the
wing and is positive when acting towards the upper surface of the wing.
DW is the drag due to the wing, it acts through the hangpoint in a directional parallel to
the wing keel and is positive when acting towards the trailing edge.
Pitching moments of the whole aircraft (except for the present the wing
aerodynamic pitching moments) about the hangbolt, are shown in the
following Table 13.
Table 13, Pitching moments about hangpoint
Moment due to wing
aerodynamic pitching
moment:
Disregarded in this analysis because the wing freely
articulates in pitch relative to the trike. Therefore any
wing aerodynamic pitching moments will influence
the wing pitch attitude only within the aircraft and
will not directly influence pitching moments acting
upon the whole aircraft.
Moment due to effect of
wing lift:
=0, since lift is considered to act through hangpoint
Moment due to effect of
wing drag:
=0, since wing drag is considered to act through
hangpoint
Moment due to effect of wing
weight:
[ ]φφgWW LW CGW
−= cos (5-5)

G. B. Gratton Airworthiness Evaluation Techniques for Small Light Aeroplanes
117
Moment due to the drag of
the trike
[ ]
[ ]θ
θ
cos
cos
2
ZVK
ZD
DD
D
TT
TT
−=
= − (5-6)
(Since VKD DTT
2= )
Moment due to thrust
[ ].cosφTTZT= (5-7)
Moment due to the weight of
the trike
Z CG T
Taking moments about hangpoint
( ) ( )( )φφgCGgCGT ZXW
TT
sincos +−= (5-8)
Summing these components, we achieve the following expression for the
pitching moment acting upon the entire aircraft.
[ ] [ ]
[ ] [ ] [ ]( )φφφ
φφ θ
ggTTT
gWWTOTAL
ZXWZ
ZVKLWM
CGCGT
DDCG
TT
TTW
sincoscos
coscos2
+−++
−−=
(5-9)
However it is difficult to predict the value of thrust during a departure from
controlled flight, and also the effect of thrust is to pitch the aircraft nose-up;
hence when considering the risk of a nose-down departure, zero thrust will be
WT
XCGT
φg

G. B. Gratton Airworthiness Evaluation Techniques for Small Light Aeroplanes
118
regarded as the worst case. Therefore, it is conservative and appropriate to
disregard it from the above formula, simplifying further to the following.
[ ] [ ] [ ] [ ]( )φφφφ θggTgWWTOTAL ZXWZVKLWM CGCGDDCG TTTTW
sincoscoscos2
+−+−−=
(5-10)
This formula may then be used to estimate the total pitching moment on the
trike. The data required use this formula to find M TOTAL are:-
- WW TW, are basic design values of the aircraft; however, it should be borne in
mind that whilst for a specific aircraft type WW is fixed, WT will vary
according to occupancy and fuel state. However, for any given type, the
minimum and maximum permitted loadings are published, allowing analysis
to bracket the range of possible conditions.
- KZXZ DCGCGD TTTTT
,,,,θ are functions of aircraft geometry and may be
obtained from design data.
- φW
, φg, θ are flight variables. Considering known flight conditions such
as are shown in Figure 44, it may be determined that in level flight ≈φg
-15°,
and ≈φW
30° (i.e. the monopole is canted about 15° forward of vertical, and
the wing is about 15° nose-up from the horizontal, or 30° nose-up compared to
a perpendicular line to the monopole). The range of values of φW
will be
approximately ±10° compared to this value (defined by the geometry of the
trike, which restricts basebar movement). Also, normal (and usually
placarded) operating limitations for an aircraft in this class are ±30° pitch
attitude, compared to the normal level flight attitude. Therefore it may be
considered that during flight within the normal envelope, -[45° < φg <15°],
and [20° < φW
< 40°].

G. B. Gratton Airworthiness Evaluation Techniques for Small Light Aeroplanes
119
Figure 44, typical aircraft (Mainair Gemini Flash 2a) in flight
For the purposes of modelling, it is possible to examine a wider range of
values of φgthan might be experienced within the normal envelope, so values
of –105° <φg< 75° will be considered [equating to attitudes between
vertically upwards and vertically downwards, as seen by the pilot]. The
significant case is the one where the pilot would not be able to prevent a nose
down departure; assuming then a full nose-up pitch inceptor input, it can be
further assumed that φW
=40°. θ , the trike angle of attack is relevant insofar
as the drag due to the trike acts in a nose-down direction, therefore it will be
considered to be 0°, again because this is the worst case for a nose-down
pitching departure.
Therefore, the relationship describing the pitching moment acting upon the
whole aircraft is given by:-

G. B. Gratton Airworthiness Evaluation Techniques for Small Light Aeroplanes
120
[ ] [ ] [ ]
− + − ° − ° = −
Z
X Z X W Z V K L W M
CG
CG CG CG D D CG
T
T T T T T W g T g W TOTAL
1 2 2 2 sin sin 0 cos cos 40 cos φ φ
(5-11)
Although for the purposes of considering the trike alone, the first term of this
equation is omitted.
The graph below shows the value of M TOTAL as a function of φg
for a Mainair
Gemini trike (Figure 44) for both it’s maximum and minimum permitted
loadings. V is assumed to be 43 knots, since this is a typical cruising airspeed,
and also the speed around which the best quality wing aerodynamic test data is
available.
Figure 45, Pitching Moment of trike about hangpoint, zero thrust
-6,000
-5,000
-4,000
-3,000
-2,000
-1,000
0
1,000
2,000
3,000
4,000
-105 -90 -75 -60 -45 -30 -15 0 15 30 45 60 75
attitude, degrees
Pitch
ing
mo
me
nt,
Nm
Maximum trike weight
Minimum trike weight
This may be compared to the following graph for a correctly adjusted Mainair
Flash 2 alpha wing, which might typically be fitted to this trike.

G. B. Gratton Airworthiness Evaluation Techniques for Small Light Aeroplanes
121
Figure 46, Characteristics of Mainair Flash 2 alpha wing
F2a, G-MVEP, Tipsticks fitted, Correct Luf flines, 44 +/-2.7 kn
-8,000
-6,000
-4,000
-2,000
0
2,000
4,000
6,000
8,000
-40 -30 -20 -10 0 10 20 30
AoA, degrees
Forc
e, N
-2000
-1500
-1000
-500
0
500
1000
1500
2000
Pitchin
g M
om
ent, N
m , p
ositiv
e n
ose-d
ow
n
M
D
L
M
D
L
If the wing is pushed through the stalling angle of attack to about 25° AoA,
then the aerodynamic pitching moment will be about 600Nm nose-down.
However, considering the wing, an equal pitching moment is reached at about
20° nose-up, regardless of weight (which equates approximately to 35° nose-
up as seen by the pilot). If the aircraft was stalled at a greater nose up pitch
attitude of, for example, 30° nose up (45° as seen by the pilot) then whilst the
wing pitching moment will remain about 600 Nm the trike, depending upon
weight, will have a pitching moment of 1,000 - 1,500 Nm nose-down. This
will, once the basebar has been touched by the front strut - creating a rigid
system, force the whole aircraft, in a rigid state, nose-down, rotating about the
whole aircraft CG, which will, due to the relative masses, be close to the trike
CG. The effect of this is to induce an apparent reverse camber at the wing:

G. B. Gratton Airworthiness Evaluation Techniques for Small Light Aeroplanes
122
Figure 47, Illustration of induced flow, superimposed upon aircraft image (Pegasus
Quantum 15-912)
This induced reverse camber is likely to cause a reversal in pitch stability, and
thus both a tendency to further pitch down; a negative lift force will also
“lock” the trike to the aircraft, maintaining the a rigid system.
5.5 Wind tunnel testing of a scaled model to consider the flow around a
tumbling aircraft.
Research has been carried out to investigate the flow around a tumbling
aircraft [99]. This made use of a rigid scaled model based upon the shape (and
in particular the 3-dimensional wing shape) of the Gemini Flash 2 alpha
aircraft [100]; this model is shown in Figure 48 below.
Local
Airflow

G. B. Gratton Airworthiness Evaluation Techniques for Small Light Aeroplanes
123
Figure 48, Scale model of Mainair Gemini Flash 2 alpha aircraft, used in wind tunnel
tests
Photograph courtesy of Oliver Moncrieff
This model, which was 1:30 scaled down from the actual aircraft and set with
geometry resembling an aircraft with the basebar against the front strut, was
rotated in pitch within the University of Southampton’s 7’ x 5’ (2.1m x 1.5m)
low-speed wind tunnel which is fitted with Particle Image Velocimetry (PIV)
equipment. No attempt was made to create a self-sustaining tumble, the
subject of interest being the qualitative flow characteristics around the aircraft
rather than quantitative effects. The airspeed and rotation rate were varied
between 0.13-0.26m/s and 310-775°/s. Initial testing with smoke and a video
camera showed the primary area of interest being 1 wing chord before and
after the rotating aircraft in the direction of ambient airflow. Figure 49 below
shows the flow at two spanwise stations:-

G. B. Gratton Airworthiness Evaluation Techniques for Small Light Aeroplanes
124
Figure 49, Illustration of flow near16
the wing root during nose-down tumble rotation
x (mm)
y(m
m)
100 200
50
100
150
200
7 54
Vorticity scale, ζ , radians per
second (defined by y
U
x
V
∂
∂−
∂
∂=ζ ):
16
10mm outboard of wing root of model
Airflow

G. B. Gratton Airworthiness Evaluation Techniques for Small Light Aeroplanes
125
Figure 50, Illustration of flow near the wing tip17
during nose-down tumble rotation
x (mm)
y(m
m)
100 200
50
100
150
200
9.6
It may be seen from these flow visualisations that there is evidence of a
significant (nominally spanwise) vortex formation occurring near to the wing
root, but very little significant effect near the tip. Further investigation
showed that the most readily visible vortex formation occurred at about 1/3
semi-span outboard of the root – partly because of well developed vortex
shapes, and partly because at stations more inboard, partial blanking of the
laser occurred due to the trike. The series of diagrams in Figure 51 following
are from Moncrieff [99] ; these show the flow around this station during a
single tumble rotation at 620°/s in a steady airflow of 0.26m/s; symbology and
orientation are identical to Figure 49, except that the trike diagram and wind
vector are omitted for clarity.
17
10mm inboard or wing tip on model.
Airflow

G. B. Gratton Airworthiness Evaluation Techniques for Small Light Aeroplanes
126
Figure 51, Series of illustrations of flow around aircraft during one tumble cycle.
(All illustrations in same orientation)
Common Data Block for Figure 51
Rotational velocity = 620 °/s (10.8 rad/s)
Free stream velocity = 0.26m/s Nominally ISA sea-level conditions, ambient air.
Reynolds number ~1.8x10⁻³
(based upon centreline chord and free stream velocity)
Vorticity scale, ζ
rad/s All illustrations within this figure from Moncrieff [99]
x (mm)
y(m
m)
100 200
25
50
75
100
125
150
175
200
3D14
x (mm)
y(m
m)
100 2 00
50
100
150
2003D95
Figure 51(a) Figure 51(b)
The flow is steadiest when the wing is in the position shown in Figure 51(a) which is
approximately 135° nose-down compared to the level flight attitude, this provides a
convenient starting point from which to analyse the tumble. Figure 51(b) following
shows the major impact the wing has on the freestream flow as it moves cross stream
(inverted compared to the level flight attitude, the trike is to the right of the wing in
the diagram), resulting vorticity is visible: clockwise at the trailing-edge and anti-
clockwise to leeward of the leading-edge.
Airflow ����
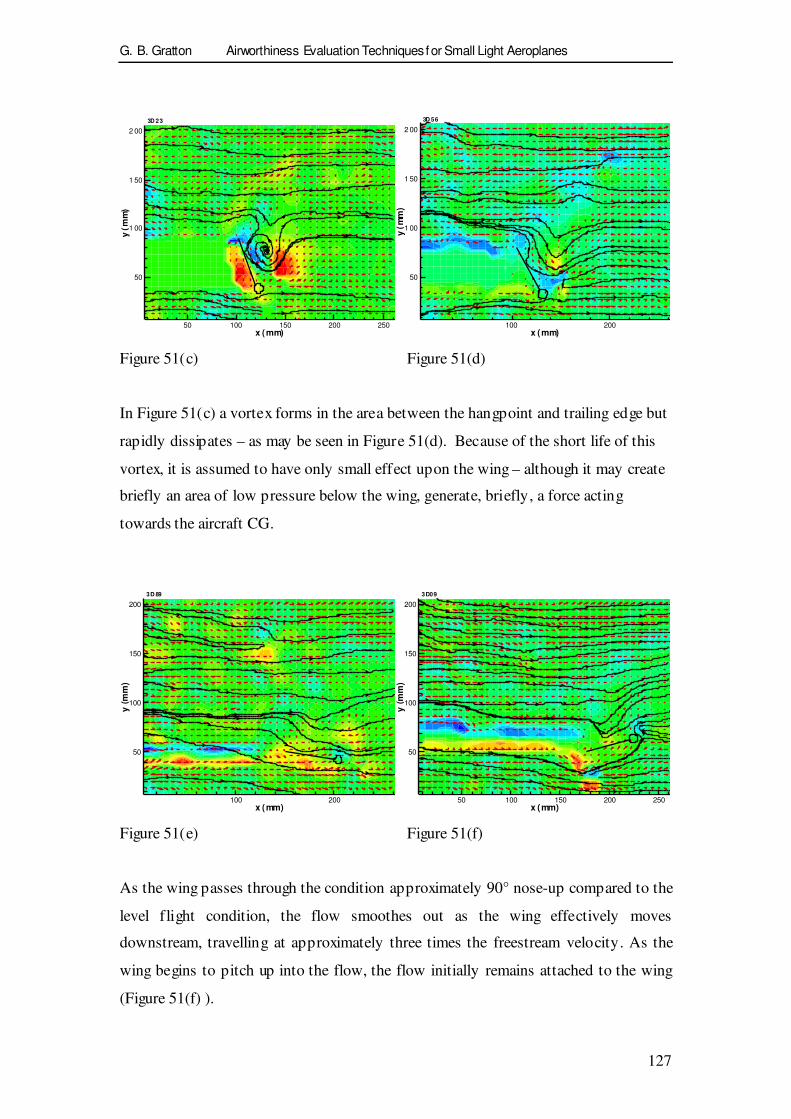
G. B. Gratton Airworthiness Evaluation Techniques for Small Light Aeroplanes
127
x (mm)
y(m
m)
50 100 150 200 250
50
1 00
1 50
2 00
3D 23
x (mm)
y(m
m)
100 200
50
1 00
1 50
2 00
3D 56
Figure 51(c) Figure 51(d)
In Figure 51(c) a vortex forms in the area between the hangpoint and trailing edge but
rapidly dissipates – as may be seen in Figure 51(d). Because of the short life of this
vortex, it is assumed to have only small effect upon the wing – although it may create
briefly an area of low pressure below the wing, generate, briefly, a force acting
towards the aircraft CG.
x (mm)
y(m
m)
100 200
50
100
150
200
3D 89
x (mm)
y(m
m)
50 100 150 200 250
50
100
150
200
3D09
Figure 51(e) Figure 51(f)
As the wing passes through the condition approximately 90° nose-up compared to the
level flight condition, the flow smoothes out as the wing effectively moves
downstream, travelling at approximately three times the freestream velocity. As the
wing begins to pitch up into the flow, the flow initially remains attached to the wing
(Figure 51(f) ).

G. B. Gratton Airworthiness Evaluation Techniques for Small Light Aeroplanes
128
x (mm)
y(m
m)
100 200
50
100
150
200
3D87
x (mm)
y(m
m)
100 200
50
1 00
1 50
2 00
3D 19
Figure 51(g) Figure 51(h)
Flow separation at the leading-edge takes place at the same time as the formation of a
trailing-edge clockwise vortex as the aircraft approaches something equivalent to a
steep climbing attitude. Simultaneously, a smaller vortex in the opposite sense forms
above the trailing edge.
x (mm)
y(m
m)
50 10 0 150 200 250
50
100
150
200
3D07
x (mm)
y(m
m)
100 200
50
1 00
1 50
2 00
3D06
Figure 51(i) Figure 51(j)
As the aircraft passes through the level flight attitude, the clockwise vortex has now
detached itself from the trailing-edge; meanwhile, the anti-clockwise vortex created
above the leading edge is growing rapidly and appears to move along the upper
surface of the aerofoil towards the trailing edge as the wing continues its nose-down
rotation.

G. B. Gratton Airworthiness Evaluation Techniques for Small Light Aeroplanes
129
x (mm)
y(m
m)
50 100 15 0 200 250
50
100
150
200
3D16
x (mm)
y(m
m)
100 200
50
1 00
1 50
2 00
3D49
Figure 51(k) Figure 51(l)
As the aircraft approaches an attitude approximately 90° nose-down from the level
flight attitude, the suction force at the trailing edge of the wing is still present as the
aerofoil moves forward into the free-stream. Figure 51(l) shows classical von Kármán
vortex shedding [101], as the inflow sweeps the alternating clockwise and anti-
clockwise vortices downstream.
x (mm)
y(m
m)
50 100 150 200 250
50
1 00
1 50
2 00
3D15
x (mm)
y(m
m)
100 200
50
1 00
1 50
2 00
3D 71
Figure 51(m) Figure 51(n)
The remains of the vortex shedding are still visible in Figure 51(m) as the flow
becomes steadier via Figure 51(n), returning to smoother flow of the initial image for
the rotation Figure 51(a).

G. B. Gratton Airworthiness Evaluation Techniques for Small Light Aeroplanes
130
5.6 Discussion, induced inflow and vortex generation during the tumble
entry.
Since all experience is that the tumble is not survivable, and the level of
maturity of knowledge of this mode is insufficient to discuss recoveries, the
most important phase of the tumble must in current analysis be the entry. This
will occur during initial nose-down rotation through (although not
commencing at) the level flight attitude. The analysis above, shows two views
of the aerodynamics at this phase in an initial nose-down pitching motion.
Figure 40 indicates that it is only for a short period around approximately 45°
either side of the level flight attitude that the net force acts from the lower to
upper surface of the wing; throughout the rest of the tumble cycle, the net
force acts strongly from the upper to lower surface (nominally towards the
aircraft CG).
Considering in addition to this the wind tunnel results, Figure 49 and Figure
51(k) show formation of a large vortex that has moved to the trailing edge,
with a diameter similar to that of the wing chord, and direction of rotation
opposite to that of the wing. This vortex will create a large nose-down
pitching moment during the phase of the tumble around the level flight
attitude.
Therefore, it may be deduced that during the phase of the tumble (or tumble
entry) between that corresponding to a steep climb and that corresponding to a
steep dive, whilst the wing is subject to an aerodynamic force acting from the
lower to the upper surface, there is also a large nose-down pitching moment
sustaining the tumble. At all other phases of the tumble motion, the wing is
subject to a force from the upper to lower surface, nominally towards the
aircraft CG and thus also tending to sustain the tumble This would be
consistent with a continuation of the tumble after initial entry (which the
evidence of accident reports supports), and with an increase in pitch rate

G. B. Gratton Airworthiness Evaluation Techniques for Small Light Aeroplanes
131
between around 45° nose-up and 45° nose-down relative to the normal level
flight attitude. This is supported by Figure 61 following).
It is therefore concluded that the most critical part of the tumble, and in
particular the tumble entry, is that phase of nose-down rotation about 60°
either side of the level flight attitude, and that all efforts towards avoiding the
tumble entry (or should future work progress to this, recovery from the
established tumble) should concentrate upon avoidance of rapid nose-down
rotation at these pitch attitudes.
5.7 Discussion – behaviour of the aircraft during the sustained tumble.
Considering the evidence above in sections 5.4 and 5.6, both indicate that the
forces acting upon the wing are not steady. The limited analysis in 5.4 shows
a maximum force likely to act upon the wing between attitudes equivalent to
45° nose-up from the level flight attitude, to approximately 90° nose-down
from the level flight attitude. Wind tunnel results given in 5.6 indicate that the
wing is likely to also experience a large nose-down pitching moment during
the first part of this phase. Therefore it is to be expected that the aircraft will
display a pro-tumble acceleration (that is downwards, and also nose-down in
pitch) during that part of the cycle. It will be seen in Figure 61 following, that
this is the observed behaviour, with the pitch rate peaking around this part of
the tumble cycle, and reaching a minimum about 180° later (when the aircraft
is inverted, and the analysis and test results from 5.4 and 5.6 above show
much an effective angle of attack close to zero, and only very short term
vortex formation).
5.8 Avoiding the tumble.
The analysis above indicates that a tumble can potentially occur if the aircraft
enters a flight condition where the nose-down pitching moment due to the
weight of the trike is greater than that of the pitching moment of the wing,
locking the trike to the wing and thereby forcing the entire aircraft to pitch
nose-down as a rigid body. This may be entered initially with the aid of

G. B. Gratton Airworthiness Evaluation Techniques for Small Light Aeroplanes
132
engine thrust, creating this situation when thrust is lost either deliberately
(through throttle closure) or inadvertently (through engine failure).
Alternatively the aircraft may if inverted also be in a position where the trike
may “fall” towards the wing, leading it’s motion, creating a similar effect if
the motion of the trike has a significant pitching component.
Using the simple model of the trike longitudinal stability given above, added
to the aerodynamic characteristics of the trike, it becomes possible to predict
the conditions at which the tumble might occur. It should be borne in mind
that the tumble might not necessarily occur, since the rate of pitching must be
sufficient to cause the inverse camber and upper surface vortex on the wing
that is associated with the sustained tumble.
From this analysis, the tumble appears to be a function of both the wing and
trike characteristics. A trike with a long monopole for example, will have a
greater pitching moment at a steep nose-up attitude, and therefore a greater
tendency to tumble.
5.9 Effect of aircraft mass upon the tumble.
It is known from the history of tumble accidents, that the more highly loaded
the trike is, the less the aircraft will tend to tumble. At first sight of the graphs
above, this does not make sense. However once the nose-down pitch
departure occurs, a more lightly loaded trike will result in a whole-aircraft CG
closer to the wing, and thus a greater angle of inflow into the wing – this is
illustrated below. So, at a lower trike mass, the induced camber at the wing
will be greater since the point of rotation will be closer to the wing. Also at
lower trike mass, the rotational inertia in pitch will be less.

G. B. Gratton Airworthiness Evaluation Techniques for Small Light Aeroplanes
133
Figure 52, Illustrating the shift in vertical CG with passenger and fuel loading
changes.
(a) High trike load
(b) Low trike load
Taking an aircraft with a wing mass of 50 kg, trike mass 150kg, and distance
between CGs, 1.5m; the total rotational inertia therefore is 87.5 kg.m² and the
wing is 1m from the aircraft CG. If however the same aircraft has an
increased trike mass of 300kg, then the rotational inertia is 96.5 kg.m² and the
wing is 1.3m from the aircraft CG. Thus, with the same pitching moment
applied, and disregarding aerodynamic damping (which at present, data does
not exist to quantify); if a net nose-down pitching moment of 500 Nm is
assumed, the following simple analysis may be carried out.

G. B. Gratton Airworthiness Evaluation Techniques for Small Light Aeroplanes
134
Table 14, Effect of trike mass upon inflow angle for constant pitching moment
Lighter aircraft Heavier aircraft
Total rotational inertia 87.5kg.m² 96.5 kg.m²
Rotational acceleration, assuming 500 Nm
nose-down pitching moment and no
aerodynamic damping,
5.73 rad/s/s 5.18 rad/s/s
Resultant rotational velocity after 1 second, ω 328 °/s 296 °/s
Downward velocity of nose, assuming it is a
nominal 1m in front of the hangpoint.
9.38 m/s 7.23 m/s
Nominal aircraft stalling speed at this
weightW
MTOWV SO
≈
15 m/s 18 m/s
Approximate angle of resultant flow, at wing
leading edge, at stalling speed
32° 21°
It is thus demonstrated that a reduced trike weight will result in a significantly
greater induced camber following an aircraft stall at a high nose-up attitude.
Therefore, the risk of the sustained tumble occurring, following a nose-up
stall, is considerably greater.

G. B. Gratton Airworthiness Evaluation Techniques for Small Light Aeroplanes
135
5.10 A simple model of the tumble equations of motion
Figure 53, Co-ordinate system for tumbling aircraft
Notes
hf, lf, define points on wing at which net force acts.
h, l, define points on wing at which effective incidence (as defining aerodynamic
loads on wing) occur.
Figure 54, Defining motion of the wing

G. B. Gratton Airworthiness Evaluation Techniques for Small Light Aeroplanes
136
Incident velocities due to CG translation may be written as:-
ψψ
ψψ
sinYcosXV
cosYsinXU
&&
&&
+−=
+= (5-12)
Whilst incident velocities due to CG rotation may be written as:-
Combining these components,
And:
From Figure 53 the inflow angle φ is given by:
Now consider the vertical and horizontal motion of the wing; resolving vertically:-
Whilst resolving horizontally:-
Now, taking clockwise moments about the aircraft CG (and introducing the term k, to
describe radius of gyration):
ψ
ψ
&
&
lV
hU
=∆
=∆ (5-13)
ψψψ &&& hcosYsinX
UUUT
++=
∆+= (5-14)
ψψψ &&& lsinYcosX
VVU P
++−=
∆+= (5-15)
=
−
T
P
U
U1tanφ (5-16)
)sin(D)cos(LmgXm φψφψ −−−−=&& (5-17)
)cos(D)sin(LYm φψφψ −−−=&& (5-18)

G. B. Gratton Airworthiness Evaluation Techniques for Small Light Aeroplanes
137
Combining velocity components gives:
Lift, Drag and Pitching Moment are given by:
The pitch damping is given by the standard result:
To ease the data input, the wing coordinate system is shown in Figure 3. The
coordinates used in equations of motion are derived in (12).
Figure 55, Coordinate System in Wing
( )( )φφ
φφ
ψ
sincos
sincos
2
FF
FF
lhD
hlL
Mmk
+⋅−
−⋅+
−=&&
(5-19)
222
PT UUV += (5-20)
⋅
⋅⋅=
M
D
L
Cc
C
C
SV
M
D
L
0
2
2
1ρ
(5-21)
ψπ
&
V
cCM
8= (5-22)

G. B. Gratton Airworthiness Evaluation Techniques for Small Light Aeroplanes
138
From these coordinates, we have the following results:
Now considering the behaviour over a finite period of time, t∆ :-
Using a tool such Microsoft Excel, this may then be used to generate an
illustration of the motion of the aircraft during the developed tumble. This
will not offer a reliable prediction of the aircraft’s motion during the tumble,
but does allow the aircraft’s behaviour, as a function of the various input
parameters to be considered generally. For example, if a sample set of aircraft
characteristics are input as shown in Table 15 below:-
gF
gF
g
g
zh
xc
l
zh
xc
l
=
−=
=
−=
4
4
3
(5-24)
t
tYY
tXX
tt
tYtYY
tXtXX
∆⋅=∆
∆⋅=∆
∆⋅=∆
∆⋅+∆⋅=∆
∆⋅+∆⋅=∆
∆⋅+∆⋅=∆
ψψ
ψψψ
&&&
&&&
&&&
&&&
&&&
&&&
2
2
2
2
1
2
1
2
1
(5-25)

G. B. Gratton Airworthiness Evaluation Techniques for Small Light Aeroplanes
139
Table 15, Characteristics of typical aircraft
M = 300kg
Radius of gyration = 1.5m
Wing area = 15 m²
Chord = 1.5m
8.5=∂
∂
αLC
per radian
CDo = 0.5
XCG = 0.5
ZCG = 0.5
h = 0.5
l = 0.625
hF = 0.5m
lF= -0.325m
Then the motion of a nominal reference point (at position X=5m, Z=0) on the
body of the aircraft may be represented by a diagram such as that shown in
Figure 56, Illustration of tumble motion, XCG=0.5m
Position of a irfra me reference (m)
-200
-150
-100
-50
0
0 50 100 150 200

G. B. Gratton Airworthiness Evaluation Techniques for Small Light Aeroplanes
140
Yet by changing, for example, the value of XCG from 0.5m to 0.7m (that is, moving
the CG further forward on the aircraft), the result may be modified to that shown in
Figure 57.
Figure 57, Illustration of tumble motion, XCG=0.7m
Position of airframe reference (m)
-200
-150
-100
-50
0
0 50 100 150 200
This is a very similar result; however, if the CG is instead moved a similar
distance rearwards, to a position XCG=0.3m, then the behaviour is markedly
different, as shown in
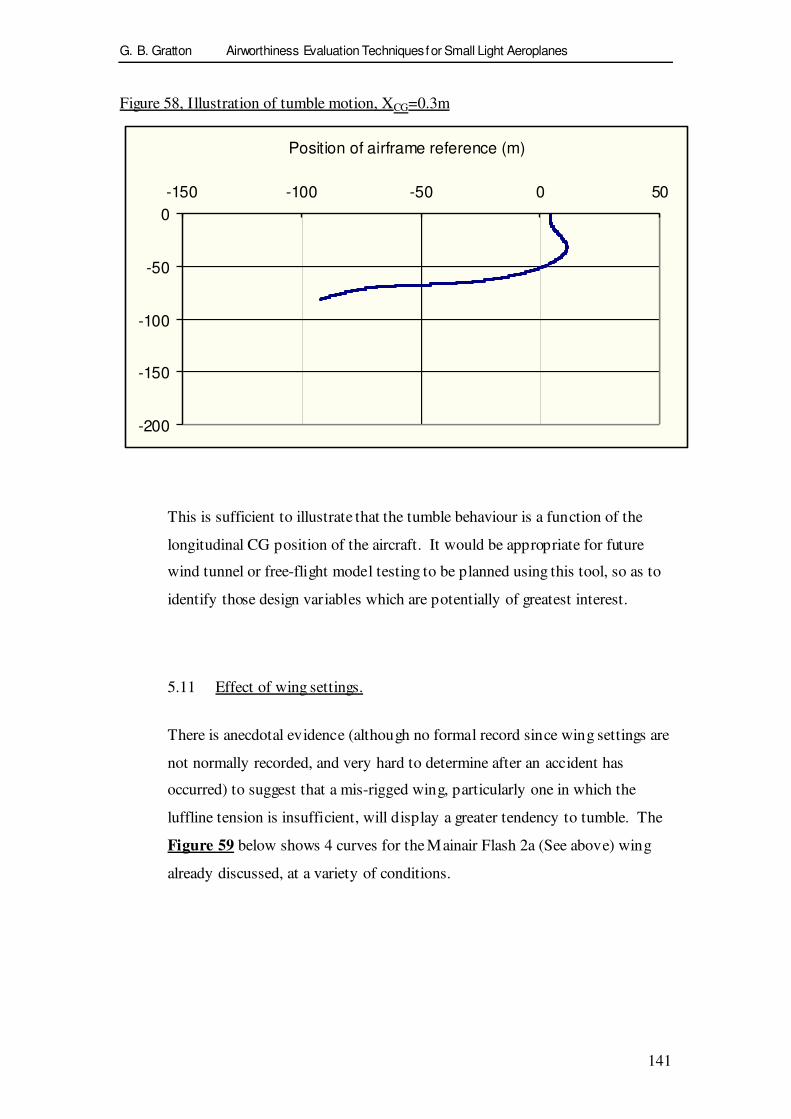
G. B. Gratton Airworthiness Evaluation Techniques for Small Light Aeroplanes
141
Figure 58, Illustration of tumble motion, XCG=0.3m
Position of airframe reference (m)
-200
-150
-100
-50
0
-150 -100 -50 0 50
This is sufficient to illustrate that the tumble behaviour is a function of the
longitudinal CG position of the aircraft. It would be appropriate for future
wind tunnel or free-flight model testing to be planned using this tool, so as to
identify those design variables which are potentially of greatest interest.
5.11 Effect of wing settings.
There is anecdotal evidence (although no formal record since wing settings are
not normally recorded, and very hard to determine after an accident has
occurred) to suggest that a mis-rigged wing, particularly one in which the
luffline tension is insufficient, will display a greater tendency to tumble. The
Figure 59 below shows 4 curves for the Mainair Flash 2a (See above) wing
already discussed, at a variety of conditions.

G. B. Gratton Airworthiness Evaluation Techniques for Small Light Aeroplanes
142
Figure 59, Effect of different rigging conditions upon Mainair Flash 2 alpha wing
Variation of F2a M.v.AoA with changes in design, nominal 44 kn
-1000
-500
0
500
1000
1500
-40 -30 -20 -10 0 10 20 30
° AoA
Pitc
hin
g M
om
en
t, N
m
(1)
(2)
(3)
(4)
(1) Tipsticks, slacken ed l ufflines; (2) No tipsti cks, correct lufflines
(3) Tipsticks, correct lu ffl ines; (4) No ti psticks, slackened lufflines
These plots vary in three ways:-.
The wings with insufficient luffline tension display a flat curve (indicating
very low apparent longitudinal static stability) around the trimmed condition.
Without either tipsticks or correct luffline tension, the wing displays a pitch
stability minimum about zero AoA. It is believed, from previous work by
Kilkenny [102] on hang-glider stability and from discussions with microlight

G. B. Gratton Airworthiness Evaluation Techniques for Small Light Aeroplanes
143
wing designers, that this is related to the luffing dive (a mode of flight where
unsatisfactory longitudinal stability characteristics cause a constant speed or
accelerating descent which may be unrecoverable) and not to the tumble.
Specifically, if this condition is achieved then because the CM:α curve is at a
minimum, the aircraft will remain at a stable angle of attack unless a
sufficiently large pitching moment can be applied to move the angle of attack
to above the maximum (seen in the plot above at about 10°). Given the low
angle of attack, the aircraft will tend to descend (due to lack of lift) and either
continuously accelerate or stabilise at a relatively high speed – which unless
recovery actions are taken (probably by use of violent rolling manoeuvres) are
likely to continue until impact with the ground.
Whilst all such wings may display an apparent tendency towards a nose down
pitching moment at very low angles of attack (well below anything likely to be
experienced within the permitted manoeuvre envelope) this is at a higher angle
of attack for a wing without tipsticks and with incorrect luffline tension. [The
lack of data at lower angles of attack than is shown in the graph is due to a
physical limitation of the BHPA test rig; the only other known facility in the
world (located in Germany) is of similar design and thus at present there is no
means of determining exactly what happens at these angles of attack).
This last characteristic is considered significant to tumble initiation. It is only
possible, due to the difficulty in obtaining either experimental data or a
combined aerodynamic and aeroelastic model of such a wing, to postulate as
to exactly what happens to the forces and moments acting upon the wing
during the initial pitch down of tumble initiation. However, it is a reasonable
assumption that the mis-rigged wing shown in curve (4) of Figure 59 above,
will show a greater tendency to pitch down as the reduction in AoA occurs
than does the correctly rigged wing (irrespective of any induced reverse
camber). In surveying these plots, it appears that correct luffline tension is
important in preventing the tumble, but the presence of tipsticks provides a
valuable backup – if luffline tension ceases to be correct, then the tipsticks
appear likely to maintain a large margin between the normal cruise condition
and the normal flying range of positive angles of attack. The graph above
G. B. Gratton Airworthiness Evaluation Techniques for Small Light Aeroplanes
144
gives reasonable grounds to believe that pitch stability reversal will occur at
angles of attack less than –20°, which previous analysis indicates might
potentially occur with sufficient mishandling in a lightweight aircraft.
5.12 Initiation of the tumble.
The description of the tumble initiation above shows that for the tumble to
occur, it is most likely that the aircraft will be steeply nose-up with a low
throttle setting or failed engine. There are several ways in which this might
occur, which are discussed below.
5.13 First proposed mechanism, the whip-stall.
The whip-stall is an aggressive entry to the aerodynamic stall (at a high
deceleration rate, well in excess of the 1kn/s normally recommended),
followed by an equally aggressive recovery initiation by the pilot (pulling in
the control bar rapidly). This is a manoeuvre which may be used by test pilots
(with great care) to allow them to demonstrate VNE or VDF in this class of
aircraft[103], which are otherwise control limited and unable to demonstrate
high speed flight for certification purposes. However, there is absolutely no
need for a pilot, other than a test pilot in the course of their duties, to ever
carry out this manoeuvre in normal flight; the whip-stall is specifically
prohibited by all microlight manufacturers, and by the UK pilot training
syllabus[104]. It is considered likely (and several eyewitness reports of fatal
accidents bear this out - most recently the October 2000 fatality to a Pegasus
Quantum [86]) that this mechanism can lead to the tumble.
The sequence of actions in the whip stall is detailed below.
• The pilot places the aircraft in a climbing attitude, and
pushes the control bar out rapidly to achieve a high
deceleration rate. At the steepest possible nose-up attitude,
the throttle is closed.

G. B. Gratton Airworthiness Evaluation Techniques for Small Light Aeroplanes
145
• The airspeed decreases rapidly, with nose-up rotational
inertia pitching the aircraft nose-up past the normal AoA
than would normally be expected for the stall, associated
loss of airspeed will also occur. As a consequence, the
aircraft will reach a state where the AoA is greater and the
airspeed lower than would normally be expected at the stall.
This point, when the maximum nose-up attitude is reached
is the stall as perceived by the pilot.
• At the point of stall, the wings aerodynamic pitching
moment becomes strongly nose down. Due to the low
airspeed, this is likely to be less than if the stalling angle of
attack is reached in a less dynamic manoeuvre.
• The trike, which had been held in a steep nose-up attitude
by thrust, pitches down and pushes against the wing (front
strut against basebar) creating a rigid system upon which a
net nose-down pitching moment is acting.
• The aircraft is then rotating nose-downwards, with the
entire system rotating about the whole aircraft CG (rather
than the wing alone rotating about the hangpoint). This can
initiate the tumble, as previously discussed.
5.14 Second proposed mechanism, Spiral instability combined with loss of
visual horizon.
Weightshift Microlight aircraft are approved in all countries of which the
author has knowledge only for flight in Visual Meteorological Conditions
(VMC). This implies a guaranteed visual horizon which the pilot may use as a
reference when correcting small rolling departures (such as may be caused by
temporary inattention, or by turbulence). However, it is possible through ill-
luck or poor judgement for an aircraft to enter Instrument Meteorological
Conditions (IMC), where a defined horizon cannot be guaranteed (most
commonly by entering cloud). If this happens, any pilot will attempt to

G. B. Gratton Airworthiness Evaluation Techniques for Small Light Aeroplanes
146
remove the aircraft from this condition as quickly as possible; however, if the
pilot is unable to extract themselves from this situation it is almost inevitable
that some cause (most likely the turbulence commonly found inside or near to
most clouds) will initiate an undemanded rolling manoeuvre. Unlike most
conventional fixed wing aeroplanes, many weightshift microlight aircraft are
spirally unstable (particularly at higher power settings); thus, an initial small
bank angle is likely to increase without (unless a horizon reference is
available) the pilot’s knowledge or ability to control it. The aircraft would
then enter a divergent rolling manoeuvre, potentially through 90° of bank to a
condition where the pendulum stability which keeps the trike below the wing
will cease to act, and the wing angle of attack will reverse sense – inevitably
causing some loss of control. It is then possible that the aircraft will find itself
in an unsustainably steep nose-up attitude. It is noticeable that some tumble
accident reports, particularly that to G-MVEP [87], have occurred in
conditions where the horizon was known to be poor, and where the subsequent
damage to the aircraft showed that the basebar had fractured (in contact with
the front strut) at the end. This implies a rolling component to the departure
from controlled flight, which would be consistent with this mechanism.
Table 16 shows the results of a brief test carried out to demonstrate the spiral
instability of a weightshift aircraft. A Raven-X weightshift microlight (the
actual aircraft used is shown in Figure 96), flown solo was trimmed in
moderately turbulent conditions and the controls released. The resultant bank
angle was estimated based upon a visual horizon and the time to reach given
bank angles. This demonstrates that following flight into IMC such a
departure could readily happen within 60 seconds (obviously, the presence of
spiral instability will vary between aircraft types, and with power setting).

G. B. Gratton Airworthiness Evaluation Techniques for Small Light Aeroplanes
147
Table 16, Results of test to demonstrate weightshift spiral instability
Aircraft: Southdown Raven-X (Rotax 447 engine) + 60” 3-blade Ivoprop
propeller @ 9° pitch (Propeller approved by MAAN 1076)
Registration: G-MNKZ
Crew: Gratton (solo)
Conditions: CAVOK, light turbulence, nil Wx, OAT +5°C, No.3 from front
hangpoint setting giving 48 mph IAS trim.
Date: 13 Feb 2001
Test: Aircraft flown in light but perceptible turbulence over woodland,
nominal 1000ft on QFE 1024 hPa
Results:
Power Time at 30° bank Time at 45° bank Time at 60° bank
3000 rpm (Flt Idle) 25 seconds 40 seconds Test abandoned
due to ground
proximity
5000 rpm (PLF) 10 seconds 20 seconds 25 seconds
6,500 rpm (MCP) 10 seconds 15 seconds 20 seconds
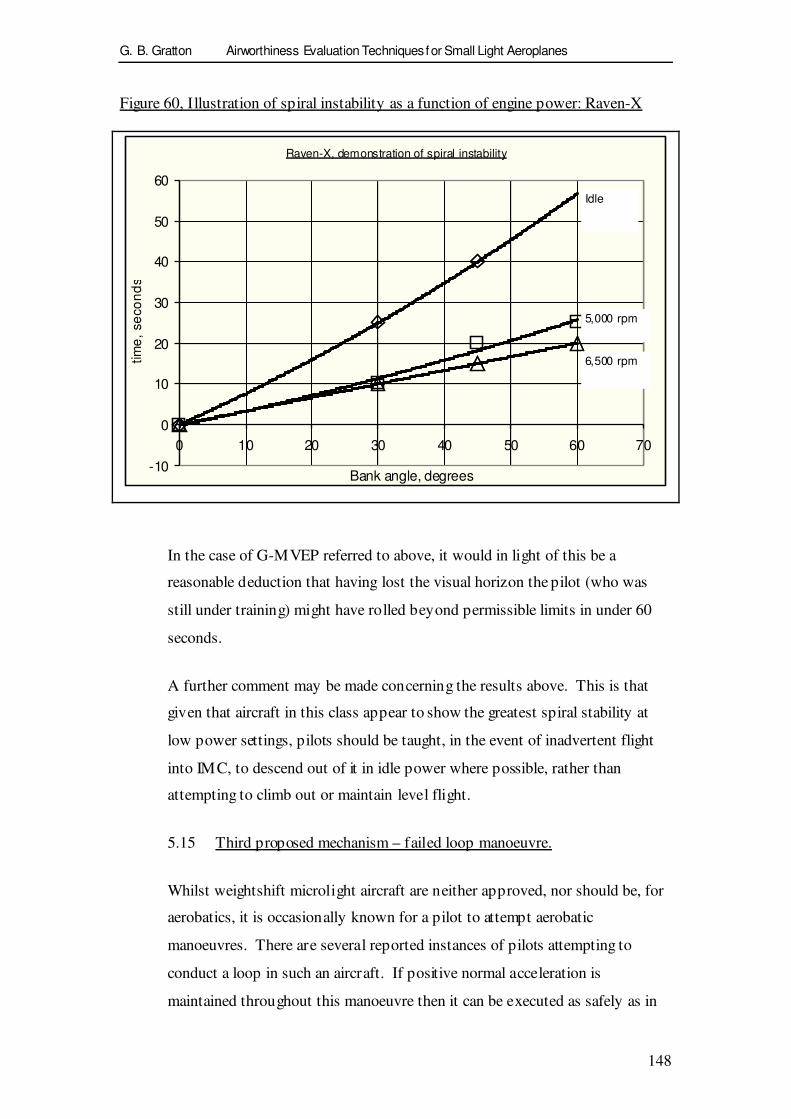
G. B. Gratton Airworthiness Evaluation Techniques for Small Light Aeroplanes
148
Figure 60, Illustration of spiral instability as a function of engine power: Raven-X
Raven-X, demonstration of spiral instability
-10
0
10
20
30
40
50
60
0 10 20 30 40 50 60 70
Bank angle, degrees
tim
e,
se
co
nd
s
6,500 rpm
5,000 rpm
Idle
In the case of G-MVEP referred to above, it would in light of this be a
reasonable deduction that having lost the visual horizon the pilot (who was
still under training) might have rolled beyond permissible limits in under 60
seconds.
A further comment may be made concerning the results above. This is that
given that aircraft in this class appear to show the greatest spiral stability at
low power settings, pilots should be taught, in the event of inadvertent flight
into IMC, to descend out of it in idle power where possible, rather than
attempting to climb out or maintain level flight.
5.15 Third proposed mechanism – failed loop manoeuvre.
Whilst weightshift microlight aircraft are neither approved, nor should be, for
aerobatics, it is occasionally known for a pilot to attempt aerobatic
manoeuvres. There are several reported instances of pilots attempting to
conduct a loop in such an aircraft. If positive normal acceleration is
maintained throughout this manoeuvre then it can be executed as safely as in

G. B. Gratton Airworthiness Evaluation Techniques for Small Light Aeroplanes
149
any other aircraft. However, as with any other aircraft, if the aircraft runs out
of kinetic energy near to the top of the loop, then the pilot will find themselves
inverted without sufficient airspeed to complete the manoeuvre. In this case,
the inevitable consequence will be a negative angle of attack, leading to a
tumble. Figure 61 shows a sequence of frames from the film taken of a
French Cosmos aircraft. The aircraft was flying an air display sequence that
included a loop, which failed. The result was a tumble resulting in the
aircraft’s destruction and death of the pilot on collision with the ground.

G. B. Gratton Airworthiness Evaluation Techniques for Small Light Aeroplanes
150
Figure 61, Illustration of a fatal tumble after a failed loop
Note: The origin of this piece of video is not entirely clear. It is believed to have been
taken at an airshow in Europe, the aircraft being identifiable as a French “Cosmos” type.
The exact date, location and source cannot be verified.
3 seconds from level flight 50° nose up
4 seconds from level flight, 80° nose up
6 seconds from level flight, 45° beyond
vertical
7 seconds from level flight, inverted.

G. B. Gratton Airworthiness Evaluation Techniques for Small Light Aeroplanes
151
8 seconds from level flight, inverted with
nose approximately 45° below the horizon.
At this point the “nose-up” (in aircraft
axes) motion pauses.
9 seconds from level flight, pitch rotation
has reversed and the aircraft has rotated
“nose down” (in aircraft axes) back to
inverted.
9 ½ seconds from level flight, the wing is
continuing to pitch “nose-down”, note that
the trike can be seen to be very “nose
down” compared to the wing. It is likely
that the front strut or basebar has failed at
this point.
10 seconds from level flight, the wing is
now pointed almost straight upwards.

G. B. Gratton Airworthiness Evaluation Techniques for Small Light Aeroplanes
152
10 1/3 seconds from level flight, the aircraft
passes through a level attitude. It can be
seen that the pitch rate between this frame
and the previous is over 400°/s
10 2/3 seconds from level flight, the aircraft
is now pointed downwards. Pitch rate
must at this point be 200 - 300°/s
11 seconds from level flight, the aircraft
passes through inverted.
11 1/3 seconds from level flight, 45° nose
down.
11 2/3 seconds from level flight, the trike is
very nose down compared to the wing -
also there is considerable wing distortion.
12 seconds from level flight, inverted.
Pitch rate appears to be slowing, note very
large washout at tips. This may indicate
tip failure.

G. B. Gratton Airworthiness Evaluation Techniques for Small Light Aeroplanes
153
12 1/3 seconds from level flight, passing
through a level attitude.
12 2/3 seconds from level flight, aircraft is
pointed downwards. Wing planform can
be seen still intact.
13 seconds from level flight, passing
through a level attitude.
13 ½ seconds from level flight, passing
through a vertical nose-down attitude.
14 ½ seconds from level flight, impact
with the ground.
5.16 Fourth proposed mechanism, flight through own wake vortex.
It is well known that a minimum safe separation should be ensured between
landing aircraft, particularly behind larger aircraft which tend to generate very
large vortex wakes that can normally be expected to remain for up to 80
seconds [105, 106] in normal conditions, rather longer in very still air. The

G. B. Gratton Airworthiness Evaluation Techniques for Small Light Aeroplanes
154
weightshift microlight using, as it does, a delta wing tends to generate a
particularly large wake vortex for the size of the aircraft capable of generating
considerable upset [107]. For this reason, pilots of weightshift aircraft are
taught that level turns should never be continued beyond 270° and preferably
not beyond 180° without climbing or descending during the turn.
Considering a typical turning manoeuvre at 45 kn CAS, 60° bank, 2000ft it
can be shown that the turn rate will be 40°/s. Hence, if the pilot were to fly a
continuous tight balanced turn, the aircraft’s own wake vortex would be met in
less than 9 seconds - scarcely time for the vortex to have significantly
dispersed in even moderately disturbed airflow. It is known that aircraft flying
through the wake vortex of another can suffer a large magnitude undemanded
roll. It is then reasonable to assume that the same mechanism, as was
described above, for a loss of visual horizon may also occur – although it is
likely that the onset will be more rapid.
The fatal accident to G-MVDO in 1992 was considered by the AAIB
investigation report [108] to have been a tumble and in-flight break-up
following a pilot flying what were observed from the ground to have been
extremely tight turns of 360° or more.
5.17 Historical note 1 – the Northrop YB-49 “Flying Wing Bomber”
During the 1940s and 1950s there was a great deal of interest in the
development of flying wing aircraft, particularly in the USA for military
purposes. One such aircraft was the Northrop YB-49 (Figure 62). Although
attributed at that time primarily to inertia coupling, there are a number of
notable incidents where these aircraft suffered a pitching departure from
controlled flight.
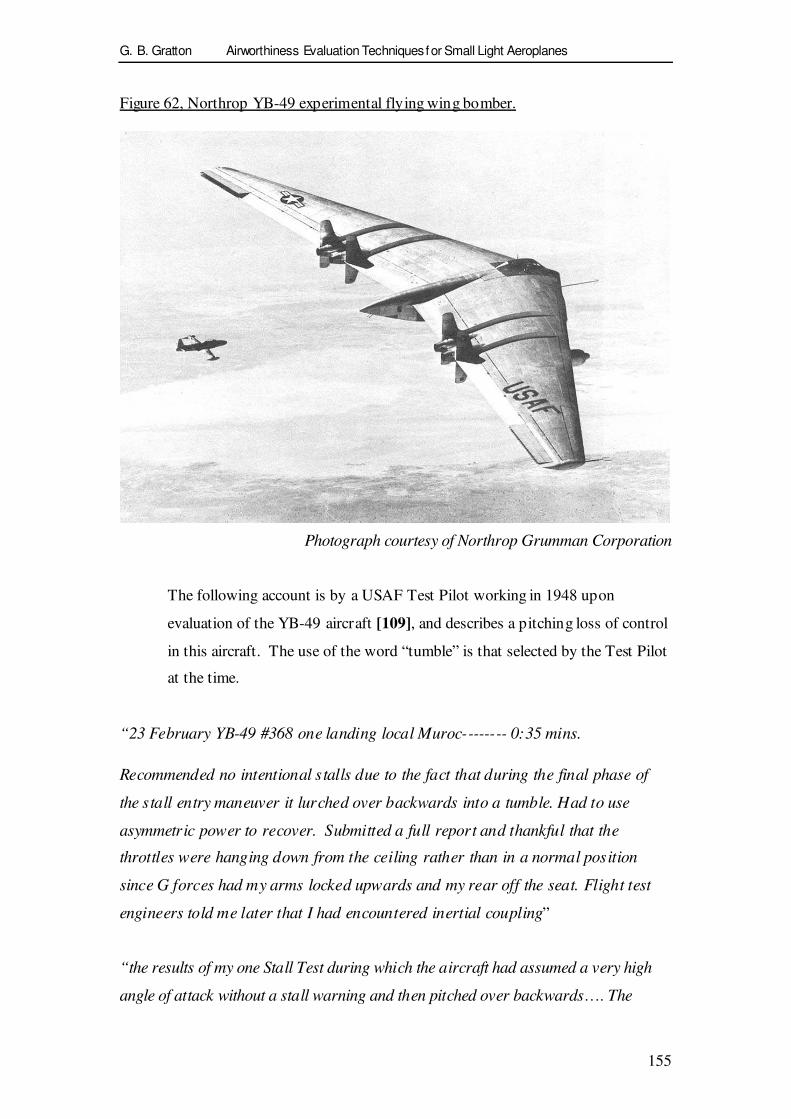
G. B. Gratton Airworthiness Evaluation Techniques for Small Light Aeroplanes
155
Figure 62, Northrop YB-49 experimental flying wing bomber.
Photograph courtesy of Northrop Grumman Corporation
The following account is by a USAF Test Pilot working in 1948 upon
evaluation of the YB-49 aircraft [109], and describes a pitching loss of control
in this aircraft. The use of the word “tumble” is that selected by the Test Pilot
at the time.
“23 February YB-49 #368 one landing local Muroc-------- 0:35 mins.
Recommended no intentional stalls due to the fact that during the final phase of
the stall entry maneuver it lurched over backwards into a tumble. Had to use
asymmetric power to recover. Submitted a full report and thankful that the
throttles were hanging down from the ceiling rather than in a normal position
since G forces had my arms locked upwards and my rear off the seat. Flight test
engineers told me later that I had encountered inertial coupling”
“the results of my one Stall Test during which the aircraft had assumed a very high
angle of attack without a stall warning and then pitched over backwards…. The

G. B. Gratton Airworthiness Evaluation Techniques for Small Light Aeroplanes
156
rotation was severe and made it difficult to keep my hands and feet on the
controls. The engineers called it a lateral roll but I was experiencing a tumble! I
was lucky that the designers had put two throttles hanging down from the upper
surfaces, each connected to four engines.I applied full power with the left throttle
and resolved the "tumble" with asymmetric power and elevon control.”
The aircraft was subsequently lost on 15 June 1948 whilst under the control of
another Test Pilot and was destroyed killing all on board. Available reports
indicate that the aircraft lost control in pitch at about 40,000ft[110], with the
wingtips detaching from the airframe at a high altitude under loading which
exceeded 4.8g[111]. The aircraft descended almost vertically, impacting
inverted, whilst the wingtips were found several miles away. It is interesting
to note that this is consistent with microlight tumble accidents, in that the
departure from controlled flight was in pitch, descent was vertical from
departure from controlled flight, and there was structural failure of the
wingtips before impact with the ground. There are two obvious differences,
which is that the aircraft had a CG which was within the airframe (rather than
below), and that the rotation was nose-up (rather than nose-down). However,
this only negates the mechanism described in 5.3 and 5.4 above and not the
aerodynamics of the established tumble shown in 5.5 above; therefore, whilst
it is not reasonable to assume a similar entry mechanism to that shown for a
weightshift controlled microlight, there is no obvious reason why the
aerodynamic characteristics that sustain this pitch autorotation are not similar
in each case.
It is therefore indicated that the tumble as discussed in this section, and the
tumble as described in the Test Pilot’s account when describing loss of control
in the Northrop YB-49, may well be closely related.

G. B. Gratton Airworthiness Evaluation Techniques for Small Light Aeroplanes
157
5.18 Historical Note 2, the Northrop XP-79 “Flying Ram” experimental
fighter
A later experimental aircraft, also developed by Northrop, was the XP-79
(Figure 63), which was a tailless experimental fighter produced for the USAF.
This aircraft was lost on it’s first flight on 12 September 1945. Very little
information is available as to the reason why this aircraft was lost; however, it
is known that the aircraft suffered a departure from controlled flight during
which the pilot was subject to sufficient forces that he was unable to abandon
the cockpit (where he was located in a “prone” position) before ground
impact, causing loss of both the aircraft and pilot.
Figure 63, Northrop XP-79B "Flying Ram"
Photograph courtesy of Northrop Grumman Corporation
It is not known the specific nature of the departure from controlled flight that
led to loss of the aircraft, and it is highly unlikely now that any new
information will become available. However, it is again interesting to note
that this is a further departure from controlled flight of a tailless delta winged
aircraft, where high forces are likely to have been a significant factor. This
may have been a tumbling departure, similar to that suffered by the YB-49.

G. B. Gratton Airworthiness Evaluation Techniques for Small Light Aeroplanes
158
5.19 Historical Note 3, The de Havilland DH108 “Swallow”
The de Havilland DH108 (Figure 64 below, also reference [112]) was a
British research aircraft of which three examples were built, all in the
late 1940s. The aircraft was a high performance tailless delta-winged
aeroplane, designed specifically for research into the control of flying-
wing aeroplanes, and into the transonic flight regime. All three of
these aircraft were lost in fatal flight testing accidents.
Figure 64, de Havilland DH108 Swallow
Reproduced courtesy of 1000aircraftphotos.com
The first of these accidents [113, 114, 115], which was to aircraft TG306
occurred on 27 September 1946 is well known, having resulted in the death of
Geoffrey de Havilland Jr., who was Chief Test Pilot of de Havilland at that
time. The aircraft was investigating high speed controllability in a dive when
the aircraft broke up “following violent divergent instability at Mach 0.9”,
which is believed to have been in pitch. Technical investigation of the
wreckage of the aircraft which had impacted into soft mud and therefore were
able to be inspected (although unfortunately the accident data recorder fitted
was destroyed by immersion in the same mud) showed that both wings had

G. B. Gratton Airworthiness Evaluation Techniques for Small Light Aeroplanes
159
failed in download. Therefore there are certain common threads here with
known tumble departures, specifically:-
- A loss of control in the pitch axis from which recovery could not be effected.
- Forces acting upon the aircraft which apparently were so great that the pilot
was unable to successfully abandon the aircraft.
- A structural failure in the air, which included a download failure of the
wings.
The second such accident [113] was on 15 February 1950 to aircraft VW120
and was during a sortie from the Royal Aircraft Establishment at Farnborough
to evaluate longitudinal stability and aero-elastic distortion at high Mach
numbers. However, the aircraft did not achieve it’s intended initial test
altitude of 38,000ft instead departing from controlled flight at 27,000 ft
following the onset of divergent longitudinal oscillations. The aircraft is then
reported to have descended at a very high rate, before breaking up somewhere
between the surface and 10,000ft. Whilst it cannot be certain that the tumble
was a factor (and contemporary reports indicate that the pilot had most likely
lost consciousness due to an oxygen system failure), this accident again shows
several common factors to those identified as part of the tumble, specifically:-
- A departure in pitch from controlled flight.
- A very rapid, apparently near-vertical, descent.
- A structural failure in the air (note, compared to TG306 the structure of
VW120 was strengthened).
It seems likely, therefore, that VW120 had entered something similar to the
tumble as previously described. The departure mechanism from controlled
flight was certainly unrelated to those which affect weightshift microlight
aeroplanes, but the aerodynamics sustaining the tumble, as identified in
section 5.5 above may reasonably be considered to apply equally to this
aircraft.

G. B. Gratton Airworthiness Evaluation Techniques for Small Light Aeroplanes
160
The third accident to the DH108 was on 1 May 1950 to aircraft TG283 also
flying from RAE Farnborough; however, in this case the aircraft entered an
inverted spin, which was identified and reported by the pilot. The aircraft spin
recovery parachutes failed, as partially did the pilot’s personal parachute –
resulting in a fatal accident. However, this is appears unrelated to the tumble,
and therefore not of interest in the context of this study.
5.20 Historical Note 4, the BKB-1
The BKB-1, which is shown in Figure 65 and Figure 66 below was an
experimental tailless swept-wing glider developed in Canada in the 1950s[116,
117], which was later developed in the USA into a powered microlight aircraft
known as the Kasperwing. Both the BKB-1 and the Kasperwing were shown
to be able to enter a manoeuvre which was referred to at the time as a tumble,
this was displayed extensively in the USA during the 1960s. It has been
reported that the sustained tumble in these aircraft was believed due to “a
strong vortex occurring just above the wing” [118]. The unique characteristic
of the tumble in these aircraft was that it could be entered deliberately, and
subsequently recovered from.
It is reported [119] that the method used to enter the tumble in this aircraft was
to pull the aircraft into a vertical climb (effectively the first part of the loop),
pause the pitching motion by moving the stick forwards with the aircraft
pointed vertically upwards, then to pull the stick fully backwards (pitching
nose-up), and that this would initiate a nose-up pitch autorotation. The pitch
rate was recorded at approximately 360°/s, with the pilot experience positive
normal accelerations of about 2g. The pilot of the aircraft reported that it was
possible to tumble forwards only by moving the CG significantly forwards in
the aircraft, and that in this instance the pitch rate increased to about 720°/s
whilst the acceleration forces upon his body became high and disorienting (as
well as sufficient to damage the seat structure). In both cases centralisation of
the pitch control was reported to recover the aircraft from the tumble with
minimal height loss.

G. B. Gratton Airworthiness Evaluation Techniques for Small Light Aeroplanes
161
This appears to be further evidence that a rigid tailless aircraft is capable of
entering a tumble, and also that this motion is rapid and can cause structural
damage to the aircraft. Commonly with the evidence of the YB-49 it indicates
a nose-up tumble as the most readily entered mode, and also shows that
recovery is possible – in this case symmetrically using elevon control.
Figure 65, Illustration of BKB-1
Reproduced courtesy of Mr S Brochocki, Air Progress

G. B. Gratton Airworthiness Evaluation Techniques for Small Light Aeroplanes
162
Figure 66, BKB-1 in flight
Reproduced courtesy of Mr D Webb
5.21 Conclusions concerning the tumble.
This section has explained that the tumble mode in a weightshift controlled
microlight is sustained by induced flow as an aircraft rotates in pitch about its
CG. It has demonstrated that the mode may be initiated by a rapid nose-down
rotation of the whole aircraft rotating about its CG, and that this is most likely
to be caused by a loss of power in a steeply nose-up pitch attitude, causing the
rotation of the trike about the hangpoint to push the wing nose-down, via
contact of the front strut and basebar.
Four possible methods of entry have been explained, through a whip-stall,
rolling departure in IMC, a failed aerobatic manoeuvre, or flight through the
aircraft’s own wake vortex. All of these occasions are shown to be avoidable
through good judgement on the part of the pilot; however equally it is possible
with the knowledge of these entry mechanisms to avoid handling
characteristics in a new aircraft design which will tend to make the aircraft
tumble prone.

G. B. Gratton Airworthiness Evaluation Techniques for Small Light Aeroplanes
163
The tumble is a potential “killer” mode in microlight aircraft, as has been
demonstrated by history. However, it is shown that through an understanding
of tumble entry mechanisms in both pilot training, and in the investigation of
the handling characteristics of new types, it is possible to avoid the tumble.
It is also shown that a tumble mode, apparently related to that seen in
weightshift controlled microlights, can also occur in tailless rigid wing aircraft
of any size, controlled using moving control surfaces – most commonly in a
nose-up pitching motion. Although entered by different means, similarly to
the weightshift tumble, this appears to be self-sustaining. There is sufficient
evidence presented to indicate that this departure should be considered as part
of the assessment of any such aircraft, particularly if the aircraft is to be used
in any mode requiring rapid manoeuvring in pitch (e.g. display aerobatics, or
as a fighter aeroplane).

G. B. Gratton Airworthiness Evaluation Techniques for Small Light Aeroplanes
164
6 Conclusions
6.1 Stall entry rates in the planning of flight testing.
Because stalling characteristics are a function of deceleration rate, it is
important to ensure that the deceleration rates used in certification testing of
aeroplanes are representative of the range of rates which may be met in
service. For microlight aeroplanes, the maximum anticipated deceleration rate
is that associated with a sudden loss of power following which the pilot
attempts to maintain altitude, sacrificing airspeed to do so. The deceleration
rate may be described by (2-27):-
+=
2
2
2
254.9
S
E
E
Sdind
V
V
V
V
Gdt
dV στ
Where dτ is a function of aircraft characteristics, but has a maximum value
given by (2-28);-
SW
d036.074.1 −=τ
6.2 Form of the O-A curve in Rogallo winged microlight aeroplanes.
For a conventional (Rogallo) flexwing microlight aeroplane, the stall speed
with wing loading, comprising the O-A curve within the classical flight
envelope (V-N) diagram has the form (3-2):-
A e
gM TOW
C
ZSOSN
MTOW
WVV
=
1.
This relationship may be used to modify VA and N1, so as to optimise
operating limits and structural lightness, without unacceptably degrading the
conservatism of structural reserve factors.
G. B. Gratton Airworthiness Evaluation Techniques for Small Light Aeroplanes
165
This form of the O-A curve is believed to be due to increased washout as wing
loading is increased (through increasing weight and/or increasing NZ).
Current facilities and available theory only permit determination of AeC for a
particular wing through flight testing.
6.3 Spinning evaluation of 3-axis controlled microlight aeroplanes.
A set of spin recovery actions, comprising:-
- Close throttle,
- Centralise primary flying controls,
- Wait for spin to stop,
- Roll wings level,
- Ease out of any ensuing dive, applying power as the level flight
attitude is reached,
is appropriate to a fixed wing microlight aeroplane which will be operated by
pilots lacking training in spin-mode recognition and recovery, and/or
availability of instrumentation which would assist in identifying spin direction.
Methods by which the suitability of these actions for an individual aircraft,
and the acceptability of that aircraft’s spinning characteristics are shown
within this thesis.
6.4 The tumble mode.
The tumble mode in a weightshift controlled microlight is sustained by
induced flow as an aircraft rotates in pitch about its CG. The mode may be
initiated by a rapid nose-down rotation of the whole aircraft rotating about its
CG; this being most likely to be caused by a loss of power in a steeply nose-up
pitch attitude, causing the rotation of the trike about the hangpoint to push the
wing nose-down, via contact of the front strut and basebar.

G. B. Gratton Airworthiness Evaluation Techniques for Small Light Aeroplanes
166
There are four known modes of tumble entry, through a whip-stall, rolling
departure in IMC, a failed aerobatic manoeuvre, or flight through the aircraft’s
own wake vortex. All of these are avoidable through good judgement on the
part of the pilot; however equally it is possible with the knowledge of these
entry mechanisms to avoid handling characteristics in a new aircraft design
which will tend to make the aircraft tumble prone.
Whilst the tumble is a potential “killer” mode in microlight aircraft, through
an understanding of tumble entry mechanisms in both pilot training, and in the
investigation of the handling characteristics of new types, it is possible to
avoid the tumble.
A tumble mode, related to that seen in weightshift controlled microlights, can
also occur in tailless rigid wing aircraft of any size, controlled using moving
control surfaces – most commonly in a nose-up pitching motion. Although
entered by different means, similarly to the weightshift tumble, this appears to
be self-sustaining. There is sufficient evidence presented to indicate that this
departure should be considered as part of the assessment of any such aircraft,
particularly if the aircraft is to be used in any mode requiring rapid
manoeuvring in pitch (e.g. display aerobatics, or as a fighter aeroplane).
.

G. B. Gratton Airworthiness Evaluation Techniques for Small Light Aeroplanes
167
7 Scope for further work in the fields of research described in this thesis.
7.1 Use of stall entry rates in the planning of flight testing.
Use of this work.
This work presents a tool by which the greatest deceleration rate in the event
of an inadvertent stall of a microlight aeroplane may be predicted. Since
existing test schedules for microlight aeroplanes already cover a range of
decelerations from 1kn/s to 5kn/s it is unlikely that test planning would
commonly be changed by this. However, it provides a tool by which the
validity of the test conditions, for a particular type, may nonetheless be
checked, and in this context usefully ensure the validity of test results in
ensuring the suitability of the aircraft for normal use.
Further research.
This work has potential to be adapted to other classes of lightweight aircraft –
for example to consider the immediate deceleration and consequent effects
upon rotor speed of a gyroplane following an engine failure, or to consider the
potential consequences of a launch-cable failure in a glider. It is very likely
that such further work will require the researcher to investigate the physical
significance of, and factors affecting the deceleration time constant, τ d .
7.2 Form of the O-A curve in Rogallo winged microlight aeroplanes.
Use of this work
The research presented shows a form of the O-A curve which may, at the
discretion of certification Engineers for particular projects, potentially be used
either to increase VA thus expanding the proven-safe flight envelope for a
flexwing microlight, to justify reduced normal acceleration limits thus
permitting reduction in structural weight, or potentially a combination of the
two.

G. B. Gratton Airworthiness Evaluation Techniques for Small Light Aeroplanes
168
Further research
Although the general mechanism of increasing washout under load is
understood – no rigorous aeroelastic model exists for a Rogallo type wing,
which would allow prediction of spanwise and chordwise shape and pressure
distribution. Such a tool might not only allow extrapolation of a valid O-A
curve with less flight test data than is currently required, but in modelling the
2-dimensional loading of the wing, would be valuable for designers attempting
structural optimisation and the maximum operating angle of attack (and thus
speed) range for new microlight and hang-glider wings.
7.3 Spinning evaluation of 3-axis controlled microlight aeroplanes.
Use of this work
The main content of this work has entered use as guidance and planning
material in the certification of microlight aeroplanes in the United Kingdom;
this has included acceptance of the “controls centralised” spin recovery.
Published guidance material [78] however, does not yet reflect the complexity
of some recently introduced types, and should be expanded as shown in Table
19 and the preceding text to include the added complexity of conducting spin-
testing of flapped aeroplanes.
Further research
Whilst the guidance developed during this research is appropriate to the
current types of microlight aeroplane being certified in the United Kingdom,
the standard of aircraft is not static. It is likely in the future that the range of
aircraft configurations will expand; this may for example include unswept
rigid weightshift microlights, multi-engined aeroplanes or aircraft with
retractable undercarriage – such aircraft already exist in other countries such
as Germany and the Czech republic [Error! Bookmark not defined.], where no
requirement for a spinning assessment exists. It is therefore important that as
either such aircraft are introduced into Britain, or conversely should
requirements for spinning assessment be introduced into countries using such

G. B. Gratton Airworthiness Evaluation Techniques for Small Light Aeroplanes
169
aircraft, the research is conducted to maintain appropriate guidance material.
Similarly, whilst there is a high confidence in the methods proposed, as
applied so far, it is important that this guidance is kept under continuous
review, so that confidence may be maintained in the method’s validity, or else
published best practice modified in light of lessons learned in future
programmes.
In addition, it has been noted during the course of this research that although a
great deal of published material exists concerning the geometry of the spin,
and a lesser amount exists (to which this research has added) concerning the
conduct of spinning assessments, very little analysis exists with regard to
prediction of either the spin-entry, or the spin recovery. A tool whereby spin
entry and spin recovery characteristics could be reliably predicted would be
both a new and original piece of work, and of enormous use throughout the
aircraft industry, reducing both risk and cost during flight test programmes.
The subject is commended to future researchers.
7.4 The tumble mode.
Use of this work
The primary use of this work has so far been, and is likely to continue to be,
education of microlight pilots in the avoidance of tumble entry mechanisms.
Through this alone however, it is hoped that lives will be saved through the
avoidance of future fatal accidents.
In addition however, the knowledge which has been developed of the tumble
entry mechanisms can also be used during the certification process for new
aircraft types to identify and solve any areas of tumble susceptibility. In
particular, determination of an operationally acceptable minimum full-power
climb speed (or maximum climb attitude) to ensure that the wing always leads
the trike during the stall event, and avoidance of strong spiral instability
should ensure relatively tumble resistant aircraft.

G. B. Gratton Airworthiness Evaluation Techniques for Small Light Aeroplanes
170
Further research
The wind tunnel results shown in Section 5.5 are the first laboratory-level
investigation of the flow affects around a tumbling aircraft; they are however
brief and leave considerable potential for future work. In particular, the true
3-dimensional flow affects are unknown, as are the effects of Centre of
Gravity (CG) position on the flow around an aircraft in the developed tumble
(i.e. whether the movement of CG from below the wing as in a microlight, to
within the wing, as in a flying wing aeroplane is significant, and if-so how).
There is also currently only limited understanding of the magnitude of
pitching moment during the tumble, or of the scale laws which might be
applied when converting between a wind tunnel model and various full-sized
aircraft.
This may be of particular significance for any future development of higher
aspect ratio flying-wing aircraft, of any size – as it has been shown that such
aircraft can tumble, and in some circumstances will also recover. This is not
well understood, but there is sufficient evidence to indicate that this
understanding should be developed as part of any new development of flying
wing aircraft – particularly those which may be flown aerobatically. This
significance is not only that of understanding the tumble entry resistance or
recovery, but equally importantly of determining the structural loads upon the
airframe during the developed tumble.
In summary, the work so far on the tumble mode whilst a considerable step
forward in understanding of the mode, can only be considered a beginning to
this subject, and there is considerable scope for future, useful, research.

G. B. Gratton Airworthiness Evaluation Techniques for Small Light Aeroplanes
171
8 Acknowledgements
No researcher in an established field, such as airworthiness, can or should
attempt to work in isolation. The researches which have led to this thesis are
no exception. Listed below are individuals without whose input, this work
would not have reached the current stage of fruition.
Name Position 8.1.1.1 Contribution
Brooks, Dr William Chief Test Pilot
(weightshift) BMAA,
Technical Director
Pegasus Aviation.
Discussions on flexwing
design and testing
Cardenas, Brigadier
General Robert L.
USAF, Rtd
Former USAF Test Pilot Discussions on loss of
control issues in Northrop
YB-49
Culling, Mr Stuart Senior Engineering
Inspector, AAIB (now
retired)
Assistance with, and
funding for, early tumble
investigations circa 1998.
Dale, Mr. Mark Technical Officer, BHPA Provision of BHPA test rig,
and assistance in it’s use,
for various flexwing tests
Dell, Ms. Liz Above all others, my long suffering partner and fiancé,
who has with remarkable patience, put up with my
spare time occupation of completing these Doctoral
studies over more than seven years.
Dewhurst, Mr. Paul Chief Instructor, Flylight
Airsports, and Test Pilot
& Senior Inspector,
BMAA
Thorough reporting of
numerous test programmes.

G. B. Gratton Airworthiness Evaluation Techniques for Small Light Aeroplanes
172
Name Position 8.1.1.1 Contribution
Dyde, Sqn.Ldr.
Simon
Former Test Pilot,
A&AEE
Assistance in the
development of spinning
methodologies during
testing of the Tucano T1
circa 1995
Farley, John Retired Test Pilot, writer Access to, and discussion
of, privately held historical
flight test records.
Finnigan, Lt Col.
(Rtd) Chris
Chief Executive, BMAA Allowing the facility for
research work within the
BMAA’s working
programme.
Finn-Kelcey, Mr
Nigel
Owner, Aviasud Mistral
G-MWIB
Use of his aircraft
Grimwood, Mr
Robert
Test Pilot, Flylight
Airsports
Thorough reporting of
iXess test programme
Hamer, Mr. John Test Pilot and Senior
Inspector, BMAA
Active participation in
numerous airworthiness
evaluation programmes.
Howes, Mr
Jonathan
Head, CAA Loads and
dynamics section.
Useful discussions on
structural implications of
airworthiness evaluation
methods.
Mulcahy, Capt.
Paul
Test Pilot, CAA
Formerly Test Pilot,
A&AEE
Close co-operation on
numerous flight test
programmes.
Newman, Dr.
Simon
Senior Lecturer,
University of
Southampton
Academic supervisor and
collaborator on analysis of
the tumble.

G. B. Gratton Airworthiness Evaluation Techniques for Small Light Aeroplanes
173
Name Position 8.1.1.1 Contribution
Pattrick, Mr. Roger Chief Designer, Mainair
Sports
Assistance in rig tests upon
several flexwings,
provision of F2a design
data.
Payne, Mr Alan Technical Administrator,
BMAA
Ensuring the smooth
progress of numerous
engineering programmes.
Porteous, Capt.
Tom
Chief Test Pilot (Fixed
Wing), BMAA and Chief
Test Pilot, Thruster Air
Services
Assistance in several
spinning test programmes.
Scott, Mr Philip Owner, HM1000 Balerit
G-MZIC
Use of his aircraft
Steele, Capt. Dick Owner, N3N-3 G-ONAF Assistance in obtaining
verified take-off and
landing performance data.
Stinton, Dr. Darrol Consultant, Author,
retired Test Pilot
Author of volumes on
aircraft design and testing,
and informal discussions on
the conduct of various test
programmes.
Venton-Walters, Mr
Roy
Formerly Chief Designer,
Southdown
Discussions concerning
stall characteristics of
flexwings.
Walsh, Ms Joan Engineer and Microlight
Pilot
Informal input into
discussion on mechanisms
of the tumble.

G. B. Gratton Airworthiness Evaluation Techniques for Small Light Aeroplanes
174
Name Position 8.1.1.1 Contribution
Welch, Mrs Ann, Writer; president, BMAA
and other organisations;
retired pilot. Deceased
December 2002.
Discussions concerning
wartime ferry flying and
1950s glider test flying.
Welsh, Dr. Paul Airworthiness Engineer,
Flylight Airsports Ltd,
Chief Designer, Bella
Aviation.
Discussions concerning the
tumble mode and
participation in flexwing
stall speed testing.
Appendix A – Other test techniques developed to assist in the investigation of aircraft
flying qualities.

Appendix A Other Test Techniques
175
APPENDIX A
OTHER TEST TECHNIQUES
DEVELOPED TO ASSIST IN THE
INVESTIGATION OF AIRCRAFT
FLYING QUALITIES.

Appendix A Other Test Techniques
176
Introduction
This appendix does not primarily concern the most significant safety issues
concerning microlight aeroplanes. However, much of the task of safety
assessment requires verifiable performance data. This is partly for the
purposes of operating data, and partly because this data is essential to the
conduct of a certification programme (to allow proper reporting, repeatability
and progression of test conditions). This section describes methods that have
been developed or refined during the period of this research for the purposes
of assessing microlight aeroplanes. Whilst they do not solve problems which
have not previously been soluble by other methods, they do offer methods for
the determination of aircraft performance which can be performed with less
manpower, cost and infrastructure than has traditionally been the case, whilst
ensuring an acceptable level of rigour. Specifically the methods developed
have been used to determine PEC (and in particular ASI errors, which are
most significant in microlight operations), take-off and landing performance
and spinning characteristics. The methods described have been specifically
developed to use with microlight aeroplanes, but they may equally be used
(albeit with consideration of the underlying assumptions and if necessary
amendment of the method) for other classes of aeroplanes.
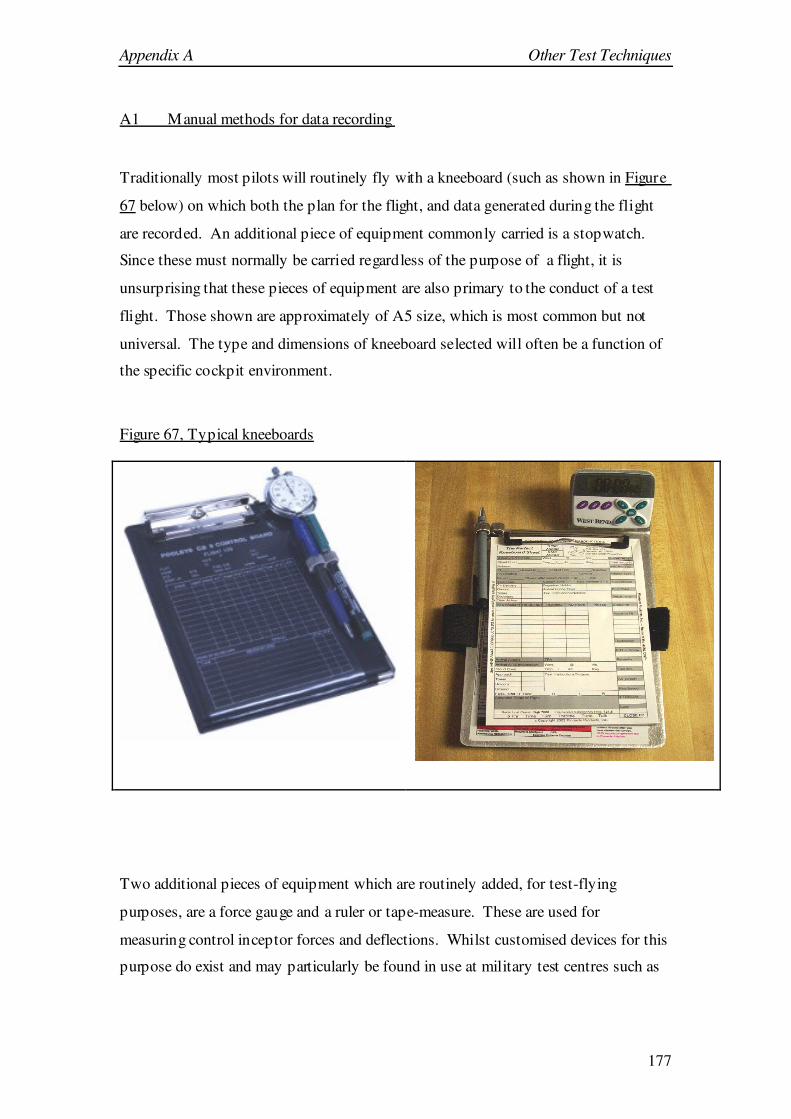
Appendix A Other Test Techniques
177
A1 Manual methods for data recording
Traditionally most pilots will routinely fly with a kneeboard (such as shown in Figure
67 below) on which both the plan for the flight, and data generated during the flight
are recorded. An additional piece of equipment commonly carried is a stopwatch.
Since these must normally be carried regardless of the purpose of a flight, it is
unsurprising that these pieces of equipment are also primary to the conduct of a test
flight. Those shown are approximately of A5 size, which is most common but not
universal. The type and dimensions of kneeboard selected will often be a function of
the specific cockpit environment.
Figure 67, Typical kneeboards
Two additional pieces of equipment which are routinely added, for test-flying
purposes, are a force gauge and a ruler or tape-measure. These are used for
measuring control inceptor forces and deflections. Whilst customised devices for this
purpose do exist and may particularly be found in use at military test centres such as

Appendix A Other Test Techniques
178
Boscombe Down, the majority of flight testing is conducted using a simple spring-
balance(Figure 68) and domestic tape measure.
Figure 68, Typical spring balance
Fundamental then to the testing process is the effective use of these simple tools.
Whilst there are obviously safety rules inherent to their use, these are within the
province of flight training and outside the scope of this appendix. However, a tool
whose use it is helpful to describe is the “test card”. Test cards are sheets of paper (or
card) developed by the test management team and carried in the air for the following
purposes:-
- Showing the aircrew the order and condition of tests (and other flight
actions such as positioning) required.
- Providing opportunity for manual recording of data (manual recording
of data is considered essential in all flight test activities, even where
automatic data recording is in use).
- Showing special checklists or safety data (such as provisional or
absolute operating limitations).
- Combining as much as possible of the information that the Test Pilot or
Flight Test Engineer will require in flight at a single source. (Thus
enhancing both efficiency and safety in the conduct of the test sortie.)
There are no firm and accepted rules concerning how test cards should be prepared.
In most civil flight testing (including that of microlight aeroplanes) they are usually
prepared by the Test Pilot, in most military aircraft testing they are prepared by the
Flight Test Engineer in consultation with the Test Pilot, whilst in major military
programmes (such as Eurofighter or F/A-22 [120]) they will be prepared by a
committee including all parties interested in the conduct of a particular sortie.
However, the general principles detailed above remain and the card must ultimately

Appendix A Other Test Techniques
179
remain useable by the crew for the intended purpose, which inevitably gives the
captain of the aircraft (the test pilot) ultimate control over their content.
In order to illustrate the use of test cards, below is described a typical test – that of
using test cards to determine the climb and glide performance of a hypothetical
aircraft type.
The first part of the determination of climb and glide performance is to determine the
speeds at which those performance values are determined. The method used for this
will be “sawtooth climbs” and “sawtooth glides”. The title of these manoeuvres
(usually flown together) implies a flightpath consisting of a number of steady
condition climbs and descents, following a flightpath as illustrated in Figure 69
below.
Figure 69, Illustration of sawtooth flightpath
It will be noted that although the individual segments nominally show a continuous
climb, the overall shape of the flightpath is uneven, obviously the climb and descent
angles will vary with airspeed, but also the lower and upper bounds of the sawtooth
will vary with operational necessity. What is critical is that the aircraft remains “on
condition” (constant speed and known weight) throughout pre-determined height
H2
H1

Appendix A Other Test Techniques
180
bands, shown here as H1 and H2. These two heights would typically (for a microlight
aeroplanes) be about 500ft apart although it is normal to make them further apart for a
higher performance (greater climb rate) aircraft, and closer together (perhaps 200ft or
even 100ft on occasion) for a very low performance (low climb rate) aircraft. This
test might be illustrated on test cards similar to that shown in
Figure 70 below – it will be noted that the cards below (which were originally used
for assessment of a Naval Aircraft Factory N3N-3 aircraft) allow the test crew
discretion concerning what heights and speeds are to be flown. This is normal since it
is not considered good practice to constrain the specific test conditions prior to flight;
a test pilot and/or FTE will make these decisions during the sortie dependent upon
local conditions. For example, heights must permit flight without intruding into IMC
conditions, controlled airspace, or transient meteorological conditions (e.g.
turbulence, updraft, downdraft or inversion) which might affect the test results, and it
is often necessary to determine the exact speeds (and conduct some limited analysis)
in flight so as to ensure that the maxima and minima of the climb/glide curves are
correctly identified – hence the inclusion of a simple graph pro-forma within the test
cards.
Figure 70, Typical test cards showing sawtooth climbs and glides

Appendix A Other Test Techniques
181
Once flown, this data must be analysed and reported. In Figure 71 and Figure 72
below is the plotted and analysed data obtained during this testing for issue of a public
transport certificate of airworthiness of this N3N-3 aircraft (extracted from reference
[121] but for details of the aircraft also see Section 0 in the main body of the thesis).
It should be noted that the sole purposes of these specific tests was to determine the
best climb and glide speeds, (which should not vary significantly with altitude or
weight) and not the absolute performance. Also, although the data plotted below
shows performance against Indicated Air Speed (IAS) analysis of climb and glide
gradients is of-course carried against TAS (True Air Speed), which in turn is a
function of IAS, the Airspeed Indicator (ASI) calibration curve (see section A2
below) and density altitude.
Figure 71, Analysed results of sawtooth climbs for N3N-3 aircraft
N3N-3 Climb performance
30
40
50
60
70
80
90
100
50 60 70 80 90
IAS, mph
Tim
e t
o c
limb
50
0 f
t, s
0.00
1.00
2.00
3.00
4.00
5.00
6.00
7.00
Clim
b a
ng
le, d
eg
ree
s
Angle
Time
This indicates that the best climb rate speed lies between 75 and 80 mph IAS. It also
indicates that the best angle climb speed lies at or below 60 mph IAS.

Appendix A Other Test Techniques
182
Figure 72, Analysed results of sawtooth glides for N3N-3 aircraft
N3N-3 Glide performance
30
35
40
45
50
55
60
65
50 60 70 80 90
IAS, mph
Tim
e t
o d
esce
nt
50
0 f
tm,
s
4.00
5.00
6.00
7.00
8.00
9.00
10.00
11.00
Glid
e r
atio
Ratio
Time
This indicates that the best glide angle speed lies at or below 60 mph IAS. Given that
the stall speed is 53 mph IAS, it was considered in post flight discussion that a
common best glide speed of 60 mph IAS should be used, and not any speed closer to
the stall, which it was considered would lead the aircraft into an unacceptable risk of
inadvertent stall (in addition the presence of pre-stall buffet commonly prevents the
pilot from obtaining good performance data at speeds close to the stall).
Following this analysis, the speeds determined are used to allow the aircraft to be
flown through a continuous long climb (or series of climbs, often on reciprocal
crosswind headings so as to negate any wind gradient effects), at a mass no less than
95% MTOW (a constraint imposed by best practice in ensuring that only small
corrections are made to MTOW, at which performance results are conventionally
quoted for smaller aeroplanes, and also the requirements of BCAR Section K [122]
which although technically obsolete is used throughout the UK industry and often
mandated by CAA as technical guidance).
Shown in Figure 73 are the analysed results for the N3N-3 previously described.
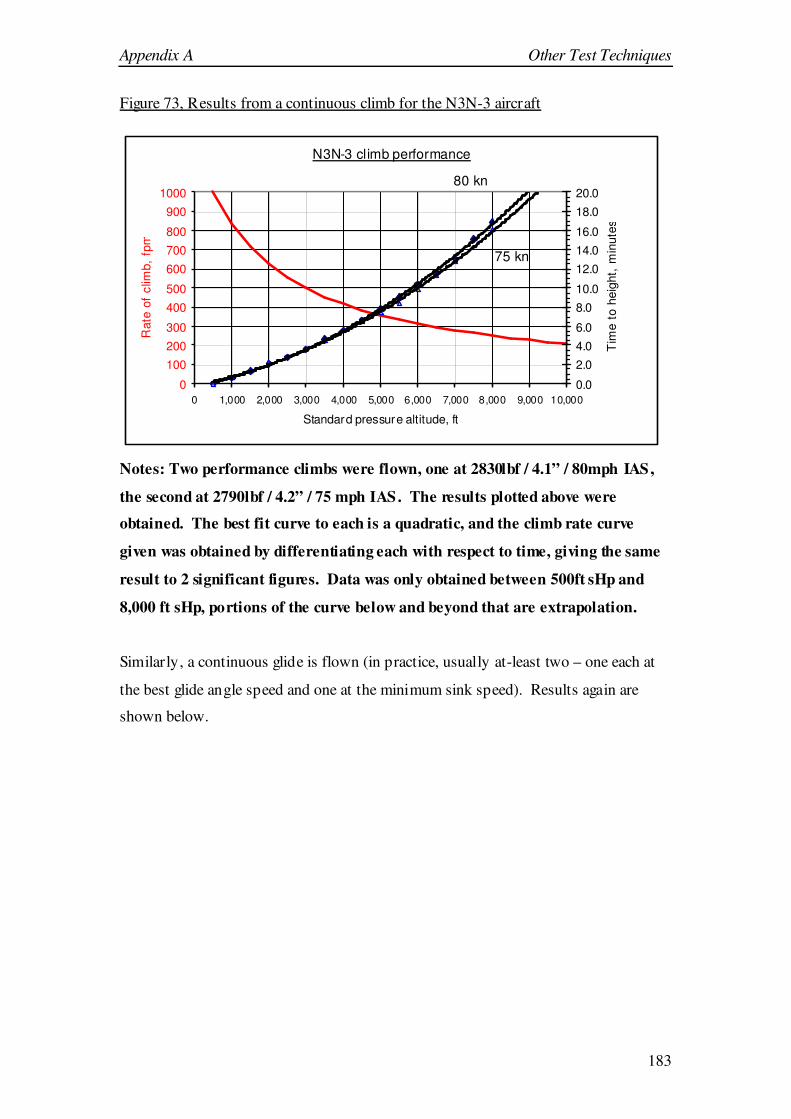
Appendix A Other Test Techniques
183
Figure 73, Results from a continuous climb for the N3N-3 aircraft
N3N-3 climb performance
0
100
200
300
400
500
600
700
800
900
1000
0 1,000 2,000 3,000 4,000 5,000 6,000 7,000 8,000 9,000 10,000
Standard pressure altitude, ft
Rate
of
clim
b,
fpm
0.0
2.0
4.0
6.0
8.0
10.0
12.0
14.0
16.0
18.0
20.0
Tim
e t
o h
eig
ht,
min
ute
s
80 kn
75 kn
Notes: Two performance climbs were flown, one at 2830lbf / 4.1” / 80mph IAS,
the second at 2790lbf / 4.2” / 75 mph IAS. The results plotted above were
obtained. The best fit curve to each is a quadratic, and the climb rate curve
given was obtained by differentiating each with respect to time, giving the same
result to 2 significant figures. Data was only obtained between 500ft sHp and
8,000 ft sHp, portions of the curve below and beyond that are extrapolation.
Similarly, a continuous glide is flown (in practice, usually at-least two – one each at
the best glide angle speed and one at the minimum sink speed). Results again are
shown below.

Appendix A Other Test Techniques
184
Figure 74, Results from two continuous long glides for N3N-3 aircraft
Actual long glide perform ance, N3N -3
0
2
4
6
8
10
12
14
010002000300040005000600070008000900010000
Standard pressure al titude, ft
Tim
e,
min
ute
s
Notes: Two continuous performance glides were flown at 60 mph IAS, from
above 8,000 ft sHp through 1000 ft sHp, the first was at 2,800lbf / 4.13”, the
second at 2780 lbf / 4.2”. The engine was warmed at approximately 1500ft
intervals. The following results were obtained. Of these, the poorer performance
is afforded by the lower line of the graph above, which reduces to a steady
descent rate of 580fpm or 8.6:1 at sea-level (improving to a ratio of 10:1 at10,000
ft).
Best climb rate speed is to be 80 mph IAS. This gives a climb rate at about 2800 lbf
which is represented by :
0008.0104
17
+×−
H. (A1-1)
It is necessary to adjust to MTOW. Climb rate is represented conventionally for a
piston-prop aircraft[123] by the following correction:

Appendix A Other Test Techniques
185
- W
VDP
dt
dH P...550 −
=η
(A1-2)
Where, H = altitude
t = time
P = Engine power output (in horsepower)
ηP = Propeller efficiency
D = Drag
V =True Air Speed
W = Weight
this, taking all others as fixed, shows rate of climb as being inversely
proportional to weight. Thus, the climb rate at MTOW, may be represented
by:
0008.0104
927.07
+×−
H (A1-3)
where 0.927 = 2080 lbf/3020 lbf. This could then be used to prepare a climb
rate graph for inclusion in the Pilots Operating Handbook (POH). Figure 75
Below shows an extract from the POH for the public transport version of the
N3N-3.

Appendix A Other Test Techniques
186
Figure 75, Climb performance section from N3N-3 operators manual (UK public
transport version)
Climb
The best climb-rate speed is 80 mph IAS. The graph below shows the climb
performance at this speed for given density altitudes at MTOW. To calculate the time
to climb between two heights, subtract the time at the lower height from the time at
the greater height. Climb performance will be no poorer at lower weights.
N3N-3 climb rate and time to height at MTOW
0
200
400
600
800
1000
1200
1400
0 2000 4000 6000 8000 10000
Density altitude, ft
Rate
of clim
b, ft/m
in
0
5
10
15
20
25
30
35
Tim
e to h
eig
ht, m
inute
s
Rate Time
Example shown, 7000 ft, climb rate is 240 fpm, time from sea-level is 17 minutes.
The speed for best climb angle is 63 mph IAS.

Appendix A Other Test Techniques
187
A2 Use of GPS for airspeed indicator calibration. (The racetrack method)
It is essential in all performance flight testing and much handling flight testing
to know accurately the relationship between Indicated Air Speed (IAS) and
Calibrated Air Speed (CAS). Historically, this relationship has been
determined by a series of methods, including trailing statics, range-course
methods, and tower flybys with high speed photography. All of these methods
have disadvantages, in that they can be inaccurate, expensive, or require
modification to the aircraft. The advent of inexpensive lightweight GPS
(Global Positioning System) units, with exceptionally good levels of both
precision (±1 metre in 3 dimensions) and accuracy (±15 metres in 3
dimensions) offered the potential for another method of determination. These
units (examples illustrated below) have become standard equipment for most
pilots, and thus are very readily available for any test programme.
Figure 76, Typical modern handheld GPS receivers

Appendix A Other Test Techniques
188
The method developed can be flown quickly; experience has shown that in
good conditions, a thorough calibration for a low speed aeroplane such as an
X’Air can be flown in as little as 30 minutes, or in poor conditions (such as
where there is localised turbulence, or airspace restrictions) perhaps an hour.
It may also be flown, if necessary, by a single pilot without any modification
to the aircraft or requirement for external data recording. Required are
turbulence-free conditions, accurate knowledge of outside air temperature, a
GPS unit, and approximate wind heading data. The latter can be obtained
from a meteorological office forecast, or readily estimated by any qualified
pilot using a pressure chart. (See figures below).
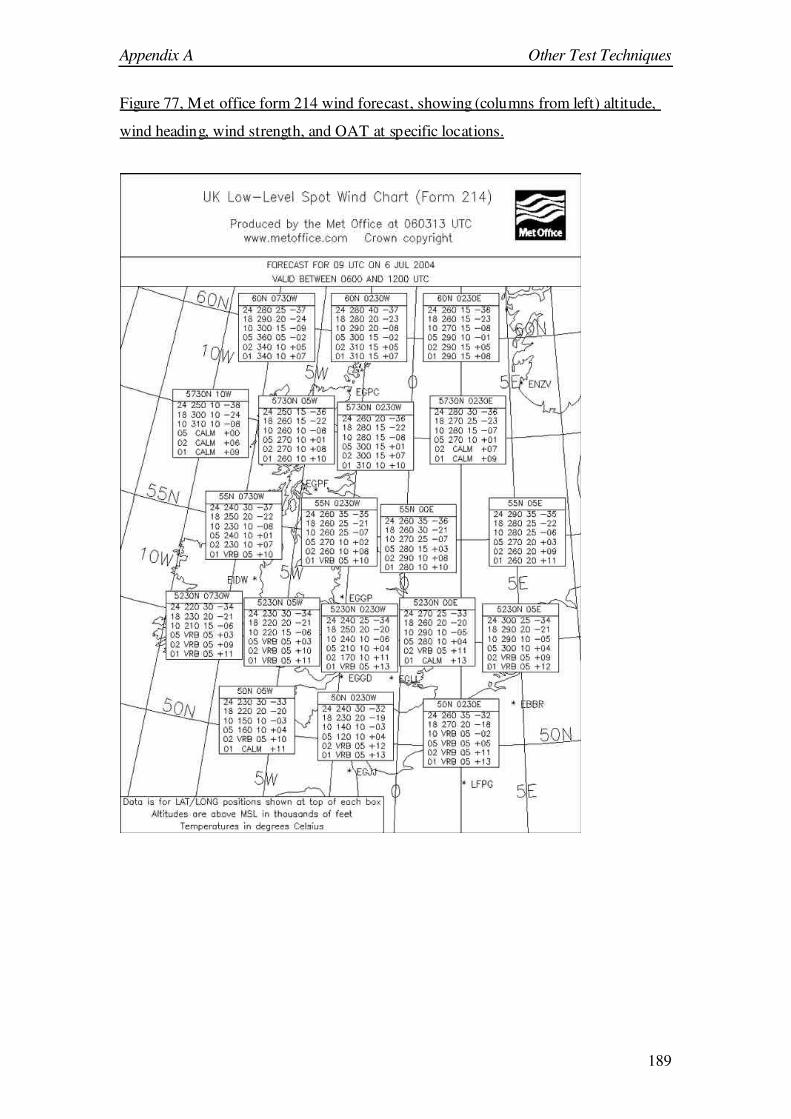
Appendix A Other Test Techniques
189
Figure 77, Met office form 214 wind forecast, showing (columns from left) altitude,
wind heading, wind strength, and OAT at specific locations.

Appendix A Other Test Techniques
190
Figure 78, Typical pressure chart (USAFE type)
The following method is used to obtain data:-
The aircraft is pointed as accurately into wind as the forecast will allow.
Precise wind heading is then obtained by varying heading slightly whilst
maintaining constant speed and height. The aircraft is known to be exactly
into wind when the lowest indication is obtained of GPS groundspeed. This
heading is noted.
The aircraft is flown at a range of speeds from just above the stall, to at-least
VH (often to Vne) with GPS groundspeed being noted against indicated
airspeed at each increment. Where the airspeed exceeds VH, and thus the
aircraft is forced to descend, the time between two heights (normally about
200 ft, greater altitude changes potentially causing significant changes in the
TAS:CAS relationship) is recorded to allow correction during subsequent
analysis.

Appendix A Other Test Techniques
191
The aircraft, maintaining a constant nominal height, is then turned (using GPS
so as to not be affected by any magnetic anomalies) onto a reciprocal heading,
and this exercise repeated. If necessary (limitations of available airspace tend
to control the flightpath) multiple turns are flown in a “racetrack” method as
indicated below.
Figure 79, Illustration of “racetrack” flightpath
Wind
Downwind leg
Into-wind leg
The data is then reduced, using a table such as that given below:-

Appendix A Other Test Techniques
192
Table 17, ASI calibration data reduction table
[Based upon reference [124].
IAS
(any unit)
GS
Into wind
(knots)
time per
200 ft (s)
Adjusted GS into
wind (knots)
GS
downwind (knots)
time per
200 ft (s)
Adjusted GS
downwind (knots)
TAS
(knots)
CAS
(knots)
(a) (b) I (d) (e) (f) (g) (h) (i)
( )
+
)(
1182
2
cb
( )
+
)(
1182
2
fe
from GPS
from stopwatch
or (b) if not descending
from GPS from
stopwatch
or (e) if not descending
( ) ( )2
gd + ( ) σ×h
30
40
etc.
σ , relative air density may be estimated from local OAT, pressure altitude, and ISA
tables.
Finally this data is plotted to produce an ASI calibration chart. A typical
example chart is shown below, for an X’Air Mk.1. Error bars are used,
typically of ±1kn or ±2 kn, depending upon the pilots opinion of the quality of
data recording during a sortie. Normally the line fit used is then the least
complex curve that fits within all the error bars. As will be seen below, the
degree to which a low (normally 1st or 2
nd) order curve may be fitted to
reasonably low value error bars is good. No attempt has been made to try and
fit any particular theoretical basis to these line fits, although it has been noted
that in most cases (including that shown below) ASIs fitted to this class of
aircraft will tend to underread at low speeds, overread at high speeds, and tend
to read approximately correctly at around 45-65 kn. It has been found
important, to use at-least 5 points, down to as near the stall as is reasonably
achievable (because of the likelihood of low-energy discontinuities, and hence
the desire to allow as little extrapolation into this potentially uncertain area as
possible). At higher speeds, discontinuities or significant changes of curve
form have not generally been noted above VH and this area can be treated with
less rigour.

Appendix A Other Test Techniques
193
Figure 80, Sample ASI calibration plot from GPS method
G-CCMK ASI Calibration (Quadratic best fit)
y = 0.007x2 + 0.5194x - 3 .4043
R2 = 0.994
0
10
20
30
40
50
60
70
80
90
100
110
120
0 10 20 30 40 50 60 70 80 90 100 110
kn CAS
kn
IA
S
A3 Alternative GPS based methods for ASI calibration: the triangular, and box-
pattern methods, also the non-GPS based ground course method.
An alternative method to the above is believed to have been used primarily by
pilots carrying out test flying on behalf of the Popular Flying Association
(PFA). This uses a similar means for groundspeed determination, but instead
uses three legs, separated by 120°. The “folklore” associated with this method
is that the mean of these three speeds will give the TAS. In practice this is
untrue since the losses of groundspeed due to crosswind factors will cause the
mean speed to be less than TAS (although trigonometry may be used to
correct this, see [125]). It is also an inefficient method since the time spent
flying an additional leg for each speed more than compensates for the time

Appendix A Other Test Techniques
194
spent accurately determining the wind heading. An additional consideration is
that continuously flying a triangular course with 120° between legs is an
internationally accepted procedure by which an aircraft which has suffered a
failure of radio and navigation equipment, indicates its need for assistance
[126] in the form of a “shepherd” aircraft. So, to fly a course which might
unnecessarily indicate distress to a radar controller, would be highly
irresponsible, particularly since the aircraft under test may well not be in
contact with that radar controller (particularly given that even during flight
testing, microlight aircraft rarely carry transponders which might display to a
controller whether the aircraft is, or is not, in any form of distress.)
A variant method was devised independently and published by J T Lowry
[127] and referred to as the “Box Pattern” method. This flies three legs at 90°
spaced magnetic headings (one being due North), and then by trigonometry
(reproduced below, using Lowry’s terminology) the TAS is determined at
each speed.
Three groundspeeds are recorded for each IAS value, these are g1 (flown
due magnetic North), g2 (flown on magnetic heading 90°) and g3 (flown on
magnetic heading 180°). Variables p, q, α used within the calculation have
no physical significance.
2
22
21 gg
p+
= (A3-1)
−
−−= −
2
1
2
3
23
21
221 2
tangg
gggα
(A3-2)
αcos4
21
23 gg
q−
=
(A3-3)
2
422
qppTAS
−+=
(A3-4)
VW, the wind strength, may be
determined as:- TAS
qVW =
(A3-5)

Appendix A Other Test Techniques
195
This is clearly demonstrated in the reference to be a valid method, the box-
pattern method uses three rather than two speeds (giving greater opportunity
for error in an individual datum to be reduced by calculation) and also does
not present the risk of inadvertently appearing to declare an emergency posed
by the triangular method, it is however considered less efficient than the
racetrack method for the following reasons:-
• Being reliant upon magnetic heading, the box-pattern
method requires a currently calibrated compass, which is
not a requirement of the racetrack method where GPS
headings are used. Most microlight aircraft, whilst fitted
with a magnetic compass, do not have them calibrated.
• Again, three legs are flown rather than two, so requiring a
greater minimum time to fly than the racetrack method.
• It is more efficient to make use of methods that can be used
unsupervised by pilots without deep technical training.
Any method which reduces the amount of calculation, and
thus potential for error introduction, is preferred.
A further variation upon this method was published by the National Test Pilots
School (NTPS) at Mojave, California in reference [128] and in turn appears to
be based upon reference [129]. This method is similar, but does not require
any of the headings to use any particular value. The strengths and weaknesses
applied to the method published by Lowry will also apply to this method
except that it is based upon GPS ground track (rather than compass heading)
and therefore any errors due to inaccuracies in the compass are eliminated.

Appendix A Other Test Techniques
196
The ground course method
The ground course method (also sometimes called the range-course or speed-
course method) is a variant upon (and predecessor of) the racetrack method
given above. Instead of using GPS to provide truth data, the aircraft was
flown overhead two points on the ground which were in-line with the wind
heading. This was used worldwide for many years, and prior to the advent of
GPS was one of only three common methods available (the others being a
trailing static and use of a chase aircraft with previously calibrated
instruments). It is mentioned here for completeness, and because it is
sometimes still used, primarily by test centres where it has become a familiar
tool. Assuming the availability of suitable landmarks and the guarantee of
empty airspace between them, this method has one major disadvantage. To
accurately time between points, it is necessary to fly comparatively low
(normally below 500 ft). Except in particularly unusual circumstances, such
as over open sea with no significant land masses for a considerable distance
into wind, air at this low level will be comparatively turbulent. This
turbulence makes accurate control over the aircraft difficult, and also can
cause fluctuations in pressure instrument readings. The consequence is greater
scatter in the data, requiring acceptance of either a lower confidence in the
results, or many tests at each condition to allow scatter to be reduced
sufficiently during data reduction.
The earliest known publication describing the use of the ground course
method is reference [130], which also shows the data reduction methods used
in this technique. Although clearly not a recent paper, the method published
therein is consistent with that used up until the advent of inexpensive GPS
units.

Appendix A Other Test Techniques
197
A4 Methodology for Spin-Testing of Microlight Aeroplanes.
Section 4 to this thesis describes the general philosophy and practice reached
in the course of this research concerning the spin-testing of microlight
aeroplanes. However, in practice, what is important to the Engineers and
Pilots conducting a spinning assessment is the minutiae of planning,
conducting and reporting a spinning trial. This section (based partly upon
reference [78] ) describes much of this important detail, additionally to which
several sample spinning test grids are presented, as are summaries of the
conduct and results of a number of spinning assessments carried out.
Executing a spinning trial
The worst case for both entry and recovery will normally be with the CG at its
aft limit. Therefore, tests shaded in the grids below should initially be carried
out at the forward CG limit, then mid CG and finally at aft CG before
progressing further. Later tests need then only be flown at aft CG. This
approach is time-saving but only valid because the worst case spin and
recovery are being sought out; trials of an aircraft to be approved for
deliberate spinning will necessarily be more rigorous in exploring every
possible combination.
Each spin mode should always be executed at least twice (once left once
right). However, more spins are often required simply to record everything –
see under “the flight” below.
If the testing is to be carried out by more than one pilot, the later pilot should
not launch straight into the most “high risk” areas of the programme already
flown, they should always repeat some of the more basic spins for
familiarisation first.
Depending upon aircraft, between 10 and 20 spins per flight is normal. The
deciding factor is a combination of available climb rate, and height loss per

Appendix A Other Test Techniques
198
spin; the greatest proportion of time during a spinning sortie is in the climb
before and between spinning, not the spins themselves.
Turbulence must be light or nil, to prevent inadvertent disturbance with the
stall.
There must be a clear horizon and clear sight of the ground. Without this, the
pilot lacks a clear visual reference during the spin or spin recovery.
It must be possible to climb to at least 5,000 ft (preferably higher) without the
cloud layers being such that there is any risk of descending through cloud or
losing a horizon reference.
Under no circumstances must spinning be carried out over any human
habitation. This is a requirement for safety to third parties.
If there is tolerance on the flying controls settings, the controls must be set to
give the lowest permitted range of movements. If the aircraft proves spin
resistant, this should be changed to the widest permitted range and the tests
repeated.
Because of the risk of engine failure during the spin, if an electric starter is
fitted it must be ensured that the battery is fully charged. An engine which
requires external action to start (for example by prop swinging) will
necessitate all spinning being flown in glide range of an airfield suitable for
landing and a radio powered independently of the engine driven power supply.
Because spinning tends often to be flown above broken cloud (in which case,
pilots will always enter spins above large “holes”) there is a significant risk of
a loss of locational awareness. For this reason use of a GPS or other radio
location device (e.g. a VHF radio incorporating a VOR receiver) has been
found highly advantageous.
Abandonment / BRS deployment criteria must be well understood and briefed
before the flight. A typical brief for a 7,000 ft spin entry might be a return to

Appendix A Other Test Techniques
199
standard entry and recovery if not recovered by 5,000 ft, door release (which
might assist spin recovery) by 4,000 ft, and abandonment at 3,000 ft.
Sample test grid – Simple flapless aeroplane
Table 18 was originally developed for use with the X’Air Mk.1 aeroplane
(See Appendix B9), but with slight modifications has proven suitable for other
types. Despite the relative simplicity of the aircraft and that the aircraft will
not be approved for deliberate spinning, a large number of spins (a minimum
of 48) are required, which with some repetition and a mean rate of 15 spins per
1 hour sortie, equates to around 5 flying hours to complete the spinning
assessment. Whilst progressing from initial quarter or half turn incipient spins
to a maximum of 2 turns, also both mishandled spins and mishandled
recoveries are flown. No more than one aspect of mishandling at a time is
considered – given that the spin entry itself may be considered in service to be
a result of mishandling, this is equivalent to the systems engineering
philosophy of considering the single or double failure case, but not greater
numbers of simultaneous failures (or in this case, simultaneous mishandling).
The shaded area of the grid indicates the range of spin entries which may be
attempted. The progression of test is that this section is attempted firstly at fwd
CG, then repeated at mid CG, then finally completed at aft CG. If after
completion of this section a spin has not been induced, and it is confirmed that
testing was carried out with the elevator set to give the greatest nose-up pitch
authority available, and rudder to give the greatest rudder authority available,
then the aircraft may be considered to be spin-resistant [131]. However, this is
extremely rare; in the course of this research the only aircraft found fully spin-
resistant was the 2-axis controlled HM1000 Balerit; if a spin has been
achieved, then the rest of the test-grid is completed.

Appendix A Other Test Techniques
200
Table 18, Test grid for a simple flapless aeroplane
No. turns Entry Mishandled Spin Mishandled recovery
Spin
No.
¼-½
turn
1 turn 2
turns
std
entry
Entry
from steep turn
½ in-
spin aileron
½ out-
spin aileron
Cruise
Power
Full
Power
Stick
held back
Full
power
Full
opposite rudder held in
(a) (b) I (d) (e) (f) (g) (h) (i) (j) (k) (l) (m)
#1 X X
#2 X X #3 X X
#4 X X #5 X X X
#6 X X X #7 X X X
#8 X X X #9 X X X
#10 X X X
#11 X X X #12 X X X
#13 X X X #14 X X X Minimum: 48 spins.

Appendix A Other Test Techniques
201
Sample test grid – High power flapped aeroplane.
The less simple 3-axis microlight aeroplanes, such as for example the Pegasus
CT2K (See Appendix B15), tend to combine relatively high power and wing
loading, with the use of high-lift devices (normally flaps) to bring Vso down
within the 35 kn CAS threshold required for certification.
For such an aircraft, a more complex test grid, is necessary, although in order
to keep the size of the test programme in proportion it becomes necessary to
pick a representative and “role relatable” sample of possible conditions, since
flying a full test grid, covering every conceivable condition, would be an
unnecessary programme expense; nonetheless, up to 80 spins is not unusual
for such a programme. The following, in a similar format, is an example,
which was used for flight testing of the Sky Ranger (UK) aircraft (in this case,
there is no “spin resistance” evaluation, since the aircraft was already known
to spin from data in other countries – although no formal evaluation had taken
place. However, repetition of tests 1-6. in a similar manner to that shown in
Table 18 above was used as indicated to move from the initial “safer” forward
CG position, towards the aft position where the majority of testing was carried
out.

Appendix A Other Test Techniques
202
Table 19, Test grid for a simple flapped aeroplane
Configuration No. Turns Entr y Spin Mishandling Recover y
Mishandling
CR TO L 1 2 Std Turn ½ in-spin
ailer on
½ out-spin
ailer on
Cruise
Power
Max Cont. Power
Stick held back
Full powr
Full oppos
ite rudder held
in
#1 X X X X
#2 X X X X
#3 X X X
#4 X X X X
#5 X X X X
#6 X X X
#7 X X X X
#8 X X X
#9 X X X X
#10 X X X X
#11 X X X X
#12 X X X X
#13 X X X
#14 X X X
#15 X X X
#16 X X X
#17 X X X
Equipment required during spinning trials.
The following have been found useful and are recommended equipment for
any pilot / FTO engaged in spin testing. Some parts of this list are normal
flight equipment in any case, others are intuitively less obvious.
A kneeboard. This is for purposes of both data recording and informing the
pilot of the order of tests – it is vital that all planning is completed on the
ground. A particular format of test card has been found particularly useful in
addition to this, an example of which is shown in Figure 81.

Appendix A Other Test Techniques
203
Figure 81, Sample kneeboard test card for spinning tests
Falcon 2 Spinning Flight: 3333 No: 5 .
Dewhurst / Gratton 5/6/99 Dewhurst / Gratton 5/6/99 Dewhurst / Gratton 5/6/99 Dewhurst / Gratton 5/6/99
Fuel: 45 L Weight : 420 kg CG:MID
Vs: 23 kn Vne: 92 kn Max 6,800 rpm
Mode: Left / Right
Entry: Standard / 60° turn
Power: Idle / Cruise (5,000) / Max
No. Turns: ½ / 1 / 2
Recovery: Central / Opposite rudder
h1: 6,700 h2: 5,800 (1013 set!)
time of spin: _________
time to recover: 4 s.
actual Vs: __________
Comments
ABOUT 5 daN FWD STICK FORCE
NO TENDENCY TO REVERSE SPIN ABOUT 3g IN RECOVERY
A standard card like this can be very useful, reproduced in a photocopier and then altered by
hand for each test point. Always fly with spares.
Text and spaces kept large
Basic limitations are useful
Use of standard lists to prevent
omissions.
It isn’t possible to to get all the
data each spin. Test repetition
is often necessary.
Room left for comments.
A voice recorder. The easiest way to do this is to use a small sound recorder
attached to a small microphone or magnetic coil pickup inserted inside the
earpiece of the pilots helmet or headset.
A stopwatch. Perception of time during a spin by pilots and observers is very
unreliable, and a stopwatch allows reasonable determination of the duration
and rate of spins.
A fuel burn .v. W&CG plot for the aircraft as it will be flown. This allows
determination of weight and centre of gravity for each test point, and
inadvertent excursions beyond the normal safe iterative progression of test can
be avoided.
A radio. This is for two reasons; firstly large and rapid changes in height can
create a hazard to other air traffic, and thus other airspace users should be
informed via ATC. Secondly, engine failures during the spin are not

Appendix A Other Test Techniques
204
uncommon, particularly with the non-aerobatic engines normally fitted to this
class of aircraft. Thus, the risk of a need to “land-out” and possibly request
assistance in recovery of the aircraft should be accounted for.
A hard shelled helmet. Although, in general, spin characteristics of
microlight aircraft are non-oscillatory, some can be, and head injuries possibly
incapacitating the pilot, can result. (Notwithstanding this recommendation,
some aircraft have proven not to have enough cockpit room for a helmet, and a
degree of risk may need to be accepted in the name of pragmatism).
A four or five point harness, a 3 point harness or lapstrap is not sufficient.
This is for similar reasons to the requirement for a hard-shelled helmet above,
and also because lateral accelerations tend often to try and force the pilot
sideways from his seat; this can restrict his or her ability to properly control
the aircraft unless fully restrained.
A g-meter (it is not unusual for the normal acceleration limit to be approach
or occasionally exceeded during spin recovery, particularly with power)
located in the cockpit as near as possible to the CG.
Some assessors [132] have found that a small video camera, mounted in the
rear of the cockpit and showing the “forward view” and main instruments is
helpful as an aid to later analysis. This must, be well secured and able to
withstand at least 9g forward load, 4.5g downward load and 3g sideward load.
(These are standard crash-integrity loads contained within BCAR Section S).
Experience has not shown that force gauges and tape measures are particularly
useful during spin testing.
This is in addition to all normal flight equipment and either personal
parachutes or a Parachute recovery system fitted to the aircraft (reference
[133] also see Figure 82). If personal parachutes are to be used, the crew
must satisfy themselves that they can exit the aircraft if required, and practice
this on the ground.
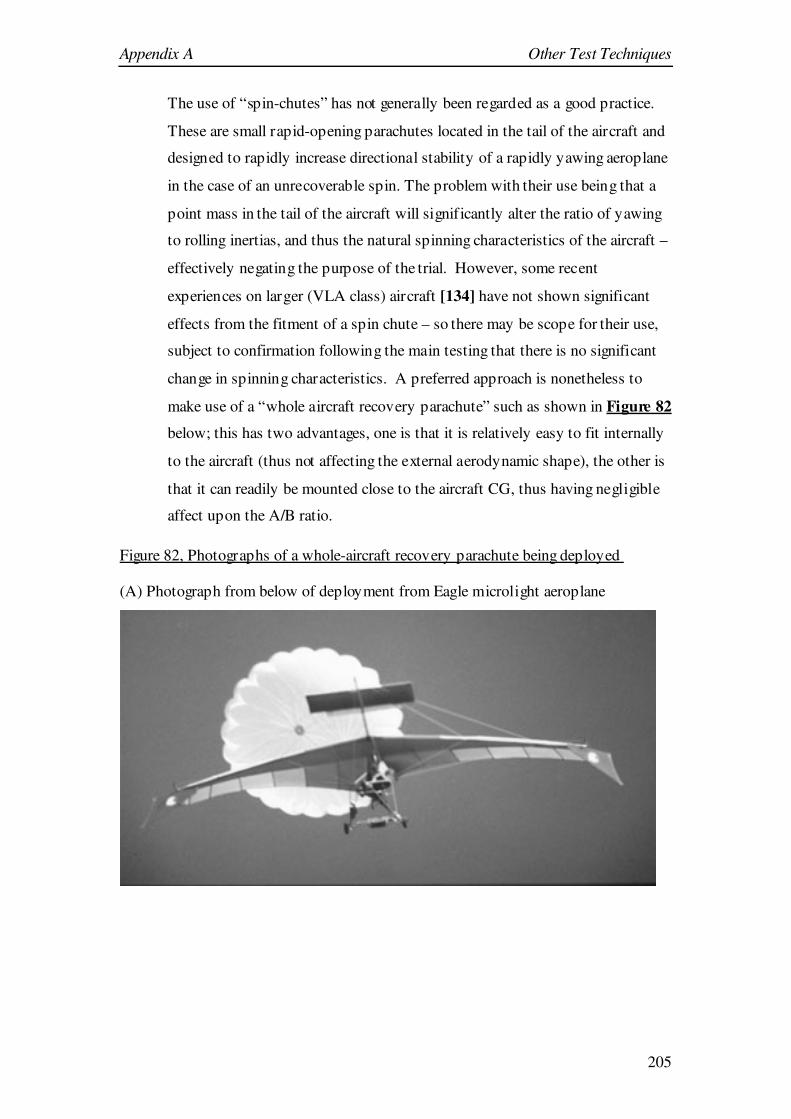
Appendix A Other Test Techniques
205
The use of “spin-chutes” has not generally been regarded as a good practice.
These are small rapid-opening parachutes located in the tail of the aircraft and
designed to rapidly increase directional stability of a rapidly yawing aeroplane
in the case of an unrecoverable spin. The problem with their use being that a
point mass in the tail of the aircraft will significantly alter the ratio of yawing
to rolling inertias, and thus the natural spinning characteristics of the aircraft –
effectively negating the purpose of the trial. However, some recent
experiences on larger (VLA class) aircraft [134] have not shown significant
effects from the fitment of a spin chute – so there may be scope for their use,
subject to confirmation following the main testing that there is no significant
change in spinning characteristics. A preferred approach is nonetheless to
make use of a “whole aircraft recovery parachute” such as shown in Figure 82
below; this has two advantages, one is that it is relatively easy to fit internally
to the aircraft (thus not affecting the external aerodynamic shape), the other is
that it can readily be mounted close to the aircraft CG, thus having negligible
affect upon the A/B ratio.
Figure 82, Photographs of a whole-aircraft recovery parachute being deployed
(A) Photograph from below of deployment from Eagle microlight aeroplane

Appendix A Other Test Techniques
206
(B) Photograph from above of deployment from Cessna 150 light aeroplane
Photographs above courtesy of BRS Inc.

Appendix A Other Test Techniques
207
Summary of results from test programmes.
Numerous test programmes have been flown since a spinning evaluation
became mandatory in the United Kingdom on new microlight aircraft types.
Since spin testing up until that change in requirement was an unknown factor,
the microlight flight testing community under technical leadership of the
author has shared data and aimed to achieve a common approach and level of
rigour in this testing.
Results from several test programmes upon representative aircraft are given in
the table below.
Table 20, Summary of known spinning test results
Type: Easy Raider (Jabiru
2200 engine)
Tests Conducted By:
BMAA
No. Spins Flown: 24
Entries examined: Standard, turning (x configs CR, TO (15°Flap), LAND (40° Flap)
Power settings considered: Idle, PLF, MCP
Spin mishandling considered: in-spin aileron, out-spin aileron
Basic spin recovery: Centralised.
Mishandled recovery cases considered: None.
General points of interest: Reduction in power prior to recovery from power-on
spins, caused a marked nose-down change in apparent attitude.
Where flap was selected during the spin, although it did not impede recovery, it was
found necessary to raise the flaps immediately after recovery so as to avoid exceeding
VF during the resultant spiral dive.

Appendix A Other Test Techniques
208
Type: Escapade
(Tailwheel, Jabiru 2200
engine)
Tests Conducted By:
BMAA
No. Spins Flown: 60
Entries examined: Standard, turning (x configs CR, TO (15°Flap), LAND (40° Flap)
[All with doors on and off].
Power settings considered: Idle, PLF, MCP
Spin mishandling considered: in-spin aileron, out-spin aileron
Basic spin recovery: Centralised.
Mishandled recovery cases considered: Opposite rudder, stick held back, full power
General points of interest: With in-spin aileron aircraft recovered immediately to a
spiral dive. Back-stick recovery was immediate but accompanied by rapid pitch-up.
Power-on during recovery did not delay recovery but caused aircraft to approach VNE
or VFE during pull-out. Doors did not significantly affect spinning characteristics, but
did markedly change cockpit environment during the spin. Use of opposite rudder
recovery caused large yawing motion in direction of rudder application accompanied
by severe pitch up. Tailwheel results were read-across to nosewheel aircraft without
further testing.
Type: Murphy Maverick Tests Conducted By: PFA No. Spins Flown: 42
attempts
Entries examined: Standard, turning
Power settings considered: Idle, PLF, MCP
Spin mishandling considered: Aircraft would not establish a developed spin,
therefore no cases could be attempted.
Basic spin recovery: Centralised.
Mishandled recovery cases considered: Stick held back, pro-spin rudder kept in.
General points of interest: Aircraft’s stall was indicated by a coupled roll:yaw
oscillation before full back-stick, with no pitch break and full control in all axes (other
than the oscillation) remaining.

Appendix A Other Test Techniques
209
Type : MXP740 Savannah Tests Conducted By:
BMAA
No. Spins Flown: 30
Entries examined: Standard, turning
Power settings considered: Idle, PLF, MCP
Spin mishandling considered: Ailerons (½ in-spin, ½ out-spin)
Basic spin recovery: Centralised.
Mishandled recovery cases considered: Opposite rudder,
General points of interest: Would only spin with power selected and closing the
throttle always caused recovery to a spiral dive.
Type: Thruster T600N
(Jabiru engine)
Tests Conducted By:
Thruster Air Services
No. Spins Flown: 72
Entries examined: Standard
Power settings considered: Idle, PLF
Spin mishandling considered: in-spin aileron, out-spin aileron
Basic spin recovery: Throttle closed, controls centralised
Mishandled recovery cases considered: None.
General points of interest: Aileron tended to affect rate of descent, from 30A5-400
ft for 1-turn + recovery with in-spin aileron, 40A5-500ft with ailerons neutral, and
50A4-100ft with out-spin aileron.
Aircraft would not spin to the left, left entries resulted in an immediate spiral dive.
Type: X’Air Mk.1 (Rotax
582 engine)
Tests Conducted By:
BMAA
No. Spins Flown:32
Entries examined: Standard entry, turning entry.
Power settings considered: Idle, PLF, MCP.
Spin mishandling considered: Power only.
Basic spin recovery: Controls central, throttle closed
Mishandled recovery cases considered: Opposite rudder, throttle closed.
General points of interest: At fwd CG / idle the aircraft displayed what was termed
a spin, but was probably a forced yawing motion, at about 8 seconds per revolution,

Appendix A Other Test Techniques
210
this was sometimes accompanied by a 2A5-40° / 3-4s pitch oscillation. With
increased power and further aft CG the aircraft was more ready to spin, but always
then self-recovered to a spiral dive within 1½ turns.
Type: X’Air Mk.1 (Jabiru
2.2L engine)
Tests Conducted By:
BMAA
No. Spins Flown: 26
Entries examined: Standard, turning
Power settings considered: Idle, PLF, MCP
Spin mishandling considered: Ailerons (½ in-spin, ½ out-spin)
Basic spin recovery: Centralised.
Mishandled recovery cases considered: pro-spin rudder, PLF remaining, stick kept
aft
General points of interest: Very slow (8-9 secs per turn), every recovery action led
to a spiral dive.
Type: X’Air Mk.2 (Rotax
912 engine)
Tests Conducted By:
BMAA
No. Spins Flown: Approx.
50
Entries examined: Standard, turning. (Crossed against configs CR, TO, LAND,
flaps were not retracted during recovery).
Power settings considered: Idle, PLF, MCP
Spin mishandling considered: ½ in-spin aileron, ½ out-spin aileron,
Basic spin recovery: Controls centralised
Mishandled recovery cases considered: Stick held back, power left on, opposite
rudder held in.
General points of interest: At fwd CG aircraft refused to enter a spin, at mid it
would do so, but tended to self-recover within 1 turn into a spiral dive. At aft CG,
recovered to a spiral dive immediately upon recovery action.
Increased power tended to increase the rapidity of entry. In-spin aileron increased the
rotation rate and apparent stabilised speed. Out-spin aileron slowed the rotation rate
(to about 10s per turn) and gave a slowed apparent stabilised speed.
Flap setting had no apparent effect on spin mode or recovery, but reduced height loss
per turn from about 400ft to 250ft. Care was required however to avoid exceeding VF

Appendix A Other Test Techniques
211
during the recovery.
Type: HM1000 Balerit Tests Conducted By:
BMAA
No. Spins Flown: 12
Entries examined: Rudder (Yoke) doublets at low speed, stalls off shallow and steep
turns,
Power settings considered: Idle, PLF, Full Throttle
Spin mishandling considered: -
Basic spin recovery: -
Mishandled recovery cases considered: -
General points of interest: The aircraft, which uses “Flying Flea” style 2-axis
controls proved wholly spin-resistant.
Type: Sky Ranger 912 Tests Conducted By:
BMAA
No. Spins Flown: 89
Entries examined: Standard, turning. (Crossed against configs CR, TO, LAND,
flaps were not retracted during recovery).
Power settings considered: Idle, PLF, MCP
Spin mishandling considered: ½ in-spin aileron, ½ out-spin aileron,
Basic spin recovery: Controls centralised
Mishandled recovery cases considered: Stick held back, power left on, opposite
rudder held in.
General points of interest: Controls centralised recovery was effective in every
case; however, where the stick was held fully back (mishandled recovery case), the
recovery was delayed by a further ¼-½ turn at about 60°/s (reduced rotation rate)
unless some opposite rudder was applied.
The data above, summarising as it does the results and conduct of a large
number of spinning trials, allows the validity of the method given to be
assessed. Any such assessment is inevitably incomplete, since there is no
guarantee that a more thorough assessment would not have caused a problem

Appendix A Other Test Techniques
212
within the spinning characteristics to be revealed. However, based upon the
above data and subsequent operating experience of all of these types once
certified, evidence so far is that the method proposed and used was a success.
Specifically:-
• No spinning related accident (causing damage to an aircraft or
injury to a crewmember) occurred during any of these test
programmes.
• All of these test programmes were completed in at-most 3 working
days, and none required any permanent modification to the aircraft
in the form of the fitment of trials equipment.
• In each case the “controls centralised” spin recovery actions were
effective with 100% success.
• None of these types have suffered any reported spinning accident
in subsequent service.
Reporting the results for a spinning trial on an aircraft not intended for
aerobatic operation.
Spinning results (similarly to spinning test plans) are particularly well suited
to tabular presentation. It has been found by experience that spinning reports
best present most information as tables, with prose only being used to describe
any handling peculiarities, and conclusions and recommendations.
The most important part of the report is however the recommendations. This
will comprise two parts:-
The aircraft recommendations.
The report must state (and support this statement) whether or not the aircraft is
acceptable for use as a microlight aeroplane with regard to its spinning
characteristics and compliance with BCAR S221. It is assumed in this context
that the final form of the report will consider that the aircraft is acceptable.

Appendix A Other Test Techniques
213
The manual recommendations
Since the aircraft has been spun, and the spin and recovery characteristics in
the final modification state satisfactory, it is necessary to introduce advice into
the operators manual about the spin. Bearing in mind that the aircraft is not
cleared for deliberate spinning, this wording must be carefully constructed to
be sufficiently clear to a pilot with no spinning experience, yet not give the
impression that he or she should ever attempt to spin the aircraft. Therefore,
the assessing pilot or engineer should recommend in their report, words to be
included in the operators manual. These words should be brief but include:-
- A warning that deliberate spinning is prohibited.
- Guidance on how to recognise a spin should one occur.
- A clear explanation of the spin recovery actions, and
what should then occur.
- Instructions on what the pilot should do after recovery
from the spin.
Excerpt from approved operators manual (Raj Hamsa X’Air Mk.1).
Departures from Controlled Flight.
The Spin. Deliberate spinning of the X’Air is prohibited. However, it is
possible through mishandling of the aircraft to inadvertently enter a
spin, either through stalling the aircraft in a turn, or by failing to keep
the rudder pedals straight at the point of stall. Should this happen, the
spin can be seen by a steep nose-down pitch attitude (about 45° nose
down) and the aircraft yawing to one side or the other, some higher than
normal ‘g’ forces may also be experienced. Should this occur, close the
throttle and centralise the stick and rudder pedals immediately. The
aircraft will stop turning almost immediately and return over about 5
seconds to a normal glide attitude, from which normal flight may be
resumed.

Appendix A Other Test Techniques
214
Other Departures. Other departures from controlled flight are likely
either to be due to damage to the aircraft, or hazardous flying
conditions. In either case, land as soon as possible and examine the
aircraft, particularly the flying controls, for any damage..
A5 A timed method for the conservative estimation of take-off distances,
eliminating the requirement for external measurement devices.
This method divides the take-off into three distinct segments, the initial
ground roll, the post-rotation ground roll, and the climb to screen height. It is
based upon times and speeds and does not directly measure distances.
Heights are measured by an observer in the aircraft using a sighting device to
the edge of the runway – this relies upon the pilot holding the centreline
accurately, and accurate knowledge of the height of the observer above the
wheels, location relative to aircraft lateral centreline, and runway width.
Since the only height required is the screen height, the device can be as
straightforward as a single mark upon a strut or canopy, although two marks
in-line or a wire frame have proven most useful.
Complying with normal certification practice, which requires at least 6 data
points [135], a minimum of 7 take-offs are carried out, and the results (times,
speeds) tabulated. The least favourable 6 results will be taken, a mean of each
time and speed value used, then distances calculated as shown below.
The following assumptions are made in this method:-
• During each segment, aircraft acceleration / deceleration is constant.
• Surface wind is constant between ground and screen height.
• During the air segment, the aircraft climbs in a straight line between
the unstick point and screen height (for microlight aircraft particularly

Appendix A Other Test Techniques
215
this is a reasonable assumption, since the initial climb condition is
established within 5-10ft of the ground, which is small within the 50ft
climb to screen height).
• The following notation is used. Speeds at start, rotate, unstuck and
screen height are 0, V1, V2, V3 respectively. These are known in TAS
by reduction from IAS values using determined PEC. Surface wind is
VW and is positive when a headwind. Times of each segment are t1, t2
,t3. Note that if the aircraft has a veryshort distance from rotation to the
unstick point (such as a taildragger taking off in a 3-point attitude),
then t2=0, V1=V2 and the method is reduced to 2-segments. Lengths of
each segment, measured along the ground, are S1, S2, S3. Straight line
distance from unstick to top of screen = S’3. Accelerations during each
segment are a1, a2, a3. a3 is acceleration along flightpath, not along the
ground. Screen height is h. For calculation, all the above will be in
consistent SI units (m, ms-1
, s).
Figure 83, Illustration of take-off segments
To determine actual length of first (pre-rotation) ground roll segment:-
Assuming that the aircraft is
initially stationary
2
111½ taS =
(A5-1)
Vw
t=0 a1 V1, t1 V2, t2
V3, t3

Appendix A Other Test Techniques
216
1
11111
t
VVataVV W
W
−=∴=−
(A5-2)
Inserting (A5-2) into
(A5-1): ( )WVV
tS −= 1
11
2
(A5-3)
To determine actual length of second (post rotation) ground roll segment.
( ) 222212 ½ tatVVS W +−=
(A5-4)
( )
2
1222212
t
VVataVVVV WW
−=∴+−=−
(A5-5)
Inserting (A5-5) into
(A5-4) ( ) 2
2
2
12212 ½ t
t
VVtVVS W
−+−=
( ) 2
1221
2t
VVtVV W
−+−=
=
−
+WV
VVt
2
122
(A5-6)
To determine actual length of air segment.
−
+= WV
VVtS
2
233
\3
(A5-7)
But by Pythagoras: 22\33 hSS −= (A5-8)
And inserting (A5-7) into (A5-
8) 2
2
23233
2hV
VVtS W −
−
+=
(A5-9)

Appendix A Other Test Techniques
217
Total take-off distance to screen height, in actual conditions, is then S1+S2+S3,
as determined above. Adjustments to standard conditions may be made using
the usual variance factors [136].
However, this method does not take account of the errors which inevitably
will exist in the variables. It is assumed that each of these factors are accurate
to within the precision of recording (which is normally done manually,
preferably by a Flight Test Observer (FTO) or exceptionally by the Test Pilot
themselves). These precisions are usually taken to be ±1second for all time
measurements, and ±1 ms-1
(about 2 knots) for all speed values including the
headwind component. It is assumed that the height is correct, and that any
errors in determining time to height are time errors alone. Using this, it is
possible to conduct an error analysis starting with the following equation,
which sums (A5-3), (A5-6) and (A5-8) above.
( ) +
−
++−= WW V
VVtVV
tS
22
1221
1 2
2
2323
2hV
VVt W −
−
+.
(A5-10)
Taking partial derivatives with respect to each component of (A5-10) in turn,
the following series of factors are obtained.
2
1
1
WVV
t
S −=
∂
∂ (A5-11)
WVVV
t
S−
+=
∂
∂
2
12
2
(A5-12)
( ) ( )( )( )
2
2
2323
3222
323
3
2.4
4
hVVV
t
VVVVVVt
t
S
W
WW
−
−
+
+−++=
∂
∂ (A5-13)
2
21
1
tt
V
S +=
∂
∂ (A5-14)

Appendix A Other Test Techniques
218
( )
2
2
2323
23232
2
2.4
2
2
hVVV
t
VVVtt
V
S
W
W
−
−
+
−++=
∂
∂ (A5-15)
( )
2
2
323
2323
3
2.4
2
hVVV
t
VVVt
V
S
W
W
−
−
+
−+=
∂
∂ (A5-16)
( ) ( )
++
−
−
+
−+−=
∂
∂
2
2.2
2 21
22
2
2323
2323 tt
hVVV
t
VVVt
V
S
W
W
W
(A5-17)
The estimated error due to each individual component will be the factor of that
component’s assumed error and the take-off distance’s partial derivative with
respect to that component. However it is also normal practice, based upon the
assumption that errors are normally distributed, that the total error may be
taken to be the square root of the sum of the squares of errors [137]. Thus, in
any individual test, the estimated maximum error may be taken as.
2
22
3
3
2
2
2
2
1
1
2
3
3
2
2
2
2
1
1
∂
∂+
∂
∂+
∂
∂+
∂
∂+
∂
∂+
∂
∂+
∂
∂
W
WV
SV
V
SV
V
SV
V
SV
t
St
t
St
t
St
(A5-18)
(Note: combination of errors. Justifying the approach taken above, it is
assumed that all errors, e are independent and follow a normal (Gaussian)
distribution, with a mean of zero and variance 2σ , then the sum of errors
∑ += neeee ...21 is itself normally distributed with a mean of zero and a
variance of ∑σ2
n . This means that the standard deviation, which is
proportional to the total error is defined by ∑= σσ22
n . Written otherwise, this
may be stated as Total error = 22
2
2
1 ...n
eee ++ which has an identical form

Appendix A Other Test Techniques
219
to (A5-18) above. Further examples of this method of combination of errors
may be found in reference [138] )
So, for a conservative analysis, the take-off distance should be calculated as
shown in (A5-10) above. Then, the maximum error should be calculated,
using (A5-18) and estimates of the accuracy to which each value was
measured, and this added to the estimate for take-off distance. This sum, may
then be used as a planning take-off distance value, with high confidence that
the actual distance required is no greater than that.
Use of this may be demonstrated using the following worst 6 results for flight
tests carried out for an increase in MTOW for the HM1000 Balerit aircraft
[139]. The results (using a 2-segment method) were as follows:-
Table 21, Take-off test data for HM1000 Balerit at 420kg.
No.� 1 2 3 4 5 6
t1 11 15 15 12.5 14.5 13.5
t3 7.5 9 5 6 4.5 4.5
V2, mph IAS 55 55 51 52 58 53
V3, mph IAS 47 47 50 50 50 50
V2, kn CAS (ms
-1 CAS)
47 (24.2)
47 (24.2)
46 (23.6)
46 (23.6)
49 (25.2)
48 (24.7)
V3, kn CAS (ms
-1 CAS)
43 (27.2)
43 (27.2)
45 (23.1)
45 (23.1)
45 (23.1)
45 (23.1)
Mean time to unstick= 13.6 s
Mean climb time = 6.1 s Mean unstuck speed = 24.3 ms
-1
Mean screen speed = 24.5 ms-1
Screen Height = 15m
Surface wind – negligible.
From (A5-10), the take-off distance is calculated (normally using a
spreadsheet programme such as Microsoft Excel) to be 313m of which 165m
was ground roll, and then using (A5-18), the maximum error is calculated to
be 30m (or ±16%). Assuming that the worst case error applies, the take-off
distance for planning may then be taken as 364m. (In practice, the

Appendix A Other Test Techniques
220
certification standard and normal working practice [140] requires the use of a
1.3 safety factor (+30%) in any case, which is clearly greater than the greatest
predicted error from this test (and from most others); but, were the predicted
error greater than that then it is conservative to use this in place of a 1.3
factor). It is most conservative to use both, which is what has become the most
common practice.
A simple “reality check” upon this data may be obtained from the runway
length and an external observer / camera. In this case the take-off tests were
flown from Chilbolton (Stonefield Park) airfield in Hampshire [141], which
has a runway length of 411m. A coarse check upon the results was provided
by external observers and the pilot who estimated that about 75% of the
runway was required to reach the 15m screen height, an observation which is
consistent with the estimated distance.
A further check was made when this method was used during flight testing for
issue of a Public Transport CofA of a Naval Aircraft Factory N3N-3
Aeroplane[142].
Qty 9 take-offs were flown from Isle of Wight (Sandown) airport, at
conditions of 2870 lbf, 8kn headwind (4.1 m/s), no crosswind, 15°C OAT,
QFE 1023, 60 ft amsl, short-dry grass. Using the 2-part segmented method
(the rotation phase being extremely short, justifying this), the following results
were obtained:-

Appendix A Other Test Techniques
221
Table 22, Take-off test data for N3N-3 Aeroplane
No. 1 2 3 4 5 6 7 8 9 Mean Mean, m/s
CAS
t1, s 14.5 15 13.5 13.5 13 13 14 13.5 12.5 13.6 -
t1+t3, s NR 22 19.5 18.5 20 17.5 19.5 20 19.5 19.6 -
t3, s - 7 6 5 7 4.5 5.5 6.5 7 6.1 -
V1,
mph
IAS
52 52 52 52 52 55 53 52 52 52.4 23.6
V2,
mph
IAS
30 60 60 60 58 60 58 58 57 55.7 25.3
(Headwind component 8 kn)
These values were reduced to calibrated SI units and input to a segmented
method analysis model, and gave the following results at the tested conditions
(shown to 3sf). Ground roll = 84.2m; Air segment distance = 123m along the
ground; Estimated maximum total error in calculation = 46.2m (22.3%); Total
conservative calculated take-off distance = 254m.
Verification of this data was performed using video analysis. A fixed video
camera was used adjacent to the control tower, and a relationship established
between aircraft position and height as seen in the camera, and relative to the
runway, by comparing the geometry of 4 points in the field of view (two
runway markers, a hangar, and a mid point) with that determined using an
airfield plan. The two figures below show the geometry of this, and the
relationship used to then relate from the video monitor to estimated values for
take-off distance. Not all take-off ground-segments were recorded, due to an
misunderstanding between the pilot and cameraman concerning the available
field of view, nonetheless, sufficient data was obtained for reasonable
verification purposes. From this, the following data were obtained: Ground
roll, mean of 5 data points, 127m along the ground; Air segment distance,
mean of 9 data points, 108m along the ground; Estimated maximum error,
14m based upon 10m accuracy for each data point; Total conservative take-off
distance, 249m. This gives a slightly reduced take-off distance than that from

Appendix A Other Test Techniques
222
the timed method, thus the timed method is slightly more conservative.
Correlation is fair, in that (before addition of error margins) the timed method
gives 207m and the video method gives 235m (14% difference). The more
elaborate error analysis of the timed method results in it being the more
conservative method
Figure 84, Geometry of Sandown airport as used for N3N field performance
estimation (not to scale)
05
23
180m 155m 110m 0m Distance from end of hangar
(measured along runway centreline)
274mm 220mm 162mm 44mm Distance from RH edge of monitor
Camera position
View centreline

Appendix A Other Test Techniques
223
Figure 85, Aerial View of Sandown Airport, in similar orientation to figure above,
showing approximate camera position
Figure 86, Chart of distance along runway centreline versus distance across video
monitor screen, showing quadratic best fit curve.
-50
0
50
100
150
200
250
0 50 100 150 200 250 300
m illimetres from right hand edge of screen
me
tre
s fro
m a
be
am
ha
ng
ar
ed
ge

Appendix A Other Test Techniques
224
A6 A timed method for the conservative estimation of landing distances,
eliminating the requirement for external measurement devices.
Similarly to the method used for take-off distance estimation above, landing
distances may also be estimated. In this case, the following notation is used:
Speeds at screen height, touchdown, 3-wheels down, and stop are V1, V2, V3
and 0 respectively. Surface wind is VW and is positive when a headwind. The
difference in VW effect due to flightpath angle is assumed to be small. Times
of each segment are t1, t2 ,t3. Note that in the case of a taildragger making a 3-
point landing or other aircraft with an insignificantly short 2-wheel roll), then
t2=0 and the method is reduced to 2-segments. Lengths of each segment,
measured along the ground, are S1, S2, S3. Straight line distance from top of
screen to touchdown = S’1. Accelerations during each segment are a1, a2, a3.
a1 is acceleration along flightpath, not along the ground.
The total landing distance may be given by:-
−+
−
++−
−
+=
222
33
232
2
2
1221
WWW
VVtV
VVthV
VVtS
(A6-1)
Similarly to the take-off case, it’s essential to conduct an error analysis. This
gives the following results:-
( )( )
2 2
2
1221
22
121
1
2.4
4
hVVV
t
VVVt
t
S
W
W
−
−
+
−+=
∂
∂ (A6-2)
WVVV
t
S−
+=
∂
∂
2
23
2
(A6-3)
2
3
3
WVV
t
S −=
∂
∂ (A6-4)

Appendix A Other Test Techniques
225
( )
22
2
2323
2121
1
2.4
2
hVVV
t
VVVt
V
S
W
W
−
−
+
−+=
∂
∂ (A6-5)
( )2
2.4
2 2
22
2
2323
2121
2
t
hVVV
t
VVVt
V
S
W
W +
−
−
+
−+=
∂
∂ (A6-6)
2
32
3
tt
V
S +=
∂
∂ (A6-7)
( )
++
−
−
+
−+−=
∂
∂
2
2.2
2 32
22
2
2323
212
1 tt
hVVV
t
VVVt
V
S
W
W
W
(A6-8)
Below is actual test data for an HM1000 Balerit aircraft.
Table 23, Landing test data for HM1000 Balerit at 420kg
No.� 1 2 3 4 5 6
t1 7 11.5 10 13.5 12 13.5
t3 43 20.5 28 26.5 25 29
V1, mph IAS 50 53 48 50 50 55
V2 mph IAS 46 37 41 45 37 37
V1, kn CAS
(ms-1
CAS)
45
(23.1)
48
(24.7)
44
(22.6)
45
(23.1)
45
(23.1)
47
(24.2)
V2, kn CAS
(ms-1
CAS)
43
(22.1)
38
(19.5)
41
(21.1)
42
(21.6)
38
(19.5)
38
(19.5)
[The aircraft was stopped on the ground using moderate braking
once at a fast walking pace).
Mean time to from screen height to touchdown: 11.25
Mean time to stop = 28.7 s Mean speed at screen height = 23.5 ms
-1
Mean touchdown speed = 20.6 ms-1
Using this data, a total landing distance is derived of 364m, and a maximum
estimated error of 54m (or 15%). This gives a total distance of 418m. Again
this test was flown at Chilbolton with a 411m runway, and the pilot estimated

Appendix A Other Test Techniques
226
that the aircraft was stopped in about the full length of the runway – having
descended through screen height before the threshold. In this case, the
conservative estimate using this method matches well the visual estimate.
As for take-off distances (section A5), an opportunity also arose to use this
method, and verify data using an external video source during testing of a
Naval Aircraft Factory N3N-3 Aeroplane . The following test data was
obtained.
Table 24, Landing test data for N3N-3 Aeroplane
No. 1 2 3 4 5 6 7 8 Mean Mean,
m/s CAS
t1, s 15 13 10 10 10.5 8 8 10 10.9
t1+t3, s 33 34 28 26.5 27.5 24.5 25.5 25.5 28.6
t3, s 18 21 18 16.5 17 16.5 17.5 15.5 17.6
V1,
mph
IAS
65 65 65 67 65 70 65 65 65.3 30.2
V2,
mph
IAS
50 52 52 52 53 55 53 53 52.1 23.5
(Headwind component 8 kn)
These values were input to a segmented method analysis model, which gave the
following results at test conditions. Air segment distance = 212m along the ground;
Ground segment distance = 120m; Estimated maximum error = 48.8m (14.7%); Total
conservative landing distance = 381m.

Appendix A Other Test Techniques
227
Verification of this data was again performed using video analysis and sufficient data
was obtained for verification purposes. From this, the following data were obtained:
Air segment distance, one data point only, 162m; Ground segment distance, 5 data
points, mean 160m; Estimated maximum error, based upon assumed 10m accuracy in
data, 14m; Estimated total landing distance, 336m. Thus the timed method is more
conservative than the method of video analysis and may be accepted. There is an
apparent mismatch between the ground and air segment distances – ground roll is
somewhat longer on the video analysis compared to air segment, which is longer on
the timed method. This is attributed to the difficulty in identifying the touchdown
point from video analysis, nonetheless the total distance before addition of estimated
errors (which effectively does not take into account this point) is extremely close
(within 3%) and the timed method is made more conservative primarily by the larger
value determined by the error analysis for that method.

Appendix B Aircraft Characteristics
228
Appendix B – Characteristics And Illustrations Of The Main Aircraft Types Referred
To In This Thesis
APPENDIX B
CHARACTERISTICS AND
ILLUSTRATIONS OF THE MAIN
AIRCRAFT TYPES REFERRED TO IN
THIS THESIS

Appendix B Aircraft Characteristics
229
B1 Aviasud Mistral.
The Aviasud Mistral is a French designed 2-seat side-by side tractor Aviasud
configuration biplane with a tricycle undercarriage. Pitch and yaw control are
through conventional elevator and rudder, but roll control is through
differential movement of the entire lower mainplane.
Maximum permitted take-off weight (MTOW) is 390kg, with a typical empty
weight of 190kg. Wing area is 17.9m², and Vso is 38 kn CAS.
The aircraft will be fitted either with the Rotax 532-2V engine, or the newer
but similar 582/48-2V engine, both generating approximately 48kW maximum
power. The Arplast 3-blade ground adjustable propeller of 65” diameter and
7.5° pitch is driven through a Rotax B-type gearbox with 1:2.58 ratio gearset.
The certification basis of the aircraft in the United Kingdom is BCAR Section
S (initial working draft) plus some special limitations agreed at the time of
approval between the BMAA and CAA.
Figure 87, Aviasud Mistral

Appendix B Aircraft Characteristics
230
B2 Eurowing Goldwing
The Eurowing Goldwing is a single-seat canard pusher aircraft derived from
an earlier US design also called the Goldwing. Construction is primarily
composite.
Maximum permitted take-off weight (MTOW) is 264kg, with a typical empty
weight of 160kg. Total lifting surface area is 12.55m². VSO is 30kn, whilst
Vne is 61kn; best glide ratio has found to be about 13:1
The aircraft may be fitted with any of a selection of 25-45 hp engines, driving
2-blade wooden propellers through a belt reduction. The most common
engine fitted was the Fuji EC34PM which gives a climb rate of 428 fpm and a
maximum level flight speed of about 50 kn.
The aircraft was approved for use in the UK on the basis of partial compliance
with the March 1983 working draft of BCAR Section S, combined with
operating experience prior to the introduction of mandatory safety regulations.
Figure 88, Eurowing Goldwing fitted with Rotax 377 engine

Appendix B Aircraft Characteristics
231
B3 Easy Raider.
The Easy Raider (formerly known as the Sky Raider II UK) is a derivative of
an American single seat aircraft called the Sky Raider. The aircraft is a
tandem 2-seat high wing monoplane taildragger with conventional flying
controls. The aircraft is fitted with 4-position half span flaps, at 0, 15°, 30°
and 40°.
Maximum permitted take-off weight (MTOW) is 450 kg, with a typical empty
weight of 200 kg. Wing area is 9.8 m² and Vso is 34 kn CAS (full flap), VS1 is
36.5 kn CAS. Vne is 115 kn CAS.
In the 503(1) configuration, the aircraft will be fitted with a Rotax 503-2V
engine generating about 38 kW. Through a Rotax C-type gearbox with 3:1
gearset, this drives a Powerfin 3 blade composite ground adjustable propeller
at 70” x 14°. In the J2.2(1) configuration, the aircraft will be fitted with a
Jabiru 2200 engine, generating about 55kW, driving either a composite or
wooden 2-blade propeller.
The certification basis is BCAR Section S issue 2, approval was under
supervision of the author.

Appendix B Aircraft Characteristics
232
Figure 89, Easy Raider J2.2(1).
Photograph courtesy of Reality Aircraft Ltd
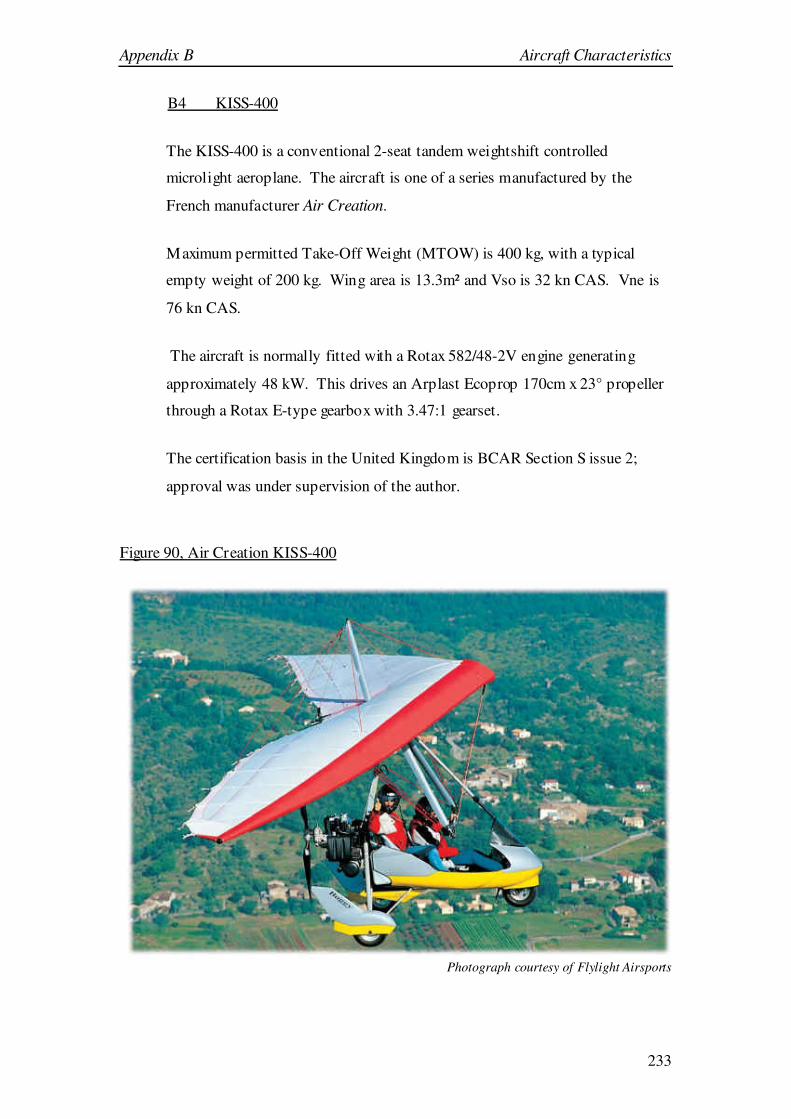
Appendix B Aircraft Characteristics
233
B4 KISS-400
The KISS-400 is a conventional 2-seat tandem weightshift controlled
microlight aeroplane. The aircraft is one of a series manufactured by the
French manufacturer Air Creation.
Maximum permitted Take-Off Weight (MTOW) is 400 kg, with a typical
empty weight of 200 kg. Wing area is 13.3m² and Vso is 32 kn CAS. Vne is
76 kn CAS.
The aircraft is normally fitted with a Rotax 582/48-2V engine generating
approximately 48 kW. This drives an Arplast Ecoprop 170cm x 23° propeller
through a Rotax E-type gearbox with 3.47:1 gearset.
The certification basis in the United Kingdom is BCAR Section S issue 2;
approval was under supervision of the author.
Figure 90, Air Creation KISS-400
Photograph courtesy of Flylight Airsports

Appendix B Aircraft Characteristics
234
B5 Air Creation iXess
The iXess is a conventional (although relatively high performance) 2-seat
tandem weightshift controlled microlight aeroplane. The aircraft is one of a
series manufactured by the French manufacturer Air Creation.
Maximum permitted Take-Off Weight (MTOW) is 450 kg, with a typical
empty weight of 200 kg. Wing area is 15m² and Vso is 33 kn CAS, Vne is 84
kn CAS, VA is 72 kn CAS
The aircraft is normally fitted with a Rotax 912UL engine generating
approximately 59 kW. This typically drives an Arplast Ecoprop 166cm
propeller through an integral gearbox.
The certification basis of the iXess in the United Kingdom was BCAR Section
S issue 3 (which is identical in all technical content to issue 2).
Figure 91, Air Creation iXess
Photograph courtesy of Flylight Airsports Ltd

Appendix B Aircraft Characteristics
235
B6 Mainair Gemini Flash 2 and Flash 2a
The Mainair Gemini Flash 2 and Flash 2 alpha, are similarly conventional
tandem weightshift microlight aeroplanes. The manufacturer, Mainair Sports,
is based in Rochdale, Lancashire and still trade, although both types are now
out of production. Both types are unusual in that the wings do not use
“tipsticks” as part of their design. The Flash 2 was first approved in 1986, and
the Flash 2a in 1991.
For both types, Maximum Take-Off Weight (MTOW) is 370kg, and wing area
is 15.56m². Similarly, for both, Vso is 24 kn, and Vne is 77 kn; these are IAS
values and PEC are not known, but believed to be small.
Both types are approved for a wide range of powerplants, but a typical
installation on either would be a Rotax 462 engine, generating about 40 kW,
and driving a Warp Drive 3-blade composite ground-adjustable propeller at
62” diameter and 110° pitch measured at 12” diameter.
Approval of both types was to BCAR Section S Advance issue (March 1983).
Figure 92, Mainair Gemini Flash 2
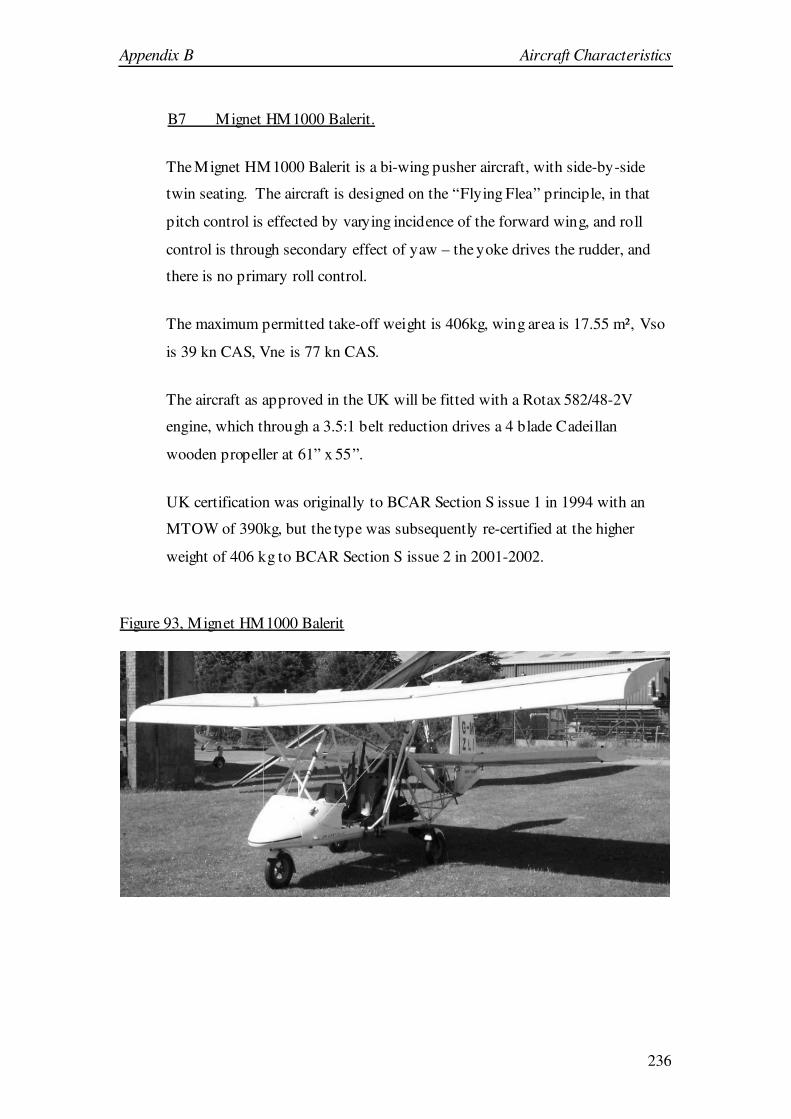
Appendix B Aircraft Characteristics
236
B7 Mignet HM1000 Balerit.
The Mignet HM1000 Balerit is a bi-wing pusher aircraft, with side-by-side
twin seating. The aircraft is designed on the “Flying Flea” principle, in that
pitch control is effected by varying incidence of the forward wing, and roll
control is through secondary effect of yaw – the yoke drives the rudder, and
there is no primary roll control.
The maximum permitted take-off weight is 406kg, wing area is 17.55 m², Vso
is 39 kn CAS, Vne is 77 kn CAS.
The aircraft as approved in the UK will be fitted with a Rotax 582/48-2V
engine, which through a 3.5:1 belt reduction drives a 4 blade Cadeillan
wooden propeller at 61” x 55”.
UK certification was originally to BCAR Section S issue 1 in 1994 with an
MTOW of 390kg, but the type was subsequently re-certified at the higher
weight of 406 kg to BCAR Section S issue 2 in 2001-2002.
Figure 93, Mignet HM1000 Balerit

Appendix B Aircraft Characteristics
237
B8 CFM Shadow
The CFM Shadow which comes in a number of variants is a British developed
high wing tandem pusher aeroplane. All discussion here is of the Shadow CD
and Shadow DD which are dual controlled microlight versions.
The Shadow CD has an MTOW of 374kg, a wing area of 15m², Vso is 35 kn
IAS, VNE is 94 kn IAS. The Shadow DD has an MTOW of 386kg, a wing area
of 15.5m², Vso is 36 kn IAS and VNE is 108 kn IAS. In both versions the ASI
overreads by approximately 20% at high speeds.
As approved in the UK, the Shadow CD will normally be fitted with a Rotax
503-2V engine, generating about 55 hp driving a 52” 3 blade wooden propeller
through a 2.58:1 Rotax gearbox. The Shadow DD will normally be fitted with
a Rotax 582/48-2V engine generating about 65hp and also driving a 52” 3
blade wooden propeller through a 2.58:1 Rotax gearbox.
The Shadow CD was approved to BCAR Section S advance issue (1983). The
Shadow DD was approved to BCAR Section S issue 1.
Figure 94, Shadow CD

Appendix B Aircraft Characteristics
238
B9 Raj Hamsa X’Air Mk.1 and Mk.2. (Falcon)
The Raj Hamsa X’Air Mk.1 is a deriviative of the AX3, which itself is a
French derivative of the Weedhopper – one of the earliest fixed wing
microlight aeroplanes. The configuration is high wing, mid-tail, with a tractor
engine and side-by-side seating. Control is through conventional ailerons,
elevator and rudder. The aircraft is not fitted with flaps.
The X’Air Mk.2 (Falcon) is a derivative of the X’Air Mk.1. The tail structure
is stiffened and the rear fuselage cone extended further aft. Most significantly
however, the wing section is altered, wingspan reduced and half-span flaps
introduced (requiring redesign of the aileron circuit).
Both aircraft have a Maximum Authorised Take-Off Weight of 450 kg. For
the Mk.1, wing area is 16m², Vne is 83 kn CAS and Vso is 32.6 kn CAS. For
the Mk.2 wing area is 14.3 m², Vne is 85 kn CAS and Vso is 35 kn CAS.
As approved in the UK, an X’Air Mk.1 is most likely to be fitted with a Rotax
582/48-2V engine generating 48kW, and a 65” Ivoprop propeller driven
through a Rotax B-type gearbox with 2.58:1 ratio gearset. An X’Air Mk.2 is
most likely ot be fitted with a Jabiru 2200 engine generating 50kW and a 64”
Arplast ecoprop direct-drive propeller.
Both aircraft are certified in the UK to BCAR Section S issue 2.

Appendix B Aircraft Characteristics
239
Figure 95, Raj Hamsa X'Air Mk.1 (UK) with Rotax 582/48-2V engine and Ivoprop
propeller

Appendix B Aircraft Characteristics
240
B10 Southdown (now Medway) Raven-X.
The Southdown Raven-X (later manufactured by Medway Microlights) is a
conventional 2-seat weightshift controlled microlight aeroplane. The aircraft
is part of a family, and shares a trike with the earlier Puma Sprint, and a wing
with various other “Raven” aircraft such as the Hybred 44XL-R and the
EclipseR.
The aircraft has a Maximum Authorised Take-Off Weight (MTOW) of
367kg and a wing area of 15 m². Vne is 87 kn and Vso is 30 kn (both are
IAS values, and PEC are not known, but believed to be small).
A typical example of this aircraft might be fitted with a Rotax 447-1V engine
generating about 31kW, driving a 3 blade 60”x9° Ivoprop through a Rotax A
or B type gearbox using a 2.58:1 ratio gearset.
Certification of the type was to BCAR Section S advance issue of March
1983.
Figure 96, Southdown Raven-X with Rotax 447 engine.

Appendix B Aircraft Characteristics
241
B11 Spectrum T1
The Spectrum T1 is a two-seat tandem 3-axis tractor aeroplane of “fuse-tube”
type construction. The type was developed from scratch in the UK in the mid
1980s.
The aircraft has an MTOW of 375kg, and a wing area of 15m². Vne is 83 kn
CAS, Vso is35 kn IAS, which is believed to be close to kn CAS.
Example of the aircraft are fitted with Rotax 503-1V or –2V (34 or 37 kW)
engines, driving a 2-bladed wooden 65” x 38” propeller or a 3-blade 62”
Ivoprop composite propeller through a 2.58 reduction.
The aircraft was certified to BCAR Section S Advance copy (1983).
Figure 97, Spectrum T1

Appendix B Aircraft Characteristics
242
B13 Thruster TST Mk.1 and Thruster T300
The Thruster TST Mk.1 is a 2-seat side-by-side conventional tractor aeroplane
derived from an Australian single seat aircraft also called the Thruster. The
T300 is a very similar development of the earlier TST. Both variants are semi-
open cockpit, with dual controls, and are taildraggers. The TST was the first
2-seat 3-axis training aeroplane readily available on the UK microlight market.
Both have an MTOW of 361kg which is commonly increased to 380kg by the
addition of aerofoil section wing struts. Wing area is 25m². Both aircraft have
a Vne of 80 kn, and a VS0 of about 35 kn.
The Thruster TST is normally fitted with a twin carburettor Rotax 503-2V
engine generating about 55 hp; this will drive one of a wide range of 2 or 3-
blade propellers through a 2.58:1 Rotax gearbox. The Thruster T300 may use
this engine, or more commonly a Rotax 532-2V or 582-2V engine (the latter
was a direct replacement for the former) generating about 65 hp and driving a
similar range of propellers, also through a 2.58:1 Rotax gearbox.
Both of these early Thruster variants were certified to the 1983 Advance issue
of BCAR Section S.
Figure 98, Thruster TST Mk.1
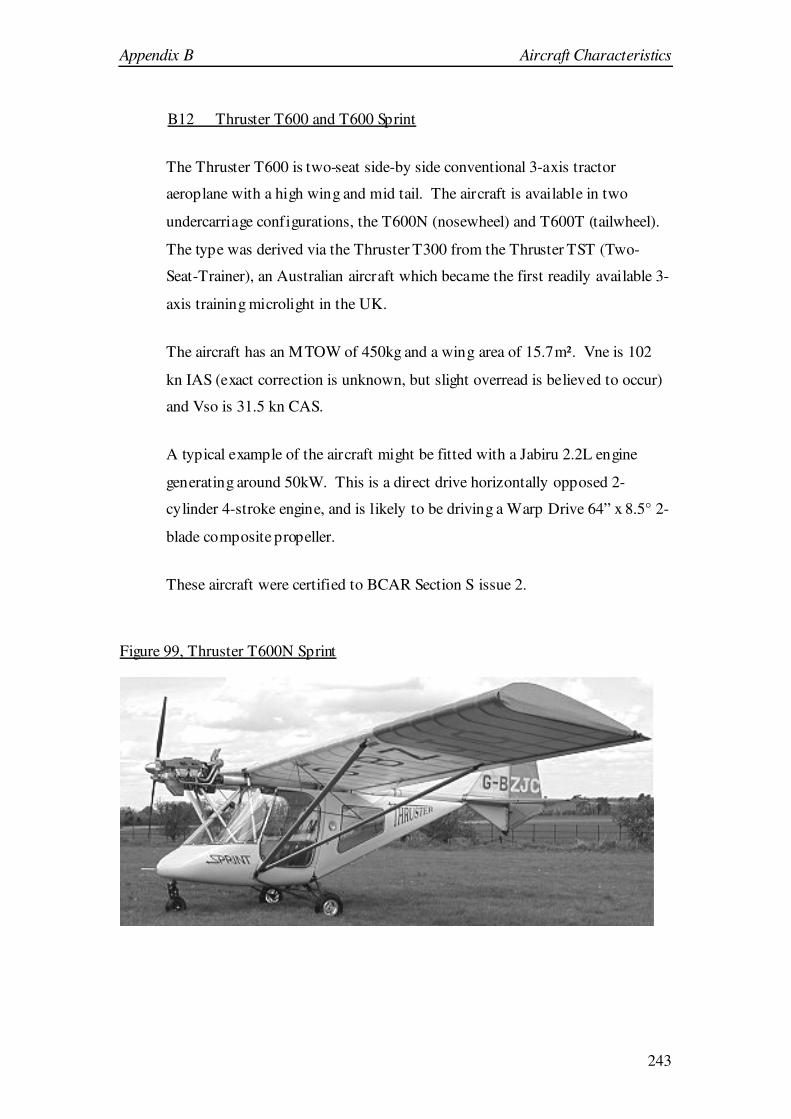
Appendix B Aircraft Characteristics
243
B12 Thruster T600 and T600 Sprint
The Thruster T600 is two-seat side-by side conventional 3-axis tractor
aeroplane with a high wing and mid tail. The aircraft is available in two
undercarriage configurations, the T600N (nosewheel) and T600T (tailwheel).
The type was derived via the Thruster T300 from the Thruster TST (Two-
Seat-Trainer), an Australian aircraft which became the first readily available 3-
axis training microlight in the UK.
The aircraft has an MTOW of 450kg and a wing area of 15.7m². Vne is 102
kn IAS (exact correction is unknown, but slight overread is believed to occur)
and Vso is 31.5 kn CAS.
A typical example of the aircraft might be fitted with a Jabiru 2.2L engine
generating around 50kW. This is a direct drive horizontally opposed 2-
cylinder 4-stroke engine, and is likely to be driving a Warp Drive 64” x 8.5° 2-
blade composite propeller.
These aircraft were certified to BCAR Section S issue 2.
Figure 99, Thruster T600N Sprint

Appendix B Aircraft Characteristics
244
B13 Flightdesign / Pegasus CT2K
The CT2K is a British development of the German Flightdesign CT, which
was originally designed for certification against the German microlight
standard BFU-95. The type is a high (cantilever) wing side tractor, with side-
by-side seating and dual controls. The aircraft is fitted with an electric flap
system variable between –12° and 40°. Negative (high speed cruise) flap
settings also reflex the ailerons.
The aircraft has an MTOW of 450kg and wing area of 10.8 m². VRA is 115 kn,
VNE is 150 kn, VS1 is 43 kn and VS0 is 34 kn CAS.
At time of writing, all examples of the type are fitted with a Rotax 912ULS
engine generating about 100 hp, driving a 1,66m 2-blade Neuform composite
propeller through a 2.43:1 gearbox.
The aircraft was certified to BCAR Section S issue 2.
Figure 100, Flightdesign CT2K

Appendix B Aircraft Characteristics
245
B14 Sky Ranger UK
The Sky Ranger is a nosewheel configuration, single engine high-wing tractor
monoplane. The UK version is slightly modified (by strengthening of the
control circuits, addition of a ventral fin to enhance directional stability, and
other smaller modifications from a similarly named aircraft originally
designed and operated in France. The aircraft is fitted with dual controls,
although in fact the control column, pitch trimmer and flap controls are fitted
centrally in the cabin and shared between pilots, only the throttle and pedals
being duplicated.
The aircraft has an MTOW of 450kg and wing area of 10.8 m². VA is 72 kn,
VNE is 108 kn, VS1 is 36 kn and VS0 is 33 kn CAS.
Most examples in the UK are fitted with Rotax 912UL engines driving a 2-
blade wood, or 3-blade composite propeller.
The aircraft is certified to BCAR Section S issue 2.
Figure 101, Sky Ranger UK
Photograph courtesy of Flylight Airsports Ltd

Appendix B Aircraft Characteristics
246
B15 Naval Aircraft Factory N3N-3.
The N3N-3 is a tailwheel configuration, single engine biplane with 2 seats in a
tandem arrangement. It was originally built in 1941 by and for the United
States Navy as a training aeroplane. The aircraft does not fall into the
microlight category, but has been used during the report because take-off and
landing performance testing carried out on it, and reported in Appendix A to
this thesis, has relevance to microlight testing.
The aircraft has an MTOW of 1373 kg in public transport operation and a
wing area of 28.3m². Vso is 46.5 kn CAS and Vne is 142 kn CAS.
The sole example of the type in the UK is G-ONAF, which is fitted with a
Wright R-760 radial engine generating about 170kW driving a fixed pitch
2.74m diameter propeller (original equipment, pitch setting unknown).
The original certification basis for the aircraft is uncertain, although BCAR
Section K issue 7 was used for the transfer of the aircraft from private to
public transport certification.
Figure 102, Naval Aircraft Factory N3N-3

Appendix C References
247
APPENDIX C
REFERENCES

Appendix C References
248
(Note: Some reference documents are repeated due to multiple reference within the
text)
1 UK Civil Aviation Authority, British Civil Airworthiness Requirements,
Section S, Small Light Aeroplanes, CAP 482 issue 2.
2 G B Gratton, “The weightshift-controlled microlight aeroplane”, Proc Instn Mech Engrs Vol 215 Part G pp147-154
3 Source, data from statistics section, Civil Aviation Authority Safety Regulation
Group.
4 UK Civil Aviation Authority, British Civil Airworthiness Requirements, Section S, Small Light Aeroplanes, CAP 482 working draft, April 1983.
5 G B Gratton, A dispersed airworthiness management system – the model of the
British Microlight Aircraft Association, International Journal of Aerospace Management, ISSN 1469-342, Vol.1 No.4, pp329-335 (Feb 2002)
6 Joint Aviation Requirements, 1.1 General Definitions
7 Deutschen Aero Club e.V., Bauvorschriften für Ultraleichtflugzeuge, BFU-95 dated 12 Oct 1995
8 Luftfahrt-Bundesamtes, Bekanntmachung von Lufttüchtigkeitsforderungen für
aerodynamisch gesteuerte Ultraleichtflugzeuge, LTF-UL dated 30 Jan 2003 9 Joint Aviation Authorities (JAA), Joint Airworthiness Requirements Part 22,
Sailplanes and Powered Sailplanes, JAR-22 AL8
10 Joint Aviation Authorities (JAA), Joint Airworthiness Requirements Part VLA,
Very Light Aeroplanes, JAR-VLA AL1
11 G B Gratton, BMAA Code of Practice for Microlight Hire, BMAA Technical Information Leaflet No. 032 issue 1a, dated April 2003.
12 British Microlight Aircraft Association, PPL(A) Microlight Training Syllabus,
Revision as at 14 Dec 1998
13 Kilkenny, E., Longitudinal Static Stability of Hang-Gliders, Phd Thesis, Cranfield University, 1988
14 Source: author’s personal notes from “qualeval” flight test assessment of
Airborne XT912 / Streak III aircraft T2-22252 at Shifnal airfield, 14 May 2004.
15 Enzo Boschi, Il delta “intellegente”, Volare Sport Jan 99, pp32-33
16 Air Accidents Investigation Branch, AAIB Bulletin No: 1/2000 Ref:
EW/C99/8/5
17 British Civil Airworthiness Requirements, Section S, Small Light Aeroplanes
CAP 482.
18 British Microlight Aircraft Association, Flight Test Schedule BMAA/AW/010b
19 British Microlight Aircraft Association, Microlight Maintenance Schedule
MMS1 issue 2, Technical Information Leaflet 020 issue 1
20 Brooks, W.G., Flight Testing of Flexwings. http://www.raes.org.uk/light-av/brooks_p_1.htm

Appendix C References
249
21 Cook, M V, The theory of the longitudinal static stability of the hang-glider,
Aeronautical Journal, Oct 1994, pp292-304
22 Gratton, G.B. and Porteous, T, The Creation of a Formal Test Flying System
Within The British Microlight Aircraft Association and a Discussion of the Spin
Testing of Microlight Aircraft http://www.setp.org/microlightaircraft.htm
23 British Microlight Aircraft Association, BMAA Code of Practice for Microlight
Hire, TIL 032 issue 1a, April 2003 24 EL Houghton and NB Caruthers, Aerodynamics for Engineering Students 3rd
Edition, ISBN 0-7131-3433-X
25 Piper Aircraft Corporation, Cherokee Warrior II Information Manual, Report VB-880
26 ACI Stall Warning entry page, http://homepages.which.net/~aci.stw/
27 J M Pratt, Cessna 152 – A Pilots Guide, ISBN 1-874783-30-6
28 Empire Test Pilots School, Course Notes, No. 20 FTE Course 1996.
29 British Microlight Aircraft Association, Test Schedule for 3-axis performance
and handling (Section S issue 2 compliance, Vd not exceeding 140 knots), BMAA/AW/010a
30 British Microlight Aircraft Association, Test Schedule for weightshift
performance and handling (Section S issue 2 compliance, Vd not exceeding 140
knots), BMAA/AW/010b
31 H Glauert, The Elements of Aerofoil and Airscrew Theory, Cambridge University Press, First Edition, 1926.
32 M E Eshelby , Aircraft Performance, Theory and Practice. ISBN 0-340-75897-X
33 R Venton-Walters, Raven Operators Manual, Southdown International Report R150 Issue 3 12 February 1986.
34 R Venton-Walters, Re: Flexwing Stalling Speeds, Email to G B Gratton dated 2 May 2002
35 R Venton-Walters, Raven Operators Manual, Report R150 Issue 3, 12 February 1986
36 UK Civil Aviation Authority, Raven-X, Type Approval Data Sheet No. BM13 issue 4.
37 Joint Aviation Authorities (JAA), Joint Airworthiness Requirements Part 22, Sailplanes and Powered Sailplanes, JAR-22 AL8
38 Joint Aviation Authorities (JAA), Joint Airworthiness Requirements Part VLA,
Very Light Aeroplanes, JAR-VLA AL1
39 Joint Aviation Authorities (JAA), Joint Airworthiness Requirements Part 23,
Normal, Utility, Aerobatic, and Commuter Category Aeroplanes, JAR-23 AL2 40 Joint Aviation Authorities (JAA), Joint Airworthiness Requirements Part 23,
Large Aeroplanes, JAR-22 AL17
41 UK Civil Aviation Authority, part K3-2 “Flight Manoeuvring Loads and Design
Airspeeds) to British Civil Airworthiness Requirements Section K: Light
Aeroplanes, CAP 467 issue 7.
42 B Cosgrove, Microlight Pilots Handbook, ISBN 1-85310-808-1

Appendix C References
250
43 Nickel and Wohlhfart (translated from German by Capt. E M Brown), Tailless
Aircraft in Theory and Practice. ISBN 1-56347-0942
44 J K Northrop, The development of all-wing aircraft, 35th Royal Aeronautical Society Wilbur Wright memorial lecture, 1947.
45 B Cosgrove, Pilots Weather, ISBN 1-84037-027-0 (pp45-46)
46 UK Air Accidents Investigation Branch, Report of Fatal Accident to Pegasus
XL-Q G-MYBR on 21 August 1999, AAIB Bulletin No: 1/2000 Ref: EW/C99/8/5
47 British Microlight Aircraft Association, KISS-400(UK), Homebuilt Aircraft Data Sheet No. HM7 issue 1
48 Authorised by G B Gratton, PM Dewhurst, D Coupland, KISS-400 (UK)
Operators Manual, Issue 1 AL0
49 British Microlight Aircraft Association, KISS-400(UK), Homebuilt Aircraft Data Sheet No. HM7 issue 1
50 Authorised by G B Gratton, PM Dewhurst, R Thomasson, KISS-450 (UK) Operators Manual, Issue 1 AL0
51 Authorised by G B Gratton, P M Dewhurst, R J Grimwood, Air Creation iXess operators manual, Issue 1, AL1
52 Source: conversations between author and Dr. W.G.Brooks, Technical Director,
P&M Aviation, during 2003 and 2004.
53 D Stinton, Flying Qualities and Flight Testing of the Aeroplane, ISBN 0-632-02121-7
54 USAF Test Pilots School Notes, Part 10 High Angle of Attack Flight
55 Empire Test Pilots School, Fixed Wing Flight Test Manual, Chapter 2.8 -
Spinning
56 UK Ministry of Defence, Stalling Post-Stalling Gyrations and Spins and
Miscellaneous Flying Qualities – Post Stall Gyrations and Spins. Def-Stan 00-970 Part 1 Section 2 Leaflet 52 issue 2 Dec 99
57 Yangos and Yangos, Spin: Angles and Inertial Moments, Aeronautical Journal July/Aug 1981 pp270-276
58 T E Archer, Are you ready for LOC?, Cockpit (magazine of the Society of Experimental Test Pilots), April/May/June 1991 pp5-12
59 A&L Welch, Flying Training in Gliders, Published by British Gliding Association Sixth Edition 1975
60 UK Air Accidents Investigation Branch, Report of Fatal Accident to Aviasud
Mistral G-MYST on 23 June 2001, AAIB Bulletin No: 6/2002 Ref: EW/2001/6/9
61 UK Air Accidents Investigation Branch, Report of Accident to Taylor J.T.1 Monoplane G-BEEW on 2 September 2001, AAIB Bulletin No: 11/2001 Ref: EW/G2001/09/03
Appendix C References
251
62 UK Air Accidents Investigation Branch, Report of Fatal Accident to Whittaker
MW6S (modified) G-MZIN on 28 March 1999, AAIB Bulletin No: 8/99 Ref: EW/C99/3/1
63 UK Air Accidents Investigation Branch, Report of Accident to Europa G-KWIP
on 21 March 2000, AAIB Bulletin No: 4/2001 Ref: EW/C2000/3/4
64 UK Air Accidents Investigation Branch, Report of Fatal Accident to Jodel D112
G-BCOG on 26 July 1998, AAIB Bulletin No: 12/98 Ref: EW/C98/7/8
65 UK Air Accidents Investigation Branch, Report of Fatal Accident to Rallye
Club 880B, G-AYKF on 26 August 1996, AAIB Bulletin No: 2/97 Ref: EW/G96/8/9
66 UK Civil Aviation Authority, LASORS 2005
67 Source, authors notes from flight test to Airborne XT912 / Wizard III aircraft T2-22252 flown at Shifnal, 14 May 2004.
68 Source, conversations during the period of this research between author and
Mr C J Draper, Proprietor, Medway Microlights.
69 Piper Aircraft Corporation, Cherokee Warrior II Information Manual, Report VB-880
70 Royal Air Force, Flying, AP3456
71 N Williams, Aerobatics, ISBN 0950454303
72 J S Denker, See How it Flies, http://www.monmouth.com/~jsd/how/
73 R Stowell, Innovations in Stall/Spin Awareness Training, Presented to (USA)
Second Annual Instructor Conference, Embry Riddle Aeronautical University, April 9-10, 1999. http://www.richstowell.com/erau.htm
74 UK Air Accidents Investigation Board, Spectrum Microlight G-MWWY,
Bulletin 3/98 EW/C97/8/8
75 G Weighell, Quite Simple Really, Microlight Flying Noc-Dec 01 pp44-45
76 UK CAA, LASORS 2004
77 Minutes of the 24th meeting of the Airworthiness Requirements Board Light
Aircraft Committee (Nov 1998)
78 British Microlight Aircraft Association, Guidance on Spin Testing Microlight
Aircraft, TIL 025 issue 1 dated December 1999.
79 G B Gratton and S J Dyde, Tucano T Mk 1 - Assessment of possible unified spin recoveries, Report D/A&E/BD/95/128, Dec 1995
80 G B Gratton, Bulldog T Mk 1 - Assessment of Lycoming modification 330
(Revised) engine inverted oil system, PE/Bulldog/17
81 Philip W Neihouse, Jacob H Lichtenstein, Jacob H Pepoon, Tail-design
requirements for satisfactory spin recovery, NACA TN-1045(April 1946)
82 G B Gratton, “The weightshift-controlled microlight aeroplane”, Proc Instn Mech Engrs Vol 215 Part G pp147-154

Appendix C References
252
83 G B Gratton, “Less Weight More Fun”, Aerospace International, Feb 2000, pp 30-32
84 UK Civil Aviation Authority, Aviation Safety Review 1990-1999, CAP 701
85 S J Morris, A Simplified Analysis of Tumbling Motion, Hang Gliding, Nov 1994, pp38-44.
86 W G Brooks, “Report on an accident to a Pegasus Quantum Supersport 503, in
Holland Michigan, USA, on 16 October 2000”, http://www.pegasusaviation.co.uk/pdf/Qtmacc.pdf
87 UK Air Accidents Investigation Branch; Bulletin 5/2000: EW/C97/10/5 (Mainair
Gemini Flash 2a G-MVEP; Fatal Accident)
88 UK Air Accidents Investigation Branch; Bulletin 1/97: EW/C96/7/8 (Mainair
Gemini Flash 2a G-MTLA; Fatal Accident)
89 UK Air Accidents Investigation Branch; Bulletin 8/92: EW/C92/5/1 (Pegasus
XL-Q, G-MVCU; Fatal Accident).
90 J Thomas, “Report of an incident that occurred on Sunday 21 July at Bedford
Microlight Centre” (Unreferenced report of a recovered in-flight departure
submitted to BMAA - Mainair Gemini Flash 2 G-MNNU).
91 UK Air Accidents Investigation Branch; Bulletin 9/89: EW/C1108 (Mainair
Gemini Flash 2a G-MTUW, Fatal accident)
92 UK Air Accidents Investigation Branch; Bulletin 4/86: EW/C918 (Mainair
Gemini Flash 2a G-MNEJ; Fatal Accident)
93 Mainair Sports Ltd, Accident Investigation, Bulletin No. 20, 1 Sept 1986 (Mainair Gemini Flash 2 G-MNNF, survived in-flight break-up during flight
testing)
94 Mainair Sports Ltd, Accident Report, Bulletin No. 21, 15 Sept 1986 (Pegasus
Flash 2, G-MNYY, survived in-flight break-up during initial testing of a newly
built aircraft)
95 Source: Multiple conversations between the author and (a) Check Pilot Brian
Searle, and (b) Test Pilot John Hamer, both of whom had suffered in-flight
breakups following tumble departures from controlled flight.
96 Source: Multiple conversations between author and technical staff at Mainair
Sports Ltd (in particular with Mr Roger Pattrick, Chief Designer) between 1997 and 2002.
97 Bisplinghoff, R.L., Ashley, A., Halfman, R.L. Aeroelasticity , Addison-Wesley 1955
98 Y.C. Fung, An Introduction to the Theory of Aeroelasticity, John Wiley, 1955.
99 O.Moncrieff, The Tumble Behaviour of Weightshift Controlled Microlight Aircraft, University of Southampton Project report No. IP/211, Oct 2003-Apr 2004
100 UK Civil Aviation Authority, Mainair Gemini Flash 2 alpha, Type Approval Data Sheet No. BM23 issue 11

Appendix C References
253
101 J F Douglas, J M Gasiorek, J A Swallowfield, Fluid Mechanics (second edition,
pp306-310), ISBN 0-582-98861-6
102 E A Kilkenny, An Experimental Study into the Longitudinal Aerodynamic and
Static Stability Characteristics of Hang Gliders, PhD Thesis, Cranfield Institute of Technology, September 1986
103 W G Brooks, Flight testing of flexwing aircraft, http://www.raes.org.uk/light-av/brooks_p_1.htm
104 British Microlight Aircraft Association, PPL(A) Microlight Training Syllabus
105 UK Civil Aviation Authority, Wake Turbulence, General Aviation Safety Sense Leaflet No. 15A
106 UK Civil Aviation Authority, Wake Turbulence, AIC 178/1993 (Pink 95)
107 B Cosgrove, Pilots Weather, ISBN 1-84037-027-0 (pp45-46)
108 UK Air Accidents Investigation Branch, Report of Fatal Accident to Microlight,
G-MVJU
109 Source: correspondence between author, James Doolittle III and Brig.Gen. Bob
Robert Cardinas, USAF(Rtd)
110 http://www.check-six.com/Crash_Sites/YB-49_crash_site.htm
111 D. Ford, “The Edwards Diaries”, published in Air and Space (Smithsonian Magazine), June/July 1997.
112 H Matthews, DH.108 The sage of the first British supersonic aircraft, HPM Publications 1997
113 D. Collier Webb , UK Flight Testing Accidents 1940-71, ISBN 0 85130 311 1 114 G de Havilland Sr., Sky Fever, the Autobiography of Sir Geoffrey de Havilland,
ISBN 0-905-778-405
115 Article in Herts Advertiser and St Albans Times, week commencing 30 September 1946
116 Stefanie Brochocki, Presentation to the July15, 2000, TWITT meeting held in El Cajon, CA, http://members.cox.net/rebid/Brochocki.html
117 Stefan Brochocki, A new tailless sailplane BKB-1, paper presented to the 8th
OSTIV conference, Cologne, Germany, June 1960
118 Stefan Brochoki, transcript of a lecture given to a branch of the Experimental
Aircraft Association, St-Anne de Bellevue, Quebec, 1990. http://members.cox.net/rebid/1990Lecture.html
119 J Mitchell, Witold Kasper and his aircraft, presentation to TWITT meeting
November 21 1998, http://members.cox.net/twitt/kasperminutes.htm
120 Flight Test Safety Committee, Test Card Creation and Approval,
http://www.flighttestsafety.org/bestpractices/test_card_creation.htm
121 G B Gratton (for Britten-Norman Group Ltd), Report recommending transfer of
N3N-3 Reg: G-ONAF from private to public transport category certificate of
airworthiness, GBG/BNG/N3N/1, issue 2 dated 31 July 2002
122 UK Civil Aviation Authority, British Civil Airworthiness Requirements Section
K, Light Aeroplanes. CAP 467 issue 7 October 1992.

Appendix C References
254
123 F J Hale, Introduction to Aircraft Performance, Selection and Design, ISBN 0-471-07885-9
124 British Microlight Aircraft Association, Form BMAA/AW/043 issue 1a
125 Williams, Aviation Formulary, http://www.best.com/~williams/avform.html
126 Royal Air Force No.1 AIDU, Flight Information Handbook (“The yellow
book”), this book carries no formal reference and is re-issued at 6 monthly intervals and referred to by title only.
127 J T Lowry, Performance of Light Aircraft, ISBN 1-56347-33A-5
128 G Lewis (National Test Pilot School), Using GPS to determine pitot-static
errors, 14 August 2003,
http://www.ntps.edu/Files/GPS%20PEC%20Method.doc
129 D Gray, Using GPS to accurately establish True Air Speed (TAS), Dated June 1998 – privately published, no formal reference.
130 F L Thompson (Langley Memorial Laboratory, NACA), The measurement of
air speed of airplanes, NACA Technical Note No. 616, October 1937.
131 E Arnold, Certification of Spin Resistant Aircraft, Society of Experimental Test Pilots – Report to the Profession 1999, pp58-73.
132 G B Gratton, Bulldog T Mk 1 - Assessment of Lycoming modification 330
(Revised) engine inverted oil system, A&AEE Report No. PE/Bulldog/17
133 Sales literature by Ballistic Recovery Systems Inc, USA.
http://www.airplaneparachutes.com/
134 L G Jansenns, J Russell, FAA Certification of the Liberty XL2, proceedings of the 2004 joint European Symposium of the Society of Experimental Test Pilots
and Society of Flight Test Engineers.
135 UK Civil Aviation Authority, British Civil Airworthiness Requirements,
Section S, Small Light Aeroplanes, CAP 482 issue 3.
136 UK Civil Aviation Authority, Take-off, climb and landing performance of light aeroplanes, AIC 12/1996 Pink 120.
137 Empire Test Pilots School, Course Notes (No. 20 Flight Test Engineer Course,
1996).
138 United Kingdom Accreditation Service, The Expression of Uncertainty and
Confidence in Measurement, M3003
139 G B Gratton, Post Flight Report, HM1000 Balerit, Determination of take-off,
climb, and landing performance, 1 Nov 01, Sortie 2, authorised by test schedule Special/MAAN 1562 / 1.
140 UK Civil Aviation Authority, Aeroplane Performance, General Aviation Safety Sense Leaflet 7b.
141 R Pooley, R Patel, W Ryall; Pooleys Flight Guide United Kingdom, ISBN 1-84336-0357-7

Appendix C References
255
142 G B Gratton, Report recommending transfer of N3N-3 Reg: G-ONAF from
private to public transport category certificate of airworthiness, GBG/BNG/N3N/1 issue 1 dated 26 May 2002 (Britten-Norman Group Ltd).