Embed Size (px)
Citation preview

UNIVERSITY OF SRI JAYEWARDENEPURA
Faculty of Science
TRAINING REPORT
Arthur C. Clarke Institute for Modern Technologies
Project name : Determination of Frequency Drift Rate of Solar Radio Bursts using CALLISTO
data
From 07/01/2020 to 07/04/2020
Date of submission : 22nd of June 2020
N.M.Samarawickrama
AS2016944
Department of Physics

ii
Declaration
This dissertation describes that this industrial training report is the record of authentic work
carried out by me during the period from 07th January 2020 and 07th April 2020, as an intern at
Arthur C. Clarke Institute for Modern Technologies under the supervision of Industrial and
Academic supervisors.
………………………..
N.M.Samarawickrama
AS2016944
……………………………………
Industrial supervisor
Mr.Janaka Adassuriya
Research Scientist,
Astronomy division,
Arthur C. Clark Institute for Modern Technologies.
…………………………………….
Academic supervisor
Mr. C.H. Manatunga
Senior lecturer

iii
Abstract
This report describes about the industrial project that was carried out by me at Arthur C. Clarke
Institute for Modern Technologies. I was assigned to the project “Determination of Frequency
Drift Rate of Solar Radio Bursts using CALLISTO data” under the division of Astronomy. In order
to achieve this task I had to study about new term fits files, E-CALLISTO international network,
python and image processing techniques used in OpenCV which comes under python language.
Fits file which included all the details about solar burst were extracted from E-CALLISTO network
and the solar burst was identified from it by removing the unnecessary noise. Image processing
techniques like gaussianblur, threshold, erode and dilate were used to remove the noise from
solar burst. The maximum intensity points of the solar burst were located and using python
commands drift rate was calculated. A simple interface was designed by me using tkinter in
python to make this process more simpler and easier.

iv
Acknowledgment
It is a great opportunity to thank all the people who are supported me in completing my 3 months
of internship period successfully in a meaningful way by sharpening my career effectively.
Firstly, I would like to thank the Department of Physics, specially Prof.A.D.Kumarasinghe the Head
of the Department, Dr.S.Jayawardhana the Industrial Training Coordinator of Physics Department
for guiding us throughout the program by finding good training establishment places. Further I
would like to pay my sincere gratitude for Mr.C.H.Manatunga the Internal Supervisor of the
Internship for the guidance and giving us instructions for sharpening our career during the
training period.
Not only that I am highly grateful to Astronomy Division of Arthur C. Clarke Institute for Modern
Technologies (ACCIMT) for their guidance and support throughout my Internship period,
Specially the Director of Astronomy Division Mr.Saraj Gunasekara and the Industrial Training
Supervisor Mr.Janaka Adassuriya for the immense support,guidance and dedication to make this
internship program a fruitful one. Then I would like to thank the entire stuff of ACCIMT for their
daily support throughout my training period.
Finally, I would like to thank all the other technical and non-technical staff members and my other
fellow trainees for their cooperation and help given during my training period.

v
Table of Contents
Declaration .................................................................................................................................................... ii
Abstract ........................................................................................................................................................ iii
Acknowledgment ......................................................................................................................................... iv
Table of figures ............................................................................................................................................ vi
1. Introduction of the Institute ..................................................................................................................... 1
1.1 Arthur C. Clarke Institute for Modern Technologies........................................................................... 1
1.2 Vision and Mission .............................................................................................................................. 2
1.2.1 Vision ............................................................................................................................................ 2
1.2.2 Mission ......................................................................................................................................... 2
1.3 Services ............................................................................................................................................... 2
1.3.1 Research and Development ......................................................................................................... 2
1.3.2 Consultancy .................................................................................................................................. 2
1.3.3 Training programs ........................................................................................................................ 2
1.4 Division of ACCIMT .............................................................................................................................. 3
1.4.1 Communication and Robotics division ......................................................................................... 3
1.4.2 Electronic and Microelectronic division ....................................................................................... 3
1.4.3 Industrial services ........................................................................................................................ 4
1.4.4 Information Technology ............................................................................................................... 4
1.4.5 Space Application division ........................................................................................................... 4
1.4.6 Astronomy .................................................................................................................................... 4
2. Introduction of the task ............................................................................................................................ 5
2.1 Astronomical background ................................................................................................................... 5
2.1.1 Solar Bursts .................................................................................................................................. 5
2.1.2 Fits file .......................................................................................................................................... 5
2.2 Project background ............................................................................................................................. 6
2.2.1 Python language .......................................................................................................................... 6
2.2.2 Image processing techniques – OpenCV ...................................................................................... 7
2.2.2 Tkinter GUI library ........................................................................................................................ 9
3. Objectives ................................................................................................................................................ 10
3.1 Main objective .................................................................................................................................. 10
3.2 specific objectives ............................................................................................................................. 10

vi
3.3 Academic outcomes .......................................................................................................................... 10
4. Methodology ........................................................................................................................................... 11
4.1 software development ...................................................................................................................... 11
4.1.1 Requirements ............................................................................................................................. 11
4.1.2 Implementation ......................................................................................................................... 11
4.2 User Interface development ............................................................................................................. 16
4.2.1 Requirements ............................................................................................................................. 16
4.2.2 Implementation ......................................................................................................................... 16
5. Gantt Chart .............................................................................................................................................. 22
6. Results and discussion ............................................................................................................................ 23
6.1 Results ............................................................................................................................................... 23
6.2 Discussion .......................................................................................................................................... 25
6.2.1 Problems encountered .............................................................................................................. 25
6.2.1 Further Improvements ............................................................................................................... 25
7. Conclusion ............................................................................................................................................... 26
8. Feedback ................................................................................................................................................. 27
9. Summary ................................................................................................................................................. 28
10. References ............................................................................................................................................ 29
11. Annexes ................................................................................................................................................. 31
Table of figures
Figure 1. 1: The largest telescope in Sri Lanka. ............................................................................................. 1
Figure 1. 2:Training program conducted by ACCIMT .................................................................................... 3
Figure 2. 1: image of a solar burst ................................................................................................................ 5
Figure 2. 2: Structure of the fits file. ............................................................................................................. 5
Figure 2. 3: Map of current distribution of CALLISTO instruments............................................................... 6
Figure 2. 4: Logo of the python ..................................................................................................................... 7
Figure 2. 5 : Logo of the openCV ................................................................................................................... 7
Figure 2. 6: Original image ............................................................................................................................ 8
Figure 2. 7 : Gaussianblur image ................................................................................................................... 8
Figure 2. 8: threshold image ......................................................................................................................... 8
Figure 2. 9 : erode and dilate image ............................................................................................................. 8
Figure 2. 10 : Simple code to make a tkinter window .................................................................................. 9

vii
Figure 4. 1: Original image without frequency and time axes. ................................................................... 12
Figure 4. 2: Original image with frequency and time axes. ........................................................................ 12
Figure 4. 3: Solar burst image after gaussianblur filter............................................................................... 12
Figure 4. 4: Image after applying threshold technique. .............................................................................. 13
Figure 4. 5: Image after applying erode technique. .................................................................................... 13
Figure 4. 6: Image after applying dilate technique. .................................................................................... 13
Figure 4. 7: Final identified mask of the solar burst. .................................................................................. 14
Figure 4. 8: Maximum intensity points of the identified solar burst. ......................................................... 15
Figure 4. 9: Curve fit for the max intensity points of the identified solar burst. ........................................ 15
Figure 4. 10: Residual graph of the curve fit. .............................................................................................. 16
Figure 4. 11: The start page of the application. .......................................................................................... 17
Figure 4. 12: Interface to choose option to input file. ................................................................................ 17
Figure 4. 13: Interface to enter details of fits file to extract it from e-CALLISTO network. ........................ 18
Figure 4. 14: Available fits file presentation. .............................................................................................. 18
Figure 4. 15: Interface to browse fits file from PC directory. ..................................................................... 19
Figure 4. 16: Interface to select graphs for the plot. .................................................................................. 19
Figure 4. 17: Message display for file save. ................................................................................................ 20
Figure 4. 18: Extended interface with more plot options. .......................................................................... 20
Figure 4. 19: The plot of the image. ............................................................................................................ 21
Figure 4. 20: The final Page of the application. .......................................................................................... 21
Figure 5. 1: The work schedule during 3 months. ....................................................................................... 22
Figure 6. 1: The Selected solar burst ........................................................................................................... 23
Figure 6. 2: The identified solar burst ......................................................................................................... 23
Figure 6. 3: Located max intensity points of the Solar burst. ..................................................................... 24
Figure 6. 4: The best curve fit for the points. ............................................................................................. 24

1
1. Introduction of the Institute
This gives an introduction about my training establishment, Arthur C. Clarke Institute for Modern
Technologies (ACCIMT). Here it describes about ACCIMT & its history, vision and mission, services and
the divisions of the Institute.
1.1 Arthur C. Clarke Institute for Modern Technologies
Arthur C. Clarke Institute for Modern Technologies is an institute for research and technology
transfer in Sri Lanka. This was found by the renowned British sci-fi creator and designer Sir Arthur
C. Clarke. The organization is chiefly centered around directing examination in the fields of
electronics,micro-electronics,telecommunications,information technology, space advancements
and mechanical technology. It is one of only a handful not many establishments of this sort in Sri
Lanka.
The ACCIMT was set up in 1984 by act of parliament, the Arthur C. Clarke Center for Modern
Technologies Act, No. 30 of 1984 and re-established in a corporate form in 1994 by the Science
and Technology Development Act, No. 11 of 1994. The ACCIMT was chosen as the national point
of convergence for space innovation applications, by the United Nations Economic and Social
Commission for Asia and the Pacific around the same time 1994.In 1996 a 45 cm Go To Cassegrain
reflector telescope was received to this institute as a donation by the Tokyo National
Observatory which was the largest optical telescope in Sri Lanka.
Figure 1. 1: The largest telescope in Sri Lanka.

2
1.2 Vision and Mission
1.2.1 Vision
To be a leading innovation centre for Modern Technologies in the region.
1.2.2 Mission
“To develop, foster and facilitate the domestic base of modern technological capabilities through
innovation, R & D, training, industrial services and international collaboration”.
1.3 Services
1.3.1 Research and Development
The information and communications technology, electronics, microelectronics, space
technology, Astronomy and robotics are some fields which carry out researches in this institute.
The majority of its research is planned for advancing most recent innovation among government
and the private area ventures in Sri Lanka.
1.3.2 Consultancy
Their very much experienced and exceptionally gifted specialized staff give consultancy in
overseeing and overhauling high tech industrial systems, offer their ability and facilities to the
local Industry so as to help overseeing current modern frameworks, for example, microchip based
hardware, telecom frameworks, information systems, PC systems and so forth. Further, the
establishment offers advance symptomatic and fix benefits in the regions of their mastery.
1.3.3 Training programs
Professional Development programs are conducted for professional, experts and senior
managers by ACCIMT. Further more it has additionally propelled electronic workshops and
astronomy outreach programs for school students in Sri Lanka. Library facilities are accessible for
college understudies and the overall population.

3
Figure 1. 2:Training program conducted by ACCIMT
1.4 Division of ACCIMT
1.4.1 Communication and Robotics division
The Communication Division is well furnished with present day instrumentation and computer
systems, which help in applied research and product improvement related to electronics,
broadcast communications and microchip based equipment.
The fields of research that carried out by this division are
• Automation Systems
• Communication Systems
• Rolling Stock Systems
• Unmanned Ground Vehicle
• Unmanned Aerial Vehicle
• Space Technology
1.4.2 Electronic and Microelectronic division
This division does research and development projects, test and estimation administrations,
consultancy administrations, equipment recuperation and Continuous Professional Development
(CPD) courses for the industry. The division basically centers around industry started R&D
activities particularly microcontroller based system structuring, data logging and display systems,
use of sensors, simple circuit plan and electrical cable data securing.

4
1.4.3 Industrial services
The division is for the most part settled to give consultancy support to the electronic business in
the regions of Calibration of test and measuring instruments, Performance test and
measurement administrations and equipment recuperation services of electronic and electrical
lab instruments.
1.4.4 Information Technology
Research, IT Solutions, Technology Transfer and Training Courses are main functions carried out
by the Information Technology Division. within the past more emphasis was made towards
development of software to satisfy the requirements of clients and therefore the transfer of
data concerning IT to general public through courses. The software developed are within the sort
of processing of knowledge to hurry up tasks to offer a far better service to the general
public and also within the sort of information dissemination through information systems.
1.4.5 Space Application division
Space Applications Division has been conducted the activities within the fields of RS/GIS (Remote
Sensing/Geographic Information Systems).
1.4.6 Astronomy
The division is responsible for conducting operation of telescope facility and carryout education
programs of observations. Astronomers within the division are working in close collaboration
with foreign entities and native universities to hold out basic research in astronomy. additionally,
outreach programs for astronomy and space science popularization also are conducting for
public and school children.

5
2. Introduction of the task
This gives an introduction about the project “Determination of Frequency Drift Rate of Solar
Radio Bursts using CALLISTO data” which I carried out at Arthur C.Clarke Institute for Modern
Technologies and introduction to the techniques I used to do this task.
2.1 Astronomical background
2.1.1 Solar Bursts
A sudden flash of increased brightness on the Sun is known as a solar burst and usually it can be
observed near Sun’s surface where a group of sunspots can be observed. In this project I worked
on the type ii solar bursts which are very rare and shows a slow drift from high to low frequency.
Figure 2. 1: image of a solar burst
2.1.2 Fits file
FITS is the most ordinarily used digital file format in astronomy. The standard meaning of the FITS
is Flexible Image Transport System and it consists of multidimensional arrays and 2d tables. This
is mostly used for transporting, analyzing, and archiving scientific data files. In this project the fits
file contains all the data of a solar burst captured by station including the time(s) and
frequency(MHz) range.
Figure 2. 2: Structure of the fits file.
6
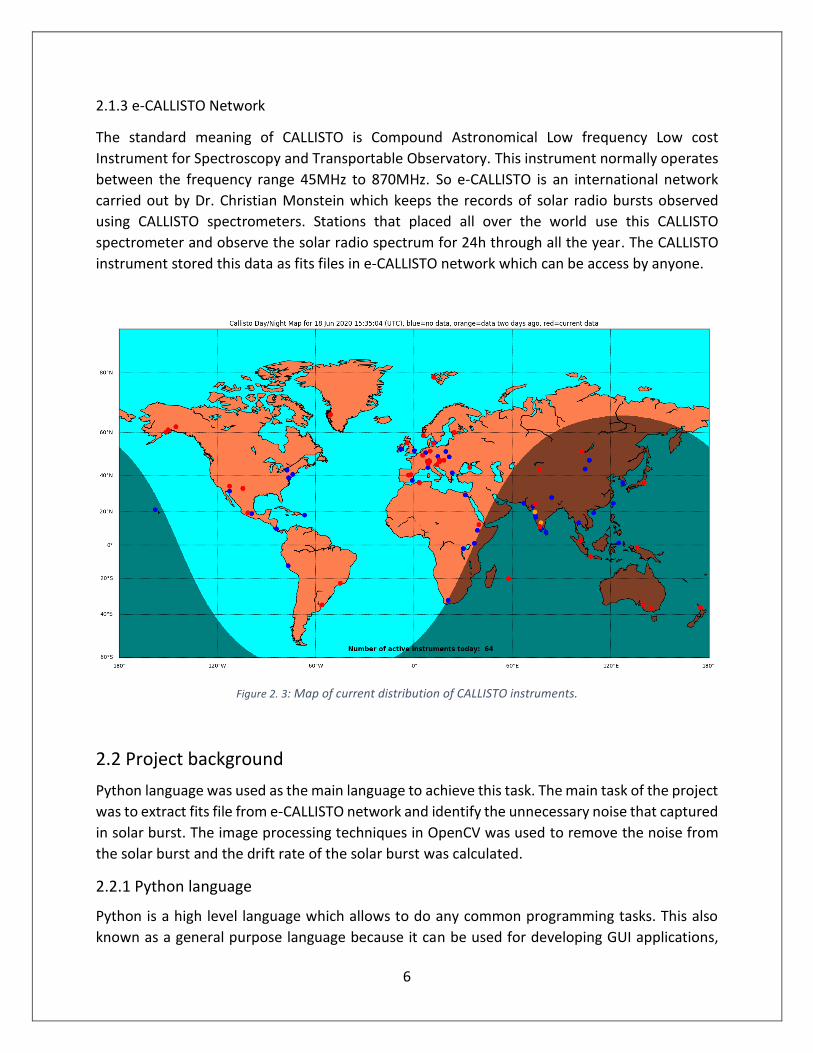
2.1.3 e-CALLISTO Network
The standard meaning of CALLISTO is Compound Astronomical Low frequency Low cost
Instrument for Spectroscopy and Transportable Observatory. This instrument normally operates
between the frequency range 45MHz to 870MHz. So e-CALLISTO is an international network
carried out by Dr. Christian Monstein which keeps the records of solar radio bursts observed
using CALLISTO spectrometers. Stations that placed all over the world use this CALLISTO
spectrometer and observe the solar radio spectrum for 24h through all the year. The CALLISTO
instrument stored this data as fits files in e-CALLISTO network which can be access by anyone.
Figure 2. 3: Map of current distribution of CALLISTO instruments.
2.2 Project background
Python language was used as the main language to achieve this task. The main task of the project
was to extract fits file from e-CALLISTO network and identify the unnecessary noise that captured
in solar burst. The image processing techniques in OpenCV was used to remove the noise from
the solar burst and the drift rate of the solar burst was calculated.
2.2.1 Python language
Python is a high level language which allows to do any common programming tasks. This also
known as a general purpose language because it can be used for developing GUI applications,

7
software development process, data science and many more. This project was done using the
Python version 3.7 and Spyder was used as the integrated development environment (IDE).
There are many libraries in python and matplotlib, astropy, pandas, numpy, PIL, skimage, scipy,
sympy, datetime are some libraries imported for this project.
Figure 2. 4: Logo of the python
2.2.2 Image processing techniques – OpenCV
OpenCV is a library which implemented using C++ language to solve the problems with computer
vision. Techniques like Gaussianblur, threshold, erode and dilate were used in this project.
Figure 2. 5 : Logo of the openCV
• Gaussianblur – This a low pass filter whish helps to reduce high frequency components of
the image. So this technique is used to smoothen or blur the input source image.
• Threshold – In this the pixels of an image is classified according to the given threshold
value. If the pixel value is greater than the threshold value usually it sets that pixel in to
255 otherwise it set to 0.
• Erode – Usually this technique is performed on binary images and it used to remove or
erode pixels on boundary of the object.
• Dilate – This is the opposite of erode which used to add pixels on boundary of the object.

8
Figure 2. 6: Original image
Figure 2. 7 : Gaussianblur image
Figure 2. 8: threshold image
Figure 2. 9 : erode and dilate image

9
2.2.2 Tkinter GUI library
This is a standard GUI library of python. This can be used to develop simple GUI applications. In
this project the GUI application was designed using this library.
The following codes represent how to make a tkinter window simply with one widget.
from tkinter import *
3 root = Tk() # Create the root (base) window
4 w = Label(root, text="Hello, world!") # Create a label with words
5 w.pack() # Put the label into the window
6 root.mainloop() # Start the event loop
Figure 2. 10 : Simple code to make a tkinter window
10
3. Objectives
3.1 Main objective
• How to identify max intensity area from an image.
• Study about the drift rates of different solar radio bursts.
3.2 specific objectives
• Study about different image processing techniques used in python-openCV.
• Learn about curve fitting techniques.
• Learn how to design a simple interface using Tkinter in python.
3.3 Academic outcomes
• Gain knowledge regarding solar bursts and their types.
• Improvement of communication skills.

11
4. Methodology
In this section it includes the procedure and techniques I used to make this project.
4.1 software development
4.1.1 Requirements
In the beginning there was no clear idea about the Astronomical background and project
background. So at first I had to gain the following requirements to achieve this task.
• Studied about solar bursts, fits file and e-CALLISTO network.
• Learned about python commands for fits file handling.
• Learned about image processing techniques.
• Studied about curve fitting techniques.
4.1.2 Implementation
After gaining a bit idea about both Astronomical and project backgrounds I started to work on
the project. The following points shows the work I did in step by step.
• At first I simply tried to read a fit files using different softwares like mathematica, matlap
and python(spyder) and I studied the details included in it. Then I selected python
language to carry out the works further.
• The image is a 2d array in 3600x200 size, So in order to plot the image with both axes
frequency and time I had to convert them according to the ranges of both frequency &
time axes. Some calculations as shown in below were carried out by me to convert the
axes.
Y axis (frequencys-MHz) = 200/frequency range of the station = y (took the round number)
If we assume we get y number of times then I took the first y numbers of the image array
and got the average. Again I got next y numbers and got the average likewise I repeat it
through the 2d array of the image in order to get the y axis values.
X axis (time-s) = 3600/time range=x (took the round number)
As in y axis here I did the same and took the values of the x axis.
Then I plotted the image with axes.

12
Figure 4. 1: Original image without frequency and time axes.
Figure 4. 2: Original image with frequency and time axes.
• Gradually I started to apply four kinds of image processing techniques like GaussianBlur,
Threshold, Erode and Dilate to remove noise from the solar burst and identify the solar
burst correctly from the plotted image. In here I applied four iterations of erode technique
and one iteration from dilate technique.
Figure 4. 3: Solar burst image after gaussianblur filter.

13
Figure 4. 4: Image after applying threshold technique.
Figure 4. 5: Image after applying erode technique.
Figure 4. 6: Image after applying dilate technique.

14
• After that finally I was able to get a somewhat better mask of the solar burst compare to
the original image. When taking this mask I had to put a condition to select the areas with
pixels more than 2000.
Figure 4. 7: Final identified mask of the solar burst.
• After getting the noise free image of the solar burst then I left with locating the maximum
intensity points of the solar burst and following calculations were carried out to select the
points.
1. First I selected the non empty positions (which represent 255 value in
the array) of the mask array.
2. Then I compared those positions with the original image array and got
the pixel intensity value stored in that array.
3. An array was formed using above values and got the average from those
values.
4. Then I gave a command to select the values which are higher than the
average value and formed a new array using that values.
5. When forming the above array I gave another two command to form
array with x axis(time) values and y axis(frequency) values.
6. Finally I gave command to plot x and y arrays in order to get the following
image given below.

15
Figure 4. 8: Maximum intensity points of the identified solar burst.
• Finally I had to fit a curve to the located points in order to find the drift rate. Additionally
I plot a residual graph to observe best fit for the points.
Figure 4. 9: Curve fit for the max intensity points of the identified solar burst.

16
Figure 4. 10: Residual graph of the curve fit.
• Then finally the drift rate of was calculated by taking the derivative of function of the
curve.
4.2 User Interface development
4.2.1 Requirements
I had to design a Graphical User Interface for this project as an additional requirement. At first in
order to fulfill this task I studied about Tkinter GUI library and some techniques as follows.
• Studied how to make a simple window, frames, buttons and layouts.
• Studied how to connect different frames using buttons.
• Learned how to clear previous frames.
4.2.2 Implementation
Before starting to design the interface using tkinter I simply sketched the necessary frames using
a pencil. Then I started to design them according to following steps.
• After studying more about tkinter I simply made a window for the introduction of the
application.

17
Figure 4. 11: The start page of the application.
• Then I made a page with two options to insert fits file either
1. manually or
2. directly extract from http://www.e-callisto.org/ website.
Figure 4. 12: Interface to choose option to input file.

18
• First option brings user to this page as shown in below. Here I made three entries. User
had to insert the date , station and time in the given format to extract the fits file.
Figure 4. 13: Interface to enter details of fits file to extract it from e-CALLISTO network.
Figure 4. 14: Available fits file presentation.
19
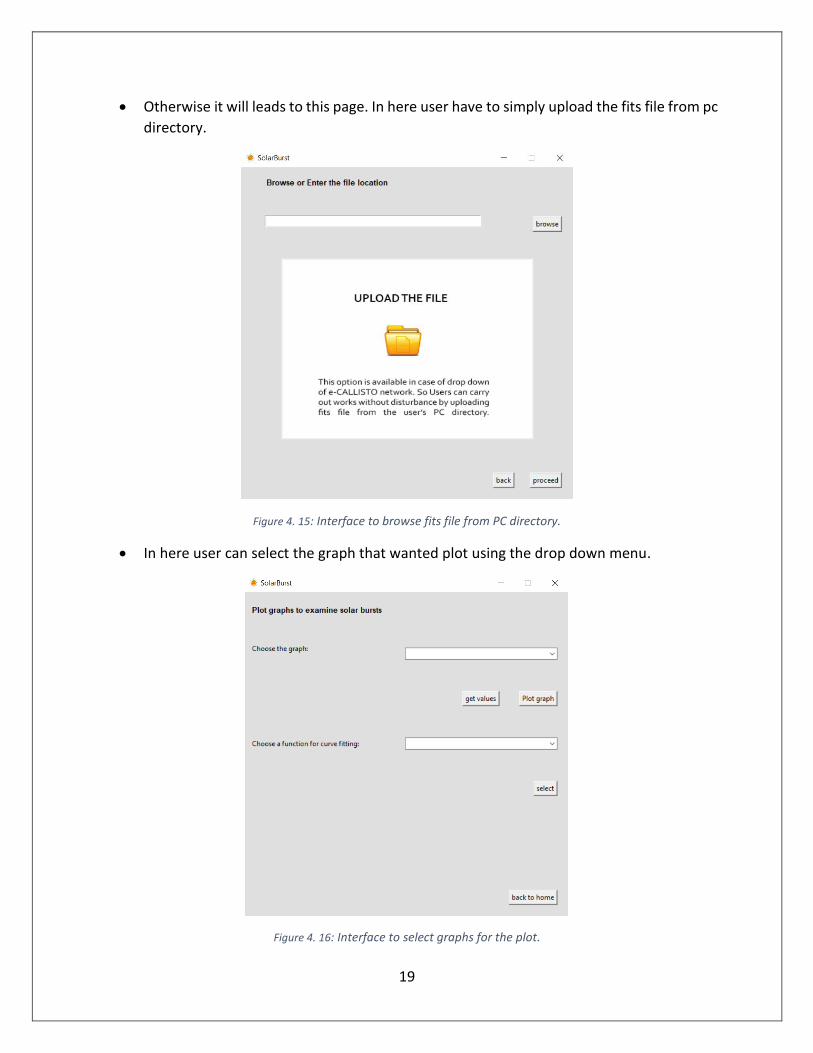
• Otherwise it will leads to this page. In here user have to simply upload the fits file from pc
directory.
Figure 4. 15: Interface to browse fits file from PC directory.
• In here user can select the graph that wanted plot using the drop down menu.
Figure 4. 16: Interface to select graphs for the plot.

20
• I made a button named “get values” which allows user to save.txt file with the values of
x and y axes of the graph.
Figure 4. 17: Message display for file save.
• Then I made a option to observe the curve fitted plots.
Figure 4. 18: Extended interface with more plot options.

21
• Finally I designed this window to display the selected graph. I made this window with tool
bar which gives different options like zoom, pan axis and save figure.
Figure 4. 19: The plot of the image.
• The drift rate can be calculated in this interface by giving the time in seconds.
Figure 4. 20: The final Page of the application.

22
5. Gantt Chart
Figure 5. 1: The work schedule during 3 months.

23
6. Results and discussion
6.1 Results
The main outcome of this project was to identify the solar burst and locate maximum intensity
points of the solar burst image to get the drift rate by doing a curve fit through the points.
So in this project I was able to locate the maximum intensity points of the selected solar burst.
Figure 6. 1: The Selected solar burst
Figure 6. 2: The identified solar burst

24
Figure 6. 3: Located max intensity points of the Solar burst.
The diagram of the result of best curve fit for the located points is given below.
Figure 6. 4: The best curve fit for the points.
The drift rates of different solar flares using the function of the curve was calculated according
to the user input time.

25
6.2 Discussion
6.2.1 Problems encountered
At first I started to do this project using matlab but after I met with founder of e-CALLISTO
network Dr.Christian Monstein, he told me that it is better to do the project using python and he
gave me some python tutorials in handling fits files. So I started to learn about python to work
out on this project. The main purpose of this industrial project was to find the maximum intensity
points of the type ii solar bursts and fit a curve through the points using a matching function in
order to calculate the drift rate. During implementing process I encountered many problems. I
could resolve these problems with the help of my supervisor and my colleagues.
• When running python file dealt with the errors occurred due to misusing expressions,
using class variables incorrectly, specifying parameters incorrectly.
• Had to try numerous image processing techniques in order to get better results.
• Faced some issues with implementing the executable file of the final GUI application./
Although I was able to extract the solar burst from the image by removing the noise I hope there
are more image processing techniques and curve fitting techniques to get better results Due to
limited time It was hard to try every possible techniques. Somehow I was able to complete the
given tasks through the given period of time at a better successful rate.
6.2.1 Further Improvements
In the given limited time I had to do this project while learning the new things from the start. So
because of that I was unable to make a better GUI application to make this process a successful
one. So in future I am planning to obtain better results with new image processing techniques
and develop the interface with some new replacements.
• Update interface with error messages when user inputs incorrect data, when there is
issues with the app.
• Try different image processing techniques to get better results compare to this one.
• Give user input to select the number of pixels that should select when taking the mask of
the solar burst.
• Sometimes the solar burst is captured in two frames. So I am planning to merge the two
frames in to one so user can carry out calculations correctly.
• Suggestion to make it a success application and distribute among public audience.

26
7. Conclusion
• Python can be used by any beginners to do their projects related to programming as it is
a simple and easy to learn language.
• The brightest spot of an image can be identified using image processing techniques like
Gaussianblur, threshold, erode and dilate which can be found in OpenCV python package.
• Tkinter can be used by beginners who are interested make simple interfaces as it is also
easy to learn by beginners.

27
8. Feedback
The 12 weeks that I spend as a trainee in the Arthur C. Clarke Institute for Modern Technologies
(ACCIMT) was a very fruitful period. During that time, I learnt lot of new knowledgeable facts and
technologies within a short period of time. So here I got a huge experience with related to new
technologies in compare to what I expected. It was all thanks to the physics special degree course.
I was able to get many experiences regarding different fields specially in Astronomy field which I
never had experiences. I didn’t have a clear idea about solar flares but thanks to this project I was
able to gain some knowledge regarding them. I had only a little experience with python but
because of my project I was able to know more about python and able to make an interface using
python for the first time. I was also self-learnt about many things in order to complete this task
and that helped me in improving my reading and comprehension skills.
The staff of the ACCIMT was a huge support in completing my project successfully. Specially
Mr.Janaka Adassuriya, industrial supervisor of the project gave me advices and support in order
to make it a success. Apart to the project in there I was able to observe different planets and
stars with the support from the staff there. I was able participate in workshops and training
programs held for school students. This helps me to gain some knowledge about Astronomy field
and also improved some of my soft skills which is a huge help for my future career works.
So as an overall view I was satisfied with my internship at ACCIMT and I recommend this institute
for future undergraduates in physics special degree course.

28
9. Summary
Type ii Solar Bursts are very rare type of solar bursts which show very slow drift from high
frequency to low frequency. This report provides how to calculate drift rate of a type ii solar burst
by removing noise and identifying the solar burst maximum intensity points. A simple interface
was designed to carry this task. Commands in Python language, image processing techniques
gaussian blur, threshold, erode, dilate in OpenCV and Tkinter GUI package was used to make this
task a successful one. All the python commands can be found in the annexes. Results shows that
OpenCV is better for image processing techniques and also curve fitting techniques in python can
be used to achieve better results. This report concludes that python language and its’ different
techniques in image processing can be used by any beginners to do any programming related
projects as it is easy to learn and gives better results as we expected.

29
10. References
[1] C. Monstein, "Catalog of dynamic electromagnetic spectra observed with callisto".
[2] "The fits support office," [Online]. Available: https://fits.gsfc.nasa.gov/. [Accessed 08 01
2020].
[3] "e-CALLISTO," [Online]. Available: http://www.e-callisto.org/index.html. [Accessed 08 01
2020].
[4] S. M. White, "Solar radio bursts and space weather".
[5] "Frequency Drift Rate Investigation of Solar Radio," [Online]. Available:
https://iopscience.iop.org/article/10.1088/1757-899X/180/1/012048/pdf. [Accessed 12 01
2020].
[6] "fits file handling," [Online]. Available: https://docs.astropy.org/en/stable/io/fits/.
[Accessed 20 01 2020].
[7] "Python-GUI programming," [Online]. Available:
https://www.tutorialspoint.com/python/python_gui_programming.htm. [Accessed 29 01
2020].
[8] "Python GUI examples," [Online]. Available: https://likegeeks.com/python-gui-examples-
tkinter-tutorial/. [Accessed 29 01 2020].
[9] "Introduction to GUI programming with tkinter," [Online]. Available: https://python-
textbok.readthedocs.io/en/1.0/Introduction_to_GUI_Programming.html. [Accessed 30 01
2020].
[10] "Basics image processing in python," [Online]. Available:
https://www.codementor.io/@innat_2k14/image-data-analysis-using-numpy-opencv-
part-1-kfadbafx6. [Accessed 20 02 2020].
[11] "Detecting multiple bright spots in an image with Python and OpenCV," [Online]. Available:
https://www.pyimagesearch.com/2016/10/31/detecting-multiple-bright-spots-in-an-
image-with-python-and-opencv/. [Accessed 10 03 2020].
[12] "Fitting curves," [Online]. Available: https://scientific-python-
101.readthedocs.io/scipy/fitting_curves.html. [Accessed 28 03 2020].

30
[13] "Basic Curve Fitting of Scientific Data with Python," [Online]. Available:
https://towardsdatascience.com/basic-curve-fitting-of-scientific-data-with-python-
9592244a2509. [Accessed 29 03 2020].
[14] "Curve Fitting with Linear and Nonlinear Regression," [Online]. Available:
https://blog.minitab.com/blog/adventures-in-statistics-2/curve-fitting-with-linear-and-
nonlinear-regression. [Accessed 29 03 2020].
[15] "Solving Equations and Writing Expressions with SymPy and Python," [Online]. Available:
https://pythonforundergradengineers.com/sympy-expressions-and-equations.html.
[Accessed 02 04 2020].
[16] "Auto py to exe," [Online]. Available: https://dev.to/eshleron/how-to-convert-py-to-exe-
step-by-step-guide-3cfi. [Accessed 06 04 2020].

31
11. Annexes

32

33

34
35

36

37

38

39

40

41

42
43
44
45