Embed Size (px)
Citation preview

Performance and application of a simple automated Magnetic Optical Density meterfor analysis of Magneto-tactic Bacteria
Marcel Welleweerd1, ....., and Leon Abelmann1,2
University of Twente, The Netherlands2KIST Europe, Saarbrucken, Germany
[email protected](Dated: June 15, 2021)
We present a photospectrometer (optical density meter) combined with electromagnets, dedicatedfor the analysis of magneto-tactic bacteria. We ensured that the system can be easily reproducedby keeping the complexity and price of the system low, and by providing the source of the 3D printsfor the housing, the electronic designs, circuit board layouts, and microcontroller software. Wecompare the performance of this novel system to exising adapated commercial photospectrometers.We demonstrate its use by analysing the absorbance of magneto-tactic bacteria as a function oftheir orientiation with respect to the light path and their speed of reorientation after rotating thefield by 90°. We continuously monitored the development of a culture of magneto-tactic bacteriaover a period of five days, and measured the development of their velocity distribution over a periodof an hour. Even though this dedicated optical density meter is relatively simple and inexpensive,the data that can be extracted from suspensions of magneto-tactic bacteria is rich in informationand will help the magneto-tactic research community in the understanding and application of thisintriguing micro-organism.
CONTENTS
I. Introduction 2A. Research question and relevance 2B. Previous work 2C. Structure and contents 2
II. Design considerations 3A. Introduction 3B. Measurement head 3
1. Mechanical 32. Coil system 33. Temperature sensor 44. Light source 45. Photodiode 5
C. Measurement board 51. AD converter 52. Microcontroller 53. Display 54. Storage 65. Current drivers 66. Power Supply 67. Enclosure 6
D. Cabling 6E. Software 7
III. Performance 7A. LED and Photodetector 7
1. Photodetector sensitivity 72. Absorbance validation 83. Time response and noise level 8
B. Magnetic field system 9
IV. Applications 10
A. MSR-1 Angular scattering 101. Theory 112. Experimental Method 123. Results and discussion 12
B. MSR-1 long term growth monitoring 131. Experimental Method 132. Results and discussion 14
C. Marathon test: MC-1 velocity measurement 151. Experimental method 152. Theory 153. Results and discussion 16
D. Possible future applications 161. Multi-color OD 172. Modulated light intensity 173. Combined marathon and Cmag 174. Sedimentation 17
V. Discussion 17A. Measurement head 17B. Measurement board 18C. Software 18
VI. Conclusion 18
Acknowledgments 19
A. C∗mag and Cmag approximations 20
B. Measurements 21
References 23
Typeset by REVTEX
arX
iv:2
106.
0746
6v1
[ph
ysic
s.in
s-de
t] 9
Jun
202
1

2
I. INTRODUCTION
Magneto-tactic bacteria posses a chain of iron-oxidenanocrystals that makes them align with the earth mag-netic field [1, 2]. This property allows them to searchefficiently for the optimimum conditions in stratified wa-ter colums [3]. Schuler and colleagues discovered thatthe transmission of light through suspensions of magneto-tactic bacteria is influenced by the direction of an exter-nally applied field [4]. This effect has been succesfullyapplied as a simple method to monitor for instance thecultivation of magneto-tactic bacteria [5–8], and to assesstheir velocity [9, 10].
A. Research question and relevance
Commonly, the field-dependent transmission ofmagneto-tactic bacteria is measured by expanding a stan-dard photospectrometer with some type of magnetic add-on. These photospectrometers are also known as opticaldensity meters, and are commonly used in biolabs to de-termine cell concentrations.
The modification of existing photospectrometers withmagnetic add-ons comes with several disadvantages:these instruments are relatively complex and expensive,so modifications are mostly done on depreciated equip-ment; most instruments contain magnetic componentsthat disturb the field and there is generally little space tomount electromagnets, certainly not in three dimensions;the various types of photospectrometers and magneticfield generators and the variations between laboratorieslead to a lack of a standardized measurement method;more fundamentally, spectrometers are not intended forcontinuous registration of absorbance over time. Theyare operated manually, and often use flash lights.
In this publication we present a photospectrometerthat intimately integrates the optical components witha magnetic field system, and is dedicated to the researchon magneto-tactic bacteria (figure 1). Additionally, thedesign considers that students at the master or early PhDlevel should be capable to construct such an instrument,both with respect to complexity and price. Our main re-search question was how this new magnetic optical den-sity meter (MagOD) compares to existing adapted photo-spectrometers, and which novel measurement strategiesit enables.
B. Previous work
The system we want to construct is an optical den-sity meter with a magnetic add-on. It is therefore use-ful to compare with commericial photospectrometers.
FIG. 1. Photospectrometer with magnetic field option. Thesystem consist of a measurement head (left) in which a cu-vette with a suspension of magneto-tactic bacteria is inserted.The measurement board (left) is dedicated to control of themagnetic field, data acquisition and communication with theuser over a touchscreen and wifi. The design of the system isopen, including layout for electronic circuit boards (top left),3D print source files (top right) and control software.
These systems generally use a Xenon light source andmonochromator with a large wavelength range. Table Ilists an overview of specifications of representative com-mercial systems (Biochrome Ultrospecs and the Eppen-dorf Biophotometer used by us for comparison), includingtheir wavelength range (λmin - λmax), spectral bandwidth(∆λ), maximum absorbance (OD, see equation 2) and ap-proximate price.
The first photospectrometer modified with a magneticfield module was presented by by Schuler [4]. This de-vice was based on standard optical components and useda permanent magnet generating a 70 mT field. Later ver-sions were constructed around commercial optical densitymeters such as the ones presented by Lefevre [9] (based ona Varian Cary 50 UV) and Song [8] (based on a HitachiU2800). In their case, the magnetic field is generatedby coil systems that can generate adustable fields up to6 mT [9].
Also, table I presents the MagOD system we introducein this paper. Its optical properties and price range com-pare well to standard commericial systems, whereas itsfield range is similar to the adapted systems by Lefevreand Song.
C. Structure and contents
Next to the specifications listed in table I, we definedother specifications that are important for the analysisof magneto-tactic bacteria and the open source nature ofthe instrument. Our design choices will be introducedin section II. In section III, we analyse the performanceof our current implementation and compare it to a com-merical optical density meter. Section IV illustrates thepossibilities of the novel system by giving three exam-
3
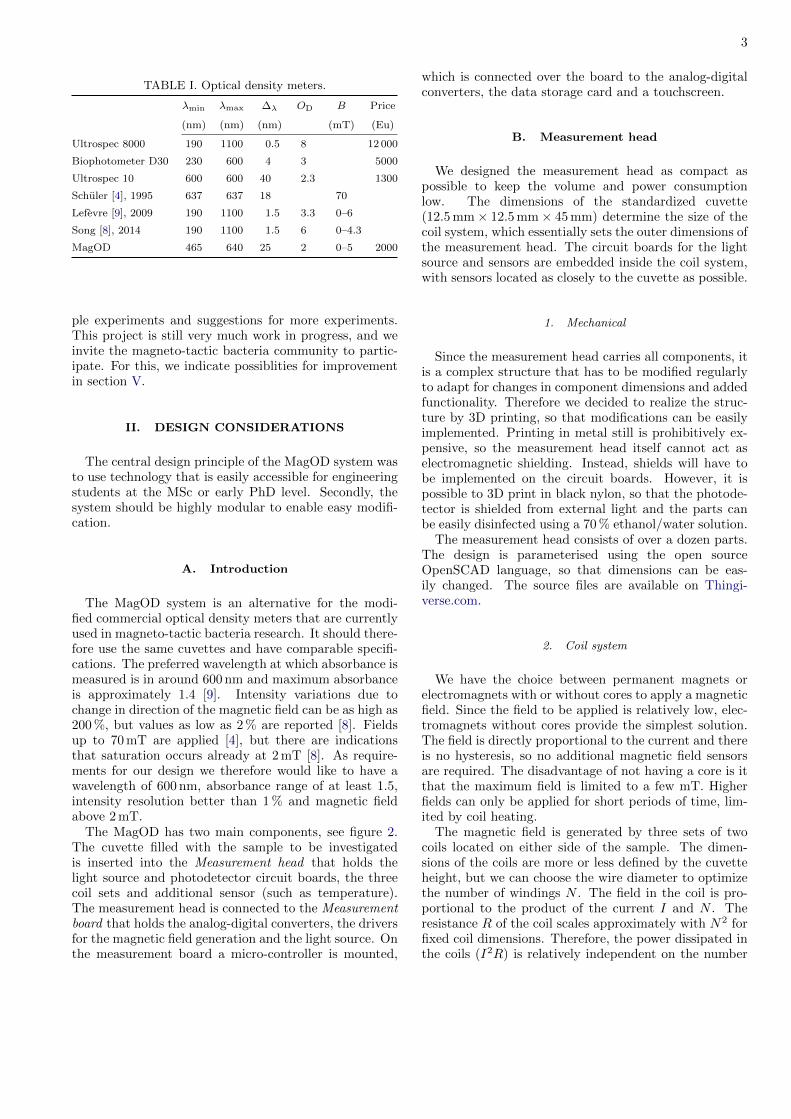
TABLE I. Optical density meters.
λmin λmax ∆λ OD B Price
(nm) (nm) (nm) (mT) (Eu)
Ultrospec 8000 190 1100 0.5 8 12 000
Biophotometer D30 230 600 4 3 5000
Ultrospec 10 600 600 40 2.3 1300
Schuler [4], 1995 637 637 18 70
Lefevre [9], 2009 190 1100 1.5 3.3 0–6
Song [8], 2014 190 1100 1.5 6 0–4.3
MagOD 465 640 25 2 0–5 2000
ple experiments and suggestions for more experiments.This project is still very much work in progress, and weinvite the magneto-tactic bacteria community to partic-ipate. For this, we indicate possiblities for improvementin section V.
II. DESIGN CONSIDERATIONS
The central design principle of the MagOD system wasto use technology that is easily accessible for engineeringstudents at the MSc or early PhD level. Secondly, thesystem should be highly modular to enable easy modifi-cation.
A. Introduction
The MagOD system is an alternative for the modi-fied commercial optical density meters that are currentlyused in magneto-tactic bacteria research. It should there-fore use the same cuvettes and have comparable specifi-cations. The preferred wavelength at which absorbance ismeasured is in around 600 nm and maximum absorbanceis approximately 1.4 [9]. Intensity variations due tochange in direction of the magnetic field can be as high as200 %, but values as low as 2 % are reported [8]. Fieldsup to 70 mT are applied [4], but there are indicationsthat saturation occurs already at 2 mT [8]. As require-ments for our design we therefore would like to have awavelength of 600 nm, absorbance range of at least 1.5,intensity resolution better than 1 % and magnetic fieldabove 2 mT.
The MagOD has two main components, see figure 2.The cuvette filled with the sample to be investigatedis inserted into the Measurement head that holds thelight source and photodetector circuit boards, the threecoil sets and additional sensor (such as temperature).The measurement head is connected to the Measurementboard that holds the analog-digital converters, the driversfor the magnetic field generation and the light source. Onthe measurement board a micro-controller is mounted,
which is connected over the board to the analog-digitalconverters, the data storage card and a touchscreen.
B. Measurement head
We designed the measurement head as compact aspossible to keep the volume and power consumptionlow. The dimensions of the standardized cuvette(12.5 mm× 12.5 mm× 45 mm) determine the size of thecoil system, which essentially sets the outer dimensions ofthe measurement head. The circuit boards for the lightsource and sensors are embedded inside the coil system,with sensors located as closely to the cuvette as possible.
1. Mechanical
Since the measurement head carries all components, itis a complex structure that has to be modified regularlyto adapt for changes in component dimensions and addedfunctionality. Therefore we decided to realize the struc-ture by 3D printing, so that modifications can be easilyimplemented. Printing in metal still is prohibitively ex-pensive, so the measurement head itself cannot act aselectromagnetic shielding. Instead, shields will have tobe implemented on the circuit boards. However, it ispossible to 3D print in black nylon, so that the photode-tector is shielded from external light and the parts canbe easily disinfected using a 70 % ethanol/water solution.
The measurement head consists of over a dozen parts.The design is parameterised using the open sourceOpenSCAD language, so that dimensions can be eas-ily changed. The source files are available on Thingi-verse.com.
2. Coil system
We have the choice between permanent magnets orelectromagnets with or without cores to apply a magneticfield. Since the field to be applied is relatively low, elec-tromagnets without cores provide the simplest solution.The field is directly proportional to the current and thereis no hysteresis, so no additional magnetic field sensorsare required. The disadvantage of not having a core is itthat the maximum field is limited to a few mT. Higherfields can only be applied for short periods of time, lim-ited by coil heating.
The magnetic field is generated by three sets of twocoils located on either side of the sample. The dimen-sions of the coils are more or less defined by the cuvetteheight, but we can choose the wire diameter to optimizethe number of windings N . The field in the coil is pro-portional to the product of the current I and N . Theresistance R of the coil scales approximately with N2 forfixed coil dimensions. Therefore, the power dissipated inthe coils (I2R) is relatively independent on the number

4
RGB LED
PDsig
B
PDref
zx
Measurement head
Temp(°C)
Coils
Coil YMeasurement board
Motor drivers
SD
Current sense
Info Menu
Time
OD
Screen
μC
Dev. Module
Reg.3V
Reg.5Vdig
Buffer
Reg.5Van
ADC
ADC
LED Driver
I2C, 3V
5Vdig
SPI, 3V
5Van
5Van
12V
230V
12V
12V
PWM
PWMDir.
FIG. 2. Diagram of the system: Measurement head: LED, refdiode, diode, amplifier stages, coils, cuvette, bacteria. Measure-ment board: outlet to 12 supply, 12 V to 5 V analog and digital, microcontroller, AD converter, LED driver, motor shields,current sense, HDMI cable, coil cable, SD card, WIFI. User interface: resistive touch screen. Measurement board and userinterface reside in the same housing.
of windings for a given field strength. The inductanceof the coil L scales with N2, so the cut-off frequency(proportional to R/L) is also fairly independent on thechoice of the coil wire diameter. The choice for wire di-ameter is therefore mainly determined by the availabilityof power supplies, specifications of H-Bridges and currentratings on connectors. Table II shows the specificationsof two commercially available coils (Jantzen Audio 000-1235 and 000-0996) as an example. The number of turnswere estimated from the coil resistance (using literaturevalues for wire resistance) and the coil inductance [11].The MagOD design used in this publication incorporatesthe coil with the larger number of windings (996) to ben-efit from the substantially lower currents, but at the ex-pense of a slightly higher cut-off frequency and powerconsumption.
3. Temperature sensor
Electromagnets — especially those without cores —produce heat as a byproduct of the magnetic field. In theabsence of active cooling the temperature of the sampleunder investigation can raise quickly. This is especiallya problem when working with micro-organisms. There-fore, it is important to monitor the temperature of thecuvette. A temperature sensor inserted into the cuvettewould give the most precise estimate, but would be cum-bersome and carries the risk of contaminating the sample.The temperature of the coils can be estimated from theirresistance, but that would overestimate the temperatureof the cuvette. Therefore, we chose to mount a simpleNTC temperature sensor in the housing, as closely aspossible to the cuvette.
TABLE II. Example of coil specifications.
Jantzen Audio coil nr. 1235 0996
Wire gauge 18 22 AWG
Wire diameter 1.0 0.64 mm
Resistance 21 53 mΩ/m
Inner diameter 42 42 mm
Outer diameter 57 53 mm
Height 21 21 mm
Inductance 0.94 2.9 mH
Resistance 0.5 2.1 Ω
Cut-off frequency 85 115 Hz
Windingsa 80(3) 140(7)
Current for 1 mT 0.9b 0.5c A
Voltage for 1 mT 0.44 1.1 V
Power 0.4 0.5 W
a estimated from resistance and inductanceb estimated from number of windingsc from figure 7
4. Light source
Ideally, the absorption pattern of a specimen is mea-sured over a large range of wavelengths. Most opti-cal density meters use a wide spectrum Xenon flashlight in combination with a monochromator. This is arather power-hungry, bulky solution (>10 W, 20 mm),and overkill for the observation of magneto-tactic bac-teria. Instead, we chose an RGB LED as source. TheseLEDs are simple to control, can be mounted closely tothe cuvette, can be operated in continuous mode and canbe easily adjusted in intensity using pulse width modula-tion (PWM). The wavelength however cannot be chosencontinuously, but the wavelength spectrum is determinedby the LED type. Moreover, the wavelength bandwidth

5
per color is rather large (25 nm compared to 5 nm formonochromators).
The LED has a non-diffuse housing such that the lightoutput in the direction of the sample is optimal. TheLEDs can easily be exchanged for e.g. a UV LED, ifthey are mounted on a separate board.
The LED is mounted in common anode configurationsuch that it can be driven by NPN mosfets and the sup-ply difference between the LED (5 V) and the microcon-troller (3 V) does not cause an issue. The frequency ofthe PWM signal is well above the cut-off frequency ofthe photodetector amplifier. The brightness of LEDs de-creases with time. To monitor the LED intensity, a pho-todiode is placed in close vicinity, before the light entersthe cuvette.
5. Photodiode
The detection of the light passing the cuvette can bedone with photo-multiplier tubes, avalange photodiodesand silicon photodiodes. Photo-multipliers have veryhigh sensitivity, but are quite bulky, require high volt-ages and perform less well at long wavelengths. Avalangephotodiodes are also very sensitive, but suffer from non-linearity, noise, high temperature dependence, and alsorequire high voltages to operate. Since the absorbanceof most magneto-tactic bacteria suspensions is low andwe work at low acquisition frequencies, the silicon pho-todiode sensitivity is sufficient. We can take advantageof its small form factor, linearity and ease of operation.We used the more light-sensitive large-area photodiodes(PD) to boost sensitivity. The diode is operated in pho-tovoltaic mode. In this mode the bias voltage is zero, sothe dark current, which is highly temperature sensitive,is minimized.
In the current MagOD implementation, the PD cur-rent is amplified by a two-stage opamp circuit since thesignal is too weak for a single stage amplifier. The firststage is a current to voltage converter. A low noise JFETopamp is applied, because this type of opamp has a lowinput current offset, which reduces DC errors and noiseat the output. The first stage has the largest amplifica-tion in order to minimize the amplification of noise. Theamplifier circuit is located right behind the PD inside aEM-protective casing, so that noise picked up by the ca-bling to the main board is not amplified and interferenceis minimized.
C. Measurement board
Placing the photodiode amplifier directly behind thephotodiode is a good way to suppress interference. Wehave the option to transport the amplified photodiodesignal directly to the measurement board or to includethe AD converter next to the amplifier in the measure-
ment head and convert the analogue to a digital signal.The analogue option has the advantage of a small formfactor for the circuit board and better access for testing.The digital option will suffer less from interference andallows for simpler cabling. Since the current implemen-tation of the MagOD system is very much a developmentproject, we chose to move the AD converters to a sepa-rate measurement board, together with the microproces-sor and other peripherals. For future versions, the digitalsolution might be preferable.
1. AD converter
The measurement board has two analog-to-digital(AD) converters to read out the various analog signalson the system. As the measurements are normally per-formed on a larger timescale, we chose converters whichare able to perform measurements with a sampling rateup to 860 Hz and have integrated anti-aliasing filters. Aresolution of 16-bit provides an upper limit to the ab-sorbance of 4.8, which is more than sufficient. In practise,the absorbance range is limited by stray light scatteringaround the sample.
The AD converters have a free-running mode, whichperforms measurements at an internally defined clockrate. A data-ready pin functions as an external interruptsuch that the microcrontroller can be freed for other taskswhile waiting for the AD converter to finalize its acqui-sition step.
2. Microcontroller
Since data acquisition rates are low, the MagOD sys-tem can be easily controlled by a microcontroller (µC).We can benefit from recent developments in cheap, versa-tile microcontroller development platforms. Rather thanembedding the microprocessor directly on the the elec-tronic board, we chose to include the µC as a develop-ment board. This way, the system can be easily upgradedwith processors with added functionality, or repaired incase of damage.
The current ESP32 microcontroller (µC) has severalcharacteristics which make it suitable for this project: ithas a small form factor, a fast 32-bits dual core processoroperating at 240 MHz, WiFi and Bluetooth and severalperipheral interfaces such as SPI and I2C. Additionally,there is a plugin for the Arduino IDE and many librariesare natively compatible.
3. Display
A resistive touch screen is added to conveniently con-trol the system either with or without protective gloves.Additionally, the screen provides the user with informa-tion on the current and past states of the measurement

6
and levels of the signals. Line drivers on the main boardensure communication is reliable.
4. Storage
The storage of the acquired data and the recipes isdone on a Secure Digital (SD) card. These cards arereadily available in a variety of capacities, are widely ap-plied in DIY projects, and are replaceable in case of adamaged card. The SD card can be interfaced to the µCin the SPI, the 1-bit SD, and the 4-bit SD mode. Whilethe data transfer is faster using the 4-bit SD mode, wechose the SPI mode since it is well supported and thewrite speed is sufficient for our purpose.
5. Current drivers
The current through the coils needs to be controlledto obtain a specific magnitude of the magnetic field. Weuse PWM and benefit from the fact that the high induc-tance of the coil provides a low frequency cut-off filterfor free. The use of PWM minimizes power dissipationin the supply, but results in a current ripple and conse-quently a ripple in the magnetic field. This ripple canbe suppressed by choosing a sufficiently high PMW fre-quency. We use commercial motordrivers because theseare specialized to drive high currents through a coil intwo directions based on a simple two-wire control. Thecurrently employed drivers work with frequencies up to20 kHz, suppressing the ripple by at least a factor of 100.The drivers can be interchanged by alternative motordrivers with similar capabilities.
The magnetic field is linearly dependent on the cur-rent. However, the current is not linearly dependent onthe PWM duty cycle, as the internal resistance of thecoil will vary due to temperature changes. A precise mea-surement of the current is necessary to close the loop andto assess the applied magnetic field. Therefore, a shuntresistor is placed in series with each coil. The voltagedrop over this resistor is amplified using a current sens-ing amplifier and digitized with the AD converter. Themeasured signal can either be used to determine the truecurrent, or applied in a feedback loop to compensate forcoil heating.
6. Power Supply
The measurement board electronics operate at lowvoltages (3 or 5 V). However, the magnetic coil system ispreferably operated at higher voltages, to limit the cur-rents and subsequent requirements for cabling and con-nectors. For reasonable winding wire diameters, the cur-rents are in the range of a few ampere and the resistanceof the coils in the order of a few ohm. Therefore, the
main on-board supply is 12 V, for which a wide rangeof external power supplies are available and which evenallows for operation from a car battery while in the field.
In the current MagOD implementation, the three coilsets have a combined resistance of 4.2 Ω at room temper-ature. The maximum current is close to 3 A with 12 V.This maximum current through each coil set simultane-ously would require a power supply of at most 120 W.
The analog and digital circuitry have a separate 5 Vsupply line to prevent noise originating from the switch-ing nature of the digital circuitry to interfere with themeasurement. The analog 5 V supply is built using anultra low noise linear regulator, whereas the digital 5 Vis built with a switching regulator. The latter is moreefficient, but produces inherently more electronic noise.The 3 V needed for the microcontroller originates from alinear regulator integrated on the microcontroller board.
7. Enclosure
The device is enclosed in a lasercut plastic housing.The choice for plastic was made since it does not blockthe wifi signal. We do not have to worry about interfer-ence signals, since the measurement signal is amplified inthe measurement head and the unshielded sections of theleads to the AD converter are kept very short.
The design is made such that no extra materials areneeded for assembly. Additionally, the parts can be man-ufactured with a 3D printer. The source code for thedesign is available on github.
D. Cabling
While designing the MagOD system, it was envisionedthat measurements could take place inside controlled en-vironments, such as incubators and fridges. Thereforethe system was separated into two parts, connected bycabling. Components that did not need to be on the mea-surement head were moved to a separate module. In ournaivity, we underestimated the additional complicationof cabling and connectors, which take a big chunk out ofthe price and assembly time budget.
We chose to resort to commercially available cablingwhere possible to minimize the damage. For the commu-nication with the amplifier boards in the measurementhead we chose an HDMI cable. These contain shieldedtwisted pair cables with separate non-isolated ground linethat are perfectly suited to transmit analogue signalswith low interference (5V, signal, ground). The HDMIinterface progressed through several standards. TheHDMI2.1 + Internet standard has five shielded twistedpair that can be used for measurement signals (for in-stance 3 photodiodes, NTC and Hall sensor) and fourseparate wires that can be used for control signals (3LEDs). The connectors on the main board, amplifierboards and motor drives are standard Molex connectors.

7
The coils are connected to standard measurement leadswith banana connectors. We could not find a suitablestandard cable with connectors with six 3 A wiring toconnect the control unit to the measurement head, sothat is the only cable that has to be custom-made.
E. Software
Most modifications to the MagOD system will be at thesoftware level, which will primarily be done by studentsand inexperienced programmers. Generally, (electrical)engineering students and many hobbyists are skilled inprogramming of Arduino development boards. There-fore, the microprocessor (ESP32) was programmed in thesame way as an Arduino project, using c++ and the na-tive Arduino IDE as compiler.
The disadvantage of the Arduino IDE is that it isnot very suitable for larger projects. The current im-plementation is already exceeding 5000 lines of code.The code was set up in a highly modular way to as-sist new programmers in navigation, using only onemain source file (.ino, .h) of 1000 lines, and a dozenlocal library source files (src/*.cpp) for e.g. screenaccess, readout of the ADC, writing to Flash mem-ory, Wifi access. The source code can be found ongithub.com/LeonAbelmann/MagOD.
III. PERFORMANCE
Several iterations of MagOD systems have been re-alised based on the design considerations of section II.We expect that more iterations will follow, not only byour team but also by others in the field of magneto-tacticbacteria. The most recent implementation can be foundonline (github.com/LeonAbelmann/MagOD). We mea-sured the performance on the current implementation ofthe MagOD meter (version 2) with respect to the opti-cal and magnetic components to provide a baseline forfuture improvement.
A. LED and Photodetector
1. Photodetector sensitivity
The MagOD systems is equipped with a three colorLED which allows selection of three wavelengths (peakintensities at 645, 520 and 460 nm), either individual orin combination. The LEDs are individually driven by aPWM voltage to adjust their intensity, for instance tomatch the absorbance of the liquid in the cuvette. Areference photodiode is mounted adjacent to the LEDswhich captures a small fraction of the LEDs’ light, tomonitor variations in the LED efficiency. Figure 3 showsthe signal of the detector and reference photodiodes as a
0
1
2
3
4
0 0.2 0.4 0.6 0.8 1
photodiode
reference diode
Signal / V
Relative intensity
FIG. 3. Photodiode and reference diode signal versus the LEDdutycycle (proportional to effective power). The photodiodesignal is linear with the duty cycle for the red (645 nm) andgreen (520 nm) LED, but not for the blue (460 nm) LED. Thereference diode signal is linear with the duty cycle of all leds.The fit parameters for the linear fits are shown in table III.
function of the average LED power, for the three differentwavelengths. The light pattern is shown in figure 16 inappendix B, and a video in the Supplementary Material.
Space restrictions forced us to design the two stageamplifier such that the output decreases with increas-ing LED power. The reference photodiode, which hasonly one amplifier stage, has an increasing output withincreasing intensity.
The relation between output voltage and intensity islinear, except for the combination of the blue LED andthe detector photodiode. The sensitivity to the blue lightdrops at high intensity of the incident light, which wasconfirmed by measurement with liquids of different ab-sorbance (figure 17 in appendix B). Since the blue LEDdoes not shine directly on the reference diode, it does notshow the saturation but clips at maximum AD converteroutput. Therefore, the blue LED should only be used foraccurate absorbance at low incident power (signal above2 V). At low intensity, the sensitivities of the red andblue channels are approximately equal, and twice as highas the green channel for the chosen combination of LEDand photodetector.
The linear fits to the data are listed in table III. Thereis a small variation in offset (less than 1 % relative to thefull range), which however cannot be fully attributed tomeasurement inaccuracy. We suspect this undesired ef-fect originates from temperature drift. Automatic offsetcorrection can be applied by modulating the LED in-tensity periodically to achieve highly accurate measure-ments.

8
TABLE III. Linear fits to measurements of figure 3. The blueLED has a non-linear response and is not tabulated.
LED photodiode reference diode
Color Imax offset slope offset slopemA V V/Imax V V/Imax
Red 20(2) 3.159(5) −15.28(4) 0.545(3) 3.305(5)
Green 20(2) 3.168(2) −6.696(9) 0.516(1) 1.902(2)
Blue 20(2) 0.532(1) 6.152(5)
2. Absorbance validation
To validate performance with respect to standard ab-sorbance measurements, we compared the MagOD sys-tem with a commercial optical density meter (EppendorfBioPhotoMeter Plus). Figure 4 shows the absorbancerelative to water as a function of the wavelength of thelight for a range of dilutions of a suspension of magneticnanoparticles (FerroTec EMG 304). The transmission oflight measured by the MagOD meter was averaged fora range of photodiode intensities ranging from zero tosaturation. For the blue LED however, care was takento measure only at low intensities, where the response islinear (see figure 3).
As expected, the absorbance increases with increasingnanoparticle concentration (indicated on the right of thegraphs). The absorbance increases with decreasing wave-length, which is in agreement with the observation thatthe solution has a brown appearance. Care was takento determine the accuracy of the measurement as accu-rately as possible. At this precision, it is clear that thenovel MagOD meter and the commercial instrument de-viate. This deviation is however never larger than 0.2 forabsorbances below 2. Above this value, the deviation be-comes considerable (datapoints inside dotted loop), prob-ably because of light scattering onto the photodetectorthrough other paths.
The blue LED seems to systematically underestimatethe absorbance, which may be related to the fact thatthe response of the detector is ill defined. The maximumabsorbance is comparable to the commercial instrument.We therefore conclude that the instrument works satis-factory as a conventional absorbance meter, especiallythe red and green channels.
3. Time response and noise level
The ADS1115 AD converter has a maximum samplingrate of 860 samples/s, which means a sampling time of1.2 ms. Figure 5 shows a time sequence of the sam-pled photodiode signal at that rate. The red LED wasswitched on and modulated from 46 to 47 bits on a full
FIG. 4. Absorbance relative to water measured with theMagOD meter (encircled datapoints) for the three LEDs,compared to the OD measured by an Eppendorf BioPhotoMe-ter measured as a function of the wavelength. A range of di-lutions of a water based ferrofluid was used (FerroTec EMG304, the dilution factor is indicated on the right). The data-points for every dilution are indicated by a line to guide theeye. The difference between the MagOD meter and the com-mercial instrument is larger than the estimated measurementerror, but less than 0.2 for absorbances below 2. Above thisvalue, the estimate is unreliable (points inside dotted loop),.The absorbance of the blue LED is systematically lower thanthe commercial instrument. The maximum absorbance mea-sured was 1.82, which is slightly lower than the commercialinstrument (2.14).
range of 255 (relative intensity approximately 0.18) ev-ery 250 samples. The total acquisition of 1300 sam-ples took 4023 ms, so the effective sample-rate was only323 samples/s. The reduction in data-rate is due to com-munication overhead with the AD converter, and can beoptimized.
The data in figure 5 shows two clear levels, without anymeasurement points in transition from one to the other.Therefore, we can safely conclude that the response ofthe MagOD meter at the highest sample-rate is betterthan 3.1 ms. This is in agreement with the filter appliedin the feedback loop of the amplifier, which has a −3 dBpoint at 800 Hz (1.25 ms).
The ADS1115 has an internal filter that matches thebandwidth, which can be selected from discrete valuesof 8, 32, 64, 128, 250, 475 and 860 samples/s. Therefore,the noise should decrease at lower sample-rates. Figure 6shows the standard deviation of 1000 samples, which isequal to the RMS noise, as a function of the sample-rate. As expected, the noise increases with increasingsample-rate, but much steeper than can be expected froma white noise spectrum (noise proportional to the squareroot of the bandwidth). There is a strong jump in noiseabove 64 samples/s. Most likely, this is caused by thepresence of a 50 Hz cross-talk signal. At 64 samples/sand below, the noise is in the order of 1 bit or 125 µV.Since the full range of the detector circuit is 3.1 V, this

9
830
840
850
860
870
0 1 2 3
Signal / mV
time / s
FIG. 5. The detector photodiode voltage sampled by theAD converter at a rate of 860 samples/s, while the red LEDpower is modulated by 0.4 %. The effective sample-rate was323 samples/s. No transitions between the levels can be ob-served, so the time response of the detector photodiode isbetter than 3.1 ms.
corresponds to a dynamic range of 88 dB or a theoreticalupper limit to the detectable absorbance of 4.4. Thiscompares very favourably to the commercial Eppendorfsystem, which has a resolution in OD of 1× 10⁻³ on fullrange of approximately 2. Assuming that the noise levelof the Eppendorf system is comparable to the resolution,this would correspond to a dynamic range of only 53 dB.
At 64 samples/s the noise level is 16 µV/√
Hz. Spicesimulations indicate that the theoretical noise level ofthe amplifier is in the order of 0.5 µV/
√Hz, so we have
not yet reached the full potential of the electronics.
B. Magnetic field system
Figure 7 shows the magnetic field in the center ofthe system, as a function of the current through eachof the three coil sets. The coils generate approximately2 mT/A, with around 5 % variation between the coils.The maximum field that can be generated is slightlyhigher than 5 mT at full current of approximately 2.5 A.The pulse width of the modulation of the driver cir-cuits can be set with a resolution of at maximum 16 bit,corresponding to a theoretical field resolution of about70 nT. In practise, we operate the PWM at 8 bit resolu-tion which gives a setpoint resolution of about 20 µT.
Since we drive the coils with a PWM signal, the currentthrough the coils is not constant but follows the modula-tion frequency. At zero and maximum current, the rippleis absent. The ripple has a maximum at 50 % duty cycle.
0
1
2
3
4
5
6
0 200 400 600 800 0
0.2
0.4
0.6
standard
deviation
/ bit
standard
deviation
/ mV
sample-rate x s
FIG. 6. Standard deviation (rms noise) over 1000 samplestaken by the AD converter of the detector photodiode signal,as function of the sample-rate. The noise increases with in-creasing sample-rate, but not proportional to the square rootof the bandwidth (solid line). Above 64 samples/s there is astrong increase in noise.
The filtering action of the coil system dampens the mod-ulation. At a PWM drive frequency of 20 kHz and 50 %modulation we measured a triangular current signal witha peak-peak amplitude of 24(2) mA on mean current of1.2 A. Simulations considering only the LR nature of thecoils, with a corner frequency of 115 Hz, give a theoreticalamplitude of 18 mA, so there probably is some additionalcapacitive coupling. The current variation corresponds toa maximum field variation in the field of approximately50 µT or 1.2 %.
At the maximum current of 2.5 A, the coils dissipateabout 13.1 W each. Since the coil system has no activecooling the heating of the sample area can be consider-able at prolonged measurement times. An NTC temper-ature sensor mounted on the body of the measurementchamber to monitor the temperature. Figure 8 shows thetemperature rise of the NTC mounted on the chamber.We also measured the temperature in the chamber witha simple alcohol thermometer for comparison. The tem-perature of the coils can be estimated from the increasein coil resistance assuming the temperature coefficient ofcopper (0.393 %/K).
At a drive current of 0.5 A (field strength of 1 mT) theheating rate of chamber barely noticeable (about 1 K/h).The average temperature of the coils increases with ap-proximately 8 K/h. At a drive current of 1.2 A, the tem-perature of the coils increase by 21 K. The temperatureincrease of the chamber is substantial, with an initial in-crease of approximately 0.25 K/min, flattening out at 7to 8 K after 40 min.

10
-6
-4
-2
0
2
4
6
-3 -2 -1 0 1 2 3
X: 2.175 (0.009) mT/AY: 2.113 (0.003) mT/AZ: 2.007 (0.003) mT/A
Field
/ mT
Coil current / A
FIG. 7. Magnetic field in the center of the cuvette holder asa function of average coil current. The fields in x, y and zdirection with a field to current ratio of 2.175(9), 2.113(3) and2.007(3) mT/A respectively.
IV. APPLICATIONS
We present three experiments to illustrate the appli-cation of the MagOD meter in the analysis of magneto-tactic bacteria. We measure the scattering of Magne-tospirillum Gryphiswaldense (MSR-1) as a function oftheir angle to the incident light and their response asa function of time during culture growth. In the thirdexperiment, we measured the velocity distribution of theunipolar Magnetococcus marinus (MC-1) as a function oftime. At the end of this section, we present some ideasfor other measurements that can be performed with thecurrent system.
A. MSR-1 Angular scattering
When cultivating magneto-tactic bacteria such asMSR-1, it is important to check whether the bacteria re-main magnetic. Since we generally optimize growth con-ditions, the oxygen concentration is optimal and thereare sufficient nutrients. Therefore, there is no need forthe bacteria to develop magnetosomes. Consequently,cultures in the lab tend to loose their ability to formmagnetosomes [12].
The standard method to determine the fraction of bac-teria with magnetosomes in a culture is to observe thechanges of light transmitted through a suspension of bac-teria under rotation of a magnetic field [4]. For MSR-1,the maximum intensity is found when the field is per-pendicular to the light path, whereas the minimum is
FIG. 8. Top: Temperature of the coil system as a functionof time, for different drive currents. At the maximum drivecurrent of 2.5 A, corresponding to 5 mT, the coils heat rapidlyand operation should be limited to a few minutes. Bottom:MagOD frame temperature (closed symbols) and air temper-ature in the chamber (open symbols) as a function of time. Ata drive current below 1.2 A (2.4 mT) the temperature increaseof the frame is limited to about 6 K.
obtained when the field is aligned parallel to the lightpath. This is somewhat counter-intuitive, since MSR-1have the smallest projected cross-section when they arealigned along the line of view. (As an analogue to blinds,MRS-1 let the light pass if the blinds are closed). MSR-1 are small compared to the wavelength of the incidentlight, especially considering their cross-section, and theirindex of refraction is only slightly higher than the sur-rounding liquid. These small ‘optically soft’ objects scat-ter more light in the forward direction if their projectedarea along the light path increases [13].
For MSR-1, the projected area is roughly proportionalto the sine of the angle between the long axis of the bacte-

11
ria body and the light path. Due to Brownian motion andflagellar movement, the bacteria will not be aligned per-fectly along the field direction but show an angular distri-bution. The width of this distribution will reduce withincreasing field. In the following, we develop a simpletheory to account for this effect. Since the MagOD me-ter allows us to accurately adjust the angle and strengthof the magnetic field, we can use it to validate the ap-proximation.
1. Theory
a. Angle dependent scattering, Cmag We define theangle between the field and the MSR-1 long axis as θ (seefigure 10), and introduce a scattering factor relative tothe intensity of light reaching the photodetector (I(θ) in(V)).
g(θ) =Imax − I(θ)
Imax − Imin(1)
For MSR-1 the photodetector signal I has a maximumwhen the MSR-1 are aligned perpendicular to the lightbeam (Imax=I(90)=I⊥), at which point scattering, g(90),is minimal.
Schuler [4] introduced a parameter to characterize therelative fraction of magneto-tactic bacteria by compar-ing the light reaching the detector for the magneticfield aligned parallel and perpendicular to the light path(Cmag, ‘coefficient of magnetically induced differentiallight scattering’ or ‘ratio of scattering intensities’ [14]).Assuming that the scattering intensity can be estimatedfrom the reduction of light reaching the detector as com-pared to the reference value of a sample without bacteria(Iref), the original definition is
C∗mag =Iref − I(0)
Iref − I(90).
With increasing concentration of bacteria, the totalamount of light reaching the photodetector will decrease.In microbiology, traditionally cultures are characterizedby a parameter (‘optical density’) that relates the reduc-tion in light intensity to the reference value on a 10-baselog scale.
OD(θ) = log
(IrefI(θ)
)= log (Iref)− log (I(θ)) (2)
After the pioneering work of Schuler, researchersstarted to equip these optical density meters (’turbidime-ters’) with magnetic fields. Using these instruments, it ismore convenient to define Cmag as [8, 14–16]
Cmag =OD‖
OD⊥=
log(Iref)− log(I(0))
log(Iref)− log(I(90))(3)
Nowadays, the latter definition is commonly used. Itshould be noted however that the values are not identical,not even for Cmag close to unity (see appendix A). Sincein the absence of magneto-tactic bacteria Cmag equalsunity, often (Cmag-1) is plotted [7, 14, 16–18].
Next to the ratio, it is insightful to study the absolutedifference between the absorbances in the parallel andperpendicular direction
∆OD = OD‖ −OD⊥
= log(I(90))− log(I(0)) (4)
This difference is proportional to the absolute amountof magneto-tactic bacteria that rotate in the field.
b. Dynamic response The response of bacteria torotating uniform magnetic fields is determined by thebalance between magnetic torque and rotational dragtorque [19–21]. Alignment of a bacterium to an exter-nal magnetic field with angle θ(t) can be described by asimple differential equation:
f∂θ(t)
∂t+mB sin θ(t) = 0,
where f [N m s] represents the rotational drag coeffi-cient, m [A m2] the magnetic dipole moment of the bac-terium, and B [T] the magnetic field strength. Initiallywe assume the bacterium to be orthogonal to the mag-netic field θ(0) = π/2. Solving for θ yields:
θ(t) = 2 cot−1 exp
(mB
ft
)≈ π
2exp
(−0.85
mB
ft
). (5)
The approximation is better than 0.065 rad. The angleθ can be indirectly estimated from the measured scat-tering as described by equation 1. The settling time ofthis transition period is characterised by time constantτ = f/mB. As in Pichel et al. [19], we scale the re-sponse time to the magnetic field, introducing a generalrotational velocity parameter γ (rad/Ts):
γ =m
πf=
1
πτB.
c. Brownian Motion So far we have left out rota-tional Brownian motion as a disturbing influence on theorientation of bacteria. There is an interplay betweentemperature-driven rotational diffusion and the externalfield which prevents full alignment of MTB. The angulardistribution of MTB b(θ) in a static magnetic field is fullydetermined by the ratio of magnetic and thermal energyaccording to Maxwell-Boltzmann statistics [22]:

12
b(θ) =
∫ 2π
0e
mBkT cos θ sin(θ)dφ∫e
mBkT cos θdΩ
=1
2
mB
kT
sin(θ)
sinh(mBkT )e
mBkT cos θ,
where k [J K−1] is the Boltzmann constant and and T[K] the temperature.
As a first order approximation, we assume that thescatter factor is proportional to projection of the bacteriashape on the light direction. Defining α as the anglebetween the bacteria long axis and the lightpath, thescattering factor than becomes
g(α) = 1− |sin(α)|
The angle α is the combined result of the angle betweenthe light and the field direction θ and the angle betweenthe bacteria and the field φ. We should take into accountthat for a fixed φ a full revolution around the field axisis possible (β = 0..2π). One can show that the relationbetween α and these three angles is
cos(α) = − sin(θ) sin(φ) cos(β) + cos(θ) cos(φ)
resulting in an expression for the scattering factor
g(θ, φ, β) = 1−√
1− cos(α)2
The average scattering factor can be obtained by dou-ble numerical integration, first over all values of β andthan over the distribution of φ
< g(θ) >=
∫ π
0
g(θ, φ)b(φ)dφ,
The numerical integration was performed in python,the source code of which is available as SupplementaryMaterial. Figure 9 shows the resulting average scatteringfactor as a function of the applied field angle for vary-ing energy product mB. At an energy mB well above40 kT, the angular dependence approaches a 1 − sin(θ)relationship. Assuming a dipole moment of 0.25 fA m2 asreported in our earlier work [19], mB=40 kT correspondsto a field of about 0.7 mT.
2. Experimental Method
The cuvette with MSR-1 bacteria, grown accordingto [19], with an OD of approximately 1.1 was insertedin the MagOD system. We measured the intensity on
0
0.2
0.4
0.6
0.8
1
0 15 30 45 60 75 90
mB = 0.1 kT
2
4
6
9
17
40
Infnite
average
scatter factor <g>
angle θ/degrees
FIG. 9. Calculation of the average scatter factor as a func-tion of the applied field, for varying values of the product ofthe magnetic moment of the magnetosome chain m and theapplied field B, in units of kT at room temperature. Whenall bacteria are perfectly aligned (mB/kT =∞), the averagescatter factor is inversely correlated to the projection crosssection of the bacteria on the light path (g = 1− sin(θ)). Atlower fields, the loss of alignment reduces the angular depen-dence, which disappears for mB < kT .
the photodetector as a function of the angle of the mag-netic field with steps of approximately 5°. The magneticfield varied with angle, but was always over 1 mT. As theoptical density of the sample is continuously fluctuatingdue to activity and sedimentation within the cuvette, 20sweeps were taken per angle. The resulting curves werenormalised to a range of 0 to 1 and averaged.
3. Results and discussion
a. Scatter factor as function of angle Figure 10shows the angle-dependent scatter factor g(θ). Basedon the scattering theory [13], we expect the scatteringto be inversely proportional to the projected area (soto sin(θ)). Indeed, a simple inverted sine fits surpris-ingly well. The strongest deviation is around the paral-lel alignment, which is understandable. The MSR-1 arenot infinitely thin rods, but spirals. Therefore, the pro-jected area will be less sensitive to variations in the anglearound the long axis. Additionally, the culture of MSRwill have a distribution in angles (due to Brownian mo-tion for instance, see above), which will ‘smear out’ thesharp corner at θ = 0. An illustration of this effect formB=60 kT is shown in the red curve, which still does notfit the measurement very well. It seems therefore likelythat the actual bacteria shape, and maybe also their dis-tribution, should be included in the model.

13
FIG. 10. The scattering of a culture of MTB is dependent onorientation of the external magnetic field; it is highest whenthe field (so also the bacteria) are aligned parallel with thelight beam and lowest when the field is aligned orthogonal. Bynormalizing from [0, 1], we obtain the angle-dependent scatterfactor g(θ) that can be relatively well approximated by a sine.The flattening of the curve around 0° can be partly explainedby additional brownian motion of the bacteria (red curve).
b. Absorbance as function of field and time In ourlab, we most commonly perform measurements in whichthe sample of MSR-1 is subjected to a field switching be-tween parallel and perpendicular to the light path, withvarying field strengths. Figure 11 shows the measuredresponse for a set of field cycles. At a high field value of3 mT the field is switched from parallel to perpendicularafter 10 s. For the lower field value of 0.4 mT we can takea longer reversal times since coil heating is no issue.
The absorbance is high (transmission of light is low)when the field is aligned along the light path1. From thedifference in detector signals, we can calculate ∆OD usingequation 4. The signal of the growth medium withoutbacteria (Iref) was 301(1) mV, so we can calculate Cmag
using equation 3.The difference in transmission between in-plane and
perpendicular alignment is higher at 3 mT as comparedto 0.4 mT. This is in agreement with the predicted in-crease of scatter factor with increasing field (Figure 9).Figure 12 shows the calculated difference in scatter fac-tor as a function of the magnetic field, scaled to kT/m.From previous analysis of MSR-1 [19] we estimated thatthe mean magnetic moment m of the magnetosome chainis 0.25 fAm2, with a 10-90 % cutoff of the distribution of
1 This measurement was performed with an older, single stage pho-todiode amplifier, unlike the measurement in figure 3 made withthe new amplifier that has an inverted response
0.07 and 0.57 fAm2 respectively. We can convert theseranges of moments to the energy ratio mB/kT for thetwo difference field values. The ranges are indicated onthe top axis of the graph by lines and the mean valuesby red circles on the graph. The predicted reduction be-tween the average scatter factors (0.20) at the two fieldvalues is less than observed in figure 11 (0.5). However,considering that we have a simplified model and our pre-vious estimate of the magnetic moment may be differentfor the current sample, the agreement with the measure-ment is acceptable. Since the MagOD system has precisefield control, it allows for a simple study of the relationbetween field strength and Cmag. It would be interestingto check if the swimming activity of the bacteria them-selves contributes to their random motion, which effec-tively would increase kT and could explain the observeddifference. For instance, it would be sufficient to mea-sure Cmag as a function of field before and after killingthe MSR-1 by intense UV-light.
Next to a decrease in step height, the time responsealso decreases with decreasing field. The time constantis estimated from a fit of equation 5 to the data using thesum of squared errors criterion. The time constant of thetransitions to 3 mT is 1.7(5) s, which is approximately 13times higher than the time constant of 5.4(8) s of thetransition to 0.4 mT. The ratio is on the high side, butstill within measurement error equal to the ratio of thefields, as expected.
B. MSR-1 long term growth monitoring
In our lab, MSR-1 are grown in 3 mL tubes. Thetubes are closed with a small air head space to ensure aproper reduction in oxygen concentration when the cul-ture grows. This way, we hope to promote the formationof magnetosome crystals. Even though this method issimple, it’s major disadvantage is that we have no cluewhether the magnetosome formation is as we expect. Thebetter option would be to grow in bioreactors, but theseare complex and costly and provide quantities that areoverkill for lab-on-chip experiments.
The MagOD system offers a solution since we can mon-itor the growth of MSR-1 bacteria and the magnetosomeby keeping cultures in cuvettes inside the MagOD meterfor long periods. During the growth period we continu-ously measure the absorbance under change of the exter-nal magnetic field. In this way we obtain information onthe total number of bacteria, as well as their magneticresponse.
1. Experimental Method
MSR-1 cultures were prepared as normal [19], but in-serted in quartz cuvettes with PTFE stopper (Hellma

14
FIG. 11. Two cycles of a measurement sequence. The mag-netic field is alternatively aligned parallel and perpendicularto the light beam. At high field (3.0 mT), we can determine∆OD from the difference between the averages of the detectorsignals (red lines), from which we can calculate Cmag (The sig-nal of the growth medium without bacteria was 301(1) mV).The difference between the two directions of the field dropsconsiderably at low field (0.4 mT), whereas the response timeincreases. These low fields are suitable for estimation of thethe time constant τ from a fit to an exponential (blue line).Using the field magnitude, we can calculate γ (rad/mT s).
QS 110-10-40) to avoid any leaking of oxygen into thecuvette. For the long term observations of figure 13, themagnetic field was set to loop through cycles of 100 sconsisting of a vertical field of 1.0 mT (20 s), a horizontalfield of 2.9 mT (20 s) and a vertical field of 0.1 mT (60 s).
The first transition is at a relatively strong fields, guar-anteeing reliable estimations of Cmag. The second tran-sition guarantees a relative large time constant which ishelpful for accurately estimating τ . These settings allowthe OD meter to measure the sample parameters with10 mHz acquisition rate.
2. Results and discussion
Figure 13 shows the measured parameters of a sampleof MTB over a period of five days. From top to bottomwe plot the the optical density (OD), relative (Cmag) andabsolute (∆OD) magnetic response and relative rotationvelocity (γ, proportional to the ratio between magneticmoment and rotational friction coefficient).
The optical density OD is typical for a bacteria growthsequence. After a lag phase (L), a transition into the ex-ponential growth phase (E) occurs followed by the sta-tionary phase (S) where the bacteria concentration re-
0
0.2
0.4
0.6
0.8
1
500 1 10 100
| 0.4 mT || 3.0 mT |
θ=0
θ=90
Δg
average
scatter <g
>
mB/kT
MSR1
FIG. 12. Calculation of the average scatter factor as a func-tion of the product of the magnetic moment of the magnet-some chain (m) and applied magnetic field (B), for the mag-netic field aligned parallel (θ=0°), and perpendicular (θ=90°)to the light path (see Figure 9). The difference in average scat-ter factor between the orientations is indicated by a red line(∆g). From earlier work [19] we estimated that the mean mag-netic moment of the magnetosome chain is 0.25 fAm2, with a10-90 % cutoff of the distribution of 0.07 and 0.57 fAm2 re-spectively. The resulting ranges in mB/kT are indicated onthe top axis and by red circles for the mean values of themoments, for the fields used in the experiment of figure 11.
mains more or less constant. After three days however,the density increases unexpectedly (X).
During the exponential growth phase, the Cmag de-creases sharply. Since ∆OD remains constant, we assumethat the increase in concentration is entirely due bac-teria without magnetosomes. Only after two days wesee a gradual increase in magnetic signal (M) due to anincrease in the fraction of bacteria with magnetosomes.With the increase in magnetic signal, also γ increases, sothe magnetosome length increases compared to the aver-age bacteria length. The observation over the first threedays would be consistent with the mechanism that afterseeding with magnetic bacteria, growth first proceeds byan increase in non-magnetic bacteria. When that growthstops, the bacteria start to form magnetosomes.
However, after approximately 3.3 days a sharp transi-tion occurs (X). As the density of the culture increasesagain, the magnetic response decreases but the γ keepson increasing. We have seen this feature more often.Additionally, we sometimes observe a cloudiness in thesuspension. Since we do not shake the suspensions be-fore measuring like in a standard optical density meter,these clouds may float in front of the detector and com-plicate the analysis. It is very well possible that ratherthan rotating individual bacteria, we rotate the entirecloud. One might consider including a piezo module inthe MagOD to shake cuvettes for long term measure-

15
L E S
XM
X
OD
Cm
agΔ
OD
γ / (
rad/
mTs
)
Time / day
1.3
1.2
1.1
1
1.05
1.1
1
0.01
0.005
0
1.5
1
0.5
01 2 3 40
FIG. 13. The bacteria colony parameters measured over aspan of five days; the optical density (OD), the Cmag (quan-tifying the ratio of magnetic to nonmagnetic bacteria), the∆OD (quantifying the amount of magnetic bacteria), and theγ (quantifying how strong the bacteria respond to magneticfields). The following phases can be identified: lag phase (L),exponential phase (E), stationary phase (S), magnetic growthphase (M) and an some undefined phase (X) probably linkedwith formation of bacteria clouds.
ments, or perform these measurements with regular man-ual shaking.
C. Marathon test: MC-1 velocity measurement
In contrast to MRS-1 bacteria, that reverse frequently,magneto-tactic bacteria of type MC-1 tend to swim forlong periods into the same direction [9]. This allows usto collect a large number of bacteria at the bottom of acuvette, simply by applying a vertical field. After revers-ing the direction of the field, all bacteria swim upward in
a band-shaped cloud. In the MagOD, the passing of thiscloud translates to a drop in the photodetector signal.The time between reversal of the field and the responseon the photodetector is a measure for the velocity of thebacteria. We nickname this method the ‘marathon’ test.
1. Experimental method
Cultivation of MC-1 bacteria is performed in high vis-cosity agarose based medium in an oxygen gradient, asdescribed by Lefevre [23]. The bacteria form a band inthe reaction tube, a few mm below the surface of themedium. The easies way to free the MC-1 from themedium is to pipette a small amount from the band andinsert this into a cuvette filled with a low viscosity growthmedium from which the agarose has been omitted. Thetransfer of some agarose cannot be avoided, especially iflarge quantities of bacteria are desired.
A second option to free the MC-1 from the agarosegrowth medium is to filter them by means of a Pasteurpipette filled with a small plug of cotton. Our assump-tion is that the cotton breaks up the agarose matrix andperhaps even captures it. By using compressed nitrogento drive the growth medium with bacteria through theplug, exposure to oxygen can be avoided. To further re-duce oxygen exposure, we performed this procedure un-der nitrogen atmosphere. For this, we simply use a glasbeaker with a parafin cover through which the Pasteurpipette is inserted into the cuvette. When using this sec-ond method, the liquid in the cuvette appears to have alower viscosity than when using the first method, but noquantitative measurements have been performed yet.
Since the MagOD is equipped with a 3D magnetic coilconfiguration, application of a vertical field, along the cu-vette, is simple. A field of 1 mT is applied in the positivez-direction for 220 s, after which the field is reversed for200 s. The asymmetry in time ensures that the bacteriacan assemble at the bottom of the cuvette again. Thecloud of bacteria that leaves the bottom of the cuvettedisperses due to a distribution of bacteria velocities. Tokeep the peak sharp and intensity variation high, we re-duce the distance between the bottom of the cuvette andthe light path to 2.5 mm by using a special insert.
2. Theory
We discovered that the arrival time t (s) of MC-1 atthe detector fits well to a log-normal distribution,
ft(t) =1
tσ√
2πexp
(− (ln(t)− µ)
2
2σ2
)(1/s), (6)
where µ (with unit ln(s)) and σ (unitless) are the meanand standard deviation of the natural logarithm of t.From the distance of the bottom of the cuvette to the

16
light beam a (2.5 mm) we can calculate the distributionof the velocities v (m/s),
fv(v) =1
vσ√
2πexp
(−(ln(av )− µ
)22σ2
)(s/m). (7)
The most likely velocity, or mode of this distribution,is
vm = a exp(−(µ+ σ2)
)(m/s). (8)
Note that the most likely arrival time is exp(µ − σ2),so one cannot simply divide the distance travelled by themost likely arrival time to obtain the most likely velocity.
3. Results and discussion
Figure 14 shows the output of the photodetector as afunction of time since the magnetic field reversal. Af-ter approximately 30 s the cloud reaches the light path,with a maximum density at about 90 s 2. Repeatedexperiments show a similar shape, but at lower ampli-tude. Apparently, less and less bacteria are collecting atthe bottom of the cuvette. The decrease in amplitude,shown in figure 15, fits very well to an exponential decay(exp(−t/τ)) with a time constant of approximately halfan hour.
From the fit of the intensity variation as a functionof time we can calculate the velocity distribution usingequation 7, shown in figure 14 in the bottom graph. Thecurves are offset vertically for clarity, the top curve isthe first measurement. From this figure it is clear thatthe velocity distribution of the bacteria does not changesignificantly with time. Since the experiment durationwas limited to 200 s, the minimum velocity that can bedetermined is 12.5 µm/s. The most likely velocity is onthe order of 20 µm/s, the fastest bacteria swim approxi-mately 80 µm/s.
D. Possible future applications
The three experiments listed above are just some of thepossiblities that the novel MagOD systems offers. With-out additional modification, we can imagine more exper-iments, which we report here to inspire future work.
2 These experiments are performed with the novel amplifier. Lowerintensity results in a higher detector voltage, see figure 3.
0 25 50 75 100 125 150 175 200time / s
2.72
2.76
2.80
Vdio
de /
V
0 10 20 30 40 50 60velocity / ( m/s)
velo
city
dens
ity ×
m
/s
0.02
FIG. 14. Output of photodetector as a function of time passedsince reversal of the magnetic field. After approximate 30 s,the first MC-1 pass the light beam and scatter the light. Maxi-mum light extinction is reached about 90 s. The experiment isrepeated eight times, with intervals of 440 s between the mea-surements. The responses fit relatively well to a log-normaldistribution (red lines). These fits can be inverted to obtainthe velocity distribution of the MC-1 (bottom curve). Forclarity, these curves are offset by 0.005 from top to bottom.The velocity distribution remains more or less constant.
0
20
40
60
80
100
0 10 20 30 40 50 60 70
τ = 27.6(9) min
Amplitude
/ mV
Time / min
FIG. 15. The decrease in amplitude of the marathon curves offigure 14 with increasing time fits very well to an exponentialdecay.

17
1. Multi-color OD
So far we have measured the transmission throughMSR-1 cultures only under green light. We notice how-ever that the colour of cultures changes as time passed by.We speculate that these colour changes may be causedby an increase in bacteria size and/or formation of mag-netosomes. For long term analysis as in figure 13, it maytherefore be usefull to measure at different wavelengths.In the MagOD system, this can easily achieved by mea-suring iteratively with the red, green and blue LED. Mul-tiple wavelengths may be combined with the addition ofan indicator agent that changes its absorbance spectrumbased on changes in conditions.
An example of such an indicator is Resuzarin, whichreacts to an increase in oxygen concentration with a shiftin the absorbance spectrum toward the red. The ratio be-tween the absorbance in the red and green channels couldtherefore be a measure for the oxygen concentration inthe culture, using the blue channel for calibration.
2. Modulated light intensity
The intensity of the LEDs can be varied rapidly, asis illustated in figure 5. One can use this modulationfor differential measurements to correct for intereferencesignals due to changes in environmental light or cross-talkon the analogue signal wiring.
Modulation of the light intensity would also provideinformation on the photosensitivity of the bacteria. Onecould for instance measure the Cmag in the red channelbefore and after a pulse with intense blue light.
3. Combined marathon and Cmag
We demonstrated Cmag measurements on MSR-1 bac-teria. and marathon tests on MC-1 bacteria. It isstraightforward to combine the marathon test with Cmag
measurements. The vertical field (z-direction) shouldthan be switched between zero and for instance a postivevalue, whereas the field along the light path (x-direction)should be switch between zero and alternatively positiveand negative values (So (x, z)= (0,1), (1,0), (0,1), (-1,0),etc). Such an experiment may reveal if the distributionin velocity is related to a distribution in magnetosomestrength as well.
4. Sedimentation
We often observe an initial increase of light transmis-sion after loading a sample with bacteria. We thereforeusually wait until the signal settles. However, there may
be information we can extract. We suspect the increase intransmission is caused by sedimentation of debris, suchas dead bacteria. If the dead bacteria have magneto-somes, they will still rotate in the magnetic field. So ameasurement of Cmag during sedimentation may provideadditonal information on the status of the culture.
Moreover, it is very simple to drive only one coil of thevertical coil set. In this way one can generate field gradi-ents that would pull magnetic debris either up or down,thus decelerating or accelerating the sedimentation.
V. DISCUSSION
The MagOD magnetic absorbance instrument hasproven to be a versatile system that can be successfullyapplied in the research on magneto-tactic bacteria. Alldesigns and source codes are made available, so that thesystem can be easily replicated, modified and improved.The data presented in this paper may serve as benchmarkfor future systems.
There are a few issues that will need attention in futureiterations of the system, on the level of the measurementhead, measurement board and software.
A. Measurement head
The response of the photodiode to the blue LED isnon-linear (Figure 3), for which we do not have a goodexplanation. Furthermore, the fact that the signal isinversely proportional to the light intensity is counter-intuitive. It may be possible to redesign the amplifierwhile still maintaining the required footprint. The noisefloor in the current design is still a factor of 30 above thetheoretical limit, and there are signs that 50 Hz cross-talkis deteriorating the signal (Figure 6). One may considermoving the AD converter from the measurement boardto the measurement head, so that the signal is betterprotected from interference.
Similarly, one may consider moving the drivers for theLEDs to the measurement head, so that the high fre-quency PWM signal does not have to be transported overthe HDMI signal cable. For this, RGB led drivers thatcommunicate over I2C are readily available.
In contrast to commercial absorbance meters, theMagOD system does not have a piezo actuator to dis-perse the suspension before measurement. One may con-sider integrating such a piezo actuator. Alternatively,one may make use of the existing coils and attempt avoice coil actuation principle using a soft magnetic ele-ment, additional small coil or even a small permanentmagnet mounted in such a way that it does not interferewith the field.

18
B. Measurement board
In future designs of the measurement board, a num-ber of improvements can be made as well. Even thoughthe AD converter is capable of data acquisition at860 samples/s, we only reach 323 samples/s in practise.The reason for the additional overhead is not clear to us.
The current implementation of the current measure-ment circuits only allows for positive currents . The mod-ification to allow for bi-directional currents is straightfor-ward.
Finally, the use of micro-SD cards poses a problemin biolab environments, especially if WiFi access is notavailable. A USB stick may be a better option.
C. Software
We expect most development in the software for theMagOD system. Next to improvements in the user inter-face, currently, the main restriction is that measurementrecipes are based on feedforward instructions only (iter-ations of ‘for this amount of time, set the field and LEDcolor’). There is no capability to react on changes in thedetected signal. For instance, it would be very usefulif the LED intensity could automatically be adjusted tothe absorbance of the suspension under investigation. Inmarathon experiments, it would be convenient if the fieldreversal takes place at a fixed delay after occurence of thepeak. The current recipe language definition is not capa-ble of handling this type of feedback. We suspect a com-plete redesign of the software is required, which wouldbe a very interesting task for an (software) engineeringstudent.
VI. CONCLUSION
We constructed a magnetic optical density meter,which analyses the amount of light transmitted through asuspension of a magneto-tactic bacteria in a transparentcuvette under application of a magnetic field.
Light absorbance measurements with the novelMagOD system were compared with a commercial instru-ment (Eppendorf), using of a dilution series of a magneticnanoparticle suspension. The deviation between the newOD meter and the commercial instrument is below 0.2in terms of relatively absorbance for wavelengths rang-ing from 460 to 645 nm. The blue channel however suf-fers from non-linearity and should only be used at lowintensity. The dynamic range (noise versus maximumsignal) of the new system is 88 dB (OD of 4.4), wherethe commercial system reaches 53 dB (OD of 2.6). TheMagOD system is considerably faster, with a sample rate
of 323 samples/s. The commercial instrument has a sam-pling time in excess of 1 s.
The magnetic field can be applied in three directions,with a setpoint resolution of 70 nT and a ripple of lessthan 50 µT. The maximum field is 5.1(1) mT, but limitedin duration due to coil heating. When a field of 1.0 mT iscontinuously applied, the temperature increase of cuvetteis approximately 1 K/h and limited to 2.1(3) K.
The MagOD system was used to characterize variousaspects of MSR-1 and MC-1 magneto-tactic bacteria.
By means of the magnetic field, MSR-1 were orientedat varying angle with respect to the light path. Theabsorbance is large when bacteria are aligned along thelight beam and reduces when the bacteria are alignedperpendicular to the light path. The relation betweenangle and optical density can be approximated relativelywell by a sine.
From the difference in absorbance, we can derive ameasure for the relative amount of magnetic over non-magnetic bacteria. This difference is commonly ex-pressed as a ratio (Cmag), but can also be expressed as adifference, which is proportional to the absolute amountof magnetic bacteria (∆OD). Both values increase withapplied field strength in a way that is within measure-ment error in agreement with a simple model based onBrownian motion.
We used the MagOD system to continuously monitorthe development of a culture of MSR-1 magnetotacticbacteria over 5 days. We recorded the optical density(OD), change in OD under rotation of the magnetic field(Cmag and ∆OD) and the rotation velocity of the bac-teria (γ). We could clearly distinguish separate growthphases (lag, exponential growth, stationary, and mag-netic growth). The data suggests that in the exponentialgrowth phase the increase in bacteria concentration isdue to an increase of non-magnetic bacteria only, whichis reflected in a drop in Cmag and a stable ∆OD. Aftertransition into the stationary phase, in which the opticaldensity no longer increases, the bacteria become moremagnetic with an increase in Cmag and rotation speedγ. This suggests that the newly formed non-magneticbacteria start to form magnetosomes as well.
Unipolar bacteria, such as MC-1, can be collected atthe bottom of the cuvette with a vertical magnetic field.Upon reversal of the field the entire group departs fromthe bottom and will arrive at the light beam, causing adip in the transmitted light. This ‘marathon’ test allowsus to measure the velocity distribution.
The arrival times can be accurately described by a log-normal distribution, with a mode (most occurring veloc-ity) of 20 µm/s. The maximum velocity observed is in theorder of 80 µm/s. The amount of bacteria participatingin the marathon decreases exponentially with each testwith a time constant of approximately half an hour.
This dedicated optical density meter is relatively sim-ple and inexpensive, yet the data that can be extractedfrom bacteria cultures is valuable. In addition to the ex-periments we report, we suggest a number of additional

19
tests that can provide even more information on the prop-erties of magneto-tactic bacteria cultures.
All information for the construction of the device, in-cluding 3D print designs, printed circuit board layoutsand code for the microprocessor has been made avail-able online. For students that want to participate in thedevelopment, we have made suggestions for further im-provement of the system. The authors trust that themagneto-tactic bacteria community will benefit from ourwork, and that the MagOD instrument will become astandard tool.
ACKNOWLEDGMENTS

20
Appendix A: C∗mag and Cmag approximations
The effect of a rotation of the magnetic field is usuallysmall. It therefore is useful to express the variation withrespect to the average intensity or absorbance3
Is =I(0) + I(90)
2, (A1)
A = log(Iref/Is). (A2)
by a small deviation α
A(0) = (1 + α)A (A3)
A(90) = (1− α)A (A4)
so that
∆A = 2αA (A5)
and
Cmag =(1 + α)
(1− α)≈ 1 + 2α = 1 +
∆A
A. (A6)
The approximation is better than 5 % in terms ofCmag − 1 for Cmag < 1.1.
Similarly, we can define for the estimate of C∗mag
∆I = 2βIs, (A7)
so that
C∗mag ≈ 1 +Is
Iref − Is2β = 1 +
∆I
Iref − Is(A8)
Both definitions of Cmag can be related by realizingthat
I(0)
Iref=
(IsIref
)1+α
≈ IsIref
(1 + α ln(Is/Iref)) (A9)
and similarly for I(90) with −α, so that
∆I = −2αIs ln(Is/Iref) (A10)
So in the approximation for Cmag close to unity, therelation between both definitions is
3 A=OD
Cmag − 1
C∗mag − 1≈ ∆A
A
Iref − Is∆I
= (A11)
Iref − IsIs ln(Iref/Is)
=(Iref − Is) log(e)
IsA. (A12)
The definitions converge for Is → Iref, so for sampleswith very low optical density.
21
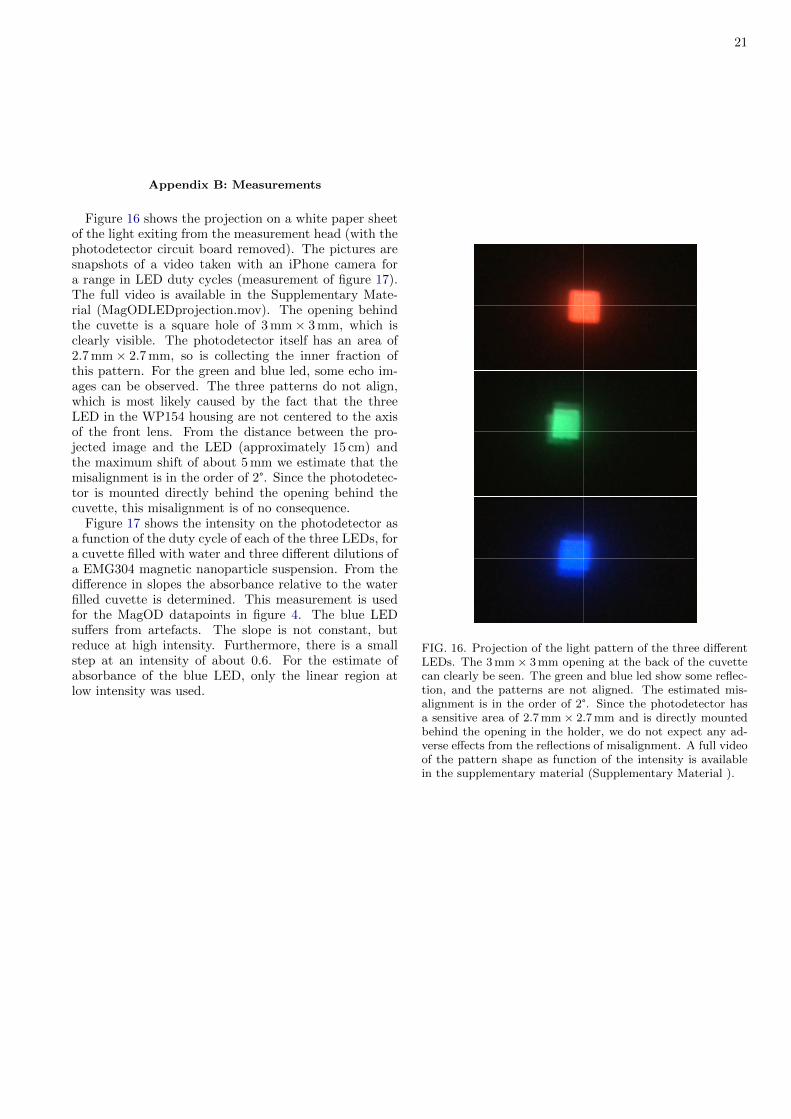
Appendix B: Measurements
Figure 16 shows the projection on a white paper sheetof the light exiting from the measurement head (with thephotodetector circuit board removed). The pictures aresnapshots of a video taken with an iPhone camera fora range in LED duty cycles (measurement of figure 17).The full video is available in the Supplementary Mate-rial (MagODLEDprojection.mov). The opening behindthe cuvette is a square hole of 3 mm× 3 mm, which isclearly visible. The photodetector itself has an area of2.7 mm× 2.7 mm, so is collecting the inner fraction ofthis pattern. For the green and blue led, some echo im-ages can be observed. The three patterns do not align,which is most likely caused by the fact that the threeLED in the WP154 housing are not centered to the axisof the front lens. From the distance between the pro-jected image and the LED (approximately 15 cm) andthe maximum shift of about 5 mm we estimate that themisalignment is in the order of 2°. Since the photodetec-tor is mounted directly behind the opening behind thecuvette, this misalignment is of no consequence.
Figure 17 shows the intensity on the photodetector asa function of the duty cycle of each of the three LEDs, fora cuvette filled with water and three different dilutions ofa EMG304 magnetic nanoparticle suspension. From thedifference in slopes the absorbance relative to the waterfilled cuvette is determined. This measurement is usedfor the MagOD datapoints in figure 4. The blue LEDsuffers from artefacts. The slope is not constant, butreduce at high intensity. Furthermore, there is a smallstep at an intensity of about 0.6. For the estimate ofabsorbance of the blue LED, only the linear region atlow intensity was used.
FIG. 16. Projection of the light pattern of the three differentLEDs. The 3 mm× 3 mm opening at the back of the cuvettecan clearly be seen. The green and blue led show some reflec-tion, and the patterns are not aligned. The estimated mis-alignment is in the order of 2°. Since the photodetector hasa sensitive area of 2.7 mm× 2.7 mm and is directly mountedbehind the opening in the holder, we do not expect any ad-verse effects from the reflections of misalignment. A full videoof the pattern shape as function of the intensity is availablein the supplementary material (Supplementary Material ).

22
0
1
2
3
0 0.2 0.4 0.6 0.8 1
Signal / V
Relative intensity
water0.0000850.0004690.0009380.0022170.004880
FIG. 17. Signal as a function of the duty cycle of the LED,for the three different LED wavelengths and for a water ref-erence and three different dilutions of a EMG304 magneticnanoparticle suspension.

23
[1] S. Bellini, Chinese Journal of Oceanology and Limnology27, 3 (2009).
[2] R. P. Blakemore, D. Maratea, and R. S. Wolfe, Journalof Bacteriology 140, 720 (1979).
[3] C. Lefevre, M. Bennet, L. Landau, P. Vach, D. Pignol,D. Bazylinski, R. Frankel, S. Klumpp, and D. Faivre,Biophysical Journal 107, 527 (2014).
[4] D. Schuler, R. Uhl, and E. Bauerlein, FEMS Microbiol-ogy Letters 132, 139 (1995).
[5] D. Faivre, A. Fischer, I. Garcia-Rubio, G. Mastrogia-como, and A. Gehring, Biophysical Journal 99, 1268(2010).
[6] A. Fernandez-Castane, H. Li, O. R. Thomas, and T. W.Overton, New Biotechnology 46, 22 (2018).
[7] J. Yang, S. Li, X. Huang, T. Tang, W. Jiang, T. Zhang,and Y. Li, Frontiers in Microbiology 4, (2013).
[8] T. Song, L. Zhao, and L.-F. Wu, IEEE Transactions onMagnetics 50, (2014).
[9] C. Lefevre, T. Song, J.-P. Yonnet, and L.-F. Wu, Appliedand Environmental Microbiology 75, 3835 (2009).
[10] C.-Y. Chen, C.-F. Chen, Y. Yi, L.-J. Chen, L.-F. Wu,and T. Song, Biomedical Microdevices 16, 761 (2014).
[11] J. E. Lane, R. C. Youngquist, C. D. Immer, and J. C.Simpson, National Aeronautics and Space Administra-tion, Washington , (2001).
[12] F. Popp, J. Armitage, and D. Schuler, Nature Commu-nications 5, (2014).
[13] M. Bennet, D. Gur, J. Yoon, Y. Park, and D. Faivre,Advanced Optical Materials 5, 1600617 (2016).
[14] E. Katzmann, M. Eibauer, W. Lin, Y. Pan, J. Plitzko,and D. Schuler, Applied and Environmental Microbiology79, 7755 (2013).
[15] L. Zhao, D. Wu, L.-F. Wu, and T. Song, Journal of Bio-chemical and Biophysical Methods 70, 377 (2007).
[16] C. Lang and D. Schuler, Applied and Environmental Mi-crobiology 74, 4944 (2008).
[17] D. Schuler and E. Baeuerlein, Journal of Bacteriology180, 159 (1998).
[18] U. Heyen and D. Schuler, Applied Microbiology andBiotechnology 61, 536 (2003).
[19] M. P. Pichel, T. A. G. Hageman, I. S. M. Khalil, A. Manz,and L. Abelmann, Journal of Magnetism and MagneticMaterials 460, 340 (2018).
[20] C. Zahn, S. Keller, M. Toro-Nahuelpan, P. Dorscht,W. Gross, M. Laumann, S. Gekle, W. Zimmermann,D. Schuler, and H. Kress, Scientific Reports 7, (2017).
[21] D. Esquivel and H. Lins de Barros, Journal of Experi-mental Biology 121, 153 (1986).
[22] H. Bryant, D. Sergatskov, D. Lovato, N. Adolphi, R. Lar-son, and E. Flynn, Physics in Medicine and Biology 52,4009 (2007).
[23] C. T. Lefevre, P. A. Howse, M. L. Schmidt, M. Sabaty,N. Menguy, G. W. Luther, and D. A. Bazylinski, Envi-ronmental Microbiology Reports 8, 1003 (2016).