Embed Size (px)
Citation preview

ENERGY AUDIT REPORT
University Of Wollongong
Main Campus Site Report
Prepared by
Version 5.6
August 2007
Disclaimer:
EMET Consultants and its personnel have no financial interests in any equipment or supplier services
recommended in this report

Energy Audit Report Main Campus
Document History and Status
Rev. Date Reviewed By Approved By Revision Details
3.0 20Nov06 C Berry, S Pupilli S Pupilli Prelim. Draft – Partial results included
3.1 23Nov06 C Berry, S Pupilli S Pupilli Final Draft
4.2 28Nov06 C Hewitt, C Berry, S Pupilli
S Pupilli UoW comments incorporated
5 13Dec06 C Hewitt, C Berry, S Pupilli
S Pupilli Results of Bldg 16 incorporated
5.4 15Mar07 C Hewitt, C Berry, S Pupilli
S Pupilli Further UoW comments incorporated
5.6 20Aug07 C Hewitt, C Berry, S Pupilli
S Pupilli Corrected figure in Table E1 and Table 5.1
Distribution of copies:
Copy No. Quantity Issued To
V3-1 1 C. Hewitt – UoW – 22Nov06
V4.2-1 1 C. Hewitt – UoW – 28Nov06
V5.2-1 1 C. Hewitt – UoW
V5.4-1 1 C. Hewitt – UoW
V5.5-1 1 C. Hewitt – UoW
V5.6-1 1 C. Hewitt – UoW
Last Saved: 23/08/2007
File Name: UOW Main Campus Site Report V5.5 - 19Aug07
Document Version: 5.5
Copyright Copyright © 23/08/2007 by EMET Consultants Pty Ltd. All rights reserved. No part of the contents of this document may be reproduced or transmitted in any form by parties other than those employed or engaged by University of Wollongong by any means without written permission of EMET Consultants Pty Ltd. Confidential & Privacy This document contains confidential material solely for the University of Wollongong. All reasonable precautionary methods in handling the document and the information contained herein should be taken to prevent any third party from obtaining access. EMET Consultants Pty Ltd does not divulge client information to any third party without authorisation from the client. Some data may be used in a generic sense to refine or update energy performance indices and other similar generic materials. In any such case, data is normalised and consolidated with other relevant materials to remove any connection or identity with the original user.
Page : 3
Energy Audit Report Main Campus
Energy Audit
University of Wollongong – Main Campus
TABLE OF CONTENTS
DOCUMENT HISTORY AND STATUS............................................................................................................ II
1. EXECUTIVE SUMMARY.......................................................................................................................... 4
2. INTRODUCTION......................................................................................................................................... 8
3. BUILDINGS AND ENGINEERING SYSTEMS...................................................................................... 12
4. ENERGY LOAD PROFILES AND ENERGY CONSUMPTION PATTERNS.................................... 15
4.1. SUMMARY OF MAIN CAMPUS ENERGY CONSUMPTION AND PERFORMANCE...................... 15 4.2. BUSINESS ACTIVITY INDICATORS (BAI) AND BASELINE ENERGY USE .............................. 16 4.3. ELECTRICITY ..................................................................................................................... 17 4.4. NATURAL GAS................................................................................................................... 20 4.5. BREAKDOWN OF ENERGY USE AND APPLICATION ............................................................. 24 4.6. ENERGY PERFORMANCE BENCHMARKS AND TARGETS...................................................... 28
5. ANALYSIS OF ENERGY SYSTEMS AND ESTIMATED SAVINGS POTENTIAL ........................ 31
5.1. OVERVIEW OF ENERGY SAVINGS IDENTIFIED .................................................................... 31 5.2. ENERGY SAVING ISSUES AND INITIATIVES......................................................................... 34
6. MAXIMUM DEMAND MANAGEMENT ............................................................................................... 55
6.1. POWER FACTOR CORRECTION ........................................................................................... 55
7. UTILITIES METERING ........................................................................................................................... 58
7.1. PROPOSED UTILITIES METERING SYSTEM UPGRADE (WATER, ELECTRICITY AND GAS).... 58 7.2. ELECTRICITY ..................................................................................................................... 59 7.3. NATURAL GAS................................................................................................................... 59
8. ENERGY MANAGEMENT....................................................................................................................... 60
8.1. CURRENT STATUS.............................................................................................................. 60
9. DESIGN STANDARDS .............................................................................................................................. 64
10. IMPLEMENTATION STRATEGY...................................................................................................... 66
APPENDIXES
1. Summary of Proposed changes to the building assets at October 2006
2. Itemised List of Energy Management Initiatives
Page : 4
Energy Audit Report Main Campus
1. EXECUTIVE SUMMARY
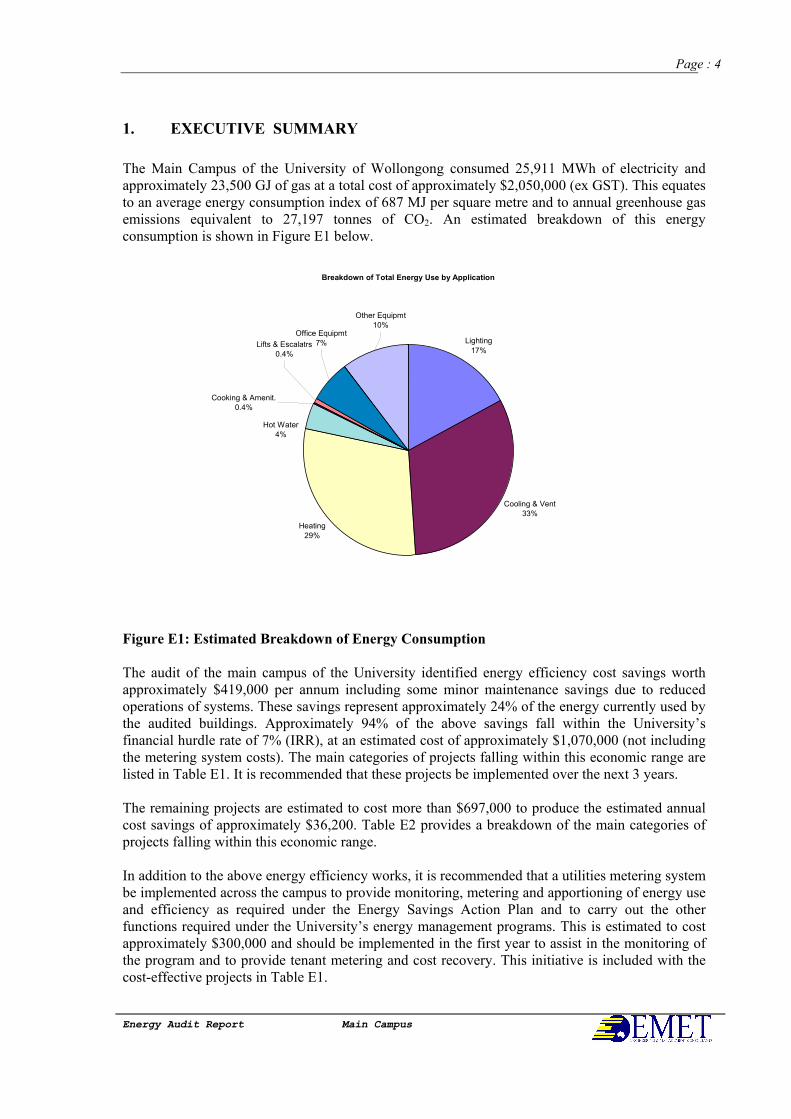
The Main Campus of the University of Wollongong consumed 25,911 MWh of electricity and approximately 23,500 GJ of gas at a total cost of approximately $2,050,000 (ex GST). This equates to an average energy consumption index of 687 MJ per square metre and to annual greenhouse gas emissions equivalent to 27,197 tonnes of CO2. An estimated breakdown of this energy consumption is shown in Figure E1 below.
Breakdown of Total Energy Use by Application
Lighting
17%
Cooling & Vent
33%
Heating
29%
Other Equipmt
10%
Cooking & Amenit.
0.4%
Lifts & Escalatrs
0.4%
Office Equipmt
7%
Hot Water
4%
Figure E1: Estimated Breakdown of Energy Consumption
The audit of the main campus of the University identified energy efficiency cost savings worth approximately $419,000 per annum including some minor maintenance savings due to reduced operations of systems. These savings represent approximately 24% of the energy currently used by the audited buildings. Approximately 94% of the above savings fall within the University’s financial hurdle rate of 7% (IRR), at an estimated cost of approximately $1,070,000 (not including the metering system costs). The main categories of projects falling within this economic range are listed in Table E1. It is recommended that these projects be implemented over the next 3 years. The remaining projects are estimated to cost more than $697,000 to produce the estimated annual cost savings of approximately $36,200. Table E2 provides a breakdown of the main categories of projects falling within this economic range. In addition to the above energy efficiency works, it is recommended that a utilities metering system be implemented across the campus to provide monitoring, metering and apportioning of energy use and efficiency as required under the Energy Savings Action Plan and to carry out the other functions required under the University’s energy management programs. This is estimated to cost approximately $300,000 and should be implemented in the first year to assist in the monitoring of the program and to provide tenant metering and cost recovery. This initiative is included with the cost-effective projects in Table E1.

Page : 5
Energy Audit Report Main Campus
Notes on savings quoted above and in the report:
(1) Savings for items are based on the average energy rates (excluding GST) for the past 12 months except
for initiatives subject to off-peak rates
(2) Refer to the body of the report for additional notes and qualifications on the above estimates
(3) All costs and savings estimates are based on information available and investigations possible at the
time of the audit. Each requires confirmation in subsequent feasibility studies.

Page : 6
Energy Audit Report UOW Main Campus
Table E1: Energy Saving Projects falling within the 7% Hurdle Rate
Savings Implement'
Cost Energy
Costs
Maintenance
Costs Energy
% of tot
Energy Emissions
Payback Area of Project
$ $ pa $ pa GJ pa T CO2-e yrs
Implement identified cost-effective HVAC1 initiatives 702,530 262,280 1,847 17,906 16.9% 3,486 2.7 Implement identified cost-effective DHW2 and Staff Amenities initiatives 69,985 11,070 0 1,578 1.5% 151 20.8 Implement identified cost-effective Utilities initiatives 10,000 37,587 0 1,879 1.8% 491 0.3 Implement identified cost-effective Lighting initiatives 166,727 21,059 9,279 1,091 1.0% 298 5.5 Implement identified cost-effective Office and Other Equipment initiatives Nil 10,000 0 477 0.4% 131 immediate Implement identified cost-effective Pool system initiatives 40,930 12,224 0 1,565 1.5% 159 3.3 Implement identified cost-effective Power Factor Correction initiatives 80,625 17,100 0 0 0.0% 0 4.7 Implement a site-wide metering system 300,000 n/a n/a n/a n/a n/a n/a Total 1,370,798 371,320 11,125 24,497 23.1% 4,717 3.6
(1) – Heating, Ventilation and Air Conditioning
(2) – Domestic Hot Water

Page : 7
Energy Audit Report UOW Main Campus
Table E2: Energy Saving Projects falling outside the 7% Hurdle Rate
Savings Implement'
Cost Energy
Costs
Maintenance
Costs Energy
% of tot
Energy Emissions
Payback Area of Project
$ $ pa $ pa GJ pa T CO2-e yrs
Identified but currently uneconomic HVAC initiatives 451,550 19,526 0 1,004 0.9% 263 23.1 Identified but currently uneconomic DHW and Staff Amenities initiatives 17,000 660 0 44 0.0% 12 25.8 Identified but currently uneconomic Lighting initiatives 228,620 11,989 3,127 572 0.5% 157 15.1 Identified but currently uneconomic Power Factor Correction initiatives 18,750 906 0 0 0.0% 0 20.7 Total 715,920 33,082 3,127 1,620 4.9% 432 19.8
(1) – Heating, Ventilation and Air Conditioning
Page : 8
Energy Audit Report UOW Main Campus
Energy Audit
University of Wollongong – Main Campus
2. Introduction
2.1 Background
The University of Wollongong, being a major consumer of energy as designated by DEUS, is required to prepare an Energy Savings Action Plan for the Main Campus under the Energy Administration Amendment (Water and Energy Savings) Act 2005 to the requirements of the NSW Department of Energy, Utilities and Sustainability (DEUS). The necessary steps in preparing an Energy Savings Action Plan are:
• Determine baseline energy use
• Conduct an Energy Management Review
• Undertake a Technical Review, in the form of a Level 3 Energy Audit in accordance with AS/NZS 3598:2000
• Complete an Energy Savings Action Plan
2.2 Scope of Works
This report covers all energy use by the Main Campus at Northfields Avenue, Wollongong which is defined by all of the buildings and services managed by the University’s Buildings and Grounds Division. Energy audits were also conducted at Building 37 (Kooloobong) and Building 121 (Graduate House), these buildings are managed by a separate entity to the Building and grounds Division and are therefore not covered by this report; separate reports have been prepared for these buildings. Also, in the case of tenanted buildings, the report only covers the services managed by the University, which typically consist of house services such as central heating, cooling and ventilation, hot water and lifts. This report includes the determination of baseline energy use, the Technical Review which is a Level 3 Energy Audit in accordance with AS/NZS 3598:2000 and other reviews associated with the preparation of an Energy Savings Action Plan for the site. The Energy Management Review has already been prepared by others and has been incorporated into this report. A Level 3 Energy Audit provides a detailed analysis of energy usage, the savings that can be made and the cost of achieving these savings. A Level 3 Energy Audit is expected to provide a firm estimate of savings and cost. Accuracy of figures would be within +10% for costs and -10% for benefits. However, refer to section 2.4 for factors which affect the accuracy of these estimates.
Page : 9
Energy Audit Report UOW Main Campus
2.3 Methodology
Baseline Energy Use
Baseline energy use was established from monthly electricity and gas consumption and cost for the 2005 calendar year. Business activity indicators used are building gross floor area and equivalent full time students, these indicators are standard for the higher education sector and are used for current reporting requirements.
Energy Management Review
The Energy Management Review was conducted by Energetics using their One-2-Five Energy diagnostic program
Technical Review
Surveys of the building loads were undertaken to enable a model of the energy use across the site to be constructed and a breakdown of energy consumption and demand levels to be obtained. The validity of the model was checked against historical electricity and gas consumption. The following performance analysis techniques were used during the process of this project:
• EMET’s EMET~IBER program (endorsed by the Property Council of Australia and in use throughout Australia for over 15 years) was used for a detailed diagnostic analysis of the building’s performance including individual components of plant (eg- heating, cooling, ventilation etc.)
• EMET’s ELM program was used to determine the breakdown of energy use within each building and across the site to allow a detailed assessment of saving potential for each initiative.
Energy related greenhouse gas emission factors used in the report were obtained from the Australian Greenhouse Office “AGO Factors and Method Workbook, December 2005” – and correspond to the following: Electricity (NSW full fuel cycle emission factor) – 0.985 kg CO2-e/kWh Natural gas (NSW direct/point source EF for combustion emissions) – 71.3 kg CO2-e/GJ
Energy Savings Action Plan
The energy savings action plan is the result of the aggregation of initiatives identified in the Technical Reviews of the individual buildings and the campus wide initiatives covered in this Main Campus report.
Page : 10
Energy Audit Report UOW Main Campus
2.4 Sources of Information, Assumptions and Qualifications
The information contained in this report is based on a range of sources that have selectively been evaluated; these sources include site historical energy consumption data, production data, site control system data, daily plant run time and lost time records, individual plant electrical readings, site observations, and discussions with site personnel. Site drawings and operating and maintenance manuals have been reviewed, where available, to gain an understanding of the installed plant and equipment. Where practical and appropriate, information has been confirmed by inspection of the installed plant. Recommendations and observations are based on visual inspections of plant and equipment. Dismantling of plant or carrying out detailed technical inspections was outside the brief of this audit. The information and recommendations stated in this report are based on the above techniques and limitations. However these estimates can be affected by a multitude of external factors, which are subject to change. As a result, each recommendation should be reviewed at the time of consideration, to ensure that its relevance and economics are still acceptable. Some of these factors include:
• Variations in production requirements
• Addition or deletion of energy consuming equipment;
• Variation in activity levels;
• Variations in the standard of maintenance and efficiency monitoring;
• Variations in process settings
• Changes in energy tariff rates; and
• Other relevant changes.
2.5 Site Issues
Capital Management Plan Years 2006 to 2010 The University has an ongoing program of building refurbishment, reconstruction and the construction of new buildings. Inputs to this process incorporate building preventative maintenance history, Building Code of Australia (BCA) compliance and functional upgrade requirements. The renewal and expansion of the building assets is expected to result in the increase in the total energy consumed by the site while the continual renewal of building assets is expected to result in improved energy performance as older less efficient systems are replaced. To this end extension of the existing high voltage system is in the planning stages. Refer Appendix 1 for a summary of proposed changes to the building assets at October 2006 for the main campus.

Page : 11
Energy Audit Report UOW Main Campus
2.6 Acknowledgements
Throughout the conductance of this Technical Review the assistance and cooperation of the University’s Buildings and Grounds Division’s indoor and outdoor staff has been invaluable. We would like to especially thank the following whose cooperation has been a significant contribution towards the completion of this report.
• Chris Hewitt – Manager Maintenance & Energy • Peter Sparkowski – Mechanical and Electrical Maintenance Supervisor • John McGrath – Maintenance Planner and OH&S Coordinator • Eric Weddell – Air Conditioning Technician
• University’s electricians for their assistance with the extensive data logging that was conducted across the campus

Page : 12
Energy Audit Report UOW Main Campus
3. Buildings and Engineering Systems
3.1 General Description of the Site and Activity Levels
The Main Campus of the University of Wollongong comprises approximately 70 buildings representing a gross building floor area of 169,967 square metres during 2005. The progressive construction and refurbishment active on the site has resulted in buildings ranging in period of construction from the 1960’s to the present time, most with refurbishments of less than 10 years. The gross building floor area for 2004 was 170,303 square metres. This energy audit covers 58 of the buildings representing a gross building floor area of 168,267 square metres equivalent to 99% of the site’s gross building floor area. The Equivalent Full Time (EFT) student enrolments for 2005 were 16,179, including Wollongong University College (WUC) students. Table 3.1 below shows EFT student enrolments steadily rising from 1997 through to 2004. 2005 saw a reduction in enrolments of 1,894 or 10.5% from 2004.
EFT Student Enrolments
0
2000
4000
6000
8000
10000
12000
14000
16000
18000
20000
1997 1998 1999 2000 2001 2002 2003 2004 2005 2006
Year
Head Count
Figure 3.1: EFT Enrolments 1997 to 2005
A campus gross floor area of 169,967 square metres and 16,179 EFT students has been use as the business activity indicators in determining the energy performance indices for the 2005 baseline year.

Page : 13
Energy Audit Report UOW Main Campus
3.2 Heating, Ventilation and Air Conditioning (HVAC)
The general policy with regards HVAC is for all areas to be ventilated to meet Australian Standards. Areas occupied by nominated senior executive staff, dedicated lecture theatres, dedicated computer laboratories and nominated laboratories are to be fully air conditioned. The types of systems in use comprise centralised chilled water and heating hot water systems; ducted reverse cycle and packaged systems; a chilled beam system; and reverse cycle room air conditioners. Non air conditioned offices are heated by personal heaters and cooling relief is provided by ceiling fans. Laboratories and workshops with make up air systems for fume cupboard and exhaust hoods comply with BCA standards and generally have tempered outside air heating systems. Seminar and tutorial rooms in general have no heating or cooling.
3.3 Building Management System (BMS)
The site has a Siemens Apogee Building Management System that currently serves 18 buildings to principally provide Heating Ventilation and Air Conditioning system monitoring and control. In some cases the BMS also provides lighting control and electrical meter monitoring.
3.4 Domestic Hot Water and Staff Amenities
Domestic hot water systems are a mix of gas and electric systems and are generally as follows:
• Student and staff amenities: Local electric mains pressure systems. • Student accommodation: Centralised gas and mains pressure electric circulating systems. • Laboratories: Centralised gas and mains pressure electric circulating systems. • Sporting complex: Centralised gas circulating systems.
The site also has approximately 70 boiling water units installed in lunch rooms and staff amenities areas; these systems generally are connected to a General Purpose Outlet (GPO) and remain energised at all times. The site also has approximately 80 refrigerators installed in lunch rooms and staff amenities areas, these systems generally are less than 3 star rated out of a 5 star energy efficiency rating..
3.5 Lighting
Lighting systems are mostly linear fluorescent, with compact fluorescents used in corridors and foyers. Automatic lighting control systems such as movement sensors, voltage reduction units and time of day control of corridor, external and security lighting have been used extensively throughout the site.
Page : 14
Energy Audit Report UOW Main Campus
3.6 Office Equipment
Personal computers The main campus has approximately 3,000 personal computers which are managed by different groups across the campus, consisting principally of Information Technology Services (ITS), Commerce Faculty, and Informatics Faculty. ITS currently manages about 1,500 machines expanding to 2,000 by January 2007 as it takes over the management of additional machines on the campus. ITS currently has a policy of enabling the Energystar facility on all computers where appropriate and phasing in lower energy consuming liquid crystal monitors as leases expire. The Commerce Faculty manages about 300 computers which are owned by the University. There is a policy of enabling the Energystar facility on all computers. The machines are automatically woken up between 2am and 5am for software updates. The Informatics Faculty manages about 450 computers which are replaced every three years. There is a policy of enabling the Energystar facility on a roll out basis, approximately 50% of the machines have the Energystar facility enabled. Computers in other areas in general are left operating, particularly in locations where older computers are in use such as research laboratories. ITS advise that the most appropriate way to promote energy savings initiatives such as Energystar is via the IT Forum. Photocopiers The Main Campus has 133 combination photocopier/fax/printers of which approximately 100 are networked via the campus Ethernet, within the next twelve months almost all machines will be connected to the network as machines are upgraded on lease expiry. All of the machines have an energy saver facility which sets the machine to energy save mode after a programmable time period of inactivity. The time period is currently set at the maximum of four hours and is centrally programmed for those machines connected to the network. Energy use under different modes of operation for these units is as follows: (model AF2015/18/18D – model AF1035 in brackets):
o Warm-up – 1.28kW (1.5 kW) o Copying – 1.28kW (1.5kW) o Standby – 130 W (500 W) o Energy Saver – 10 W (223 W) o Auto-off – 1 W (10 W)
Page : 15
Energy Audit Report UOW Main Campus
4. Energy Load Profiles and Energy Consumption Patterns
4.1. Summary of Main Campus Energy Consumption and Performance
The Main Campus of the University of Wollongong consumed 116,771 GJ of energy for the twelve months ending December 2005. This consumption level resulted in Greenhouse gas emissions of 26,737 tonnes of Carbon Dioxide. This energy consumption was required to service a total building gross floor area of 169,967 square metres and 16,179 Equivalent Full Time Students (EFTS). The corresponding energy performance indices were 687 MJ/m2 and 7,217 MJ/EFTS. The maximum electricity demand, based on the sum of the recorded monthly maximum demand levels for the nine supplies to the site, was 6,161 kVA in summer and 4,742 kVA in winter. Table 4.1 below provides a comparison of annual energy consumption, cost and performance for the 2004 and 2005 calendar years. It shows that all of these factors were higher during 2005 compared to 2004, while the gross building floor area decreased slightly and the EFTS reduced by 10%.
Table 4.1: Comparison of Energy Consumption, Cost and Performance
Total Consumption
Annual Cost
Consumption Indices
Emissions
Year Energy Source
(MWh) (GJ)
$(1)
(MJ/m²)
(MJ/EFTS) (tCO2-e)
Electricity 24,670 88,812 1,789,239 521 4,914 24,300 Natural Gas 21,481 136,016 126 1,189 1,532
2004 Total 110293 1,925,255 648 6,103 25,832
Electricity 25,911 93,280 1,916,467 549 5,765 25,522 Natural Gas 23,492 130,033 138 1,452 1,675
2005 Total 116772 2,046,500 687 7,217 27,197

Page : 16
Energy Audit Report UOW Main Campus
4.2. Business Activity Indicators (BAI) and Baseline Energy Use
The standard business activity indicators used by the higher education sector are gross building floor area and equivalent full time students. The gross building floor area during 2005 was 169,967 square metres and 170,303 square metres during 2004. During 2006 the gross floor area is expected to increase due to the commissioning of the Medical School Building. During 2007 and beyond substantial increases in the gross building floor area are scheduled. Based on the above, the 2005 gross floor area is considered representative of a stable period in relation to changes in the building gross floor area, consequently the 2005 building gross floor area of 169,967 has been used as the baseline BAI for floor area. The EFT student figure for 2005 was 16,179. The baseline energy use for the site is summarised in Table 4.2 below.
Table 4.2: Baseline Energy Use
University of Wollongong Main Campus Comments
Baseline Start Date 01-Jan-05Baseline End Date 31-Dec-05
Baseline energy use per annum (GJ) 116,771
Greenhouse Emissions (tonnes) 7,217
Is baseline representative of normal Energy Use Yes
Impact of variation on Energy use per annum Nil
Baseline energy use corrected for variation (GJ) 116,771
Baseline Activity Indicator 1 Building gross floor area (m2) Note 1
Quantity of Site Business Activity Indicator 1 per annum 169,967 m2
Baseline Energy use Key Perfromance Indicator 1 (KPI 1) 687 MJ/m2
Business Activity Indicator 2 Equivalent Full Time Students Note 1
Quantity of Site Business Activity Indicator 2 per annum 16,179 EFTSBaseline Energy use Key Perfromance Indicator 2 (KPI 2) 7,217 MJ/EFTS
Demand Baseline summer peak Electircal use (kVA) 6,161 Note 2
Baseline winter peak Electrical use (kVA) 4,742 Note 2
Baseline Energy Use
Note 1: The university sector uses two Business Activity Indicators, gross building floor area and equivalent
full time students. Gross building floor area is the index most applicable to measuring energy performance.
Note 2: Summer & winter peak electrical use is based on the summation of the monthly peak for the nine
supplies to the site

Page : 17
Energy Audit Report UOW Main Campus
4.3. Electricity
4.3.1 General Description
The Main Campus is supplied by ten low voltage supplies metered by revenue meters. All of these supplies are totally independent of one another. Power factor correction equipment is installed on some of the low voltage supplies. Table 4.3 contains a schedule of the electrical supplies and identifies those which have power factor correction installed.
Table 4.3: Schedule of Electrical Supplies
LV Substation
Revenue
Meter No. NMI Meter location
Power
Factor
Correction
2 5006900 NEEE 00910 UOW Switchroom 2, Building 16 Yes
2 5012410 NEEE 00910 UOW Switchroom 2, Building 16 Yes
3 5013891 NEEE 003522 UOW Switchroom 3, Building 19 Yes
3 5014473 NEEE 003066 UOW Switchroom 3, Building 40 Yes
4 5017551 NEEE 0044560UOW Switchroom 4, Building 25 Yes
5 5024576 NEEE 003065 UOW Switchroom 5, Building 64 Yes
6 5010073 NEEE 073067 UOW Switchroom 6, Building 66 Yes7 5005230 NEEE 003069 UOW Switchroom 7, Building 1 Yes
7 5006183 NEEE 003068 UOW Switchroom 7, Building 1 Yes
8 525601 NEEE 2615-6 UOW Switchroom 8, Building 30 No
4.3.2 Electricity Consumption, Cost and Performance
The electricity consumption for the calendar year 2005 was 25,911 MWh or 93,278 GJ and corresponds to Greenhouse gas emissions equivalent to 25,522 tonnes of Carbon Dioxide. Table 4.4 provides a comparison of annual electricity consumption, cost and performance for the 2004 and 2005 calendar years. It shows electricity consumption increased by 5% during 2005, the electricity MJ/m2 also increased by 5% while MJ/EFTS increased by 17% in association with a decrease in EFTS enrolments of 10%. The average cost of electricity for the campus for the 2005 calendar year was 7.4 cents per kWh
Table 4.4: Comparison of Electricity Consumption, Cost and Performance
MWh GJ
2004 Electricity 24,670 88,810 1,789,239 521 4,914 24,300
2005 Electricity 25,911 93,278 1,916,467 549 5,765 25,522
MJ/m2
MJ/EFT
Student
Tonnes
of CO2Year Energy Source
Total Consumption Annual
Cost ($)

Page : 18
Energy Audit Report UOW Main Campus
4.3.3 Seasonal Patterns of Electricity Use Figure 4.1 shows monthly campus electricity consumption for the 2004 and 2005 calendar years. The profiles show no clear seasonal variation in energy consumption and 2005 consumption levels being consistently greater than 2004 levels after April 2005. The reason for the increased consumption level after April 2005 has not been established, it is not due to the commissioning of new or the refurbishment of existing buildings.
Campus Electricity Consumption
0
500000
1000000
1500000
2000000
2500000
3000000
Jan Feb Mar Apr May Jun Jul Aug Sep Oct Nov Dec
Month
kWh 2005
2004
Figure 4.1: Campus monthly electricity consumption

Page : 19
Energy Audit Report UOW Main Campus
Figure 4.2 shows monthly campus maximum demand for the 2004 and 2005 calendar years, the profiles show winter demand to be approximately 15% less than summer demand.
Campus Maximum Demand
0
1000
2000
3000
4000
5000
6000
7000
Jan Feb Mar Apr May Jun Jul Aug Sep Oct Nov Dec
Month
kVA 2005
2004
Figure 4.2: Campus monthly electricity consumption
4.3.4 Electricity Tariffs
The Main Campus has ten supplies which are billed under a contestable time of use demand based tariff, the average cost of electricity for these supplies during 2005 was 7.4 cents per kWh, this was 2% higher than the average cost of electricity for the 2004 calendar year. Figure 4.3 shows the rates paid for electricity by a range of consumers of comparable consumption level to those of the University. The graph shows that the rates charged to the University are on the low end of the range. No additional green energy is purchased by the site above the that relating to compulsory charges passed on by the retailer for RECs and NGACs.

Page : 20
Energy Audit Report UOW Main Campus
Average Cost of Electricity for a Range of Similar Consumers -
2005
0
0.02
0.04
0.06
0.08
0.1
0.12
F H UoW D G E C B I A
Consumer
Average Electricity Cost - c/kWh
Figure 4.3: Comparison of Average Cost of Electricity for a Range of Similar Consumers
It should be noted that Figure 4.3 is an indicative price comparison only as the prices do not cover exactly the same period, location, level of activity or consumption patterns. The two sites showing lower rates of electricity consist of a research centre and a major commercial building of lower total electricity consumption. The sites with higher costs include one university and several commercial buildings all of which have lower consumption compared to UoW.
4.4. Natural Gas
4.4.1 General Description
The main campus is supplied by natural gas from a single meter located at the rear of Building 31 and reticulated via a ring main to buildings within the university ring road. The Graduate House accommodation complex is supplied by a separate meter.
4.4.2 Natural Consumption, Cost and Performance
The natural gas consumption for the calendar year 2005 was 23,492 GJ and corresponds to Greenhouse gas emissions equivalent to 1,675 tonnes of Carbon Dioxide. Table 4.5 provides a comparison of annual natural gas consumption, cost and performance for the 2004 and 2005 calendar years. It shows that natural gas consumption increased by 9% and the gas

Page : 21
Energy Audit Report UOW Main Campus
consumption index in MJ/m2 increased by 10%. The gas MJ/EFTS index increased by 22% in association with a decrease in EFTS enrolments of 10%. The average cost of natural gas for the campus for the 2005 calendar year was $5.48/GJ, due to the consumption based tariff the lowest price was $4.32/GJ in July and the highest $11.75/GJ in January.
Table 4.5: Comparison of Natural Gas Consumption, Cost and Performance
Year Energy Source
Total Consumption (GJ)
Annual Cost ($) MJ/m2
MJ/EFT Student
Tonnes of CO2
2004 Natural gas 21,481 136,01
6 126 1,189 1,532
2005 Natural gas 23,492 130,03
3 138 1,452 1,675
4.4.2 Seasonal Patterns of Natural Gas Use Figure 4.4 shows monthly campus natural gas consumption for the 2004 and 2005 calendar years. The profiles show increased consumption during cooler months due to heating systems and increased consumption during 2005 compared with 2004 after April 2005. The reason for the increased consumption level after April 2005 has not been established, it is not due to the commissioning of new or the refurbishment of existing buildings.
Campus Natural Gas Consumption
0
20,000
40,000
60,000
80,000
100,000
120,000
140,000
Jan Feb Mar Apr May Jun Jul Aug Sep Oct Nov Dec
Month
MJ/Day
2005
2004
Figure 4.4: Campus monthly natural gas consumption

Page : 22
Energy Audit Report UOW Main Campus
4.4.3 Daily Patterns of Natural Gas Use Figure 4.5 shows campus daily natural gas consumption for January and July 2006. The profiles show no substantial difference in gas consumption from a weekend to a weekday indicating that systems are operating when not required on weekends. This substantiates findings in the individual building reports of boilers operating on a 24 hour basis 7 days a week during winter.
Daily Gas Consumption
0
20
40
60
80
100
120
140
160
0 5 10 15 20 25 30 35
Date
GJ January
July
Figure 4.5: Summer and Winter Daily Gas Consumption
4.4.4 Natural Gas Tariffs
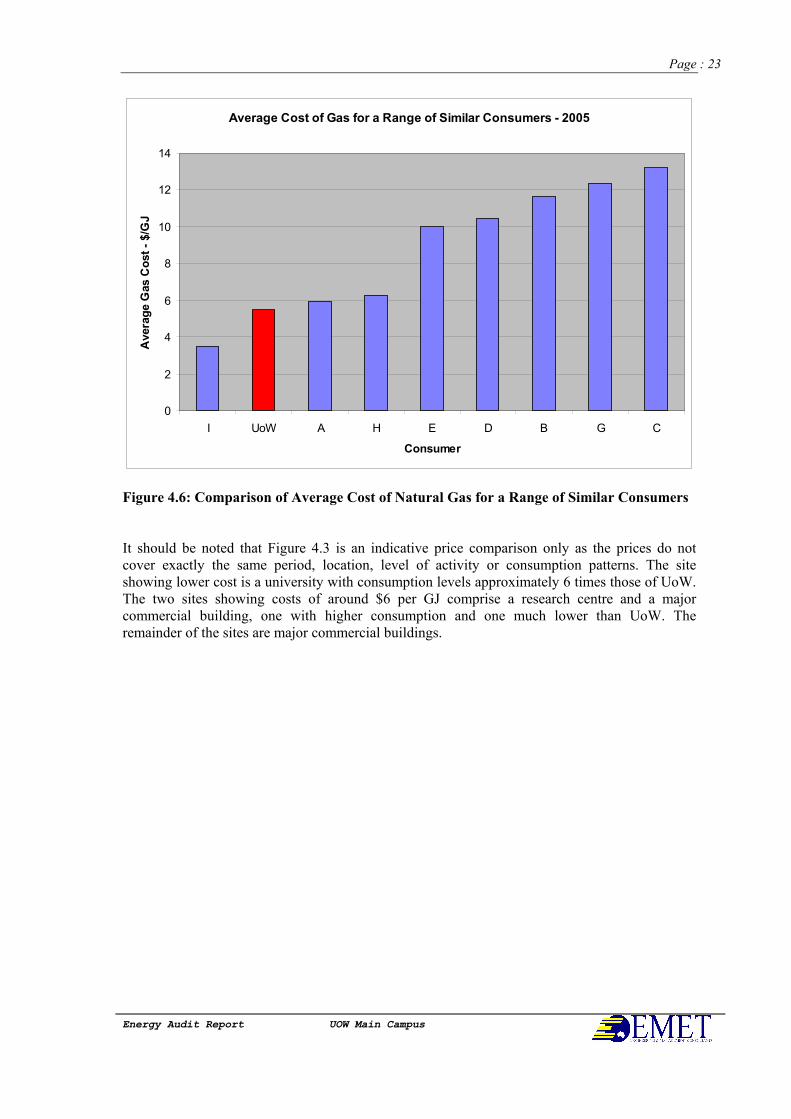
The price of gas is based on a variable consumption based component, a monthly fixed cost component and a network cost component, consequently the average cost of gas is lower during periods of higher consumption. Figure 4.6 shows the rates paid for gas by a range of consumers of comparable consumption level to the University. The graph shows that the rates charged to the University are on the lowest end of the range. The university negotiated a new gas supply contract in late 2006.
Page : 23
Energy Audit Report UOW Main Campus
Average Cost of Gas for a Range of Similar Consumers - 2005
0
2
4
6
8
10
12
14
I UoW A H E D B G C
Consumer
Average Gas Cost - $/GJ
Figure 4.6: Comparison of Average Cost of Natural Gas for a Range of Similar Consumers
It should be noted that Figure 4.3 is an indicative price comparison only as the prices do not cover exactly the same period, location, level of activity or consumption patterns. The site showing lower cost is a university with consumption levels approximately 6 times those of UoW. The two sites showing costs of around $6 per GJ comprise a research centre and a major commercial building, one with higher consumption and one much lower than UoW. The remainder of the sites are major commercial buildings.

Page : 24
Energy Audit Report UOW Main Campus
4.5. Breakdown of Energy Use and Application
4.5.1 Energy Use by Building and Energy Source
Figure 4.7 shows the estimated energy consumption for each of the audited buildings by energy source. These consumption levels were derived by a combination of metering data, site observations, measurements and modelling using EMET’s diagnostic and modelling programs, as noted in the Methodology clauses. The largest consumer is Building 39 followed by Building 16 and Building 13. Building 13 is also estimated to be the larger consumer of natural gas.
Energy Consumption by Building and Energy Source
0
2,000
4,000
6,000
8,000
10,000
12,000
14,000
16,000
39 16 13 41 35 30 17 18 20 15 11 40 67 3 25 22 4 19 36 1 8 2 32 5 6 10 31 38 42 23 21 29
Building
Estimated Consumption - GJ (2005)
Gas
Electricity
Figure 4.7: Estimated Energy Consumption by Building and Energy Source
4.5.2 Energy Use by Application
The breakdown of energy consumption and cost by application is shown in Table 4.6 and Figure 4.7. These show the most significant applications of energy across the site to be Heating, Cooling and Ventilation, Lighting and Other Equipment. The latter comprises a multitude of laboratory equipment and other specialist equipment generally related to the teaching and research activities in the buildings and generally activated manually by occupants. Office equipment and hot water delivery also constitute significant loads.

Page : 25
Energy Audit Report UOW Main Campus
Table 4.6 - Estimated Energy Consumption, Performance and Cost by Application
APPLICATION
Location Lighting Cooling & Vent Heating Hot Water
Cooking & Amenit.
Lifts & Escal
Office Equipmt
Other Equipmt Total
Consumption GJ pa 18,207 33,713 31,274 3,926 398 411 7,170 10,925 106,024
Performance MJ/m2 pa 112 208 193 24 2 3 44 67 654
Cost $ pa 381,414 706,271 344,046 35,481 8,339 8,613 150,201 227,090
1,861,454
Breakdown of Total Energy Use by Application
Lighting
17%
Cooling & Vent
33%
Heating29%
Other Equipmt
10%
Cooking & Amenit.
0.4%
Lifts & Escalatrs
0.4%
Office Equipmt
7%
Hot Water4%
Figure 4.7 – Breakdown of Total Energy Use by Application
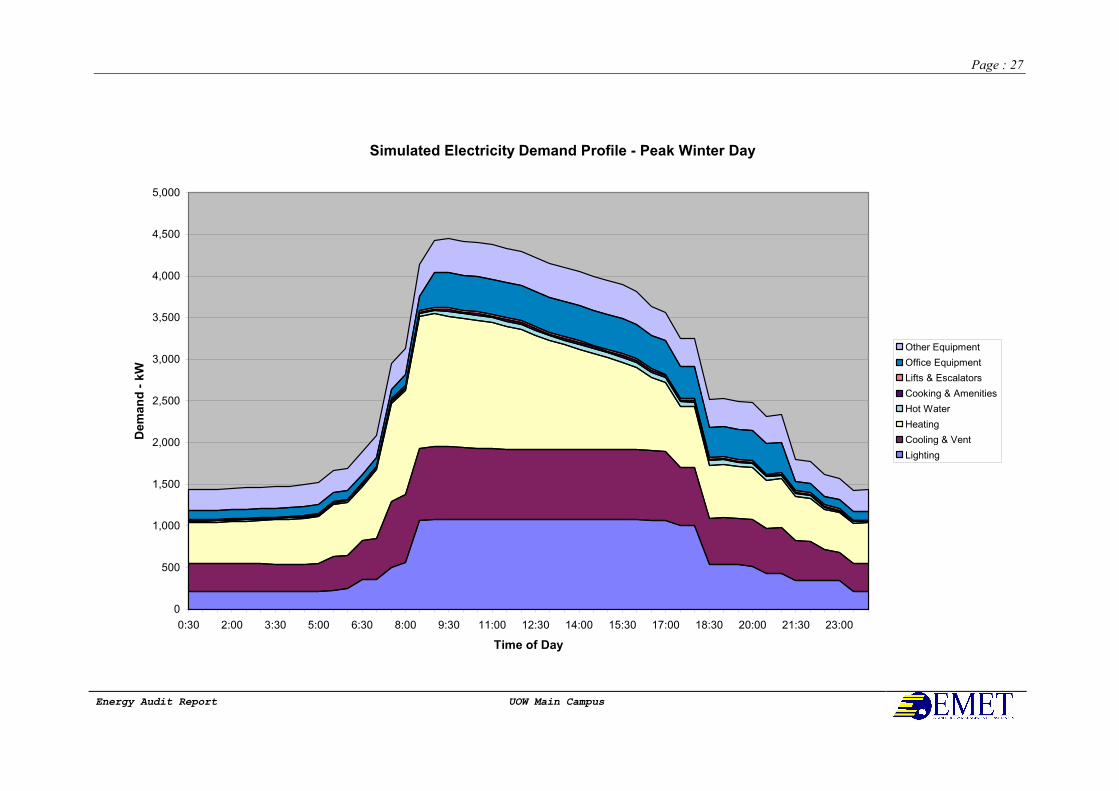
Figures 4.8 and 4.9 show the simulated breakdown of the weekday electrical demand under peak Summer and Winter conditions respectively. The patterns show the major loads to be heating, cooling and ventilation systems and lighting. It should be noted that the charts show the typical demand patterns during Summer and Winter, with peak demand levels reached on days of extreme weather and/or activity.

Page : 26
Energy Audit Report UOW Main Campus
Simulated Electricity Demand Profile - Peak Summer Day
0
1,000
2,000
3,000
4,000
5,000
6,000
0:30 2:00 3:30 5:00 6:30 8:00 9:30 11:00 12:30 14:00 15:30 17:00 18:30 20:00 21:30 23:00
Time of Day
Demand - kW
Other Equipment
Office Equipment
Lifts & Escalators
Cooking & Amenities
Hot Water
Heating
Cooling & Vent
Lighting
Page : 27
Energy Audit Report UOW Main Campus
Simulated Electricity Demand Profile - Peak Winter Day
0
500
1,000
1,500
2,000
2,500
3,000
3,500
4,000
4,500
5,000
0:30 2:00 3:30 5:00 6:30 8:00 9:30 11:00 12:30 14:00 15:30 17:00 18:30 20:00 21:30 23:00
Time of Day
Demand - kW
Other Equipment
Office Equipment
Lifts & Escalators
Cooking & Amenities
Hot Water
Heating
Cooling & Vent
Lighting
Page : 28
Energy Audit Report UOW Main Campus
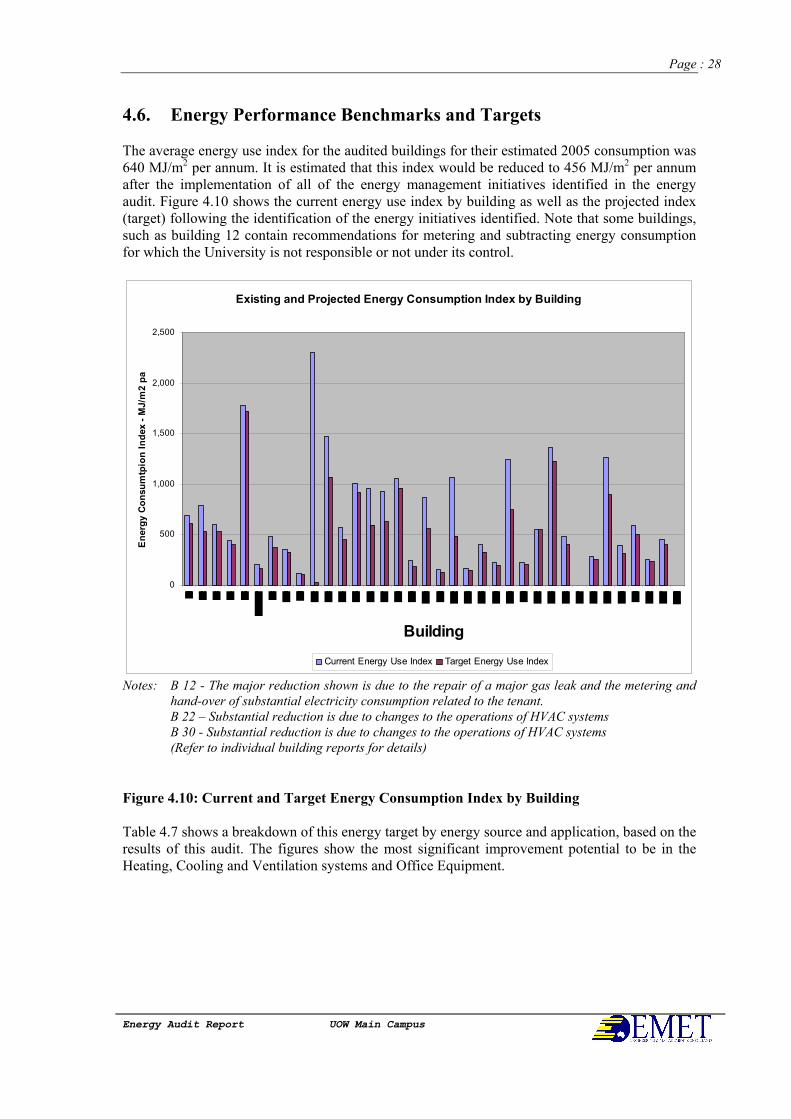
4.6. Energy Performance Benchmarks and Targets The average energy use index for the audited buildings for their estimated 2005 consumption was 640 MJ/m2 per annum. It is estimated that this index would be reduced to 456 MJ/m2 per annum after the implementation of all of the energy management initiatives identified in the energy audit. Figure 4.10 shows the current energy use index by building as well as the projected index (target) following the identification of the energy initiatives identified. Note that some buildings, such as building 12 contain recommendations for metering and subtracting energy consumption for which the University is not responsible or not under its control.
Existing and Projected Energy Consumption Index by Building
0
500
1,000
1,500
2,000
2,500
Building
Energy Consumtpion Index - MJ/m2 pa
Current Energy Use Index Target Energy Use Index
Notes: B 12 - The major reduction shown is due to the repair of a major gas leak and the metering and
hand-over of substantial electricity consumption related to the tenant.
B 22 – Substantial reduction is due to changes to the operations of HVAC systems
B 30 - Substantial reduction is due to changes to the operations of HVAC systems
(Refer to individual building reports for details)
Figure 4.10: Current and Target Energy Consumption Index by Building
Table 4.7 shows a breakdown of this energy target by energy source and application, based on the results of this audit. The figures show the most significant improvement potential to be in the Heating, Cooling and Ventilation systems and Office Equipment.

Page : 29
Energy Audit Report UOW Main Campus
Table 4.7: Target Energy Consumption by Application
Annual Consumption APPLICATION Energy Source
(kWh) (GJ)
Annual Cost ($pa)
Perform. Index (MJ/m
2)
Proportion of Total Energy Consumption
(%)
Lighting Electricity 5,419,088 19,509 $408,693 120 23%
Cooling and Ventilation Electricity 8,181,651 29,454 $617,038 182 34%
Heating Electricity 1,869,122 6,729 $140,964 41 8%
Heating Gas 9,891 $54,198 61 11%
Amenities Electricity 133,762 482 $10,088 3 1%
Lifts & Escalators Electricity 47,134 170 $3,555 1 0%
Office Equipment Electricity 1,702,025 6,127 $128,362 38 7%
Other Equipment Electricity 3,192,233 11,492 $240,749 71 13%
Hot Water Electricity 218,254 786 $16,460 5 1%
Hot Water Gas 1,894 $10,381 12 2%
Total 20,763,27
0 86,533 $1,620,107 534 100%
Notes: (1) The costs shown are calculated on an average cost of electricity and gas as noted under
methodology
(2) Numbers do not necessarily add due to rounding off
Based on the current building types and the extent of operations carried out within the buildings, the target energy performance levels for the University are as follows:
o Current Performance - 687 MJ/m2 o Following the implementation of all projects within the
University hurdle rate - 543 MJ/m2
o Following the implementation of all identified projects - 534 MJ/m2 The above levels are shown in Figure 4.11 together with the 2004 performance levels for other Australian Universities. Note that the above targets do not represent the best practice level of performance which could only be achieved in the long term following major refurbishments of systems and services as new buildings and plant are brought on line. This performance level, based on the current level of operations and services provided is approximately 425 MJ/m2.

Page : 30
Energy Audit Report UOW, Main Campus
Comparison of UoW Performance and Targets against Performance of other Australian Univerisities
0
200
400
600
800
1,000
1,200
1,400
40
21
23 8
16
25
31
22
15 1
35
Current
33
17
49
19
27
26
41
10 9
39
37
12
42
36
38
Performance Index - MJ/m2 pa
Current level of
performanceForecast performance after
implementation of cost-
effective projects
Forecast performance after
implementation of all projects
Source: Other University data – Tertiary Education Facilities Management Association – 2004 Benchmark report
Figure 4.11: Comparison of Current and Forecast UoW performance Indexes against other universities current performance

Page : 31
Energy Audit Report UOW Main Campus
5. Analysis of Energy Systems and Estimated Savings Potential 1 2
5.1. Overview of Energy Savings Identified
The audit of the main campus of the University identified energy efficiency cost savings worth approximately $419,000 per annum including some minor maintenance savings due to reduced operation of systems. These savings represent approximately 25% of the energy used by the audited buildings. Approximately 94% of the above savings fall within the University’s financial hurdle rate of 7% (IRR), at an estimated cost of approximately $1,070,000. The remaining 6% are estimated to cost more than $716,000 to produce the estimated annual cost savings of approximately $36,200. Table 5.1 shows a breakdown of costs and savings falling within and outside the University’s hurdle rate.
Table 5.1: Summary of Identified Energy Saving Projects
Savings Implement
'
Cost
Energy
Costs
Maintenanc
e Costs
Energ
y
% of
tot
Energ
y
Emission
s
Combine
d
Payback
Internal
Rate of
Return
(IRR)
$ $ pa $ pa GJ pa T CO2-e yrs
Better than 7% 1,070,798
371,320 11,125 24,497 23% 4,717 2.8
Less than 7% 715,920 33,082 3,127 1,620 2% 1,620 19.8
Total 1,786,718 404,40
2 14,252 26,117 25% 6,337 4.3
Estimated Annual Energy Savings by Building
0
500
1,000
1,500
2,000
2,500
3,000
3,500
4,000
4,500
5,000
39 16 13 30 12 17 20 41 22 40 35 25 19 3 18 11 67 15 2 36 8 4 6 1 14 10 21 5 23 42 31 38 29
Building Number
Annual Energy Savings - GJ pa
Figure 5.1: Estimated Annual Energy Savings by Building
1 All savings and costs quoted in this report are ex-GST 2 Implementation costs shown are budget estimates only. They include an allowance for the typical
engineering costs involved in fully scoping and documenting the works however, this cost will depend on
the complexity of the specific installation and the amount of documentation available and will therefore
vary with each case
Page : 32
Energy Audit Report UOW Main Campus
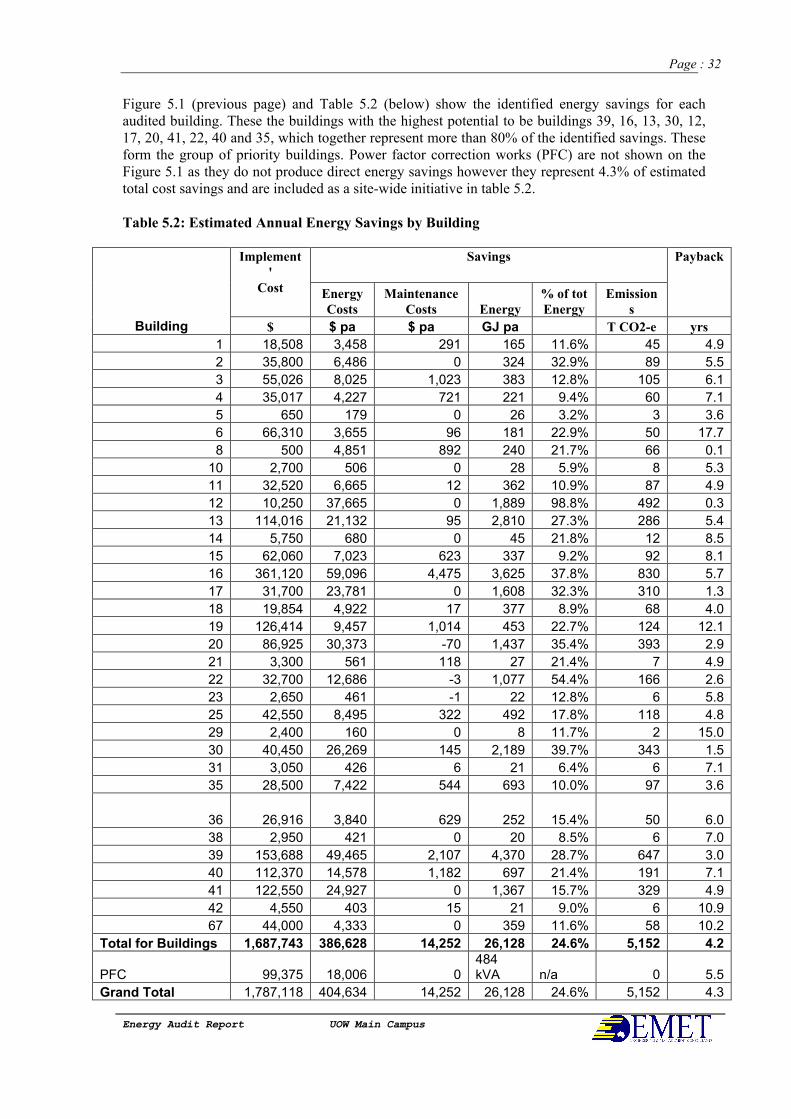
Figure 5.1 (previous page) and Table 5.2 (below) show the identified energy savings for each audited building. These the buildings with the highest potential to be buildings 39, 16, 13, 30, 12, 17, 20, 41, 22, 40 and 35, which together represent more than 80% of the identified savings. These form the group of priority buildings. Power factor correction works (PFC) are not shown on the Figure 5.1 as they do not produce direct energy savings however they represent 4.3% of estimated total cost savings and are included as a site-wide initiative in table 5.2.
Table 5.2: Estimated Annual Energy Savings by Building
Savings Implement
'
Cost Energy
Costs
Maintenance
Costs Energy
% of tot
Energy
Emission
s
Payback
Building $ $ pa $ pa GJ pa T CO2-e yrs
1 18,508 3,458 291 165 11.6% 45 4.9
2 35,800 6,486 0 324 32.9% 89 5.5
3 55,026 8,025 1,023 383 12.8% 105 6.1
4 35,017 4,227 721 221 9.4% 60 7.1
5 650 179 0 26 3.2% 3 3.6
6 66,310 3,655 96 181 22.9% 50 17.7
8 500 4,851 892 240 21.7% 66 0.1
10 2,700 506 0 28 5.9% 8 5.3
11 32,520 6,665 12 362 10.9% 87 4.9
12 10,250 37,665 0 1,889 98.8% 492 0.3
13 114,016 21,132 95 2,810 27.3% 286 5.4
14 5,750 680 0 45 21.8% 12 8.5
15 62,060 7,023 623 337 9.2% 92 8.1
16 361,120 59,096 4,475 3,625 37.8% 830 5.7
17 31,700 23,781 0 1,608 32.3% 310 1.3
18 19,854 4,922 17 377 8.9% 68 4.0
19 126,414 9,457 1,014 453 22.7% 124 12.1
20 86,925 30,373 -70 1,437 35.4% 393 2.9
21 3,300 561 118 27 21.4% 7 4.9
22 32,700 12,686 -3 1,077 54.4% 166 2.6
23 2,650 461 -1 22 12.8% 6 5.8
25 42,550 8,495 322 492 17.8% 118 4.8
29 2,400 160 0 8 11.7% 2 15.0
30 40,450 26,269 145 2,189 39.7% 343 1.5
31 3,050 426 6 21 6.4% 6 7.1
35 28,500 7,422 544 693 10.0% 97 3.6
36 26,916 3,840 629 252 15.4% 50 6.0
38 2,950 421 0 20 8.5% 6 7.0
39 153,688 49,465 2,107 4,370 28.7% 647 3.0
40 112,370 14,578 1,182 697 21.4% 191 7.1
41 122,550 24,927 0 1,367 15.7% 329 4.9
42 4,550 403 15 21 9.0% 6 10.9
67 44,000 4,333 0 359 11.6% 58 10.2
Total for Buildings 1,687,743 386,628 14,252 26,128 24.6% 5,152 4.2
PFC 99,375 18,006 0 484 kVA n/a 0 5.5
Grand Total 1,787,118 404,634 14,252 26,128 24.6% 5,152 4.3

Page : 33
Energy Audit Report UOW Main Campus
A breakdown of the major applications of energy use expected to produce the estimated energy savings is shown in Table 5.3. Heating, Ventilation and Air Conditioning (HVAC) systems represent the largest component of energy savings at 73% of the total. This category includes comfort cooling and heating systems as well as process cooling and heating provided for specialised equipment and locations as well as specialised ventilation for areas such as laboratories. The next major area of potential savings is Utilities which includes the metering and subtraction of energy provided to tenants, for which the University has no control, as well as the repair to a major gas leak which existed during the base year. Savings shown against Office and Other relate to improved awareness to the proper operation of systems and equipment by occupants, as well as the activation of built-in energy saver features on equipment. The remainder of savings relate to Power Factor Correction (PFC) works, and the improvement of the efficiency and operation of Pool systems, Domestic Hot Water and other staff (and occupant) amenities and Lighting systems.
Table 5.3: Sources of Energy Savings Potential by Application
Savings Implement
'
Cost
Energy
Costs
Maintenance
Costs
Energ
y
% of
tot
Energ
y
Emission
s
Payback
Building $ $ pa $ pa GJ pa T CO2-e yrs
Heating, ventilation and air conditioning 1,154,480
282,039 1,847 18,921 17.8% 3,753 4.1
Utilities 10,000 37,587 0 1,879 1.8% 491 0.3
Pool 40,930 12,224 0 1,565 1.5% 159 3.3 Domestic Hot Water and Staff Amenities 86,985 11,730 0 1,622 1.5% 163 7.4
Lighting 395,347 33,048 12,405 1,663 1.6% 455 8.7
Office Nil 9,891 0 472 0.4% 129 immediate
Other Nil 110 0 5 0.0% 1 immediate
PFC 99,375 18,006 0 484 kVA n/a 0 5.5
Total 1,787,118 404,63
4 14,252 26,128 24.6% 5,152 4.3
Refer to the next sections for a more detailed analysis of the types of initiatives identified for each of the above areas of energy saving potential, as well as Appendix 2 for a detailed list of recommendations resulting from this energy audit.

Page : 34
Energy Audit Report UOW Main Campus
5.2. Energy Saving Issues and Initiatives
This energy audit has identified a number of initiatives and issues, both technical and procedural, which are sources of energy losses or inefficiencies. These are discussed below, together with recommended actions and estimated savings. It should be noted that the University is in the process of addressing many of these issues by commissioning the following standards, which are currently being finalised:
• Building Monitoring and Control Systems Design Standards
• Building Monitoring and Control Systems Commissioning Procedures & Schedules
• Mechanical Services Design Standards
• Mechanical Services Commissioning Standard
• Electrical Services design Standard
• Energy and Demand Management Standards for the Design Process The following clauses address each of the major issues and areas of opportunities identified. The site’s Building Management System is discussed separately as it is a major influence over many systems and services and has the opportunity to provide a substantial component of the savings and also assist in the monitoring and management of the energy management program of the site.
5.2.1. Building Management System (BMS)
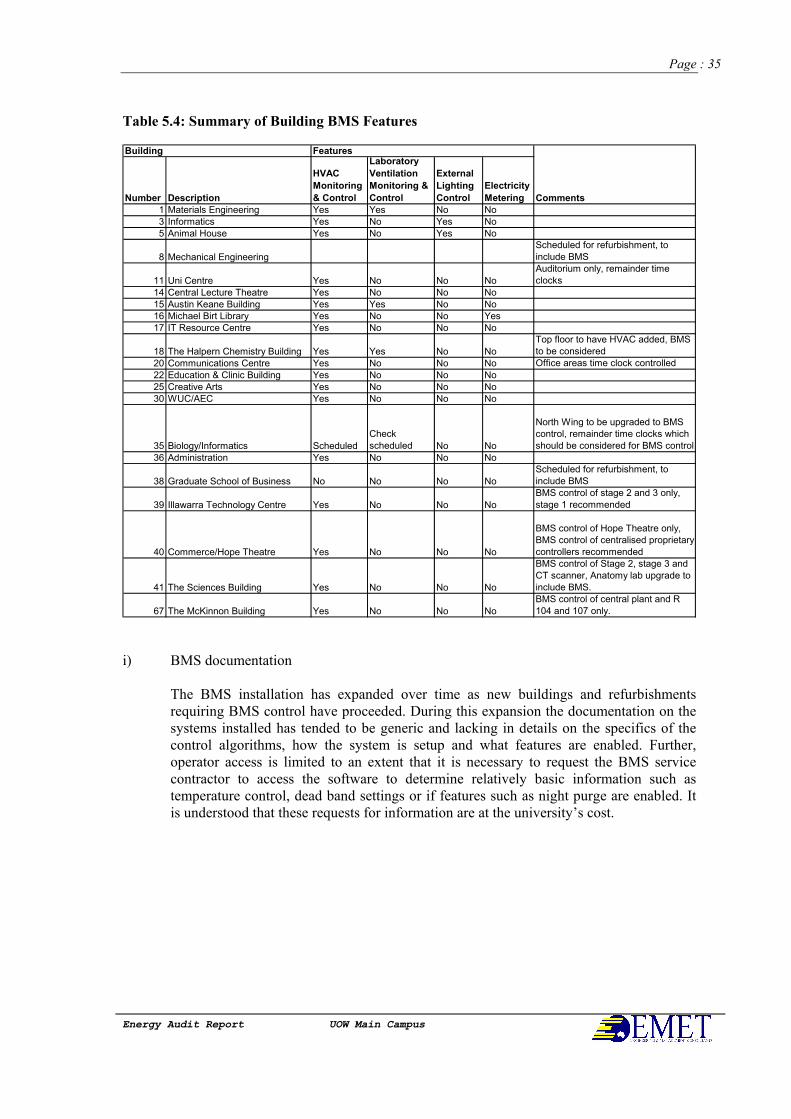
The site has a BMS that currently serves 18 buildings to principally provide Heating Ventilation and Air Conditioning system monitoring and control, in some cases the BMS also provides lighting control and electrical meter monitoring. Table 5.4 provides a summary of buildings served by the BMS and their features. In some cases the BMS only serves part of the building or only provides time of day control to air conditioning systems with local proprietary controls. There are 15 larger buildings that are not served by the BMS. These buildings mostly have no air conditioning. In cases where air conditioning is installed, it is controlled by time clocks, timers or local on/off control. The BMS installed at the site is a Siemens Apogee System which has expanded as new buildings and refurbishments have required BMS control.
Page : 35
Energy Audit Report UOW Main Campus
Table 5.4: Summary of Building BMS Features
Number Description
HVAC
Monitoring
& Control
Laboratory
Ventilation
Monitoring &
Control
External
Lighting
Control
Electricity
Metering
1 Materials Engineering Yes Yes No No
3 Informatics Yes No Yes No
5 Animal House Yes No Yes No
8 Mechanical Engineering
Scheduled for refurbishment, to
include BMS
11 Uni Centre Yes No No No
Auditorium only, remainder time
clocks
14 Central Lecture Theatre Yes No No No
15 Austin Keane Building Yes Yes No No16 Michael Birt Library Yes No No Yes
17 IT Resource Centre Yes No No No
18 The Halpern Chemistry Building Yes Yes No No
Top floor to have HVAC added, BMS
to be considered
20 Communications Centre Yes No No No Office areas time clock controlled
22 Education & Clinic Building Yes No No No
25 Creative Arts Yes No No No
30 WUC/AEC Yes No No No
35 Biology/Informatics Scheduled
Check
scheduled No No
North Wing to be upgraded to BMS control, remainder time clocks which
should be considered for BMS control
36 Administration Yes No No No
38 Graduate School of Business No No No No
Scheduled for refurbishment, to
include BMS
39 Illawarra Technology Centre Yes No No No
BMS control of stage 2 and 3 only,
stage 1 recommended
40 Commerce/Hope Theatre Yes No No No
BMS control of Hope Theatre only, BMS control of centralised proprietary
controllers recommended
41 The Sciences Building Yes No No No
BMS control of Stage 2, stage 3 and
CT scanner, Anatomy lab upgrade to
include BMS.
67 The McKinnon Building Yes No No No
BMS control of central plant and R
104 and 107 only.
Building Features
Comments
i) BMS documentation
The BMS installation has expanded over time as new buildings and refurbishments requiring BMS control have proceeded. During this expansion the documentation on the systems installed has tended to be generic and lacking in details on the specifics of the control algorithms, how the system is setup and what features are enabled. Further, operator access is limited to an extent that it is necessary to request the BMS service contractor to access the software to determine relatively basic information such as temperature control, dead band settings or if features such as night purge are enabled. It is understood that these requests for information are at the university’s cost.

Page : 36
Energy Audit Report UOW Main Campus
ii) Commissioning
The BMS documentation does not always reflect the system installed and can reflect the system that was offered rather than that which has been installed, in some cases there is no documentation, only a reference in the time of day schedule. To establish what actually has been installed would require the software to be analysed by the BMS service provider as outlined in item i) above. During the audit a number of systems were identified that were not operating correctly and appear to never have operated correctly, these include:
• Boilers and chillers operating 24 hours a day when they are not supposed to
• Economy cycles not functioning correctly
• Night purge not functioning correctly iii) Operator interface & system management
The Building’s & Grounds staff monitor the BMS on a daily basis and trend selected parameters to identify system problems which are then passed on to the BMS service provider for action. During the audit it was found that basic parameters that would normally be accessible to the end user via the Graphical User Interface (GUI) to fine tune system and identify unsatisfactory operation were not accessible. They were only accessible within the software program by the BMS service provider. Also, attempts to identify the cause of plant such as boilers and chillers operating 24 hours a day seven days a week when the BMS time schedules indicated that these systems should not be operating were not possible due to the lack of access to the BMS via the GUI. The BMS service provider was also not able to identify the cause of these problems from the GUI, it would be necessary to undertake an analysis of the software.
iv) Time of day control The time of day control of HVAC plant is globally programmed for public holidays and for after hours use for special occasions. The “special occasions” function is automatically cancelled after the date of the event. It is common practice to schedule air conditioning plant to operate from around 5am for when the cleaners commence work through to when the area is not likely to be in use and for after hours push buttons to be used outside these times. There is no facility to globally program selected time channels for university recess which occurs approximately 76 days of the year, consequently these systems continue to operate throughout the university recess.
v) Control algorithms Control algorithms have been duplicated across the site as new BMS installations are installed and it is presumed that this practice applies to recently commissioned buildings that are still in the warranty period.
Page : 37
Energy Audit Report UOW Main Campus
This energy audit has identified problems with the economy cycle, night purge and night setback algorithms. Problems have also been identified with chillers and boilers operating when they are not intended to in a number of buildings.
vi) Monitoring & Verification Good energy management practice and this energy audit recommended that energy efficiency initiatives be monitored and verified for their correct effectiveness, and that building refurbishments and new buildings should consider the improvements in energy consumption at the design stage and then monitor and verify the results after the work is commissioned and handed over. The utilisation of the BMS for monitoring & verification is a critical part of this process.
Recommendations:
Note: The University has indicated a desire that better controls be put on service providers to improve the performance of energy systems. Develop a strategy that enables the BMS to be better used as a management tool by university staff to improve maintenance, fine tune system operation for improved performance, monitor & verify energy efficiency improvements and reduce energy consumption. The following are key steps considered necessary to develop the above strategy. Ideally, many of the steps should involve a person technically competent to understand the system(s) being controlled in each case and the level of information and interaction required to be incorporated in the systems. It would be expected that these would involve a person/organisation not linked to the BMS contractor.
i) Review the documentation for each building so that it reflects the current installation. ii) Where appropriate provide additional BMS access to university staff to enable
improved system monitoring, improved fault finding, on going fine tuning and better management of service contractors.
iii) Provide appropriate training for university staff iv) Implement BMS commissioning procedures v) Incorporate monitoring and verification of energy performance at the design stage
into energy efficiency improvement projects, building refurbishments and new buildings.
vi) Revise BMS time of day control to allow global scheduling of university recess days for student accessed areas, alternatively link the Cardax system for common teaching areas to the BMS to control plant dedicated to common teaching areas.
vii) Implement optimum start/stop strategies and set the time of day schedules to core occupancy times (typically 8am to 6pm for office areas), not cleaning periods, and utilise after hours push buttons outside core hours. For student accessed areas university recess should be considered as outside core hours unless programmed for special occasions which are automatically cancelled after the date of the event.
viii) Modify control algorithms as recommended in this report, refer Section 5.2.2, and ensure that building design guidelines are updated.
ix) Implement a request tracking system to monitor the progress of requests made to the BMS contractor; and a performance tracking system to measure the effectiveness of the BMS contractor.

Page : 38
Energy Audit Report UOW Main Campus
5.2.2. Heating, Ventilation and Air Conditioning (HVAC) Systems
The building’s HVAC systems are estimated to consume approximately 11,200 MWh of electricity and 14,000 GJ of gas at a total cost of approximately $923,000 per annum and have an energy utilisation index of 335 MJ/m2 per annum. This overall consumption index shows a high level of energy use for the types and extent of systems employed on the site.
Table 5.4 - Estimated Energy Use and Cost by HVAC Systems
Annual Consumption APPLICATION Energy Source (kWh) (GJ)
Annual Cost ($pa)
Perform. Index (MJ/m2)
Proportion of Total
Energy (%)
Cooling and Ventilation Electricity 8,173,084 29,423 616,392 181 28%
Heating Electricity 3,046,709 10,968 229,774 68 10%
Heating Gas 14,010 76,770 86 13%
Total 11,219,792 54,401 $922,936 335 51%
The energy audit identified energy efficiency cost savings for the HVAC systems as being worth approximately $284,000 per annum including some minor maintenance savings due to reduced operation of systems. These savings represent approximately 18% of the energy used by the audited buildings. Approximately 95% of the above savings fall within the University’s financial hurdle rate of 7% (IRR), at an estimated cost of approximately $703,000. Table 5.5 shows a breakdown of costs and savings falling within and outside the University’s hurdle rate. A full list of identified energy management projects for each building is included in Appendix 2.
Table 5.5 - Summary of Costs and Savings - HVAC Initiatives
Savings Implement
'
Cost
Energy
Costs
Maintenanc
e Costs
Energ
y
% of
tot
Energ
y
Emission
s
IRR
$ $ pa $ pa GJ pa T CO2-e
Better than 7% 702,930
262,512 1,847 17,917 17% 3,490
Less than 7% 451,550 19,526 0 1,004 1% 263
Total 1,154,480 282,03
9 1,847 18,921 18% 3,753
Figure 5.2 shows a breakdown of the above energy savings amongst the major categories of initiatives. It should be noted that these are broad categories which often overlap (ie. an initiative may incorporate items of more than one category). Also Table 5.6 provides an overview of the type of HVAC energy management actions identified for each building. Refer to the itemised list of initiatives in Appendix 2 and to individual building reports for further information.

Page : 39
Energy Audit Report UOW Main Campus
Major Categories of Energy Saving Potential - HVAC Systems
Control Improvements
33%
Boiler
4%
Chiller and Condenser
Water
7%
Holiday scheduling and
time of day
38%
Control of personal
equipment and general
awareness
6%
New or refurbished plant
3%
Other
1%
Economy Cycle, CO2,
Outside air and Night purge
7%
Figure 5.2: Major Categories of Energy Saving Potential – HVAC Systems
The major categories identified in figure 5.2 include:
o The improved control of operating times of plant through holiday scheduling, time of day control etc;
o Improvements to the controls which activate or operate the plant including adjustments to operating parameters, automatic (de)-activation, fine tuning etc;
o The application of improved or expansion to the use of economy cycles, outside air control, night purging functions etc;
o Specific Chiller, Boiler and Condenser system improvements; o Better control of systems operated by occupants through awareness and additional
controls; o Other functions.

Page : 40
Energy Audit Report UOW Main Campus
Table 5.6: Energy Efficiency Project Type for each building
No. Description BMS time of day schedule
Optim
um start/stop
Condenser water temperature control
Chilled water temperature setpoint reset
Excessive chiller & boiler operation
Variable speed pump control
Economy cycle
Night purge
Space temperature Setback
Fume cupboard sash monitoring
Outside air compensation
CO2 Control
Timer control control of A/C
Timer control of personal heaters
1 Materials Engineering Y Y Y Y2 Engineering Extension N Y Y Y Y Y Y3 Informatics Y Y Y Y
4 Engineering N Y Y Y5 Animal House Y
6, 7 Engineering Laboratories N Y8 Mechanical Engineering N
10 Kid's Uni N Y
11 Uni Centre Y Y Y 12 UniBar N
13 URAC N Y 14 Central Lecture Theatre Y Y Y Y Y Y 15 Austin Keane Building Y Y Y Y
16 Michael Birt Library Y Y Y Y Y Y Y Y Y Y 17 IT Resource Centre Y Y Y Y Y Y Y Y 18 The Halpern Chemistry Building Y Y Y Y Y
19 Arts N Y Y20 Communications Centre Y Y Y Y Y Y Y
21 Education laboratories N 22 Education & Clinic Building Y Y Y Y Y Y Y Y Y 23 Education Building N Y
25 Creative Arts Y Y Y Y Y Y Y Y Y29 & Demountables Public Health, classrooms N Y Y
30 WUC/AEC Y Y Y Y Y Y Y Y 31 Building & Grounds N Y32 Printery, Central Store N
35 Biology/Informatics N Y Y Y Y Y Y Y36 Administration Y Y Y Y Y Y Y
37 Kooloobong N Y38 Graduate School of Business Y Y39 Illawarra Technology Centre Y Y Y Y Y Y Y Y Y Y
40 Commerce/Hope Theatre Y Y Y Y Y Y41 The Sciences Building Y Y Y Y Y Y Y Y 42 The Science Annexe N
67 The McKinnon Building Y Y Y Y Y Y Y Y Y121 Graduate House N Y
Building
BMS
Energy Efficiency Opportunities
i) BMS time of day schedule The BMS controls the operating times of HVAC systems in buildings with BMS control and in some cases external lighting, the current time of day schedules provide for global public holiday scheduling and special event scheduling on request to Building & Grounds, the schedules are automatically reset after the scheduled data has passed. The start and stop times of HVAC systems are often not set to core occupancy hours, the start times of HVAC systems in some cases have been set to provide comfort conditions for cleaners, who commence work around 5am, and stop times have been set to suit after hours periods when a small number of people may be present.

Page : 41
Energy Audit Report UOW Main Campus
It has been proposed in Section 5.2 that the facility be incorporated into the BMS time of day scheduling to enable global scheduling of student occupied areas for university recess so that these systems don’t operate during these periods. It is also proposed that time of day schedules be set to core occupancy hours for systems with economy cycle control and that after hours push button timers be used to provide air conditioning outside core occupancy hours unless automatic reset special events scheduling has been requested. For example after hours timers would provide air conditioning when activated for cleaners, staff working out of hours or student occupied areas such as lecture theatres and tutorial rooms during university recess. Automatic reset special events scheduling would be used for events conducted during university recess such as exams, conferences and trade exhibitions. An alternative to the above for common teaching areas is to link the Cardax system to the BMS so that HVAC plant dedicated to common teaching areas is energised from scheduled booking times. The Cardax system at this stage has not been interfaced to a Siemens BMS, the costs associated with the Cardax system to provide this link is approximately $15,000 and the costs for the Siemens BMS is not known. In view of the uncertainty of costs, development time and implementation time this approach has not been considered. Optimum start/stop Optimum start stop control should be used for central plant or each package and split unit serving more than a single room independently. Small split units and room air conditioners serving one room should not be controlled by an optimum start/stop system. Under optimum start control, the system should seek to start the air conditioning units as late as possible whilst achieving the following average space temperatures by the scheduled occupancy times:
• If cooling: Setpoint +1C
• If Heating: Setpoint -1C If the optimum start sequence determines that cooling is required then all zone re-heats should be disabled until occupancy, conversely, if the optimum start sequence determines that heating is required, then all stages of cooling should be disabled until occupancy. Under optimum stop control, the system should seek to utilise the residual cooling or heating capacity of the chilled water or heating water systems by shutting down primary plant as early as possible whilst not allowing the average space temperature to go beyond the following levels during the scheduled occupancy time:
• If cooling: Setpoint +2C
• If heating: Setpoint – 2C In all cases, the fan should run on for a minimum of 15 minutes after the last heater is de-energised to allow it to cool down. The energy audit has identified a number of buildings with optimum start/stop control listed in the Operating & Maintenance Manual. However, it has not been possible to establish if the optimum start/stop facility is enabled and the control strategy employed due to the inability to access these features from the BMS GUI. Hirotech, the mechanical services contractor, indicates

Page : 42
Energy Audit Report UOW Main Campus
that these systems do not function and this is substantiated by the early and late starting and stopping times via the BMS time of day schedule to cater for worse case occupancies. ii) Condenser water temperature control The site utilises condenser water systems to reject waste heat to atmosphere from water cooled chillers and water cooled packaged air conditioners. Reducing the condenser water temperature as low as possible within the system requirements, the manufacturers guidelines and ambient dry bulb and wet bulb temperature constraints will reduce the compressor head pressure resulting in improved system efficiency and hence energy reduction. Typically condenser water systems are set to higher temperatures than necessary, penalising chiller efficiency unnecessarily. The opportunities identified in the reports involve better controlling the condenser water circulating temperature by various means including: converting the cooling tower fan to variable speed; modulating the fan speed and cooling tower bypass valve; changing operating setpoints in relation to ambient wet bulb temperature and to minimum temperatures acceptable to the system and manufacturer’s requirements (typically 20C). iii) Chilled water temperature setpoint reset The site has chilled water plant installed in six buildings for space cooling, the chilled water reticulated to cooling coils is generally controlled to 6C at all times. A chilled water temperature of 6C is typically a design temperature to which cooling coils are designed to cover the maximum design space thermal load. That is, for much of the time a higher chilled water temperature will be adequate to satisfy the space thermal load. Increasing the chilled water temperature reduces the compressor suction pressure resulting in improved system efficiency and hence energy reduction. The implementation of a chilled water temperature setpoint based on the load on the system allows for improved efficiencies. This is achieved by controlling the chilled water flow temperature to maintain a constant return flow temperature (typically 12C) and applying a reset strategy based on sustained changes in cooling demand (eg. reset down if any chilled water valve is>95% open and up if any chilled water valve is <80% open). Note that all figures given are typical and require fine tuning. During this operation, RH levels should be monitored and raising of chilled water temperatures prevented or reversed incrementally to maintain RH levels within acceptable limits (typically 65%). iv) Excessive chiller and boiler operation Four buildings, buildings 16, 22, 30 and 39, were found to have chiller and or boiler plant operating outside scheduled operating times from BMS trend data and electrical data logging.
• Building 16 electrical data logging shows chiller plant operating 24/7 during August, BMS trend data shows boiler operation 24/7 between 10/08/06 and 16/08/06 except for five hours on Monday and 7.5 hours on Tuesday, time of day schedules are set from 0400 to 2130. This operation could result from inappropriate night setback control settings.

Page : 43
Energy Audit Report UOW Main Campus
• Building 22 BMS trend data over a seven day period from 9/08/06 to 15/08/06 shows minimal chiller operation and boiler operation through the night and during the cooler parts of the day on a seven day basis, the scheduled plant operating times are from 7am to 5pm five days a week. This operation could result from inappropriate night setback control settings.
• Building 30 trend data shows both the chiller and hot water boiler to be operating continuously over the period 10/08/06 to 16/08/06, the scheduled plant operating hours are 7am to 5pm five days a week. The boiler operation could result from inappropriate night setback control settings, this would not explain the continuous chiller operation.
• Building 39 electrical data logging shows chiller plant operating 24/7 and BMS trend data for the periods 9/06/06 to 15/06/06 and 9/08/06 to 15/08/06 show the stage 2 hot water flow temperature to be above 58^C at all times indicating there is a 24 hour heating demand on the stage 2 boiler, the scheduled plant operating hours are 7am to 6pm. The boiler operation could result from inappropriate night setback control settings, this would not explain the continuous chiller operation.
The causes of the above operation have not been confirmed due to the limited BMS access via the BMS GUI, refer Section 5.1 above. It is recommended that the BMS software be reviewed and rectified to ensure that buildings 16, 22, 30 and 39 chillers and boilers are not enabled when the systems they service are not in operation and that all other chillers and boilers are checked to ensure that they also are only enabled when the systems they service are in operation. v) Variable speed pump control Pump energy consumption is proportional to the cube of the speed and proportional to flow quantity. A number of situations have been identified where the pump flow has been throttled as part of system balancing or because the pump has been sized for future expansion.
• Building 17 has a condenser water pump system that is sized for future expansion with the discharge throttled by about 50% to reduce the flow. The building heating hot water pump is also throttled by about 30%.
• Building 67 has a condenser water pump that operates when any one package air conditioner is enabled, a variable number of air conditioners operate at any one time resulting in a variable system flow requirements. The condenser water flow has been set to suit the requirements of when all package air conditioners are operating.
Controlling the flow by varying the pump speed instead of throttling the flow will result in substantial energy consumption reduction. vi) Economy Cycle Outside air is one of the main components contributing to the building load, modulating the outside air intake to a minimum acceptable level can lead to savings of typically 20% of HVAC system energy costs. Outside air management should provide the primary means of temperature control within the building. For systems with a common return air plenum, such as multi zone installation or systems with central and perimeter zones, the proportion of outside air entering the various air handling units should be controlled by modulating outside and return air dampers on each unit.
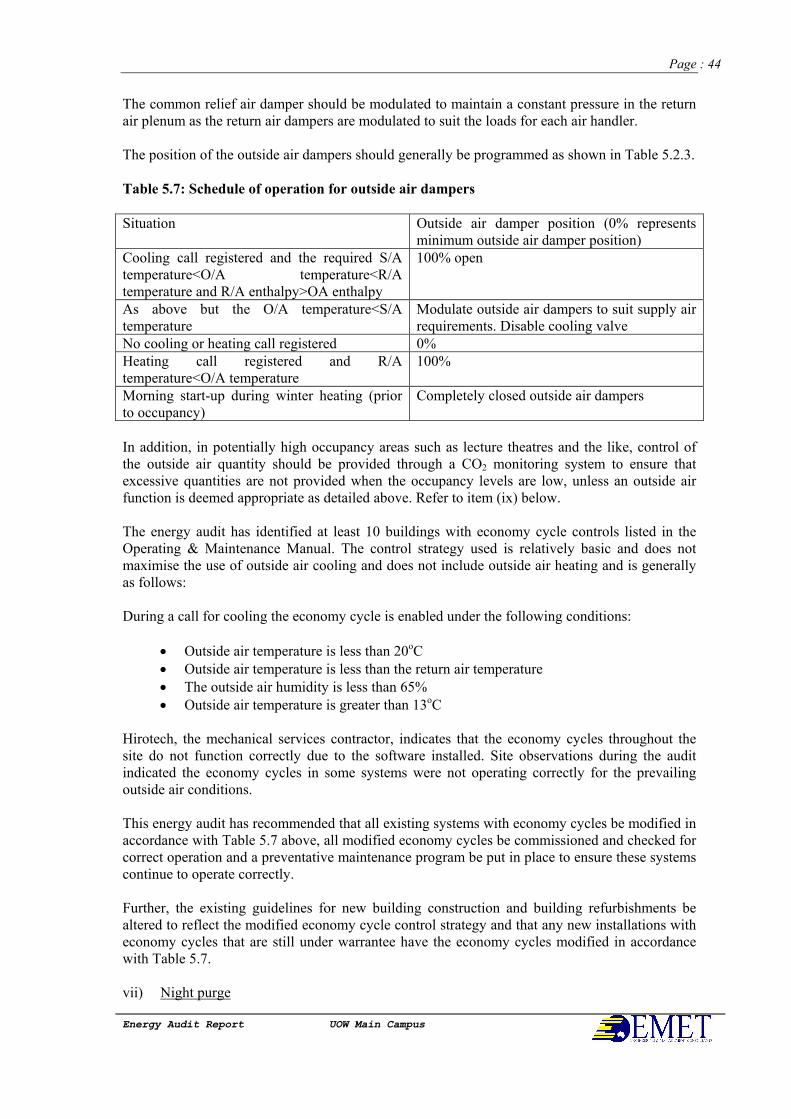
Page : 44
Energy Audit Report UOW Main Campus
The common relief air damper should be modulated to maintain a constant pressure in the return air plenum as the return air dampers are modulated to suit the loads for each air handler. The position of the outside air dampers should generally be programmed as shown in Table 5.2.3.
Table 5.7: Schedule of operation for outside air dampers
Situation Outside air damper position (0% represents minimum outside air damper position)
Cooling call registered and the required S/A temperature<O/A temperature<R/A temperature and R/A enthalpy>OA enthalpy
100% open
As above but the O/A temperature<S/A temperature
Modulate outside air dampers to suit supply air requirements. Disable cooling valve
No cooling or heating call registered 0%
Heating call registered and R/A temperature<O/A temperature
100%
Morning start-up during winter heating (prior to occupancy)
Completely closed outside air dampers
In addition, in potentially high occupancy areas such as lecture theatres and the like, control of the outside air quantity should be provided through a CO2 monitoring system to ensure that excessive quantities are not provided when the occupancy levels are low, unless an outside air function is deemed appropriate as detailed above. Refer to item (ix) below. The energy audit has identified at least 10 buildings with economy cycle controls listed in the Operating & Maintenance Manual. The control strategy used is relatively basic and does not maximise the use of outside air cooling and does not include outside air heating and is generally as follows: During a call for cooling the economy cycle is enabled under the following conditions:
• Outside air temperature is less than 20oC
• Outside air temperature is less than the return air temperature
• The outside air humidity is less than 65%
• Outside air temperature is greater than 13oC Hirotech, the mechanical services contractor, indicates that the economy cycles throughout the site do not function correctly due to the software installed. Site observations during the audit indicated the economy cycles in some systems were not operating correctly for the prevailing outside air conditions. This energy audit has recommended that all existing systems with economy cycles be modified in accordance with Table 5.7 above, all modified economy cycles be commissioned and checked for correct operation and a preventative maintenance program be put in place to ensure these systems continue to operate correctly. Further, the existing guidelines for new building construction and building refurbishments be altered to reflect the modified economy cycle control strategy and that any new installations with economy cycles that are still under warrantee have the economy cycles modified in accordance with Table 5.7. vii) Night purge
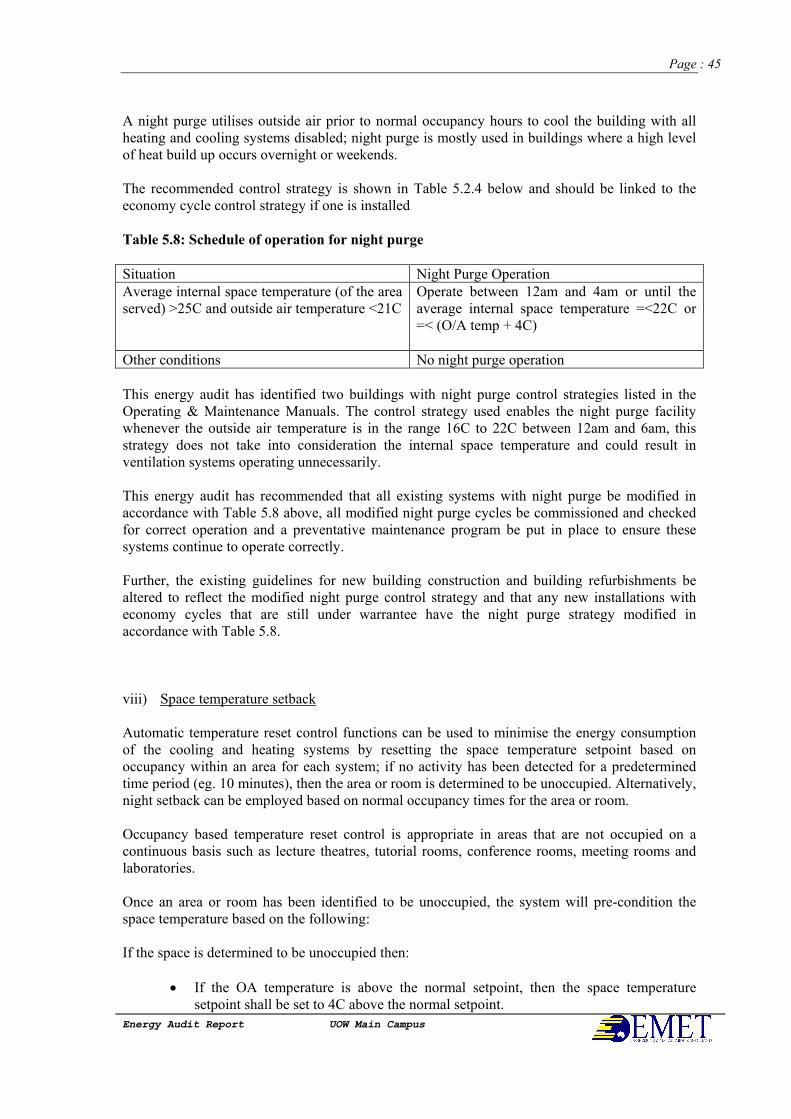
Page : 45
Energy Audit Report UOW Main Campus
A night purge utilises outside air prior to normal occupancy hours to cool the building with all heating and cooling systems disabled; night purge is mostly used in buildings where a high level of heat build up occurs overnight or weekends. The recommended control strategy is shown in Table 5.2.4 below and should be linked to the economy cycle control strategy if one is installed
Table 5.8: Schedule of operation for night purge
Situation Night Purge Operation
Average internal space temperature (of the area served) >25C and outside air temperature <21C
Operate between 12am and 4am or until the average internal space temperature =<22C or =< (O/A temp + 4C)
Other conditions No night purge operation
This energy audit has identified two buildings with night purge control strategies listed in the Operating & Maintenance Manuals. The control strategy used enables the night purge facility whenever the outside air temperature is in the range 16C to 22C between 12am and 6am, this strategy does not take into consideration the internal space temperature and could result in ventilation systems operating unnecessarily. This energy audit has recommended that all existing systems with night purge be modified in accordance with Table 5.8 above, all modified night purge cycles be commissioned and checked for correct operation and a preventative maintenance program be put in place to ensure these systems continue to operate correctly. Further, the existing guidelines for new building construction and building refurbishments be altered to reflect the modified night purge control strategy and that any new installations with economy cycles that are still under warrantee have the night purge strategy modified in accordance with Table 5.8. viii) Space temperature setback Automatic temperature reset control functions can be used to minimise the energy consumption of the cooling and heating systems by resetting the space temperature setpoint based on occupancy within an area for each system; if no activity has been detected for a predetermined time period (eg. 10 minutes), then the area or room is determined to be unoccupied. Alternatively, night setback can be employed based on normal occupancy times for the area or room. Occupancy based temperature reset control is appropriate in areas that are not occupied on a continuous basis such as lecture theatres, tutorial rooms, conference rooms, meeting rooms and laboratories. Once an area or room has been identified to be unoccupied, the system will pre-condition the space temperature based on the following: If the space is determined to be unoccupied then:
• If the OA temperature is above the normal setpoint, then the space temperature setpoint shall be set to 4C above the normal setpoint.

Page : 46
Energy Audit Report UOW Main Campus
• If the OA temperature is below the normal setpoint, then the space temperature setpoint shall be set to 2C under the normal setpoint.
Where feasible, the system may be turned off completely while temperatures remain within the setback temperature. Once activity is detected, and the area or room is identified as occupied, then the space temperature setpoint shall be set back to the normal setpoint value. This energy audit has recommended that occupancy based setpoint control be implemented 7 buildings and that occupancy setpoint control be incorporated into the preventative maintenance programme and the existing guidelines for new building construction and building refurbishments. ix) Fume cupboard sash monitoring Laboratory ventilation systems require makeup air systems to operate whenever a fume cupboard sash is not closed in order to maintain a negative pressure in the space, in some cases the makeup air system is either cooled and heated or heated only. Buildings 1 and 2 have tempered outside air makeup systems as outlined above which have been found to operate 24/7 due to fume cupboard sashes remaining in the raised position. Building 1 has BMS monitoring of the fume cupboard status, Building 2 is not connected to the BMS. This report has recommended that the BMS be utilised to monitor and report on fume cupboard status so that fume cupboard usage can be better managed to reduce energy consumption. Trending of these systems would take place out of hours. Further, it is recommended that new building and refurbishment guidelines include BMS monitoring and reporting on fume cupboard status. x) Outside air compensation Outside air compensation is used to reduce system losses in heating hot water systems by reducing the hot water temperature as the outside air temperature increases and in tempered air systems by disabling heating when the outside air temperature is greater than 18C. The proposed function operates by controlling the flow temperature to maintaining a constant return water temperature which is reset as ambient temperatures increase as described above. Buildings 2, 4, 22, 25 and 30 have been identified as suitable for the installation of outside air compensation. Further, it is recommended that new building and refurbishment guidelines include outside air compensation as outlined above.
Page : 47
Energy Audit Report UOW Main Campus
xi) CO2 control of outside air CO2 control of outside air is used to minimise outside air to air handling units based on air quality. The use of CO2 control of outside air is appropriate in spaces such as lecture theatres where there is variable occupancy. Buildings 3, 16, 17 and 25 have been identified as suitable for the installation of CO2 control of outside air. Further, it is recommended that new building and refurbishment guidelines include CO2 control of outside air as outlined above. xii) Timer control of room air conditioners Split units and room air conditioners serving one room should have local manual start with a programmable time duration automatic shutdown of the air conditioner. Local controllers where time schedules can be programmed by the occupants are not recommended. Room air conditioner controls throughout the site comprise the following:
• Local on off
• Remote hand held controllers with manual on off control, time of day scheduling, manual start with time duration operation.
Buildings 3, 4, 13, 15, 19, 29 and demountables have been identified as suitable for the installation push button timer control of air conditioners. Further, it is recommended that new building and refurbishment guidelines include timer control of room air conditioners as outlined above. xiii) Timer control of personal heaters
Personal heaters should have local manual start with a programmable time duration automatic switch off. Personal heaters throughout the site are used mostly in non air conditioned offices throughout the site and generally consist of the following:
• Forced fan heaters with local on/off control
• Convection heaters with on/off and thermostat control The installation of push button timer control of existing personal heaters across the site has been recommended. Further, it is recommended that new building and refurbishment guidelines include provision for dedicated heater circuits fitted with a round earth pin socket so that only university issued heaters fitted with a round earth pin plug can be connected to the dedicated circuit. The dedicated circuit is to provide centralised reset control of the individual heaters connected to the circuit so that after a reset pulse, typically every 2 hours, the local heater has to be manually initiated. It is also recommended that the purchasing policy be changed as follows:

Page : 48
Energy Audit Report UOW Main Campus
• Purchase of fan forced heaters be discontinued.
• Purchase low wattage under desk convection heaters with push button timer control for office areas. The heater plug is to have a round earth pin; the socket where the heater is to be located is to be replaced with a round earth pin socket.
• Purchase halogen or infrared radiant heaters for open areas such as lunch rooms and meeting rooms where heaters are required, the heaters are to have push button timer control with an on duration no greater than 1 hour.
xiv) Other Energy Efficiency Opportunities Energy efficiency opportunities that are building specific, i.e. not listed in Table 5.6 above, are contained in the detailed listing of projects for each building in Appendix 2. xv) Space temperature reset based on outside air temperature Air conditioning systems at the university are controlled to unchanging setpoints throughout the year, irrespective of ambient conditions and seasonal changes. The above recommendations have assumed a continuation of the current practice. Consideration should be given to seasonally adjusting the control points used for comfort air conditioning systems to provide conditions more appropriate with clothing and climatisation factors applicable during the year. The reduction of the heating setpoint by 1C during winter and the increase of the cooling setpoint by 1C during summer may be expected to produce savings in the order of 420 GJ per annum in electricity and gas combined, worth approximately $9,400 per annum. However the application of this initiative during winter needs careful review to ensure that energy use is not actually increased in areas where substantial internal heat loads exist and limited outside air cooling is available.
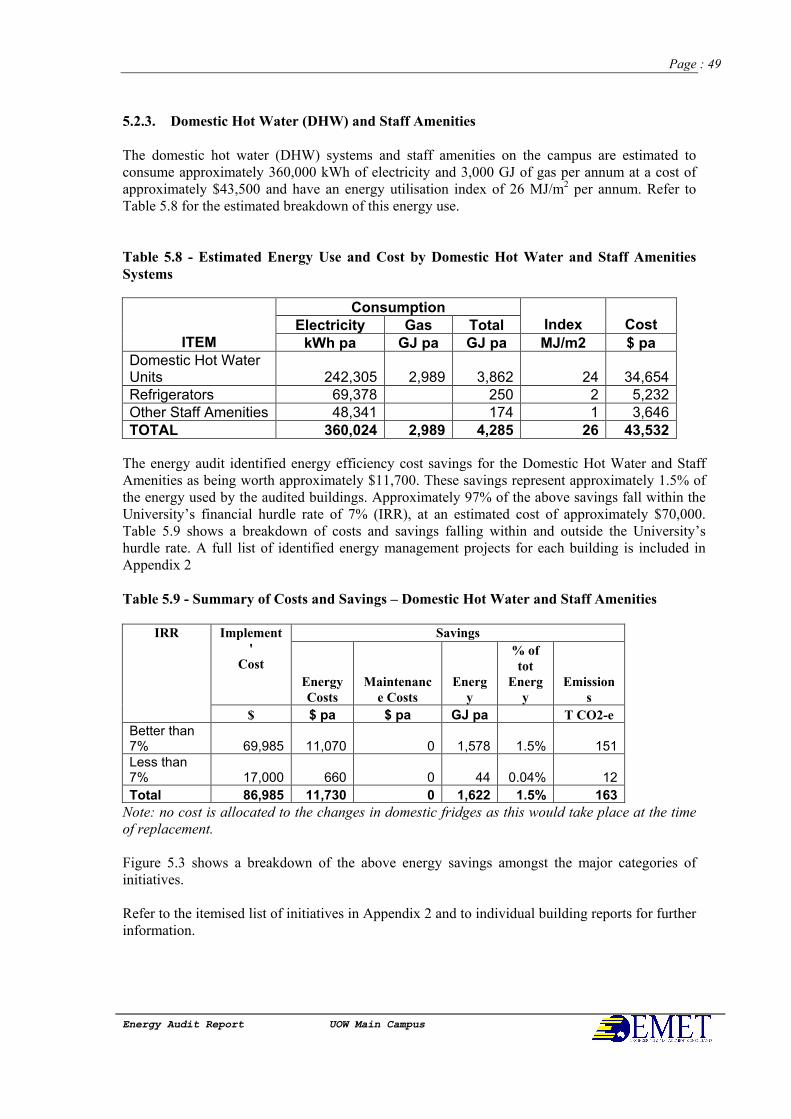
Page : 49
Energy Audit Report UOW Main Campus
5.2.3. Domestic Hot Water (DHW) and Staff Amenities
The domestic hot water (DHW) systems and staff amenities on the campus are estimated to consume approximately 360,000 kWh of electricity and 3,000 GJ of gas per annum at a cost of approximately $43,500 and have an energy utilisation index of 26 MJ/m2 per annum. Refer to Table 5.8 for the estimated breakdown of this energy use.
Table 5.8 - Estimated Energy Use and Cost by Domestic Hot Water and Staff Amenities
Systems
Consumption Electricity Gas Total Index Cost
ITEM kWh pa GJ pa GJ pa MJ/m2 $ pa Domestic Hot Water Units 242,305 2,989 3,862 24 34,654 Refrigerators 69,378 250 2 5,232 Other Staff Amenities 48,341 174 1 3,646 TOTAL 360,024 2,989 4,285 26 43,532
The energy audit identified energy efficiency cost savings for the Domestic Hot Water and Staff Amenities as being worth approximately $11,700. These savings represent approximately 1.5% of the energy used by the audited buildings. Approximately 97% of the above savings fall within the University’s financial hurdle rate of 7% (IRR), at an estimated cost of approximately $70,000. Table 5.9 shows a breakdown of costs and savings falling within and outside the University’s hurdle rate. A full list of identified energy management projects for each building is included in Appendix 2
Table 5.9 - Summary of Costs and Savings – Domestic Hot Water and Staff Amenities
Savings Implement
'
Cost
Energy
Costs
Maintenanc
e Costs
Energ
y
% of
tot
Energ
y
Emission
s
IRR
$ $ pa $ pa GJ pa T CO2-e
Better than 7% 69,985 11,070 0 1,578 1.5% 151 Less than 7% 17,000 660 0 44 0.04% 12
Total 86,985 11,730 0 1,622 1.5% 163
Note: no cost is allocated to the changes in domestic fridges as this would take place at the time
of replacement.
Figure 5.3 shows a breakdown of the above energy savings amongst the major categories of initiatives. Refer to the itemised list of initiatives in Appendix 2 and to individual building reports for further information.
Page : 50
Energy Audit Report UOW Main Campus
Major Categories of Energy Saving Potential
DHW and Staff Amenities
Boiling Water Units
3%
Domestic Hot Water
92%
Refrigerators
5%
Figure 5.3: Major Categories of Energy Saving Potential – Domestic Hot Water Systems
and Staff Amenities
The opportunities identified within these major categories are described below.
5.2.4. Domestic hot water
Domestic hot water is mostly provided by local electric mains pressure storage units and circulating gas systems in areas of high usage such as commercial kitchens (Buildings 11, 12 and 69) or showers (URAC, building 13), or specialised areas such as building 5 (animal house) and buildings 18 (chemistry) and 41 (Science building). Opportunities identified are as follows:
• Time control of circulating systems to reduce system losses when there is no demand for hot water
• Solar systems with gas or electric backup for URAC. Further, it is recommended that new building and refurbishment guidelines include timer control of circulating hot water systems as outlined above, preferably controlled via the BMS time of day schedule. A detailed listing of domestic hot water projects for each building are contained in Appendix 2
Page : 51
Energy Audit Report UOW Main Campus
5.2.4.1. Boiling water units
Boiling water units are extensively used throughout the site in staff amenities, these units remain energised at all times, normally being plugged into a GPO. The opportunity identified is to energise the boiling water units via a push button timer to reduce system losses during periods of low utilisation.
Further, it is recommended that new building and refurbishment guidelines include timer control of boiling water systems as outlined above, preferably controlled via the BMS time of day schedule.
5.2.4.2. Refrigerators
Refrigerators throughout the site are generally rated at three stars or less, there are approximately 80 refrigerators used in staff amenities. It is recommended that existing refrigerators be replaced with 5 star rated refrigerators on failure and that the purchasing policy be changed so that only 5 star rated refrigerators are purchased.
5.2.5. Lighting
The lighting systems on the site are estimated to consume approximately 5,060,000 kWh of electricity per annum at a cost of $380,000. This level of energy use corresponds to an average energy utilisation index of 112MJ/m2 per annum, which is considered to be reasonable for the type of applications and activities involved on the site. A comprehensive upgrade of the lighting systems was conducted by NDYLIGHT in 2003. The upgrade covered many of the larger buildings on the site, namely 11, 16, 17, 19, 20, 25, 35, 39, 40, 41 and 67. The upgrade mostly covered the following initiatives:
• Voltage regulator units
• Movement detectors
• Daylight cells
• Replacement of existing fittings
• Lamp removal Earlier improvements in to other buildings have resulted in the extensive use of movement sensors in corridors and intermittently occupied areas such as tutorial rooms, offices, lecture theatres and staff amenities. This energy audit identified energy efficiency cost savings for the Lighting systems as being worth approximately $45,500 per annum including some minor maintenance savings due to reduced operation of systems. These savings represent approximately 1.6% of the energy used by the audited buildings. Approximately 66% of the above savings fall within the University’s financial hurdle rate of 7% (IRR), at an estimated cost of approximately $166,700. Table 5.10 shows a breakdown of costs and savings falling within and outside the University’s hurdle rate. A full list of identified energy management projects for each building is included in Appendix 2
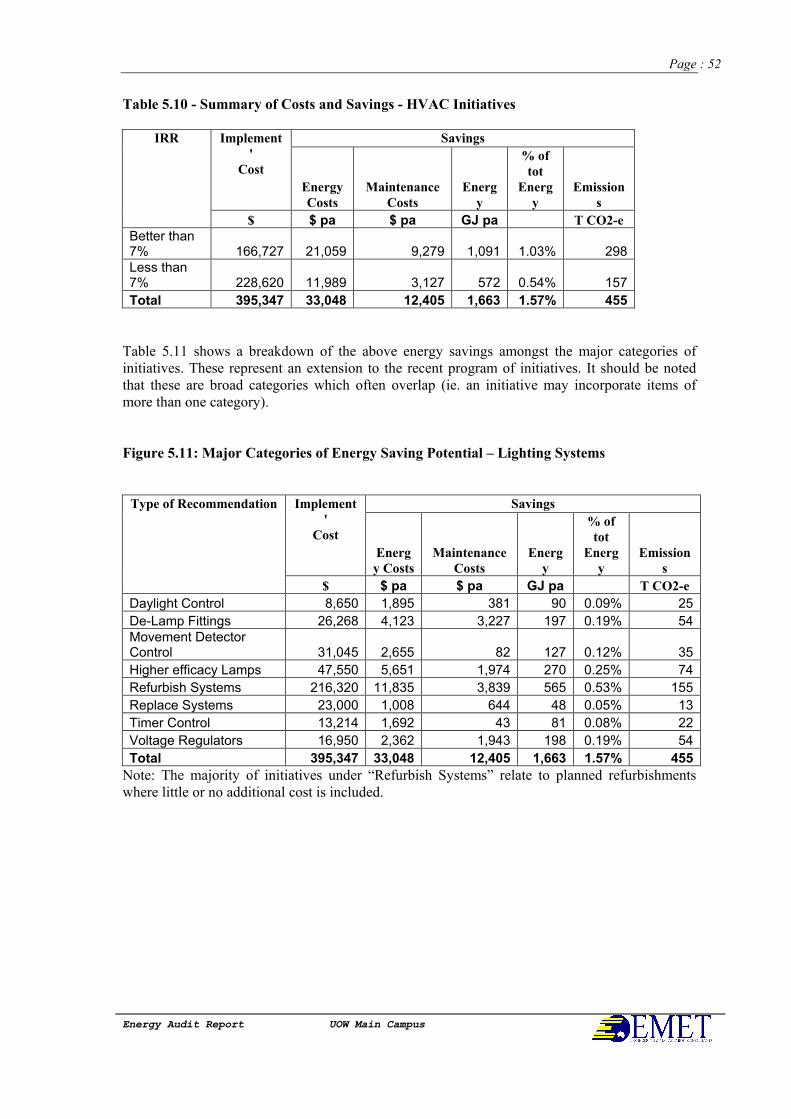
Page : 52
Energy Audit Report UOW Main Campus
Table 5.10 - Summary of Costs and Savings - HVAC Initiatives
Savings Implement
'
Cost
Energy
Costs
Maintenance
Costs
Energ
y
% of
tot
Energ
y
Emission
s
IRR
$ $ pa $ pa GJ pa T CO2-e
Better than 7% 166,727 21,059 9,279 1,091 1.03% 298 Less than 7% 228,620 11,989 3,127 572 0.54% 157
Total 395,347 33,048 12,405 1,663 1.57% 455
Table 5.11 shows a breakdown of the above energy savings amongst the major categories of initiatives. These represent an extension to the recent program of initiatives. It should be noted that these are broad categories which often overlap (ie. an initiative may incorporate items of more than one category).
Figure 5.11: Major Categories of Energy Saving Potential – Lighting Systems
Savings Implement
'
Cost
Energ
y Costs
Maintenance
Costs
Energ
y
% of
tot
Energ
y
Emission
s
Type of Recommendation
$ $ pa $ pa GJ pa T CO2-e
Daylight Control 8,650 1,895 381 90 0.09% 25
De-Lamp Fittings 26,268 4,123 3,227 197 0.19% 54 Movement Detector Control 31,045 2,655 82 127 0.12% 35
Higher efficacy Lamps 47,550 5,651 1,974 270 0.25% 74
Refurbish Systems 216,320 11,835 3,839 565 0.53% 155
Replace Systems 23,000 1,008 644 48 0.05% 13
Timer Control 13,214 1,692 43 81 0.08% 22
Voltage Regulators 16,950 2,362 1,943 198 0.19% 54
Total 395,347 33,048 12,405 1,663 1.57% 455
Note: The majority of initiatives under “Refurbish Systems” relate to planned refurbishments where little or no additional cost is included.

Page : 53
Energy Audit Report UOW Main Campus
5.2.6. Office and Other3 Equipment
The office and other equipment on the site are estimated to consume approximately 5,000,000 kWh of electricity per annum at a cost of $18,000. This level of energy use corresponds to an energy utilisation index of 111MJ/m2 per annum, which is considered to be moderately high. Refer to Table 5.12 for the estimated breakdown of this energy use.
Table 5.12 - Estimated Energy Use and Cost by Office and Other Equipment
Consumption Index Cost
ITEM kWh pa GJ MJ/m2 $ pa
Office Equipment 1,991,597 7,170 44 150,201
Other Equipment 3,002,726 10,810 67 226,457
TOTAL 4,994,323 17,980 111 376,658
5.2.6.1. Personal computers
The main campus has approximately 3,000 personal computers, approximately 2,750 of these are managed by ITS, the Commerce Faculty and the Informatics Faculty, these groups have or are in the process of enabling the Energystar facility on all computers and phasing out CRT monitors. A significant number of the remaining 250 or so computers, based on site observations, are likely to remain on at all times. 5.2.6.2. Combined Photocopiers/Printers
The Main Campus has 133 combination photocopiers/printers which are mostly linked via the campus network. The energy saver time out facility after equipment use is centrally programmed at the maximum time of 4 hours. The energy saver time out facility should be centrally programmed to an optimum time, typically 5 minutes. 5.2.6.3. Other Office Equipment and Systems
A large proportion of general office equipment and many items of other occupant activated plant and equipment was found to be running continuously or for extended periods of time when not being utilised. A general awareness campaign and the use of dedicated shut-down procedures for laboratory services and systems would reduce the incidence of this unnecessary load.
3 Other equipment refers to specialised occupant equipment which is not part of building services and
typically includes laboratory equipment and services.
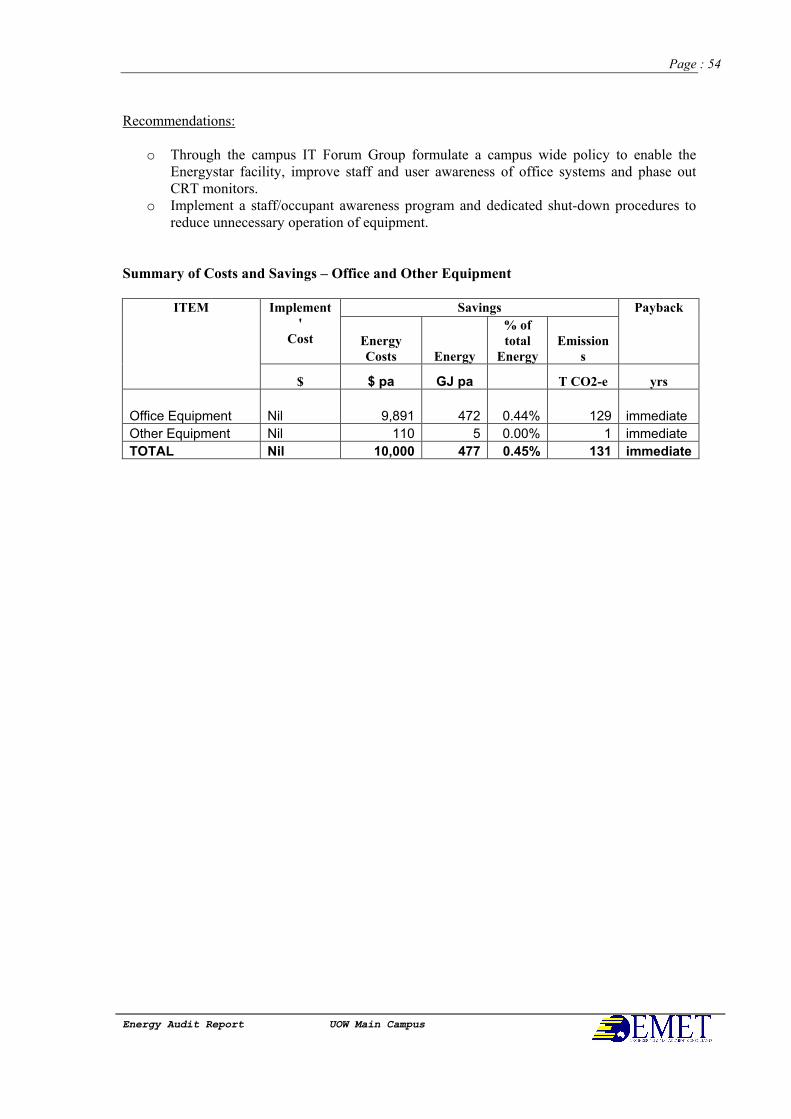
Page : 54
Energy Audit Report UOW Main Campus
Recommendations:
o Through the campus IT Forum Group formulate a campus wide policy to enable the Energystar facility, improve staff and user awareness of office systems and phase out CRT monitors.
o Implement a staff/occupant awareness program and dedicated shut-down procedures to reduce unnecessary operation of equipment.
Summary of Costs and Savings – Office and Other Equipment
Savings Implement
'
Cost Energy
Costs Energy
% of
total
Energy
Emission
s
Payback ITEM
$ $ pa GJ pa T CO2-e yrs
Office Equipment Nil 9,891 472 0.44% 129 immediate
Other Equipment Nil 110 5 0.00% 1 immediate
TOTAL Nil 10,000 477 0.45% 131 immediate

Page : 55
Energy Audit Report UOW Main Campus
6. Maximum Demand Management
6.1. Power Factor Correction
The main campus has nine substations, all of which have power factor equipment installed. The average power factor is in the range 0.91 to 0.99. Table 6.1 summarises an analysis of the power factor for each of the substations
Table 6.1: Power factor correction analysis
Maximum Demand Reductio
n Correction required
Cost Savings
Project Cost Payback Substatio
n
Average Power Factor kVA kVAr $ $ Years
2 0.98 68 250 $906.50 $18,750.0
0 20.7
3 0.99 0 0 $0.00 $0.00 n/a
4 0.93 67 225 $3,515.7
9 $16,875.0
0 4.8
5 0.95 62 175 $2,995.9
0 $13,125.0
0 4.4
6 0.92 84 250 $4,437.9
8 $18,750.0
0 4.2
7-1 0.91 68 200 $3,055.9
2 $15,000.0
0 4.9
7-2 0.97 12 50 $300.52 $3,750.00 12.5
Building 30 0.92 26 75 $1,359.9
6 $5,625.00 4.1
Building 37 0.99 1 0 $0.00 $0.00 n/a
Building 40 0.91 30 100 $1,433.7
6 $7,500.00 5.2
Power Factor correction works for substation 2 fall outside the University’s hurdle rate of 7%IRR. The remainder, at a total cost of $80,600, are estimated to produce a combined electricity demand reduction of 348 kVA, resulting in annual cost savings of $17,100.
6.2 Maximum Demand Control
Building 20 has provision for shedding of air conditioning plant based on a programmable current and Building 16 has provisions in the software for demand load shedding of mechanical plant, this system is not currently enabled. Load shedding based on a current level may not necessarily achieve maximum demand reduction. An effective maximum demand control system for the campus needs to monitor the maximum demand for each revenue meter or substation so as to shed loads associated with the revenue meter or substation on the approach of a maximum demand event for that system. That is, as the demand approaches the maximum demand for that month loads are shed in a prioritised order in attempt to prevent the current maximum demand for that month being exceeded. In the event that the maximum demand for that month is exceeded that demand becomes the target against which loads are shed.

Page : 56
Energy Audit Report UOW Main Campus
The following illustrates some typical ways in which loads can be shed on the approach of a maximum demand event:

Page : 57
Energy Audit Report UOW Main Campus
i) Load limiting of air conditioning compressors ii) Cycling of cooling and heating systems iii) Increase cooling setpoints in summer and reducing heating setpoints in
winter iv) Increasing chilled water temperatures v) Decreasing heating hot water temperatures vi) Widening dead bands on heating and cooling systems
Sheddable loads should be shed in a priority order based on the criticality of the load. A maximum demand control system for the Main Campus would be best implemented via the BMS as the potential sheddable loads are mostly already interfaced to the BMS. It is proposed that a maximum demand control system be evaluated once the major HVAC control and operational issues identified as part of this Technical review are rectified.

Page : 58
Energy Audit Report UOW Main Campus
7. Utilities Metering
7.1. Proposed Utilities Metering System Upgrade (Water, Electricity and Gas)
The NSW Energy Administration Amendment (Water and Energy Savings) Act 2005 requires Energy and/or Water Savings Action Plan participants to report on their progress towards implementing cost-effective energy efficiency improvements on an annual basis, and revise their Energy and/or Water Savings Action Plans every four years.
This energy audit has identified baseline consumption and performance levels for the main campus and for each building, the main campus baselines are based on revenue meter data and the building baselines are based on sub-meter data or estimates where the sub-meter data does not exist or is considered unreliable. The audit has also identified target consumption and performance levels for the campus and for each building against which energy performance improvement measures can be compared. The proposed metering system upgrade is to address the following issues:
i) Provide sub-metering for tenant billing purposes, based on both network and retailer billing rates for both electricity and gas.
ii) Generate monthly and annual reports on the campus energy consumption and
performance as part of the University’s energy management program and annual reporting responsibilities to DEUS
iii) Generate monthly and annual reports on individual building’s energy consumption and
performance as part of the University’s energy management program incorporating monitoring and verification of the implementation of energy efficiency opportunities.
iv) The requirements of future meter requirements for new and refurbished buildings in
terms of establishing baselines, verifying design energy performance and incorporation into the proposed energy management reporting system.
v) Provide a similar monitoring and reporting regime for the University’s Water Saving
Action Plan requirements The University of Wollongong has recognised the need for an improved metering system and has commissioned tender documents be prepared in conjunction with this Energy Savings Action Plan for a utilities metering system covering electricity, natural gas and water. The system will apply to buildings consuming more than 5% of campus energy consumption or where reporting to DEUS is applicable. The system is required to link in with the University’s Strategic Plan and provide notional energy charges to faculties for posting on the University’s intranet.

Page : 59
Energy Audit Report UOW Main Campus
7.2. Electricity
The Main Campus is supplied electricity via ten revenue meters. The site has numerous electricity sub-meters that are mostly intended to monitor individual building consumption. The sub-meters are mostly a synchronous disc type more than 20 years old, some recent installations include sub-meters on mechanical services plant and a BMS based energy monitoring system on the mechanical service plant in Building 16. The metering system is generally in poor condition with a significant number of meters not functioning, not reading correctly, incorrect or no K factor or not commissioned properly. In some cases meters are not clearly identified in relation to the load being metered. Selected meters are read on a monthly basis and the results compiled on a spreadsheet. The readings for URAC, Building 13 and Kooloobong (Building 37) are used for tenant billing purposes; no other tenants on the main campus are billed for their energy consumption on a user pays basis. No other use is currently made of the monthly meter readings. Graduate House, Building 121 pays for its electricity directly with the electricity provider. Revenue meter data for the main campus is available from the electricity retailer as 30 minute interval data.
7.3. Natural Gas
The main campus is supplied by natural gas via one revenue meter. Graduate House (Building 121) has a separate meter and pays for its natural gas directly to the natural gas service provider. The main campus has nine natural gas sub-meters that supply free standing buildings. There is also provision for the installation of additional sub-meters in a number of areas. URAC (Building 13), UniCentre (Building 11) and UniBar (Building 12) meters are read on a monthly basis and used for tenant billing purposes, none of the other gas meters are read on a regular basis. Revenue meter data for the main campus is available from the gas retailer as 24 hour interval data.

Page : 60
Energy Audit Report UOW Main Campus
8. Energy Management
8.1. Current Status
A Diagnostic Review of energy management at the University of Wollongong was completed on June 15, 2005 by Energetics using the One-2-Five energy management rating tool. The review ranked the university at one star out of a five star range suggesting that there is limited focus on energy. The recommended actions of the Diagnostic Review are paraphrased below together with the actions taken before and subsequent to the Diagnostic Review.
1. Understanding of performance and opportunities
Conduct a baseline study (“energy audit”) to establish energy consumption by major users and opportunities for savings. Action taken:
•••• This Technical Review has established baselines and targets and identified energy consumption by major users and opportunities for savings.
•••• Prior to the Diagnostic Review extensive lighting control projects were implemented aimed at reducing energy consumption
2. Plans
Implement an annual planning process that identifies all priority projects, schedules, responsibilities and budgets. Action taken:
• This Technical Review has identified cost effective prioritised costed projects which are to be incorporated into the university’s five year Capital Management Plan which is reviewed annually.
3. Awareness and training
Conduct basic energy-awareness activities within the organisation, focusing on cost savings and environmental issues associated with energy use. Disseminate the information using tools such as the organisation web site or newsletter. Action taken:
• A campus energy management working party has been set up; energy management issues are reviewed and delegated to divisional groups.
• The university’s intranet is to be used to disseminate information on the ESAP; this has already been implemented for the Water Savings Action Plan (WSAP).
4. Demonstrated corporate commitment

Page : 61
Energy Audit Report UOW Main Campus
a) Arrange for an executive-level officer to sign an energy policy or directive containing specific goals and objectives for improving energy efficiency and reducing energy costs. b) Ensure that energy management activities and progress made towards goals are contained in the organisation’s energy directive/policy Action taken:
• Prior to the Diagnostic Review the role of Energy Manager was incorporated into the Maintenance Manager’s role.
• An Environmental Policy came into effect on 23rd of June 2006; one of the aims of the policy is to “focus particularly on minimisation of energy and water consumption, waste management, including recycling, and endeavour to become a community leader in these areas”.
• The preparation of design standards to address energy efficiency requirements for new and the refurbishment of existing buildings is in progress (refer to comments on these work-in-progress documents in Section 9).
5. Metering and Monitoring
Regularly monitor the energy use of all major facilities/cost centres/energy intensive end users. Action taken:
• The university has commissioned the documentation of a utilities metering system to be prepared concurrently with this Technical Review
• The key requirements of the metering systems identified during this review include (refer also to the Section 7 above):
i. A user pays principal for tenants ii. Monthly and annual report generation on campus energy consumption and
performance against target as part of the university’s energy management program.
iii. Monthly and annual report generation on individual building’s energy consumption and performance against target as part of the university’s energy management program.
iv. Monitoring and verification of the implementation of energy efficiency opportunities.

Page : 62
Energy Audit Report UOW Main Campus
8.2 Energy Initiatives to Date
A comprehensive review of lighting systems across the campus has been carried out. The majority of recommendations from these have been implemented across the campus. In addition, a number of air conditioning projects including a chilled beam system and other programs have been completed. It is estimated that these are accruing savings of approximately 9,300 GJ per annum. A series of additional projects with the potential to save 3,553 GJ per annum are at various stages of processing. The preparation of a series of design standards, which address (among other matters) the energy efficiency aspects of new developments and refurbishments, has been commissioned.
8.3 Energy Initiatives Proposed
Section 5 and Section 6 above outline site wide energy efficiency and management opportunities and the individual building reports provide details on specific energy efficiency opportunities applicable to each building. The energy initiatives proposed are broadly summarised as follows:
• Improve the operation and utilisation of the BMS for improved control, monitoring and line management of energy systems
• Fine tune time of day control of HVAC plant and incorporate university recess scheduling and after hours control
• Modify existing BMS control algorithms and carry these changes through to the building Design Standards
• Incorporate energy efficiency requirements in the university’s purchasing policies
• Install a utilities metering system to provide inputs into the university’s Energy Management Program by generating monthly and annual reports on campus and individual building energy consumption and performance against targets.
8.4 Energy Performance Indicators
Baseline energy consumption and performance has been established as part of this Technical Review for the main campus for the 2005 calendar year and performance benchmarks and targets have been established for each building. Load profiles have also been established for peak summer and winter demand days. The inputs required to compare actual consumption and performance against baseline consumption and performance are as follows: Campus:
i) Building gross floor area ii) Monthly and annual campus energy consumption derived from energy accounts iii) Record of changes to the site impacting on energy consumption
Buildings:
i) Monthly and annual electricity consumption for each building derived from utility meter readings.
ii) Record of changes to the building impacting on energy consumption

Page : 63
Energy Audit Report UOW Main Campus
iii) Daily load profiles derived from the utilities metering system with alarm outputs when the expected load profile envelope is exceeded.
8.5 Energy Use Monitoring and Reporting System
The energy use monitoring and reporting system is required to receive data inputs from the utilities metering system and manual data entry to generate reports that provide the following outputs:
i) Report on changes in business activity indicators ii) Performance against baseline and target iii) Identification of areas of poor performance iv) Highlight savings achieved
8.6 Monitoring and Verification of Energy Efficiency Measures
Energy efficiency projects need to be monitored before the project commences and after the project is completed to verify that expected improvements have been achieved. There also needs to be ongoing monitoring to ensure that the expected improvements are maintained, the ongoing monitoring would be provided by the energy use monitoring and reporting system subject to a revision of the targets that should be determined as part of a new project.
Documentation for new buildings and building refurbishments should include estimates of energy consumption and performance at the design stage which should be monitored and verified after building commissioning is complete.
Page : 64
Energy Audit Report UOW Main Campus
9. Design Standards
The University has commissioned the preparation of a number of design standards to provide guidance and direction for new developments and refurbishments on the site. Among other issues, these standards address the energy aspects of the proposed works. Currently, design standards are being prepared for:
1. Building Monitoring and Control Systems 2. Mechanical Services 3. Building Elements 4. Energy Saving Items
At the time of writing this report, the above documents are at various stages of preparation. The following comments apply to the documents at the time of inspection. In general, It is recommended that the procedures called up in the BCA, to ensure that the entire design is modelled and its performance compared against target energy consumption, be called up in these standards and provision be made for energy modelling and assessment of all major components at the time of design to ensure that the final project is optimised.
9.1 Building Monitoring and Control Systems
The standard is focused on the technical issues of design and installation of the system. Many energy management functions are called up as being required however, no details are provided with respect to the operating parameters, user interface requirements, documentation and other operating factors which have been identified as lacking in the system during this energy audit. An example of this is the economy cycle which is called up in the standard but its specific operation and control/adjustment parameters are not specified, possibly resulting in unoptimised operation, as is currently the case across the campus. Documentation and operator access issues which were found lacking in this energy audit have also not been addressed in this document. Similarly, metering and monitoring parameters need to be better specified including the ability to set targets hourly, weekly, monthly and alarming of unusual consumption etc. Other areas where the existing BMCS has been identified as lacking in this energy audit (refer to the relevant clauses) should also be addressed in the standard. BCA 2006 contains a number of provisions applicable to the University and should be called up in lieu of the 2005 edition.
Page : 65
Energy Audit Report UOW Main Campus
9.2 Mechanical Services As for the BMCS standard, this document focuses on the technical issues of design and installation on a general basis. No specific provisions are included for ensuring energy efficiency, specifying target consumption levels, undergoing design review sessions which include energy efficiency etc. The design temperature selections appear to be too extreme and not representative of normal design conditions (eg. design day ambient temperature for cooling is 37C) which will lead to excessive capacities in the system designs. An issue noted during the energy audit was the inefficient operation of systems oversized possibly for future expansion or due to excessively conservative design. Where this is required, a modular approach to the design may be considered more appropriate. Comfort condition settings for heating and cooling also appear to be too restrictive at a maximum of 22.5C and minimum of 20C. These are not in line with general energy efficiency policies. The provisions of BCA 2006 should be called up in the standard and existing areas of conflict with this document should be resolved. In addition, items of equipment and plant which are nominated in the standard need to be checked for compliance against the efficiency requirements contained in the BCA.
9.3 Building Elements This standard covers items of construction, including insulation, material finishes and other areas which affect the overall energy use of the building. Energy efficiency is mentioned as one consideration in the choice of the elements. It is recommended that the procedures called up in the BCA, to ensure that the entire design is modelled and its performance compared against target energy consumption, be called up in this standard and provision be made for energy modelling and assessment of all major components at the time of design to ensure that the final project is optimised.
9.4 Energy Saving Items
This document is in its early stages of preparation and only includes a brief description and main advantages and disadvantages of a number of lighting control devices. It is recommended that the final document be expanded to cover control devices and systems across all areas of energy use and that the discussion of each item be expanded to cover the applications where these systems should be used; provisions for installation; operation; on-going maintenance; programming etc as appropriate for each item. It should be noted that many of these devices and their applications are further specified in the Building Code of Australia. Reference to this document should be included and any anomalies between the two documents should be addressed.

Page : 66
Energy Audit Report UOW Main Campus
10. Implementation Strategy
A number of cash flow analyses were conducted to develop an optimised implementation strategy for the cost-effective (within the university’s 7% hurdle rate) energy management works identified during this energy audit. The options analysed included:
1. Each recommendation carried out in order of cost effectiveness 2. HVAC projects (being the major contributor to total savings) given priority 3. Buildings with most savings first 4. Each type of project (eg. HVAC control improvements) carried out across the campus in
order of cost-effectiveness (by project type) Following is a comparison of effective investment cost for each of the above options assuming all savings achieved from projects previously carried out are made available to assist in financing subsequent projects.
Table 10.1 – Comparison of Effective Investment Cost by Type of Implementation
Implementation Type Effective Investment Cost 1. Projects by cost effectiveness $724,331 2. HVAC priority1 $892,856 3. Buildings with most savings first $885,584 4. Project Type $815,637 Note: the HVAC propriety projects achieve a positive cash flow by year 2 compared to year 3 for the other
strategies, due to the larger number of projects included in the initial year.
The analysis shows that the individual project approach provides the optimum results in providing the quickest return on investment. However this approach is not practical in all cases as it does not make allowances for the administrative and implementation efficiencies found in carrying out like-projects on a site-wide scale, as per option 4 (Project Type). Also, some individual projects will not achieve the predicted cost-effectiveness if they are not carried out at the appropriate time (eg. when the building is being refurbished or the plant is to be upgraded etc), which is a condition on many of these cases. The following program of implementation was found to provide the best combination of priority project types (option 4), combined with some individual projects of high cost-effectiveness (option 1), where these can be effectively undertaken separately. The project-type approach focuses on HVAC projects initially, as the major source of potential, while also ensuring that all energy management options are implemented in buildings and systems which are refurbished during the time of this work program.

Page : 67
Energy Audit Report UOW Main Campus
Table 10.2 – Suggested Program of Implementation
Project Number Measure Description
Cost to Implement
Savings - GJ
Total Cost savings
Internal rate of return
Time required to implement
Planned completion date
1 HVAC - Control Improvements 258,050 6,004 79,157 30.7% 1 yr Dec-07
2 HVAC – Boiler Systems 29,900 702 4,439 14.8% 3 yrs Dec-09
3 HVAC - Chiller and Condenser Water Systems 116,700 1,260 25,844 22.1% 1 yrs Dec-07
4 HVAC - Holiday scheduling and time of day 92,650 7,205 101,507 109.6% 1 yr Dec-07
5
HVAC - Economy Cycle, CO2, Outside air and Night purge 57,000 1,522 27,963 49.1% 1 yr Dec-07
6
HVAC- Control of personal equipment and general awareness 123,150 837 17,223 14.0% 3 yrs Dec-09
7 HVAC - New or refurbished plant 800 235 4,743 592.9% 4 yrs Dec-10
8 HVAC - Other 24,680 153 3,483 14.1% 4 yrs Dec-10
9 DHW
2 and Staff Amenities
initiatives 69,985 1,578 11,070 0 3 yrs Dec-09
10 Specific Utilities initiatives 10,000 1,879 37,587 >100% 1 yr Dec-07
11 Lighting initiatives 166,727 1,091 30,338 0 3 yrs Dec-08
12 Office and Other Equipment initiatives Nil 477 10,000 >100% 4 yrs Dec-10
13 Pool system initiatives 40,930 1,565 12,224 0 2 yrs Dec-08
14 Power Factor Correction initiatives 80,625 348 kVA 17,100 0 3 yrs Dec-09
15 Implement a site-wide metering program 300000 n/a n/a 1 yr Dec-07
Total 1,371,198 24,508 382,677 27.90% 1,371,198
Table 10.2 shows the projected simple cash flow resulting from the application of the above implementation program. It shows that the program becomes self-funding after year 1 following an initial investment of approximately $835,000 and assuming that all energy and maintenance cost savings are retained to fund subsequent projects.
Table 10.3 – Projected Simple Cash Flow of Recommended Program
Year 2007 2008 2009 2010 Subsequent years
Implementation Cost -$834,600 -$207,857 -$303,860 -$24,880
Annual Savings $275,744 $321,992 $375,509 $382,678
Net cost -$834,600 $67,887 $18,132 $350,629 $382,678

Page : 68
Energy Audit Report UOW Main Campus
Energy Audit
University of Wollongong – Main Campus
APPENDIXES
1. Summary of Proposed changes to the building assets at October 2006
2. Itemised List of Energy Management Initiatives
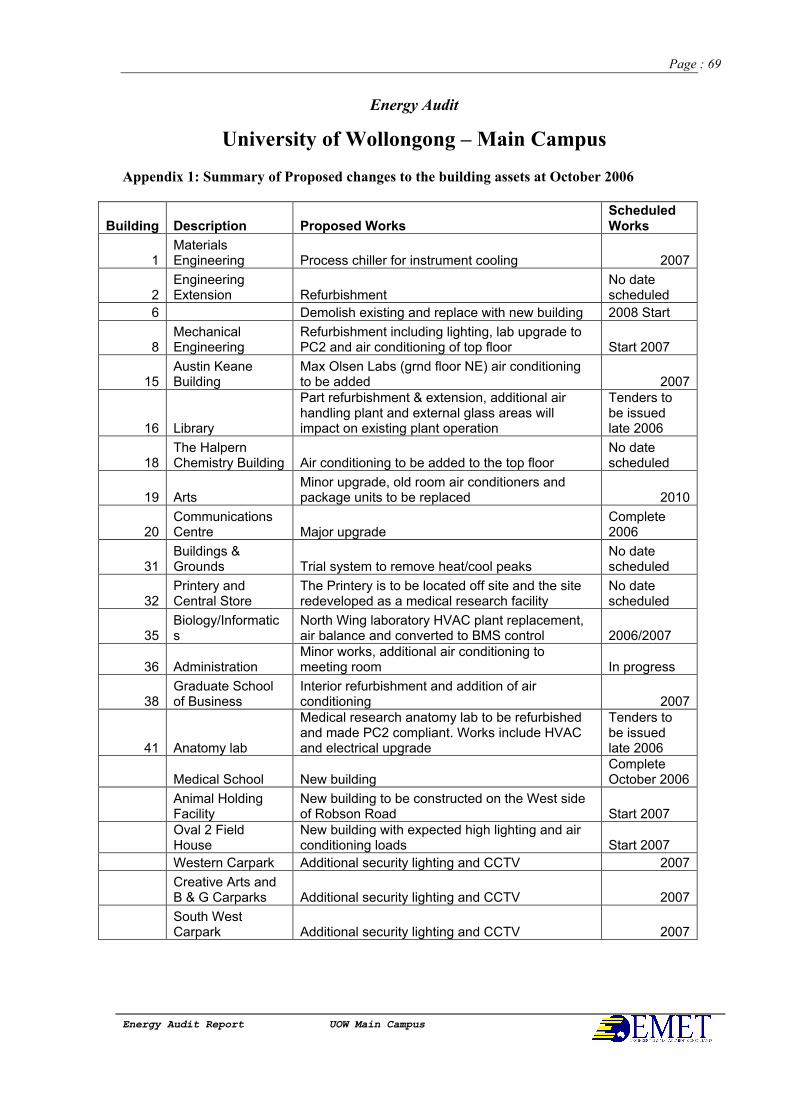
Page : 69
Energy Audit Report UOW Main Campus
Energy Audit
University of Wollongong – Main Campus
Appendix 1: Summary of Proposed changes to the building assets at October 2006
Building Description Proposed Works Scheduled Works
1 Materials Engineering Process chiller for instrument cooling 2007
2 Engineering Extension Refurbishment
No date scheduled
6 Demolish existing and replace with new building 2008 Start
8 Mechanical Engineering
Refurbishment including lighting, lab upgrade to PC2 and air conditioning of top floor Start 2007
15 Austin Keane Building
Max Olsen Labs (grnd floor NE) air conditioning to be added 2007
16 Library
Part refurbishment & extension, additional air handling plant and external glass areas will impact on existing plant operation
Tenders to be issued late 2006
18 The Halpern Chemistry Building Air conditioning to be added to the top floor
No date scheduled
19 Arts Minor upgrade, old room air conditioners and package units to be replaced 2010
20 Communications Centre Major upgrade
Complete 2006
31 Buildings & Grounds Trial system to remove heat/cool peaks
No date scheduled
32 Printery and Central Store
The Printery is to be located off site and the site redeveloped as a medical research facility
No date scheduled
35 Biology/Informatics
North Wing laboratory HVAC plant replacement, air balance and converted to BMS control 2006/2007
36 Administration Minor works, additional air conditioning to meeting room In progress
38 Graduate School of Business
Interior refurbishment and addition of air conditioning 2007
41 Anatomy lab
Medical research anatomy lab to be refurbished and made PC2 compliant. Works include HVAC and electrical upgrade
Tenders to be issued late 2006
Medical School New building Complete October 2006
Animal Holding Facility
New building to be constructed on the West side of Robson Road Start 2007
Oval 2 Field House
New building with expected high lighting and air conditioning loads Start 2007
Western Carpark Additional security lighting and CCTV 2007
Creative Arts and B & G Carparks Additional security lighting and CCTV 2007
South West Carpark Additional security lighting and CCTV 2007

Page : 70
Energy Audit Report UOW Main Campus
APPENDIX 2 – Itemised List of Energy Management Initiatives (Note: The individual items included below are summarised and abbreviated for the purposes of presentation. Refer to the specific building reports which provide
further background and details to each recommendation)
Cost Savings Payback
Building
Category of Initiative
Recommendation
$
Energy
$ pa
Maintenanc
e
$ pa GJ pa
% of
tot
Energy
t CO2-e
pa yrs
Site-Wide Meters Install a site-wide utilities metering and monitoring system
300,000 n/a 0 n/a n/a n/a n/a
1 HVAC
Install a monitoring system via the BMS to track fume cupboard doors that are open for more than a specified period of time, the system should also monitor the makeup air fan to ensure it shuts down outside normal working periods. Trending of these systems would take place out of hours. 5,900 1,844 0 88 6.2% 24 3.2
1 HVAC Install push button timer control of personal heaters 7,000 805 0 38 2.7% 11 8.7
1 DHW Install time of day control on the domestic hot water circulating pump via the BMS. 650 99 5 0.3% 1 6.6
1 Ref Replace the refrigerators with 5 star units when due for replacement 0 42 2 0.1% 1 0.0
1 Light Delamp areas of high light levels 1,008 134 204 6 0.4% 2 3.0
1 Light Daylight link the link corridor between building 1 and building 4 on level 1 and level 2 1,200 229 87 11 0.8% 3 3.8
1 Off Implement Energy Star and a staff awareness program 0 127 0 6 0.4% 2 0.0
1 HVAC
Implement night setback on the 100% outside air system (AHU-RF-01) that provides make up air to the laboratories to cover the situation when fume cupboards are left operating after hours. If appropriate the heating could be turned off out of hours instead of night setback. 2,500 168 0 8 0.6% 2 14.8
1 BWU Install push button timer control to boiling water units 250 10 1 0.0% 0 25.1
2 HVAC
Implement night setback on the tempered air system serving Lab G04 and the four packaged air conditioners serving Labs 102, 104, 106 and 108 to cover the situation when fume cupboards are left operating after hours. If appropriate the heating could be turned off out of hours instead 12,500 5,001 239 24.2% 65 2.5

Page : 71
Energy Audit Report UOW Main Campus
Cost Savings Payback
Building
Category of Initiative
Recommendation
$
Energy
$ pa
Maintenanc
e
$ pa GJ pa
% of
tot
Energy
t CO2-e
pa yrs
of night setback.
2 HVAC
Implement outside air compensation on the tempered air system serving Lab G04 and the four packaged air conditioners serving Labs 102, 104, 106 and 108 to disable heating when the outside air temperature is above 18C or the room temperature is greater than 21C. 2,000 486 23 2.4% 6 4.1
2 HVAC Install push button timer control of personal heaters 7,000 586 39 4.0% 11 11.9
2 Ref Replace the refrigerators with 5 star units when due for replacement 0 18 1 0.1% 0 0.0
2 Off Implement Energy Star and a staff awareness program 0 84 0 4 0.4% 1 0.0
2 HVAC Install audible alarms on the laboratory doors to ensure doors remain closed at all times. 4,250 132 6 0.6% 2 32.2
2 HVAC
Install a monitoring system via the BMS to track fume cupboard doors that are open for more than a specified period of time, the system should also monitor the air handling plant to ensure that it shuts down outside normal working hours. Trending of these systems would take place out of hours. 9,800 169 11 1.1% 3 58.1
2 BWU Install push button timer control to boiling water units 250 10 1 0.1% 0 25.1
3 HVAC Disable the teaching and computer lab time of day control and operate the air conditioning from the adjustable push button timers 8,100 1,850 0 88 2.9% 24 4.4
3 DHW Install low flow taps with automatic shut off in the student toilets on levels 1 and 2 0 121 6 0.2% 2 0.0
3 Ref Replace the refrigerators with 5 star units when due for replacement 0 41 2 0.1% 1 0.0
3 Light Install push button timer control on the staff room lighting and ceiling fans? 450 72 16 3 0.1% 1 5.1
3 Light Install auto transformer control on the ground floor car park lighting 1,600 614 13 29 1.0% 8 2.6
3 Light When the building is due for a bulk lamp replacement with triphosphors, conduct a lighting survey and selectively delamp 8,122 1,665 968 79 2.6% 22 3.1
3 Light Replace the fluorescent tubes in stairs 1 to 3 with T5 28 watt tube kits with electronic ballasts 2,704 454 26 22 0.7% 6 5.6
3 Off Implement Energy Star and a staff awareness program 0 1,080 0 52 1.7% 14 0.0

Page : 72
Energy Audit Report UOW Main Campus
Cost Savings Payback
Building
Category of Initiative
Recommendation
$
Energy
$ pa
Maintenanc
e
$ pa GJ pa
% of
tot
Energy
t CO2-e
pa yrs
3 HVAC
Install shut-off dampers on O/A intakes to air-conditioners to close when the each unit is not operating and automate the speed control on the O/A fan. 21,300 1,335 0 64 2.1% 17 16.0
3 HVAC Install push button timer control of personal heaters 12,250 772 37 1.3% 10 15.9
3 BWU Install push button timer control to boiling water units 500 21 1 0.1% 0 23.6
4 HVAC Control the air conditioners in rooms 1.18 and 1.19 using the average of the two temperature sensors to avoid conflicting operations. 1,950 232 11 0.5% 3 8.4
4 HVAC
Install outside air compensation on the tempered air system that serves room G29 so that there is no heating when the outside air is greater than 18C or the room temperature is greater than 21C. 1,500 164 8 0.3% 2 9.2
4 HVAC Seal the exhaust vent above the fan coil unit discharge in room 141 400 192 9 0.4% 3 2.1
4 HVAC Convert the time control of the air conditioner serving lecture room G31 to push button timer control. 700 112 5 0.2% 1 6.3
4 Ref Replace the refrigerators with 5 star units (if due for replacement during this time) 0 82 4 0.2% 1 0.0
4 Light Delamp areas of high light levels 1,217 168 208 8 0.3% 2 3.2
4 Light Daylight link the first floor walkway lights below the atrium. (13 by quad by 18 watt lights) 800 208 130 10 0.4% 3 2.4
4 Light Install PIR control of the lights in the following areas: G31, 118, 119, 120, 122, 123A, 123C, 141, 142 and G02 of the North wing. 4,250 340 292 16 0.7% 4 6.7
4 Light Install push button timer control of the lights in the staff lunch room 124 250 33 33 2 0.1% 0 3.8
4 Light Install reduced voltage control of the workshop high bay lights 3,200 432 59 21 0.9% 6 6.5
4 Off Implement Energy Star and a staff awareness program 0 1,032 0 49 2.1% 13 0.0
4 HVAC Install push button timer control of personal heaters 19,600 969 65 2.8% 18 20.2
4 BWU Install push button timer control to boiling water units 750 30 2 0.1% 1 25.1
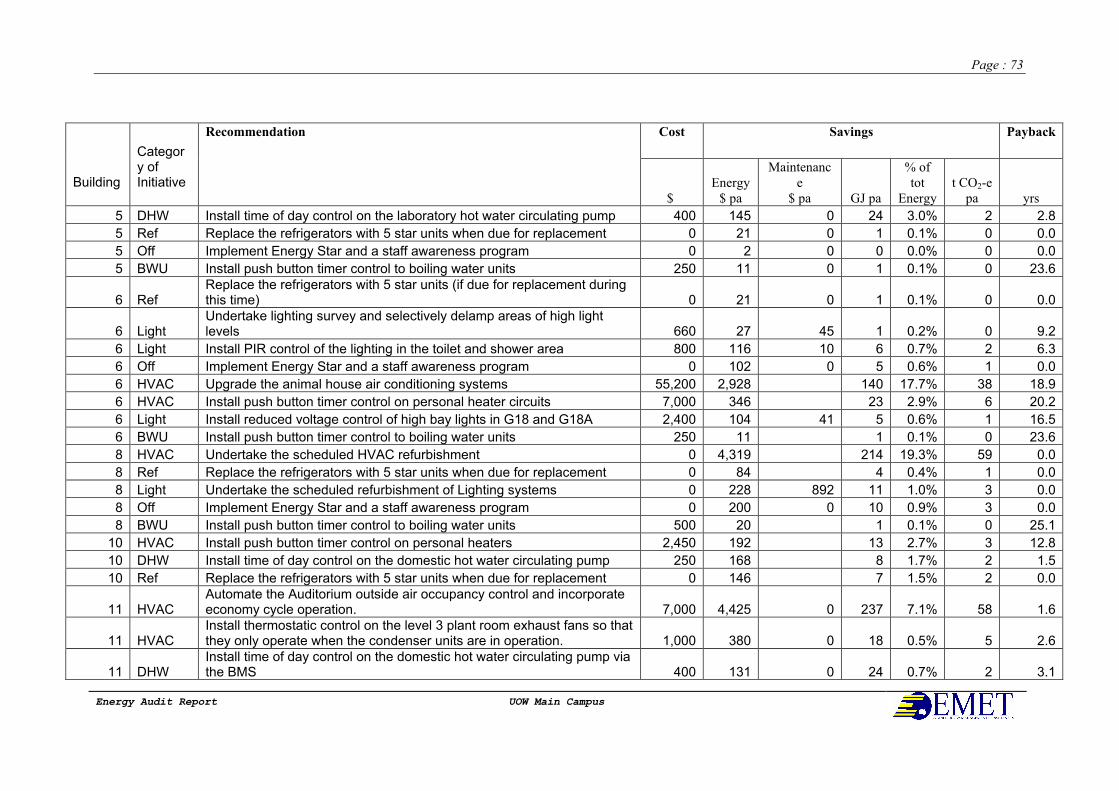
Page : 73
Energy Audit Report UOW Main Campus
Cost Savings Payback
Building
Category of Initiative
Recommendation
$
Energy
$ pa
Maintenanc
e
$ pa GJ pa
% of
tot
Energy
t CO2-e
pa yrs
5 DHW Install time of day control on the laboratory hot water circulating pump 400 145 0 24 3.0% 2 2.8
5 Ref Replace the refrigerators with 5 star units when due for replacement 0 21 0 1 0.1% 0 0.0
5 Off Implement Energy Star and a staff awareness program 0 2 0 0 0.0% 0 0.0
5 BWU Install push button timer control to boiling water units 250 11 0 1 0.1% 0 23.6
6 Ref Replace the refrigerators with 5 star units (if due for replacement during this time) 0 21 0 1 0.1% 0 0.0
6 Light Undertake lighting survey and selectively delamp areas of high light levels 660 27 45 1 0.2% 0 9.2
6 Light Install PIR control of the lighting in the toilet and shower area 800 116 10 6 0.7% 2 6.3
6 Off Implement Energy Star and a staff awareness program 0 102 0 5 0.6% 1 0.0
6 HVAC Upgrade the animal house air conditioning systems 55,200 2,928 140 17.7% 38 18.9
6 HVAC Install push button timer control on personal heater circuits 7,000 346 23 2.9% 6 20.2
6 Light Install reduced voltage control of high bay lights in G18 and G18A 2,400 104 41 5 0.6% 1 16.5
6 BWU Install push button timer control to boiling water units 250 11 1 0.1% 0 23.6
8 HVAC Undertake the scheduled HVAC refurbishment 0 4,319 214 19.3% 59 0.0
8 Ref Replace the refrigerators with 5 star units when due for replacement 0 84 4 0.4% 1 0.0
8 Light Undertake the scheduled refurbishment of Lighting systems 0 228 892 11 1.0% 3 0.0
8 Off Implement Energy Star and a staff awareness program 0 200 0 10 0.9% 3 0.0
8 BWU Install push button timer control to boiling water units 500 20 1 0.1% 0 25.1
10 HVAC Install push button timer control on personal heaters 2,450 192 13 2.7% 3 12.8
10 DHW Install time of day control on the domestic hot water circulating pump 250 168 8 1.7% 2 1.5
10 Ref Replace the refrigerators with 5 star units when due for replacement 0 146 7 1.5% 2 0.0
11 HVAC Automate the Auditorium outside air occupancy control and incorporate economy cycle operation. 7,000 4,425 0 237 7.1% 58 1.6
11 HVAC Install thermostatic control on the level 3 plant room exhaust fans so that they only operate when the condenser units are in operation. 1,000 380 0 18 0.5% 5 2.6
11 DHW Install time of day control on the domestic hot water circulating pump via the BMS 400 131 0 24 0.7% 2 3.1
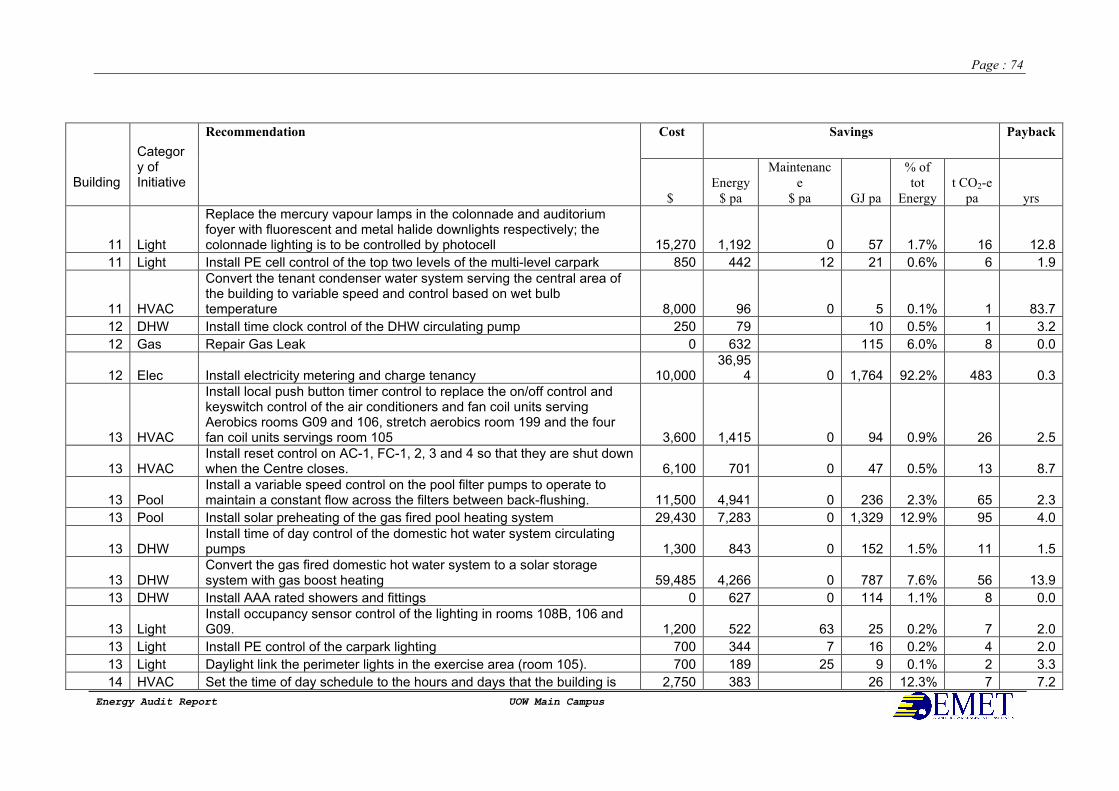
Page : 74
Energy Audit Report UOW Main Campus
Cost Savings Payback
Building
Category of Initiative
Recommendation
$
Energy
$ pa
Maintenanc
e
$ pa GJ pa
% of
tot
Energy
t CO2-e
pa yrs
11 Light
Replace the mercury vapour lamps in the colonnade and auditorium foyer with fluorescent and metal halide downlights respectively; the colonnade lighting is to be controlled by photocell 15,270 1,192 0 57 1.7% 16 12.8
11 Light Install PE cell control of the top two levels of the multi-level carpark 850 442 12 21 0.6% 6 1.9
11 HVAC
Convert the tenant condenser water system serving the central area of the building to variable speed and control based on wet bulb temperature 8,000 96 0 5 0.1% 1 83.7
12 DHW Install time clock control of the DHW circulating pump 250 79 10 0.5% 1 3.2
12 Gas Repair Gas Leak 0 632 115 6.0% 8 0.0
12 Elec Install electricity metering and charge tenancy 10,000 36,95
4 0 1,764 92.2% 483 0.3
13 HVAC
Install local push button timer control to replace the on/off control and keyswitch control of the air conditioners and fan coil units serving Aerobics rooms G09 and 106, stretch aerobics room 199 and the four fan coil units servings room 105 3,600 1,415 0 94 0.9% 26 2.5
13 HVAC Install reset control on AC-1, FC-1, 2, 3 and 4 so that they are shut down when the Centre closes. 6,100 701 0 47 0.5% 13 8.7
13 Pool Install a variable speed control on the pool filter pumps to operate to maintain a constant flow across the filters between back-flushing. 11,500 4,941 0 236 2.3% 65 2.3
13 Pool Install solar preheating of the gas fired pool heating system 29,430 7,283 0 1,329 12.9% 95 4.0
13 DHW Install time of day control of the domestic hot water system circulating pumps 1,300 843 0 152 1.5% 11 1.5
13 DHW Convert the gas fired domestic hot water system to a solar storage system with gas boost heating 59,485 4,266 0 787 7.6% 56 13.9
13 DHW Install AAA rated showers and fittings 0 627 0 114 1.1% 8 0.0
13 Light Install occupancy sensor control of the lighting in rooms 108B, 106 and G09. 1,200 522 63 25 0.2% 7 2.0
13 Light Install PE control of the carpark lighting 700 344 7 16 0.2% 4 2.0
13 Light Daylight link the perimeter lights in the exercise area (room 105). 700 189 25 9 0.1% 2 3.3
14 HVAC Set the time of day schedule to the hours and days that the building is 2,750 383 26 12.3% 7 7.2
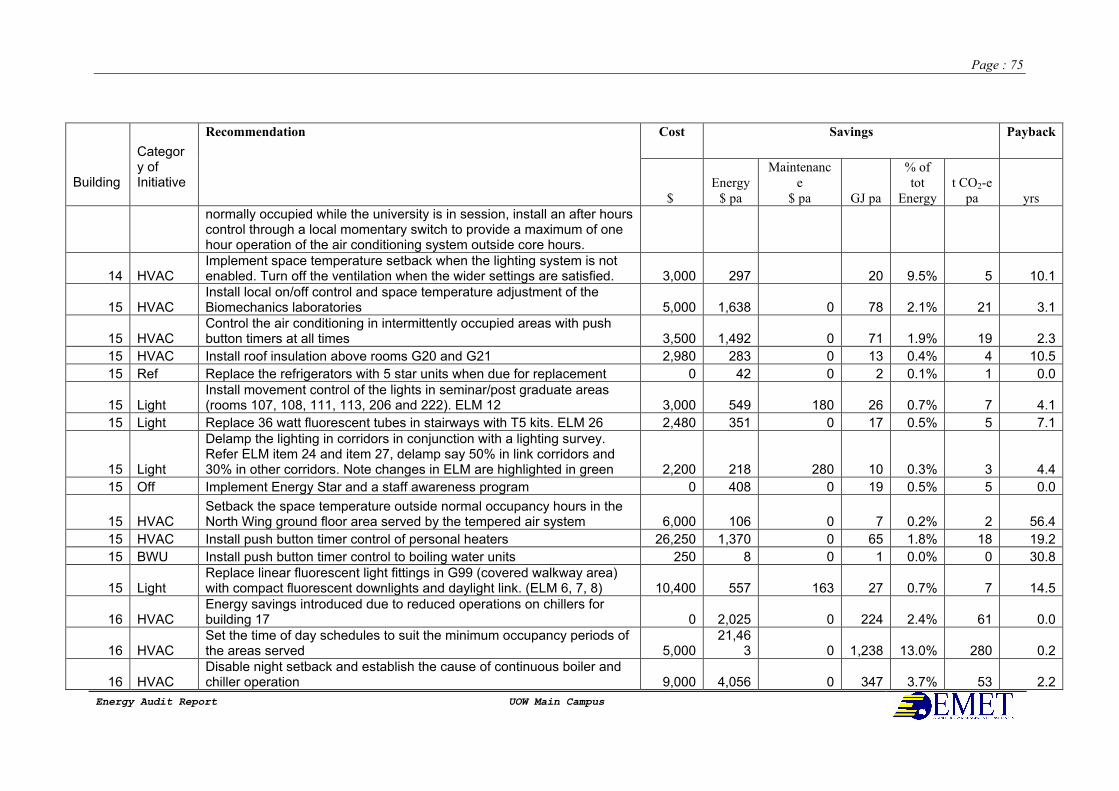
Page : 75
Energy Audit Report UOW Main Campus
Cost Savings Payback
Building
Category of Initiative
Recommendation
$
Energy
$ pa
Maintenanc
e
$ pa GJ pa
% of
tot
Energy
t CO2-e
pa yrs
normally occupied while the university is in session, install an after hours control through a local momentary switch to provide a maximum of one hour operation of the air conditioning system outside core hours.
14 HVAC Implement space temperature setback when the lighting system is not enabled. Turn off the ventilation when the wider settings are satisfied. 3,000 297 20 9.5% 5 10.1
15 HVAC Install local on/off control and space temperature adjustment of the Biomechanics laboratories 5,000 1,638 0 78 2.1% 21 3.1
15 HVAC Control the air conditioning in intermittently occupied areas with push button timers at all times 3,500 1,492 0 71 1.9% 19 2.3
15 HVAC Install roof insulation above rooms G20 and G21 2,980 283 0 13 0.4% 4 10.5
15 Ref Replace the refrigerators with 5 star units when due for replacement 0 42 0 2 0.1% 1 0.0
15 Light Install movement control of the lights in seminar/post graduate areas (rooms 107, 108, 111, 113, 206 and 222). ELM 12 3,000 549 180 26 0.7% 7 4.1
15 Light Replace 36 watt fluorescent tubes in stairways with T5 kits. ELM 26 2,480 351 0 17 0.5% 5 7.1
15 Light
Delamp the lighting in corridors in conjunction with a lighting survey. Refer ELM item 24 and item 27, delamp say 50% in link corridors and 30% in other corridors. Note changes in ELM are highlighted in green 2,200 218 280 10 0.3% 3 4.4
15 Off Implement Energy Star and a staff awareness program 0 408 0 19 0.5% 5 0.0
15 HVAC Setback the space temperature outside normal occupancy hours in the North Wing ground floor area served by the tempered air system 6,000 106 0 7 0.2% 2 56.4
15 HVAC Install push button timer control of personal heaters 26,250 1,370 0 65 1.8% 18 19.2
15 BWU Install push button timer control to boiling water units 250 8 0 1 0.0% 0 30.8
15 Light Replace linear fluorescent light fittings in G99 (covered walkway area) with compact fluorescent downlights and daylight link. (ELM 6, 7, 8) 10,400 557 163 27 0.7% 7 14.5
16 HVAC Energy savings introduced due to reduced operations on chillers for building 17 0 2,025 0 224 2.4% 61 0.0
16 HVAC Set the time of day schedules to suit the minimum occupancy periods of the areas served 5,000
21,463 0 1,238 13.0% 280 0.2
16 HVAC Disable night setback and establish the cause of continuous boiler and chiller operation 9,000 4,056 0 347 3.7% 53 2.2

Page : 76
Energy Audit Report UOW Main Campus
Cost Savings Payback
Building
Category of Initiative
Recommendation
$
Energy
$ pa
Maintenanc
e
$ pa GJ pa
% of
tot
Energy
t CO2-e
pa yrs
16 HVAC Alter the economy cycle algorithm to maximise the use of outside air cooling, while maintaining the required RH limits within the library 4,300 5,882 0 411 4.3% 77 0.7
16 HVAC Control the chiller condensing temperature 33,300 6,057 0 289 3.0% 79 5.5
16 HVAC Rectify chiller staging and plant operating problems 4,500 1,312 0 63 0.7% 17 3.4
16 HVAC
Convert the chilled water valves to two way and modulate the secondary chilled water pumps. Refer to the building 16 report for details on the existing primary/secondary setup. 4,500 322 0 15 0.2% 4 14.0
16 HVAC
Control the variable speed condenser water pumps (chillers 1 and 2) based on maintaining the minimum flow requirements of the chiller at partial load. Refer to the building 16 report for details on the existing variable speed condenser water pumps. 2,500 276 0 13 0.1% 4 9.1
16 HVAC Implement outside air compensation on the leaving hot water setpoint 4,500 698 0 127 1.3% 9 6.4
16 Ref Replace the refrigerators with 5 star units when due for replacement 0 58 0 3 0.0% 1 0.0
16 Light Install after hours push buttons to enable cleaner control of the lighting systems 12,150 1,361 1,562 151 1.6% 41 4.2
16 Light Refurbish the lighting systems in Rooms 101 and 201 as part of a building refurbishment
213,620
11,205 2,913 535 5.4% 146 15.1
16 Off Implement Energy Star and a staff awareness program 0 1,377 0 66 0.6% 18 0.0
16 HVAC Consider supplementary air conditioners as part of the building refurbishment for areas of identified with high thermal loads 67,500 2,992 0 143 1.5% 39 22.6
16 BWU Install push button timer control to boiling water units 250 10 0 1 0.0% 0 24.3
17 HVAC
Set the time of day schedules to suit the minimum occupancy periods of the areas served and implement optimum start stop incorporating a night purge cycle and holiday scheduling. 7,000
18,050 0 1,308 26.2% 236 0.4
17 HVAC Alter the economy cycle algorithm to maximise the use of outside air cooling 2,000 549 0 26 0.5% 7 3.6
17 HVAC
Convert the condenser water pump to variable speed control and set the speed to suit the flow requirements of the condenser water loop. Refer to the Building 17 report for details on future expansion requirements of the condenser water system. 7,800 1,122 0 54 1.1% 15 7.0
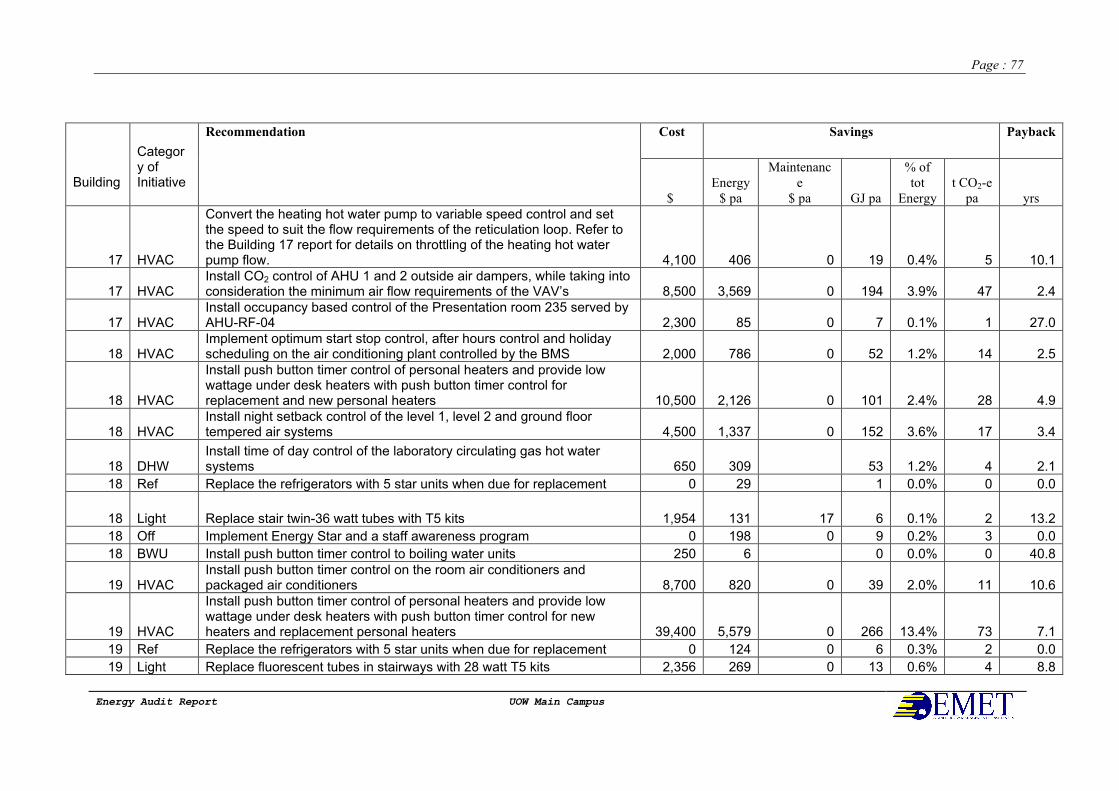
Page : 77
Energy Audit Report UOW Main Campus
Cost Savings Payback
Building
Category of Initiative
Recommendation
$
Energy
$ pa
Maintenanc
e
$ pa GJ pa
% of
tot
Energy
t CO2-e
pa yrs
17 HVAC
Convert the heating hot water pump to variable speed control and set the speed to suit the flow requirements of the reticulation loop. Refer to the Building 17 report for details on throttling of the heating hot water pump flow. 4,100 406 0 19 0.4% 5 10.1
17 HVAC Install CO2 control of AHU 1 and 2 outside air dampers, while taking into consideration the minimum air flow requirements of the VAV’s 8,500 3,569 0 194 3.9% 47 2.4
17 HVAC Install occupancy based control of the Presentation room 235 served by AHU-RF-04 2,300 85 0 7 0.1% 1 27.0
18 HVAC Implement optimum start stop control, after hours control and holiday scheduling on the air conditioning plant controlled by the BMS 2,000 786 0 52 1.2% 14 2.5
18 HVAC
Install push button timer control of personal heaters and provide low wattage under desk heaters with push button timer control for replacement and new personal heaters 10,500 2,126 0 101 2.4% 28 4.9
18 HVAC Install night setback control of the level 1, level 2 and ground floor tempered air systems 4,500 1,337 0 152 3.6% 17 3.4
18 DHW Install time of day control of the laboratory circulating gas hot water systems 650 309 53 1.2% 4 2.1
18 Ref Replace the refrigerators with 5 star units when due for replacement 0 29 1 0.0% 0 0.0
18 Light Replace stair twin-36 watt tubes with T5 kits 1,954 131 17 6 0.1% 2 13.2
18 Off Implement Energy Star and a staff awareness program 0 198 0 9 0.2% 3 0.0
18 BWU Install push button timer control to boiling water units 250 6 0 0.0% 0 40.8
19 HVAC Install push button timer control on the room air conditioners and packaged air conditioners 8,700 820 0 39 2.0% 11 10.6
19 HVAC
Install push button timer control of personal heaters and provide low wattage under desk heaters with push button timer control for new heaters and replacement personal heaters 39,400 5,579 0 266 13.4% 73 7.1
19 Ref Replace the refrigerators with 5 star units when due for replacement 0 124 0 6 0.3% 2 0.0
19 Light Replace fluorescent tubes in stairways with 28 watt T5 kits 2,356 269 0 13 0.6% 4 8.8

Page : 78
Energy Audit Report UOW Main Campus
Cost Savings Payback
Building
Category of Initiative
Recommendation
$
Energy
$ pa
Maintenanc
e
$ pa GJ pa
% of
tot
Energy
t CO2-e
pa yrs
19 Light De- lamp teaching area light fittings in conjunction with a bulk lamp replacement with triphosphors 7,258 1,232 1,014 59 3.0% 16 3.2
19 Off Implement Energy Star and a staff awareness program 0 630 0 30 1.5% 8 0.0
19 HVAC Replace all room and packaged air conditioners with new more efficient split air conditioners 67,200 740 0 35 1.8% 10 90.8
19 BWU Install push button timer control to boiling water units 1,500 64 0 4 0.2% 1 23.6
20 HVAC Install automatic doors on the North and South side of the building 12,800 1,082 0 52 1.3% 14 11.8
20 HVAC
Set the BMS time of day schedules to suit the minimum occupancy periods of the areas served and implement optimum start stop incorporating a night purge cycle, session and holiday scheduling 12,500 6,698 0 320 7.9% 87 1.9
20 HVAC
Install occupancy sensor control to setback the space temperature of the BMS controlled air conditioners. Shut down dedicated air conditioners to these rooms while the temperature is within the setback range 27,500 3,978 0 190 4.7% 52 6.9
20 HVAC Set the Foyer air conditioner space temperature to the average Lecture Theatre setpoint with a dead band of 4C for heating and cooling 2,800 252 0 12 0.3% 3 11.1
20 HVAC Install variable speed control of the Lecture Theatre air conditioners to reduce the fan speed based on space CO2 levels. 4,800 1,109 0 53 1.3% 14 4.3
20 HVAC Install signage to indicate that Lecture Theatre and Cedir TV studio doors should remain closed at all times 5,000 755 0 36 0.9% 10 6.6
20 HVAC
Convert the CEDIR offices air conditioners to BMS control and other efficiency improvements. Refer to the Building 20 report for further details. 6,500
13,691 0 654 16.1% 179 0.5
20 HVAC Establish the reason for the out of hours operation of the Lecture Theatre air conditioning and rectify 3,500 1,198 0 57 1.4% 16 2.9
20 HVAC Foyer air conditioner load shedding. Refer building 20 report for further details 3,000 275 0 0 0.0% 0 10.9
20 Ref Replace the refrigerators with 5 star units when due for replacement 0 62 0 3 0.1% 1 0.0
20 Light Install PE control of the Foyer notice board lighting. 800 103 -21 5 0.1% 1 9.7
20 Light Install reduced voltage control of the Video Conference room high bay 1,600 288 58 14 0.3% 4 4.6
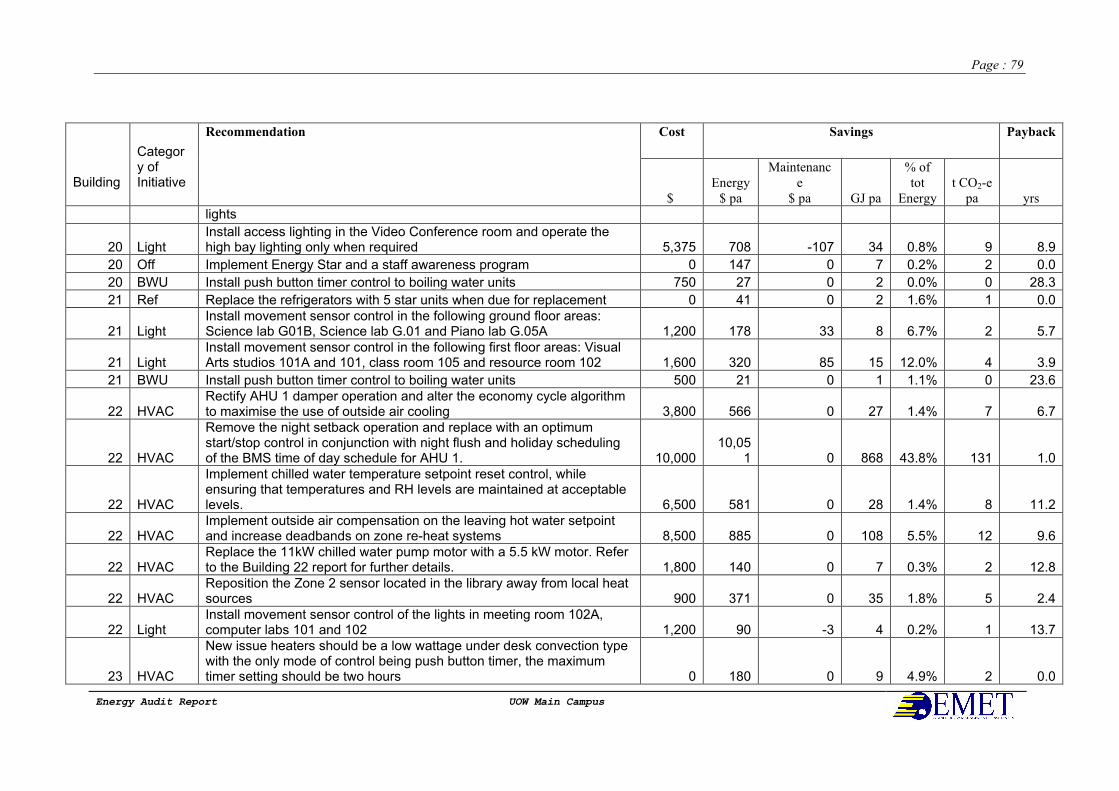
Page : 79
Energy Audit Report UOW Main Campus
Cost Savings Payback
Building
Category of Initiative
Recommendation
$
Energy
$ pa
Maintenanc
e
$ pa GJ pa
% of
tot
Energy
t CO2-e
pa yrs
lights
20 Light Install access lighting in the Video Conference room and operate the high bay lighting only when required 5,375 708 -107 34 0.8% 9 8.9
20 Off Implement Energy Star and a staff awareness program 0 147 0 7 0.2% 2 0.0
20 BWU Install push button timer control to boiling water units 750 27 0 2 0.0% 0 28.3
21 Ref Replace the refrigerators with 5 star units when due for replacement 0 41 0 2 1.6% 1 0.0
21 Light Install movement sensor control in the following ground floor areas: Science lab G01B, Science lab G.01 and Piano lab G.05A 1,200 178 33 8 6.7% 2 5.7
21 Light Install movement sensor control in the following first floor areas: Visual Arts studios 101A and 101, class room 105 and resource room 102 1,600 320 85 15 12.0% 4 3.9
21 BWU Install push button timer control to boiling water units 500 21 0 1 1.1% 0 23.6
22 HVAC Rectify AHU 1 damper operation and alter the economy cycle algorithm to maximise the use of outside air cooling 3,800 566 0 27 1.4% 7 6.7
22 HVAC
Remove the night setback operation and replace with an optimum start/stop control in conjunction with night flush and holiday scheduling of the BMS time of day schedule for AHU 1. 10,000
10,051 0 868 43.8% 131 1.0
22 HVAC
Implement chilled water temperature setpoint reset control, while ensuring that temperatures and RH levels are maintained at acceptable levels. 6,500 581 0 28 1.4% 8 11.2
22 HVAC Implement outside air compensation on the leaving hot water setpoint and increase deadbands on zone re-heat systems 8,500 885 0 108 5.5% 12 9.6
22 HVAC Replace the 11kW chilled water pump motor with a 5.5 kW motor. Refer to the Building 22 report for further details. 1,800 140 0 7 0.3% 2 12.8
22 HVAC Reposition the Zone 2 sensor located in the library away from local heat sources 900 371 0 35 1.8% 5 2.4
22 Light Install movement sensor control of the lights in meeting room 102A, computer labs 101 and 102 1,200 90 -3 4 0.2% 1 13.7
23 HVAC
New issue heaters should be a low wattage under desk convection type with the only mode of control being push button timer, the maximum timer setting should be two hours 0 180 0 9 4.9% 2 0.0

Page : 80
Energy Audit Report UOW Main Campus
Cost Savings Payback
Building
Category of Initiative
Recommendation
$
Energy
$ pa
Maintenanc
e
$ pa GJ pa
% of
tot
Energy
t CO2-e
pa yrs
23 Ref Replace the refrigerators with 5 star units when due for replacement 0 41 0 2 1.1% 1 0.0
23 Light Install occupancy sensor control of the corridor lighting 800 73 -1 3 2.0% 1 11.1
23 Off Implement Energy Star and a staff awareness program 0 68 0 3 1.9% 1 0.0
23 HVAC Install reset control of the ground floor heater circuits 1,350 77 0 4 2.1% 1 17.5
23 BWU Install push button timer control to boiling water units 500 21 0 1 0.8% 0 23.6
25 HVAC
AHU-1 - alter de-humidification, O/A cycle, disable night set-back, review night purge, chilled water setpoint control, O/A compensation on boiler, holiday scheduling, HHW pump control, CO2 control of O/A quantities 9,950 1,741 169 6.1% 29 5.7
25 HVAC
Link the operation of ACU-GF-01 (G18 lecture theatre) to the existing occupancy sensor so that the space temperature is set back when the room is not occupied 2,000 208 10 0.4% 3 9.6
25 HVAC
Link the operation of ACU-RF-01 (128 lecture theatre) to the existing occupancy sensor so that the space temperature is set back when the room is not occupied. 2,000 1,033 49 1.8% 13 1.9
25 HVAC
Disable the tempered air systems heating (AHU-RF-01, AHU-RF-02, AHU-RF-03 and SAF-GF-01) when the outside air temperature is greater than 18C 6,200 1,933 92 3.3% 25 3.2
25 HVAC
Incorporate public holiday and university holiday scheduling into the time of day control of AC-GF-01, AC-GF-02, AC-GF-03, AC-RF-01, AHU-RF-01, AHU-RF-02, AHU-RF-03, SAF-GF-01 and SAF-GF-02 600 436 21 0.8% 6 1.4
25 HVAC
Install push button timer control of personal heaters and provide low wattage under desk heaters with push button timer control for replacement and new personal heaters. 16,100 1,335 64 2.3% 17 12.1
25 Ref Replace the refrigerators with 5 star units when due for replacement 0 124 6 0.2% 2 0.0
25 Light
Install push button timer control of the first floor South corridor art display spotlights, one push button timer is to be installed for each light track. (Steve, there are 5 tracks.Item 8 in ELM) 2,500 807 95 39 1.4% 11 2.8
25 Light Install occupancy control of the ground floor lecture theatre (room 107) and room 153 lighting. Steve, room 152 has 9 twin 36 watt fittings, the 2,200 549 227 26 0.9% 7 2.8

Page : 81
Energy Audit Report UOW Main Campus
Cost Savings Payback
Building
Category of Initiative
Recommendation
$
Energy
$ pa
Maintenanc
e
$ pa GJ pa
% of
tot
Energy
t CO2-e
pa yrs
lecture theatre has 30 x twin 36 watt fittings plus 28 x 36 watt compact fluorescents
25 Off Implement Energy Star and a staff awareness program 0 290 0 14 0.5% 4 0.0
25 BWU Install push button timer control to boiling water units 1,000 39 3 0.1% 1 25.6
29 Ref Replace the refrigerators with 5 star units when due for replacement 0 20 0 1 1.4% 0 0.0
29 Off Implement Energy Star and a staff awareness program 0 36 0 2 2.6% 0 0.0
29 HVAC Install push button timer control of personal heaters 2,150 94 0 4 6.7% 1 22.9
29 BWU Install push button timer control to boiling water units 250 10 0 1 1.0% 0 26.0
30 HVAC Alter the economy cycle algorithm to maximum the use of outside air cooling 2,000 1,519 0 73 1.3% 20 1.3
30 HVAC Implement optimum start stop control in conjunction with night purge and set air conditioning time of day schedules to core occupancy hours 7,000
18,369 0 1,680 30.6% 240 0.4
30 HVAC Review the night purge facility control strategy 2,300 669 0 32 0.6% 9 3.4
30 HVAC
Implement chilled water temperature setpoint reset control, while ensuring that temperatures and RH levels are maintained at acceptable levels. 6,500 3,020 0 144 2.6% 39 2.2
30 HVAC Implement outside air compensation on the leaving hot water setpoint 8,500 974 0 178 3.2% 13 8.7
30 HVAC Install push button timer control of the Demountables room air conditioners 7,250 554 0 26 0.5% 7 13.1
30 Ref Replace the refrigerators with 5 star units when due for replacement 0 61 0 3 0.0% 1 0.0
30 Light Install PE control of the lights in the ground floor foyer adjacent to S2 and the corridor on the Western side 400 49 4 2 0.0% 1 7.5
30 Light Install PE control of the lights in the ground floor foyer G07 400 110 22 5 0.1% 1 3.0
30 Light
Install movement sensor control of the Demountable classroom lights. Refer to the Building 30 report for details on the Demountable classrooms recommendations 5,200 552 124 26 0.4% 7 7.7
30 Off Implement Energy Star and a staff awareness program 0 340 0 16 0.3% 4 0.0
30 BWU Install push button timer control to boiling water units 500 20 0 1 0.0% 0 24.9
30 Light Install PE control of the lights in the ground floor foyer adjacent to S1 400 32 -5 2 0.0% 0 14.6

Page : 82
Energy Audit Report UOW Main Campus
Cost Savings Payback
Building
Category of Initiative
Recommendation
$
Energy
$ pa
Maintenanc
e
$ pa GJ pa
% of
tot
Energy
t CO2-e
pa yrs
31 HVAC
Install push button timer control of personal heaters and provide low wattage under desk heaters with push button timer control for new heaters and replacement personal heaters 2,000 238 0 11 3.5% 3 8.4
31 Ref Replace the refrigerators with 5 star units when due for replacement 0 19 0 1 0.3% 0 0.0
31 Light PIR and daylight link the lunch room lighting 550 84 6 4 1.2% 1 6.2
31 Off Implement Energy Star and a staff awareness program 0 64 0 3 0.9% 1 0.0
31 BWU Install push button timer control to boiling water units 500 21 0 1 0.4% 0 23.6
35 HVAC
Incorporate optimum start stop in conjunction with night purge and set the BMS time of day schedule to core occupancy times, utilise after hours push button control at all other times including university recess and public holiday periods 500 2,276 0 122 1.8% 30 0.2
35 HVAC
Install movement sensors to setback the lecture theatre space temperatures when the space is unoccupied while the BMS time of day schedule is enabled. Shut down the systems when the temperature is within the setback range. 1,500 242 0 23 0.3% 3 6.2
35 HVAC An economy cycle that maximises the lecture theatre outside air cooling 500 99 0 5 0.1% 1 5.1
35 HVAC Incorporate space temperature setback of the rooms served by SF-1 5,000 2,333 0 426 6.1% 30 2.1
35 HVAC Control the cooling tower fan based on wet bulb temperature 1,800 270 0 13 0.2% 4 6.7
35 HVAC
Incorporate optimum start stop in conjunction with night purge and set the BMS time of day schedule to core occupancy times, utilise after hours push button control at all other times including university recess and public holiday periods 500 616 0 29 0.4% 8 0.8
35 HVAC
Install movement sensors to setback the lecture theatre space temperatures when the space is unoccupied while the BMS time of day schedule is enabled. Shut down the systems when the temperature is within the setback range. A setback of +/-2C should be used during system enabled times – subject to site testing) 1,500 192 0 9 0.1% 3 7.8
35 HVAC An economy cycle that maximises the lecture theatre outside air cooling 500 52 0 2 0.0% 1 9.7
35 HVAC Install push button timer control of personal heaters 8,000 761 0 36 0.5% 10 10.5
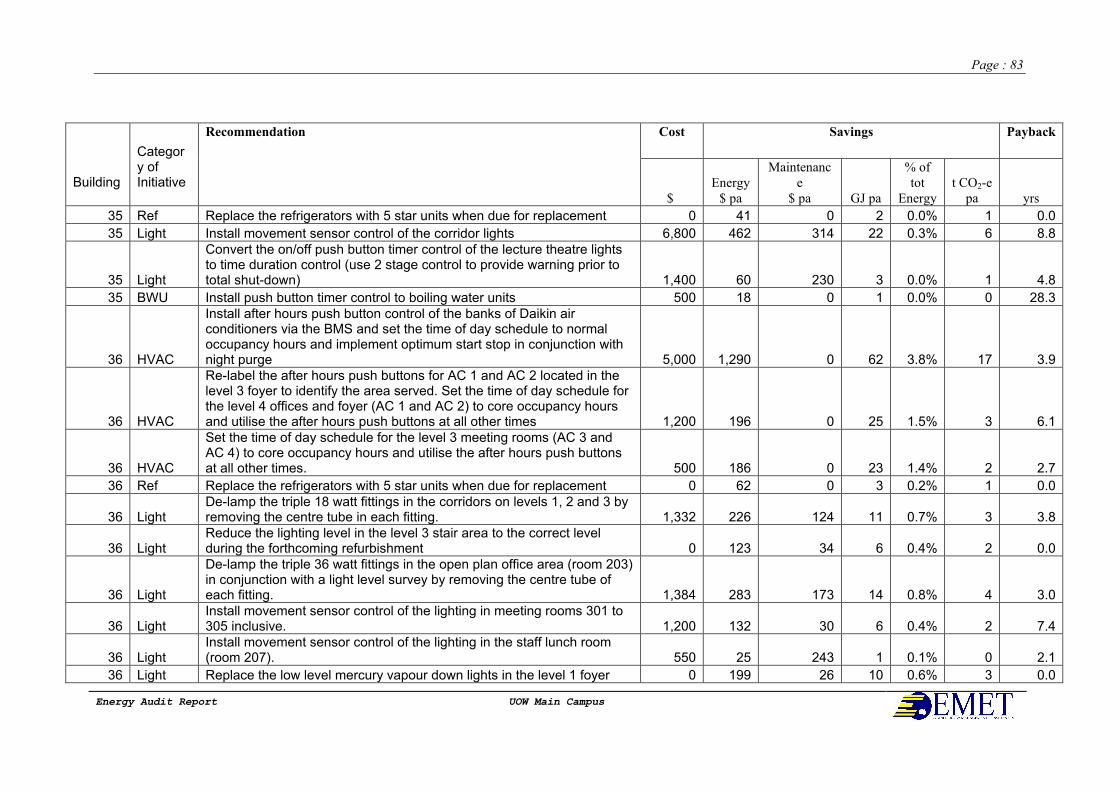
Page : 83
Energy Audit Report UOW Main Campus
Cost Savings Payback
Building
Category of Initiative
Recommendation
$
Energy
$ pa
Maintenanc
e
$ pa GJ pa
% of
tot
Energy
t CO2-e
pa yrs
35 Ref Replace the refrigerators with 5 star units when due for replacement 0 41 0 2 0.0% 1 0.0
35 Light Install movement sensor control of the corridor lights 6,800 462 314 22 0.3% 6 8.8
35 Light
Convert the on/off push button timer control of the lecture theatre lights to time duration control (use 2 stage control to provide warning prior to total shut-down) 1,400 60 230 3 0.0% 1 4.8
35 BWU Install push button timer control to boiling water units 500 18 0 1 0.0% 0 28.3
36 HVAC
Install after hours push button control of the banks of Daikin air conditioners via the BMS and set the time of day schedule to normal occupancy hours and implement optimum start stop in conjunction with night purge 5,000 1,290 0 62 3.8% 17 3.9
36 HVAC
Re-label the after hours push buttons for AC 1 and AC 2 located in the level 3 foyer to identify the area served. Set the time of day schedule for the level 4 offices and foyer (AC 1 and AC 2) to core occupancy hours and utilise the after hours push buttons at all other times 1,200 196 0 25 1.5% 3 6.1
36 HVAC
Set the time of day schedule for the level 3 meeting rooms (AC 3 and AC 4) to core occupancy hours and utilise the after hours push buttons at all other times. 500 186 0 23 1.4% 2 2.7
36 Ref Replace the refrigerators with 5 star units when due for replacement 0 62 0 3 0.2% 1 0.0
36 Light De-lamp the triple 18 watt fittings in the corridors on levels 1, 2 and 3 by removing the centre tube in each fitting. 1,332 226 124 11 0.7% 3 3.8
36 Light Reduce the lighting level in the level 3 stair area to the correct level during the forthcoming refurbishment 0 123 34 6 0.4% 2 0.0
36 Light
De-lamp the triple 36 watt fittings in the open plan office area (room 203) in conjunction with a light level survey by removing the centre tube of each fitting. 1,384 283 173 14 0.8% 4 3.0
36 Light Install movement sensor control of the lighting in meeting rooms 301 to 305 inclusive. 1,200 132 30 6 0.4% 2 7.4
36 Light Install movement sensor control of the lighting in the staff lunch room (room 207). 550 25 243 1 0.1% 0 2.1
36 Light Replace the low level mercury vapour down lights in the level 1 foyer 0 199 26 10 0.6% 3 0.0
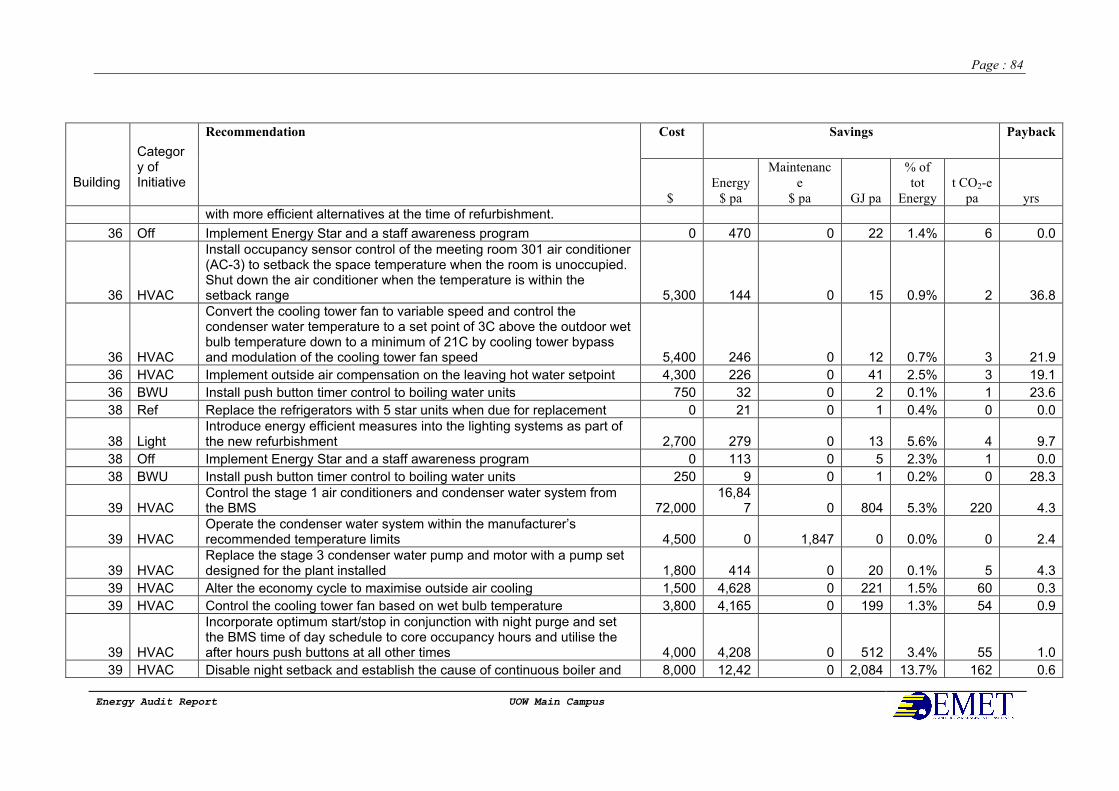
Page : 84
Energy Audit Report UOW Main Campus
Cost Savings Payback
Building
Category of Initiative
Recommendation
$
Energy
$ pa
Maintenanc
e
$ pa GJ pa
% of
tot
Energy
t CO2-e
pa yrs
with more efficient alternatives at the time of refurbishment.
36 Off Implement Energy Star and a staff awareness program 0 470 0 22 1.4% 6 0.0
36 HVAC
Install occupancy sensor control of the meeting room 301 air conditioner (AC-3) to setback the space temperature when the room is unoccupied. Shut down the air conditioner when the temperature is within the setback range 5,300 144 0 15 0.9% 2 36.8
36 HVAC
Convert the cooling tower fan to variable speed and control the condenser water temperature to a set point of 3C above the outdoor wet bulb temperature down to a minimum of 21C by cooling tower bypass and modulation of the cooling tower fan speed 5,400 246 0 12 0.7% 3 21.9
36 HVAC Implement outside air compensation on the leaving hot water setpoint 4,300 226 0 41 2.5% 3 19.1
36 BWU Install push button timer control to boiling water units 750 32 0 2 0.1% 1 23.6
38 Ref Replace the refrigerators with 5 star units when due for replacement 0 21 0 1 0.4% 0 0.0
38 Light Introduce energy efficient measures into the lighting systems as part of the new refurbishment 2,700 279 0 13 5.6% 4 9.7
38 Off Implement Energy Star and a staff awareness program 0 113 0 5 2.3% 1 0.0
38 BWU Install push button timer control to boiling water units 250 9 0 1 0.2% 0 28.3
39 HVAC Control the stage 1 air conditioners and condenser water system from the BMS 72,000
16,847 0 804 5.3% 220 4.3
39 HVAC Operate the condenser water system within the manufacturer’s recommended temperature limits 4,500 0 1,847 0 0.0% 0 2.4
39 HVAC Replace the stage 3 condenser water pump and motor with a pump set designed for the plant installed 1,800 414 0 20 0.1% 5 4.3
39 HVAC Alter the economy cycle to maximise outside air cooling 1,500 4,628 0 221 1.5% 60 0.3
39 HVAC Control the cooling tower fan based on wet bulb temperature 3,800 4,165 0 199 1.3% 54 0.9
39 HVAC
Incorporate optimum start/stop in conjunction with night purge and set the BMS time of day schedule to core occupancy hours and utilise the after hours push buttons at all other times 4,000 4,208 0 512 3.4% 55 1.0
39 HVAC Disable night setback and establish the cause of continuous boiler and 8,000 12,42 0 2,084 13.7% 162 0.6
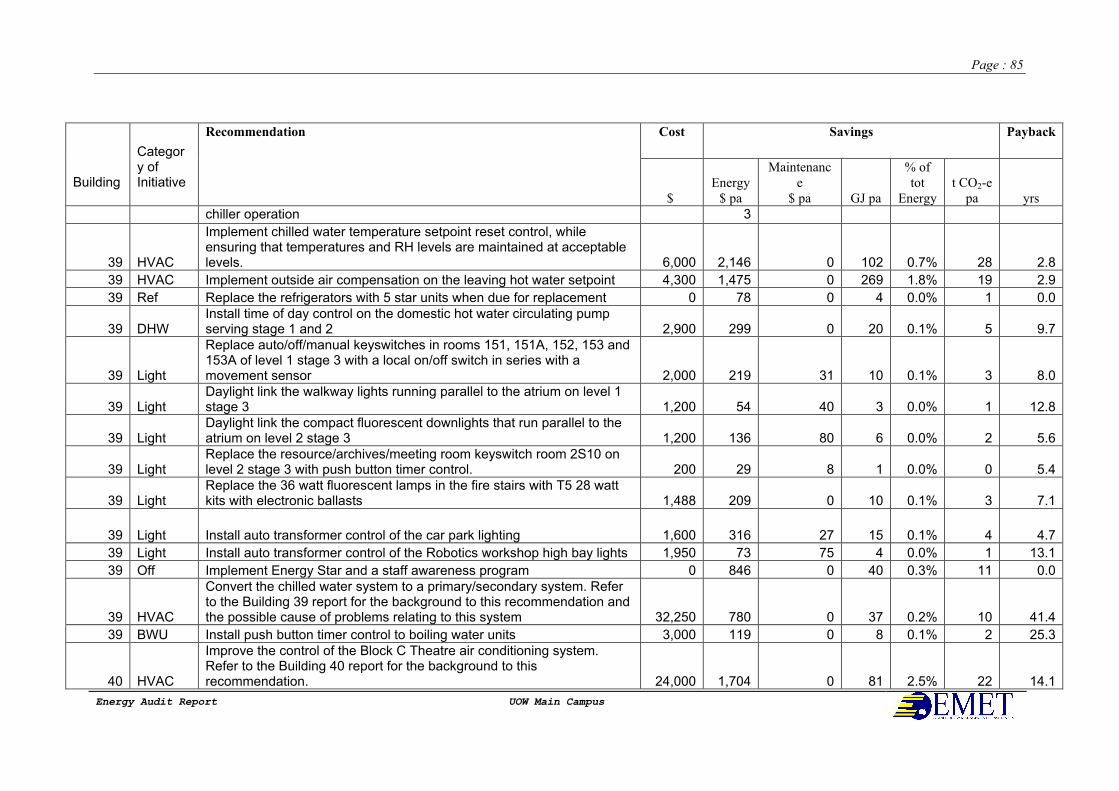
Page : 85
Energy Audit Report UOW Main Campus
Cost Savings Payback
Building
Category of Initiative
Recommendation
$
Energy
$ pa
Maintenanc
e
$ pa GJ pa
% of
tot
Energy
t CO2-e
pa yrs
chiller operation 3
39 HVAC
Implement chilled water temperature setpoint reset control, while ensuring that temperatures and RH levels are maintained at acceptable levels. 6,000 2,146 0 102 0.7% 28 2.8
39 HVAC Implement outside air compensation on the leaving hot water setpoint 4,300 1,475 0 269 1.8% 19 2.9
39 Ref Replace the refrigerators with 5 star units when due for replacement 0 78 0 4 0.0% 1 0.0
39 DHW Install time of day control on the domestic hot water circulating pump serving stage 1 and 2 2,900 299 0 20 0.1% 5 9.7
39 Light
Replace auto/off/manual keyswitches in rooms 151, 151A, 152, 153 and 153A of level 1 stage 3 with a local on/off switch in series with a movement sensor 2,000 219 31 10 0.1% 3 8.0
39 Light Daylight link the walkway lights running parallel to the atrium on level 1 stage 3 1,200 54 40 3 0.0% 1 12.8
39 Light Daylight link the compact fluorescent downlights that run parallel to the atrium on level 2 stage 3 1,200 136 80 6 0.0% 2 5.6
39 Light Replace the resource/archives/meeting room keyswitch room 2S10 on level 2 stage 3 with push button timer control. 200 29 8 1 0.0% 0 5.4
39 Light Replace the 36 watt fluorescent lamps in the fire stairs with T5 28 watt kits with electronic ballasts 1,488 209 0 10 0.1% 3 7.1
39 Light Install auto transformer control of the car park lighting 1,600 316 27 15 0.1% 4 4.7
39 Light Install auto transformer control of the Robotics workshop high bay lights 1,950 73 75 4 0.0% 1 13.1
39 Off Implement Energy Star and a staff awareness program 0 846 0 40 0.3% 11 0.0
39 HVAC
Convert the chilled water system to a primary/secondary system. Refer to the Building 39 report for the background to this recommendation and the possible cause of problems relating to this system 32,250 780 0 37 0.2% 10 41.4
39 BWU Install push button timer control to boiling water units 3,000 119 0 8 0.1% 2 25.3
40 HVAC
Improve the control of the Block C Theatre air conditioning system. Refer to the Building 40 report for the background to this recommendation. 24,000 1,704 0 81 2.5% 22 14.1
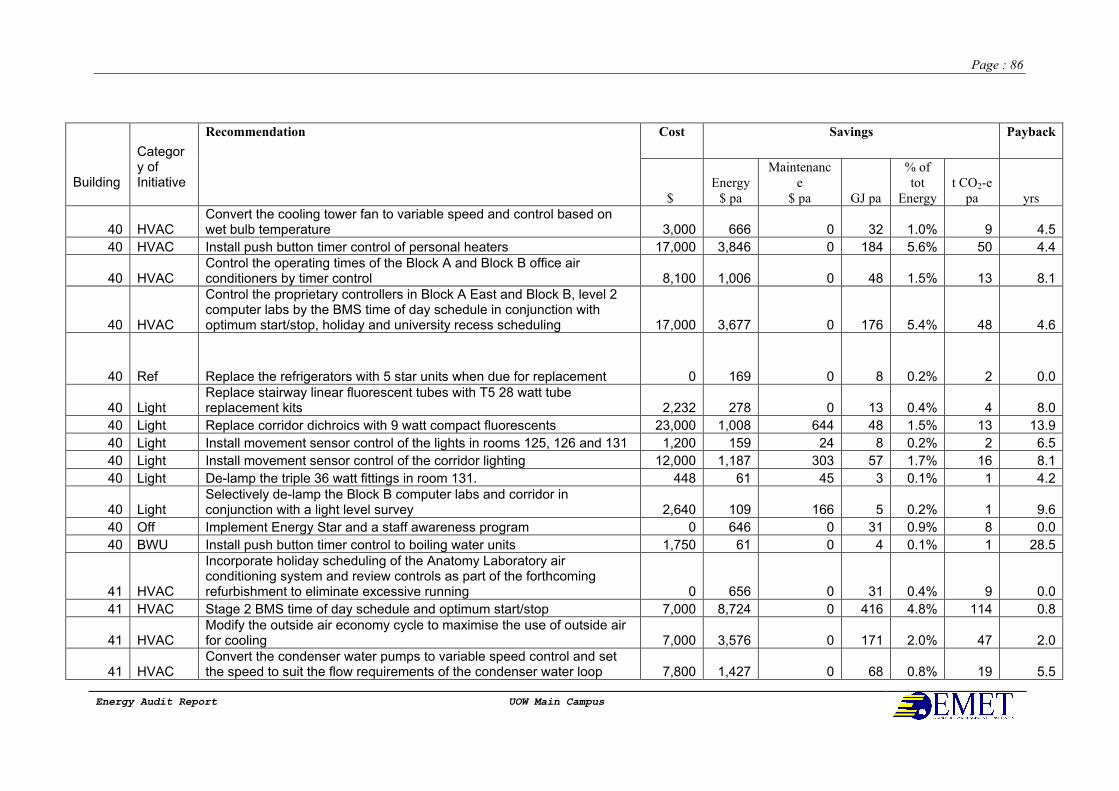
Page : 86
Energy Audit Report UOW Main Campus
Cost Savings Payback
Building
Category of Initiative
Recommendation
$
Energy
$ pa
Maintenanc
e
$ pa GJ pa
% of
tot
Energy
t CO2-e
pa yrs
40 HVAC Convert the cooling tower fan to variable speed and control based on wet bulb temperature 3,000 666 0 32 1.0% 9 4.5
40 HVAC Install push button timer control of personal heaters 17,000 3,846 0 184 5.6% 50 4.4
40 HVAC Control the operating times of the Block A and Block B office air conditioners by timer control 8,100 1,006 0 48 1.5% 13 8.1
40 HVAC
Control the proprietary controllers in Block A East and Block B, level 2 computer labs by the BMS time of day schedule in conjunction with optimum start/stop, holiday and university recess scheduling 17,000 3,677 0 176 5.4% 48 4.6
40 Ref Replace the refrigerators with 5 star units when due for replacement 0 169 0 8 0.2% 2 0.0
40 Light Replace stairway linear fluorescent tubes with T5 28 watt tube replacement kits 2,232 278 0 13 0.4% 4 8.0
40 Light Replace corridor dichroics with 9 watt compact fluorescents 23,000 1,008 644 48 1.5% 13 13.9
40 Light Install movement sensor control of the lights in rooms 125, 126 and 131 1,200 159 24 8 0.2% 2 6.5
40 Light Install movement sensor control of the corridor lighting 12,000 1,187 303 57 1.7% 16 8.1
40 Light De-lamp the triple 36 watt fittings in room 131. 448 61 45 3 0.1% 1 4.2
40 Light Selectively de-lamp the Block B computer labs and corridor in conjunction with a light level survey 2,640 109 166 5 0.2% 1 9.6
40 Off Implement Energy Star and a staff awareness program 0 646 0 31 0.9% 8 0.0
40 BWU Install push button timer control to boiling water units 1,750 61 0 4 0.1% 1 28.5
41 HVAC
Incorporate holiday scheduling of the Anatomy Laboratory air conditioning system and review controls as part of the forthcoming refurbishment to eliminate excessive running 0 656 0 31 0.4% 9 0.0
41 HVAC Stage 2 BMS time of day schedule and optimum start/stop 7,000 8,724 0 416 4.8% 114 0.8
41 HVAC Modify the outside air economy cycle to maximise the use of outside air for cooling 7,000 3,576 0 171 2.0% 47 2.0
41 HVAC Convert the condenser water pumps to variable speed control and set the speed to suit the flow requirements of the condenser water loop 7,800 1,427 0 68 0.8% 19 5.5
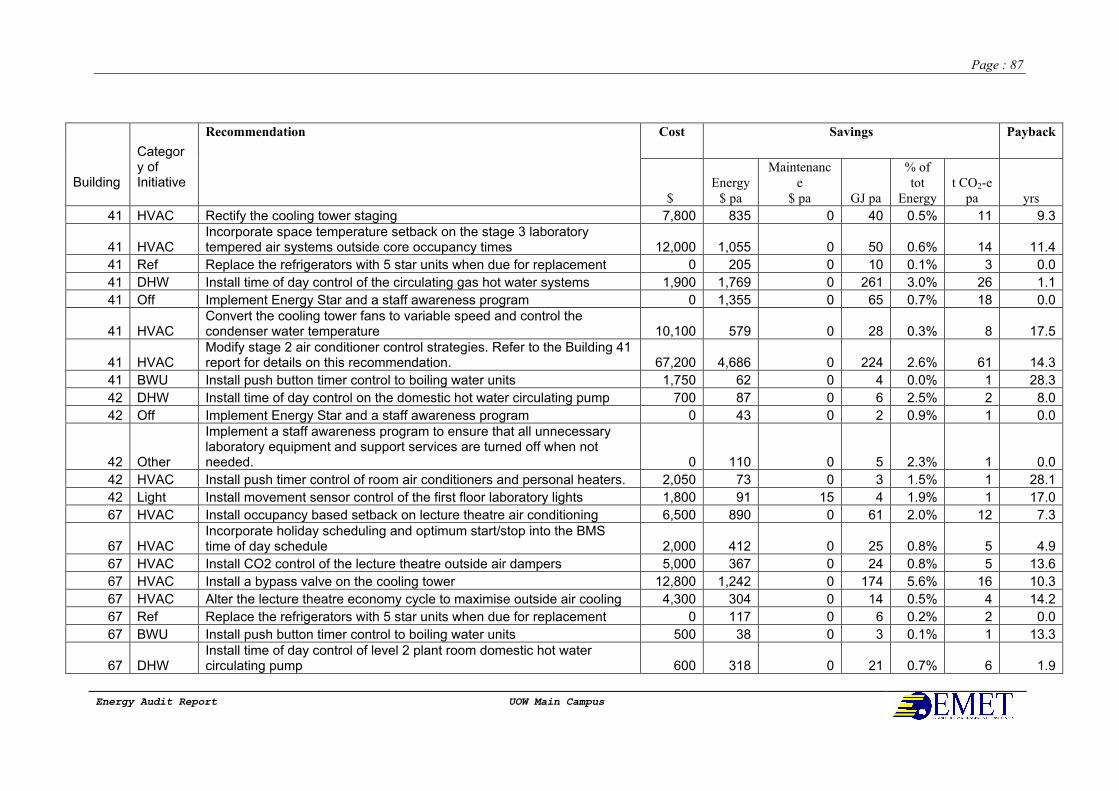
Page : 87
Energy Audit Report UOW Main Campus
Cost Savings Payback
Building
Category of Initiative
Recommendation
$
Energy
$ pa
Maintenanc
e
$ pa GJ pa
% of
tot
Energy
t CO2-e
pa yrs
41 HVAC Rectify the cooling tower staging 7,800 835 0 40 0.5% 11 9.3
41 HVAC Incorporate space temperature setback on the stage 3 laboratory tempered air systems outside core occupancy times 12,000 1,055 0 50 0.6% 14 11.4
41 Ref Replace the refrigerators with 5 star units when due for replacement 0 205 0 10 0.1% 3 0.0
41 DHW Install time of day control of the circulating gas hot water systems 1,900 1,769 0 261 3.0% 26 1.1
41 Off Implement Energy Star and a staff awareness program 0 1,355 0 65 0.7% 18 0.0
41 HVAC Convert the cooling tower fans to variable speed and control the condenser water temperature 10,100 579 0 28 0.3% 8 17.5
41 HVAC Modify stage 2 air conditioner control strategies. Refer to the Building 41 report for details on this recommendation. 67,200 4,686 0 224 2.6% 61 14.3
41 BWU Install push button timer control to boiling water units 1,750 62 0 4 0.0% 1 28.3
42 DHW Install time of day control on the domestic hot water circulating pump 700 87 0 6 2.5% 2 8.0
42 Off Implement Energy Star and a staff awareness program 0 43 0 2 0.9% 1 0.0
42 Other
Implement a staff awareness program to ensure that all unnecessary laboratory equipment and support services are turned off when not needed. 0 110 0 5 2.3% 1 0.0
42 HVAC Install push timer control of room air conditioners and personal heaters. 2,050 73 0 3 1.5% 1 28.1
42 Light Install movement sensor control of the first floor laboratory lights 1,800 91 15 4 1.9% 1 17.0
67 HVAC Install occupancy based setback on lecture theatre air conditioning 6,500 890 0 61 2.0% 12 7.3
67 HVAC Incorporate holiday scheduling and optimum start/stop into the BMS time of day schedule 2,000 412 0 25 0.8% 5 4.9
67 HVAC Install CO2 control of the lecture theatre outside air dampers 5,000 367 0 24 0.8% 5 13.6
67 HVAC Install a bypass valve on the cooling tower 12,800 1,242 0 174 5.6% 16 10.3
67 HVAC Alter the lecture theatre economy cycle to maximise outside air cooling 4,300 304 0 14 0.5% 4 14.2
67 Ref Replace the refrigerators with 5 star units when due for replacement 0 117 0 6 0.2% 2 0.0
67 BWU Install push button timer control to boiling water units 500 38 0 3 0.1% 1 13.3
67 DHW Install time of day control of level 2 plant room domestic hot water circulating pump 600 318 0 21 0.7% 6 1.9
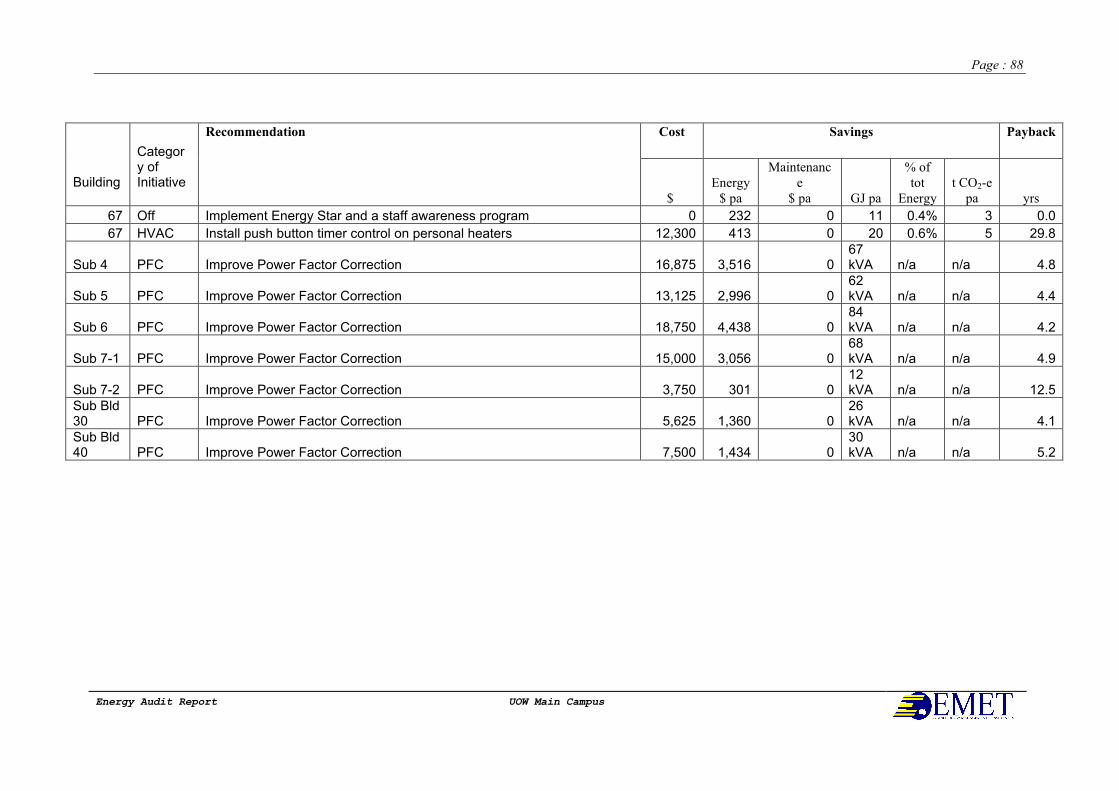
Page : 88
Energy Audit Report UOW Main Campus
Cost Savings Payback
Building
Category of Initiative
Recommendation
$
Energy
$ pa
Maintenanc
e
$ pa GJ pa
% of
tot
Energy
t CO2-e
pa yrs
67 Off Implement Energy Star and a staff awareness program 0 232 0 11 0.4% 3 0.0
67 HVAC Install push button timer control on personal heaters 12,300 413 0 20 0.6% 5 29.8
Sub 4 PFC Improve Power Factor Correction 16,875 3,516 0 67 kVA n/a n/a 4.8
Sub 5 PFC Improve Power Factor Correction 13,125 2,996 0 62 kVA n/a n/a 4.4
Sub 6 PFC Improve Power Factor Correction 18,750 4,438 0 84 kVA n/a n/a 4.2
Sub 7-1 PFC Improve Power Factor Correction 15,000 3,056 0 68 kVA n/a n/a 4.9
Sub 7-2 PFC Improve Power Factor Correction 3,750 301 0 12 kVA n/a n/a 12.5
Sub Bld 30 PFC Improve Power Factor Correction 5,625 1,360 0
26 kVA n/a n/a 4.1
Sub Bld 40 PFC Improve Power Factor Correction 7,500 1,434 0
30 kVA n/a n/a 5.2