Embed Size (px)
Citation preview
University of ZurichZurich Open Repository and Archive
Winterthurerstr. 190
CH-8057 Zurich
http://www.zora.uzh.ch
Year: 2010
Hydrogen-Promoted Chlorination of RuO2(110)
Hofmann, J P; Zweidinger, S; Knapp, M; Seitsonen, A P; Schulte, K; Andersen, J N;Lundgren, E; Over, H
Hofmann, J P; Zweidinger, S; Knapp, M; Seitsonen, A P; Schulte, K; Andersen, J N; Lundgren, E; Over, H (2010).Hydrogen-Promoted Chlorination of RuO2(110). Journal of Physical Chemistry C, 114(24):10901-10909.Postprint available at:http://www.zora.uzh.ch
Posted at the Zurich Open Repository and Archive, University of Zurich.http://www.zora.uzh.ch
Originally published at:Journal of Physical Chemistry C 2010, 114(24):10901-10909.
1
Hydrogen Promoted Chlorination of RuO2(110)
Jan Philipp Hofmanna), Stefan Zweidinger a), Marcus Knapp a), Ari Paavo Seitsonen b), Karina Schulte c),
Jesper N. Andersen c), Edvin Lundgren c), and Herbert Over a)*
a) Physikalisch-Chemisches Institut, Justus-Liebig-Universität Gießen, Heinrich-Buff-Ring 58, D-35392
Gießen, Germany b) IMPMC, CNRS & Université Pierre et Marie Curie, 4 place Jussieu, case 115, F-
75252 Paris, France and Physikalisch-Chemisches Institut der Universität Zürich, Winterthurerstrasse
190, CH-8057 Zürich, Switzerland c) Department of Synchrotron Radiation Research, Lund University,
Sölvegatan 14, S-22362 Lund, Sweden
To whom correspondence should be addressed. E-Mail: [email protected] Fax:
++49-641-9934559. URL: ://www.uni-giessen.de/cms/physchem/over
Abstract
High resolution core level photoemission spectroscopy and temperature programmed reaction
experiments together with density functional theory calculations were used to elucidate the chlorination
mechanism of ruthenium dioxide RuO2(110) by hydrogen chloride exposure on the atomic scale. The
surface selective chlorination accounts for the extraordinary stability of the RuO2 catalyst in the
Sumitomo process – the heterogeneously catalyzed oxidation of hydrogen chloride by oxygen. The
selective replacement of bridging oxygen atoms by chlorine atoms depends on the formation of water
molecules serving as leaving groups. Water is produced by the chlorine assisted recombination of two
neighboring surface hydroxyl groups at around 450 K – a temperature where water instantaneously
leaves the surface. Finally, the bridging vacancy is filled in by chlorine atoms, thereby forming bridging
chlorine atoms. Pre-adsorbed hydrogen has shown to facilitate the chlorination process for stoichiometry
reasons. The general strategy of transforming bridging O atoms into a good leaving group has been
corroborated by the chlorination of RuO2(110) via CO pretreatment and subsequent Cl2 exposure with
CO2 as leaving group.
2
1. Introduction
In 2004, Sumitomo Chemical has introduced a stable and efficient catalytic process for the recovery of
molecular chlorine from HCl1, an abundant by-product in a number of important industrial chemical
processing schemes, thereby avoiding undesired waste processing. The “Sumitomo process” is based on
the surprisingly simple Deacon reaction2, namely the oxidation of HCl by oxygen:
4 HCl + O2 2 H2O + 2 Cl2 López et al. studied the mechanism of HCl oxidation over RuO2 powder under realistic reaction
conditions3. At the same time the atomic details of the HCl oxidation over a RuO2(110) model catalyst
were elucidated by our group4,5. Both research groups identified independently the rate determining step
with the association of chlorine adsorbed terminally on the one fold coordinatively unsaturated 1f-cus
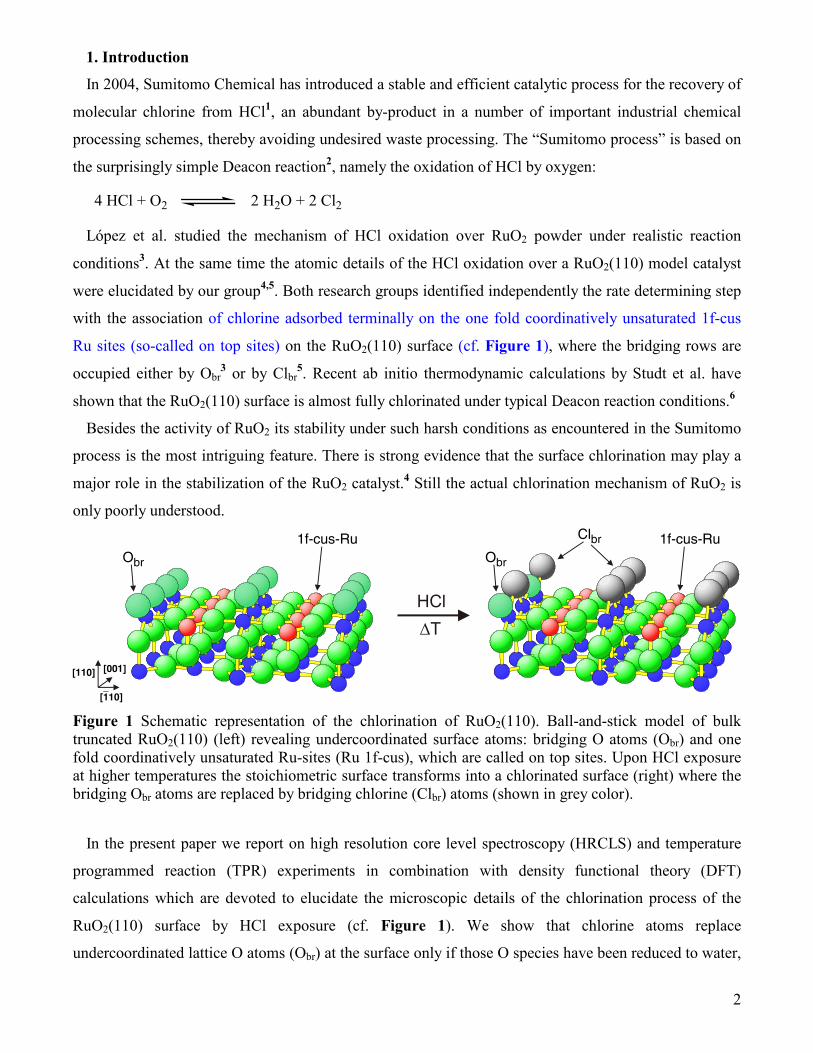
Ru sites (so-called on top sites) on the RuO2(110) surface (cf. Figure 1), where the bridging rows are
occupied either by Obr3 or by Clbr
5. Recent ab initio thermodynamic calculations by Studt et al. have
shown that the RuO2(110) surface is almost fully chlorinated under typical Deacon reaction conditions.6
Besides the activity of RuO2 its stability under such harsh conditions as encountered in the Sumitomo
process is the most intriguing feature. There is strong evidence that the surface chlorination may play a
major role in the stabilization of the RuO2 catalyst.4 Still the actual chlorination mechanism of RuO2 is
only poorly understood.
Figure 1 Schematic representation of the chlorination of RuO2(110). Ball-and-stick model of bulk truncated RuO2(110) (left) revealing undercoordinated surface atoms: bridging O atoms (Obr) and one fold coordinatively unsaturated Ru-sites (Ru 1f-cus), which are called on top sites. Upon HCl exposure at higher temperatures the stoichiometric surface transforms into a chlorinated surface (right) where the bridging Obr atoms are replaced by bridging chlorine (Clbr) atoms (shown in grey color).
In the present paper we report on high resolution core level spectroscopy (HRCLS) and temperature
programmed reaction (TPR) experiments in combination with density functional theory (DFT)
calculations which are devoted to elucidate the microscopic details of the chlorination process of the
RuO2(110) surface by HCl exposure (cf. Figure 1). We show that chlorine atoms replace
undercoordinated lattice O atoms (Obr) at the surface only if those O species have been reduced to water,
3
a neutral leaving group to make room for chlorine insertion. For stoichiometry reasons this process is
strongly promoted by preadsorbed hydrogen.
2. Experimental Details
The HRCLS measurements were conducted at beamline I311 at MAX-lab in Lund, Sweden7.
The photon energies for the measurements of the O 1s and Cl 2p core levels were carefully chosen to be
580 eV and 250 eV, respectively, in order to enhance the surface sensitivity without facing a too intense
background in the spectra due to secondary electrons. The total energy resolutions of O 1s and Cl 2p
spectra were 230 and 115 meV, respectively. All HRCL spectra were recorded at a sample temperature
of 110 K. For a quantitative evaluation the experimental HRCL spectra were decomposed into a small
number of Doniach-Šunjić profiles convoluted with Gaussian distributions8. Synchrotron radiation
induced beam damage of the sample surface has been checked for and shown to be negligible.
The temperature programmed reaction (TPR) experiments were carried out in an ultra-high vacuum
(UHV) chamber equipped with low energy electron diffraction (LEED) optics, a quadrupole mass
spectrometer (QMS), a Perkin Elmer Auger electron spectrometer with cylindrical mirror analyzer
(AES), and facilities for surface preparation and cleaning9. The differentially cryo-pumped QMS with
ion counting detection was connected to the main chamber via a closed cone with a small aperture (d = 2
mm) facing the sample at a distance of approximately 1 mm. This experimental geometry ensures that
only molecules released from the sample surface can reach the QMS. For the temperature programmed
reaction experiments the heating rate was set to be 5.0 K/s.
The stoichiometric RuO2(110) surface (referred to as s-RuO2(110)) was produced by exposing a well
prepared Ru(0001) surface to 2×10⁶ L O2 (1 L = 1 Langmuir = 1.33×10⁻⁶ mbar×s) at a sample
temperature of 650 K. In the bulk structure of RuO2 (rutile type), the Ru atoms bind to six oxygen
atoms, forming a slightly distorted RuO6 octahedron, while the O atoms are coordinated to three Ru
atoms in a planar sp2 configuration. On the stoichiometric RuO2(110) surface (cf. ball-and-stick model
of the bulk-truncated RuO2(110) surface (Figure 1)) two kinds of undercoordinated surface atoms are
present which are arranged in rows along the [001] direction: (a) the bridging oxygen atoms (Obr) which
are coordinated only to two Ru atoms (instead of three) and (b) the so-called 1f-cus Ru atoms (1f-cus
stands for one-fold coordinatively unsaturated sites)10 which are coordinated to five O atoms (instead of
six).
For DFT calculations11 we employed the projector augmented wave method12 with a plane wave
cutoff of 37 Ry and the generalized gradient approximation13. The surface was modeled by five tri-layers
of RuO2(110) (super cell approach) with adsorbates only placed at one side of the slab. Consecutive
RuO2(110) slabs were separated by a vacuum region of about 16 Å. Adsorption energy and the geometry
4
of adsorbed HCl, Cl, O, hydroxyl and water groups on RuO2(110) were determined using a (2x1) or a
(2x2) surface unit cell with a uniform k point mesh of 4x2 and 4x4 k points, respectively. The core level
energy shifts were calculated by removing half of an electron from the core orbital and calculating self-
consistently the electronic structure14. Hence, the screening effect ("final state") of the hole is
automatically included in these calculations. The core level binding energy shifts between inequivalent
atoms are obtained as the energy differences between the Kohn-Sham eigenvalues of the half-filled core
state of these atoms. On the basis of these DFT calculations the experimental O 1s and Cl 2p core level
components can be uniquely assigned to specific O, OH, H2O and Cl species on the RuO2(110) surface.
The activation energy of an elementary reaction step during the chlorination process was determined as
the maximum energy value of the system along a predefined reaction coordinate. For more complex
reaction coordinates Nudged Elastic Band (NEB)15 calculations on the basis of DFT were employed.
3. Results and Discussion
3.1. Stoichiometry Considerations
As shown in a recent paper4, the surface chlorination process of RuO2(110) takes place by replacing
the bridging O atoms by chlorine. There are several ways conceivable how the bridging O atoms of
RuO2(110) can be replaced by chlorine. First of all simple exposure of molecular chlorine is not able to
chlorinate the RuO2(110) surface, since the exchange process ot brbrot O Cl O Cl +→+ is activated by
2.3 eV according to our DFT calculations. Obviously, hydrogen is an important ingredient in the
chlorination mechanism and is automatically supplied by HCl exposure. DFT calculations show that the
hydrogen atom of adsorbed HCl is directly transferred to the adjacent bridging Obr atom without any
noticeable activation barrier. However, the next step for the chlorination, i.e. the replacement of the
bridging hydroxyl group by on top Cl (Clot + ObrH → Clbr + OotH) is again strongly activated by more
than 3 eV as found by DFT-based nudged elastic band (NEB) calculations. Therefore, the chlorination
process needs the formation of bridging water as reaction intermediate to replace bridging Obr by
chlorine.
For stoichiometry reasons the formation of bridging water should be promoted by preadsorbed
hydrogen: The formation of one water molecule from Obr requires two H atoms. Since HCl provides
only one H atom per molecule, two HCl molecules are needed for the formation of one water molecule
resulting in two Clot atoms, from which only one Clot can be transferred into a bridging position when
Obr is reduced to water. The other Clot atom is left on the 1f-cus Ru site as a spectator and can not
substitute a bridging oxygen atom and therefore blocking the 1f-cus Ru sites. If the surface is
preexposed to H2 at 300 K, bridging hydroxyl groups (ObrH) are formed.16 In this way the deficiency of
hydrogen on the surface is overcome and a subsequent exposure of HCl is expected to lead to a balanced
5
and more efficient chlorination of the bridging oxygen atoms, as summarized by the following reaction
equation:
ObrH + HClgas → H2Ogas + Clbr.
3.2. High resolution core level spectroscopy (HRCLS) experiments
In order to study the atomic details of the chlorination of the RuO2(110) surface HRCLS experiments
were conducted. DFT calculated core level shifts were employed for the firm assignment of the spectral
features in both Cl 2p and O 1s HRCL spectra (see Table 1).
assignment
expt. binding
energies (eV)
expt. shift
(eV) calculated shift(eV) surface structure
Obulk 529.2 reference reference
Obr 528.4 –0.8 –0.87a (1x1) Obr
ObrH 530.4 1.2 1.46a (1x2) ObrH + Obr
ObrH, hydrogen bound 529.8 0.6 0.72a (1x2) Oot-H + ObrH
(1x1)-O, chemisorbed 529.8 0.6 0.5a Ru(0001)-(1x1)-O
OotH2 531.9 2.7 2.96a (1x2) 2Obr + Oot + OotH2
ObrH2 n/a n/a 4.80a (1x1) ObrH2
ObrH2, hydrogen bound n/a n/a 4.06 (2x2) 3Obr + 1Clot + ObrH2
Clbr 197.8/199.4 reference reference (1x1) Clbr
Clbr neighboring Clot 197.6/199.2 –0.2 –0.2 (2x2) 4Clbr + 1Clot
Clot 196.9/198.5 –0.9 –1.46 (2x2) 4Clbr + 1Clot
HClot n/a n/a 1.7 (1x2) 2Clbr + 1ClotH
Table 1: Experimentally observed core level energies of O 1s and Cl 2p and their shifts in comparison with DFT-calculated shifts. Except for Ru(0001)-(1x1)-O, all other spectral features are from species on RuO2(110). For Cl 2p, the binding energies of both spin-orbit doublets are given. aData taken from Knapp et al.16 and from Over et al.17
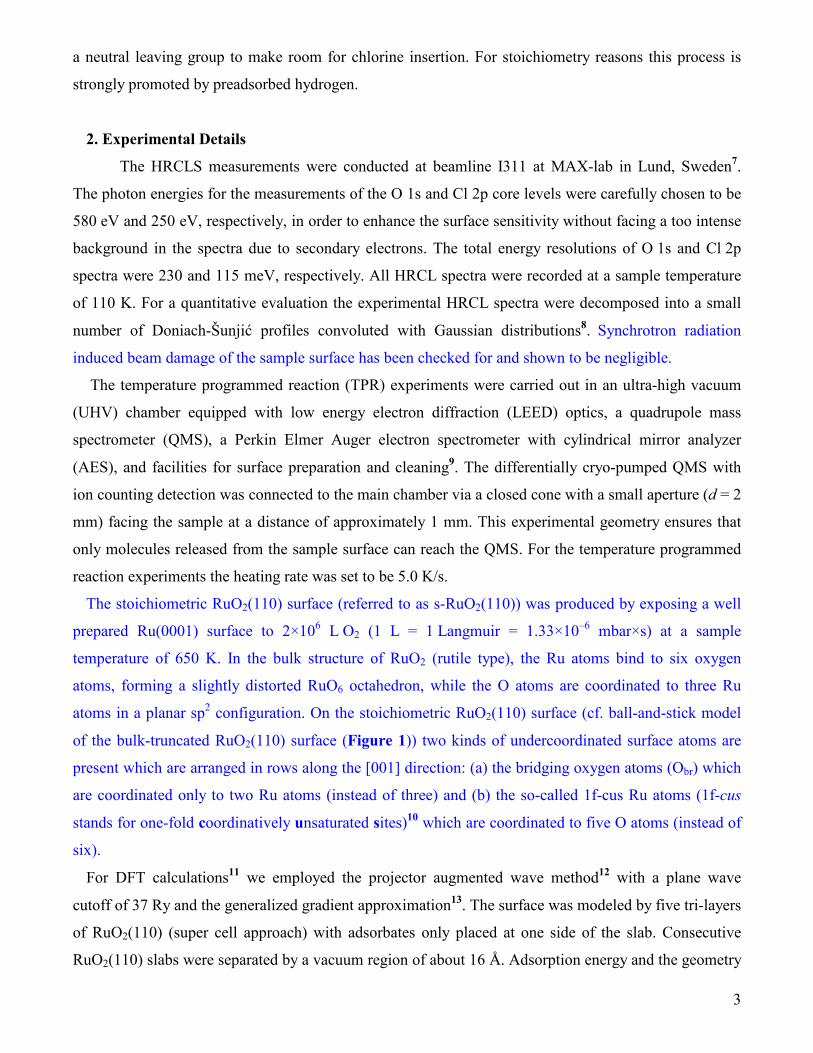
We begin the discussion of the HRCL spectra with the specific chlorination of a hydrogen pre-
exposed RuO2(110) surface. An exposure of 15 L H2 to the stoichiometric RuO2(110) surface at room
temperature leads to the selective formation of bridging hydroxyl (ObrH) groups16 as can be inferred
from the O 1s emission at 530.4 eV (cf. Figure 2). The Obr component is still clearly visible, indicating
an incomplete capping of Obr sites by hydrogen. No water related signal at around 532 eV is detected.
6
Figure 2: Cl 2p and O 1s HRCL spectra of hydrogen pretreated RuO2(110) exposed to 5 L HCl at 300 K followed by a stepwise annealing to specific temperatures as indicated. The observed doublets in the Cl 2p spectra, separated by 1.60 eV, are due to spin-orbit splitting. The uppermost curves show HRCL spectra of the maximum chlorinated RuO2(110) after a further H2 treatment (10 L H2 at 300 K) followed by annealing in p(HCl) = 5 ×10⁻⁸ mbar to 700 K.
Subsequently, 5 L of HCl have been dosed at T = 300 K followed by a stepwise temperature protocol:
flash to 420 K, flash to 520 K, and a 15 min annealing at 520 K. After each annealing step the surface
was characterized by the Cl 2p and O 1s core level shift spectra compiled in Figure 2. In the following,
these spectra are discussed for each step separately:
a) HCl exposure at 300 K: A broad O 1s signal appears in the water region at 532.5 eV
(FWHM = full width at half maximum = 1.38 eV). In comparison with adsorbed on top water on
s-RuO2(110)16 this water feature is shifted by +0.6 eV to higher binding energy presumably due
to weakened hydrogen bonding to the ObrH groups. On the basis of our DFT calculations (cf.
Table 1) the signal at 532.5 eV (shift 2.8 eV) can not be assigned to bridging water since the
calculated core level shift for ObrH2 is larger than 4.0 eV, a shift which has not been observed in
the experimental O 1s spectrum. On top water was presumably introduced via HCl as an
unavoidable contaminant due to exchange reactions with the chamber wall18. The Cl 2p
spectrum reveals a broad emission at 197.5/199.1 eV (cf. Figure 2) which is ascribed to a
hydrogen-bonded Cl species adsorbed on 1f-cus site (Clot). This observation indicates that HCl
preferentially adsorbs dissociatively adjacent to Obr groups. Spin-orbit splitting causes the
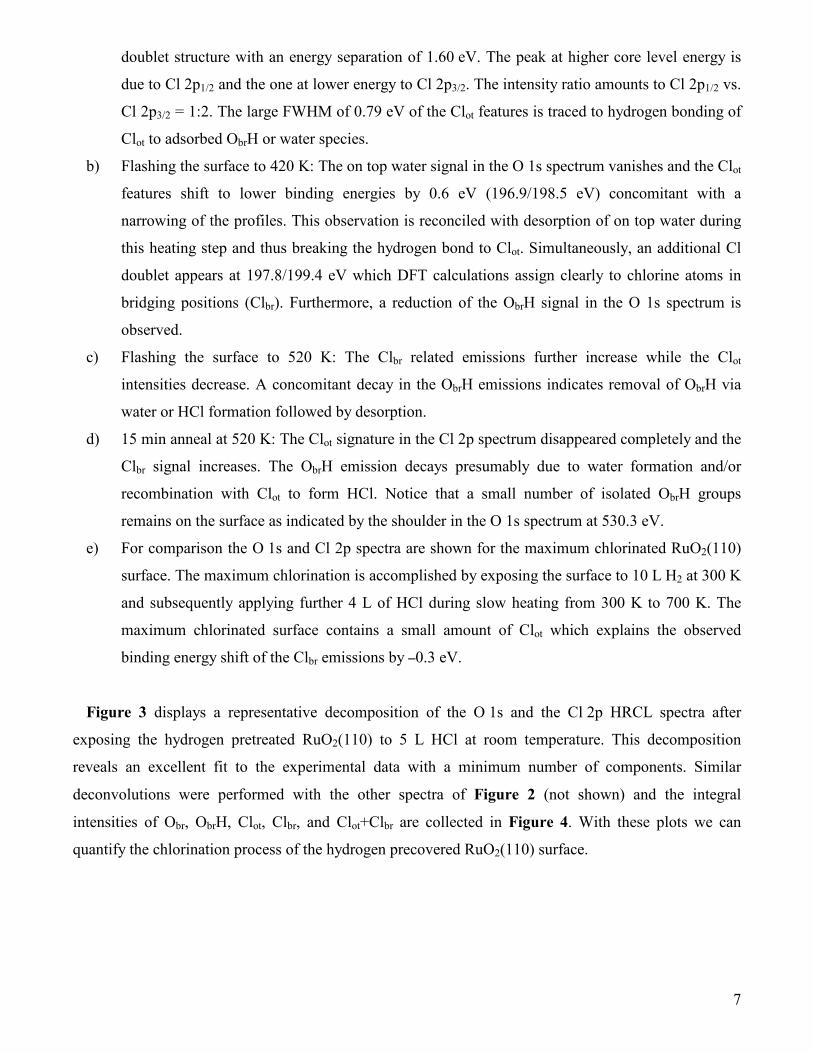
7
doublet structure with an energy separation of 1.60 eV. The peak at higher core level energy is
due to Cl 2p1/2 and the one at lower energy to Cl 2p3/2. The intensity ratio amounts to Cl 2p1/2 vs.
Cl 2p3/2 = 1:2. The large FWHM of 0.79 eV of the Clot features is traced to hydrogen bonding of
Clot to adsorbed ObrH or water species.
b) Flashing the surface to 420 K: The on top water signal in the O 1s spectrum vanishes and the Clot
features shift to lower binding energies by 0.6 eV (196.9/198.5 eV) concomitant with a
narrowing of the profiles. This observation is reconciled with desorption of on top water during
this heating step and thus breaking the hydrogen bond to Clot. Simultaneously, an additional Cl
doublet appears at 197.8/199.4 eV which DFT calculations assign clearly to chlorine atoms in
bridging positions (Clbr). Furthermore, a reduction of the ObrH signal in the O 1s spectrum is
observed.
c) Flashing the surface to 520 K: The Clbr related emissions further increase while the Clot
intensities decrease. A concomitant decay in the ObrH emissions indicates removal of ObrH via
water or HCl formation followed by desorption.
d) 15 min anneal at 520 K: The Clot signature in the Cl 2p spectrum disappeared completely and the
Clbr signal increases. The ObrH emission decays presumably due to water formation and/or
recombination with Clot to form HCl. Notice that a small number of isolated ObrH groups
remains on the surface as indicated by the shoulder in the O 1s spectrum at 530.3 eV.
e) For comparison the O 1s and Cl 2p spectra are shown for the maximum chlorinated RuO2(110)
surface. The maximum chlorination is accomplished by exposing the surface to 10 L H2 at 300 K
and subsequently applying further 4 L of HCl during slow heating from 300 K to 700 K. The
maximum chlorinated surface contains a small amount of Clot which explains the observed
binding energy shift of the Clbr emissions by –0.3 eV.
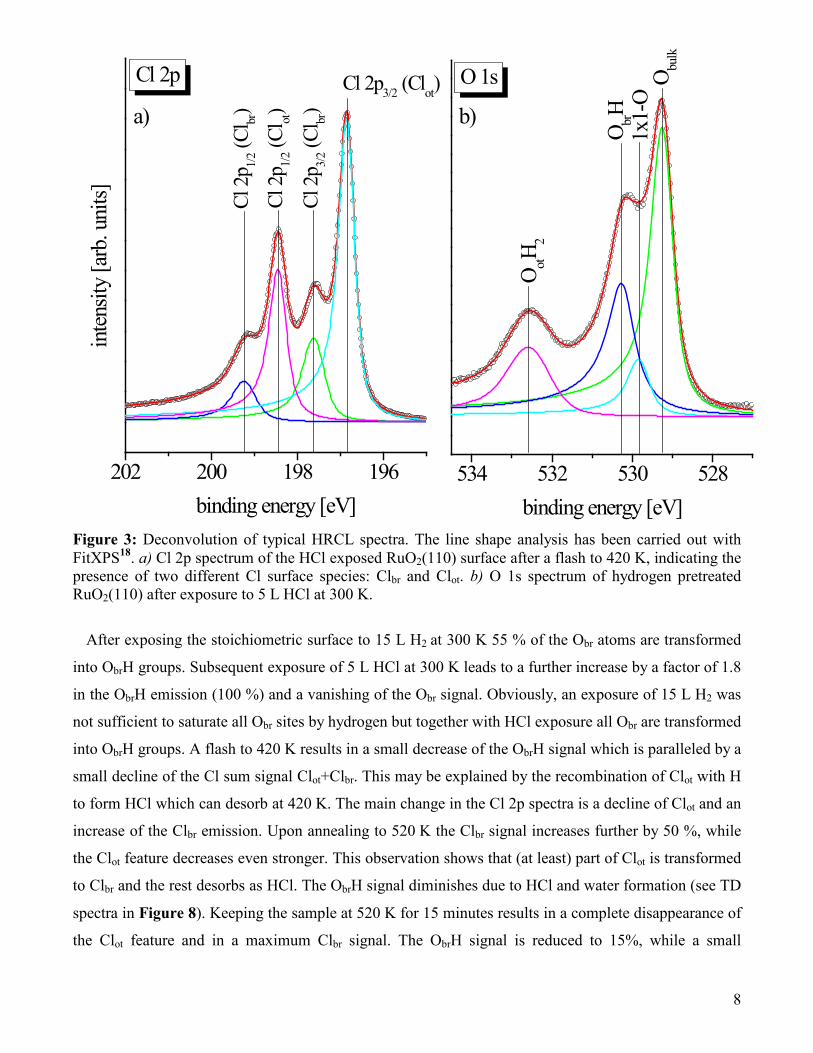
Figure 3 displays a representative decomposition of the O 1s and the Cl 2p HRCL spectra after
exposing the hydrogen pretreated RuO2(110) to 5 L HCl at room temperature. This decomposition
reveals an excellent fit to the experimental data with a minimum number of components. Similar
deconvolutions were performed with the other spectra of Figure 2 (not shown) and the integral
intensities of Obr, ObrH, Clot, Clbr, and Clot+Clbr are collected in Figure 4. With these plots we can
quantify the chlorination process of the hydrogen precovered RuO2(110) surface.
8
202 200 198 196 534 532 530 528
inten
sity
[arb
. uni
ts]Cl 2p3/2 (Clot)
Cl 2
p 1/2 (
Clot)
Cl 2
p 1/2 (
Clbr)
Cl 2
p 3/2 (
Clbr)
binding energy [eV]
Cl 2p
a) b)
O 1s O bulk
1x1-
OO br
H
O otH 2
binding energy [eV] Figure 3: Deconvolution of typical HRCL spectra. The line shape analysis has been carried out with FitXPS18. a) Cl 2p spectrum of the HCl exposed RuO2(110) surface after a flash to 420 K, indicating the presence of two different Cl surface species: Clbr and Clot. b) O 1s spectrum of hydrogen pretreated RuO2(110) after exposure to 5 L HCl at 300 K.
After exposing the stoichiometric surface to 15 L H2 at 300 K 55 % of the Obr atoms are transformed
into ObrH groups. Subsequent exposure of 5 L HCl at 300 K leads to a further increase by a factor of 1.8
in the ObrH emission (100 %) and a vanishing of the Obr signal. Obviously, an exposure of 15 L H2 was
not sufficient to saturate all Obr sites by hydrogen but together with HCl exposure all Obr are transformed
into ObrH groups. A flash to 420 K results in a small decrease of the ObrH signal which is paralleled by a
small decline of the Cl sum signal Clot+Clbr. This may be explained by the recombination of Clot with H
to form HCl which can desorb at 420 K. The main change in the Cl 2p spectra is a decline of Clot and an
increase of the Clbr emission. Upon annealing to 520 K the Clbr signal increases further by 50 %, while
the Clot feature decreases even stronger. This observation shows that (at least) part of Clot is transformed
to Clbr and the rest desorbs as HCl. The ObrH signal diminishes due to HCl and water formation (see TD
spectra in Figure 8). Keeping the sample at 520 K for 15 minutes results in a complete disappearance of
the Clot feature and in a maximum Clbr signal. The ObrH signal is reduced to 15%, while a small
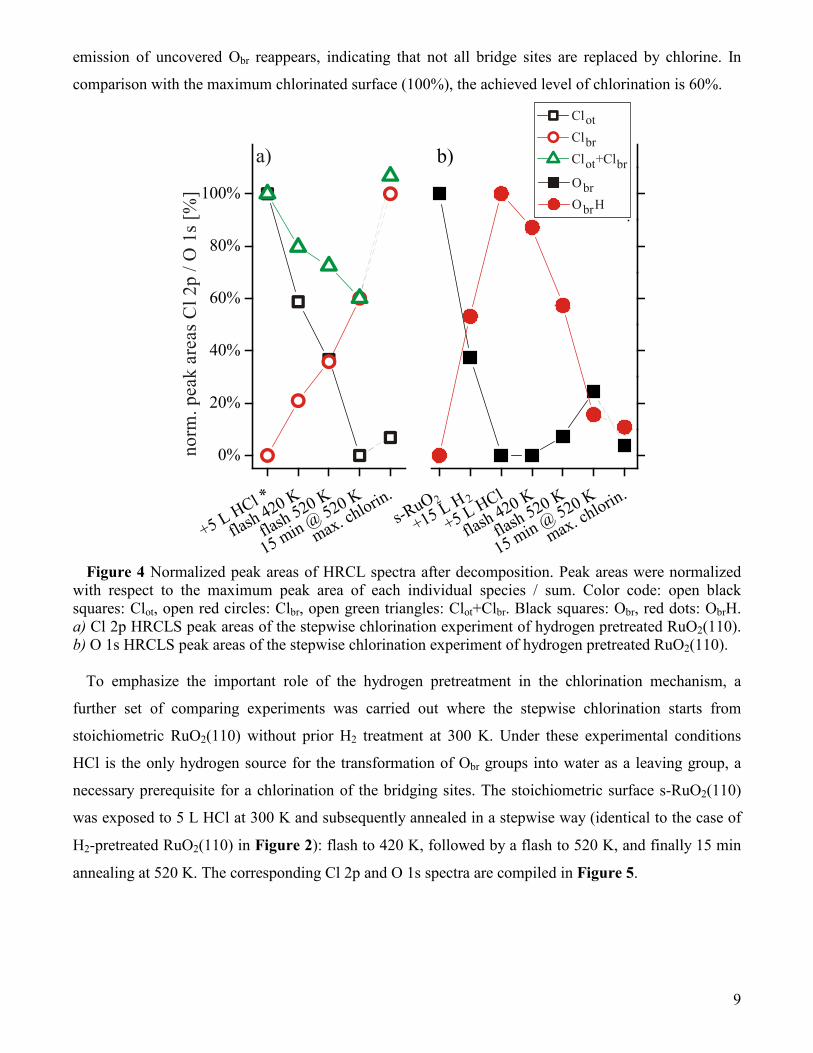
9
emission of uncovered Obr reappears, indicating that not all bridge sites are replaced by chlorine. In
comparison with the maximum chlorinated surface (100%), the achieved level of chlorination is 60%.
Figure 4 Normalized peak areas of HRCL spectra after decomposition. Peak areas were normalized
with respect to the maximum peak area of each individual species / sum. Color code: open black squares: Clot, open red circles: Clbr, open green triangles: Clot+Clbr. Black squares: Obr, red dots: ObrH. a) Cl 2p HRCLS peak areas of the stepwise chlorination experiment of hydrogen pretreated RuO2(110). b) O 1s HRCLS peak areas of the stepwise chlorination experiment of hydrogen pretreated RuO2(110).
To emphasize the important role of the hydrogen pretreatment in the chlorination mechanism, a
further set of comparing experiments was carried out where the stepwise chlorination starts from
stoichiometric RuO2(110) without prior H2 treatment at 300 K. Under these experimental conditions
HCl is the only hydrogen source for the transformation of Obr groups into water as a leaving group, a
necessary prerequisite for a chlorination of the bridging sites. The stoichiometric surface s-RuO2(110)
was exposed to 5 L HCl at 300 K and subsequently annealed in a stepwise way (identical to the case of
H2-pretreated RuO2(110) in Figure 2): flash to 420 K, followed by a flash to 520 K, and finally 15 min
annealing at 520 K. The corresponding Cl 2p and O 1s spectra are compiled in Figure 5.
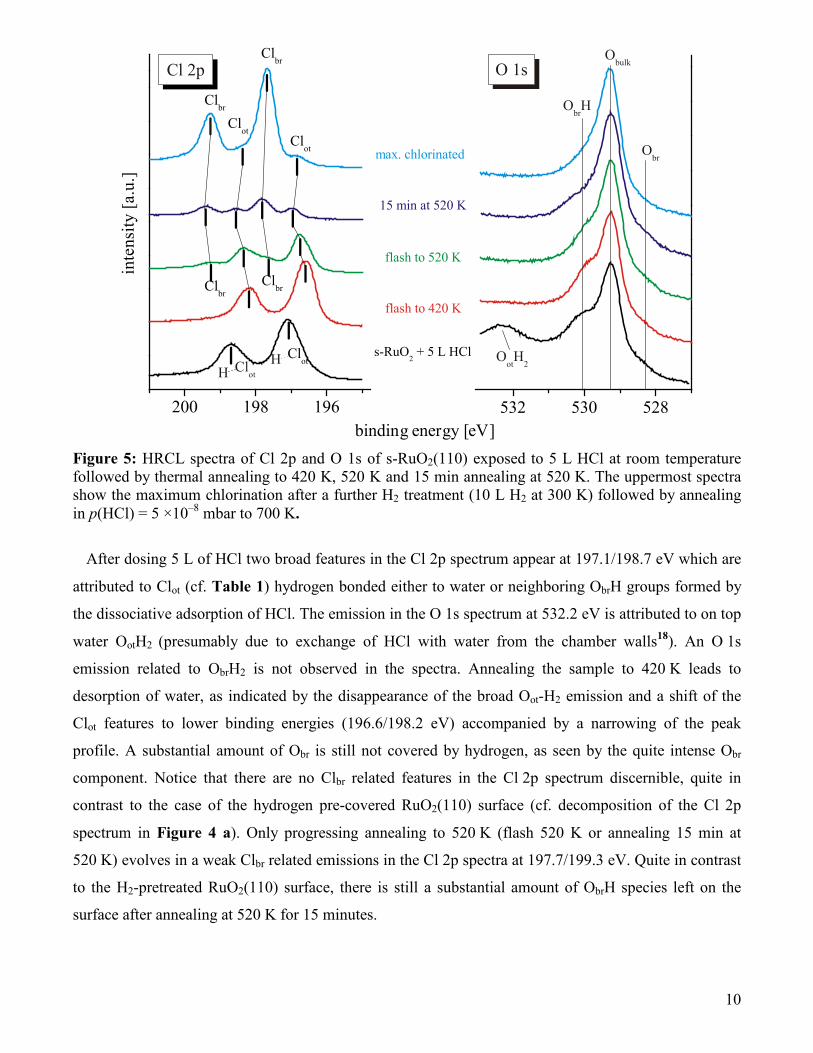
10
Figure 5: HRCL spectra of Cl 2p and O 1s of s-RuO2(110) exposed to 5 L HCl at room temperature followed by thermal annealing to 420 K, 520 K and 15 min annealing at 520 K. The uppermost spectra show the maximum chlorination after a further H2 treatment (10 L H2 at 300 K) followed by annealing in p(HCl) = 5 ×10⁻⁸ mbar to 700 K.
After dosing 5 L of HCl two broad features in the Cl 2p spectrum appear at 197.1/198.7 eV which are
attributed to Clot (cf. Table 1) hydrogen bonded either to water or neighboring ObrH groups formed by
the dissociative adsorption of HCl. The emission in the O 1s spectrum at 532.2 eV is attributed to on top
water OotH2 (presumably due to exchange of HCl with water from the chamber walls18). An O 1s
emission related to ObrH2 is not observed in the spectra. Annealing the sample to 420 K leads to
desorption of water, as indicated by the disappearance of the broad Oot-H2 emission and a shift of the
Clot features to lower binding energies (196.6/198.2 eV) accompanied by a narrowing of the peak
profile. A substantial amount of Obr is still not covered by hydrogen, as seen by the quite intense Obr
component. Notice that there are no Clbr related features in the Cl 2p spectrum discernible, quite in
contrast to the case of the hydrogen pre-covered RuO2(110) surface (cf. decomposition of the Cl 2p
spectrum in Figure 4 a). Only progressing annealing to 520 K (flash 520 K or annealing 15 min at
520 K) evolves in a weak Clbr related emissions in the Cl 2p spectra at 197.7/199.3 eV. Quite in contrast
to the H2-pretreated RuO2(110) surface, there is still a substantial amount of ObrH species left on the
surface after annealing at 520 K for 15 minutes.
11
534 532 530 528200 198 196
O br
binding energy [eV]
O brH
1x1-
OO bu
lk
O otH 2
b)
O 1sin
tensit
y [a
rb. u
nits] Cl
2p 1/
2 (Cl ot
)
Cl 2p3/2 (Clot)
binding energy [eV]
Cl 2p
a)
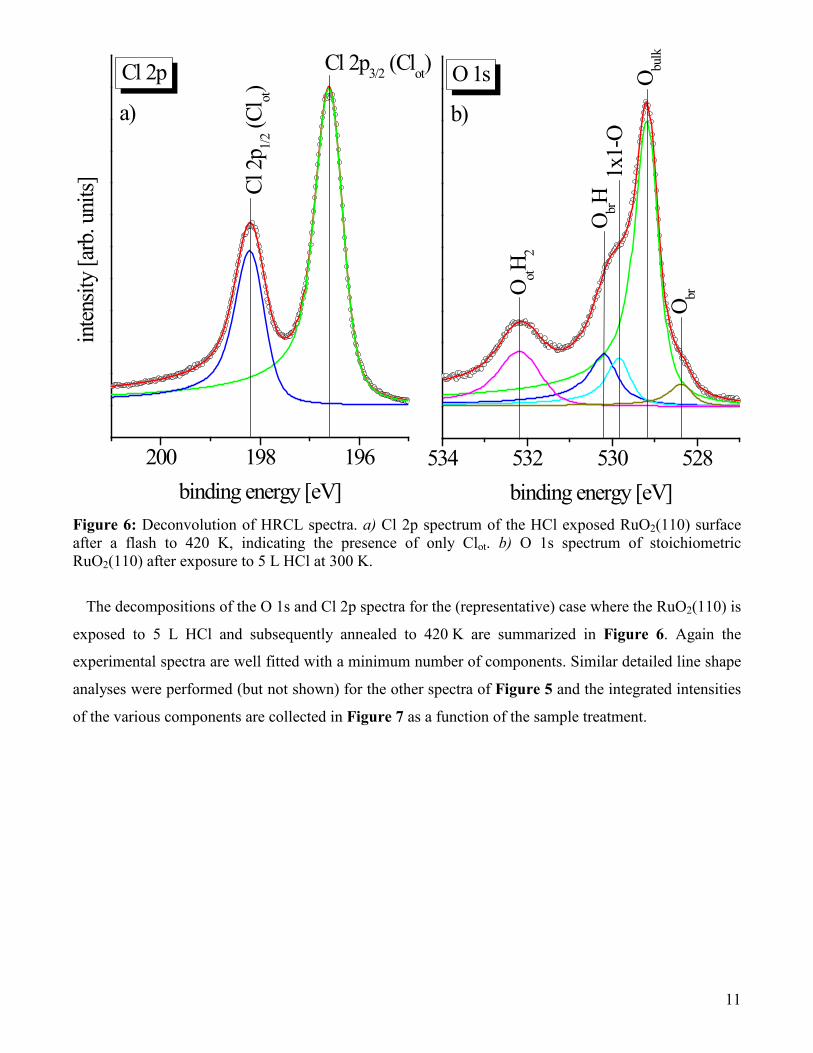
Figure 6: Deconvolution of HRCL spectra. a) Cl 2p spectrum of the HCl exposed RuO2(110) surface after a flash to 420 K, indicating the presence of only Clot. b) O 1s spectrum of stoichiometric RuO2(110) after exposure to 5 L HCl at 300 K.
The decompositions of the O 1s and Cl 2p spectra for the (representative) case where the RuO2(110) is
exposed to 5 L HCl and subsequently annealed to 420 K are summarized in Figure 6. Again the
experimental spectra are well fitted with a minimum number of components. Similar detailed line shape
analyses were performed (but not shown) for the other spectra of Figure 5 and the integrated intensities
of the various components are collected in Figure 7 as a function of the sample treatment.
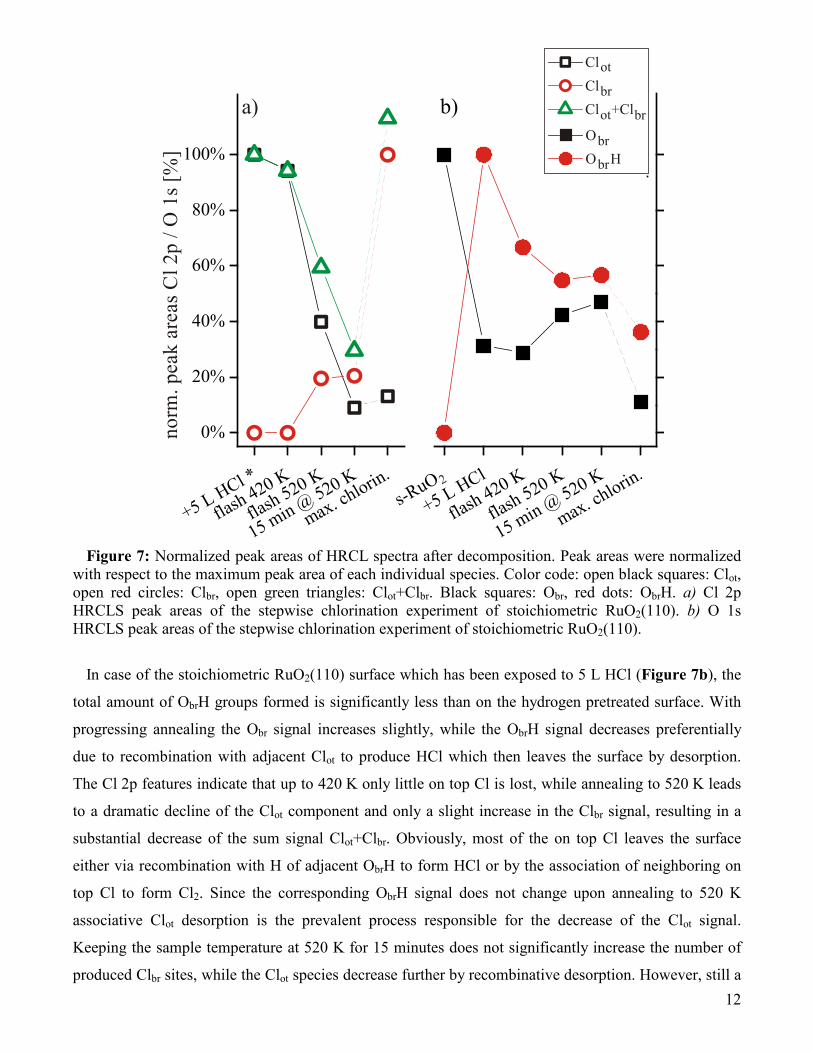
12
Figure 7: Normalized peak areas of HRCL spectra after decomposition. Peak areas were normalized
with respect to the maximum peak area of each individual species. Color code: open black squares: Clot, open red circles: Clbr, open green triangles: Clot+Clbr. Black squares: Obr, red dots: ObrH. a) Cl 2p HRCLS peak areas of the stepwise chlorination experiment of stoichiometric RuO2(110). b) O 1s HRCLS peak areas of the stepwise chlorination experiment of stoichiometric RuO2(110).
In case of the stoichiometric RuO2(110) surface which has been exposed to 5 L HCl (Figure 7b), the
total amount of ObrH groups formed is significantly less than on the hydrogen pretreated surface. With
progressing annealing the Obr signal increases slightly, while the ObrH signal decreases preferentially
due to recombination with adjacent Clot to produce HCl which then leaves the surface by desorption.
The Cl 2p features indicate that up to 420 K only little on top Cl is lost, while annealing to 520 K leads
to a dramatic decline of the Clot component and only a slight increase in the Clbr signal, resulting in a
substantial decrease of the sum signal Clot+Clbr. Obviously, most of the on top Cl leaves the surface
either via recombination with H of adjacent ObrH to form HCl or by the association of neighboring on
top Cl to form Cl2. Since the corresponding ObrH signal does not change upon annealing to 520 K
associative Clot desorption is the prevalent process responsible for the decrease of the Clot signal.
Keeping the sample temperature at 520 K for 15 minutes does not significantly increase the number of
produced Clbr sites, while the Clot species decrease further by recombinative desorption. However, still a
13
significant amount of Clot stays on the surface, quite in contrast to the case of the H2-pretreated
RuO2(110) surface.
The total amount of Clbr produced on the non-H2-pretreated RuO2(110) surface is significantly lower
than on the H2-pretreated RuO2(110) surface (cf. Figure 3), i.e. the chlorination efficiency is
substantially improved by the hydrogen pretreatment of the RuO2(110) surface.
The chlorination of the stoichiometric (H2 untreated) RuO2(110) faces two problems when dosing
only HCl: First, a deficiency of hydrogen on the surface and second, a self-poisoning of the surface by
excess Clot according to the following reaction:
2 Obr + 2 HClgas → Obr + H2Ogas + Clbr + Clot.
Both effects have been identified with HRCLS. The level of chlorination achieved after 15 min of
annealing at 520 K was therefore only 23 % of the maximum achievable chlorination.
Preceding hydrogenation of s-RuO2(110) results in a much higher chlorination yield for simple
stoichiometry reasons:
2 ObrH + 2 HClgas → 2 H2Ogas + 2 Clbr.
Most of the Obr atoms are removed from the surface via water formation and the resulting vacancies
are filled in by chlorine. Even after a flash to only 420 K part of the Clot atoms have moved to bridging
positions (Clbr) on the H2-pretreated RuO2(110) surface. Upon further heating to 520 K, more and more
Clbr atoms are produced. Most of Clot atoms are shifted to bridging sites during the 15 min annealing
step at 520 K, while without H2-pretreatment most of the Clot desorbs associatively. The high degree of
chlorination in the case of the hydrogenated RuO2(110) surface after 15 min annealing at 520 K is
manifested by the complete disappearance of the Clot signal in Cl 2p HRCL spectra and a level of
chlorination which reaches 60 % of the maximum achievable chlorination, i.e. about three times higher
than without H2-pretreatment.
3.3. Temperature programmed reaction (TPR) experiments
The transformation of Obr into good leaving groups such as water has shown to be a necessary
prerequisite for the substitution of Obr by Cl atoms. Knapp et al. have reported that water formation via
recombination of ObrH groups takes place only at temperatures above 650 K16. However, in the presence
of chlorine atoms on the surface the recombination of neighboring ObrH groups to form water proceeds
at temperatures as low as 520 K as indicated by the HRCL experiments of chapter 3.2 and corroborated
by temperature programmed reaction experiments in Figure 8.
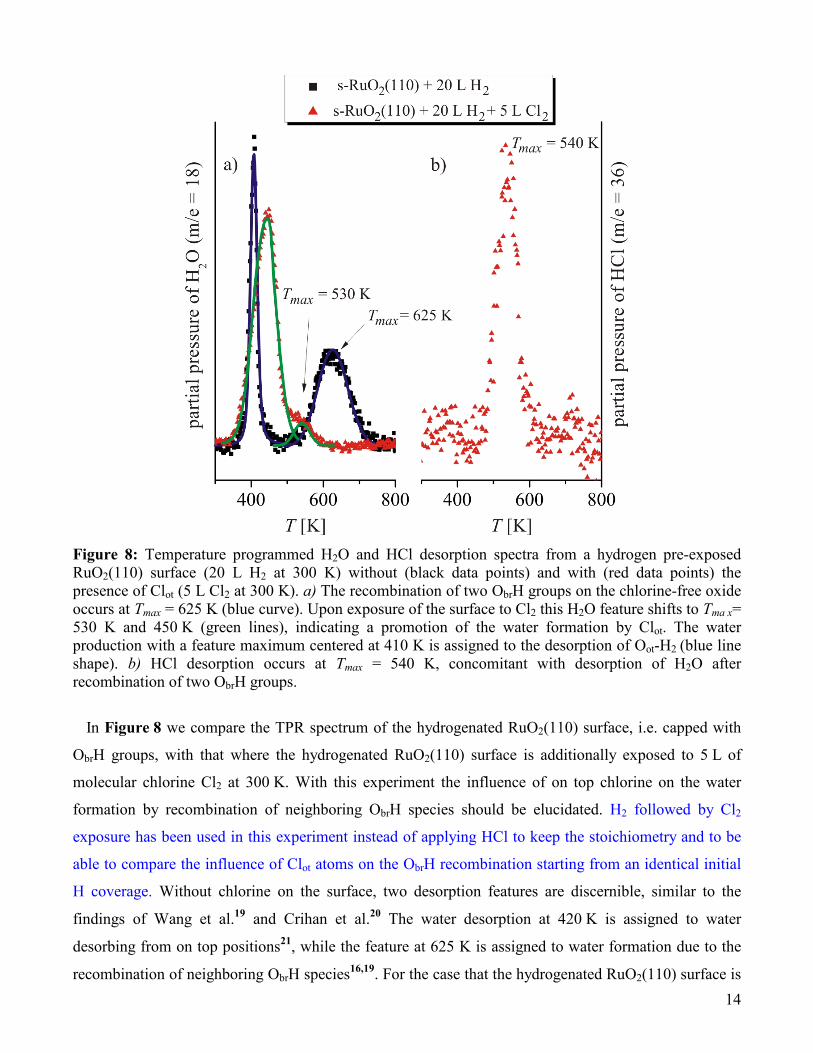
14
Figure 8: Temperature programmed H2O and HCl desorption spectra from a hydrogen pre-exposed RuO2(110) surface (20 L H2 at 300 K) without (black data points) and with (red data points) the presence of Clot (5 L Cl2 at 300 K). a) The recombination of two ObrH groups on the chlorine-free oxide occurs at Tmax = 625 K (blue curve). Upon exposure of the surface to Cl2 this H2O feature shifts to Tma x= 530 K and 450 K (green lines), indicating a promotion of the water formation by Clot. The water production with a feature maximum centered at 410 K is assigned to the desorption of Oot-H2
(blue line shape). b) HCl desorption occurs at Tmax = 540 K, concomitant with desorption of H2O after recombination of two ObrH groups.
In Figure 8 we compare the TPR spectrum of the hydrogenated RuO2(110) surface, i.e. capped with
ObrH groups, with that where the hydrogenated RuO2(110) surface is additionally exposed to 5 L of
molecular chlorine Cl2 at 300 K. With this experiment the influence of on top chlorine on the water
formation by recombination of neighboring ObrH species should be elucidated. H2 followed by Cl2
exposure has been used in this experiment instead of applying HCl to keep the stoichiometry and to be
able to compare the influence of Clot atoms on the ObrH recombination starting from an identical initial
H coverage. Without chlorine on the surface, two desorption features are discernible, similar to the
findings of Wang et al.19 and Crihan et al.20 The water desorption at 420 K is assigned to water
desorbing from on top positions21, while the feature at 625 K is assigned to water formation due to the
recombination of neighboring ObrH species16,19. For the case that the hydrogenated RuO2(110) surface is
15
additionally exposed to 5 L of Cl2, the high temperature water peak disappears and instead a broader
feature around 440 K and a shoulder at 530 K appear. This change in the H2O TPR spectrum provides
strong evidence that water formation via recombination of two neighboring ObrH groups is facilitated by
the presence of Clot and hence plays a pivotal role in the chlorination process.
In addition, the HCl desorption spectrum (Figure 8b) indicates that Clot, which is formed by
dissociative adsorption of Cl2 on the H2-pretreated surface, partly leaves the surface via HCl formation
and subsequent desorption. Desorption of HCl begins at T = 500 K and reaches a maximum at
Tmax = 540 K. Thus a noticeable amount of HCl is able to leave the surface at the chlorination
temperature of T = 520 K applied in the HRCLS experiments, thereby accounting for the observed
decrease in the total amount of surface chlorine.
3.4 Determination of the absolute coverage of bridging chlorine
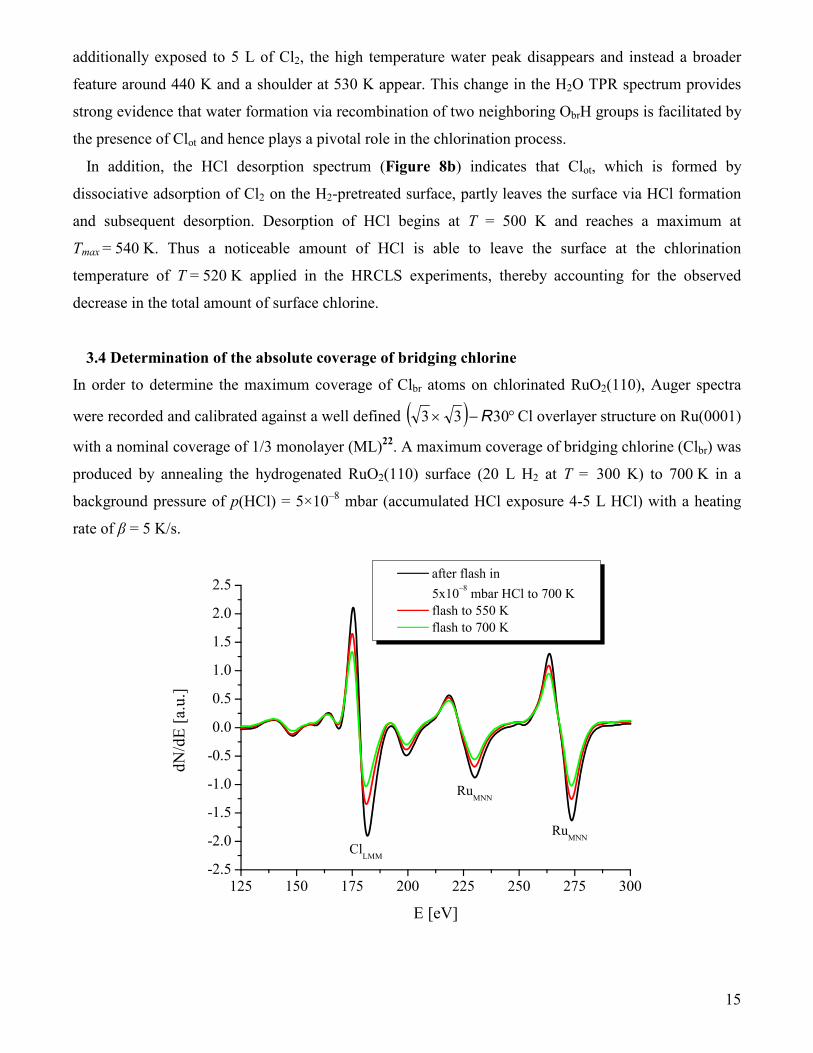
In order to determine the maximum coverage of Clbr atoms on chlorinated RuO2(110), Auger spectra
were recorded and calibrated against a well defined ( ) °−× 3033 R Cl overlayer structure on Ru(0001)
with a nominal coverage of 1/3 monolayer (ML)22. A maximum coverage of bridging chlorine (Clbr) was
produced by annealing the hydrogenated RuO2(110) surface (20 L H2 at T = 300 K) to 700 K in a
background pressure of p(HCl) = 5×10⁻⁸ mbar (accumulated HCl exposure 4-5 L HCl) with a heating
rate of β = 5 K/s.
16
Figure 9: Auger electron spectra (E = 3 keV) of maximally chlorinated RuO2(110) directly after a flash to 700 K in p(HCl) = 5×10⁻⁸ mbar followed by cooling to room temperature (black) and flashing in vacuum to T = 550 K (red) and T = 700 K (green).
Subsequently, Auger spectra were taken at room temperature a) directly after chlorination (flash to T =
700 K in p(HCl) = 5×10⁻⁸ mbar), b) after an additional flash to T = 550 K in vacuum, and c) after a
further flash to T = 700 K (Figure 9) in vacuum with the aim to determine the respective coverages of
Clot and Clbr atoms on the RuO2(110) surface. The ClLMM Auger signal measured directly after the
chlorination step consists of contributions of both on top Clot and bridge bonded Clbr species. According
to the TPR experiment in Figure 8b, hydrogen bonded Clot (referred to as H…Clot) desorbs (partly) in
the form of HCl during an anneal of the sample to T = 550 K through recombination of Clot with ObrH.
Flashing the sample to T = 700 K results in the recombinative desorption of Clot species5 so that finally
most of the 1f-cus Ru sites are unoccupied. The remaining Cl seen in the AES spectrum is ascribed to
chlorine in bridging positions. The amount of Clot atoms on the surface (either in the form of on top
H…Clot and on top Clot) is determined by the difference of the ClLMM intensities in the Auger spectrum
taken directly after the chlorination and the spectrum after flashing the sample to T = 550 K and
T = 700 K, respectively. Table 2 summarizes the evaluated surface coverages Θ in monolayers (ML) of
Cl, H…Clot, Clot, and Clbr on RuO2(110) after maximum chlorination of the stoichiometric RuO2(110)
surface and annealing the surface to 550 K and 700 K. Absolute chlorine surface coverages Θ are
available since the observed AES line intensities (ICl(300 K), ICl(550 K), ICl(700 K)) are calibrated
against the ClLMM Auger signal intensities of a well defined ( ) °−× 3033 R Cl adsorbate (ΘCl = 1/3
ML) on Ru(0001).
ICl (300 K), ΘCl ICl (550 K), ΘCl ICl (700 K), ΘCl ΘH…Cl ΘClot
3.62, 1.26 ML 3.41, 1.19 ML 2.23, 0.76 ML 0.07 ML 0.43 ML
Table 2: Chlorine coverages on RuO2(110) after chlorination (20 L H2 at T = 300 K followed by an annealing step to T = 700 K in p(HCl) = 5×10⁻⁸ mbar and cooling to 300 K). ICl in arbitrary units corresponds to the peak to peak intensity of the ClLMM line in the Auger spectra at E = 181 eV which is uniquely related to a surface chlorine coverage ΘCl employing the calibration against the well-defined ( ) °−× 3033 R Cl adsorbate (ΘCl=1/3 ML) on Ru(0001). The coverages ΘCl are given in monolayers (ML) with 1 ML of Cl being 1 Cl atom per (1x1) surface unit cell of RuO2(110). The coverage of H…Cl (ΘH…Cl) is obtained as the difference in ΘCl of the as-chlorinated surface taken at T = 300 K and that after a flash to T = 550 K in vacuum. The surface concentration of Clot atoms ΘClot is given by the difference of ΘCl(550 K) and ΘCl(700 K). The relative error of the determination of the Cl surface concentrations ΘCl is estimated to be ±10 %.
17
The highest level of bridge site chlorination of RuO2(110) is quantified by 0.76 ML of Cl atoms as
inferred from ΘCl after flashing the as-chlorinated surface to T = 700 K (cf. Table 2). However, a small
amount of Cl atoms may still reside on 1f-cus Ru sites as indicated by the Cl 2p HRCLS spectra of the
maximally chlorinated surface in Figures 2 and 4. The remaining bridge positions (0.24 ML) are
occupied by ObrH and Obr species (cf. Figure 4b). An observed maximum Clbr coverage of less than
1 ML is also consistent with DFT calculations which indicate that a 100 % bridge chlorination is by
0.37 eV energetically less favorable than a 50 % bridge chlorination.
3.5 CO promoted chlorination of the RuO2(110) surface
202 200 198 196 194
Clbr
flash (T = 700 K)10 L CO followed by10 L Cl2 (T = 420 K)
10 L Cl2 (T = 500 K)
flash (T = 700 K)
flash (T = 600 K)
s-RuO2(110)
Clot
inten
sity
[a.u
.]
binding energy [eV]
Clbr/ClotCl 2p
Figure 10 Comparison of Cl 2p HRCLS spectra of RuO2(110) taken after exposure to 10 L Cl2 at 500 K (black spectra) and annealing to the indicated temperatures with spectra taken after subsequent exposure to 10 L CO followed by 10 L Cl2 (red spectra).
So far we have seen that the formation of intermediate bridging water as a “good” leaving group for
the bridging O atom is crucial for the actual chlorination process. When bridging water has left the
surface, chlorine from an adjacent on top position may shift into the resulting vacancy, forming bridging
Clbr. To demonstrate the generality of this concept of transforming Obr into a stable leaving group
allowing its facile substitution by Cl atoms, we studied the CO promoted chlorination of RuO2(110) by
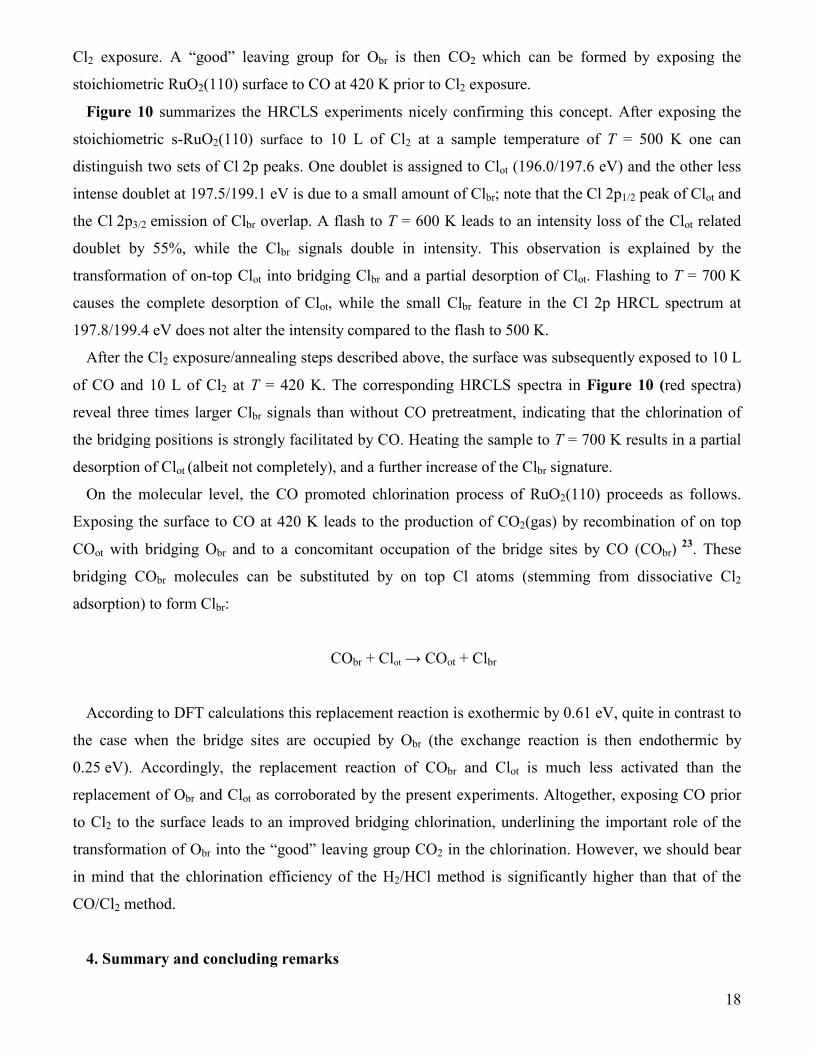
18
Cl2 exposure. A “good” leaving group for Obr is then CO2 which can be formed by exposing the
stoichiometric RuO2(110) surface to CO at 420 K prior to Cl2 exposure.
Figure 10 summarizes the HRCLS experiments nicely confirming this concept. After exposing the
stoichiometric s-RuO2(110) surface to 10 L of Cl2 at a sample temperature of T = 500 K one can
distinguish two sets of Cl 2p peaks. One doublet is assigned to Clot (196.0/197.6 eV) and the other less
intense doublet at 197.5/199.1 eV is due to a small amount of Clbr; note that the Cl 2p1/2 peak of Clot and
the Cl 2p3/2 emission of Clbr overlap. A flash to T = 600 K leads to an intensity loss of the Clot related
doublet by 55%, while the Clbr signals double in intensity. This observation is explained by the
transformation of on-top Clot into bridging Clbr and a partial desorption of Clot. Flashing to T = 700 K
causes the complete desorption of Clot, while the small Clbr feature in the Cl 2p HRCL spectrum at
197.8/199.4 eV does not alter the intensity compared to the flash to 500 K.
After the Cl2 exposure/annealing steps described above, the surface was subsequently exposed to 10 L
of CO and 10 L of Cl2 at T = 420 K. The corresponding HRCLS spectra in Figure 10 (red spectra)
reveal three times larger Clbr signals than without CO pretreatment, indicating that the chlorination of
the bridging positions is strongly facilitated by CO. Heating the sample to T = 700 K results in a partial
desorption of Clot (albeit not completely), and a further increase of the Clbr signature.
On the molecular level, the CO promoted chlorination process of RuO2(110) proceeds as follows.
Exposing the surface to CO at 420 K leads to the production of CO2(gas) by recombination of on top
COot with bridging Obr and to a concomitant occupation of the bridge sites by CO (CObr) 23. These
bridging CObr molecules can be substituted by on top Cl atoms (stemming from dissociative Cl2
adsorption) to form Clbr:
CObr + Clot → COot + Clbr
According to DFT calculations this replacement reaction is exothermic by 0.61 eV, quite in contrast to
the case when the bridge sites are occupied by Obr (the exchange reaction is then endothermic by
0.25 eV). Accordingly, the replacement reaction of CObr and Clot is much less activated than the
replacement of Obr and Clot as corroborated by the present experiments. Altogether, exposing CO prior
to Cl2 to the surface leads to an improved bridging chlorination, underlining the important role of the
transformation of Obr into the “good” leaving group CO2 in the chlorination. However, we should bear
in mind that the chlorination efficiency of the H2/HCl method is significantly higher than that of the
CO/Cl2 method.
4. Summary and concluding remarks
19
The chlorination of RuO2(110) by the selective replacement of the bridging O atoms with chlorine
atoms relies critically on the formation of “good” leaving groups for the bridging O atoms. If hydrogen
is available on the surface the leaving group is water, while in the case of CO exposure the leaving
group consists of CO2. Facilitating the formation of such leaving groups substantially improves the
surface chlorination efficiency of RuO2(110).
In such cases where mere HCl exposure was used for the chlorination of the RuO2(110) surface the
formation of the leaving group water was seriously hampered by too less surface hydrogen and by
blocking of the 1f-cus sites by on top Cl. As shown in this paper a pretreatment of the RuO2(110)
surface by hydrogen exposure overcomes both problems for stoichiometrical reasons. If molecular
chlorine is used for the chlorination of the RuO2(110) surface, the only feasible leaving group for Obr
would be molecular oxygen, the formation of which is strongly activated24. However, pretreating the
sample with CO at 420 K results in the replacement of the bridging O atoms by CO mediated by the
formation and desorption of CO2. Finally, the bridging CObr molecules are replaced by on top Clot which
is supplied by dissociative Cl2 adsorption.
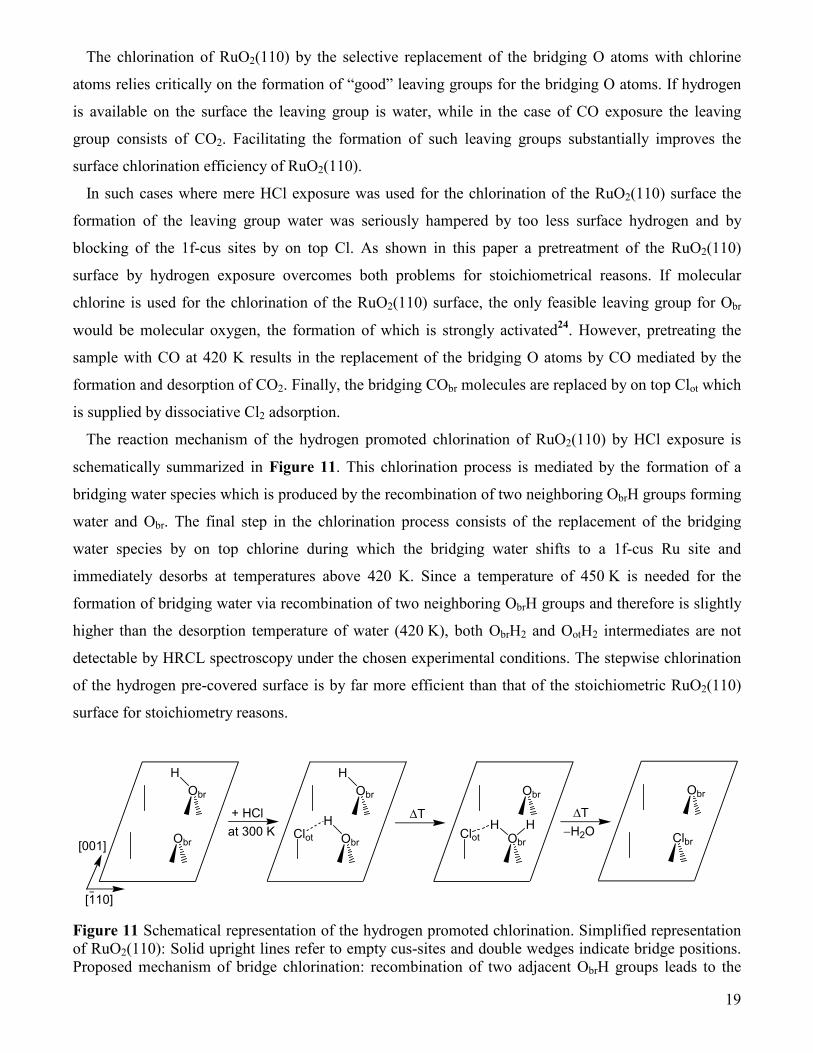
The reaction mechanism of the hydrogen promoted chlorination of RuO2(110) by HCl exposure is
schematically summarized in Figure 11. This chlorination process is mediated by the formation of a
bridging water species which is produced by the recombination of two neighboring ObrH groups forming
water and Obr. The final step in the chlorination process consists of the replacement of the bridging
water species by on top chlorine during which the bridging water shifts to a 1f-cus Ru site and
immediately desorbs at temperatures above 420 K. Since a temperature of 450 K is needed for the
formation of bridging water via recombination of two neighboring ObrH groups and therefore is slightly
higher than the desorption temperature of water (420 K), both ObrH2 and OotH2 intermediates are not
detectable by HRCL spectroscopy under the chosen experimental conditions. The stepwise chlorination
of the hydrogen pre-covered surface is by far more efficient than that of the stoichiometric RuO2(110)
surface for stoichiometry reasons.
Obr
H
Obr
Obr
H
ObrClot
H
Obr
ObrClot
H+ HCl
[001]
[110]
Obr
Clbr−H2Oat 300 K H
∆T ∆T
Figure 11 Schematical representation of the hydrogen promoted chlorination. Simplified representation of RuO2(110): Solid upright lines refer to empty cus-sites and double wedges indicate bridge positions. Proposed mechanism of bridge chlorination: recombination of two adjacent ObrH groups leads to the
20
formation of bridging water, assisted by Clot. As soon as bridging water is formed, it shifts to an on top site from which it desorbs. The created vacancies are immediately filled in by Clot.
The maximum bridging chlorination on RuO2(110) is quantified with ΘCl = (0.76 ± 0.08) ML as
determined by Auger electron spectroscopy and calibration against the well-defined ( ) °−× 3033 R -
Cl overlayer on Ru(0001) with a nominal coverage of 1/3 ML.
The results presented in this paper show on the molecular level also how HCl exposure of s-RuO2(110)
causes the selective replacement of Obr atoms by Cl, which in turn accounts for the reported stability of
the RuO2(110) surface in the Sumitomo process25.
Acknowledgement
We would like to thank the Deutsche Forschungsgemeinschaft, the Swedish Research Council for
financial support, the Leibniz-Rechenzentrum in Munich for providing us with massive parallel
supercomputing time, and the MAX-lab staff for technical support. JPH is grateful for the support by the
Fund of the German Chemical Industry (FCI) and the German National Academic Foundation.
References: 1 Iwanaga, K.; Seki, K.; Hibi, T.; Issoh, K.; Suzuta, T.; Nakada, M.; Mori, Y.; Abe, T.; Sumitomo
Kagaku 2004-I, 1. 2 Deacon, H.; U. S. Pat. 1875, 0165802. 3 López, N.; Gómez-Segura, J.; Marín, R. P.; Pérez-Ramírez, J.; J. Catal. 2008, 255, 29. 4 Crihan, D.; Knapp, M.; Zweidinger, S.; Lundgren, E.; Weststrate, C. J.; Andersen, J. N.; Seitsonen, A.
P.; Over, H.; Angew. Chem. Int. Ed. 2008, 47, 2131. 5 Zweidinger, S.; Crihan, D.; Knapp, M.; Hofmann, J. P.; Seitsonen, A. P.; Westrate, C. J.; Lundgren,
E.; Andersen, J. N.; Over, H.; J. Phys. Chem. C 2008, 112, 9966. 6 Studt, F.; Abild-Pedersen F.; Hansen, H. A.; Man, I. C.; Rossmeisl, J.; Bligaard T.; Chem. Cat. Chem.
2010, 2, 98. 7 (a) http://www.maxlab.lu.se/beamline/hd-bl.html. (b) Nyholm, R.; Andersen, J. N.; Johansson, U.;
Jensen, B. N.; Lindau; I. Nucl. Instrum. Meth. Phys. Res., Sect. A 2001, 520, 467. 8 Doniach, S.; Šunjić, M.; J. Phys. C 1970, 3, 285. 9 Over, H.; Bludau, H.; Skottke-Klein, M.; Moritz, W.; Ertl, G.; Campbell, C. T.; Phys. Rev. B 1992, 45,
8638. 10 Over, H.; Kim, Y. D.; Seitsonen, A. P.; Wendt, S.; Lundgren, E.; Schmid, M.; Varga, P.; Morgante,
A.; Ertl, G.; Science 2000, 287, 1474.
21
11 We employed the Vienna ab initio simulation package (VASP); Kresse, G.; Furthmüller, J.; Comput.
Mater. Sci. 1995, 6, 15., Kresse, G.; Joubert, D.; Phys. Rev. B 1998, 59, 1758. 12 Kresse, G.; Joubert, D.; Phys. Rev. B 1998, 59, 1758. 13 Perdew, J. P.; Burke, K.; Ernzerhof, M.; Phys. Rev. Lett. 1996, 77, 3365. 14 Pehlke, E.; Scheffler, M.; Phys. Rev. Lett. 1993, 71, 2338. 15 Jonsson, H., Mills, G., Jacobsen, K. W.: Nudged Elastic Band Method for Finding Minimum Energy
Paths of Transitions. In: Berne, B.J., Ciccotti, G., Coker, D.F. (Eds.): Classical and Quantum Dynamics
in Condensed Phase Simulations, pp. 385. World Scientific 1998. 16 Knapp, M.; Crihan, D.; Seitsonen, A. P.; Lundgren. E.; Resta, A.; Andersen, J. N.; Over, H.; J. Phys.
Chem. C 2007, 111, 5363. 17 Over, H.; Seitsonen, A. P.; Lundgren, E.; Wiklund M.; Andersen J. N.; Chem. Phys. Lett. 2001 342,
467. 18 Madey, T. E.; Faradzhev, S.; Yakshinskiy, B. Y.; Edwards, N. V.; Appl. Surf. Sci. 2006, 253, 1681. 19 Wang, J.; Fan, C. Y.; Sun, Q.; Reuter, K.; Jacobi, K.; Scheffler, M.; Ertl, G.; Angew. Chem. Int. Ed.
2003, 42, 2151. 20 Crihan, D.; Knapp, M.; Seitsonen, A. P.; Over, H.; J. Phys. Chem. B 2006, 110, 22947. 21 Lobo, A.; Conrad, H.; Surf. Sci. 2003, 523, 279. 22 Preyss, W.; Ebinger, H. D.; Fick, D.; Polenz, C.; Polivka, B.; Saier, V.; Veith, R.; Weindel, C.;
Jänsch, H. J.; Surf. Sci. 1997, 373, 33. 23 Farkas, A.; Mellau, G. C.; and Over, H.; J. Phys. Chem. C, 2009, 113, 14341. 24 Kim, Y. D.; Seitsonen, A. P.; Wendt, S.; Wang, J.; Fan, C.; Jacobi, K.; Over, H.; Ertl, G.; J. Phys.
Chem. B 2001, 105, 3752. 25 Zweidinger, S.; Hofmann, J. P.; Balmes, O.; Lundgren, E.; Over H.; J. Catal. 2010 in press,
doi:10.1016/j.jcat.2010.02.030.
22
Graphic for Table of content (TOC)