Embed Size (px)
Citation preview

UNIVERSITY (UNI) HIGH SCHOOL SAFE ROUTES TO SCHOOL REPORT
May 2012
Prepared by: Champaign County Regional Planning Commission
1776 East Washington Street Urbana, IL 61802
Phone: (217) 328-3313 Fax: (217) 328-2426
Website: http://www.ccrpc.org
Staff: Gabriel Lewis, Transportation Planner
Rita Morocoima-Black, Transportation Planning Manager Angelica Aquino, Intern Eric Van Buskirk, Intern
In association with:
Champaign-Urbana Safe Routes to School Project (C-U SRTS Project) Cynthia Hoyle, Chair & Founding Member
Rose Hudson, Child Safety Advocate & Founding Member Website: http://www.cu-srtsproject.com

i
TABLE OF CONTENTS Introduction .................................................................................................................. 1 Background ....................................................................................................... 1 Type of Surveys ....................................................................................... 1 Type of Information ................................................................................. 2 Note about Percentage Tables .................................................................. 2 Frequent Survey Problems & Tips for Improvement ...................................... 2 Parent Surveys ................................................................................................... 2 Problems ................................................................................................ 2 University High School Parent Surveys: 2008 ................................................................... 3
Number of Surveys ............................................................................................. 4 1. What is the grade of the child who brought home this survey? (K-8) ................... 4 2. Is the child who brought home this survey male or female? ................................ 5 3. How many children do you have in Kindergarten through 8th grade? .................. 5 4. What is the street intersection nearest your home? ............................................ 6 5. How far does your child live from school? ....................................................... 7 6. On most days, how does your child arrive at school and leave for home after
school? ....................................................................................................... 8 7. How long does it normally take your child to get to/from school? ..................... 10 8. Has your child asked you for permission to walk or bike to/from school in the last
year? ........................................................................................................ 12 9. At what grade would you allow your child to walk or bike without an adult to/from
school? ..................................................................................................... 13 10. Which of the following issues affected your decision to allow, or not allow, your
child to walk or bike to/from school? ............................................................ 14 11. Would you probably let your child walk or bike to/from school if this problem were
changed or improved? ................................................................................ 15 12. In your opinion, how much does your child’s school encourage or discourage
walking and biking to/from school? .............................................................. 16 13. How much FUN is walking or biking to/from school for your child? .................. 17 14. How HEALTHY is walking or biking to/from school for your child? .................... 18 15. What is the highest grade or year of school you completed? ............................ 19
University High School Travel Tallies: 2008 ................................................................... 20
Student Arrival and Departure Tally Sheets .......................................................... 21 Reported Weather Conditions ................................................................. 21 Number of Students Surveyed & Reported Mode to/from School ............................ 22 Appendices:
A. 2008 Parent Survey form B. Spring 2008 Travel Tally form

Champaign-Urbana Safe Routes to School Report – 2nd Edition University (UNI) High School Introduction
1
Background In August 2009, the Champaign-Urbana Safe Routes to School Project (C-U SRTS Project) was awarded its second consecutive grant through the Illinois Department of Transportation’s (IDOT) Safe Routes to School (SRTS) Program. The purpose of this grant is to educate community audiences on pedestrian and bicycle safety issues, and to encourage safe walking and bicycling to schools in Champaign-Urbana. C-U SRTS Project contracted with the Champaign County Regional Planning Commission (CCRPC) to conduct the evaluation of data collected from 2008-2010. This data was collected through International Walk to School Day walkability checklists, parent surveys, and travel tallies distributed by C-U SRTS Project as part of its SRTS grant. CCRPC added these survey results to the C-U SRTS Database, and created this 2nd Edition of the C-U SRTS Report. This allows three years of data from the 1st Edition (2004, 2006, and 2007) to be compared with three years of data in the 2nd Edition (2008-2010). This report will show stakeholders and public audiences the trends in student and parent perceptions of walking and biking to school, and actual student travel patterns to and from school. This information can be analyzed by year, by school, or by city. The presence of the database and report also allows for updates with future surveys and tallies. CCRPC also prepares Safe Walking Route Maps for each public elementary and middle school in Champaign-Urbana, with the latest editions updated in 2011. These maps can be accessed at: http://www.ccrpc.org/transportation/safewalking.php. Type of Surveys The following surveys are summarized in this report:
Year Type of Survey Date of Administration Appendix
2008 Parent Surveys May 2008 A
2008 Travel Tallies April-May 2008 B
The Parent Surveys (Appendix A) and Travel Tallies (Appendix B) came from the federally funded SRTS program. Their use was required for C-U SRTS Project grant purposes. The Parent Survey in Spanish form (Appendix F) came from the California Active Communities program, and the questions are slightly different than the Parent Survey in English. Therefore, a separate section for this survey was created.
Champaign-Urbana Safe Routes to School Report – 2nd Edition University (UNI) High School Introduction
2
Type of Information The following information is listed under each question in the report, in this order:
Parent Surveys o Notes o Graph of response sums o Percent table of responses o Comments table
Note about Percentage Tables Percentage tables in the report will not always add up to 100%, because some survey takers checked more than one response per question. Percentages are based on the total number of surveys received that year. Frequent Survey Problems & Tips for Improvement While processing surveys, it became apparent that some people had difficulty filling out the survey accurately. Some of these problems can be improved by giving survey takers some important reminders. Better user understanding can lead to increased survey returns and more accurate results. The following lists some of the frequent problems found when processing surveys, and some tips for improving the process. Parent Surveys Problems:
Question #10 asks “Which of the following issues affected your decision to allow, or not allow, your child to walk or bike to/from school?” It is not clear if the factor made parents decide to let their child walk or bike to school, or if the factor deterred them from doing so. This was also mentioned in a few parent comments.

University High School Parent Surveys 2008

Champaign-Urbana Safe Routes to School Report – 2nd Edition University High School Parent Surveys
4
Number of Surveys: School 2008 University (Uni) High School 7
1. What is the grade of the child who brought home this survey? (K-8)
Grade 8
% 85.7%

Champaign-Urbana Safe Routes to School Report – 2nd Edition University High School Parent Surveys
5
2. Is the child who brought home this survey male or female?
3. How many children do you have in Kindergarten through 8th grade?
# of K-8 Children 0 1 2 3
% 14.3% 71.4% 14.3% 0.0%

Champaign-Urbana Safe Routes to School Report – 2nd Edition University High School Parent Surveys
6
4. What is the street intersection nearest your home?
North/South Street East/West Street City School Country Fair Dr Springfield Ave Champaign Uni Duncan Rd Windsor Rd Champaign Uni Duncan Rd Windsor Rd Champaign Uni Duncan Rd Windsor Rd Champaign Uni Lynn St Haines Blvd Champaign Uni Staley Rd Old Church St Champaign Uni Orchard St Florida Ave Urbana Uni
Zip Code Champaign Urbana
% 85.7% 14.3%

Champaign-Urbana Safe Routes to School Report – 2nd Edition University High School Parent Surveys
7
5. How far does your child live from school?
Distance from
Home to School Less than ¼ mile
¼ mile up to ½ mile
½ mile up to 1 mile
1 mile up to 2 miles
More than 2 miles
Don’t know
% 0.0% 0.0% 0.0% 14.3% 71.4% 14.3%

Champaign-Urbana Safe Routes to School Report – 2nd Edition University High School Parent Surveys
8
6. On most days, how does your child arrive at school and leave for home after school? Notes:
• Family vehicle is when child rides with only children from his/her family. • Carpool is when child rides with children from other families.
Mode to School
Walk Bike School
Bus Family Vehicle
Carpool Transit Other
% 0.0% 0.0% 0.0% 57.1% 28.6% 14.3% 0.0%

Champaign-Urbana Safe Routes to School Report – 2nd Edition University High School Parent Surveys
9
Mode from
School Walk Bike
School Bus
Family Vehicle
Carpool Transit Other
% 0.0% 0.0% 0.0% 57.1% 28.6% 14.3% 0.0%

Champaign-Urbana Safe Routes to School Report – 2nd Edition University High School Parent Surveys
10
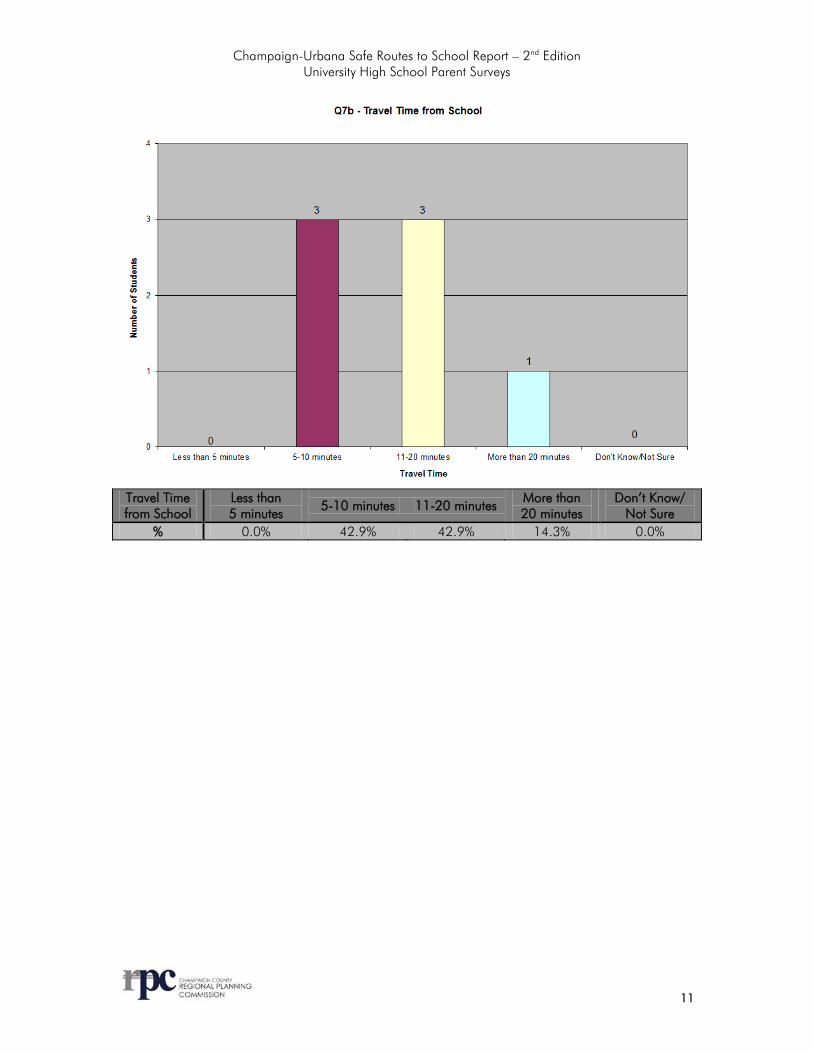
7. How long does it normally take your child to get to/from school?
Travel Time to School
Less than 5 minutes
5-10 minutes 11-20 minutes More than 20 minutes
Don’t Know/ Not Sure
% 0.0% 42.9 42.9% 14.3% 0.0%
Champaign-Urbana Safe Routes to School Report – 2nd Edition University High School Parent Surveys
11
Travel Time from School
Less than 5 minutes
5-10 minutes 11-20 minutes More than 20 minutes
Don’t Know/ Not Sure
% 0.0% 42.9% 42.9% 14.3% 0.0%

Champaign-Urbana Safe Routes to School Report – 2nd Edition University High School Parent Surveys
12
8. Has your child asked you for permission to walk or bike to/from school in the last year?

Champaign-Urbana Safe Routes to School Report – 2nd Edition University High School Parent Surveys
13
9. At what grade would you allow your child to walk or bike without an adult to/from school?
Grade 6 11 I would not feel comfortable at any grade
% 14.3% 14.3% 71.4%

Champaign-Urbana Safe Routes to School Report – 2nd Edition University High School Parent Surveys
14
10. Which of the following issues affected your decision to allow, or not allow, your child to walk or bike to/from school?
Response % Distance 85.7% Convenience of driving 14.3% Time 28.6% Child’s participation in before/after-school activities 42.9% Speed of traffic along route 71.4% Amount of traffic along route 71.4% Adults to walk or bike with 14.3% Sidewalks or pathways 14.3% Safety of intersections and crossings 42.9% Crossing guards 0.0% Violence or crime 14.3% Weather or climate 28.6%

Champaign-Urbana Safe Routes to School Report – 2nd Edition University High School Parent Surveys
15
11. Would you probably let your child walk or bike to/from school if this problem were changed or improved?
My child already walks or bikes to/from school # % 1 14.3%
Response Yes No Not Sure Distance 71.4% 0.0% 0.0% Convenience of driving 0.0% 0.0% 14.3% Time 28.6% 0.0% 0.0% Child’s participation in before/after-school activities 42.9% 0.0% 0.0% Speed of traffic along route 57.1% 0.0% 0.0% Amount of traffic along route 57.1% 0.0% 0.0% Adults to walk or bike with 14.3% 0.0% 0.0% Sidewalks or pathways 28.6% 0.0% 0.0% Safety of intersections and crossings 42.9% 0.0% 0.0% Crossing guards 0.0% 0.0% 0.0% Violence or crime 14.3% 0.0% 0.0% Weather or climate 28.6% 0.0% 0.0%

Champaign-Urbana Safe Routes to School Report – 2nd Edition University High School Parent Surveys
16
12. In your opinion, how much does your child’s school encourage or discourage walking and biking to/from school?
Level of
Encouragement Strongly
Encourage Encourage Neither Discourage
Strongly Discourage
% 0.0% 0.0% 100.0% 0.0% 0.0%

Champaign-Urbana Safe Routes to School Report – 2nd Edition University High School Parent Surveys
17
13. How much FUN is walking or biking to/from school for your child?
Level of Fun Very Fun Fun Neutral Boring Very Boring
% 0.0% 14.3% 42.9% 14.3% 14.3%

Champaign-Urbana Safe Routes to School Report – 2nd Edition University High School Parent Surveys
18
14. How HEALTHY is walking or biking to/from school for your child?
Perception of Healthiness
Very Healthy Healthy Neutral Unhealthy Very Unhealthy
% 0.0% 42.9% 42.9% 0.0% 0.0%
Champaign-Urbana Safe Routes to School Report – 2nd Edition University High School Parent Surveys
19
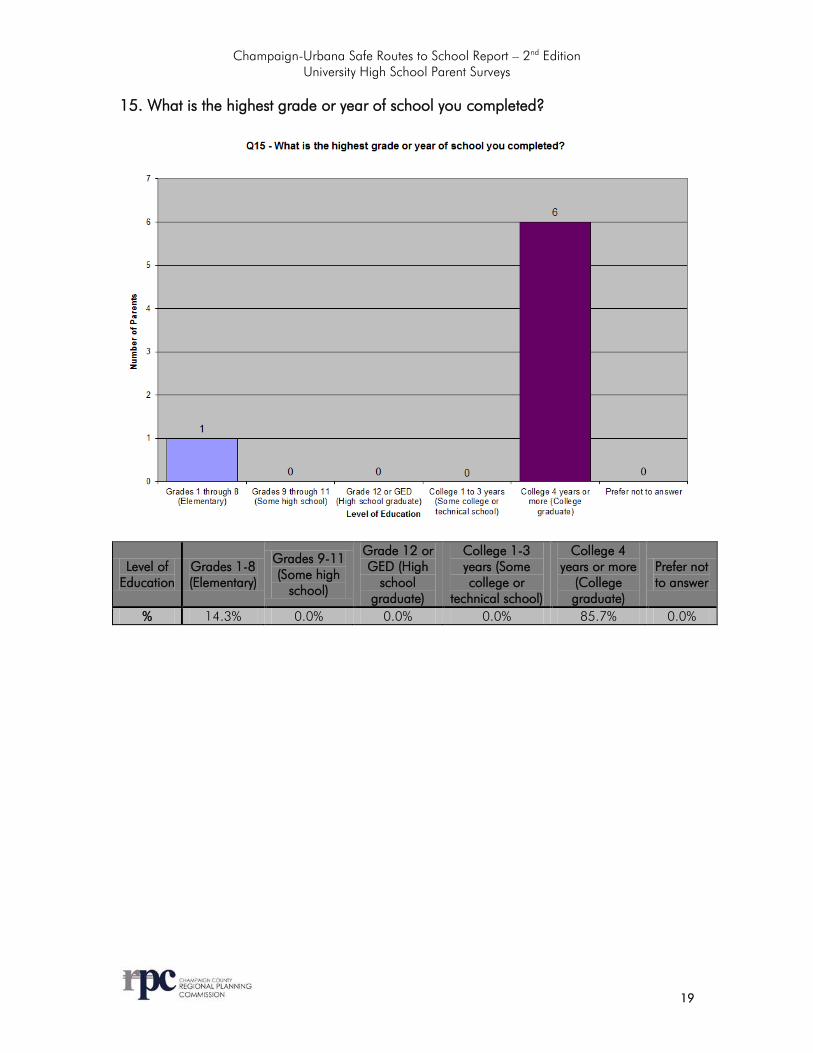
15. What is the highest grade or year of school you completed?
Level of Education
Grades 1-8 (Elementary)
Grades 9-11 (Some high
school)
Grade 12 or GED (High
school graduate)
College 1-3 years (Some college or
technical school)
College 4 years or more
(College graduate)
Prefer not to answer
% 14.3% 0.0% 0.0% 0.0% 85.7% 0.0%

University High School Travel Tallies 2008

Champaign-Urbana Safe Routes to School Report – 2nd Edition University High School Travel Tallies
21
Student Arrival and Departure Tally Sheets Teachers at University High School administered these tallies between Monday, April 21, 2008 and Friday, April 25, 2008. Reported Weather Conditions

Champaign-Urbana Safe Routes to School Report – 2nd Edition University High School Travel Tallies
22
Number of Students Surveyed & Reported Mode to/from School Notes:
• The “Total # of Students Surveyed” column is the sum of the number of students present during each tally in each school. Students were surveyed a maximum of 6 times per week, at the beginning and end of each school day, Tuesday through Thursday. Not all teachers administered tallies 6 times per week.
• The “Total # of Times Surveyed” column is the total number of tallies taken per school. • The “Average # of Students Surveyed” was rounded to the closest full number. • Mode percentages were found by dividing the total number of responses for that mode by the
total number of students surveyed. o Numbers were entered exactly as teachers wrote them.
School Grades
Surveyed
Total # of Students Surveyed
Total # of Times Surveyed
Average # of Students Surveyed
University High School (Uni) 8 121 4 30
School Walk Bike School Bus Family Vehicle Carpool Transit Other
University High School (Uni) 1.7% 1.7% 0% 114% 50.4% 28.9% 0%
School Teacher Comments
University High School (Uni)
Misread the directions on Tuesday and overlooked the "leave school" part. Disregard Tuesday's data.

APPENDIX A: 2008 PARENT SURVEY FORM

Page 1 of 2
Dear Parent or Caregiver, Your child’s school wants to learn your thoughts about children walking and biking to school. This survey will take about 5 - 10 minutes to complete. We ask that each family complete only one survey per school your children attend. If more than one child from a school brings a survey home, please fill out the survey for the child with the next birthday from today’s date.
After you have completed this survey, send it back to the school with your child or give it to the teacher. Your responses will be kept confidential and neither your name nor your child’s name will be associated with any results. Thank you for participating in this survey!
School Name:
1. What is the grade of the child who brought home this survey? (K – 8) grade
2. Is the child who brought home this survey male or female? MALE FEMALE
3. How many children do you have in Kindergarten through 8th grade? children 4. What is the street intersection nearest your home? (provide the names of two intersecting streets)
5. How far does your child live from school? (choose one and mark box with X)
a. less than 1/4 mile c. 1/2 mile up to 1 mile e. More than 2 miles
b. 1/4 mile up to 1/2 mile d. 1 mile up to 2 miles f. Don’t know
Arrive at school Leave for home 6. On most days, how does your child arrive at school and leave for home after school? (select one choice per column, mark box with X)
a. Walk b. Bike c. School Bus d. Family vehicle (only with children
from your family) e. Carpool (riding with children from
other families) f. Transit (city bus, subway, etc.) h. Other (skateboard, scooter, inline
skates, etc.)
a. Walk b. Bike c. School Bus d. Family vehicle (only with children
from your family) e. Carpool (riding with children from
other families) f. Transit (city bus, subway, etc.) h. Other (skateboard, scooter, inline
skates, etc.)
Travel time to school Travel time from school 7. How long does it normally take your child to get to/from school? (fill-in circle for one choice per column)
a. Less than 5 minutes b. 5 - 10 minutes
c. 11 - 20 minutes d. More than 20 minutes
e. Don’t know / Not sure
a. Less than 5 minutes b. 5 - 10 minutes c. 11 - 20 minutes d. More than 20 minutes
e. Don’t know / Not sure
AND
SURVEY ABOUT WALKING AND BIKING TO SCHOOL - FOR PARENTS -
Completing this form: Please write with CAPITAL letters. Mark boxes with “X” instead of “ ”.

Page 2 of 2
8. Has your child asked you for permission to walk or bike to/from school in the last year? (select one) YES NO
9. At what grade would you allow your child to walk or bike without an adult to/from school?
(select a grade between K – 8) grade (or I would not feel comfortable at any grade)
10. Which of the following issues affected your decision to allow, or not allow, your child to walk or bike to/from school? (select all that apply, mark with X in box)
11. Would you probably let your child walk or bike to/from school if this problem were changed or improved? (select one choice per line)
( My child already walks or bikes to/from school)
Distance YES NO Not Sure
Convenience of driving YES NO Not Sure
Time YES NO Not Sure
Child’s before or after-school activities YES NO Not Sure
Speed of traffic along route YES NO Not Sure
Amount of traffic along route YES NO Not Sure
Adults to walk or bike with YES NO Not Sure
Sidewalks or pathways YES NO Not Sure
Safety of intersections and crossings YES NO Not Sure
Crossing guards YES NO Not Sure
Violence or crime YES NO Not Sure
Weather or climate YES NO Not Sure
12. In your opinion, how much does your child’s school encourage or discourage walking and biking to/from school? (select one, mark with X in box)
Strongly Encourage Encourage Neither Discourage Strongly Discourage
13. How much FUN is walking or biking to/from school for your child? (select one)
Very Fun Fun Neutral Boring Very Boring
14. How HEALTHY is walking or biking to/from school for your child? (select one)
Very Healthy Healthy Neutral Unhealthy Very Unhealthy
15. What is the highest grade or year of school you completed? (select one, mark with X in box)
Grades 1 through 8 (Elementary) Grades 9 through 11 (Some high school) Grade 12 or GED (High school graduate)
College 1 to 3 years (Some college or technical school) College 4 years or more (College graduate) Prefer not to answer
16. Please provide any additional comments below:
Thank you for participating in this survey!

APPENDIX B: SPRING 2008 TRAVEL TALLY FORM

Thank you for helping gather this information!
School Name:
Zip Code:
-
Teacher:
Grade (K-8)
Monday’s Date / / 2 0 # of students enrolled in class
M M / D D / Y E A R
Teachers, here are simple instructions for using this form: • Please conduct these counts on any two days from Tuesday, Wednesday, or Thursday of the
assigned week. Only two days worth of counts are needed, but counting all 3 provides better data.
• Please do not conduct these counts on Mondays or Fridays. • Before asking your students to raise their hands to indicate the one answer that is correct for them,
read through all potential answers so they will know what the choices are.
• Ask your students as a group the question “How did you arrive at school today?”
• Read each answer and record the number of students that raised their hands for each.
• Place just one character or number in each box. • Follow the same procedure for the question “How do you plan to leave for home after school?”
• Please conduct this count regardless of weather conditions (i.e., ask these questions on rainy days, too).
Step 1. Fill in the weather conditions and number of students in class each day.
Step 2. Ask students “How did you arrive at school today?” and “How do you plan to leave for home after school?” (record number of hands for each answer)
Weather S= sunny R= rainy O= overcast Sn= snow
Number of
Students (in class
when count made)
Walk Bike School
Bus
Family Vehicle
(only with children
from your family)
Carpool (riding with
children from other families)
Transit (city bus, subway,
etc.)
Other (skate-board,
scooter, inline
skates, etc.)
SAMPLE S 2 7 4 2 1 1 7 3 0 0
Tues AM
Tues PM
Wed AM
Wed PM
Thur AM
Thur PM
Comments (List disruptions to counts or any unusual travel conditions to/from the school on the days of the tally):
SAFE ROUTES TO SCHOOL STUDENT ARRIVAL AND DEPARTURE TALLY SHEET