Embed Size (px)
Citation preview

UNIX Performance Data Analysis
Ellen FriedmanSRM Associates, Ltd.
CMG, OrlandoDecember 12, 2000
www.srmassoc.com
AgendaToday’s Focus? Review Unix measurement tools- Examples will
be AIX based, similar for other OS? Focus on Process- Examining CPU, I/O and
Memory? Workload Characterization for Unix? Collecting Performance Unix performance data-
building a database for monitoring resource usage? Case Study examples to illustrate process? Summary
www.srmassoc.com
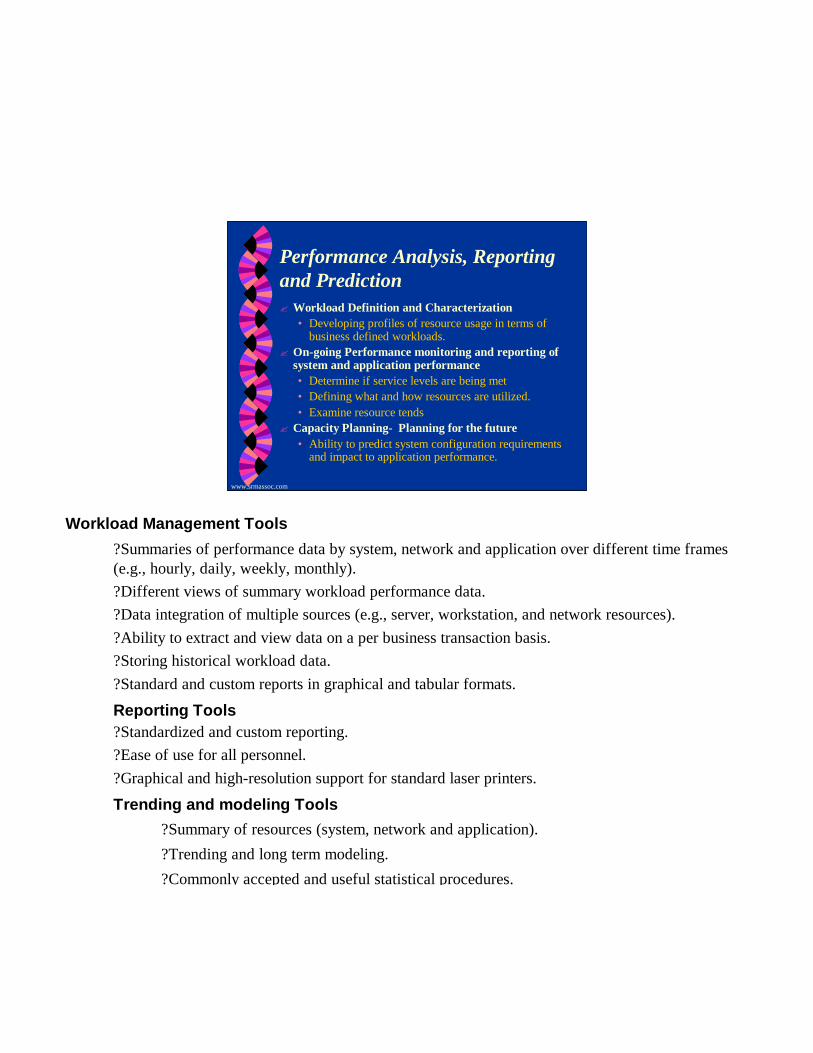
Performance Analysis, Reporting and Prediction? Workload Definition and Characterization
• Developing profiles of resource usage in terms of business defined workloads.
? On-going Performance monitoring and reporting of system and application performance• Determine if service levels are being met• Defining what and how resources are utilized.• Examine resource tends
? Capacity Planning- Planning for the future• Ability to predict system configuration requirements
and impact to application performance.
Workload Management Tools?Summaries of performance data by system, network and application over different time frames (e.g., hourly, daily, weekly, monthly).?Different views of summary workload performance data.?Data integration of multiple sources (e.g., server, workstation, and network resources).?Ability to extract and view data on a per business transaction basis.?Storing historical workload data.?Standard and custom reports in graphical and tabular formats.
Reporting Tools?Standardized and custom reporting.?Ease of use for all personnel.?Graphical and high-resolution support for standard laser printers.
Trending and modeling Tools?Summary of resources (system, network and application).?Trending and long term modeling.?Commonly accepted and useful statistical procedures.

www.srmassoc.com
Performance Overview- All OS
? Factors Contributing to system performance and resources to examine:
• CPU, I/O, Memory, Network • Tools for measuring resource usage in Unix• Who is using resources?• Can work be scheduled and/or prioritized to balance
resource usage across the day?• What are the application service level requirements
which must be met and what is the impact to resource consumption?
www.srmassoc.com
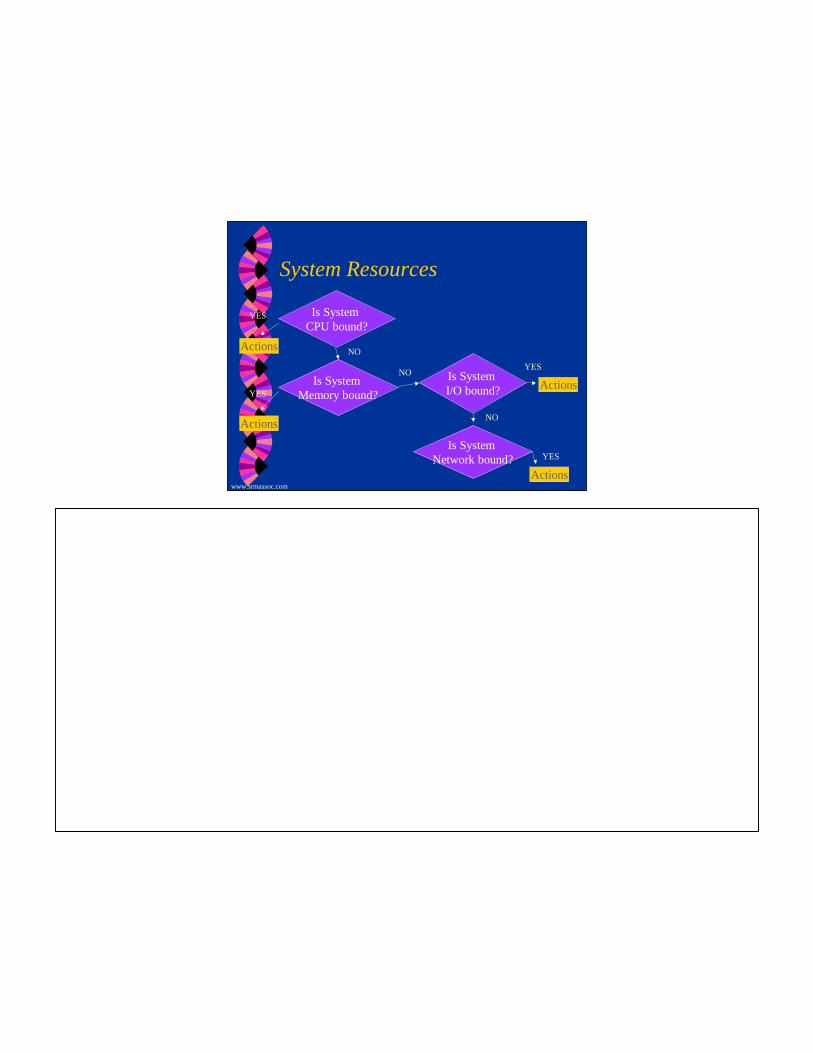
System Resources
Is System I/O bound?
Is System CPU bound?
Is System Memory bound?
Is System Network bound?
Actions
Actions
Actions
Actions
YES
YES
YES
YES
NO
NO
NO

www.srmassoc.com
System Resources Memory and CPU
? Memory • Number of concurrent users, # of logged on users,
buffer pool sizes for databases, number and type of applications.
• Measurements of Contention:• Swapping, Paging , Swap queue sizes
? CPU • How fast must the processor be? How many processors
do you need? • Compute intensive vs. database intensive
•Paging: To handle lack of memory system will page- move portions of active processes to disk in order to reclaim physical memory.•Swapping: Moving an entire process to disk to reclaim space.•Use vmstat to monitor memory and paging.•To prevent paging, you must make more memory available or decrease the load.
•CPU-•Can offload work by scheduling it.
•Get faster processors to handle work if machine is out of capacity defined by high system+user CPU in Unix.
•If there is high Wait for I/O time recorded then need faster disks not faster CPU.•Change priority scheme of large jobs requiring significant resources.•Consider Workload Management to balance priorities and run various workload types in UNIX.
www.srmassoc.com
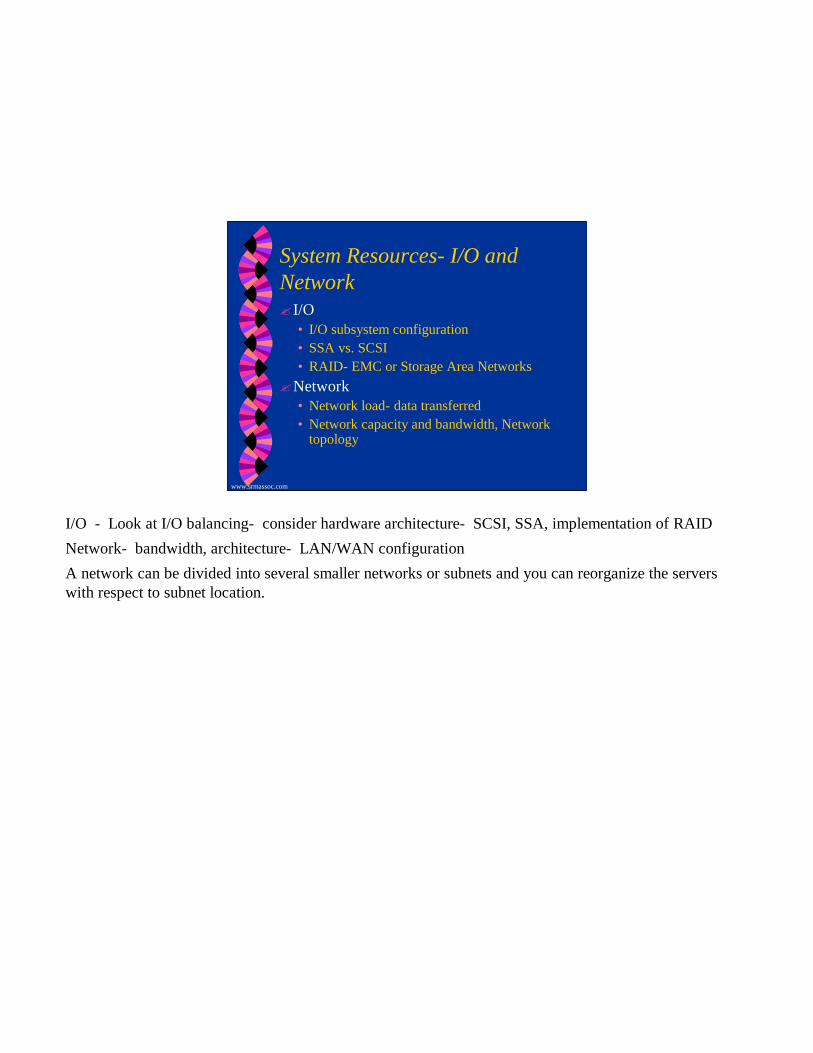
System Resources- I/O and Network? I/O
• I/O subsystem configuration• SSA vs. SCSI• RAID- EMC or Storage Area Networks
?Network• Network load- data transferred• Network capacity and bandwidth, Network
topology
I/O - Look at I/O balancing- consider hardware architecture- SCSI, SSA, implementation of RAIDNetwork- bandwidth, architecture- LAN/WAN configuration A network can be divided into several smaller networks or subnets and you can reorganize the servers with respect to subnet location.
www.srmassoc.com
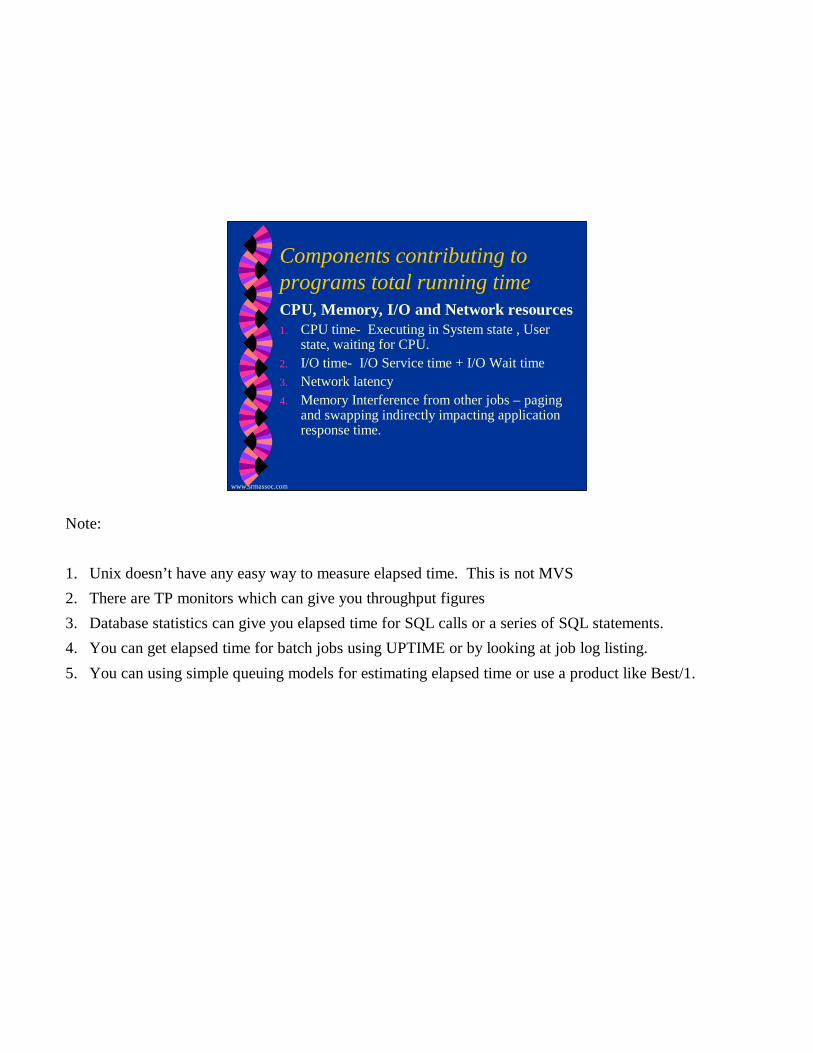
Components contributing to programs total running timeCPU, Memory, I/O and Network resources1. CPU time- Executing in System state , User
state, waiting for CPU. 2. I/O time- I/O Service time + I/O Wait time3. Network latency4. Memory Interference from other jobs – paging
and swapping indirectly impacting application response time.
Note:
1. Unix doesn’t have any easy way to measure elapsed time. This is not MVS 2. There are TP monitors which can give you throughput figures3. Database statistics can give you elapsed time for SQL calls or a series of SQL statements.4. You can get elapsed time for batch jobs using UPTIME or by looking at job log listing.
5. You can using simple queuing models for estimating elapsed time or use a product like Best/1.

www.srmassoc.com
Standard Performance Tools? sar- System V: collects and reports system
activity information on CPU, disk and memory
?vmstat- CPU and virtual memory
? iostat- I/O subsystem? ps- shows current status of processes? Accounting data? netstat- network load

www.srmassoc.com
Standard Performance Tools (con’t)? sar – sadc script will create date time and unix
machine name in file- run against report file (e.g., sar –A report file)
? Berkley Systems: vmstat/iostat/netstat/ps- need to create a script to run these which adds date/time and machine name.
AIX unix49 3 4 000C541D4C00 11/01/00
00:00:00 %usr %sys %wio %idle
00:10:00 2 5 14 79
00:20:00 0 0 0 99
00:30:00 0 0 0 100

www.srmassoc.com
Looking at CPU Utilization
? CPU measurements in UNIX-? From a system perspective:
• sar -u, iostat, vmstat all give CPU utilization figures.• CPU utilization= System+User
? From a process perspective• ps (different flavors: -aux)
• CPU time per process in mm:ss since start of process• Need to delta the CPU time between recordings to get the
contribution of CPU per interval
Showing CPU utilization by invoking sar -u
AIX unix49 3 4 000C541D4C00 11/01/00
00:00:00 %usr %sys %wio %idle00:10:00 2 5 14 7900:20:00 0 0 0 9900:30:00 0 0 0 10000:40:00 0 0 0 9900:50:00 0 0 0 9901:00:00 0 0 0 10001:10:00 0 0 0 99
01:20:01 0 0 0 9901:30:01 0 0 0 100
www.srmassoc.com
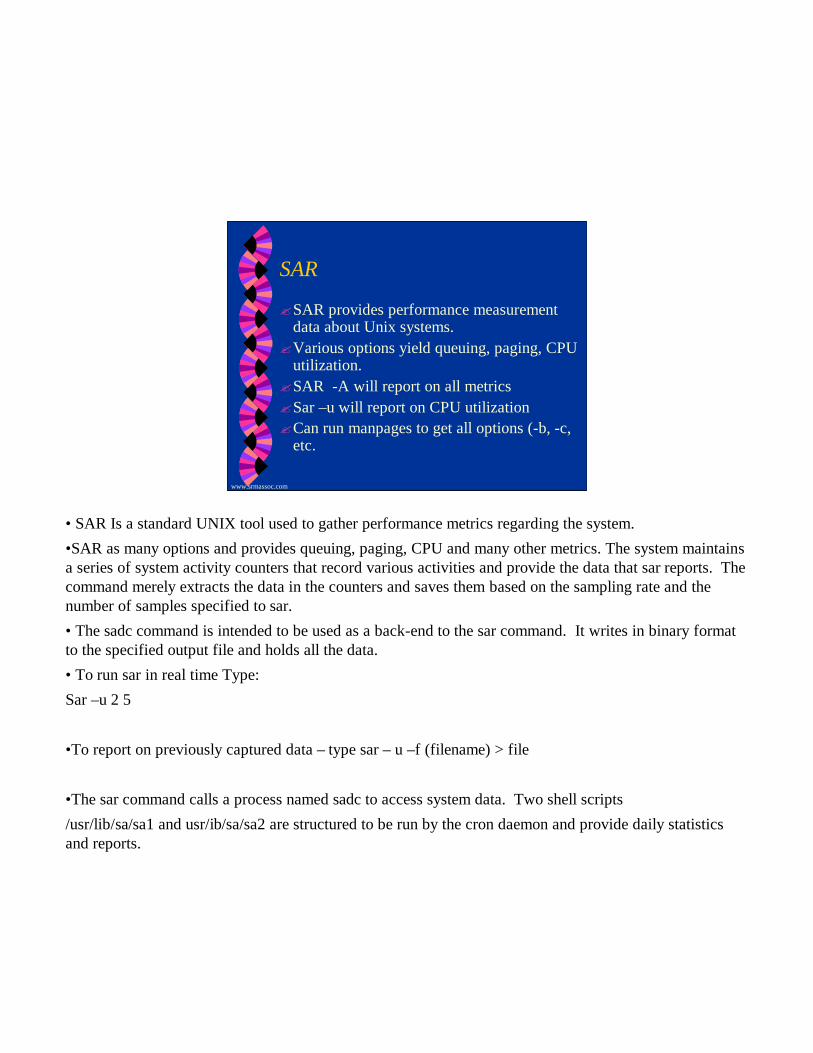
SAR
? SAR provides performance measurement data about Unix systems.
?Various options yield queuing, paging, CPU utilization.
? SAR -A will report on all metrics? Sar –u will report on CPU utilization?Can run manpages to get all options (-b, -c,
etc.
•SAR Is a standard UNIX tool used to gather performance metrics regarding the system.•SAR as many options and provides queuing, paging, CPU and many other metrics. The system maintains a series of system activity counters that record various activities and provide the data that sar reports. The command merely extracts the data in the counters and saves them based on the sampling rate and the number of samples specified to sar.•The sadc command is intended to be used as a back-end to the sar command. It writes in binary format to the specified output file and holds all the data.•To run sar in real time Type: Sar –u 2 5
•To report on previously captured data – type sar – u –f (filename) > file
•The sar command calls a process named sadc to access system data. Two shell scripts/usr/lib/sa/sa1 and usr/ib/sa/sa2 are structured to be run by the cron daemon and provide daily statistics and reports.
www.srmassoc.com
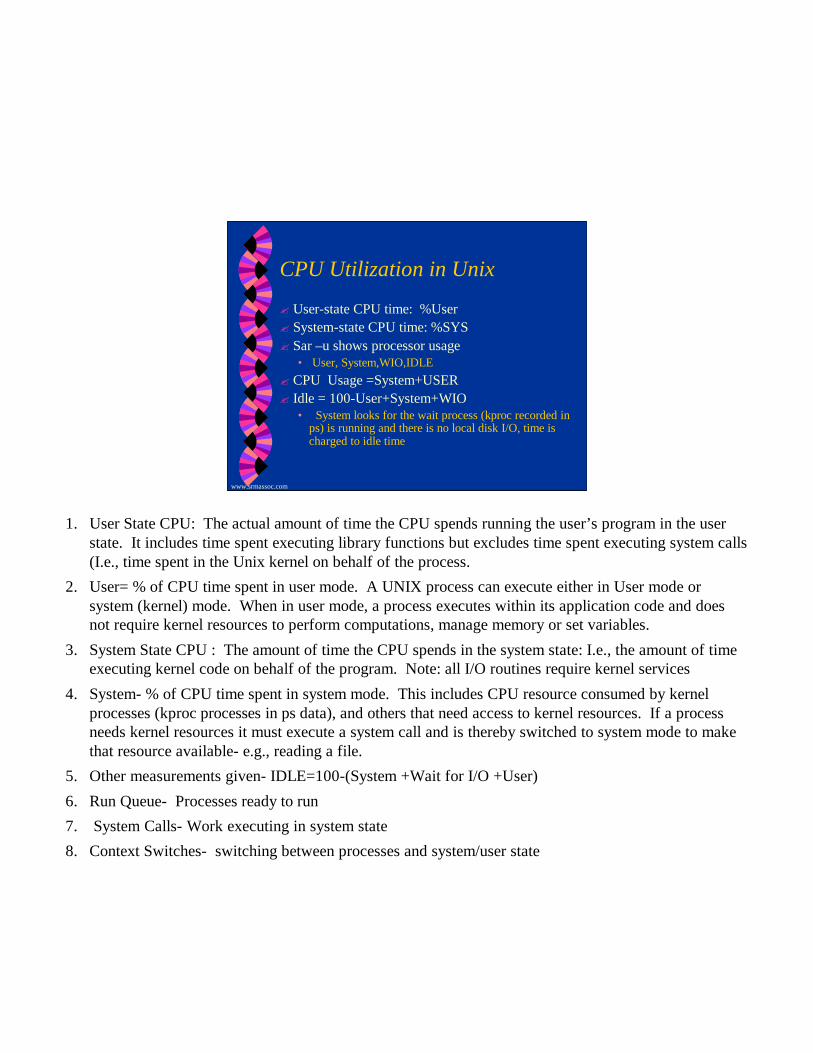
CPU Utilization in Unix
? User-state CPU time: %User? System-state CPU time: %SYS? Sar –u shows processor usage
• User, System,WIO,IDLE? CPU Usage =System+USER? Idle = 100-User+System+WIO
• System looks for the wait process (kproc recorded inps) is running and there is no local disk I/O, time is charged to idle time
1. User State CPU: The actual amount of time the CPU spends running the user’s program in the user state. It includes time spent executing library functions but excludes time spent executing system calls (I.e., time spent in the Unix kernel on behalf of the process.
2. User= % of CPU time spent in user mode. A UNIX process can execute either in User mode or system (kernel) mode. When in user mode, a process executes within its application code and does not require kernel resources to perform computations, manage memory or set variables.
3. System State CPU : The amount of time the CPU spends in the system state: I.e., the amount of time executing kernel code on behalf of the program. Note: all I/O routines require kernel services
4. System- % of CPU time spent in system mode. This includes CPU resource consumed by kernel processes (kproc processes in ps data), and others that need access to kernel resources. If a process needs kernel resources it must execute a system call and is thereby switched to system mode to make that resource available- e.g., reading a file.
5. Other measurements given- IDLE=100-(System +Wait for I/O +User)
6. Run Queue- Processes ready to run7. System Calls- Work executing in system state8. Context Switches- switching between processes and system/user state
www.srmassoc.com
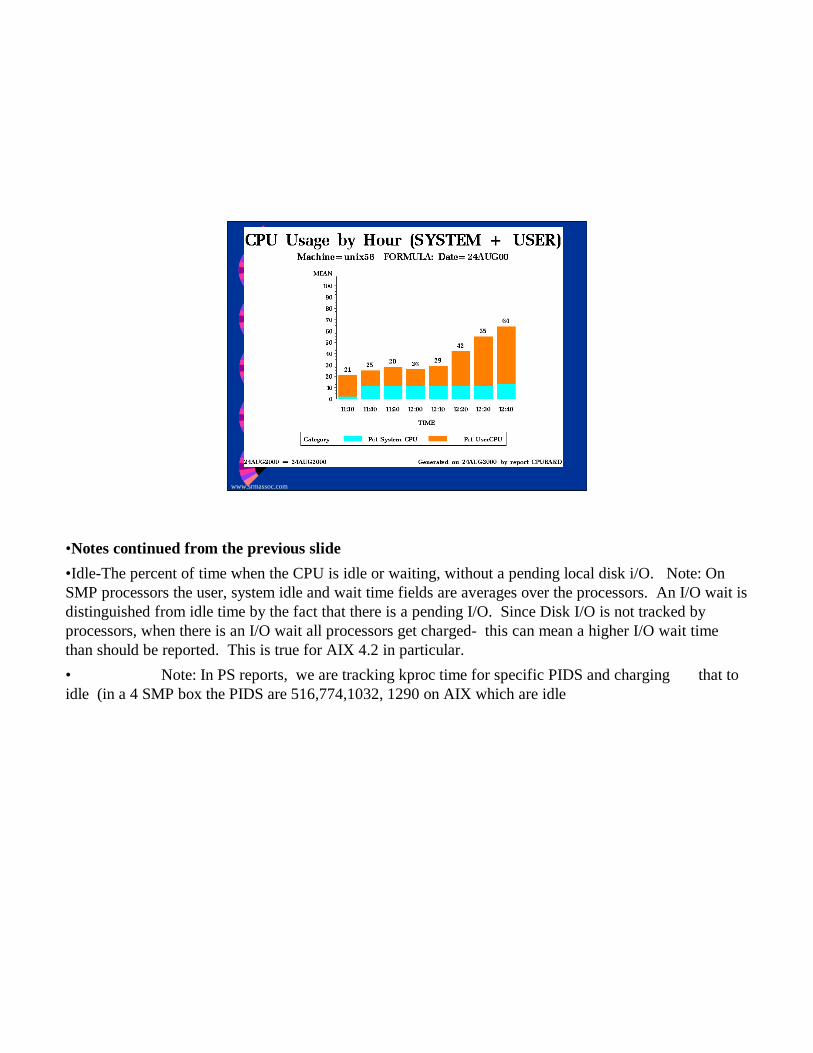
•Notes continued from the previous slide•Idle-The percent of time when the CPU is idle or waiting, without a pending local disk i/O. Note: On SMP processors the user, system idle and wait time fields are averages over the processors. An I/O wait is distinguished from idle time by the fact that there is a pending I/O. Since Disk I/O is not tracked by processors, when there is an I/O wait all processors get charged- this can mean a higher I/O wait time than should be reported. This is true for AIX 4.2 in particular.• Note: In PS reports, we are tracking kproc time for specific PIDS and charging that to idle (in a 4 SMP box the PIDS are 516,774,1032, 1290 on AIX which are idle

www.srmassoc.com
VMSAT Usage? vmstat [-f] [-s] [interval] [count]- vmstat 2 2? Reports summary of paging and system events
since initialization/periodic reports? Using vmstat with intervals during the execution
of a workload will provide information on paging space consumption, real memory use and CPU utilization.
? Note: the first line of report will be since system boot. The subsequent lines are interval statistics.
This script will give data every 15 minutes with the system name and date appended to it. Since the first line of the vmstat report is the header we ignore this and we ignore the first line of the report.
VMSTAT INFORMATIONvmstat 900 5 | tail +5 |while read linedo
echo "`date \"+%y%m%d %H%M%S\"` ${line}" >> "${DIR4OUTPUT}/vmstat`date+%d`.`uname -n`"done
www.srmassoc.com
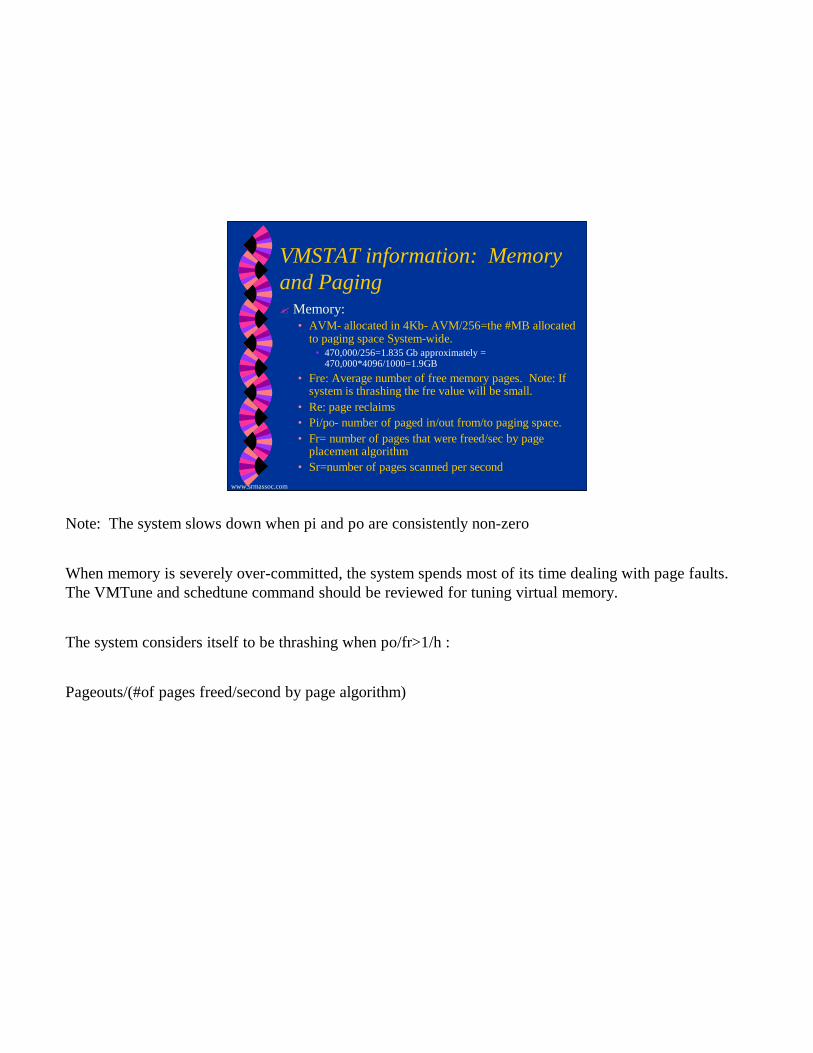
VMSTAT information: Memory and Paging? Memory:
• AVM- allocated in 4Kb- AVM/256=the #MB allocated to paging space System-wide.
• 470,000/256=1.835 Gb approximately = 470,000*4096/1000=1.9GB
• Fre: Average number of free memory pages. Note: If system is thrashing the fre value will be small.
• Re: page reclaims• Pi/po- number of paged in/out from/to paging space.• Fr= number of pages that were freed/sec by page
placement algorithm• Sr=number of pages scanned per second
Note: The system slows down when pi and po are consistently non-zero
When memory is severely over-committed, the system spends most of its time dealing with page faults. The VMTune and schedtune command should be reviewed for tuning virtual memory.
The system considers itself to be thrashing when po/fr>1/h :
Pageouts/(#of pages freed/second by page algorithm)
www.srmassoc.com
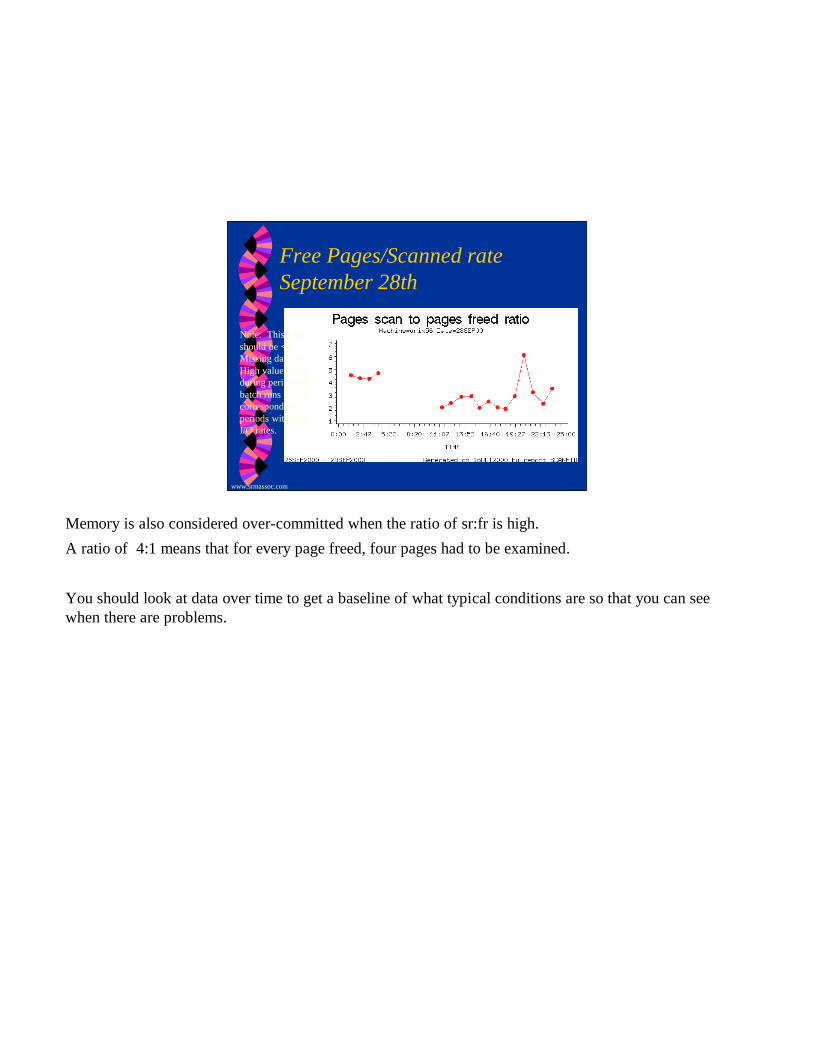
Free Pages/Scanned rateSeptember 28th
Note: This value should be <4.Missing data =0High values existduring periods of batch runs whichcorresponds to periods with highI/O rates.
Memory is also considered over-committed when the ratio of sr:fr is high.A ratio of 4:1 means that for every page freed, four pages had to be examined.
You should look at data over time to get a baseline of what typical conditions are so that you can see when there are problems.

www.srmassoc.com
VMSTATExample of Memory Problem
Date Time Machine r b AVMEM Free Re PI PO PageFreed
SR
829 0 unix41 1 1 478322 224 0 0 0 1 4829 1500 unix41 1 1 478026 528 0 0 0 0 0829 3000 unix41 1 1 478028 842 0 0 0 0 1829 4500 unix41 1 1 478028 760 0 0 0 0 0829 10000 unix41 1 1 478028 762 0 0 0 0 0829 11500 unix41 1 1 478026 765 0 0 0 0 0829 13000 unix41 1 1 478028 682 0 0 0 0 0829 14500 unix41 1 1 478028 540 0 0 0 0 0829 20000 unix41 1 1 478028 751 0 0 0 7 17829 21500 unix41 1 1 478026 757 0 0 0 0 0829 23000 unix41 1 1 478028 679 0 0 0 0 0829 24500 unix41 1 1 478028 769 0 0 0 0 0829 30000 unix41 1 1 478028 653 0 0 0 0 0829 31500 unix41 1 1 478026 8257 0 0 0 0 0
829 33000 unix41 1 1 478695 124 0 1 0 62 134829 34500 unix41 1 1 482845 103 0 0 0 195 345829 40000 unix41 1 2 482807 118 0 0 2 99 236829 41500 unix41 1 1 482555 132 0 9 8 324 748829 43000 unix41 1 1 482565 277 0 2 1 132 395829 44500 unix41 1 1 482752 148 0 0 1 105 230829 50000 unix41 1 1 482566 170 0 0 1 56 135829 51500 unix41 3 1 482565 144 0 7 8 493 1343829 53000 unix41 4 2 482650 153 0 1 11 456 1167829 54500 unix41 3 3 480906 172 0 0 2 184 392829 60000 unix41 3 3 459583 11251 0 1 2 121 323
Notice how the free memory is extremely low - also note that pageins are occurring at 5 A.M. The scan rate to free rate is also high at about 5 A.M.
Notice at 6 A.M. The free pages increases dramatically, indicating that a process most likely ended and relinquished its pages back to the system.

www.srmassoc.com
Iostat
? iostat command: Is the the system I/O bound or not.
? Data collected about CPU and I/O statistics for tty devices, disk and CD-ROMs.
? Provides statistics about physical volumes.? Need to review file system placement across
physical volumes to understand file system utilization and placement issues.
? Note: The first message is a summary since the system was booted. The data then gives you interval statistics: iostat 2 2
The iostat command works by sampling the kernel’s address space and extracting data from various coutners that updated every clock tick . Results are reported as per second rates or as absolute values for the specified interval.
If the iostat command is used without interval- then the output is a summary since system startup.So that if you record:Iostat 2 5 then only the first line is an average since system reboot and the subsequent lines are interval statistics- The first line should be ignored.Iostat:Disks- each physical volume e.g., hdisk followed by a number%tm-act- Indicates the percentage of time the physical disk was active. A drive is active during data transfer and command processing, such as seeking to a new location. The disk active percentage is ivnersely proportional to performance. Utilization >40% is not good.
Kbps- amount of data trasferrred (read or written) to the drive in KB per second. =(kb_read+kb_wrtn)/(length of interval in seconds).
www.srmassoc.com
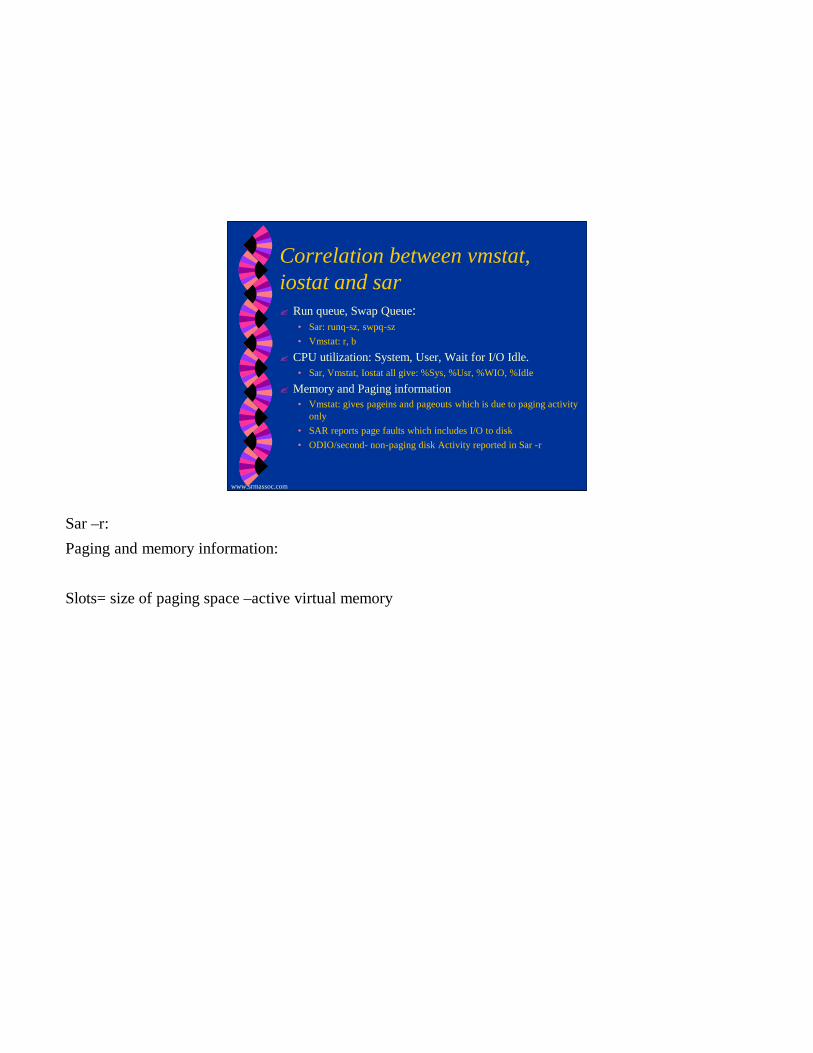
Correlation between vmstat, iostat and sar? Run queue, Swap Queue:
• Sar: runq-sz, swpq-sz• Vmstat: r, b
? CPU utilization: System, User, Wait for I/O Idle.• Sar, Vmstat, Iostat all give: %Sys, %Usr, %WIO, %Idle
? Memory and Paging information• Vmstat: gives pageins and pageouts which is due to paging activity
only• SAR reports page faults which includes I/O to disk• ODIO/second- non-paging disk Activity reported in Sar -r
Sar –r:Paging and memory information:
Slots= size of paging space –active virtual memory
www.srmassoc.com
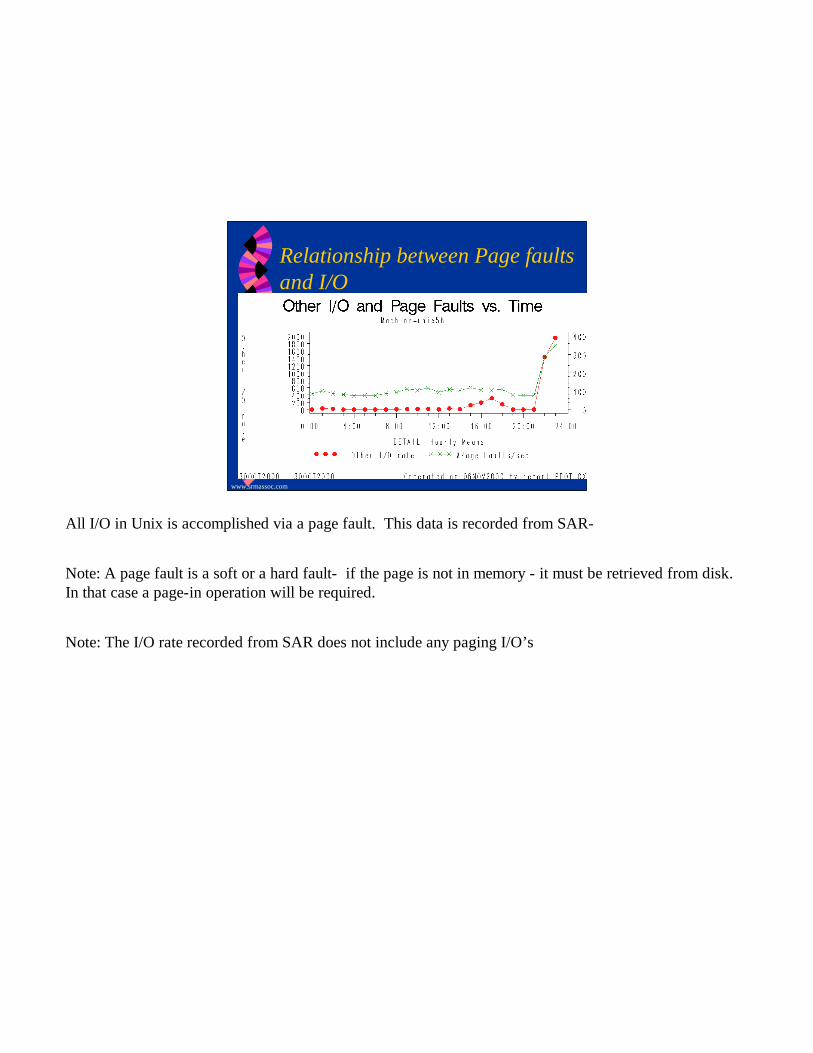
Relationship between Page faultsand I/O
All I/O in Unix is accomplished via a page fault. This data is recorded from SAR-
Note: A page fault is a soft or a hard fault- if the page is not in memory - it must be retrieved from disk. In that case a page-in operation will be required.
Note: The I/O rate recorded from SAR does not include any paging I/O’s

www.srmassoc.com
CRON Facility
? Use Cron to schedule scripts to collect performance data. Here is a SAR example.
? Each entry in the file is a single line:• Minute hour dayofmonth dayofweek username command• 0 8-17 * * 1-5 /usr/lib/sa/sa1 1200 3&• 0 * * * 0,6 /usr/lib/sa/sa1 &• 0 18-7 * * 1-5 /usr/sa/sa1
? This will collect data every 20 minutes weekdays, every hour on Saturday and Sunday and hourly from 6 P.M. to 7 A.M. weekdays.
www.srmassoc.com
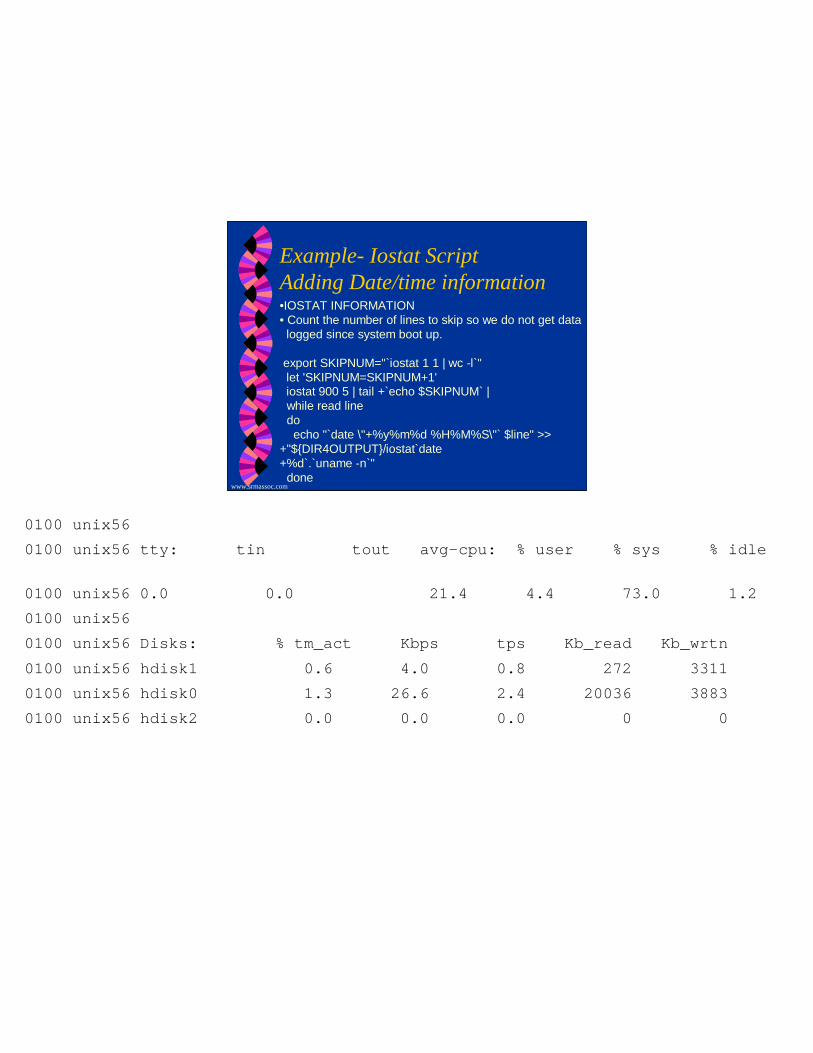
Example- Iostat ScriptAdding Date/time information•IOSTAT INFORMATION•Count the number of lines to skip so we do not get data logged since system boot up.
export SKIPNUM="`iostat 1 1 | wc -l`"let 'SKIPNUM=SKIPNUM+1'iostat 900 5 | tail +`echo $SKIPNUM` |while read linedoecho "`date \"+%y%m%d %H%M%S\"` $line" >>
+"${DIR4OUTPUT}/iostat`date+%d`.`uname -n`"
done
001103 000100 unix56 001103 000100 unix56 tty: tin tout avg-cpu: % user % sys % idle %
001103 000100 unix56 0.0 0.0 21.4 4.4 73.0 1.2001103 000100 unix56 001103 000100 unix56 Disks: % tm_act Kbps tps Kb_read Kb_wrtn001103 000100 unix56 hdisk1 0.6 4.0 0.8 272 3311001103 000100 unix56 hdisk0 1.3 26.6 2.4 20036 3883001103 000100 unix56 hdisk2 0.0 0.0 0.0 0 0
www.srmassoc.com
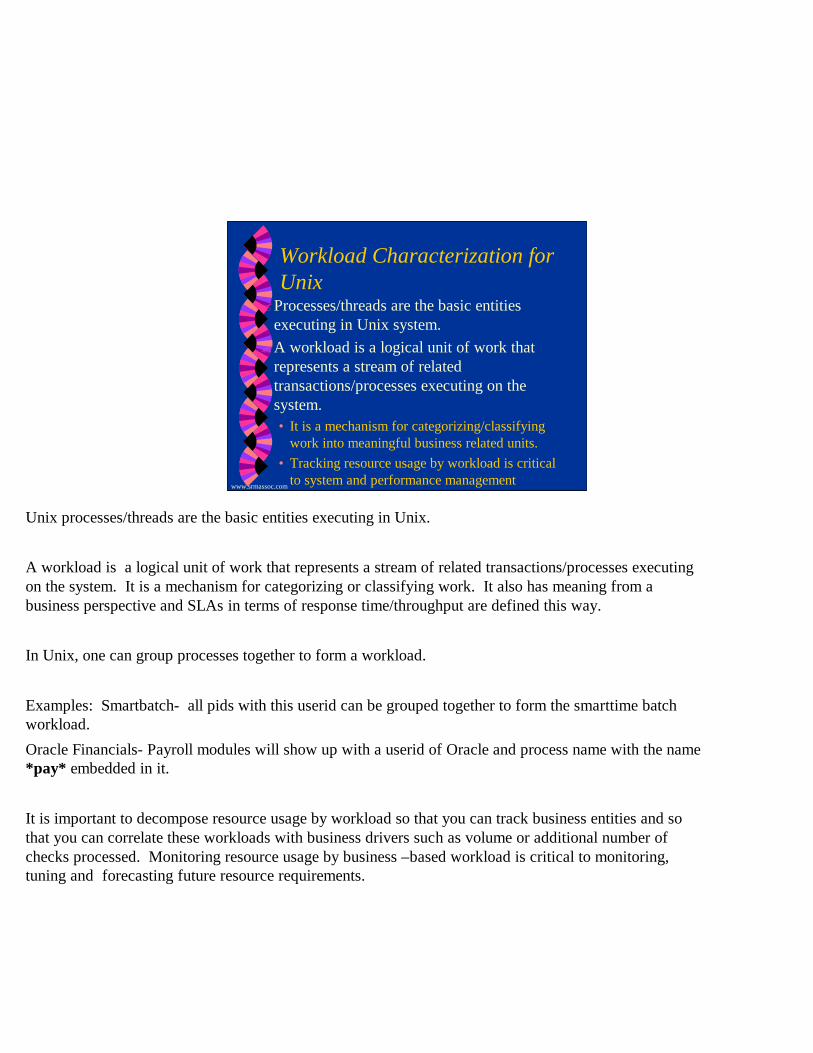
Workload Characterization for Unix
? Processes/threads are the basic entities executing in Unix system.
?A workload is a logical unit of work that represents a stream of related transactions/processes executing on the system.• It is a mechanism for categorizing/classifying
work into meaningful business related units.• Tracking resource usage by workload is critical
to system and performance management
Unix processes/threads are the basic entities executing in Unix.
A workload is a logical unit of work that represents a stream of related transactions/processes executing on the system. It is a mechanism for categorizing or classifying work. It also has meaning from a business perspective and SLAs in terms of response time/throughput are defined this way.
In Unix, one can group processes together to form a workload.
Examples: Smartbatch- all pids with this userid can be grouped together to form the smarttime batch workload.
Oracle Financials- Payroll modules will show up with a userid of Oracle and process name with the name *pay* embedded in it.
It is important to decompose resource usage by workload so that you can track business entities and so that you can correlate these workloads with business drivers such as volume or additional number of checks processed. Monitoring resource usage by business –based workload is critical to monitoring, tuning and forecasting future resource requirements.

www.srmassoc.com
PS Data Retrieved•Data from ps aux- Shows CPU and Memory usage for specific
processes. Date/time stamp added via script.
000824 001100 unix56USER PID %CPU %MEM SZ RSS TTY STAT STIME TIME COMMANDoracle7 37996 25.0 0.0 3148 1076 - A 19:19:16 291:42 dbsnmproot 516 24.7 0.0 264 6820 - A Jul 24 43136:02 kprocroot 774 24.3 0.0 8 6804 - A Jul 24 42435:07 kprocroot 1032 24.1 0.0 8 6804 - A Jul 24 42225:45 kprocroot 1290 23.3 0.0 8 6804 - A Jul 24 40750:50 kprocoracle7 17056 11.7 0.0 3068 1664 pts/0 A 15:48:34 234:41 imp system/shigaooracle7 26748 10.2 0.0 11920 5432 - A 15:48:34 205:33 oracleSMTPRD (DE
PS INFORMATION- Script used to create the data abovex=1while [ "$x" -le 4 ]dosleep 900(date "+%y%m%d %H%M%S"ps aux
) >> "${DIR4OUTPUT}/psaux`date +%d`.`uname -n`"let 'x=x+1'
done
www.srmassoc.com
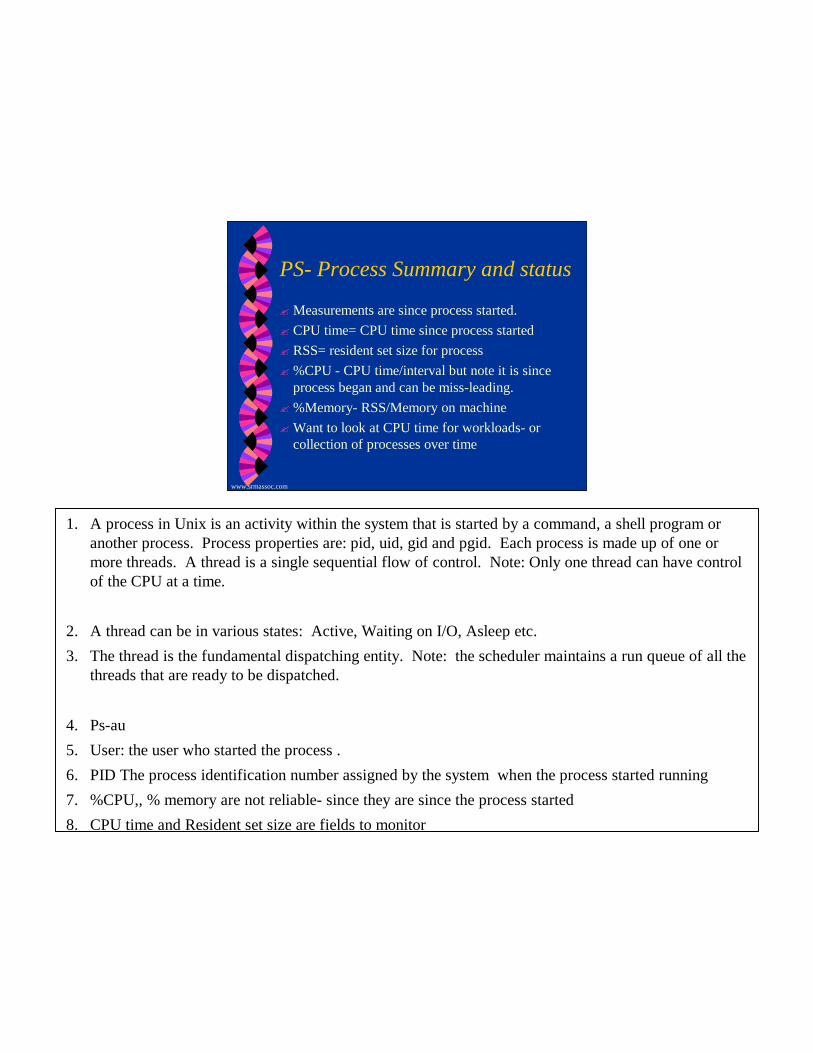
PS- Process Summary and status
? Measurements are since process started.? CPU time= CPU time since process started? RSS= resident set size for process ? %CPU - CPU time/interval but note it is since
process began and can be miss-leading.? %Memory- RSS/Memory on machine? Want to look at CPU time for workloads- or
collection of processes over time
1. A process in Unix is an activity within the system that is started by a command, a shell program or another process. Process properties are: pid, uid, gid and pgid. Each process is made up of one or more threads. A thread is a single sequential flow of control. Note: Only one thread can have control of the CPU at a time.
2. A thread can be in various states: Active, Waiting on I/O, Asleep etc.3. The thread is the fundamental dispatching entity. Note: the scheduler maintains a run queue of all the
threads that are ready to be dispatched.
4. Ps-au 5. User: the user who started the process .6. PID The process identification number assigned by the system when the process started running7. %CPU,, % memory are not reliable- since they are since the process started8. CPU time and Resident set size are fields to monitor
www.srmassoc.com
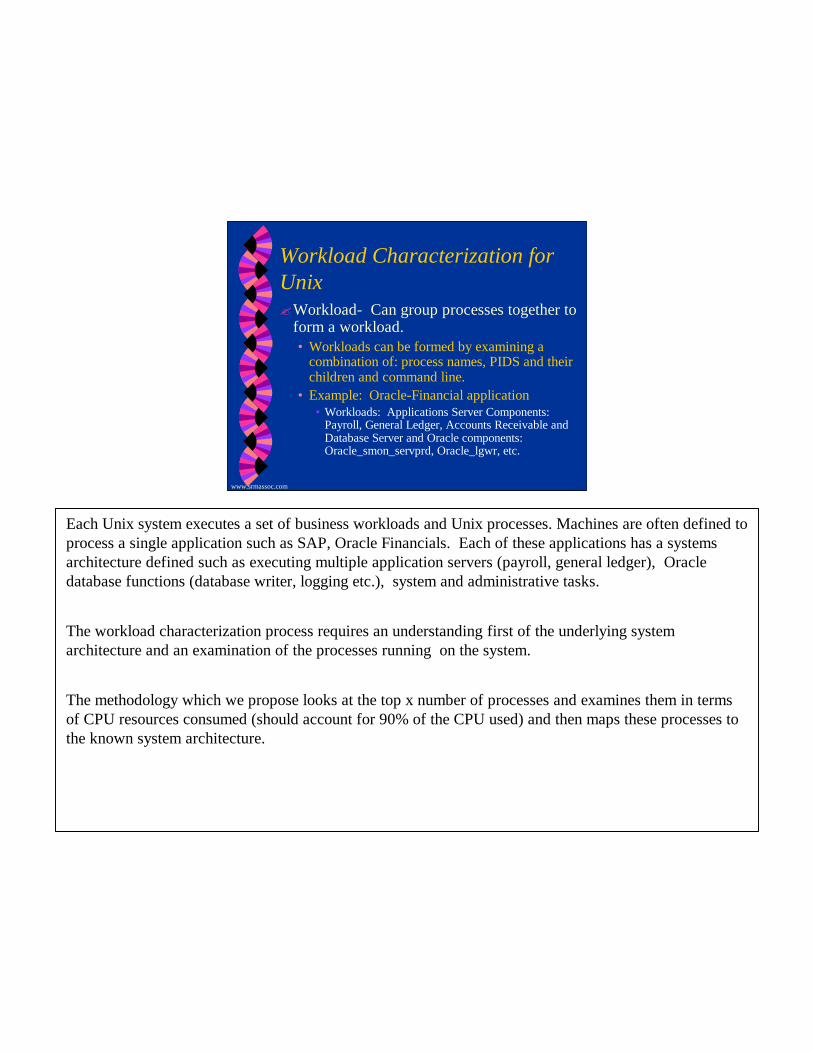
Workload Characterization for Unix?Workload- Can group processes together to
form a workload.• Workloads can be formed by examining a
combination of: process names, PIDS and their children and command line.
• Example: Oracle-Financial application• Workloads: Applications Server Components:
Payroll, General Ledger, Accounts Receivable and Database Server and Oracle components: Oracle_smon_servprd, Oracle_lgwr, etc.
Each Unix system executes a set of business workloads and Unix processes. Machines are often defined to process a single application such as SAP, Oracle Financials. Each of these applications has a systems architecture defined such as executing multiple application servers (payroll, general ledger), Oracle database functions (database writer, logging etc.), system and administrative tasks.
The workload characterization process requires an understanding first of the underlying system architecture and an examination of the processes running on the system.
The methodology which we propose looks at the top x number of processes and examines them in terms of CPU resources consumed (should account for 90% of the CPU used) and then maps these processes to the known system architecture.

www.srmassoc.com
Looking at Unix Processes -Workload Characterization? Two approaches working together
1. Look at top 25 processes2. Understand application architecture
? Combine understanding of architecture and top resource users to develop workload groupings.
• Build resource profiles by summarizing CPU time for workloads in time intervals which can be matched to sar or vmstat output

www.srmassoc.com
Creating Workload Utilization
? CPU utilization by workload is obtained by merging SAR and PS data by machine, date, time.• Need to delta CPU times for each User/pid between
time intervals recorded in ps• Sum of PS CPU <=SAR CPU utilization• Unaccounted CPU time =difference in SAR and PS
data• Create workloads by combination of
User/PID/command• Sum the CPU time for all workloads from ps, create
unaccounted workload
www.srmassoc.com
Looking at the Top 50 processes
? Look at the data over a specific time frame e.g., prime shift (9-5 vs. over the entire day because you will get a different result for top workloads)
?Remember to delta the records for CPU time - not for memory usage• Memory usage- look at avg or max RSS
www.srmassoc.com
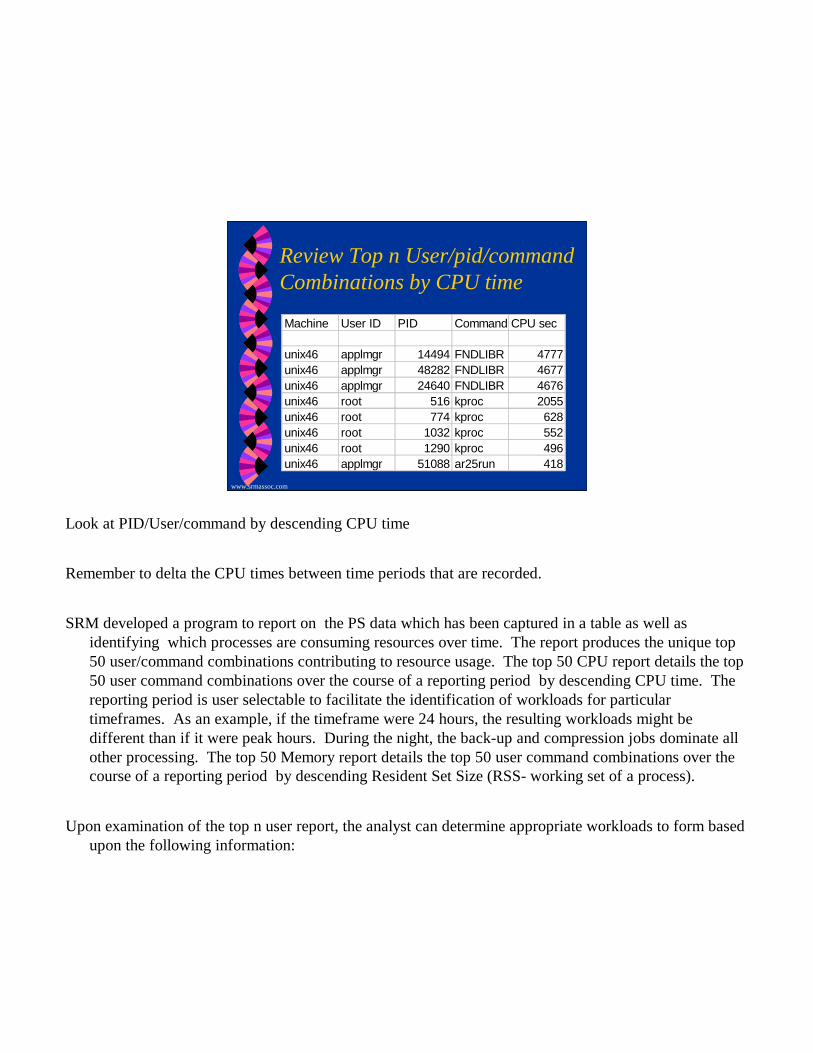
Review Top n User/pid/command Combinations by CPU time
Machine User ID PID Command StringCPU sec
unix46 applmgr 14494 FNDLIBR 4777unix46 applmgr 48282 FNDLIBR 4677unix46 applmgr 24640 FNDLIBR 4676unix46 root 516 kproc 2055unix46 root 774 kproc 628unix46 root 1032 kproc 552unix46 root 1290 kproc 496unix46 applmgr 51088 ar25run 418
Look at PID/User/command by descending CPU time
Remember to delta the CPU times between time periods that are recorded.
SRM developed a program to report on the PS data which has been captured in a table as well as identifying which processes are consuming resources over time. The report produces the unique top 50 user/command combinations contributing to resource usage. The top 50 CPU report details the top 50 user command combinations over the course of a reporting period by descending CPU time. The reporting period is user selectable to facilitate the identification of workloads for particular timeframes. As an example, if the timeframe were 24 hours, the resulting workloads might be different than if it were peak hours. During the night, the back-up and compression jobs dominate all other processing. The top 50 Memory report details the top 50 user command combinations over the course of a reporting period by descending Resident Set Size (RSS- working set of a process).
Upon examination of the top n user report, the analyst can determine appropriate workloads to form based upon the following information:
www.srmassoc.com
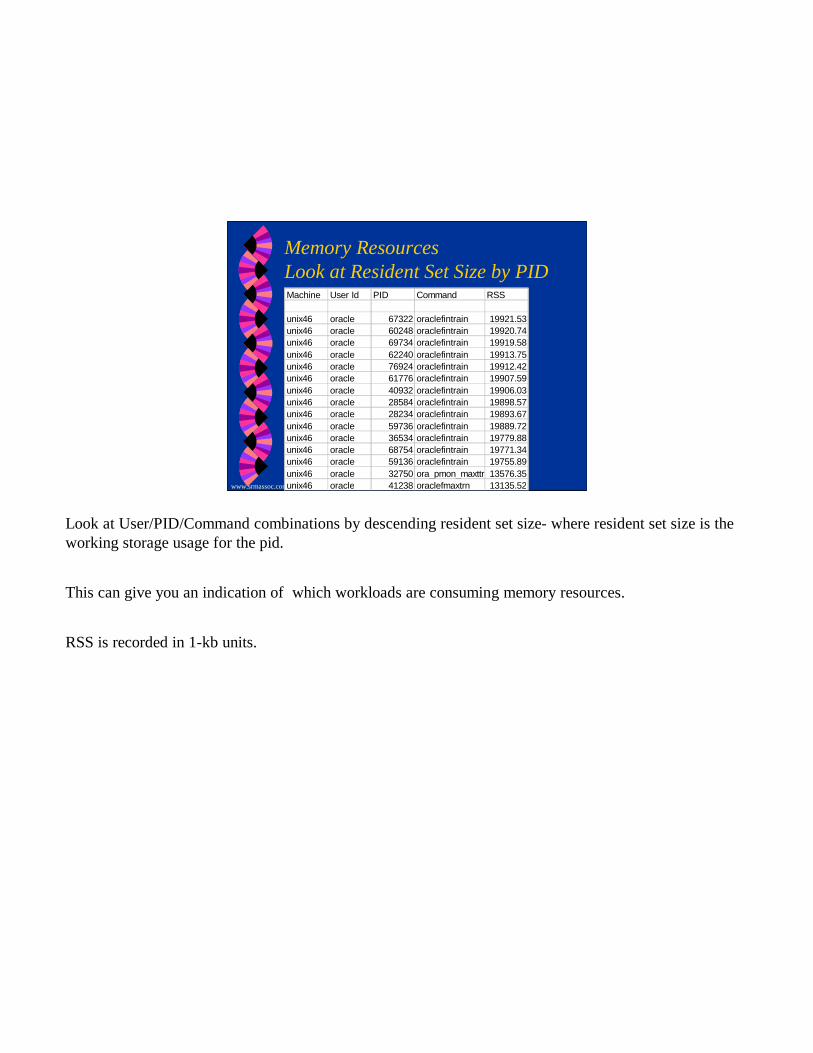
Memory ResourcesLook at Resident Set Size by PIDMachine User Id PID Command RSS
unix46 oracle 67322 oraclefintrain 19921.53unix46 oracle 60248 oraclefintrain 19920.74unix46 oracle 69734 oraclefintrain 19919.58unix46 oracle 62240 oraclefintrain 19913.75unix46 oracle 76924 oraclefintrain 19912.42unix46 oracle 61776 oraclefintrain 19907.59unix46 oracle 40932 oraclefintrain 19906.03unix46 oracle 28584 oraclefintrain 19898.57unix46 oracle 28234 oraclefintrain 19893.67unix46 oracle 59736 oraclefintrain 19889.72unix46 oracle 36534 oraclefintrain 19779.88unix46 oracle 68754 oraclefintrain 19771.34unix46 oracle 59136 oraclefintrain 19755.89unix46 oracle 32750 ora_pmon_maxttr 13576.35unix46 oracle 41238 oraclefmaxtrn 13135.52
Look at User/PID/Command combinations by descending resident set size- where resident set size is the working storage usage for the pid.
This can give you an indication of which workloads are consuming memory resources.
RSS is recorded in 1-kb units.
www.srmassoc.com
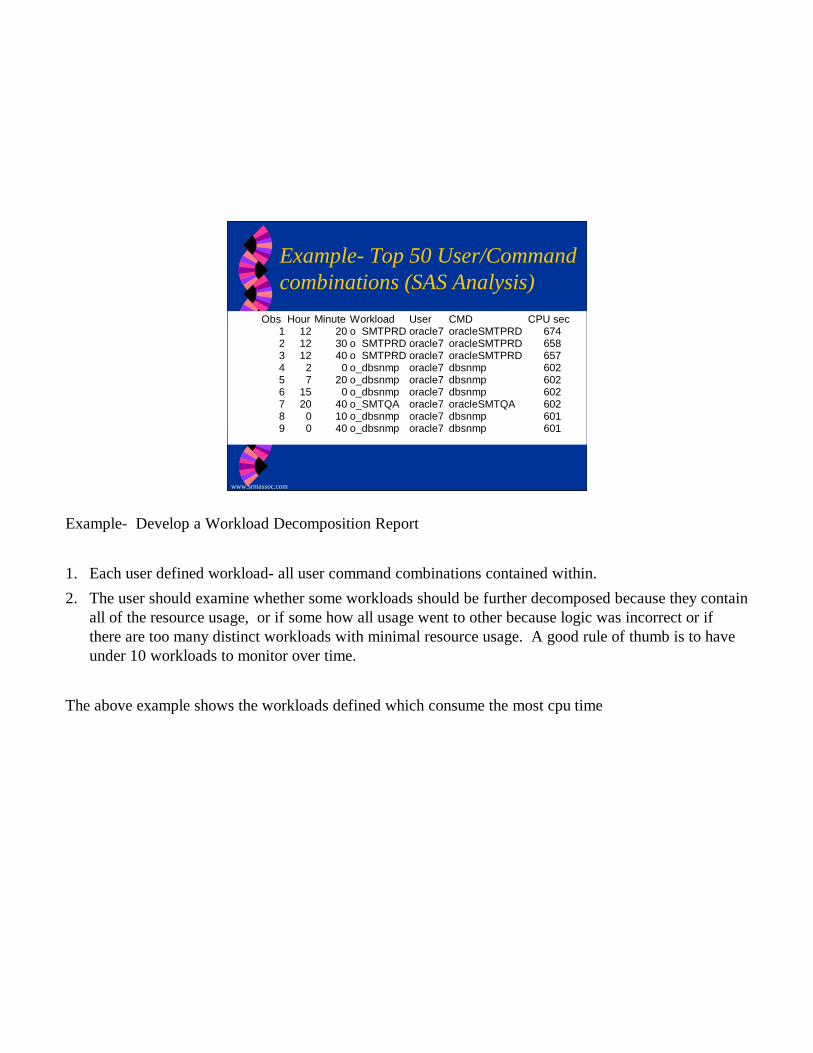
Example- Top 50 User/Command combinations (SAS Analysis)
Obs Hour Minute Workload User CMD CPU sec1 12 20 o_SMTPRD oracle7 oracleSMTPRD 6742 12 30 o_SMTPRD oracle7 oracleSMTPRD 6583 12 40 o_SMTPRD oracle7 oracleSMTPRD 6574 2 0 o_dbsnmp oracle7 dbsnmp 6025 7 20 o_dbsnmp oracle7 dbsnmp 6026 15 0 o_dbsnmp oracle7 dbsnmp 6027 20 40 o_SMTQA oracle7 oracleSMTQA 6028 0 10 o_dbsnmp oracle7 dbsnmp 6019 0 40 o_dbsnmp oracle7 dbsnmp 601
Example- Develop a Workload Decomposition Report
1. Each user defined workload- all user command combinations contained within.2. The user should examine whether some workloads should be further decomposed because they contain
all of the resource usage, or if some how all usage went to other because logic was incorrect or if there are too many distinct workloads with minimal resource usage. A good rule of thumb is to have under 10 workloads to monitor over time.
The above example shows the workloads defined which consume the most cpu time

www.srmassoc.com
Planning for systems:Need to partner with Applications/Business Groups? Develop resource profiles of key business functions for
system.• Identify business workloads- e.g., groups of Unix
processes• Identify key volume indicators/business metrics to
forecast growth? Obtain volume forecasts for growth for new system
• based on usage patterns of old systems• based on interview information
? Develop models of current and future application requirements.
? Document Service level requirements

www.srmassoc.com
Planning for OLTP-DB Applications? Monitor resource usage
• System, Workload, Database and Network requirements
• Develop resource profiles of business usage• Understand peak resource requirements (e.g, 1st and
3rd week of month)? Review system, application and database performance-
e.g., Is system well tuned?• Does database require any modifications to improve
performance
www.srmassoc.com
Smarttime/PeoplesoftApplication- Analysis? 3- Cytrix NT servers functioning as the applications server
running the Smarttime application - users connect to NT server in order to enter timesheets.
? 2 Unix machines - 1 hosting the Smarttime database and 1 hosting the Peoplesoft databases
? Batch job is run 2-3 times daily and can be scheduled.? Measured logged on users into Oracle, Cytrix servers and
number of users entering data into a particular Oracle table.
www.srmassoc.com
Analysis Focus
? Analysis of CPU requirements per user for Smarttime on-line data entry work on Unix56.
• CPU time by workload and CPU per user graphics generated
? Analysis of CPU and memory requirements for Smarttime batch workloads- Rules processing and pre-processing work
• CPU time by workload and memory graphics generated
? Analysis of CPU and memory impact to Peoplesoft database server

www.srmassoc.com
CPU busy vs # of UsersNote:Unix doesn’t providedata onthroughput!Obtain user counts, session information fromNT, Oracle
www.srmassoc.com
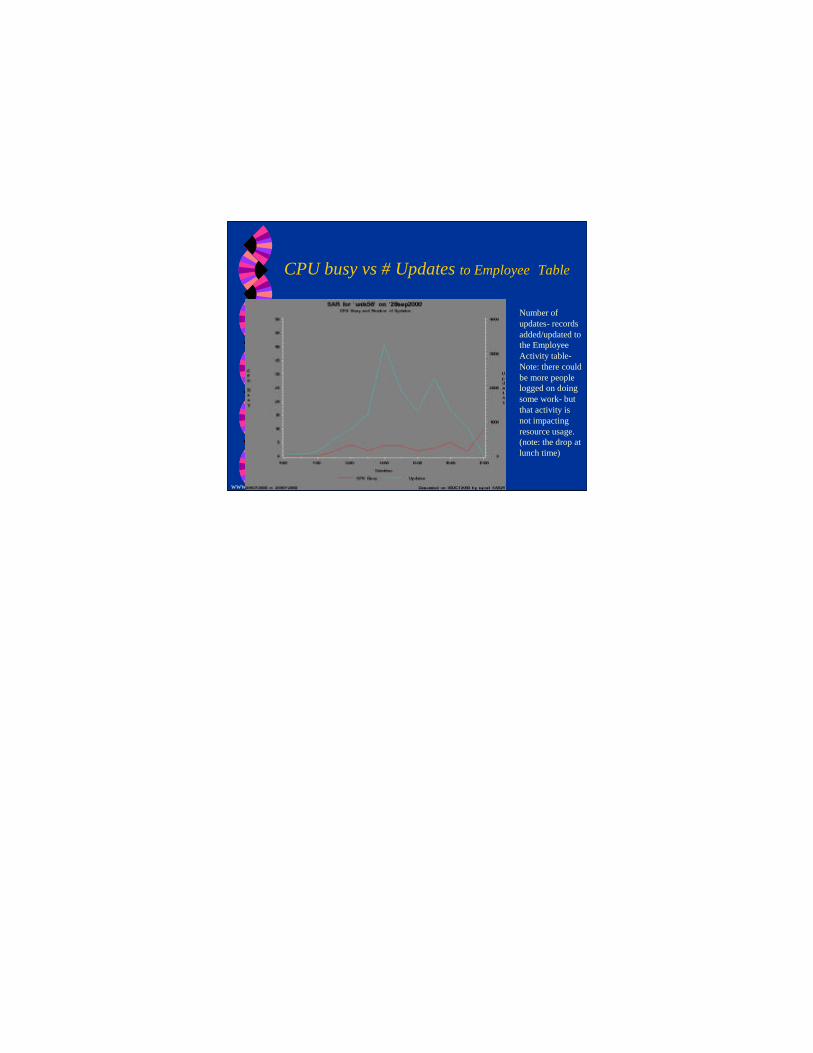
CPU busy vs # Updates to Employee Table
Number of updates- recordsadded/updated tothe Employee Activity table-Note: there couldbe more people logged on doing some work- butthat activity isnot impacting resource usage.(note: the drop at lunch time)
www.srmassoc.com
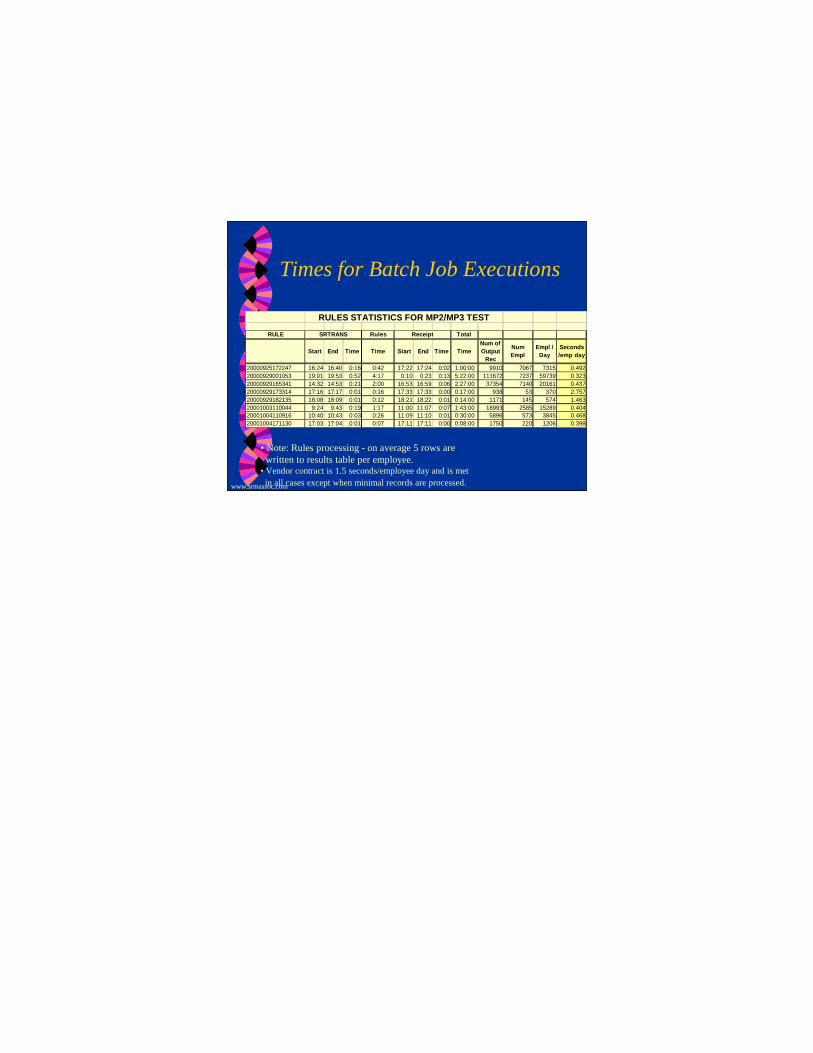
Times for Batch Job Executions
RULES STATISTICS FOR MP2/MP3 TEST
RULE Rules Total
Start End Time Time Start End Time TimeNum of Output
Rec
Num Empl
Empl / Day
Seconds /emp day
20000925172247 16:24 16:40 0:16 0:42 17:22 17:24 0:02 1:00:00 9910 7067 7315 0.49220000929001053 19:01 19:53 0:52 4:17 0:10 0:23 0:13 5:22:00 111672 7237 59739 0.32320000929165341 14:32 14:53 0:21 2:00 16:53 16:59 0:06 2:27:00 37354 7140 20161 0.43720000929173314 17:16 17:17 0:01 0:16 17:33 17:33 0:00 0:17:00 938 53 370 2.75720000929182135 18:08 18:09 0:01 0:12 18:21 18:22 0:01 0:14:00 1171 145 574 1.46320001003110044 9:24 9:43 0:19 1:17 11:00 11:07 0:07 1:43:00 18993 2585 15289 0.40420001004110916 10:40 10:43 0:03 0:26 11:09 11:10 0:01 0:30:00 5896 573 3845 0.46820001004171130 17:03 17:04 0:01 0:07 17:11 17:11 0:00 0:08:00 1750 220 1206 0.398
SRTRANS Receipt
•Note: Rules processing - on average 5 rows are written to results table per employee.
•Vendor contract is 1.5 seconds/employee day and is metin all cases except when minimal records are processed.

www.srmassoc.com
CPU Usage by Shift
Note: CPU usage is around 25-30% for Batch processing after 18:00
www.srmassoc.com
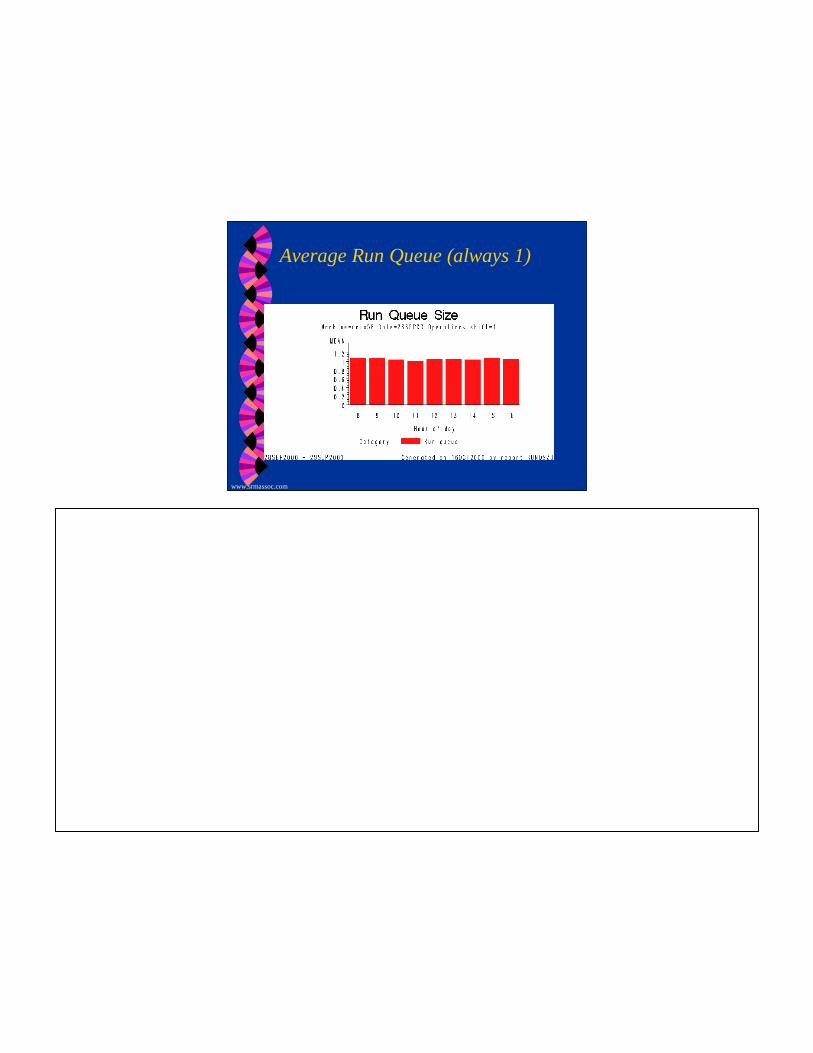
Average Run Queue (always 1)
www.srmassoc.com
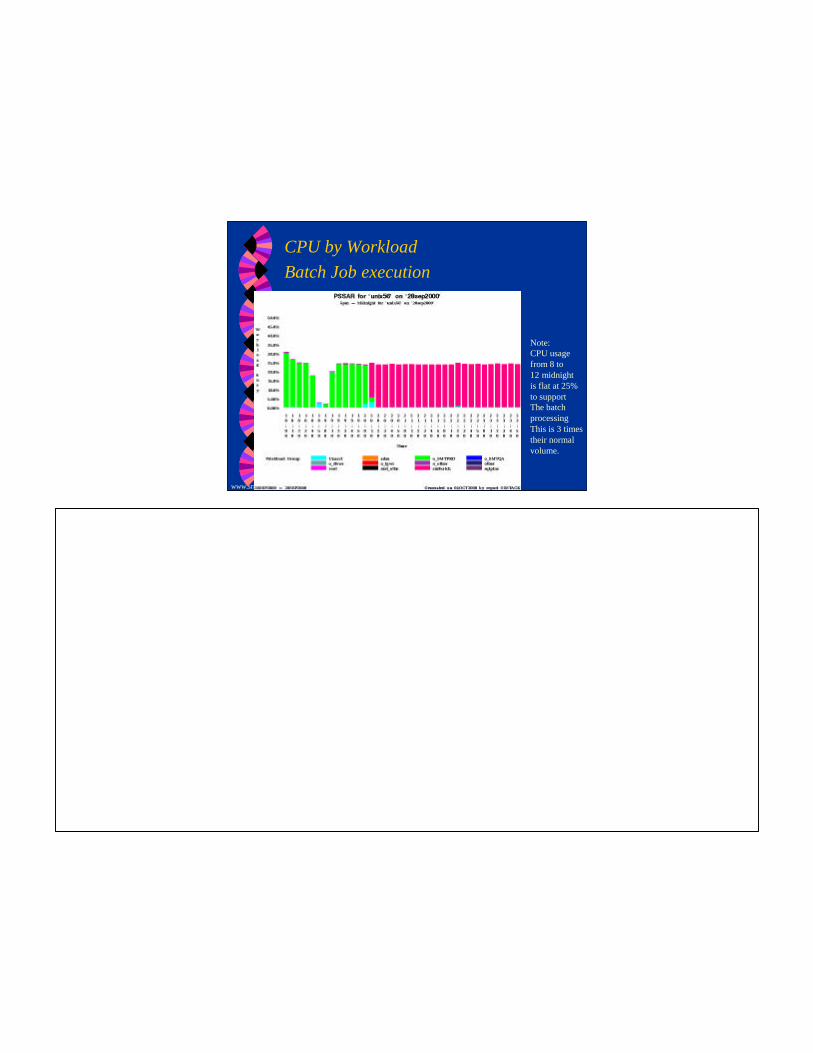
CPU by Workload Batch Job execution
Note:CPU usagefrom 8 to12 midnightis flat at 25%to supportThe batch processingThis is 3 timestheir normalvolume.

www.srmassoc.com
Creating Workload Utilization? Reminder: CPU utilization by workload is
obtained by merging SAR and PS data by machine, date, time.• Need to delta CPU times for each User/pid between
time intervals recorded in ps• Sum of PS CPU <=SAR CPU utilization• Unaccounted CPU time =difference in SAR and PS
data• Create workloads by combination of
User/PID/command• Sum the CPU time for all workloads from ps, create
unaccounted workload

www.srmassoc.com
CPU Busy by WorkloadNote:CPU usage forOn-line workis minimal.
Batch isapproximately25%
www.srmassoc.com
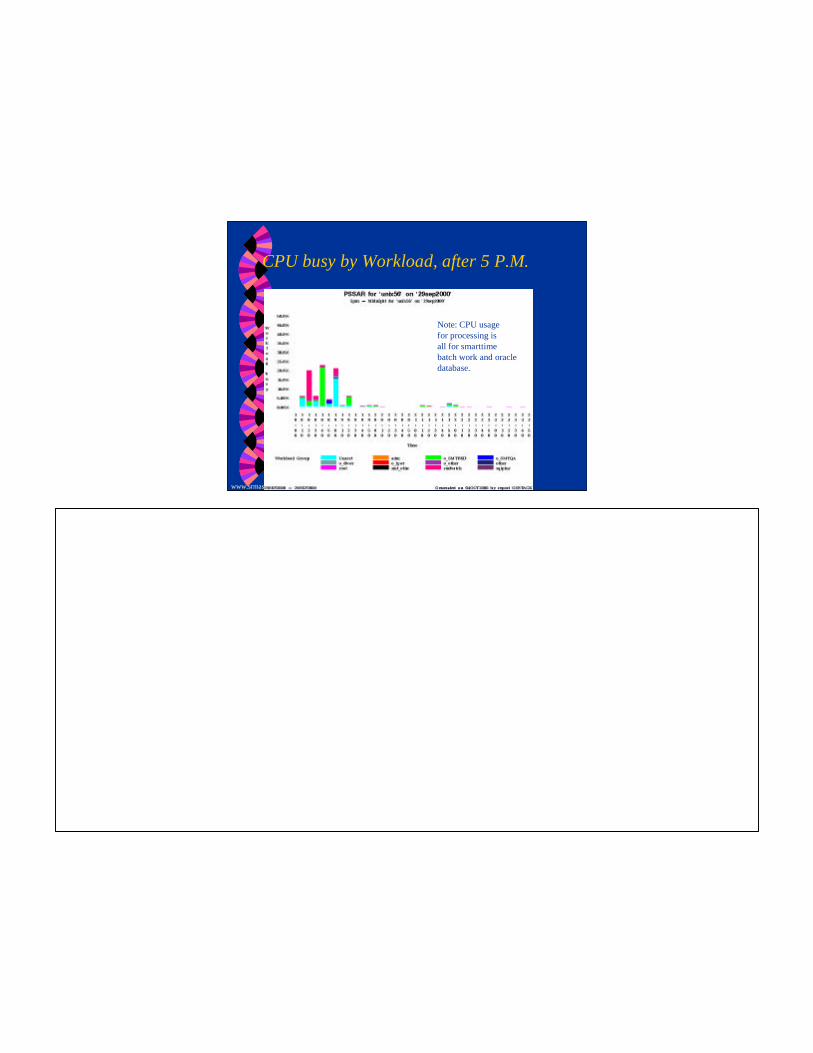
CPU busy by Workload, after 5 P.M.
Note: CPU usagefor processing isall for smarttimebatch work and oracle database.
www.srmassoc.com
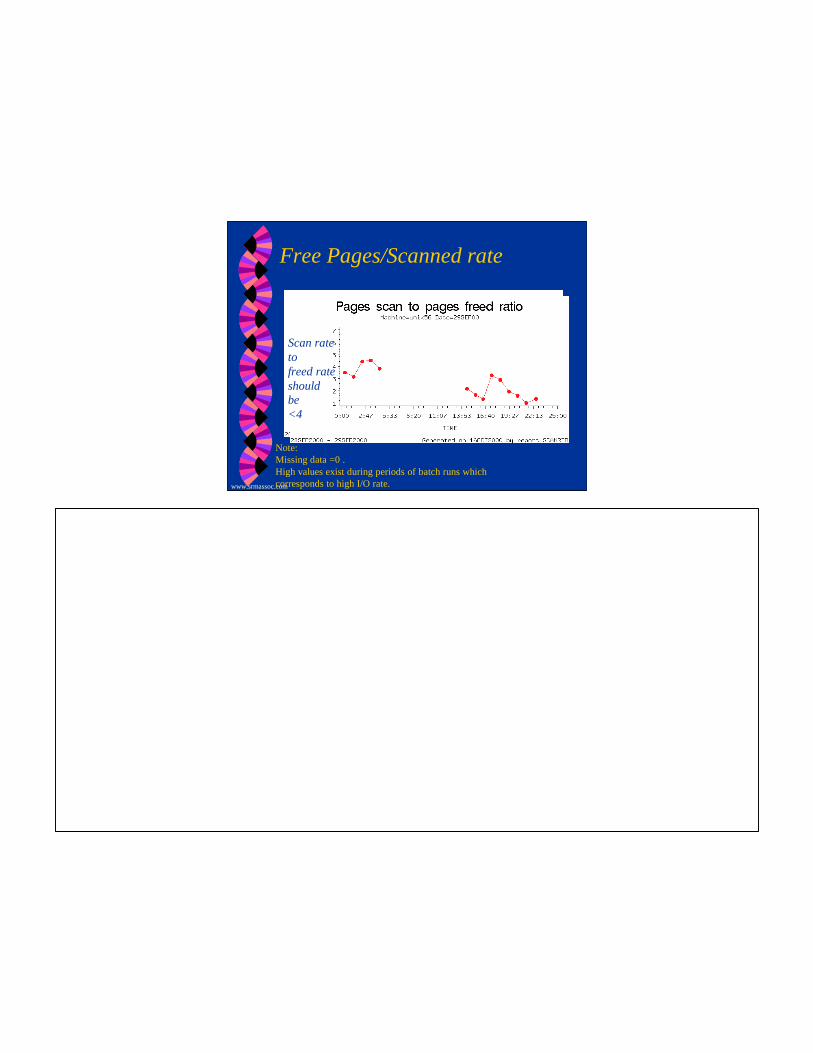
Free Pages/Scanned rate
Note:Missing data =0 . High values exist during periods of batch runs whichcorresponds to high I/O rate.
Scan rate to freed rateshould be<4
www.srmassoc.com
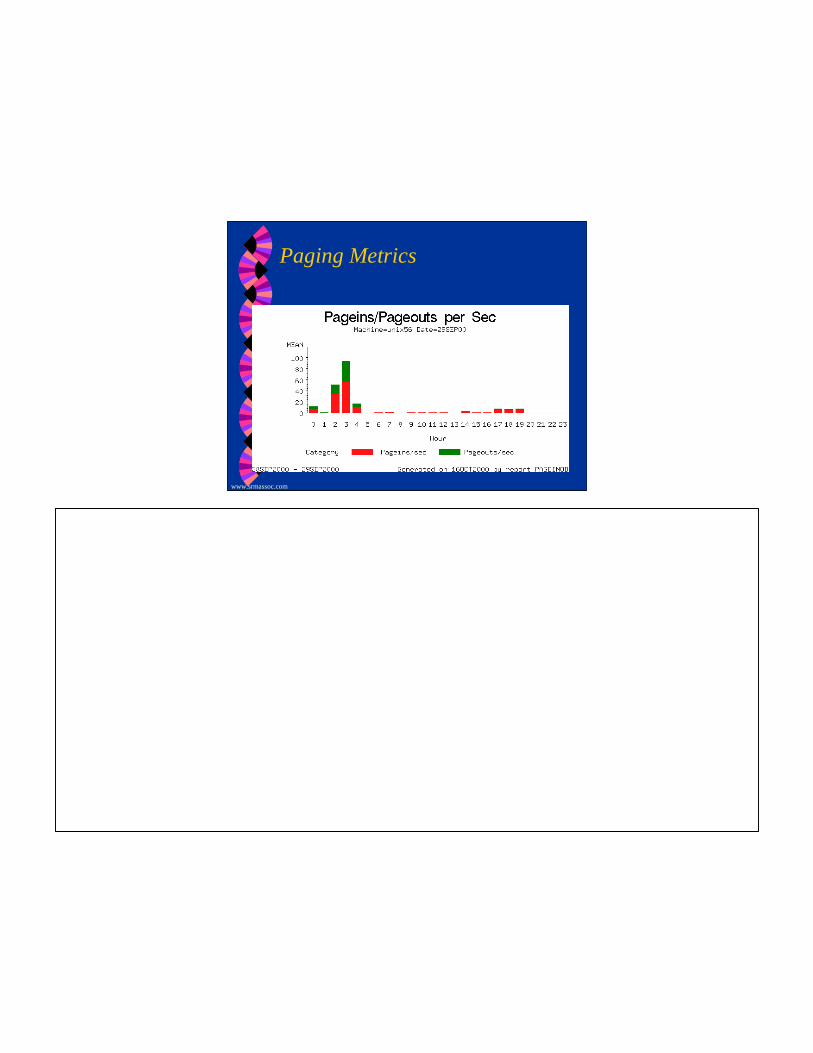
Paging Metrics

www.srmassoc.com
Total I/O rate for Week of 9/26 Across All SSA Disks
Note: Increase in I/O activity on 9/29late in the afternoonTo support batch work.
www.srmassoc.com
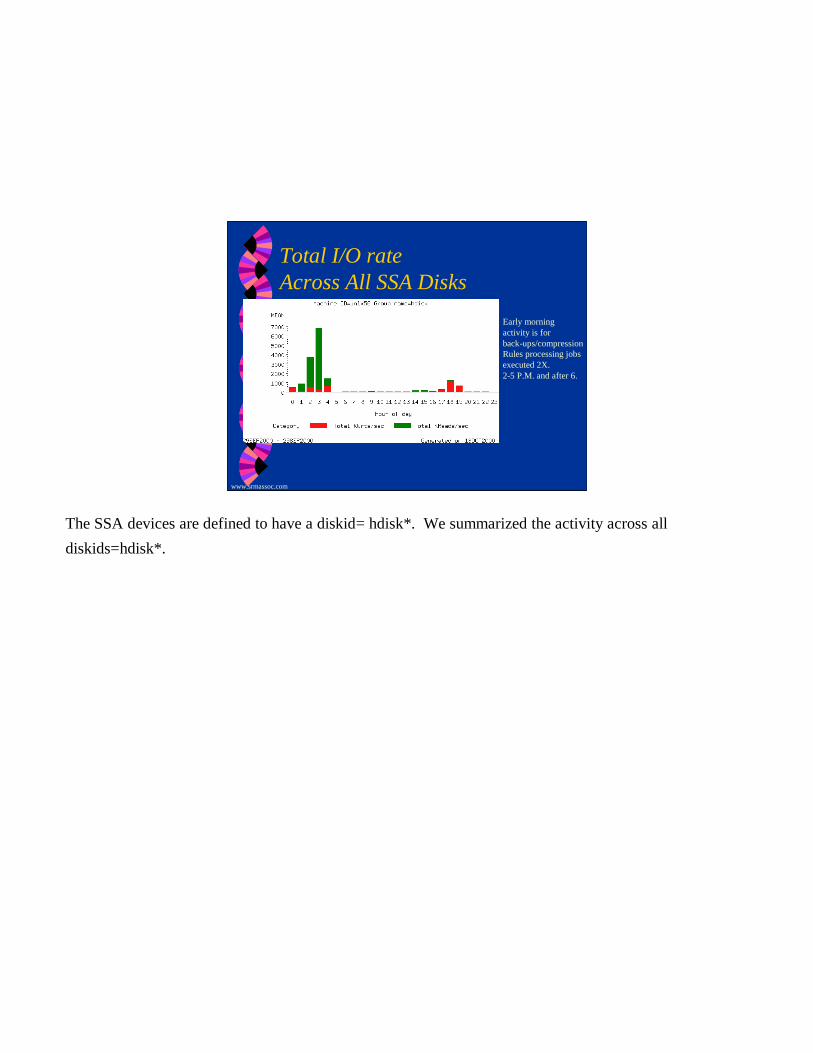
Total I/O rate Across All SSA Disks
Early morning activity is for back-ups/compressionRules processing jobsexecuted 2X.2-5 P.M. and after 6.
The SSA devices are defined to have a diskid= hdisk*. We summarized the activity across all diskids=hdisk*.
www.srmassoc.com
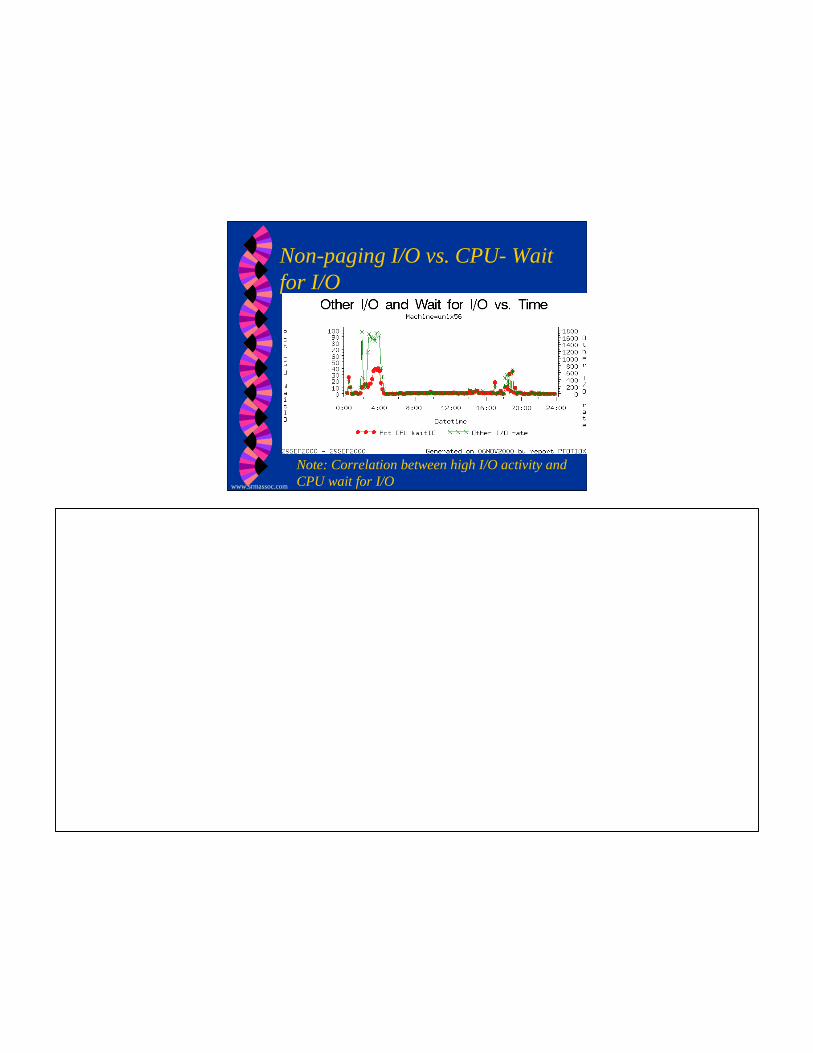
Non-paging I/O vs. CPU- Wait for I/O
Note: Correlation between high I/O activity and CPU wait for I/O

www.srmassoc.com
Total I/O rate for Sept 29th Across All EMC Disks
Data pattern is same as for SSA disks. Data is spread across both types.
The EMC devices are defined to have a diskid= hpower*. We summarized the activity across alldiskids=hpower*.
www.srmassoc.com
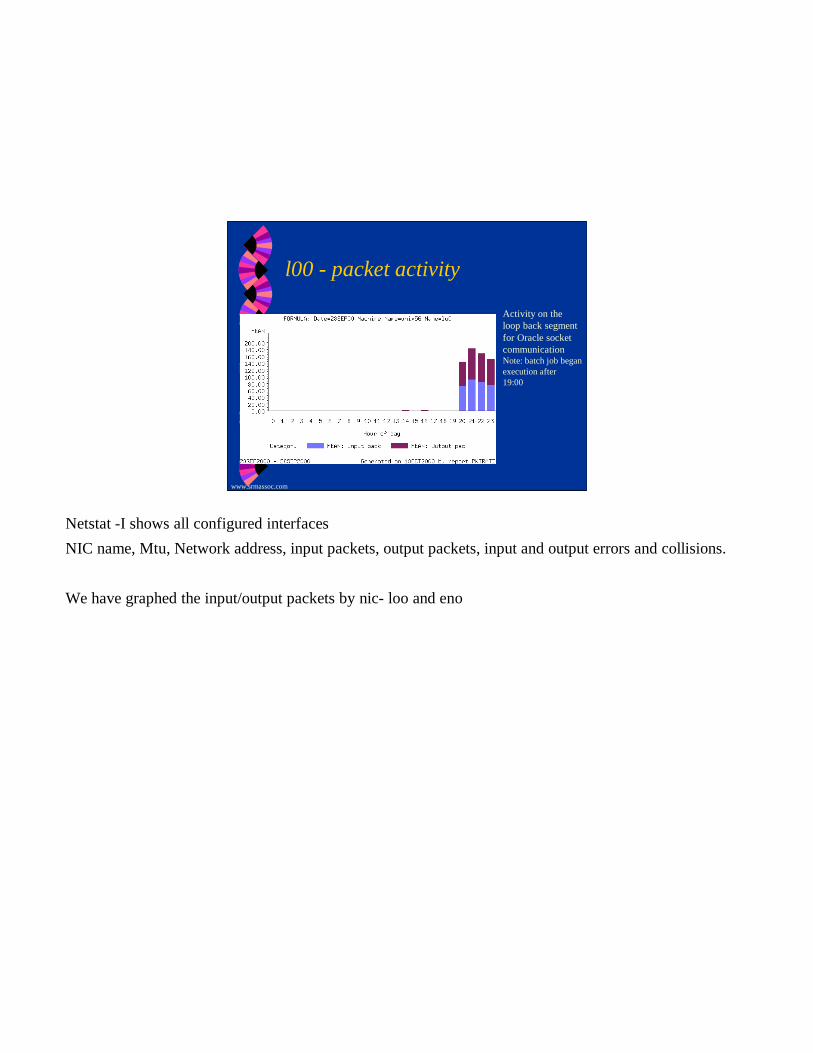
l00 - packet activity
Activity on theloop back segmentfor Oracle socket communicationNote: batch job beganexecution after19:00
Netstat -I shows all configured interfacesNIC name, Mtu, Network address, input packets, output packets, input and output errors and collisions.
We have graphed the input/output packets by nic- loo and eno
www.srmassoc.com
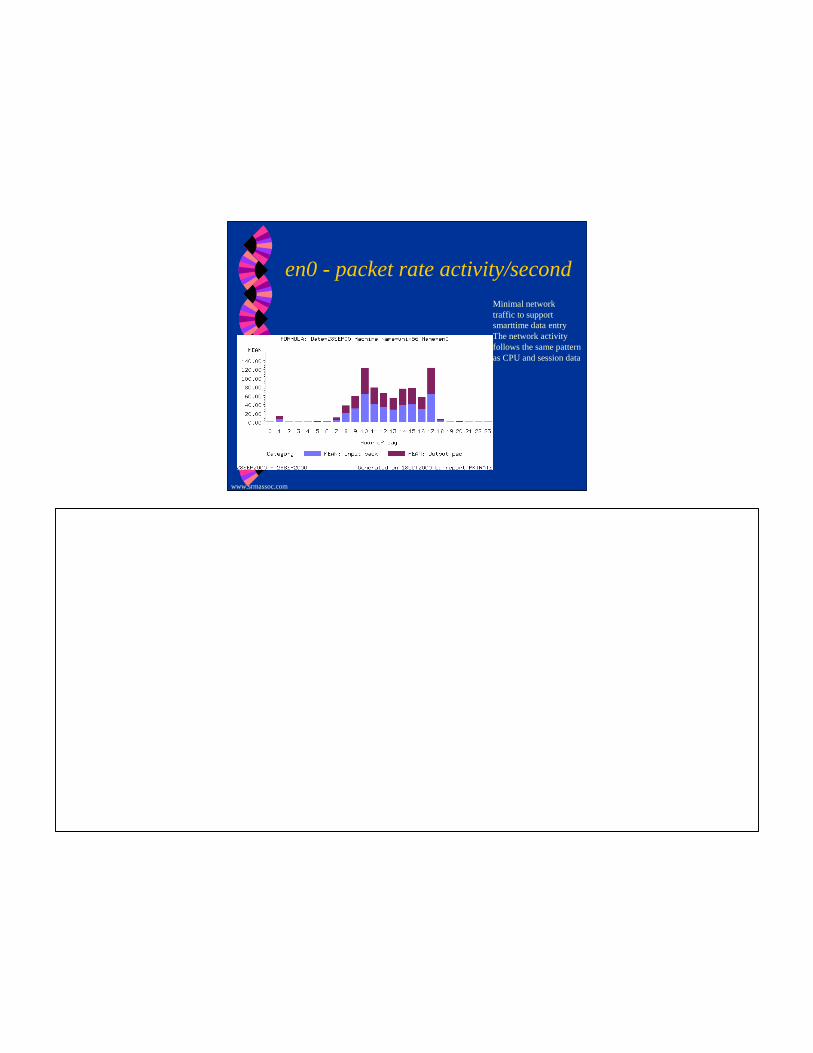
en0 - packet rate activity/secondMinimal network traffic to support smarttime data entryThe network activity follows the same pattern as CPU and session data
www.srmassoc.com
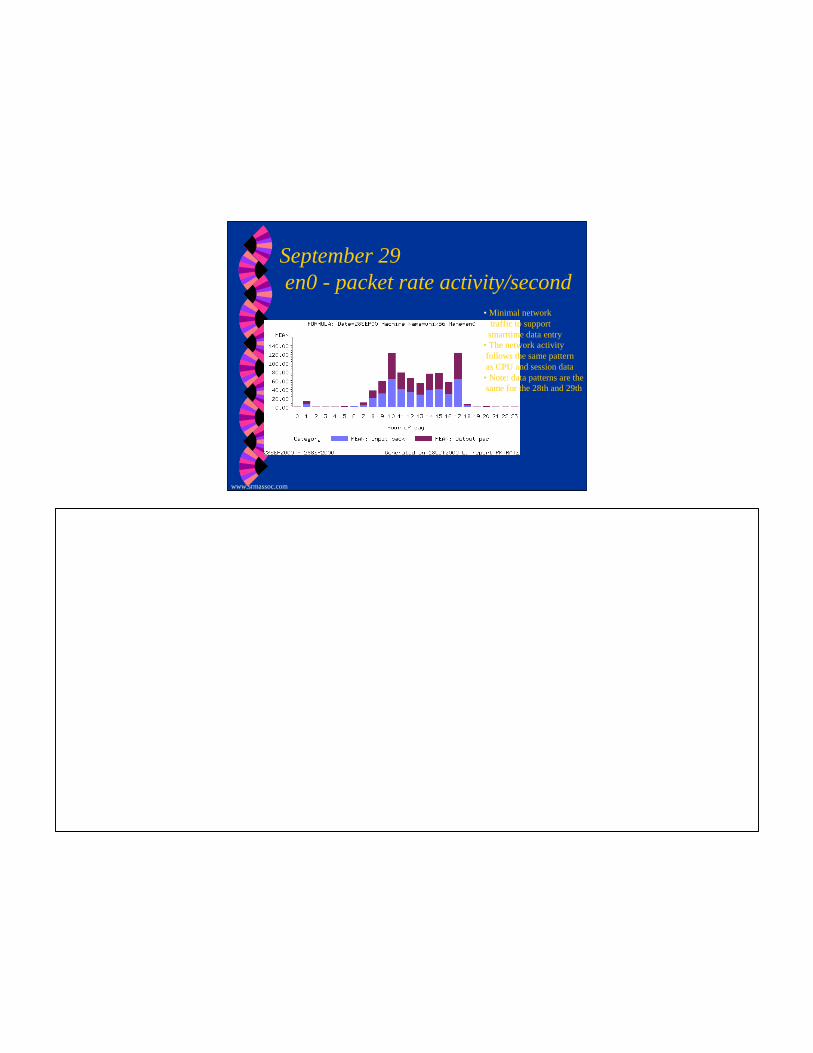
September 29en0 - packet rate activity/second
•Minimal network traffic to support
smarttime data entry•The network activity follows the same pattern as CPU and session data
•Note: data patterns are thesame for the 28th and 29th

www.srmassoc.com
Analysis Results? Smarttime data entry resource requirements are
minimal.• CPU requirements are <5% to support 70 active users• Minimal I/O activity observed for data entry
? Batch processing resources are dependent upon the number of employees processed in a run and is scheduable work.• CPU requirements are <25% to process a typical load• Some paging I/O observed due to large file I/O -but this
is over a limited time frame
www.srmassoc.com
Recommendations
? Smartime workload resource requirements are minimal and this work can correside with Peoplesoft payroll system and reporting system.
?Rules processing run can do large file I/O for limited periods.• Paging and memory should be looked at in
detail during a scheduled execution of this job.
www.srmassoc.com
Summary- What we discussed
?Review of Standard Measurement Collectors- sar, ps, iostat, vmstat, netstat
?Understanding basics in Unix performance measurement data
?Workload Characterization?Reporting systems for Unix performance
• Reports and displays of performance data
? Sizing an application with Unix data

www.srmassoc.com
References
? IBM Redbooks- RS/6000- all performance and storage publications? IBM Redbooks, RS/6000 Performance and Tuning Guide ? IBM Redbooks- RS/6000 Performance tools in focus? IBM RS/6000 homepage.
http://www.rs6000.ibm.com/resource/aix_resource/Pubs/? Sun Homepage http://www.sun.com/servers/? Adrian Cockcroft, Sun Performance and Tuning? Brian Wong, Configuration and Capacity Planning for Solaris Systems? Mike Loukides, System Performance Tuning, O’Reilly Publishing? Unix in a Nutshell, O’Reilly Publishing