Embed Size (px)
Citation preview

8/6/2019 Unleashing the Potential of Renewable Energy in India
http://slidepdf.com/reader/full/unleashing-the-potential-of-renewable-energy-in-india 1/60
A W O R L D B A N K S T U D Y
Gevorg Sargsyan, Mikul Bhatia,
Sudeshna Ghosh Banerjee,
Krishnan Raghunathan, Ruchi Soni
Unleashing the
Potential of Renewable
Energy in India

8/6/2019 Unleashing the Potential of Renewable Energy in India
http://slidepdf.com/reader/full/unleashing-the-potential-of-renewable-energy-in-india 2/60
8/6/2019 Unleashing the Potential of Renewable Energy in India
http://slidepdf.com/reader/full/unleashing-the-potential-of-renewable-energy-in-india 3/60
W O R L D B A N K S T U D Y
Unleashing the Potential ofRenewable Energy in IndiaGevorg Sargsyan
Mikul Bhatia
Sudeshna Ghosh Banerjee
Krishnan Raghunathan
Ruchi Soni
8/6/2019 Unleashing the Potential of Renewable Energy in India
http://slidepdf.com/reader/full/unleashing-the-potential-of-renewable-energy-in-india 4/60
Copyright © 2011The International Bank for Reconstruction and Development/The World Bank1818 H Street, NWWashington, DC 20433Telephone: 202-473-1000
Internet: www.worldbank.org
1 2 3 4 14 13 12 11
World Bank Studies are published to communicate the results of the Bank’s work to the developmentcommunity with the least possible delay. The manuscript of this paper therefore has not been prepared inaccordance with the procedures appropriate to formally-edited texts. This volume is a product of the staff of the International Bank for Reconstruction and Development / The World Bank. The findings, interpre-tations, and conclusions expressed in this volume do not necessarily reflect the views of the ExecutiveDirectors of The World Bank or the governments they represent.
The World Bank does not guarantee the accuracy of the data included in this work. The boundaries,colors, denominations, and other information shown on any map in this work do not imply any judge-ment on the part of The World Bank concerning the legal status of any territory or the endorsement or
acceptance of such boundaries.
Rights and PermissionsThe material in this publication is copyrighted. Copying and/or transmiing portions or all of this
work without permission may be a violation of applicable law. The International Bank for Reconstruc-tion and Development/The World Bank encourages dissemination of its work and will normally grantpermission to reproduce portions of the work promptly.
For permission to photocopy or reprint any part of this work, please send a request with completeinformation to the Copyright Clearance Center Inc., 222 Rosewood Drive, Danvers, MA 01923, USA;telephone: 978-750-8400; fax: 978-750-4470; Internet: www.copyright.com.
All other queries on rights and licenses, including subsidiary rights, should be addressed to the Of-fice of the Publisher, The World Bank, 1818 H Street NW, Washington, DC 20433, USA; fax: 202-522-2422;e-mail: [email protected].
ISBN: 978-0-8213-8780-1eISBN: 978-0-8213-8790-0DOI: 10.1596/978-0-8213-8780-1
Library of Congress Cataloging-in-Publication DataUnleashing the potential of renewable energy in India / Gevorg Sargsyan ... [et al.]. p. cm. Includes bibliographical references. ISBN 978-0-8213-8780-1 -- ISBN 978-0-8213-8790-0 (electronic) 1. Energy development--India. 2. Renewable energy--India. I. Sargsyan, Gevorg, 1973- II. World Bank.HD9502.I42U55 2011
333.79’40954--dc222011014931
Cover photo: “A Wind Project in India” taken by Gurmeet Sapal.
8/6/2019 Unleashing the Potential of Renewable Energy in India
http://slidepdf.com/reader/full/unleashing-the-potential-of-renewable-energy-in-india 5/60
iii
Contents
Acknowledgments .....................................................................................................................v
Acronyms and Abbreviations ............................................................................................... vii
Executive Summary ..................................................................................................................ix
1. Why: Role of Renewable Energy in India ......................................................................... 1
Contribution to India’s Energy Future ............................................................................ 1
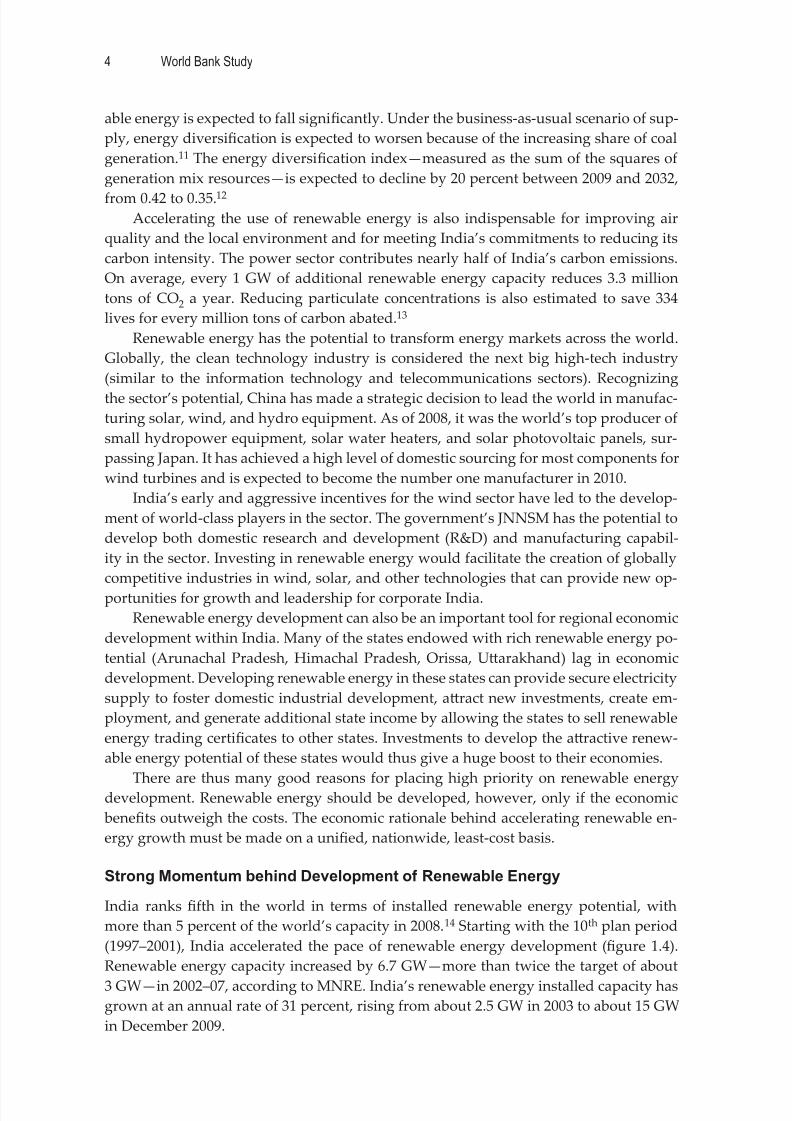
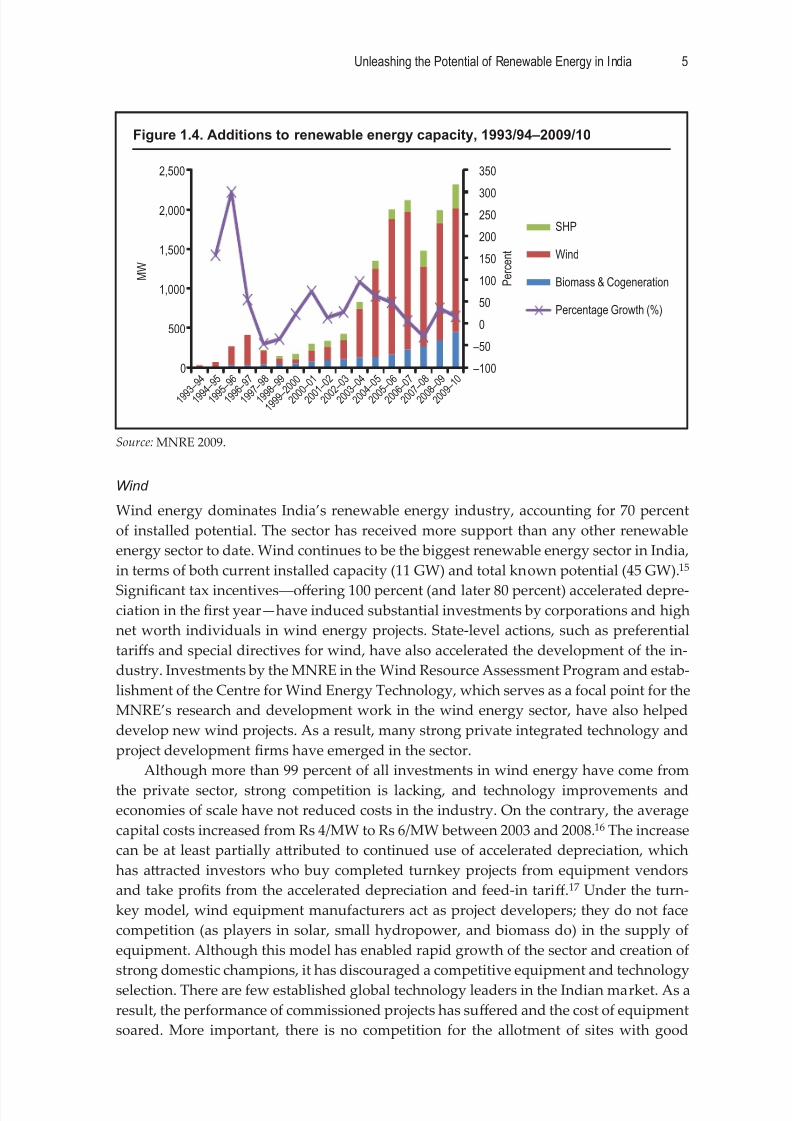
Strong Momentum behind Development of Renewable Energy ................................ 4
India’s Ambitious Targets for Renewable Energy Development ................................. 7
2. How Much: Economic and Financial Potential of Renewable Energy ...................... 11Economic Viability of Renewable Energy Generation ................................................ 12
Viability of Renewable Energy Generation from the Perspective of the Utilityand Developer ........................................................................................................... 18
3. What: Establishment of an Enabling Environment for Renewable EnergyDevelopment ..................................................................................................................... 22
The Current Operating Environment ............................................................................ 22
The Proposed Operating Environment .......................................................................... 26
The Failure of Current Processes ................................................................................... 29
What Can Be Done?........................................................................................................... 31
Challenges and Opportunities ........................................................................................ 38
Boxes
Box 2.1. Creating a renewable energy project database .....................................................11
Box 2.2. Coal and gas shortages in India ...............................................................................13
Box 2.3. Definition of economic cost and benefit ..................................................................15
Box 2.4. Definition of financial cost and benefit ...................................................................18
Box 3.1. Stages of introduction and use of policy instruments ..........................................32
Box 3.2. Aractiveness of renewable energy projects for developers ................................34
Figures
Figure 1. Additions to renewable energy capacity, 1993/94–2009/10 ................................ix
Figure 2. Economic competitiveness of wind, biomass, and small hydropower ............xii
Figure 1.1. Annual average and peak power deficits, 2005/06–2008/09 ..............................1
Figure 1.2. Potential and installed renewable energy capacity, by type ............................3
Figure 1.3. Actual (2007–08) and projected (2031–32) installed grid capacity, bytype of energy ..................................................................................................................... 3
Figure 1.4. Additions to renewable energy capacity, 1993/94–2009/10 ..............................5Figure 1.5. Potential capacity, installed capacity, and cost of generation of
renewable energy sources, by state as of fiscal year 2009–2010 ...................................8

8/6/2019 Unleashing the Potential of Renewable Energy in India
http://slidepdf.com/reader/full/unleashing-the-potential-of-renewable-energy-in-india 6/60
iv Contents
Figure 1.6. Cost and use of renewable energy potential ....................................................... 9
Figure 2.1. Avoided cost of coal-based generation ..............................................................14
Figure 2.2. Economic cost of generating power using renewable energy, by state(Rs/kWh) .............................................................................................................................16
Figure 2.3. Economic competitiveness of wind, biomass, and small hydropower .........17
Figure 2.4. Short-term traded cost of electricity, 2007–09 ..................................................18
Figure 2.5. Financial cost of renewable energy from the utility’s perspective, by state ............................................................................................................................... 19
Figure 2.6. Gap between cost and tariff s of renewable energy, by state andenergy source ....................................................................................................................20
Figure 3.1. Key legislation and increases in renewable energy capacity, 1993/94–2009/10 .................................................................................................................................23
Figure 3.2. Project allocation and development cycle of small hydropower project
in Himachal Pradesh .........................................................................................................30
Tables
Table 1. Renewable energy barriers and suggested solutions ......................................... xiii
Table 2.1. Resources required to achieve 40 GW of renewable energy ............................20
Table 3.1. Status of renewable purchase obligations, by state (2008–09) ..........................24
Table 3.2. Roles of state and central government agencies in policy development,regulation, and promotion of renewable energy ..........................................................25
Table 3.3. Renewable energy barriers and suggested solutions ........................................26

8/6/2019 Unleashing the Potential of Renewable Energy in India
http://slidepdf.com/reader/full/unleashing-the-potential-of-renewable-energy-in-india 7/60
v
Acknowledgments
This study was prepared by a World Bank team led by Gevorg Sargsyan (South Asia
Sustainable Development Energy—SASDE). The core team consisted of Sudeshna
Ghosh Banerjee (SASDE), Krishnan Raghunathan (SASDE consultant), and Ruchi Soni
(SASDE). Mikul Bhatia (SASDE) led the team in early stages of the work and Ashish
Khanna (SASDE) led the dissemination stage.
The team benefied greatly from the directions and contributions provided by,
Bhavna Bhatia (World Bank Institute), who also coordinated the dialog with key stake-
holders, as well as Venkata Pui (Energy Transport and Water—ETWEN ), Anjali Garg
(SASDE), Priya Barua (SASDE), and Late Paramjit Singh Dhingra (SASDE). The team
is immensely thankful to Anil Cabraal (ETWEN) for guiding us through the length ofthe study and providing key insights on renewable energy industry with specific em-
phasis on developing countries. The team is also grateful to the peer reviewers Richard
J. Spencer (East Asia Sustainable Development—EASVS), Chandrasekar Govindarajalu
(Middle East and North Africa Sustainable Development—MNSSD), and Luis Alberto
Andres (South Asia Sustainable Development—SASSD) for their insightful inputs. We
especially wish to thank Salman Zaheer (Sector Manager—SASDE) for his constructive
guidance and valuable support during the preparation of the study.
The study greatly benefited from the underlying study prepared by staff of Pricewa-
terhouseCoopers (Private) Limited, who interacted with renewable energy developers
and other industry stakeholders to share data and first-hand experiences. In addition,the team would like to thank counterparts in the Ministry of New and Renewable En-
ergy (MNRE) and Indian Renewable Energy Development Agency (IREDA) who pro-
vided guidance and inputs through the assignment. The firm of Ernst & Young, India,
prepared the initial desk study inputs on the renewable energy sector in India.
This team is grateful for the funding received from Energy Sector Management As-
sistance Program (ESMAP).

8/6/2019 Unleashing the Potential of Renewable Energy in India
http://slidepdf.com/reader/full/unleashing-the-potential-of-renewable-energy-in-india 8/60
8/6/2019 Unleashing the Potential of Renewable Energy in India
http://slidepdf.com/reader/full/unleashing-the-potential-of-renewable-energy-in-india 9/60
vii
Acronyms and Abbreviations
CERC Central Electricity Regulatory Commission
FIT Feed-in tariff s
GBI Generation-based incentive
GIS Geographic Information System
HT High-tension
IEA International Energy Agency
IEGC Indian Electricity Grid Code
IEP Integrated Energy Policy
IREDA India Renewable Energy Development Agency
JNNSM Jawaharlal Nehru National Solar MissionMNRE Ministry of New and Renewable Energy
NAPCC National Action Plan on Climate Change
OECD Organization for Economic Co-operation and Development
PPA Power purchase agreement
R&D Research and development
RE Renewable energy
REC Renewable energy certificate
RGGVY Rajiv Gandhi Grameen Vidyutikaran Yojana
RPO Renewable purchase obligation
SERC State electricity regulatory commissionUI Unscheduled interchange
UNFCCC United Nations Framework Convention on Climate Change

8/6/2019 Unleashing the Potential of Renewable Energy in India
http://slidepdf.com/reader/full/unleashing-the-potential-of-renewable-energy-in-india 10/60
8/6/2019 Unleashing the Potential of Renewable Energy in India
http://slidepdf.com/reader/full/unleashing-the-potential-of-renewable-energy-in-india 11/60
ix
Executive Summary
India has 150 GW of renewable energy potential, about half in the form of small hy-
dropower, biomass, and wind and half in solar, cogeneration, and waste-to-energy.
Developing renewable energy can help India increase its energy security, reduce the
adverse impacts on the local environment, lower its carbon intensity, contribute to more
balanced regional development, and realize its aspirations for leadership in high-tech-
nology industries.
Since 2005 the energy and climate change agenda has taken center stage in the do-
mestic and international policy arena. India is well placed to build on this momentum.
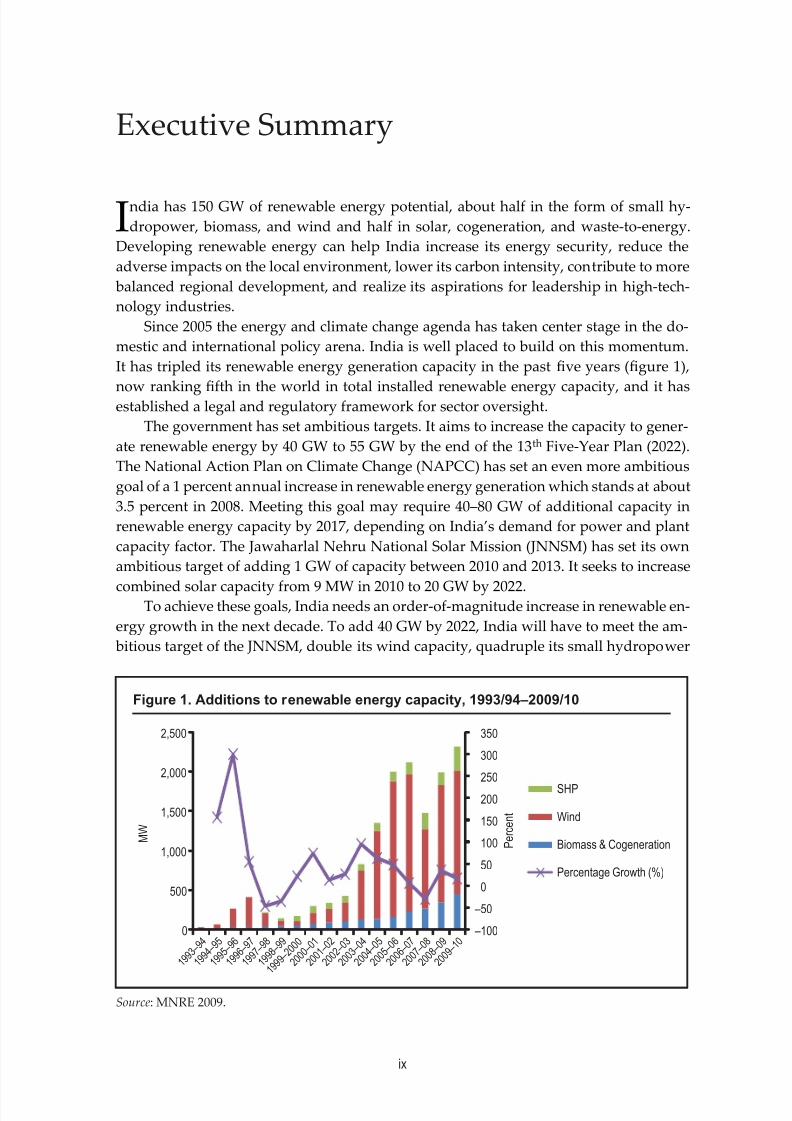
It has tripled its renewable energy generation capacity in the past five years (figure 1),
now rankingfi
fth in the world in total installed renewable energy capacity, and it hasestablished a legal and regulatory framework for sector oversight.
The government has set ambitious targets. It aims to increase the capacity to gener-
ate renewable energy by 40 GW to 55 GW by the end of the 13th Five-Year Plan (2022).
The National Action Plan on Climate Change (NAPCC) has set an even more ambitious
goal of a 1 percent annual increase in renewable energy generation which stands at about
3.5 percent in 2008. Meeting this goal may require 40–80 GW of additional capacity in
renewable energy capacity by 2017, depending on India’s demand for power and plant
capacity factor. The Jawaharlal Nehru National Solar Mission (JNNSM) has set its own
ambitious target of adding 1 GW of capacity between 2010 and 2013. It seeks to increase
combined solar capacity from 9 MW in 2010 to 20 GW by 2022.To achieve these goals, India needs an order-of-magnitude increase in renewable en-
ergy growth in the next decade. To add 40 GW by 2022, India will have to meet the am-
bitious target of the JNNSM, double its wind capacity, quadruple its small hydropower
Figure 1. Additions to renewable energy capacity, 1993/94–2009/10
Source: MNRE 2009.
–100
0
50
100
150
200
250
300
350
0
500
1,000
1,500
2,000
2,500
1 9 9 3
– 9 4
1 9 9 4
– 9 5
1 9 9 5
– 9 6
1 9 9 6
– 9 7
1 9 9 7
– 9 8
1 9 9 8
– 9 9
1 9 9 9
– 2 0 0
0
2 0 0 0
– 0 1
2 0 0 1
– 0 2
2 0 0 2
– 0 3
2 0 0 3
– 0 4
2 0 0 4
– 0 5
2 0 0 5
– 0 6
2 0 0 6
– 0 7
2 0 0 7
– 0 8
2 0 0 8
– 0 9
2 0 0 9
– 1 0
P e r c e n t
M W
SHP
Wind
Biomass & Cogeneration
Percentage Growth (%)
–50

8/6/2019 Unleashing the Potential of Renewable Energy in India
http://slidepdf.com/reader/full/unleashing-the-potential-of-renewable-energy-in-india 12/60
x Executive Summary
power capacity, fully realize co-generation capacity, and increase biomass realization by
a factor offive to six. These ambitious targets have made creation of an enabling environ-
ment for renewable energy development particularly urgent and topical.
This diagnostic note draws on a detailed analysis conducted by a Pricewater-
houseCoopers India consulting team in 2008–09 for the World Bank. The data are basedon information on about 180 wind, biomass, and small hydropower projects in 20 states,
as well as information from and norms of the Ministry of New and Renewable Energy
(MNRE) and the Central Electricity Regulatory Commission (CERC).
The study is intended to provoke discussions of the feasibility of renewable ener-
gy development in India. Why is renewable energy development relevant? How much
development is economically feasible? What needs to be done to realize the potential?
Each of these topics is addressed in a separate chapter, all of which suggest a few imple-
mentable measures that India can consider to tap its economically feasible unharnessed
potential.
Why: Role of Renewable Energy in India
India has a severe electricity shortage. It needs massive additions in capacity to meet
the demand of its rapidly growing economy. The country’s overall power deficit—11
percent in 2009—has risen steadily, from 8.4 percent in 2006. About 100,000 villages (17
percent) remain unelectrified, and almost 400 million Indians are without electricity cov-
erage. India’s per capita consumption (639 kWh) is one of the lowest in the world.
The Integrated Energy Policy Report, 2006, estimates that India will need to increase
primary energy supply by three to four times and electricity generation by five to six
times to meet the lifeline per capita consumption needs of its citizens and to sustain a 8percent growth rate. The government plans to provide universal access and to increase
per capita consumption to 1,000 kWh by 2012. This translates into a required generation
capacity of 800 GW compared to 160 GW today. The need to bring on new generation ca-
pacity—and to improve operational effi ciency in transmission and distribution—is clear.
Renewable energy can be an important part of India’s plan not only to add new
capacity but also to increase energy security, address environmental concerns, and lead
the massive market for renewable energy. More than three-fourths of India’s electric-
ity production depends on coal and natural gas. At current usage levels, India’s coal
reserves are projected to run out in 45 years. India already imports 10 percent of its coal
for electricity generation, and the figure is projected to increase to 16 percent by 2011.Like coal, gas and oil have witnessed considerable price volatility in recent years.
Development of renewable energy sources, which are indigenous and distributed and
have low marginal costs of generation, can increase energy security by diversifying sup-
ply, reducing import dependence, and mitigating fuel price volatility.
Accelerating the use of renewable energy is also indispensable if India is to meet its
commitments to reduce its carbon intensity. The power sector contributes nearly half
of the country’s carbon emissions. On average, every 1 GW of additional renewable en-
ergy capacity reduces CO2 emissions by 3.3 million tons a year. Local ancillary benefits
in terms of reduced mortality and morbidity from lower particulate concentrations are
estimated at 334 lives saved/million tons of carbon abated.
8/6/2019 Unleashing the Potential of Renewable Energy in India
http://slidepdf.com/reader/full/unleashing-the-potential-of-renewable-energy-in-india 13/60
xiExecutive Summary
Renewable energy development can also be an important tool for spurring regional
economic development, particularly for many underdeveloped states, which have the
greatest potential for developing such resources. It can provide secure electricity supply
to foster domestic industrial development, aract new investments, and hence serve as
an important employment growth engine, generating additional income.Renewable energy is seen as the next big technology industry, with the potential
to transform the trillion dollar energy industry across the world. China seized this ini-
tiative to become a world leader in manufacturing renewable energy equipment. In-
dia’s early and aggressive incentives for the wind sector have led to the development
of world-class players. Investing in renewable energy would enable India to develop
globally competitive industries and technologies that can provide new opportunities for
growth and leadership by corporate India.
How Much: Economic and Financial Potential of Renewable Energy
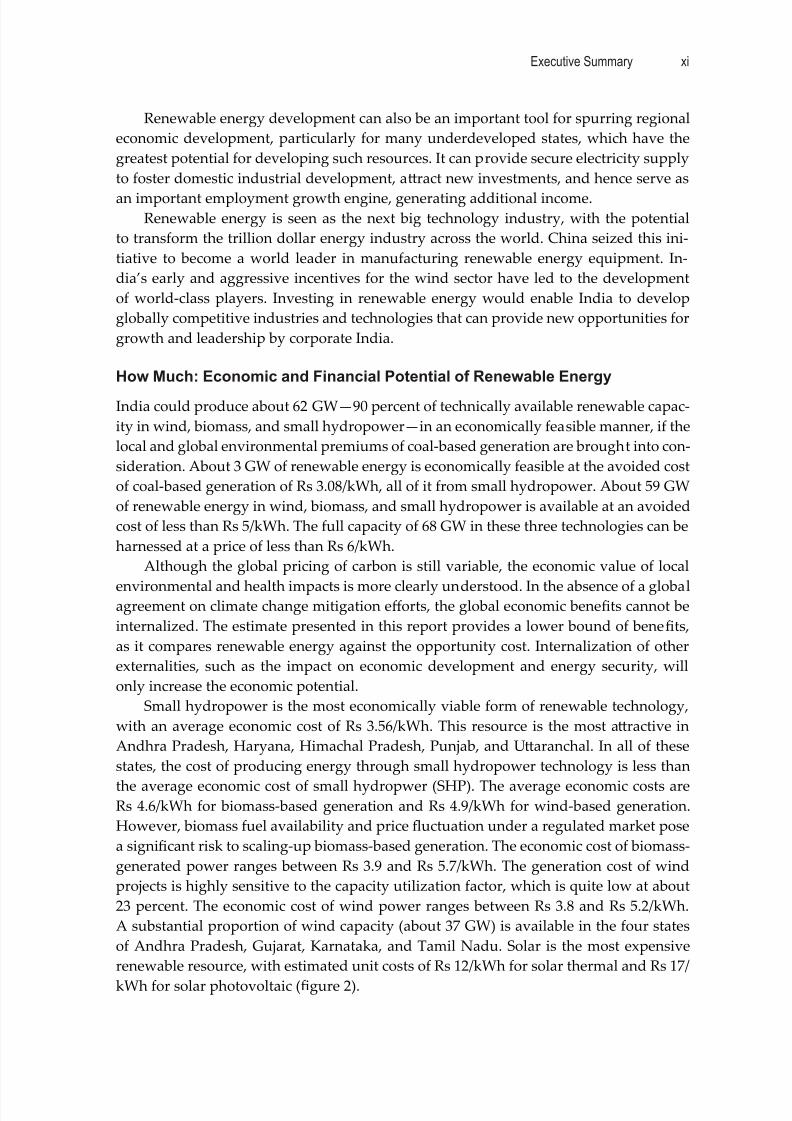
India could produce about 62 GW—90 percent of technically available renewable capac-
ity in wind, biomass, and small hydropower—in an economically feasible manner, if the
local and global environmental premiums of coal-based generation are brought into con-
sideration. About 3 GW of renewable energy is economically feasible at the avoided cost
of coal-based generation of Rs 3.08/kWh, all of it from small hydropower. About 59 GW
of renewable energy in wind, biomass, and small hydropower is available at an avoided
cost of less than Rs 5/kWh. The full capacity of 68 GW in these three technologies can be
harnessed at a price of less than Rs 6/kWh.
Although the global pricing of carbon is still variable, the economic value of local
environmental and health impacts is more clearly understood. In the absence of a globalagreement on climate change mitigation eff orts, the global economic benefits cannot be
internalized. The estimate presented in this report provides a lower bound of benefits,
as it compares renewable energy against the opportunity cost. Internalization of other
externalities, such as the impact on economic development and energy security, will
only increase the economic potential.
Small hydropower is the most economically viable form of renewable technology,
with an average economic cost of Rs 3.56/kWh. This resource is the most aractive in
Andhra Pradesh, Haryana, Himachal Pradesh, Punjab, and Uaranchal. In all of these
states, the cost of producing energy through small hydropower technology is less than
the average economic cost of small hydropwer (SHP). The average economic costs areRs 4.6/kWh for biomass-based generation and Rs 4.9/kWh for wind-based generation.
However, biomass fuel availability and price fluctuation under a regulated market pose
a significant risk to scaling-up biomass-based generation. The economic cost of biomass-
generated power ranges between Rs 3.9 and Rs 5.7/kWh. The generation cost of wind
projects is highly sensitive to the capacity utilization factor, which is quite low at about
23 percent. The economic cost of wind power ranges between Rs 3.8 and Rs 5.2/kWh.
A substantial proportion of wind capacity (about 37 GW) is available in the four states
of Andhra Pradesh, Gujarat, Karnataka, and Tamil Nadu. Solar is the most expensive
renewable resource, with estimated unit costs of Rs 12/kWh for solar thermal and Rs 17/
kWh for solar photovoltaic (figure 2).
8/6/2019 Unleashing the Potential of Renewable Energy in India
http://slidepdf.com/reader/full/unleashing-the-potential-of-renewable-energy-in-india 14/60
xii Executive Summary
The financial incentives for state utilities to buy renewable power are substantial
only when compared with short-term power procurement cost. The feed-in tariff s for
wind, small hydropower, and biomass are typically lower than the short-term power
purchase charges, such as trading and unscheduled interchange (UI). Reallocating the
money that would have been spent buying short-term power to investment in renewableenergy can yield significant savings. However, the core of electricity procurement by
utilities still rests with power purchase agreements (PPAs) with coal- or gas-fired plants.
At the financial cost of coal-based generation, renewable capacity is not financially vi-
able. About 5 GW of capacity is viable at the cost of gas-based generation; the entire
capacity of wind, biomass, and small hydropower is viable at the cost of diesel-based
generation. Solar energy is not financially viable at any of these opportunity costs and
will require subsidies in the short to medium term particularly if renewable purchase
obligations are enhanced rapidly in line with the targets of the NAPCC.
There is almost zero escalation in the variable cost of generation from renewable
sources; in contrast, the variable cost of fossil-fuel based power generation is expected
to increase. Most utility expansion models are unable to account for the hedging value
of renewables against the price volatility of fossil fuel-based generation. Renewables are
the only free hedging mechanism against the price volatility of fossil fuels. Experts have
concluded that the risk-adjusted cost of generation portfolio that includes renewable
energy is lower than that of a fossil fuels only portfolio. Moreover, renewable energy
increases the price certainty of the entire portfolio and enhances energy security. (In the
United States, for example, every MWh of non-gas generation saves consumers $7.50–
$20.00/MWh) Utilities therefore need to be incentivized to diversify the energy mix.
Achieving the government’s goal for the next decade will require an annual subsidyof $ 1 billion–$ 6 billion, depending on choices made. This may change as the renewable
energy certificate trading mechanism evolves. There is still significant scope for improv-
ing the bankability of renewable energy to aract developers to invest in renewable en-
Figure 2. Economic competitiveness of wind, biomass, and small hydropower
Source: AuthorsNote: The economic costs of generation include all capital, operational, and financial expenses and ex-clude all taxes and subsidies.
B i o m a s s A P & M P
SHP
All
States
Wind
TN &
Karnataka
Wind
AP
Wind
Gujarat
& MP
Wi n d K e r a l a & M a h a r a s h t r a
B i o m a s s V a r i o u s s t a t e s *
Wi n d R a j a s t h a n & W e s t B e n g a l
& H a r y a n a B i o m a s s
2.9 2.93.0 3.1 3.2
3 .7 3 .7 3 .7 3 .7 3 .7 3 .7 3.8 3.9 3.9 3.9 4.04.2
4.5 4.5 4.6 4.7 4.8 4.8 4.9 5.0 5.0 5.0 5.0
5.2 5.2 5.2
5.7
0
1
2
3
4
5
6
E c o n o m i c C o s t o f G e n e r a t i o n R s / K w
h
0.11 67.951.037.8Cumulative Capacity (in GW)
With Global
Environmental Premium4.96 Rs/Kwh
With Global
Environmental Premium
3.74 Rs/Kwh
Coal Avoided Cost
3.08 Rs/Kwh

8/6/2019 Unleashing the Potential of Renewable Energy in India
http://slidepdf.com/reader/full/unleashing-the-potential-of-renewable-energy-in-india 15/60
xiiiExecutive Summary
ergy. To reach the goal of installing 40 GW of additional capacity of renewables in the
next 10 years, the government could provide subsidies to achieve parity between the
cost of renewable energy and coal-based generation A back-of-the-envelope estimation
is made by identifying the size of subsidy required to bring levelized cost of renewable
energy to avoided cost (at a coal-based generation price of Rs 3.08/kWh). The amountis equal to the up-front capital subsidy or net present value of generation-based incen-
tives. The estimated resource requirement ranges from Rs 450 billion (about $10 billion)
for low-cost renewable energy but low diversity of renewable energy sources to Rs 2.9
trillion (about $64 billion) for high-cost renewable energy with significant diversity of
renewable energy sources. Provision of low-cost renewable energy is not prohibitively
expensive when spread over 10 years, with an annual bill of about $1 billion.
What: Establishment of an Enabling Environment
for Renewable Energy Development
Significant barriers to renewable energy development remain in India. Given the high
upfront capital costs of renewable energy technologies, financial barriers are substan-
tial. But nonfinancial barriers are equally important in limiting the growth of renewable
energy.
Barriers can be grouped into three categories: financial viability, support infrastruc-
ture, and regulatory approval (table 1):
■ The cost plus approach to tariff seing—along with the technology-specific
focus—has led to incentives that hinder the economic development of India’s
renewable energy resources. India currently off ers a wide variety of incentives,
including feed-in tariff s; generation-based incentives; renewable purchase obliga-
tions (RPOs); central, state, and regional capital subsidies; accelerated deprecia-
Table 1. Renewable energy barriers and suggested solutions
Type of
barrier Remaining issues Suggested solutions
Financial
Viability
• Skewed financial incentives for facilitatinginvestments in renewable energy
• Too many incentive programs• Failure to adequately address utilities’ long-
term financial concerns• Failure to develop least-cost resources first• Inadequate long-term funding sources
• Provide streamlined, market-based governmentinterventions
• Create national renewable energy fund tomitigate impact on utilities
• Enable direct purchase and distributedgeneration of renewable energy
• Facilitate financing of renewable energy
Support
Infrastructure
• Inadequate evacuation and accessinfrastructure
• Lack of good-quality data• Underdeveloped industry value chain
• Make renewable energy evacuation a high-transmission priority
• Introduce and enforce “take or pay” forrenewable energy generation
• Invest in high-quality, integrated resourcemonitoring systems
• Catalyze research and development (R&D) andsupply chain innovations and investments
RegulatoryApprovals
• Delays in clearances and approvals and long
development cycle• Land and resource acquisition issues
• Move to unified, light-touch regulation for
renewable energy.• Strengthen state nodal agencies and stateregulators
Source: Authors.

8/6/2019 Unleashing the Potential of Renewable Energy in India
http://slidepdf.com/reader/full/unleashing-the-potential-of-renewable-energy-in-india 16/60
xiv Executive Summary
tion; and tax incentives. The lack of coordination between incentives and state
programs makes it diffi cult to adopt an economics-based least-cost develop-
ment approach to tapping the country’s renewable energy potential.
■ The limited availability of evacuation infrastructure and grid interconnections is
one of the biggest obstacles to harnessing renewable energy potential. Much ec-onomically aractive wind and small hydropower potential remains untapped
because of lack of adequate grid evacuation capacity and approach roads. The
lack of good-quality data on renewable resources also remains a problem, de-
spite heavy investment by the MNRE in collecting data on renewable energy.
The lack of support infrastructure in the form of a strong indigenous supply
chain remains a major barrier.
■ Existing mechanisms—including single-window clearances, facilitation by state
nodal agencies, and simplified regulation for smaller renewable energy proj-
ects—have proved to be of limited eff ectiveness. In some cases multiple bole-
necks have been replaced by single, larger, and more powerful roadblocks, and
significant delays remain the norm. In addition, speculative blocking of land
has become common, leading to unsustainable price increases.
To reduce financial barriers, policy makers need to consider ways to bridge the
higher costs that ensure least economic cost development of India’s plentiful renewable
resources. There is a need to simplify the numerous and overlappingfinancial incentives
into a cogent set of synchronized policies established on a sound economic and market
foundation. Policies could be based on short- and long-term national targets and bro-
ken down into state-level RPOs that are mandatory and enforced. Technology-specific
incentives could be supported by earmarked funding and increasingly allocated on acompetitive basis.
India needs to make renewable energy evacuation a high transmission priority—as
high a priority as village electrification. This is especially true for large-scale renewable
energy plants. Dedicated funding should be allocated as part of existing programs, such
as the government’s rural electrification initiative - Rajiv Gandhi Grameen Vidyutikaran
Yojana (RGGVY), or new green funds.
Steps also need to be taken to address nonfinancial barriers that increase the cost of
doing business. Like information technology and telecommunications, clean technology
and renewable energy have enormous growth potential and can transform the trillion
dollar energy markets across the world. To realize this potential, India needs to stream-line bureaucratic processes for clearances and approvals through the use of light-touch
regulation. State nodal agencies, which are supposed to play a leading role in guid-
ing renewable energy projects through the regulatory maze, need to be strengthened. A
comprehensive capacity-building program on emerging regulatory, legal, and financing
issues to facilitate grid-connected renewable energy should be structured.
The way forward is complicated, but it provides India with the opportunity to dra-
matically increase the security of its energy future. Based on stakeholder discussions,
three key messages emerge:
■
Recognizing and managing risks is crucial. Any discussions of radical new ap-proaches to achieve an order-of-magnitude change in renewable energy should
first recognize the existing risks. Key risks that have to be managed include un-

8/6/2019 Unleashing the Potential of Renewable Energy in India
http://slidepdf.com/reader/full/unleashing-the-potential-of-renewable-energy-in-india 17/60
xvExecutive Summary
timely access to evacuation networks and equipment, diffi culties in the acquisi-
tion of land, lack of access to reliable resource estimates, and delays in payment
because of the weak financial state of the utilities and the weak institutional
capacity of renewable energy developmental institutions, especially at the state
level. Concerns from key stakeholders should be listened to and addressed tohead off resistance to project implementation, which rendered previous reform
aempts ineff ective. Implementation will have to be gradual in scale and se-
quencing and tolerant of the chance of failure.
■ Early adoption of “quick wins” can build momentum for high-eff ort, high-im-
pact structural reforms. Some solutions take time to design and implement and
may require significant resources. Achieving and demonstrating some quick
results helps gain political support for longer-term solutions. Policy initiatives
such as enforcement of state-level RPOs could provide an immediate boost to
the sector. Initiatives that increase financial sector capability and awareness,
strengthen state nodal agencies, and invest in high-quality resource information
systems can also be implemented relatively quickly.
■ Perhaps the best way to create substantive change is to implement compre-
hensive pilot models in a few states. One potential quick win that could have
a strong impact would be the creation of renewable energy parks, which can
serve as integrated implementation platforms for testing and refining solutions.
Such parks could be created as joint national and state initiatives in pilot states.
The central government could commit substantive financial and administrative
resources to aract states rich in renewable energy resources, which could be
selected based on their demonstrated commitment to such a program, includ-
ing co-financing and capacity to implement. Renewable energy parks can be
aractive to both small and large players. They can provide ready-to-bid project
pipelines; prefeasibility studies, including resource assessment data; access to
land; transmission infrastructure; and preferential open access policies. They
can be used to create simplified light-touch regulations, including accelerated
environmental and social clearances and package clearances. The India Renew-
able Energy Development Agency (IREDA) could pilot new risk guarantee and
financing schemes. State and central funds could catalyze R&D and supply
chain innovations in renewable energy parks. Initially, the parks would require
specifi
c kick-off
grants or subsidies from the MNRE and other agencies. Thesesubsidies could be recovered from developers as projects reach critical mass. If
proven successful, solutions tested in the parks could be replicated across India.

8/6/2019 Unleashing the Potential of Renewable Energy in India
http://slidepdf.com/reader/full/unleashing-the-potential-of-renewable-energy-in-india 18/60

8/6/2019 Unleashing the Potential of Renewable Energy in India
http://slidepdf.com/reader/full/unleashing-the-potential-of-renewable-energy-in-india 19/60
1
C H A P T E R 1
Why: Role of RenewableEnergy in India
T
his chapter explores the rationale for developing renewable energy in India.1 It pres-
ents a snapshot of the current status of renewable energy development and sum-
marizes key issues in each of the major industry segments. It also examines crucial gaps
in the renewable energy market, describes the goals set out by various government pro-
grams, and estimates the resources and eff ort required to meet these goals.
India’s significant untapped renewable energy resources can be an important con-
tributor to alleviating power shortages. They can also increase energy security, contribute
to regional development, enhance access in remote (rural) areas, diversify fuel sources,
and provide local and global environmental benefits. Recognizing these benefits, India’s
policy makers have given much aention to renewable energy, seing ambitious goals
for the sector. Meeting these goals will require significant capital investments and con-
certed action to solve the many issues faced by the diff erent renewable energy sectors.
Contribution to India’s Energy Future
Persistent electricity shortages have been identified as a key boleneck for sustaining
India’s growth rate (figure 1.1). India’s per capita consumption (of just 639 kWh) is one
of the lowest in the world.2 According to the Ministry of Power, out of the total 593,732
Figure 1.1. Annual average and peak power deficits, 2005/06–2008/09
Source: Ministry of Power Website (CEA Report).
0
10,000
20,000
30,000
40,000
50,000
60,000
70,000
80,000
90,000
0
2
4
6
8
10
12
14
16
18
2005–06 2006–07 2007–08 2008–09
M i l l i o n k W h
P e r c e n t
Energy deficit (%) Peak deficit (%) Energy deficit (million kwh)
8/6/2019 Unleashing the Potential of Renewable Energy in India
http://slidepdf.com/reader/full/unleashing-the-potential-of-renewable-energy-in-india 20/60
World Bank Study2
villages in the country as per the 2001 census, 496,365 have been electrified as of Dec
31, 2009. In 2009–10 the national power shortage averaged 10.1 percent.3 Access to grid
power remains low, with an electrification rate of just 55 percent, leaving almost 412 mil-
lion people without electricity coverage.4 About 42 percent of rural households in India
use kerosene-based lighting, paying 20–30 times more than they would for electricity- based lighting.5 Supply is not suffi cient even in urban areas, where about 6 percent of
households use kerosene for lighting.
The economic and opportunity costs of these shortages are very high. Substantial
segments of Indian business and some household customers use expensive diesel gen-
erators to cope with grid shortages. About 60 percent of Indian firms rely on captive or
back-up generation (compared with just 21 percent in China). Grid-connected captive
generation capacity is estimated to be about 20 GW and growing at 30–40 percent a year.6
In the next 25 years, India’s electricity demand is expected to grow at an average an-
nual rate of 7.4 percent. Generation capacity will have to increase fivefold to keep pace
with demand growth. India needs massive additions in generation capacity to meet the
demands of its fast-growing economy. In 2008 India had 148 GW of generation capacity,
with annual electricity generation of about 724 Billion kWh.7 The Integrated Energy Pol-
icy (IEP) Report, 2006,8 estimates that India will need to increase primary energy supply
by three to four times and electricity generation by five to six times to meet the lifeline
per capita consumption needs of its citizens and to sustain an eight percent growth rate.
The government plans to provide universal access and to increase per capita consump-
tion to 1,000 kWh by 2012. This translates to an installed generation capacity require-
ment of approximately 800 GW in 2031–32 compared to the installed capacity of 160 GW
in 2010 (at 8 percent GDP growth rate).9 The IEP report projects that nearly three-fourths
of the installed capacity will be thermal-based (coal and gas). The gap between supply
and demand is likely to increase unless adequate measures are taken to bring on new
generation capacity and improve operational effi ciency in the distribution and manage-
ment of power utilities.
With about 150 GW of known resource potential—of which only about 10 percent
has been developed—renewable energy should be an important part of the solution to
India’s energy shortage (figure 1.2). The country’s huge energy potential is likely to be
even greater than 150 GW, as resources from sources with significant generation capac-
ity (such as energy plantation of wastelands and off shore wind farms) have not yet been
mapped. In sectors such as wind and small hydropower, application of the latest de-velopments in engineering design and equipment technology are also likely to increase
potential, as are the discovery of new small hydropower sites and the development of
the irrigation network. The potential for solar power will likely increase significantly as
technology improves.
Development of renewable energy sources, which are indigenous and distributed
and have low marginal costs of generation, can increase energy security by diversifying
supply, reducing import dependence, and mitigating fuel price volatility. India produc-
es three-fourths of its electricity from coal and natural gas (figure 1.3). At current usage,
its coal reserves are projected to be depleted in 45 years.10 India already imports 10 per-
cent of its coal for electricity generation; it is projected to import 16 percent by 2011. Withthe increase in demand for coal in Asia, global coal prices are projected to rise, exerting
greater pressure on India’s power sector.

8/6/2019 Unleashing the Potential of Renewable Energy in India
http://slidepdf.com/reader/full/unleashing-the-potential-of-renewable-energy-in-india 21/60
8/6/2019 Unleashing the Potential of Renewable Energy in India
http://slidepdf.com/reader/full/unleashing-the-potential-of-renewable-energy-in-india 22/60
World Bank Study4
able energy is expected to fall significantly. Under the business-as-usual scenario of sup-
ply, energy diversification is expected to worsen because of the increasing share of coal
generation.11 The energy diversification index—measured as the sum of the squares of
generation mix resources—is expected to decline by 20 percent between 2009 and 2032,
from 0.42 to 0.35.12
Accelerating the use of renewable energy is also indispensable for improving air
quality and the local environment and for meeting India’s commitments to reducing its
carbon intensity. The power sector contributes nearly half of India’s carbon emissions.
On average, every 1 GW of additional renewable energy capacity reduces 3.3 million
tons of CO2 a year. Reducing particulate concentrations is also estimated to save 334
lives for every million tons of carbon abated.13
Renewable energy has the potential to transform energy markets across the world.
Globally, the clean technology industry is considered the next big high-tech industry
(similar to the information technology and telecommunications sectors). Recognizing
the sector’s potential, China has made a strategic decision to lead the world in manufac-
turing solar, wind, and hydro equipment. As of 2008, it was the world’s top producer of
small hydropower equipment, solar water heaters, and solar photovoltaic panels, sur-
passing Japan. It has achieved a high level of domestic sourcing for most components for
wind turbines and is expected to become the number one manufacturer in 2010.
India’s early and aggressive incentives for the wind sector have led to the develop-
ment of world-class players in the sector. The government’s JNNSM has the potential to
develop both domestic research and development (R&D) and manufacturing capabil-
ity in the sector. Investing in renewable energy would facilitate the creation of globally
competitive industries in wind, solar, and other technologies that can provide new op-
portunities for growth and leadership for corporate India.
Renewable energy development can also be an important tool for regional economic
development within India. Many of the states endowed with rich renewable energy po-
tential (Arunachal Pradesh, Himachal Pradesh, Orissa, Uarakhand) lag in economic
development. Developing renewable energy in these states can provide secure electricity
supply to foster domestic industrial development, aract new investments, create em-
ployment, and generate additional state income by allowing the states to sell renewable
energy trading certificates to other states. Investments to develop the aractive renew-
able energy potential of these states would thus give a huge boost to their economies.
There are thus many good reasons for placing high priority on renewable energydevelopment. Renewable energy should be developed, however, only if the economic
benefits outweigh the costs. The economic rationale behind accelerating renewable en-
ergy growth must be made on a unified, nationwide, least-cost basis.
Strong Momentum behind Development of Renewable Energy
India ranks fifth in the world in terms of installed renewable energy potential, with
more than 5 percent of the world’s capacity in 2008.14 Starting with the 10th plan period
(1997–2001), India accelerated the pace of renewable energy development (figure 1.4).
Renewable energy capacity increased by 6.7 GW—more than twice the target of about
3 GW—in 2002–07, according to MNRE. India’s renewable energy installed capacity hasgrown at an annual rate of 31 percent, rising from about 2.5 GW in 2003 to about 15 GW
in December 2009.
8/6/2019 Unleashing the Potential of Renewable Energy in India
http://slidepdf.com/reader/full/unleashing-the-potential-of-renewable-energy-in-india 23/60
Unleashing the Potential of Renewable Energy in India 5
Wind
Wind energy dominates India’s renewable energy industry, accounting for 70 percent
of installed potential. The sector has received more support than any other renewable
energy sector to date. Wind continues to be the biggest renewable energy sector in India,
in terms of both current installed capacity (11 GW) and total known potential (45 GW).15
Significant tax incentives––off ering 100 percent (and later 80 percent) accelerated depre-ciation in the first year—have induced substantial investments by corporations and high
net worth individuals in wind energy projects. State-level actions, such as preferential
tariff s and special directives for wind, have also accelerated the development of the in-
dustry. Investments by the MNRE in the Wind Resource Assessment Program and estab-
lishment of the Centre for Wind Energy Technology, which serves as a focal point for the
MNRE’s research and development work in the wind energy sector, have also helped
develop new wind projects. As a result, many strong private integrated technology and
project development firms have emerged in the sector.
Although more than 99 percent of all investments in wind energy have come from
the private sector, strong competition is lacking, and technology improvements andeconomies of scale have not reduced costs in the industry. On the contrary, the average
capital costs increased from Rs 4/MW to Rs 6/MW between 2003 and 2008.16 The increase
can be at least partially aributed to continued use of accelerated depreciation, which
has aracted investors who buy completed turnkey projects from equipment vendors
and take profits from the accelerated depreciation and feed-in tariff .17 Under the turn-
key model, wind equipment manufacturers act as project developers; they do not face
competition (as players in solar, small hydropower, and biomass do) in the supply of
equipment. Although this model has enabled rapid growth of the sector and creation of
strong domestic champions, it has discouraged a competitive equipment and technology
selection. There are few established global technology leaders in the Indian market. As a
result, the performance of commissioned projects has suff ered and the cost of equipment
soared. More important, there is no competition for the allotment of sites with good
Figure 1.4. Additions to renewable energy capacity, 1993/94–2009/10
Source: MNRE 2009.
–100
0
50
100
150
200
250300
350
0
500
1,000
1,500
2,000
2,500
1 9 9 3 – 9 4
1 9 9 4 – 9 5
1 9 9 5 – 9 6
1 9 9 6 – 9 7
1 9 9 7 – 9 8
1 9 9 8 – 9 9
1 9 9 9 – 2
0 0 0
2 0 0 0 – 0 1
2 0 0 1 – 0 2
2 0 0 2 – 0 3
2 0 0 3 – 0
4
2 0 0 4 – 0 5
2 0 0 5 – 0 6
2 0 0 6 – 0 7
2 0 0 7 – 0 8
2 0 0 8 – 0 9
2 0 0 9 – 1 0
P e r c e n t
M W
SHP
Wind
Biomass & Cogeneration
Percentage Growth (%)
–50
8/6/2019 Unleashing the Potential of Renewable Energy in India
http://slidepdf.com/reader/full/unleashing-the-potential-of-renewable-energy-in-india 24/60
World Bank Study6
wind resources; investors who acquire the land control the resource, eff ectively blocking
any competition. Wind energy installations in many other countries are provided a fixed
feed-in tariff , which provides predictability but does not necessarily encourage competi-
tion with other power producers. Promoting competition might be an appropriate op-
tion for a sector that has reached maturity.
Small hydropower
Small hydropower—one of the least expensive and most aractive forms of renewable
energy—lies largely untapped. It is a very aractive renewable energy source because
it uses mature and largely indigenous technology and its maximum power production
is in the summer, which coincides with peak seasonal demand in India. India has an
estimated small hydropower potential of about 15 GW, of which about 2.5 GW has been
developed. The pace of small hydropower development, which increased significantly
during the 11th Plan period (2008–2012), has now stabilized. Development has been rela-
tively slow because of long delays in geing clearances and acquiring access to evacua-tion infrastructure, lack of clear policy for private sector participation in some states, and
issues associated with land acquisition. Small hydropower–rich north and northeastern
states have lagged in tapping this resource. With their perennial Himalayan rivers, Hi-
machal Pradesh, Jammu and Kashmir, and Uarakhand have 65 percent of India’s small
hydropower resource and among the lowest generation costs. Despite these advantages,
resource utilization is only in the low to mid teens.18 Raising the utilization rate requires
immediate aention.
Biomass
Biomass has huge potential in an agrarian economy like India. Generation costs for bio-mass are similar to those of wind.
Like small hydropower, biomass remains largely underdeveloped. According to the
MNRE, India has nearly 700 million tons a year of biomass agri-residues, of which about
a fifth can be used for electricity generation. (The rest goes to alternative usages, includ-
ing household and small business heating, animal fodder, and packaging.) This biomass
could produce about 17 GW of power.19 The MNRE estimates that another 34 GW of
power could be produced from wood and energy plantations on wasteland.20 In addi-
tion, India has 61 GW of additional capacity of bioenergy, which includes agri-residues
and biomass, from plantations.21 Despite these resources, the sector is the least devel-
oped in India, with only about 0.8 GW (less than 5 percent) of potential realized to date.Biomass has two unique characteristics. First, biomass plants require large quanti-
ties of fuel input for operations (biomass feedstock), which requires a well-developed
supply chain. This disadvantage is also a strength, because biomass is the only renewable
energy technology that can serve as a reliable alternative to diesel. However, the presence
of multiple middlemen, diffi culties in administering and enforcing agricultural contracts,
and the development of wastelands have led to underdeveloped fuel supply chains.
Second, the sector suff ers from lack of reliable resource assessment. The develop-
ment of the biomass industry has been limited to only a few states, such as Andhra
Pradesh and Tamil Nadu. Significant potential exists in economically underdeveloped
states like Uar Pradesh for developing biomass. Developing biomass in such states is awin-win strategy, as it can both reduce the electricity shortage and provide farmers with
reliable additional sources of income.
8/6/2019 Unleashing the Potential of Renewable Energy in India
http://slidepdf.com/reader/full/unleashing-the-potential-of-renewable-energy-in-india 25/60
Unleashing the Potential of Renewable Energy in India 7
Co-generation
Co-generation is a highly cost-eff ective and industrially aractive generation source that
is gaining industry aention. With the ready availability of low-cost and abundant fuel
supply, the levelized costs are lower than those of even small hydropower.22 The poten-
tial to reach higher effi ciencies in heat recovery and usage also make it an aractive en-
ergy source. India has about 5 GW of estimated co-generation potential from sugarcane,
paper making, and other agriprocessing industries, of which only about 0.2 GW had
been realized as of December 2009.23 Interest in this source has been growing.
Solar
Solar power represents a strategic long-term solution for India. An extensive program is
planned as part of the JNNSM.
India has an estimated 50 MW/km2 of potential solar power,24 of which only about
9 MW had been developed as of December 2009, because generation costs are even
higher than those for diesel. There is a huge potential for solar energy applications ingrid-interactive solar power generation plants, solar thermal industrial applications, ru-
ral electrification, roof top–based applications and mobile towers in off -grid areas, and
domestic water heating. As one of the eight missions under the National Action Plan on
Climate Change (NAPCC), the JNNSM pursues ambitious goals on generation capac-
ity additions from solar technology (solar thermal and solar photovoltaic) in terms of
both grid-connected and off -grid applications. Implementation will take place in three
phases—Phase I (2009–13), Phase II (2013–17), and Phase III (2017–22)—to achieve the
target of deploying 20 GW of solar power by 2022. Milestones to reach this target include
ramping up the current capacity of grid-connected solar power generation to 1 GW by
the end of Phase I and adding 3 GW of capacity through mandatory renewable purchase
obligations (RPOs) by utilities coupled with preferential tariff s by 2017.
Meeting the targets set by the JNNSM will be a challenge. Solar plants have high
capital costs because of expensive input material and the high cost of components. Ade-
quate solar radiation levels for large-scale solar generation also require the availability of
transmission infrastructure to evacuate power from the project location; large stretches
of flat land, particularly for parabolic trough systems; and continual water supply to
generate steam and cool turbines, in the case of solar thermal plants. Solar technology
also requires high precision–engineered components, such as parabolic mirrors and re-
ceiver tubes, which are not available locally. Because of limited field experience and
data, process standardization and quality benchmarks are not uniform across projects
under preparation, with each manufacturer imposing its own standard. The level of cus-
tomization means that equipment has to be commissioned on a project-by-project ba-
sis, preventing manufacturers from enjoying economies of larger scale production. The
problem is accentuated by the lack of a learning curve and data gained from ground-
level experience for simulating capital and operating costs for potential projects.
India’s Ambitious Targets for Renewable Energy Development
India needs to step up the development of its renewable energy–rich but underdeveloped
states. Although national policies enable renewable energy, the pace of developmentdepends largely on each state’s policy and regulatory support. State-level renewable
energy policies, specific feed-in tariff and RPO programs from state energy regulatory

8/6/2019 Unleashing the Potential of Renewable Energy in India
http://slidepdf.com/reader/full/unleashing-the-potential-of-renewable-energy-in-india 26/60
World Bank Study8
commissions (SERCs), utility evacuation programs, clearance mechanisms, open access
policies, and capacity of state nodal agencies all have significant influence on the pace of
renewable energy development.
Renewable energy development has lacked an integrated national economic per-
spective and has been largely driven by uncoordinated state policies. Many states withthe richest renewable energy resources lag farthest in development. Himachal Pradesh,
Jammu and Kashmir, and Uarakhand have 65 percent of India’s small hydropower
resources, thanks to the rich natural resources of the perennial Himalayan rivers in
the northeast states. Despite these resources, their combined installed capacity is less
than the combined capacity of Andhra Pradesh and Karnataka (figure 1.5). Much of the
economically aractive wind potential in Orissa or the biomass potential in Madhya
Pradesh also lies largely undeveloped. With credit trading mechanisms in place and key
barriers removed, renewable energy could be a source of both substantial investment
and income generation for these states.
India needs to address uneven development across renewable energy sectors. Al-
though all renewable energy technologies have been underused, small hydropower and
biomass sectors need special aention (figure 1.6). Both sectors have aractive econom-
ics. In fact, the generation costs of small hydropower are comparable to those of thermal
generation sources, and the generation costs of biomass are comparable to those of wind.
Figure 1.5. Potential capacity, installed capacity, and cost of generation of
renewable energy sources, by state as of fiscal year 2009–2010
Source: MNRE, authors.Note: P: potential; I: installed capacity; CoG: economic cost of generation.
J&K P % CoGSHP 1411 7.93% 3.92
AP P % CoGWind 8968 1.37% 4.90
SHP 552 32.76% 3.37Biomass 830 25.33 4.09
Arunachal P % CoGSHP 1333 4.06% 3.92
Gujarat P % CoGWind 10645 14.72% 4.90
Biomass 916 0.05% 4.81
Haryana P % CoGSHP 110 57% 3.07
Biomass 884 0.45% 5.46
HP P % CoGSHP 2268 10.18% 3.19
Kerala P % CoG
Wind 1171 2.31% 5.12
MP P % CoGWind 1019 20.88% 5.01
SHP 400 17.79% 4.90Biomass 1059 0.09% 3.87
Rajasthan P % CoGWind 4858 15.2% 5.63
SHP 63 37.86%Biomass 1289 1.81% 4.67
Uttrakhand P % CoGSHP 1609 7.95% 3.29
Tamil Nadu P % CoGWind 5530 77.84% 4.15
Biomass 1186 10.03% 5.01
Maha’tra P % CoGWind 4584 42.30% 5.36
SHP 762 27.73% 4.09
Biomass 1711 0.67% 4.69
Chhattisgarh P % CoGBiomass 830 25.33 4.81
Karnataka P % CoGWind 11531 11.51% 4.25
SHP 643 87.6% 3.96Biomass 859 9.49% 4.81
Nagaland P % CoGSHP 28.67 17.13% 3.92
Punjab P % CoGSHP 390 31.7% 3.07
West Bengal P % CoGWind 450 0% 5.63

8/6/2019 Unleashing the Potential of Renewable Energy in India
http://slidepdf.com/reader/full/unleashing-the-potential-of-renewable-energy-in-india 27/60
8/6/2019 Unleashing the Potential of Renewable Energy in India
http://slidepdf.com/reader/full/unleashing-the-potential-of-renewable-energy-in-india 28/60
World Bank Study10
Notes
1. This review examines the renewable energy sector only from an electricity generation point of
view. The many applications for leveraging renewable energy resources in areas such as decentral-
ized household lighting, commercial cooking, residential heating and hot water, industrial heating,
and power generation and transportation through the use of biofuel generation are not covered.2. World Bank (World Development Indicators, 2010).
3. Ministry of Power, June 2009 hp://powermin.nic.in/JSP_SERVLETS/internal.jsp.
4. World Energy Outlook 2007.
5. National Sample Survey Organization, Ministry of Statistics and Program Implementation 2007.
6. Central Electricity Authority 2009.
7. Central Electricity Authority, April 2009.
8. hp://planningcommission.nic.in/reports/genrep/rep_intengy.pdf.
9. Integrated Energy Policy, Planning Commission, 2006, p. 20.
10. Planning Commission, India 2006.
11. World Bank, 2010. “Energy intensive sectors of the Indian economy: Path to low carbon devel-
opment.” South Asia Sustainable Development. See discussion in chapter 2.12. The Herfindahl index, a measure widely used to describe the concentration of firms in an indus-
try, is used here to quantify the diversity of the generation mix.
13. Bussolo, Maurizio, and D. O’Connor, 2001. Clearing the Air in India: The Economics of Climate
Policy.
14. REN21 (2009) Renewables Global Status Report: 2009 Update, REN21 Secretariat, Paris, www.
ren21.net/pdf/RE_GSR_2009_update.pdf, p. 11.
15. MNRE figures of estimated renewable energy potential, achievement as of December 31, 2009.
16. The estimation of capital cost in this study is based on a review of wind tariff orders by SERCs
and review of about 50 wind-based power projects in India (UNFCC).
17. The increase in global demand between 2004 and 2008 could have also contributed to price
increases.
18. PwC.19. As per MNRE estimates of renewable energy potential as of December 31, 2009.
20. Biomass Atlas prepared by MNRE and Indian Institute of Science 2000.
21. Biomass Atlas prepared by MNRE and Indian Institute of Science 2000.
22. Levelized costs are the present value of the total cost of building and operating a generating
plant over its economic life, converted into equal annual payments and allocated as per unit elec-
tricity generation costs.
23. As per MNRE estimates of renewable energy potential as of December 31, 2009.
24. As per MNRE estimates of renewable energy potential as of December 31, 2009.
25. Report of the Working Group on New and Renewable Energy for the 11th Five Year Plan (2007–
12), Government of India, Ministry of New and Renewable Energy, December 2006, p. 56.
26. National Action Plan on Climate Change, Government of India, Prime Minister’s Council onClimate Change, p. 43.
27. The 40 GW figure assumes a 40 percent plant capacity factor. The average plant capacity factor
in India is about 20 percent. If the effi ciency of plants of generation is not improved, the additional
capacity requirement will be as much as 80 GW.
8/6/2019 Unleashing the Potential of Renewable Energy in India
http://slidepdf.com/reader/full/unleashing-the-potential-of-renewable-energy-in-india 29/60
11
C H A P T E R 2
How Much: Economicand Financial Potential
of Renewable Energy
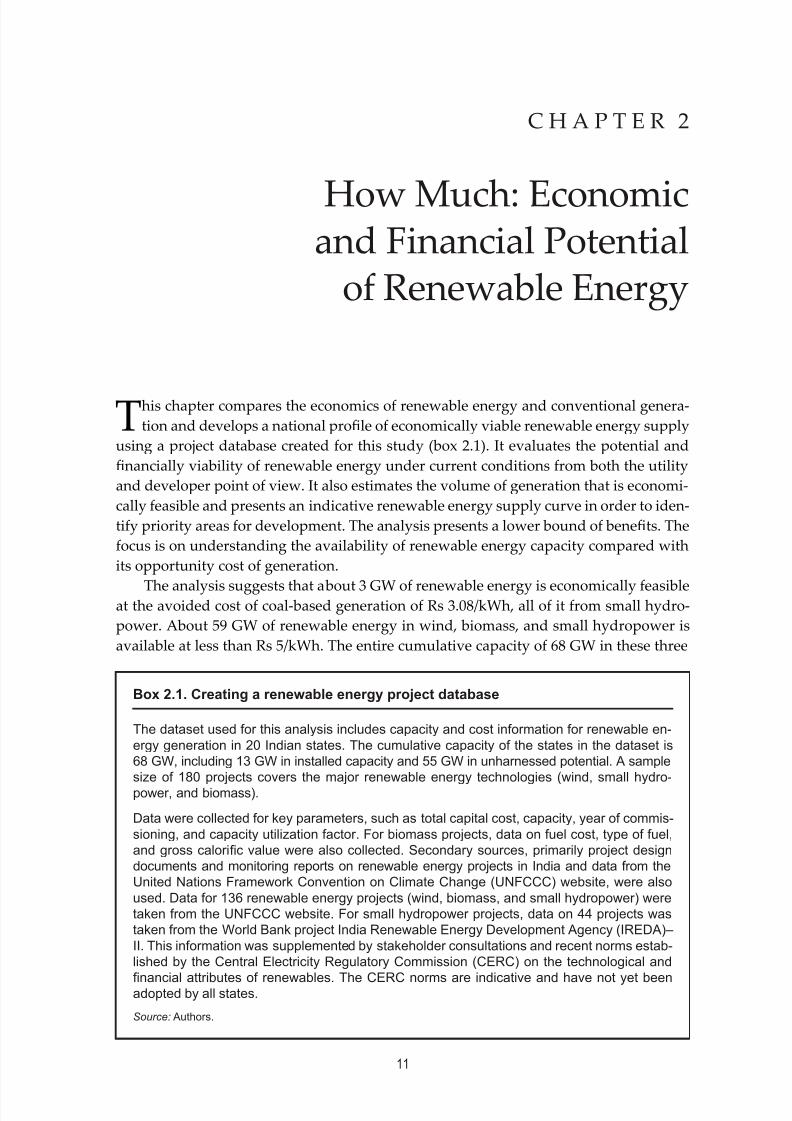
This chapter compares the economics of renewable energy and conventional genera-
tion and develops a national profile of economically viable renewable energy supply
using a project database created for this study (box 2.1). It evaluates the potential and
financially viability of renewable energy under current conditions from both the utility
and developer point of view. It also estimates the volume of generation that is economi-
cally feasible and presents an indicative renewable energy supply curve in order to iden-
tify priority areas for development. The analysis presents a lower bound of benefits. The
focus is on understanding the availability of renewable energy capacity compared with
its opportunity cost of generation.
The analysis suggests that about 3 GW of renewable energy is economically feasibleat the avoided cost of coal-based generation of Rs 3.08/kWh, all of it from small hydro-
power. About 59 GW of renewable energy in wind, biomass, and small hydropower is
available at less than Rs 5/kWh. The entire cumulative capacity of 68 GW in these three
Box 2.1. Creating a renewable energy project database
The dataset used for this analysis includes capacity and cost information for renewable en-
ergy generation in 20 Indian states. The cumulative capacity of the states in the dataset is
68 GW, including 13 GW in installed capacity and 55 GW in unharnessed potential. A sample
size of 180 projects covers the major renewable energy technologies (wind, small hydro-
power, and biomass).
Data were collected for key parameters, such as total capital cost, capacity, year of commis-
sioning, and capacity utilization factor. For biomass projects, data on fuel cost, type of fuel,
and gross calorific value were also collected. Secondary sources, primarily project design
documents and monitoring reports on renewable energy projects in India and data from the
United Nations Framework Convention on Climate Change (UNFCCC) website, were also
used. Data for 136 renewable energy projects (wind, biomass, and small hydropower) were
taken from the UNFCCC website. For small hydropower projects, data on 44 projects was
taken from the World Bank project India Renewable Energy Development Agency (IREDA)–
II. This information was supplemented by stakeholder consultations and recent norms estab-
lished by the Central Electricity Regulatory Commission (CERC) on the technological and
financial attributes of renewables. The CERC norms are indicative and have not yet beenadopted by all states.
Source: Authors.
8/6/2019 Unleashing the Potential of Renewable Energy in India
http://slidepdf.com/reader/full/unleashing-the-potential-of-renewable-energy-in-india 30/60
World Bank Study12
technologies can be harnessed at less than Rs 6/kWh. About 62 GW—90 percent of cu-
mulative renewable capacity in wind, biomass, and small hydropower—is economically
feasible when the environmental premiums on coal are brought into consideration.
The financial incentives for state utilities to buy renewable power are substantial
only when compared with short-term power procurement. The feed-in tariff s for wind,small hydropower, and biomass are typically lower than short-term power purchase
cost such as trading and unscheduled interchange (UI) charges. The savings from in-
vesting in renewable energy rather than purchasing short-term power can be significant.
Utilities therefore need to be incentivized to develop their ability to diversify the energy
mix. Full implementation of RPOs and renewable energy certificate (REC) mechanisms
would help address this concern. The core of the electricity supply procurement in utili-
ties still lie with power purchase agreements (PPAs) with coal- or gas-fired plants. At the
opportunity cost of coal-based generation, renewable capacity is not financially avail-
able. About 5 GW of capacity is available at the cost of gas-based generation, and the
entire capacity of wind, biomass, and small hydropower is viable at diesel-based genera-
tion cost. Solar power is not financially viable at any of the opportunity costs without
subsidies or preferential tariff s.
Economic Viability of Renewable Energy Generation
India’s renewable energy potential is both large and varied. The estimated technically
feasible potential of renewable energy is estimated to be 150 GW, of which about 76 GW
is in the relatively active wind, small hydropower, and biomass sectors. However, the
high up-front cost of renewable energy generation compared with conventional energy
sources has often posed a barrier to their development. A more economically competi-tive picture emerges when an environmental premium is imposed on the cost of conven-
tional sources.
The trends in international fuel and equipment markets are likely to favor renew-
able energy technologies. Among the technologies considered here, fuel expenses form a
substantial part of total cost only for biomass. The largest cost component is the high up-
front capital costs of equipment. Fuel costs constitute the largest proportion of total eco-
nomic costs for thermal generation, which is therefore exposed to future input inflation.
Given the structural changes in global oil markets in the past decade and the accelerat-
ing global demand and shrinking supply of known fuel sources, fuel costs are projected
to increase consistently in the coming decades. According to the International EnergyAgency, demand for fossil fuels in the base reference scenario is expected to increase
by 77 percent by 2030. In volume terms coal is expected to have the largest increase: its
share in primary energy demand will rise from 27 percent to 29 percent between 2007
and 2030. The average real price of coal is projected to rise from $65/ton in 2009 to $100/
ton by 2020 and $110/ton by 2030. Oil is expected to follow a similar trend, with the aver-
age price projected to rise from $65/barrel to $100/barrel by 2020 and $115/barrel by 2030
($190/barrel in nominal terms).1
In contrast, the costs of capital equipment for renewable energy have been decreas-
ing and are likely to continue to decline as technology advances. The levelized cost of on-
shore wind power is projected to fall to $5.3/kWh for high wind sites by 2015. Off shorewind costs are projected to fall about 20 percent by 2020 (in 2006 prices). The cost of solar
photovoltaic systems is projected to fall from about $4/W in 2009/10 to $1.9–$2.2/W in

8/6/2019 Unleashing the Potential of Renewable Energy in India
http://slidepdf.com/reader/full/unleashing-the-potential-of-renewable-energy-in-india 31/60
8/6/2019 Unleashing the Potential of Renewable Energy in India
http://slidepdf.com/reader/full/unleashing-the-potential-of-renewable-energy-in-india 32/60
World Bank Study14
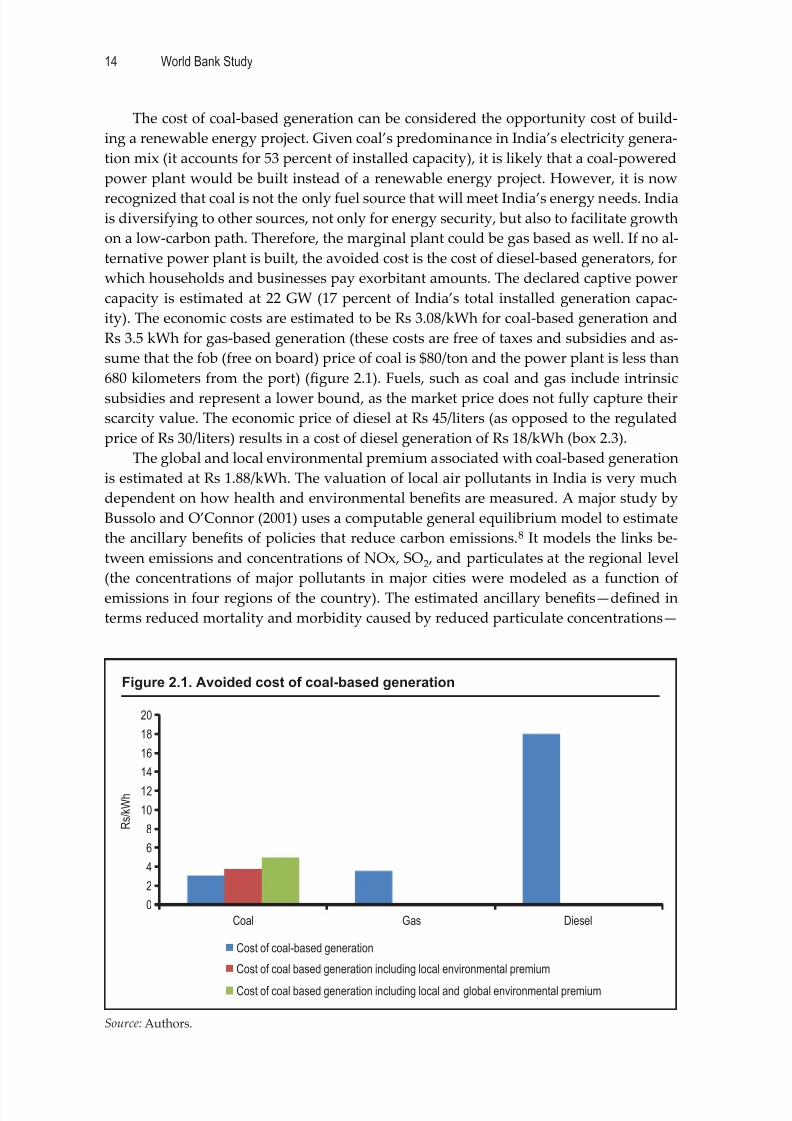
The cost of coal-based generation can be considered the opportunity cost of build-
ing a renewable energy project. Given coal’s predominance in India’s electricity genera-
tion mix (it accounts for 53 percent of installed capacity), it is likely that a coal-powered
power plant would be built instead of a renewable energy project. However, it is now
recognized that coal is not the only fuel source that will meet India’s energy needs. Indiais diversifying to other sources, not only for energy security, but also to facilitate growth
on a low-carbon path. Therefore, the marginal plant could be gas based as well. If no al-
ternative power plant is built, the avoided cost is the cost of diesel-based generators, for
which households and businesses pay exorbitant amounts. The declared captive power
capacity is estimated at 22 GW (17 percent of India’s total installed generation capac-
ity). The economic costs are estimated to be Rs 3.08/kWh for coal-based generation and
Rs 3.5 kWh for gas-based generation (these costs are free of taxes and subsidies and as-
sume that the fob (free on board) price of coal is $80/ton and the power plant is less than
680 kilometers from the port) (figure 2.1). Fuels, such as coal and gas include intrinsic
subsidies and represent a lower bound, as the market price does not fully capture their
scarcity value. The economic price of diesel at Rs 45/liters (as opposed to the regulated
price of Rs 30/liters) results in a cost of diesel generation of Rs 18/kWh (box 2.3).
The global and local environmental premium associated with coal-based generation
is estimated at Rs 1.88/kWh. The valuation of local air pollutants in India is very much
dependent on how health and environmental benefits are measured. A major study by
Bussolo and O’Connor (2001) uses a computable general equilibrium model to estimate
the ancillary benefits of policies that reduce carbon emissions.8 It models the links be-
tween emissions and concentrations of NOx, SO2 , and particulates at the regional level
(the concentrations of major pollutants in major cities were modeled as a function of
emissions in four regions of the country). The estimated ancillary benefits—defined in
terms reduced mortality and morbidity caused by reduced particulate concentrations—
Figure 2.1. Avoided cost of coal-based generation
Source: Authors.
0
2
4
6
8
10
12
14
16
18
20
Coal Gas Diesel
R s / k W h
Cost of coal-based generation
Cost of coal based generation including local environmental premium
Cost of coal based generation including local and global environmental premium

8/6/2019 Unleashing the Potential of Renewable Energy in India
http://slidepdf.com/reader/full/unleashing-the-potential-of-renewable-energy-in-india 33/60
Unleashing the Potential of Renewable Energy in India 15
are 334 lives saved/million tons of carbon abated, or $58/ton (at the 1995 exchange rateand 1995 prices) of carbon emissions reduced in monetary terms. A one-ton reduction in
carbon emissions is thus associated with a reduction in local pollutants worth about $58
in 1995 dollars ($93 in 2008 dollars). The local environmental premium thus amounts to
Rs 0.66/kWh.
Generating electricity from renewable sources implies that an equivalent volume of
coal used to generate the same amount of electricity is not burned. The pricing of CO2
emissions in the European Union at $10/ton presents the financial price and the lower
bound of valuation. This price reflects a limited market, in which modest targets for
reducing CO2 from large combustion sources in the European Union are set. It is not
the cost of a ton of CO2 in terms of damage caused or a measure of the price at which aton of savings of CO2 generated from the project would sell. The cost of a ton of CO 2 in
terms of damage caused is considerably higher than $10. It is more appropriate to use
the unit damage values arising from CO2: $32/tCO2 has been employed in this report as
the global value of carbon emissions.9 The global environmental premium thus amounts
to Rs 1.22/kWh. However, the global environmental benefits may not be fully translated
into monetary terms if there is a global climate agreement.
Small hydropower is the most economically viable form of renewable technology,
with an average economic cost of Rs 3.56/kWh. This resource is the most aractive in
Haryana, Punjab, Himachal Pradesh, Uaranchal, and Andhra Pradesh, where the cost
is less than the average cost. With the exception of Andhra Pradesh, these states arelocated in the north. Together they have unharnessed potential of about 5 GW (figure
2.2). At this cost of generation, small hydropower is competitive with the avoided cost of
Box 2.3. Definition of economic cost and benefit
The economic cost of renewable power generation captures the total investment cost in-
curred by the economy to produce it. The levelized economic cost is discounted at a 10
percent rate, which is typically used for economic analysis. The economic cost is estimated
net of taxes and subsidies imposed by the government.
The economic benefit of renewable energy is measured by opportunity or avoided cost. The
cost of building the marginal coal power plant is considered the economic value of developing
renewable energy. In addition to the base cost of building a coal-based power plant, there
are associated local and global environmental effects because of the increase in carbon
emissions at the global level and the contribution to local environmental damage. Reducing
such damages through renewables raises the avoided cost of generation and represents the
competitive advantage of renewable resources.
Assessing the competitiveness of renewable energy involves comparing the economic cost
of coal-based generation with and without environmental premiums. The other avoided fuels
considered are gas and diesel, which are used on a long-term basis to generate power.
The renewable energy supply curve shows the economically viable quantity of renewable
energy that can be supplied at a given price. This curve intersects the avoided cost of coal
generation at a specific point, identifying the economically optimal level of renewable energy
supply. The supply curve is prepared by arranging the cost of generation for renewables for
different states in ascending order and superimposing the cumulative capacity (installed ca-
pacity and unexploited potential) (figure 2.3).
Source: Authors.

8/6/2019 Unleashing the Potential of Renewable Energy in India
http://slidepdf.com/reader/full/unleashing-the-potential-of-renewable-energy-in-india 34/60
World Bank Study16
coal-based generation, highlighting the need to address institutional barriers for small
hydropower in these states, including through integrated approaches to evacuation in-
frastructure development and clearances (elaborated on in chapter 3).The average economic cost of generation is Rs 4.6/kWh for biomass and Rs 4.9/kWh
for wind. These costs are competitive with gas- and diesel-based generation. However,
the availability and price fluctuations of biomass under a regulated market pose a sig-
nificant risk to scale-up. The economic cost of biomass-generated power ranges between
Rs 3.9–Rs 5.7/kWh. The generation cost of wind is highly sensitive to the capacity utili-
zation factor, which is low (about 23 percent). The economic cost of wind power ranges
between Rs 3.8–Rs 5.2/kWh. A substantial proportion of wind capacity (about 37 GW) is
in the four states of Andhra Pradesh Gujarat, Karnataka, and Tamil Nadu.
Solar power is the most expensive renewable resource. Unit costs are estimated to
be Rs 12/kWh for solar thermal and Rs 17/kWh for solar photovoltaic—comparable to orlower than the cost of diesel-based generation.10 Solar technologies become even more
competitive when the associated environmental externalities of diesel-based generation
are taken into account.
The high cost of production reflects the high capital cost and low plant-load factor
compared with other renewable technologies. The capital costs of generating 1 MW of
power are Rs 170 million (with a plant- load factor of 19 percent) for solar photovoltaic
and Rs 130 million for solar thermal (with a plant-load factor of 23 percent). However, the
economics of solar power are expected to improve significantly over the next two decades.
The economy can aff ord to supply about 3 GW of renewable capacity at minimum
avoided cost of Rs 3.08/kwh, all of it from small hydropower. The renewable energy sup-ply curve intersects the local environmental benefits curve (the cost of coal generation +
the local environmental premium) at 9 GW and the global environmental curve (the cost
Figure 2.2. Economic cost of generating power using renewable energy, by state
(Rs/kWh)
Source: Authors.
0
2
4
6
8
10
12
14
16
18
20
H a r y a n a ( S H
P )
P u n j a
b ( S H
P )
H i m a c h a
l P r a d e s h (
S H P )
U t t a r a n c h a l ( S H
P )
A n d h r a P r a d
e s h (
S H P )
A r u n a c h a l ( S H
P )
J & K ( S H
P )
M e g h a l a y
a ( S H
P )
M i z o r a m
( S H P )
N a g a l a n
d ( S H
P )
S i k k i m
( S H P
)
K a r n a t a k
a ( S H
P )
T a m i l N
a d u ( W i
n d )
M a h a r a s
h t r a ( S H
P )
K a r n a t a k a ( W i
n d )
M a d h y a
P r a d e s h
( B i o m a
s s )
A n d h r a
P r a d e s h
( B i o m
a s s )
A n d h r a P r a d
e s h ( W i
n d )
G u j a r a
t ( W i n d )
M a d h y a
P r a d e s h ( W i
n d )
M a d h y a P r a d
e s h (
S H P )
K e r a l
a ( W i
n d )
R a j a s t h a n
( B i o m a
s s )
M a h a r a s h t r a
( B i o m a
s s )
M a h a r a s
h t r a ( W i
n d )
C h h a
t t i s g a r h ( B i o
m a s s )
K a r n a t a k a
( B i o m
a s s )
G u j a r a t ( B i o
m a s s )
T a m i l N a d u
( B i o m a
s s )
R a j a s t h a
n ( W i
n d )
W e s t B e n
g a l ( W i
n d )
H a r y a n a
( B i o m
a s s )
S o l a r
T h e r m
a l
S o l a r
P V
R s / k W h
RE-based generation Coal-based generation Local Environmental Premium
Global Environmental Premium Gas-based generation Diesel-based generation
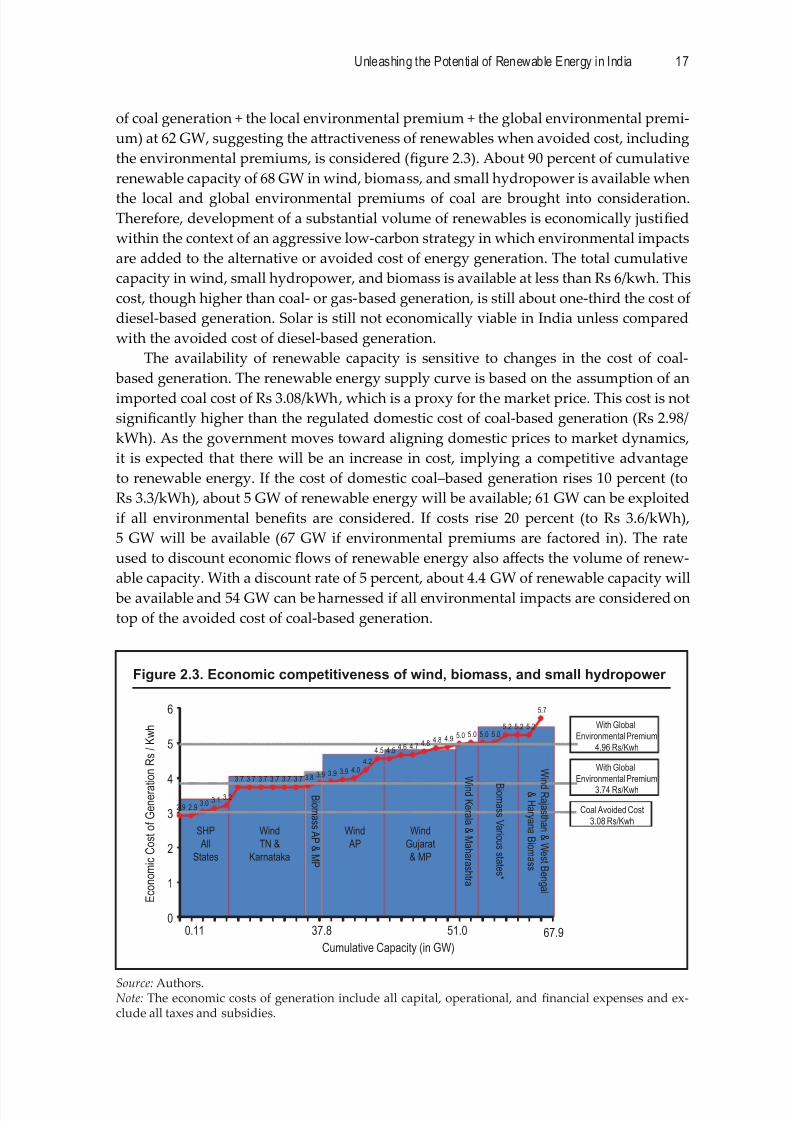
8/6/2019 Unleashing the Potential of Renewable Energy in India
http://slidepdf.com/reader/full/unleashing-the-potential-of-renewable-energy-in-india 35/60
Unleashing the Potential of Renewable Energy in India 17
of coal generation + the local environmental premium + the global environmental premi-
um) at 62 GW, suggesting the aractiveness of renewables when avoided cost, including
the environmental premiums, is considered (figure 2.3). About 90 percent of cumulative
renewable capacity of 68 GW in wind, biomass, and small hydropower is available when
the local and global environmental premiums of coal are brought into consideration.Therefore, development of a substantial volume of renewables is economically justified
within the context of an aggressive low-carbon strategy in which environmental impacts
are added to the alternative or avoided cost of energy generation. The total cumulative
capacity in wind, small hydropower, and biomass is available at less than Rs 6/kwh. This
cost, though higher than coal- or gas-based generation, is still about one-third the cost of
diesel-based generation. Solar is still not economically viable in India unless compared
with the avoided cost of diesel-based generation.
The availability of renewable capacity is sensitive to changes in the cost of coal-
based generation. The renewable energy supply curve is based on the assumption of an
imported coal cost of Rs 3.08/kWh, which is a proxy for the market price. This cost is not
significantly higher than the regulated domestic cost of coal-based generation (Rs 2.98/
kWh). As the government moves toward aligning domestic prices to market dynamics,
it is expected that there will be an increase in cost, implying a competitive advantage
to renewable energy. If the cost of domestic coal–based generation rises 10 percent (to
Rs 3.3/kWh), about 5 GW of renewable energy will be available; 61 GW can be exploited
if all environmental benefits are considered. If costs rise 20 percent (to Rs 3.6/kWh),
5 GW will be available (67 GW if environmental premiums are factored in). The rate
used to discount economic flows of renewable energy also aff ects the volume of renew-
able capacity. With a discount rate of 5 percent, about 4.4 GW of renewable capacity will
be available and 54 GW can be harnessed if all environmental impacts are considered on
top of the avoided cost of coal-based generation.
Figure 2.3. Economic competitiveness of wind, biomass, and small hydropower
Source: Authors.Note: The economic costs of generation include all capital, operational, and financial expenses and ex-clude all taxes and subsidies.
B i o m a s s A P & M P
SHP
All
States
Wind
TN &
Karnataka
Wind
AP
Wind
Gujarat
& MP
Wi n d K e r a l a & M a h a r a s h t r a
B i o m a s s V a r i o u s s t a t e s *
Wi n d R a j a s t h a n & W e s t B e n g a l
& H a r y a n a B i o m a s s
2.9 2.93.0 3.1 3.2
3 .7 3 .7 3 .7 3 .7 3 .7 3 .7 3.8 3.9 3.9 3.9 4.04.2
4.5 4.5 4.6 4.7 4.8 4.8 4.9 5.0 5.0 5.0 5.05.2 5.2 5.2
5.7
0
1
2
3
4
5
6
E c o n o m i c C o s t o f G e n e r a t i o n R s / K w h
0.11 67.951.037.8
Cumulative Capacity (in GW)
With Global
Environmental Premium
4.96 Rs/Kwh
With Global
Environmental Premium
3.74 Rs/Kwh
Coal Avoided Cost
3.08 Rs/Kwh

8/6/2019 Unleashing the Potential of Renewable Energy in India
http://slidepdf.com/reader/full/unleashing-the-potential-of-renewable-energy-in-india 36/60
World Bank Study18
Viability of Renewable Energy Generation from the
Perspective of the Utility and Developer
The financial opportunity cost of developing renewable energy includes both the long-
term cost of procuring power and short-term trading prices (box 2.4). A “short-term”transaction refers to contracts of less than a year procured through interstate trading
licenses and directly by distribution licensees, power exchanges (the India Energy Ex-
change and Power Exchange of India Ltd.) and unscheduled interchange charges.11 As
of 2009, the short-term market represented about 8 percent of total energy generated in
India.12 The short-term trading cost is estimated at Rs 5/kWh–Rs 6.4/kWh, depending on
the method used to procure power (figure 2.4).
Box 2.4. Definition of financial cost and benefit
The levelized financial cost represents the cost developers face in undertaking a renewable
energy project. The total financial cost, inclusive of taxes and exclusive of subsidies and
customs duty savings, is defined as the sum of operating and financial charges. The totalfinancial cost is discounted using a rate of 16–17 percent (depending on the technology used)
over the life of the asset. The taxes levied on developers are the corporate tax rate of 33.99
percent and the minimum alternate tax of 16.99 percent. For all technologies, a 10-year tax
holiday for corporate tax rate applies. Developers are required to pay these taxes only after
the initial period of development is completed.
Although the tax rate is similar across technologies, the unit burden of taxes differs depend-
ing on the capital cost, which ranges from Rs 0.09/kWh for biomass to Rs 1.8/kWh for solar
photovoltaic. Subsidies for renewable energy come in various forms, such as accelerated
depreciation for wind and solar development and generation-based incentives in wind power
and capital subsidies for small hydropower and biomass, with special consideration for the
states of Himachal Pradesh and Uttaranchal. Subsidies can range from Rs 0.02/kWh for bio-
mass to Rs 0.98/kWh for solar photovoltaic . In addition, customs duty savings are provided
for wind (Rs 0.21/kWh) and biomass equipment (Rs 0.14/kWh).
Source: Authors.
Notes: a. CERC Notification No. Eco 2/2008-CERC for guidelines on tariff determination
b. The developers are required to pay the minimum alternative tax even in the tax holiday period
Figure 2.4. Short-term traded cost of electricity, 2007–09
Source: CERC.
0
1
2
3
4
5
6
7
8
Price of electricity
transacted throughtrading licenses (Rs/kwh)
Price of electricity
transacted throughpower exchanges (Rs/kwh)
Price of electricity
transacted throughUI (Rs/kwh)
R s / k W h
2007
2008
2009

8/6/2019 Unleashing the Potential of Renewable Energy in India
http://slidepdf.com/reader/full/unleashing-the-potential-of-renewable-energy-in-india 37/60
Unleashing the Potential of Renewable Energy in India 19
From the utility’s point of view, buying renewable energy makes business sense
only when compared with short-term power purchase cost. The cost of buying renew-
able energy at feed-in tariff s is significantly lower than any of the short-term methods
of procuring power. The severe energy shortage in many Indian states has forced utili-
ties to buy short-term power at often very high prices. The gamut of renewable energyin wind, biomass, and small hydropower will be available at below the lower bound
of short-term prices. However, the bulk of power procurement still remains with PPAs
with primarily coal- and gas-fired plants. The opportunity cost with which the utility
chooses to compare its renewable energy expenses depends on the individual energy
mix and future business plan. The prices facing the utilities are Rs 3.14/kWh for coal-
based, Rs 3.6/kWh for gas-based, and Rs 12.3/kWh for diesel-based generation, inclu-
sive of financial transfers (figure 2.5). At the cost of coal-based generation, renewable
capacity is not available. About 5 GW of capacity is available at the cost of gas-based
generation; the capacity of wind, biomass, and small hydropower is available at the cost
of diesel-based generation. Solar power is not financially viable at any opportunity cost
and requires additional support from the government. The JNNSM aims to provide that
support by introducing several incentives, including bringing cost of solar energy to par-
ity with grid costs. The utilities will need to be incentivized to ensure that investments in
renewable energy make sound business sense.
From the developer’s point of view, financial barriers remain. In most cases (excep-
tions include Haryana and Punjab in small hydropower and Andhra Pradesh in bio-
mass), tariff s are lower than the cost of production, in some cases by more than Rs 1/
kWh (figure 2.6). Tariff s have to be more competitive to enable more private players to
participate in the market for renewable energy generation.
Figure 2.5. Financial cost of renewable energy from the utility’s perspective, by state
Source: Authors, based on data from CERC.
0
5
10
15
20
25
H a r y a
n a ( S H
P )
P u n j a
b ( S H
P )
H i m a c h
a l P r a
d e s h
( S H P )
U t t a r a
n c h a
l ( S H P )
A n d h r a
P r a d e s h
( S H P )
M a d h y a
P r a d
e s h (
B i o m a
s s )
A r u n a
c h a l ( S
H P )
J & K ( S H
P )
M e g h
a l a y a
( S H P )
M i z o r a m
( S H P
)
N a g a l a n
d ( S H
P )
S i k k i m
( S H P )
K a r n a
t a k a ( S H
P )
M a h a
r a s h t r
a ( S H
P )
A n d h r a
P r a d e
s h ( B i o m
a s s )
T a m i l N
a d u ( W i
n d )
K a r n a
t a k a ( W i
n d )
R a j a s
t h a n (
B i o m a
s s )
M a h a
r a s h t r
a ( B i o
m a s s )
C h h a
t t i s g a r h
( B i o m a
s s )
K a r n a
t a k a ( B i o
m a s s )
G u j a r
a t ( B i
o m a s s )
A n d h r a
P r a d e s h
( W i n d )
G u j a r
a t ( W i
n d )
M a d h y a
P r a d e s h (
S H P )
M a d h y a
P r a d
e s h ( W i
n d )
T a m i l N
a d u (
B i o m a
s s )
K e r a l
a ( W i
n d )
M a h a
r a s h t r
a ( W i
n d )
H a r y a
n a ( B i o m
a s s )
R a j a s
t h a n ( W i
n d )
W e s t B e
n g a l ( W i
n d )
S o l a r
P V
S o l a r
T h e r m
a l
R s / k W h
Financial cost Price of electricity transacted
through trading licenses (Rs/kwh)
Price of electricity transacted
through power exchanges (Rs/kwh)
Price of electricity transacted
through UI (Rskwh)
Coal Gas Diesel

8/6/2019 Unleashing the Potential of Renewable Energy in India
http://slidepdf.com/reader/full/unleashing-the-potential-of-renewable-energy-in-india 38/60
World Bank Study20
Achieving the government’s goal for the next decade will require an annual subsidy
of $1 billion–$6 billion, depending on choices made. This may change as the renewable
energy certificate trading mechanism evolves. There is still significant scope for improv-
ing the bankability of renewable energy to aract developers to invest in renewable en-
ergy. To reach the goal of installing 40 GW of additional capacity of renewables in the
next 10 years, the government could provide subsidies to achieve parity between the
cost of renewable energy and coal-based generation (table 2.1) A back-of-the-envelope
estimation is made by identifying the size of subsidy required to bring levelized cost of
Table 2.1. Resources required to achieve 40 GW of renewable energy
Scenario Fuel mix (for 40 GW)
Total subsidy required
(over 10 years)
Annual subsidy
required
1 Wind (25 GW), SHP (5 GW), Biomass (10 GW) Rs 777 billion Rs 77 billion($1.7 billion)
2 Wind (25 GW), SHP (15 GW) Rs 450 billion Rs 45 billion($1 billion)
3 Wind (15 GW), SHP (20 GW), Biomass (5 GW) Rs 493 billion Rs 49 billion($1.1 billion)
4 Wind (5 GW), SHP (5 GW), Biomass (10 GW),Solar PV (10 GW), Solar Thermal (10 GW)
Rs 2.98 trillion Rs 0.29 trillion($6 billion)
Source: Authors.
Figure 2.6. Gap between cost and tariffs of renewable energy, by state and
energy source
Source: Authors calculations based on SERC tariff orders.
-0.5 0 0.5 1
Punjab (SHP)
Haryana (SHP)
Andhra Pradesh (Biomass)
Rajasthan (Biomass)
Uttaranchal (SHP)
Maharashtra (Biomass)
Madhya Pradesh (Biomass)
Tamil Nadu (Biomass)
Himachal Pradesh (SHP)Tamil Nadu (Wind)
Karnataka (Wind)
Andhra Pradesh (SHP)
Madhya Pradesh (Wind)
Maharashtra (SHP)
Karnataka (SHP)
Haryana (Biomass)
Andhra Pradesh (Wind)
Gujarat (Wind)
West Bengal (Wind)
Karnataka (Biomass)
Gujarat (Biomass)
Chhattisgarh (Biomass)
Maharashtra (Wind)Rajasthan (Wind)
Kerala (Wind)
Rs/kWh
–2.5 –2 –1.5 –1

8/6/2019 Unleashing the Potential of Renewable Energy in India
http://slidepdf.com/reader/full/unleashing-the-potential-of-renewable-energy-in-india 39/60
Unleashing the Potential of Renewable Energy in India 21
renewable energy to avoided cost (at a coal-based generation price of Rs 3.08/kWh). The
amount is equal to the up-front capital subsidy or net present value of generation-based
incentives. The estimated resource requirement ranges from Rs 450 billion (about $10
billion) for low-cost renewable energy but low diversity of renewable energy sources
to Rs 2.9 trillion (about $64 billion) for high-cost renewable energy with significant di-versity of renewable energy sources. Provision of low-cost renewable energy is not pro-
hibitively expensive when spread over 10 years, with an annual bill of about $1 billion
(table 2.1).
Notes
1. Energy Technology Prospective 2008, IEA.
2. Energy Technology Prospective 2008, IEA.
3. World Energy Outlook 2009, IEA.
4. Awerbuch, S., and M. Berger, 2006 “A Portfolio Approach to Energy Planning in Mexico.” Draft
report. Instituto de Investigaciones Eléctricas , Cuernavaca, Mexico.5. Energy Technology Perspective, 2008; IEA, 2009.
6. Awerbuch, S., 2006, “The Value of Renewable: Portfolio Diversification, Energy Security, and
Free Hedging.” Paper presented at the International Grid-Connected Renewable Energy Policy
Forum, February 1–3 Mexico City.
7. hp://assets.wwfindia.org/downloads/re_thinking_coal_s_rule_in_india.pdf.
8. Bussolo, Maurizio, and D. O’Connor, 2001. Clearing the Air in India: The Economics of Climate Policy
with Ancillary Bene fits. Technical Paper 182. Paris: OECD Development Centre.
9. Markandya, A., B. G. Armstrong, S. Hales, A. Ciabai, P. Criqui, S. Mima, C. Tonne, and P. Wilkin-
son, 2009. “Health and Climate Change 3: Public Health Eff ects of Strategies to Reduce Green-
house-Gas Emissions: Low-Carbon Electricity Generation.” Lancet 374 (9706): 2006–15.
10. The National Solar Mission (2009) projects a 50 percent reduction in the capital cost by 2012.
Such a scenario may render solar projects economically competitive, with a cost lower than that of
diesel-based generation.
11. CERC 2010, Annual Report: Short-Term Power Market in India , New Delhi.
12. The development of a competitive power market was one of the cornerstones of the Electricity
Act 2003, which facilitated trading at various levels.
8/6/2019 Unleashing the Potential of Renewable Energy in India
http://slidepdf.com/reader/full/unleashing-the-potential-of-renewable-energy-in-india 40/60
22
C H A P T E R 3
What: Establishment of anEnabling Environment for
Renewable Energy Development
This chapter provides an overview of the legal, regulatory, and institutional frame-
work in India and reviews unresolved issues raised in extensive discussions with
representatives of industry, regulatory authorities, and other stakeholders. It presents
10 main barriers for developing renewable energy and 10 possible solutions. It indicates
how the government could create a more conducive environment to aract private in-
vestments in renewable energy and examines how the strength of India’s dynamic pri-
vate sector could be beer leveraged to meet its ambitious renewable energy goals. The
chapter concludes by prioritizing proposed interventions and indicating a way forward.
In recent years India has established an overarching policy and institutional frame-
work. However, multiple regulatory and institutional overlaps have led to ineff ectivecoordination that has resulted in continuing implementation gaps. The barriers that hold
back renewable energy development relate to three broad areas: thefinancial viability of
renewable energy projects, the lack of soft and hard support infrastructure, and regula-
tory and process delays, which increase transaction costs.
Addressing financial issues requires streamlining financial incentives, moving to
a market-based approach for seing tariff s, addressing concerns about financing re-
newable energy projects, creating new long-term funding sources, and most important,
tapping into the private sector’s willingness and ability to pay for renewable energy
generation. Investments in support infrastructure need to be made to ensure timely
transmission evacuation and access infrastructure, provide quality and easily accessibleresource information, and catalyze the development of industry supply chains. Policy
implementation must be made eff ective on the ground, and the capacity and capability
of state nodal agencies should be strengthened to facilitate renewable energy development
and reduce the cost of doing business for renewable energy investors. These eff orts could
be implemented in a gradual, risk-tolerant approach with emphasis on quick wins. Pilot
programs could be launched around the idea of renewable energy parks, which could
create integrated infrastructure for investors in renewable energy resource–rich areas.
The Current Operating Environment
India has already put in place significant policy, regulatory, and financial incentives to
encourage renewable energy development. The landmark Electricity Act 2003 aimed at
fostering competition, private investment, and power for all. De-licensing generation

8/6/2019 Unleashing the Potential of Renewable Energy in India
http://slidepdf.com/reader/full/unleashing-the-potential-of-renewable-energy-in-india 41/60
Unleashing the Potential of Renewable Energy in India 23
and allowing open access probably had the greatest impact on jump-starting renewable
energy development. The act explicitly recognized the role of renewable projects for sup-
plying power to the utility grid as well as in stand-alone systems. It provided an overall
framework for preferential feed-in tariff s and quotas for renewable energy. It also in-
troduced a host of important reforms, such as allowing captive generation, establishingprovisions for power trading, and allowing phased open access to both transmission and
distribution. All these steps had a substantial impact on aracting private investment
into the power sector. As a result, renewable energy capacity grew dramatically.
Subsequent initiatives, such as the National Tariff Policy 2005, articulated the gov-
ernment’s vision of universal provision of “power to all’’ by 2012 and an increase in per
capita consumption to 1,000 kWh by 2012.1 The two policies established a strong frame-
work for both supply-side incentives with preferential feed-in tariff s and demand-side
stimulus with RPOs.
A number of dedicated institutions were created to facilitate development of re-
newable energy. On the institutional side, the MNRE has been playing a key role in
catalyzing all aspects of renewable energy development, from resource mapping to R&D
investment and promotional projects. On the financing side, the India Renewable En-
ergy Development Agency (IREDA) has a long track record of providing financial support
to renewable energy projects. Agencies for promoting renewable energy have been set up in
most states as well. Although there are gaps in these institutions like inadequate capability at
state nodal agencies and lack of adequate renewable energyfinancing, a nascent institutional
infrastructure does exist for renewable energy on which future development can be built.
The impact of various policy and regulatory initiatives has been mixed. Of India’s
numerous policy and financial incentives, two have had the clearest correlation with in-
stalled capacity. The wind sector–specific eff orts of the mid-1990s, including accelerated
depreciation, preferential tariff s, and resource mapping initiatives, and the landmark
umbrella Electricity Act 2003 have had the most tangible impact on the industry growth
(figure 3.1). The link between other initiatives and sector growth is less clear.
Figure 3.1. Key legislation and increases in renewable energy capacity, 1993/94–
2009/10
Source: PwC analysis for World Bank.
1,475
2,196
10,784
0
2,000
4,000
6,000
8,000
10,000
12,000
14,000
16,000
1 9 9 3
- 9 4
1 9 9 4
- 9 5
1 9 9 5
- 9 6
1 9 9 6
- 9 7
1 9 9 7
- 9 8
1 9 9 8
- 9 9
1 9 9 9
- 2 0 0 0
2 0 0 0
- 0 1
2 0 0 1
- 0 2
2 0 0 2
- 0 3
2 0 0 3
- 0 4
2 0 0 4
- 0 5
2 0 0 5
- 0 6
2 0 0 6
- 0 7
2 0 0 7
- 0 8
2 0 0 8
- 0 9
2 0 0 9
- 1 0
I n s t a l l e d ( M W )
SHP Biomass and Cogen Wind
MNRE Policy and
tariff guidelines
Creation of Ministry of
New and Renewable
Energy (1992)
Accelerated
Depreciation for Wind
Electricity Act 2003
State Electricity Regulatory
Commission start setting up Feed
in Tariff for Renewable Energy
National Tariff Policy–
Renewable Purchase
Obligations Generation Based
Incentives for Wind
National Action Plan on Climate
Change
Integrated Energy Policy
sets Renewable Energy
Targets
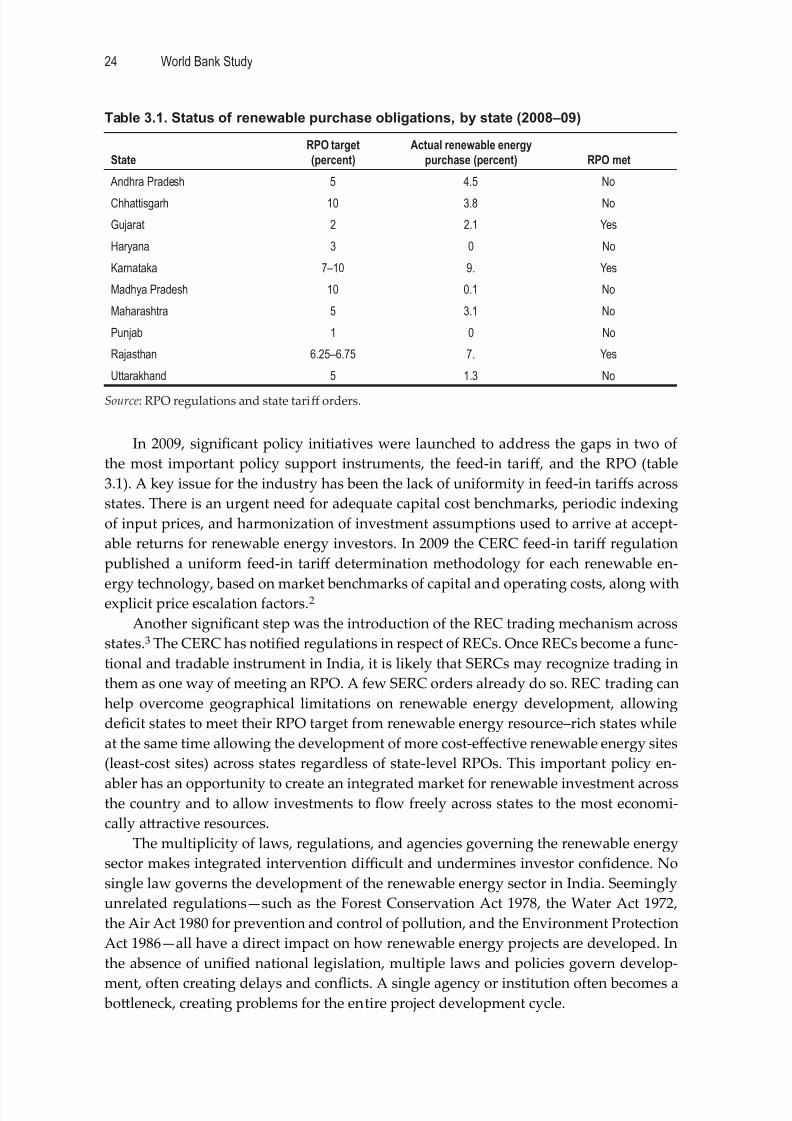
8/6/2019 Unleashing the Potential of Renewable Energy in India
http://slidepdf.com/reader/full/unleashing-the-potential-of-renewable-energy-in-india 42/60
World Bank Study24
In 2009, significant policy initiatives were launched to address the gaps in two of
the most important policy support instruments, the feed-in tariff , and the RPO (table
3.1). A key issue for the industry has been the lack of uniformity in feed-in tariff s across
states. There is an urgent need for adequate capital cost benchmarks, periodic indexing
of input prices, and harmonization of investment assumptions used to arrive at accept-
able returns for renewable energy investors. In 2009 the CERC feed-in tariff regulation
published a uniform feed-in tariff determination methodology for each renewable en-
ergy technology, based on market benchmarks of capital and operating costs, along withexplicit price escalation factors.2
Another significant step was the introduction of the REC trading mechanism across
states.3 The CERC has notified regulations in respect of RECs. Once RECs become a func-
tional and tradable instrument in India, it is likely that SERCs may recognize trading in
them as one way of meeting an RPO. A few SERC orders already do so. REC trading can
help overcome geographical limitations on renewable energy development, allowing
deficit states to meet their RPO target from renewable energy resource–rich states while
at the same time allowing the development of more cost-eff ective renewable energy sites
(least-cost sites) across states regardless of state-level RPOs. This important policy en-
abler has an opportunity to create an integrated market for renewable investment acrossthe country and to allow investments to flow freely across states to the most economi-
cally aractive resources.
The multiplicity of laws, regulations, and agencies governing the renewable energy
sector makes integrated intervention diffi cult and undermines investor confidence. No
single law governs the development of the renewable energy sector in India. Seemingly
unrelated regulations—such as the Forest Conservation Act 1978, the Water Act 1972,
the Air Act 1980 for prevention and control of pollution, and the Environment Protection
Act 1986—all have a direct impact on how renewable energy projects are developed. In
the absence of unified national legislation, multiple laws and policies govern develop-
ment, often creating delays and conflicts. A single agency or institution often becomes a boleneck, creating problems for the entire project development cycle.
Table 3.1. Status of renewable purchase obligations, by state (2008–09)
State
RPO target
(percent)
Actual renewable energy
purchase (percent) RPO met
Andhra Pradesh 5 4.5 No
Chhattisgarh 10 3.8 No
Gujarat 2 2.1 Yes
Haryana 3 0 No
Karnataka 7–10 9. Yes
Madhya Pradesh 10 0.1 No
Maharashtra 5 3.1 No
Punjab 1 0 No
Rajasthan 6.25–6.75 7. Yes
Uttarakhand 5 1.3 No
Source: RPO regulations and state tariff orders.

8/6/2019 Unleashing the Potential of Renewable Energy in India
http://slidepdf.com/reader/full/unleashing-the-potential-of-renewable-energy-in-india 43/60
Unleashing the Potential of Renewable Energy in India 25
Development of the renewable energy sector also depends on multiple institutions,
which are empowered under diff erent laws and often lack coordination. These institu-
tions include the Ministry of Power, the MNRE, the CERC and SERCs, state govern-
ments, state nodal agencies, and regional electricity corporations (table 3.2). The lack of
coordination among them leaves critical implementation gaps. The Ministry of Power isresponsible for national electricity policy and national tariff policy, both of which play
a key role in promoting procurement of renewable energy–based power. The MNRE
has a direct mandate for renewable energy in all policy and programmatic aspects. The
SERCs, which have the most direct impact on feed-in tariff s, RPOs, and open-access
charges, are loosely bound by the directives and guidelines of the CERC. All central
agencies have a state counterpart, which has the final say on how renewable energy proj-
ects are developed. Progress on the ground depends mainly on state-level policies on
feed-in tariff s and RPOs, evacuation, clearances, open access, and facilitation from state
nodal agencies. More often than not, one or more of these elements becomes a boleneck
in developing renewable energy projects.
Table 3.2. Roles of state and central government agencies in policy development,
regulation, and promotion of renewable energy
Level
Central government
(Ministry of Power/
Ministry of Finance) MNRE CERC
Central • Develops nationalelectricity tariff policies,which also coverrenewable energy
• Provides fiscalincentives forpromoting renewableenergy
• Develops national renewable energy laws• Sets technical standards for renewable energy• Conducts resource assessments for renewable
energy; supports R&D in renewable energy
technologies• Promotes effective use of information technology
for renewable energy, manages database• Reviews renewable energy programs to understand
their effectiveness and ef ficiency
• Sets guidelines forfeed-in tariff designfor different renewableenergy technologies
• Regulates the regionalelectricity corporationmechanism
• Regulates interstateopen access, and third-party sales
State State government State nodal agency SERCs
• Develops state- levelrenewable energypolicy
• Provides fiscalincentives for
promoting renewableenergy sources
• Conducts resource assessments for variousrenewable energy sources
• Allocates renewable energy projects and progressmonitors
• Provides facilitation services to project developers
—IREDA personnel escort project developers tovarious government departments with the objectiveof facilitating and streamlining clearances
• Facilitates clearances and land acquisition• Creates awareness and educates the masses
about adoption of renewable energy• Maintains database on renewable energy sources
• Develops feed-in tariffmethodologies fordifferent renewableenergy technologies
• Determines RPOs
and enforcementmechanism
• Sets regulations onintrastate wheeling,open access, and third-party sale
Source: PwC analysis for World Bank.
Creating a national renewable energy law and crafting an integrated policy would
enable a coordinated national economic perspective and would help drive focus from
fragmented uncoordinated state policies. It would also help provide beer clarity onthe rules of the game, the requirements to be followed, and the roles and responsibilities
of diff erent institutions involved in the development of renewable energy sources. Al-
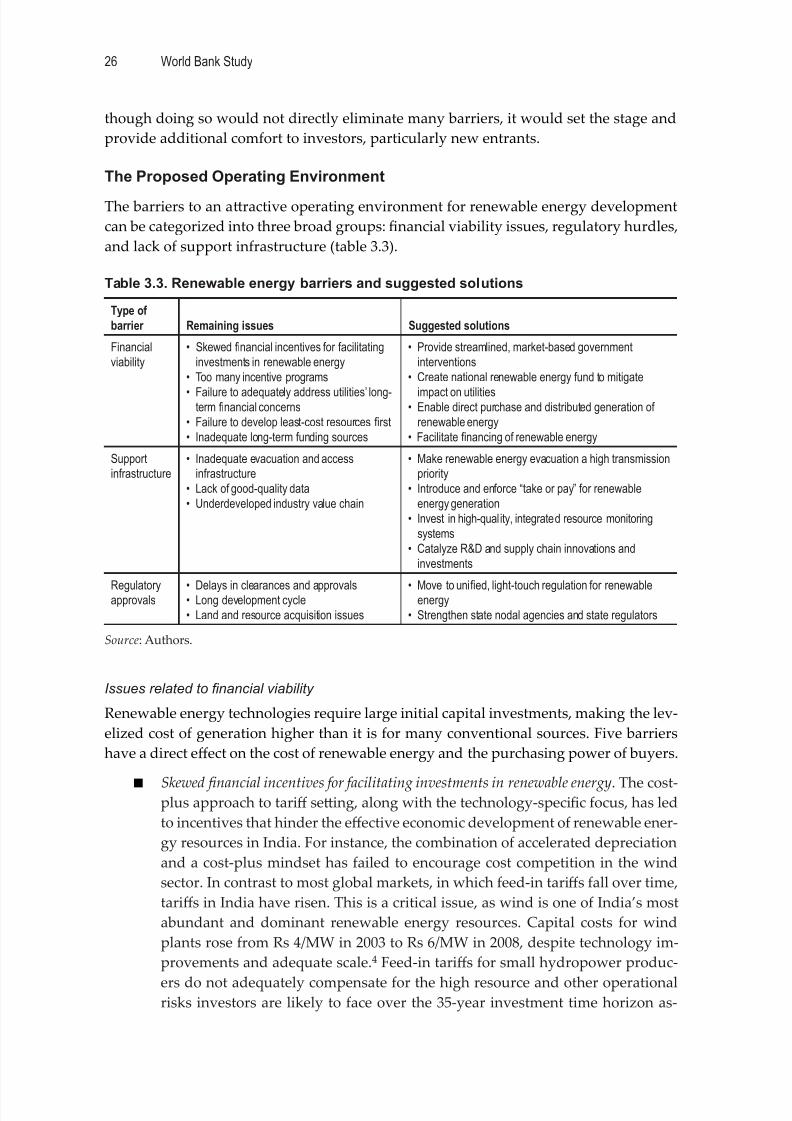
8/6/2019 Unleashing the Potential of Renewable Energy in India
http://slidepdf.com/reader/full/unleashing-the-potential-of-renewable-energy-in-india 44/60
World Bank Study26
though doing so would not directly eliminate many barriers, it would set the stage and
provide additional comfort to investors, particularly new entrants.
The Proposed Operating Environment
The barriers to an aractive operating environment for renewable energy development
can be categorized into three broad groups: financial viability issues, regulatory hurdles,
and lack of support infrastructure (table 3.3).
Table 3.3. Renewable energy barriers and suggested solutions
Type of
barrier Remaining issues Suggested solutions
Financialviability
• Skewed financial incentives for facilitatinginvestments in renewable energy
• Too many incentive programs
• Failure to adequately address utilities’ long-term financial concerns
• Failure to develop least-cost resources first• Inadequate long-term funding sources
• Provide streamlined, market-based governmentinterventions
• Create national renewable energy fund to mitigate
impact on utilities• Enable direct purchase and distributed generation of
renewable energy• Facilitate financing of renewable energy
Supportinfrastructure
• Inadequate evacuation and accessinfrastructure
• Lack of good-quality data• Underdeveloped industry value chain
• Make renewable energy evacuation a high transmissionpriority
• Introduce and enforce “take or pay” for renewableenergy generation
• Invest in high-quality, integrated resource monitoringsystems
• Catalyze R&D and supply chain innovations andinvestments
Regulatoryapprovals • Delays in clearances and approvals• Long development cycle• Land and resource acquisition issues
• Move to unified, light-touch regulation for renewableenergy
• Strengthen state nodal agencies and state regulators
Source: Authors.
Issues related to fi nancial viability
Renewable energy technologies require large initial capital investments, making the lev-
elized cost of generation higher than it is for many conventional sources. Five barriers
have a direct eff ect on the cost of renewable energy and the purchasing power of buyers.
■ Skewed financial incentives for facilitating investments in renewable energy. The cost-plus approach to tariff seing, along with the technology-specific focus, has led
to incentives that hinder the eff ective economic development of renewable ener-
gy resources in India. For instance, the combination of accelerated depreciation
and a cost-plus mindset has failed to encourage cost competition in the wind
sector. In contrast to most global markets, in which feed-in tariff s fall over time,
tariff s in India have risen. This is a critical issue, as wind is one of India’s most
abundant and dominant renewable energy resources. Capital costs for wind
plants rose from Rs 4/MW in 2003 to Rs 6/MW in 2008, despite technology im-
provements and adequate scale.4 Feed-in tariff s for small hydropower produc-
ers do not adequately compensate for the high resource and other operationalrisks investors are likely to face over the 35-year investment time horizon as-
8/6/2019 Unleashing the Potential of Renewable Energy in India
http://slidepdf.com/reader/full/unleashing-the-potential-of-renewable-energy-in-india 45/60
Unleashing the Potential of Renewable Energy in India 27
sumed in CERC guidelines. Small hydropower is the only renewable energy
resource for which the financial costs are higher than economic costs (because
of unfavorable taxes and subsidy scheme). Many states are willing to pay well
above Rs 4/kWh for wind electricity, while they can develop small hydropower
for Rs 3/kWh. In a number of states small hydropower tariff s are even lowerthan tariff s for new coal- or gas-powered plants.
■ Too many incentive programs. India off ers every possible type of incentive, in-
cluding feed-in tariff s; generation-based incentives; RPOs; central, state, and
regional capital subsidies; accelerated depreciation; and tax incentives. The in-
centives are off ered by diff erent central and state agencies. Some have formulas
that base the subsidy on nonlinear functions. The eff ect is unintended overlaps,
reduced transparency and fiscal discipline, unnecessary complexity in claiming
subsidies, and ineff ective leverage for the amount spent on renewable energy
development. An integrated and coordinated approach for financial incentives
is urgently needed.
■ Failure to adequately address utilities’ long-term financial concerns. The regulatory
framework is designed to allow the pass-through of renewable energy costs to
consumers in the form of tariff revisions. However, it is contingent on utilities
meeting the targets (for example, for loss reduction) set by the regulator. If the
utility is unable to achieve a target, it tends to be saddled with losses that are
not included in the average cost of power supply. Utilities also suff er when con-
sumer tariff s are not revised on a yearly basis but the renewable energy feed-in
tariff s are, leaving the utilities to make up the diff erential. Given cross-subsidies
from high-tension industrial and commercial customers to certain consumer
categories (such as agriculture and low-volume households), industrial custom-
ers look for ways to purchase cheaper power through third-party sales or cap-
tive generation. This, in turn, forces utilities and regulators to constrain open
access in order to ensure that the utilities retain their paying consumers and
remain financially secure. As a result, utilities have limited incentives to go out
of their way to encourage renewable energy development.
■ Failure to develop least-cost resources first. In some states, wind is more developed
than less expensive sources of power, such as small hydropower and biomass.
Solar power, the most expensive source of power in India, gets more aention
and investment than much less expensive sectors, such as small hydropowerand biomass.
■ Inadequate long-term funding sources. There is real concern about the bankability
of renewable energy projects because of high (real and perceived) risks by fi-
nanciers. Tariff regulations lack an appropriate mechanism to minimize the risk
of uncontrollable factors, such as biomass availability and price variation and
hydrological and meteorological risks in small hydropower, wind, and solar.
For instance, in small hydropower, high nontariff barriers—such as diffi culties
in obtaining clearances, the poor quality of project information, and hydrologi-
cal risks—make the project risk very high for financiers. There is also often a
mismatch between the tenure of available funds and the cashflow of renewableprojects. In some cases (for example, solar energy), financiers are also reluctant
8/6/2019 Unleashing the Potential of Renewable Energy in India
http://slidepdf.com/reader/full/unleashing-the-potential-of-renewable-energy-in-india 46/60
World Bank Study28
to accept the technology risk, possibly because they are unable to evaluate tech-
nical feasibility. This problem both limits access to finance and introduces a
bias toward investment in fossil fuel–based technologies, whose risks are more
easily understood and mitigated. As a result, most projects are financed on the
promoter balance sheet and not on a project finance basis. In many cases, proj-ect developers have to assume the refinancing risk, making it diffi cult for new
entrants and small- to medium-size developers to raise finance.
Issues related to support infrastructure
To catalyze investments in remote and renewable energy–rich areas, the government
needs to remove “soft” and “hard” infrastructure bolenecks facing the private sector.
Three major barriers need to be addressed.
■ Inadequate evacuation and access infrastructure. The lack of adequate evacuation
infrastructure and grid interconnections is one of the biggest barriers to har-nessing renewable energy potential. Economically aractive potential for wind
and small hydropower in Andhra Pradesh and coastal Tamil Nadu, small hy-
dropower in north and northeast India, and wind in Madhya Pradesh or West
Bengal remains untapped because of lack of adequate grid evacuation capacity
and approach roads. Experience in India and other countries suggests that grid
evacuation infrastructure is critical to the success of renewable energy projects.
This is true for both large projects that sell power generated to the grid and
small distributed-generation projects for which access to the grid improves fi-
nancial viability and reduces risks of projects by acting as a reliable back-up
sink and source of power. Transmission bolenecks inhibit use of RECs to facili-tate interstate power trading and boost the development of renewable energy.
■ Lack of good-quality data. Although the MNRE has invested heavily in collecting
renewable energy data, lack of good-quality data remains a big problem. Even
basic data on the actual generation volume of renewable energy by technologies
are not available in the public domain. A number of state nodal agencies are not
able to establish and maintain a technical library, a data bank, or an information
center or collect and correlate information regarding renewable energy sourc-
es. Information is not updated frequently, and in certain cases (for example,
biomass), it is outdated. The Biomass Atlas prepared by the Indian Institute of
Science Bangalore in 2000 under funding by MNRE, often does not accurately
reflect developable energy potential if biomass resources and in many areas
cannot be used even as an indicative estimate by developers.5 Over the past de-
cade, the paern of alternative usage has been altered significantly, aff ecting the
estimate of biomass surplus and in turn the potential of biomass-based power
projects. Wind data are inaccurate because of lack of adequate investment in
improved and multi-year measurements on sites. As a result, the plant capacity
factor for many wind plants is lower than what was envisaged at the design
stage. Similar problems exist with hydrology data. There is also a strong need
to integrate these data resources and present them to potential developers in a
user-friendly way.
8/6/2019 Unleashing the Potential of Renewable Energy in India
http://slidepdf.com/reader/full/unleashing-the-potential-of-renewable-energy-in-india 47/60
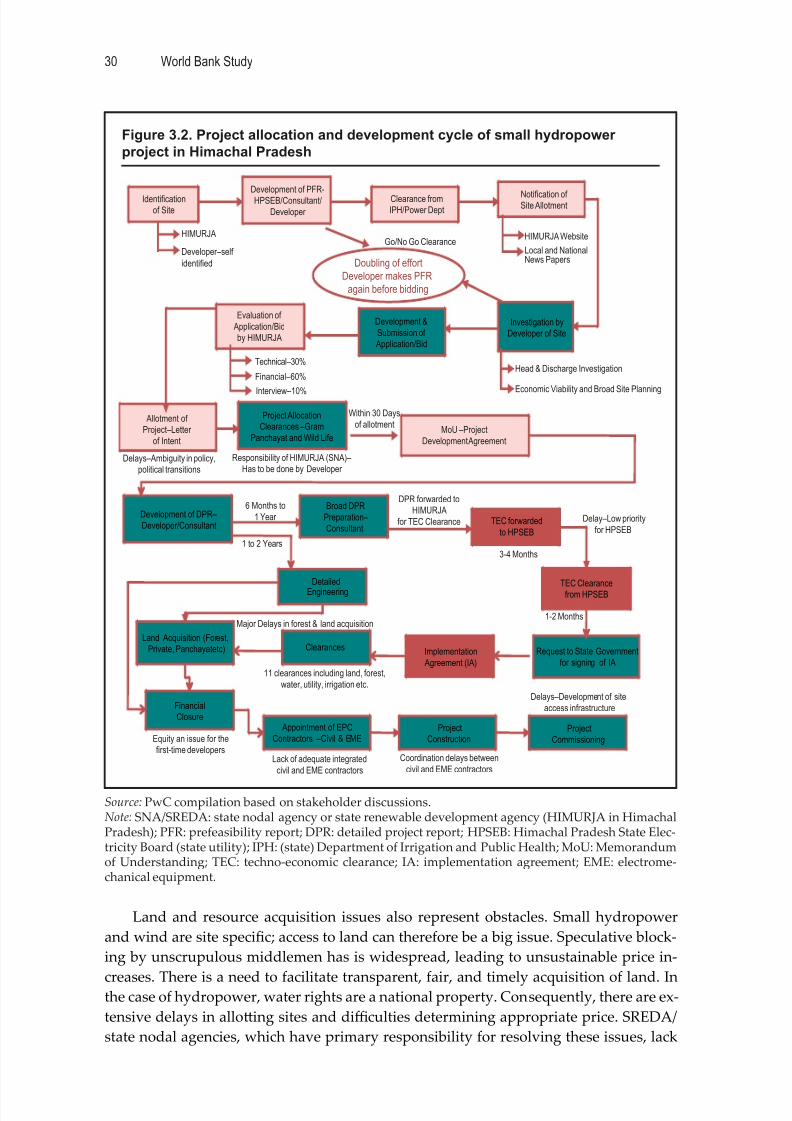
8/6/2019 Unleashing the Potential of Renewable Energy in India
http://slidepdf.com/reader/full/unleashing-the-potential-of-renewable-energy-in-india 48/60
World Bank Study30
Land and resource acquisition issues also represent obstacles. Small hydropower
and wind are site specific; access to land can therefore be a big issue. Speculative block-
ing by unscrupulous middlemen has is widespread, leading to unsustainable price in-
creases. There is a need to facilitate transparent, fair, and timely acquisition of land. Inthe case of hydropower, water rights are a national property. Consequently, there are ex-
tensive delays in alloing sites and diffi culties determining appropriate price. SREDA/
state nodal agencies, which have primary responsibility for resolving these issues, lack
Figure 3.2. Project allocation and development cycle of small hydropower
project in Himachal Pradesh
Source: PwC compilation based on stakeholder discussions.Note: SNA/SREDA: state nodal agency or state renewable development agency (HIMURJA in HimachalPradesh); PFR: prefeasibility report; DPR: detailed project report; HPSEB: Himachal Pradesh State Elec-tricity Board (state utility); IPH: (state) Department of Irrigation and Public Health; MoU: Memorandumof Understanding; TEC: techno-economic clearance; IA: implementation agreement; EME: electrome-chanical equipment.
Identificationof Site
HIMURJA
Developer–self
identified
Notification of Site Allotment
Clearance fromIPH/Power Dept
Investigation by
Developer of Site
Development &
Submission of
Application/Bid
Evaluation of
Application/Bid
by HIMURJA
Technical–30%
Financial–60%
Interview–10%
Allotment of
Project–Letter
of Intent
Project Allocation
Clearances –Gram
Panchayat and Wild Life
Within 30 Days
of allotment
Development of DPR–
Developer/Consultant
Go/No Go Clearance
Responsibility of HIMURJA (SNA)–
Has to be done by Developer
Development of PFR-
HPSEB/Consultant/
Developer
HIMURJA Website
Local and NationalNews Papers
Head & Discharge Investigation
Economic Viability and Broad Site Planning
Delays–Ambiguity in policy,
political transitions
Broad DPR
Preparation–
Consultant
6 Months to
1 Year
DPR forwarded to
HIMURJA
for TEC Clearance TEC forwarded
to HPSEB
TEC Clearance
from HPSEB
Request to State Government
for signing of IA
Delay–Low priority
for HPSEB
Detailed
Engineering
Implementation
Agreement (IA)
ClearancesLand Acquisition (Forest,
Private, Panchayatetc)
Financial
Closure Appointment of EPC
Contractors –Civil & EMEProject
ConstructionProject
Commissioning
3-4 Months1 to 2 Years
Major Delays in forest & land acquisition
Equity an issue for the
first-time developers
11 clearances including land, forest,
water, utility, irrigation etc.
Delays–Development of site
access infrastructure
Lack of adequate integrated
civil and EME contractors
Coordination delays between
civil and EME contractors
Doubling of effort
Developer makes PFR
again before bidding
MoU –Project
Development Agreement
1-2 Months
8/6/2019 Unleashing the Potential of Renewable Energy in India
http://slidepdf.com/reader/full/unleashing-the-potential-of-renewable-energy-in-india 49/60
Unleashing the Potential of Renewable Energy in India 31
adequate resources and have limited importance within the state government hierarchy.
Although states can acquire land under Section 4 of the Land Acquisition Act, state ad-
ministrations are reluctant to use this route, because of political considerations and the
low priority state governments give to renewable energy projects.
What Can Be Done?
Although these barriers are common in other countries, in many cases no readymade
solutions can be imported and applied to India. In areas related to the strength of the
private sector in wind and some of the broad policy and programmatic support for re-
newable energy, India is actually a leader. It could also become a pioneer in coming up
with new solutions.
Several actions could be taken to address financial viability and bankability issues.
The first would be to provide streamlined, market-based government interventions. In-
dia has been using a number of market- based government interventions to promotediff erent renewable energy technologies. There is a need to simplify the numerous and
overlapping financial incentives and put them on a sound economic and market founda-
tion. The following actions could be lead to a cogent set of synchronized and simplified
policies that provide comprehensive solutions to the high financial generation cost of
renewable energy:
■ Set, and make mandatory, short- and long-term national targets for renewable
energy, as suggested by the NAPCC. Long-term targets can be based on the po-
tential identified by the renewable energy supply curve that corresponds to the
economic cost of power. The NAPCC target of increasing purchased renewable
energy by 1 percent every year for the next decade is a good start.
■ Establish coherence in the underlying principles and approach in breaking
down the national RPO target into statewide RPOs. (GDP could be a good
choice of allocation factor.) These targets should be made mandatory and en-
forced. SERCs should be responsible for monitoring annual compliance with
RPO targets by state distribution utilities; penalty mechanisms should be in-
troduced as a deterrent for noncompliance. A common, strictly enforced RPO
target would provide utilities with incentives to develop least-cost resources
first. Technology-specific RPOs may not be necessary unless there is a specific
objective of the government to promote a particular technology. (The JNNSM’s
mandating that SERCs fix a percentage for the purchase of solar power is one
example of a technology-specific RPO.)
■ Allow states and utilities to move to a technology-neutral feed-in tariff based on
the economic avoided cost of power generation, including premiums for local
externalities. The feed-in tariff can be revised downward after meeting the RPO.
Experience from Germany, Spain, and the United States suggests that this ap-
proach can accelerate investment in renewable energy. Avoided cost tariff s have
a strong financial and economic rationale, as it may help address the financial
concerns of utilities on renewable energy procurement and help bring in the
least expensive renewable generation sourcesfi
rst.■ Eliminate all other technology-specific incentives, including capital subsidies
and accelerated depreciation. States can use price discovery bids to identify ad-
ditional generation-based incentives necessary to support specific technologies.

8/6/2019 Unleashing the Potential of Renewable Energy in India
http://slidepdf.com/reader/full/unleashing-the-potential-of-renewable-energy-in-india 50/60
World Bank Study32
Competitive procurement of renewable energy is in line with the objectives of
the national tariff policy, which states that procurement of power from noncon-
ventional sources shall be done as far as possible through competitive bidding.
Some states have started piloting the award of small hydropower projects based
on a competitive bidding process. The Ministry of Power and the MNRE could jointly develop competitive procurement approaches and bidding documents
for implementing this initiative. This market mechanism would also provide a
strong economic rationale for additional subsidies, avoid issues related to cost
benchmarking and indexing, and encourage cost competition and market in-
novation. Because some incentives, such as capital grants and tax breaks, are
eff ectively paid for by the central budget, it is important to ensure that states
are adequately compensated. The international experience on introduction and
utilization of policy instruments in renewable energy market development is
presented in box 3.1.
Box 3.1. Stages of introduction and use of policy instruments
International experience indicates that appropriate introduction and utilization of policy in-
struments at relevant stages of renewable energy development is critical for the sector’s
development. The appropriate stage for introducing various policy instruments in the sector’s
development cycle and the current positioning of various technologies in India are shown in
figure below.
Figure: Applicability of policy instruments at various stages of renewable energy market
development
Source: PwC analysis for World Bank.
TechnologyDevelopment Stage
MarketCommercialization
MarketMaturity Stage
Feed-in Tariff
Accelerated Depreciation
Tax Benefits
Capital Subsidy
Generation Based Incentive
Carbon Trading
Renewable Energy Fund
Grants
Renewable Energy Certificates
Market IncubationStage
Technical viability notyet demonstrated.
Only pilot projects arebeing undertaken
Underlying technologyis well established but
commercial viabilityyet to be
demonstrated. Highperceived risk. Few
players. Small installed
capacity.
Technical and financialviability of technologyis well proven. Ample
investment takenplace and developersgeared up to take up
projects
Increased number ofmarket participantsleads high level of
competitive market,established valuechain and amplecapacity installed
Geothermal
Wind Offshore Wind Onshore
SHP
Biomass Gasifier
Solar Thermal
Solar PV
TidalWaste to Energy
Biomass Combustion
8/6/2019 Unleashing the Potential of Renewable Energy in India
http://slidepdf.com/reader/full/unleashing-the-potential-of-renewable-energy-in-india 51/60
Unleashing the Potential of Renewable Energy in India 33
Create a national renewable energy fund to mitigate the impact on utilities. Moving
to an avoided cost mechanism should reduce the financial impact of renewable energy
procurement on utilities. However, capturing the value of externalities and providing
generation-based incentives to meet technology-specific RPO targets would require ad-
ditional subsidies that might need to be financed by a national or state fund. The useof market-based competitive price discovery and least-cost REC trading across states
should reduce the extent of subsidies. India could use the recently established National
Clean Energy Fund, which finances research and innovative projects in clean technolo-
gies, as a vehicle to accumulate and channel renewable energy subsidies and reduce the
financial burden on utilities. The fund could be financed through budget allocations,
redirection of various renewable energy subsidy funds, or a small national green cess
on electricity. Existence of fully financed national fund to subsidize RE would remove
market uncertainty and make states and utilities more willing to implement renewable
energy goals in practice. (A similar fund established by China as part of its 2005 renew-
able energy law to fund wind feed-in tariff s increased installed wind capacity by a factor
of 20 in less than five years.7)
Enable direct purchase and grid-connected distributed generation of renewable en-
ergy. India needs to move away from using government or utility subsidies as the only
way of supporting the higher financial costs of renewable energy. Although the pro-
posed streamlined financial incentive program could reduce renewable energy subsi-
dies, the limited budget allocated to states for renewable energy cannot by itself dramati-
cally accelerate the pace of renewable energy development. Renewable energy is more
competitive than several coping alternatives, but market-based mechanisms to integrate
renewable energy into the power sector are missing.
Two important steps can be taken to enable private sector solutions. First, open ac-
cess must be made to work. Most states have been reluctant to allow open access to
consumers and third- party sales by captive generators out of concern about losing large
high-paying consumers and the resultant impact on utility finances. The high incidence
of cross-subsidy surcharges and wheeling charges imposed on the direct sale of power
to consumers reduces the competitiveness of renewable energy in an otherwise poten-
tially high- demand market. To promote renewable energy, the government should re-
move the cross-subsidy surcharge for open access in order to create a level playing field
for competitive market development (box 3.2). While there may be practical diffi culties
in doing the aforesaid, doing so would help high-paying consumers replace diesel withrenewable energy sources. It would also create competitive pressure for utilities to im-
prove the quality of supply. Also, with the mechanism in place, it is anticipated that
this would be simplified as that would allow the separation of green aribute from the
electricity component.
Second, the government should promote new models for allowing renewable en-
ergy developers to recover higher generation costs directly from customers. India could
consider promoting widespread use of rural distribution franchises that meet their pow-
er requirement using their own local renewable energy plants.8 Commercially operated
private franchises that generate power locally using renewable energy could address the
power supply shortage and significantly improve service to rural areas. Locally basedsmall-scale renewable energy generation can ensure that power is actually fed to local
areas rather than diverted to meet urban demand. This approach could also reduce the

8/6/2019 Unleashing the Potential of Renewable Energy in India
http://slidepdf.com/reader/full/unleashing-the-potential-of-renewable-energy-in-india 52/60
World Bank Study34
need for renewable energy subsidies, as higher cost renewable energy generation could
be largely mitigated through the avoidance of transmission costs and improved effi cien-
cies in private franchises, which, as experience shows, results in substantial reductions
in technical and collection losses as well as distribution overheads.
In order to provide additional incentives to utilities, the renewable energy supplied
directly to consumers using open access and distributed generation will be credited to-
ward utilities’ RPO targets. This could be done by facilitating the financing of renewable
energy projects, in three ways:
■ The perception of risk by commercial banks in the renewable energy sector
could be addressed by increasing the awareness and building the capability of banks as well as through partnerships with major Indian business schools to
train future financiers and bankers.
Box 3.2. Attractiveness of renewable energy projects for developers
States have adopted incentives—such as allowing concessions in open access, cross-sub-
sidies, and wheeling charges—to encourage developers of renewable energy projects. The
most important factors determining the viability of such a business model is the level of the
incentive and the relationship between the HT tariff, the feed-in tariff, and net open access
charges levied in the state, as presented in the figure below.
Figure: Relationship between HT tariff, the feed-in tariff, and net open access changes, by state
Source: Forum of regulators and state tariff orders.
Karnataka and Tamil Nadu have high net open access charges because of high cross-subsidy
surcharges and low relaxations. The high level of net open access charges may discourage
further investment in these states, both of which have strong potential for renewable energy.
Among states with low net open access charges (Gujarat, Haryana, Maharashtra, Punjab,
and Rajasthan), only three (Gujarat, Punjab, and Maharashtra) have competitive third-party
sale in all Renewable Energy technologies. In Gujarat and Maharashtra, almost all renewable
energy developers have the opportunity to sell at prices that are higher than the feed-in tariff.
Biomass developers in Madhya Pradesh and Punjab also have such opportunities.
Source: PwC Research for World Bank.
0
100
200
300
400
500
600
700
W i n d
S H P
B i o m a s s
B i o m a s s
W i n d
S H P
W i n d
S H P
B i o m a s s
W i n d
S H P
B i o m a s s
W i n d
B i o m a s s
W i n d
S H P
B i o m a s s
W i n d
B i o m a s s
W i n d
S H P
B i o m a s s
S H P
B i o m a s s
W i n d
B i o m a s s
Haryana UT CGT TNPunjabRajasthanMaharashtraMPKarnatakaHPGujarat
FIT Net Open Access Charges (Paise/Kwh) HT Tariff
HT Tariff in Gujarat Varies from450 to 630 paise/unit
p a i s e / u n i t
Relaxed OA charges for REencourage third-party sale market
Andhra Pradesh

8/6/2019 Unleashing the Potential of Renewable Energy in India
http://slidepdf.com/reader/full/unleashing-the-potential-of-renewable-energy-in-india 53/60
Unleashing the Potential of Renewable Energy in India 35
■ New sources of long-term funding needs could be found for renewable energy
projects. IREDA, a focused renewable energy financial intermediary, could be-
come a wholesaler, playing a catalytic role in leveraging more funding from
domestic and international markets. IREDA needs to explore new instruments,
such as green bonds, new equity, and synthesized products, with which to raisefinancing and enable risk sharing and mitigation in renewable energy projects.
■ A national partial risk guarantee facility, which could be managed by IREDA or
private sector financial institutions, could address specific renewable energy proj-
ect risks, such as refinancing, construction financing, off -take by utilities, resource
availability, and technology. International financial institutions could be asked to
backstop such a facility if the intention is to aract globalfinanciers and developers.
Investments must be made to support infrastructure in the sector. Renewable en-
ergy evacuation should be made a high-transmission priority, given the same focus as
village electrifi
cation. It should have dedicated funding as part of existing programs likeRGGVY or through new green funds. Although the new Indian Electricity Grid Code
(IEGC) announced in April 2010 by the CERC will help facilitate development of renew-
able energy by specifying the technical and commercial aspects for integration of these
resources into the grid, some additional actions could be taken to improve transmission
development in renewable energy:
■ The IEGC mandate states that interstate transmission system planning and de-
velopment should take into account the needs of renewable energy sources and
the renewable capacity addition plan (as issued by the MNRE). To make this
goal a reality, all state transmission utilities should be mandated to prepare a
comprehensive five-year transmission plan with appropriate consideration of
renewable generation projects based on load flow studies and location of gener-
ation projects. State nodal agencies should take a lead role in coordinating and
providing information to state transmission utilities on new renewable energy
generation capacity.
■ The cluster approach for the development of wind, solar, and small hydropow-
er (river basin–wide) could be used to pool power from pockets of renewable
energy–abundant areas and develop transmission capacity.
■ State transmission utilities should be required to provide renewable energy
evacuation to all projects or aggregated projects with more than a certain speci-
fied MW output.
■ State transmission utilities should be allowed to use diff erent mechanisms to re-
cover costs for establishing transmission lines for renewable energy-rich areas.
For large conventional plants, the timing and quantity of power transmied is
certain, allowing for predicable cost recovery for transmission lines. Multiple
small-scale renewable energy plants do not provide for certain cost recovery.
Utilities should therefore be allowed to pass on to the rate base transmission in-
vestments that are built to catalyze new renewable energy projects in resource-
rich areas.
■
Introduce and enforce “take or pay” for renewable energy generation. Onehundred percent of the available capacity of renewable energy should be dis-
patched, without being subjected to merit-order dispatch. A long-term take-
or-pay contract would make it incumbent for utilities to dispatch renewable
8/6/2019 Unleashing the Potential of Renewable Energy in India
http://slidepdf.com/reader/full/unleashing-the-potential-of-renewable-energy-in-india 54/60
World Bank Study36
energy. The freeing of renewable energy projects from this merit-order dispatch
principle is a welcome step under the new IEGC.9 The take-or-pay agreement,
if part of a PPA, would insulate developers and investors from issues of grid ac-
cess. The terms of the PPAs and the feed-in tariff should be harmonized. At least
12- to 15-year PPAs should be required to provide confidence to developers andfinanciers. New technologies, such as solar thermal, may require even longer
term PPAs. Mandating such PPAs would reduce regulatory uncertainty, create
appropriate incentives for location and operation, and allow for effi cient system
operation. A take-or-pay regime would have to be enforced by the regulator,
and the utilities would have to be properly compensated through tariff s. In a
number of countries, including Armenia, Denmark, Sri Lanka, and some U.S.
states, long-term PPAs and take-or-pay or must-run regulations are the norm.
■ Investment should be made in a high-quality, integrated resource monitoring
program. Known gaps in existing programs need to be addressed. For instance,
the Biomass Atlas needs to be updated to reflect changes in agriculture output
and alternative economic uses. The assessment should take the economics of
developing these resources and financial viability into consideration. The bio-
mass potential from forests and wasteland should be considered as exploitable
potential only after the costs of plantation, collection, and extraction are quanti-
fied. In addition to geographic information system (GIS)–based surveys, there
is a need to asset the resources at the state, district, and taluka levels, through
field surveys and consultations with farmers and other stakeholders. New wind
measurement norms need to be adopted. (For example, number and paern of
meteorological masts to obtain accurate assessment data.) These data should
be monitored for at least two seasons and additional investments to cover
unmapped potential, assessing biomass potential from energy plantations in
wastelands and India’s vast off shore wind potential, are required. The country
also needs precise solar radiation data, especially to support the National Solar
Mission, eff orts for which are underway by the MNRE. The MNRE could in
addition, support establishment of national and state-level renewable energy
information systems that provide integrated and easily accessible public infor-
mation. State nodal agencies, in conjunction with the CERC and SERCs, could
lead this eff ort. The database should be easily usable and provide up-to-date
information.■ R&D and supply chain innovations and investments should be catalyzed. Al-
though R&D initiatives should ideally be driven by the private sector, the state
could play an important catalytic role in accelerating investments in innova-
tions and new domestic capacity. For instance, the JNNSM has laid out a policy
to provide public funds to promote R&D and local manufacturing for solar en-
ergy. Similar eff orts could be made for other technologies. For instance, invest-
ments in off -shore technology could facilitate development of the wind sector.
The MNRE could encourage technology development based on important local
investments leveraged by small grants, cost-shared grants, or both for wind and
biomass. Long-term capacity- building investments also could be made, suchas increasing collaboration with leading international universities to develop
postgraduate-level or specialist renewable energy engineering courses and of-

8/6/2019 Unleashing the Potential of Renewable Energy in India
http://slidepdf.com/reader/full/unleashing-the-potential-of-renewable-energy-in-india 55/60
Unleashing the Potential of Renewable Energy in India 37
fering fellowship programs to allow more senior engineers to study abroad.
Equipment standardization and low-cost design could reduce the costs of local
hydro equipment, as they have in China. The biomass sector probably receives
the most aention, given its untapped potential and opportunity for providing
stable alternate income streams for farmers. India should simplify rules for cap-tive crop generation and deregulate energy plantations on wastelands to allevi-
ate the fuel supply shortages.
The government could help reduce the cost of doing business for renewable energy
projects by taking three main steps:
■ Move to unified, light-touch regulation for renewable energy. Like informa-
tion technology and cellular telephony, clean technology and renewable energy
have the potential to be a transformative growth industry. To realize this po-
tential, India needs to streamline bureaucratic processes for clearances and ap-
provals. The single-window approach has not worked, largely because of thereluctance of various agencies to delegate power. An alternative would be to
pilot a “no objection”–based approval process. Such a process would require
offi cials to explicitly reject an application and provide wrien explanations for
the reasons they did so; unless rejected, an application would automatically
be considered approved. States such as Punjab have adopted a single-window
clearance and fixed time limits (45 days) within which clarifications, comments,
or objections to projects need to be sent to the state nodal agency; absent such
comments, the state nodal agency grants all clearances to the project. Promising
approaches like special purpose vehicle–based project predevelopment can be
widely adopted. Government-created special purpose vehicles can off er a pack-
age of clearances for multiple renewable energy projects, which could reduce
transaction costs and encourage large investors. To prevent speculative land
grabbing, the government could indicate its willingness to use Section 4(1) of
the Land Acquisition Act to ensure transparent, fair, and timely acquisition of
land required for small renewable energy projects. In Gujarat, where the state
nodal agency administers the functions of the land allocation commiee and
coordinates with other departments to ensure the smooth transfer of land to
renewable energy project developers, land acquisition has worked relatively
well. Similar eff orts by state governments are needed to ensure time-bound al-
location of sites and to streamline approval process.
■ Strengthen the SREDA and state regulators. SREDA or state nodal agencies are
supposed to play a leading role in helping renewable energy projects through
the regulatory maze, but few have the resources, capability, or authority to do
so. A comprehensive capacity-building program on emerging regulatory, legal,
and financing issues to facilitate grid-connected renewable energy should be
structured. International experience suggests that local agencies need help con-
ducting resource assessments, providing support for investment projects, de-
veloping demonstration projects, seing local standards, and building aware-
ness of programs. State nodal agencies also need resources and training to workwith other state agencies to ensure speedy clearances of renewable energy proj-

8/6/2019 Unleashing the Potential of Renewable Energy in India
http://slidepdf.com/reader/full/unleashing-the-potential-of-renewable-energy-in-india 56/60
World Bank Study38
ects. Sharing of best practices from other states in India and other countries
could be very helpful.
■ Strengthen the ability of state nodal agencies to provide assistance to local proj-
ect sponsors. Such agencies should be able to disseminate and process technical
information to overcome information barriers, provide predevelopment assis-tance, and set up local development and demonstration projects. The MNRE,
with IREDA’s assistance on financing issues, could take the lead in developing
and implementing such a program.
Challenges and Opportunities
Any discussion of radical new approaches to achieve an order-of-magnitude change
in renewable energy should first recognize the existing risks. The poor financial state
of and lack of incentives faced by utilities as well as the weak institutional capacity of
public sector institutions, especially at the state level, are among the key risks that willhave to be carefully managed. Concerns from key stakeholders should be listened to and
addressed to head off implementation resistance, which rendered previous reform at-
tempts ineff ective. Implementation will have to be gradual in scale and sequencing and
tolerant of the chance of failure.
Early adoption of “quick wins” could build momentum for high-eff ort, high-impact
structural reforms. Some solutions take substantial time to design and implement and
may require considerable resources. Achieving and demonstrating some quick results is
important to gain political support for longer-term solutions. Policy initiatives such as
enforcement of state-level RPOs could provide an immediate boost to the sector. Initia-
tives on financial sector capability and awareness building, strengthening of state nodalagencies, and investment in high-quality resource information system can also be imple-
mented relatively quickly.
Perhaps the best way to create substantive change is to implement comprehensive
pilot models in a few states. One potential quick win that could yield high impact would
be to create renewable energy parks, which can serve as integrated implementation plat-
forms on which the solutions could be tested and refined. Such parks could be estab-
lished as joint national and state government initiatives in a few selected pilot states.
They could serve as concentrated zone of renewable energy development, including
generation and/or manufacturing. The central government could commit substantive fi-
nancial and administrative resources to aract states rich in renewable energy resources.The states could be selected based on their demonstrated commitment for such a pro-
gram, including co-financing and capacity to implement.
Creating renewable energy parks could accelerate development of resources and
address multiple issues comprehensively. India is already familiar with special econom-
ic zones and technology parks, which create an enabling environment to promote certain
industries. Renewable energy parks are a good example of private-public partnerships
that allow aggregation of projects, create economies of scale, and enable the formation of
supporting supply chains. Such parks can be aractive to both small and large players.
They can off er ready-to-bid project pipelines; provide prefeasibility studies, including
resource assessment data; access to land and transmission infrastructure; and prefer-ential open access policies. They can be used to craft simplified light-touch regulations,
including accelerated environmental and social clearances and package clearances. IRE-
8/6/2019 Unleashing the Potential of Renewable Energy in India
http://slidepdf.com/reader/full/unleashing-the-potential-of-renewable-energy-in-india 57/60
Unleashing the Potential of Renewable Energy in India 39
DA could pilot new risk guarantee and financing schemes, and state and central funds
could catalyze R&D and supply chain innovations in renewable energy parks. Examples
include solar, wind, or river basin–based special purpose vehicles for small hydropower
projects. Initially, the parks would require specific kick-off grants or subsidies from the
MNRE and other agencies, which could be recovered from developers as projects reachcritical mass. The parks could serve as testing grounds for new policies, which if proven
successful could be then replicated across the country.
The ideas proposed in this study are meant to provoke substantive discussions
among key stakeholders to establish customized solutions for India. Creating a consul-
tative forum to bring together developers, corporations, utilities, consumer groups, and
regulators to debate and pilot broader initiatives can facilitate India’s journey toward a
more secure energy future.
Notes
1. World Energy Outlook 2007.
2. hp://www.cercind.gov.in/Regulations/CERC_RE-Tariff -Regualtions_17_sept_09.pdf.
3. The CERC notification (Terms and Conditions for Recognition and Issuance of Renewable En-
ergy Certificate (REC) for Renewable Energy Generation Regulations 2010 (“the REC Regulation”),
January 14, 2010. Available at: hp://www.cercind.gov.in/Regulations/CERC_Regulation_on_Re-
newable_Energy_Certificates_REC.pdf.
4. The estimation of capital cost in this study is based on PricewaterhouseCoopers’ review of
SERCs’ wind tariff orders for about 50 wind-based power projects in India (UNFCC). The data
collected in 2008—09.
5. Assessment by MNRE through the Indian Institute of Science.
6. PwC market analysis.
7. Chinese_Renewables_Status_Report_2009 REN21.8. Distributed generation and supply franchises model discussed in World Bank report for the
Ministry of Power.
9. For the first time, the new IEGC recognizes renewable energy sources, subject to specific condi-
tions to be “must run” power plants that would not be subject to merit order dispatch.

8/6/2019 Unleashing the Potential of Renewable Energy in India
http://slidepdf.com/reader/full/unleashing-the-potential-of-renewable-energy-in-india 58/60
ECO-AUDITEnvironmental Bene fi ts Statement
The World Bank is commied to preserving
endangered forests and natural resources.
The Offi ce of the Publisher has chosen to
print World Bank Studies and Working
Papers on recycled paper with 30 percent
postconsumer fi ber in accordance with the
recommended standards for paper usage
set by the Green Press Initiative, a non-
profit program supporting publishers in
using fi ber that is not sourced from endan-
gered forests. For more information, visit
www.greenpressinitiative.org.
In 2010, the printing of
this book on recycled paper
saved the following:
• 11 trees*
• 3 million Btu of total
energy
• 1,045 lb. of net greenhouse
gases
• 5,035 gal. of waste water
• 306 lb. of solid waste
* 40 feet in height and 6–8
inches in diameter

8/6/2019 Unleashing the Potential of Renewable Energy in India
http://slidepdf.com/reader/full/unleashing-the-potential-of-renewable-energy-in-india 59/60

8/6/2019 Unleashing the Potential of Renewable Energy in India
http://slidepdf.com/reader/full/unleashing-the-potential-of-renewable-energy-in-india 60/60
Unleashing the Potential of Renewable Energy in India is part of the World Bank Studies series.
These studies are published to communicate the results of the Bank’s ongoing research
and to stimulate public discussion.
This study is a diagnostic of the feasibility of developing renewable energy in India. It
answers critical questions on why renewable energy development is relevant for India, on how
much development is economically feasible, and on what needs to be done. Developing
indigenous renewable energy sources that have low marginal generation costs is more econom-
ically viable in the long run. Developing renewable energy can help India increase its energy
security, reduce the adverse impacts on the local environment, lower its carbon intensity,
contribute to more balanced regional development, and realize India’s aspirations for leader-
ship in high-technology industries.
The Energy Sector Management Assistance Program (ESMAP) is a global knowledge and
technical assistance program administered by the World Bank. Its mission is to assist low- and
middle-income countries to increase know-how and institutional capacity to achieve environ-
mentally sustainable energy solutions for poverty reduction and economic growth.
For more information about ESMAP’s work, please visit us at http://www.esmap.org.
World Bank Studies are available individually or on standing order. This World Bank Studies
series is also available online through the World Bank e-library (www.worldbank.org/elibrary).