Embed Size (px)
Citation preview
Uganda Wildlife SocietyKampala, Uganda
December, 2012
Unlocking Local Community Potentialfor Sustainable Natural Resource
Management in Uganda’sAlbertine-Oil Region
Fountain Publisherswww.fountainpublishers.co.ug
Unlocking Local Community Potential for Sustainable Natural Resource Management in Uganda’s
Albertine-Oil Region
Contributing Authors
Priscilla Nyadoi, Ambrose Mugisha, Moses Murungi, Suzan Owino, Joseph Odong, Teddy Namirimu, Gilbert Wathum, James Lutalo, Chris Bakuneeta and Joel Buyinza
EditorProfessor Joseph Obua
FOUNTAIN PUBLISHERSwww.fountainpublishers.co.ug
Fountain Publishers Rwanda LtdP. O. Box 6567 KigaliE-mail: [email protected]
[email protected]: www.fountainpublishers.co.ug.
Project PartnersBuliisa District Local Government (BDLG); Ecosystems Alliance Uganda Country Program Partners- NAPE and AFIEGO; Community Based Civil Society Organization Partners- Soft Power Education (SPE), Buliisa Initiative for Rural Development Organization (BIRUDO), Buliisa Catholic Women Association (BUCAWA), Kakindo Orphans Care (KOC) and Kalolo Fish Mongers and Fishermen Association (KFMFA) and; Tree Talk Foundation –Uganda.
December 2012
Copyright (C) 2012 Uganda Wildlife Society Buliisa District Local Government
Reproduction of this publication for educational or non-commercial purposes is authorised without prior written permission from the copyright holders provided the source is fully acknowledged. Publication for resale or other commercial purposes is prohibited.
Citation: Priscilla Nyadoi., Ambrose Mugisha., Moses Murungi., Suzan Owino., Joseph Odong., Teddy Namirimu., Gilbert Wathum., James Lutalo., Chris Bakuneeta and Joel Buyinza, 2012. Unlocking Local Community Potential For Sustainable Natural Resource Management In Uganda’s Albertine-Oil Region.
Disclaimer
This research report has been prepared with the fi nancial assistance of IUCN NL, Wetlands International and Both ENDS, partners in the Ecosystem Alliance. The views expressed, the information and material presented and the geographical and geopolitical designations used in this report do not imply the expression of any opinion whatsoever on the part of IUCN NL, Wetlands International or Both ENDS or the institutions and organisations providing these three organisations with funds.
ISBN 978-9970-25-256-5
iii
Table of Contents
Acknowledgement .................................................................................................................................. vExecutive Summary .............................................................................................................................. vi
1. Introduction .........................................................................................................................1
2. Materials and methods .......................................................................................................32.1. Study Area ................................................................................................................................ 32.1.1. Demographic and socio-economic indicators ...................................................................... 42.2. Data Collection ......................................................................................................................... 42.2.1. Soil and water condition ........................................................................................................... 42.2.2. Natural resource use/management constraints ................................................................... 42.2.3. Mapping locations of households .......................................................................................... 52.2.4. Focus Group Interviews and Discussions.............................................................................. 52.3. Data analysis ............................................................................................................................. 52.3.1. Soil and water data ................................................................................................................... 52.3.2. Analysis of survey data .......................................................................................................... 52.3.3. Map showing households/resource user groups ................................................................ 62.3.4. Analysis of Focus Group Discussion data ............................................................................. 6
3. Survey Findings .................................................................................................................73.1. Soil and Water Conditions in Buliisa .................................................................................... 73.2. Natural Resource Use and Management in Buliisa ............................................................. 93.2.1. Major natural resource user groups and their locations in Buliisa District ..................... 93.2.2. Location of the different resource user groups in
the seven sub-counties of Buliisa .......................................................................................... 113.2.3. Users perception on natural resource productivity trends ............................................... 113.2.4. Natural resource user’s perception on causes of productivity trends in Buliisa ........... 133.2.5. Other factors affecting natural resources productivity trends in Buliisa.........................133.2.6. Users’ perceived interventions required to stem natural
resources productivity decline .................................................................................................. 15Emerging issues from the focus group discussions ..................................................................... 16
4. Discussion...........................................................................................................................174.1. Soil and water condition ....................................................................................................... 174.2. Natural resource use, management and sustainability constraints ............................... 184.3. Soil and water analyses in respect to peoples’ perception of natural resource sustainability constraints ................................................. 19
iv
5. Conclusions and Recommendations .............................................................................215.1. Conclusions ............................................................................................................................. 215.2. Recommendations .................................................................................................................. 22References ............................................................................................................................................. 23
Appendices ................................................................................................................................25Appendix 1 ......................................................................................................................................... 25
Questionnaire ..................................................................................................................... 25Empowering Communities in Buliisa District for Sustainable Natural Resource Use and Management ................................................... 25
Appendix 2 ........................................................................................................................................ 38List of Participants and Emerging Issues From a Focus Group Discussion held to identify the Stakeholders’ Perception, the Constraints to and Interventions required for Sustainability in Natural Resources Use and Management in Buliisa ................................................. 38
v
List of TablesTable 1: Baseline Soil Conditions in Studied Sites in Buliisa .................................................... 7Table 2: Baseline Water Conditions in Studied Sites in Bullisa ................................................ 8Table 3: Resource User Groups ....................................................................................................... 9Table 4: Resource user groups ...................................................................................................... 10Table 5: Resource User Groups’ Perception on productivity trend in the last 5-20 years .... 12Table 6: Resource User Groups’ Perception on Problems
Affecting Productivity in Buliisa..................................................................................... 13Table 7. Factors Affecting resource productivity ........................................................................ 14Table 8: Buliisa- Resource Users’ perception of the interventions
required to address natural resources productivity decline ..................................... 15Table: Queries to Elicit Information on Climate Change in Buliisa District .......................... 37
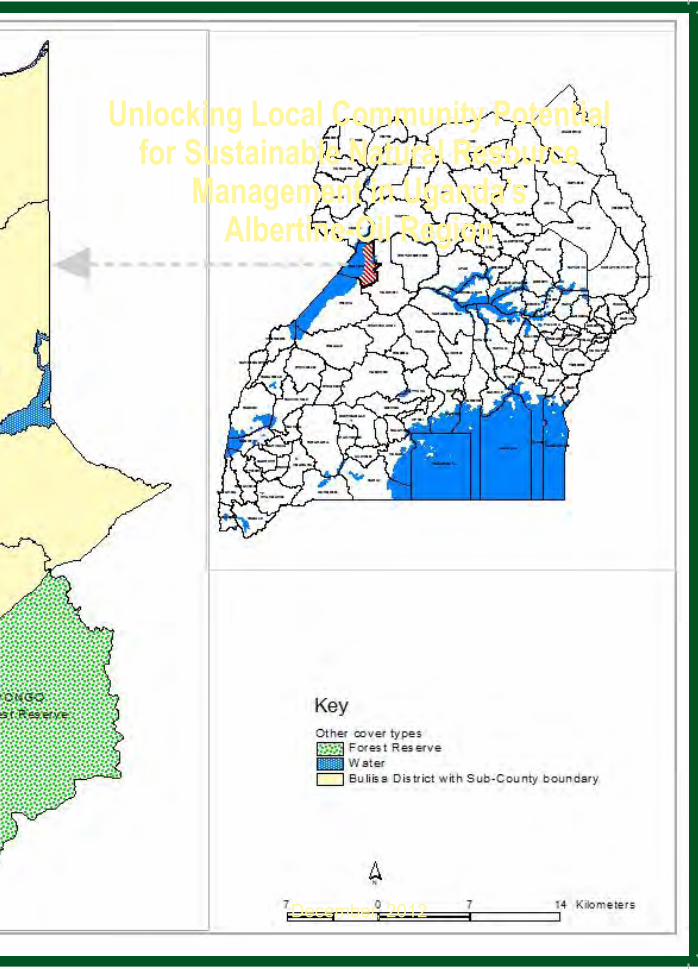
List of figuresFigure 1: Map of Buliisa District showing sub-counties
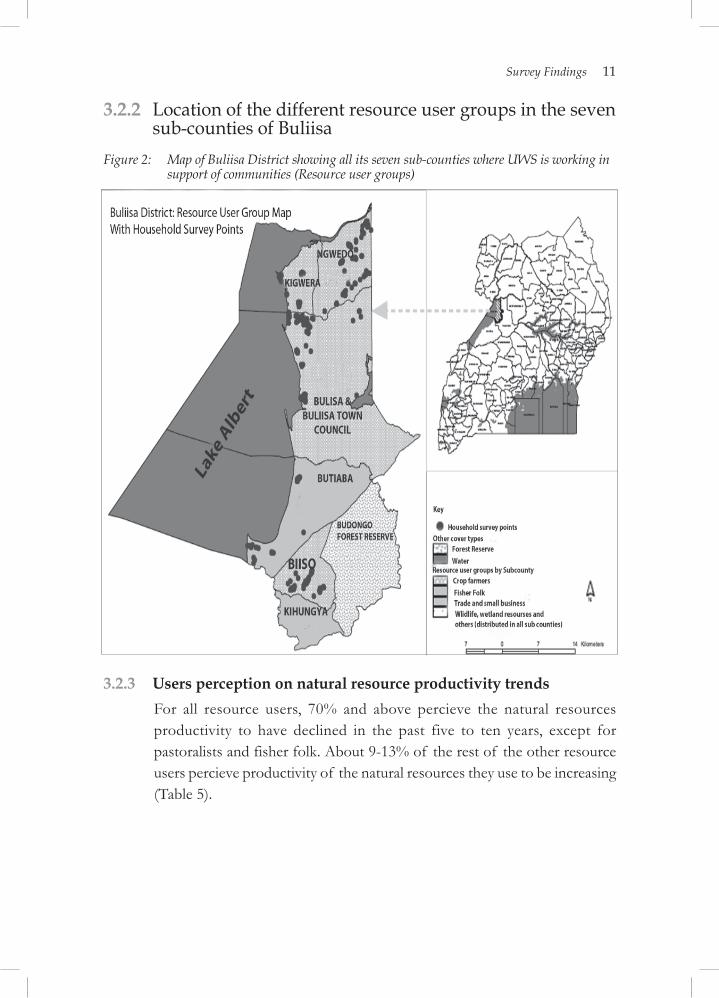
where UWS is working with commmunities. ............................................................... 3Figure 2: Map of Buliisa District showing all its seven sub
counties where UWS is working in support of communities (Resource user groups) .......................................................................................................... 11

vii
Acknowledgement
This study was successfully conducted and thanks to the financial support from the Royal Netherlands Government through the Ecosystems Alliance (Wetlands International, BothEnds and IUCN-NL). The Authors and Uganda Wildlife Society also acknowledge the institutional support and collaboration by the Buliisa District Local Government through the political leaders and technical officials (who included Murungi Moses, Abigaba Jackson, Kirungi Robert, Tumwesigye Barnabas, Katwesige Bright and Okumu Israel) and Ecosystems Alliance Uganda Country Programme Consortium Partners NAPE and AFIEGO. We are grateful to Buliisa Communities who gave their time and information both individually and in the Focus Group Interviews conducted for this study. We also thank all our research assistants and student interns who participated in data collection (including Nakiyimba Rose, Okello Ronald Rimbosh and Odong Joseph) and we acknowledge initial contacts made with the district officials by Paul Okiror. We thank Meshack Nyabenge of World Agroforestry Centre-ICRAF for the GIS mapping, John Omara of Makerere University Chemistry Laboratory for the Water Analysis, technicians at the Makerere University College of Agriculture and Environmental Sciences Soil laboratory for the Soil analysis and, Denis Afizua of the National Agriculture Research Organisation (NARO) for statistical analysis.

viii
Executive Summary
Sustainable use and management of natural resources in the Albertine Rift is the single most important factor that will help to secure the region’s globally unique biodiversity and ecosystems which is critical for the survival of the environment, growth of the economy and people’s wellbeing and livelihoods. However, the discovery and development of the oil industry, growing human population, overuse and inappropriate management of natural resources pause a threat to sustainability of the natural resources and ecosystems in the Albertine Rift. A recent baseline study by Ecosystems Alliance Uganda Country Programme Partners (AFIEGO, NAPE and UWS) revealed the nature and extent of community dependence on natural resources in the Albertine Rift and emerging threats to sustainability of the region’s ecosystems.
In order to focus on specific required interventions, Uganda Wildlife Society in collaboration with Buliisa District Local Government conducted a needs assessment survey on natural resource use and management constraints. Data were collected using interviews- at household level, key informants and focus group discussions, and national level dialogues involving policy makers, private sector, the academia , general public, Buliisa communities and local government representatives.
The needs assessment survey revealed that there are five major natural resource user groups in Buliisa District and the majority of these (46.8% of the 374 households interveiewed) are crop farmers, the fisher folks (14.2%), pastoralists (5.6%), wildlife resource dependent communities (2.9%) and, communities involved in oil or affected by oil activities (1.6%). The rest (20.3%) are small scale traders and office employees (5.9%). Among these five resource user groups, 44-50% perceive that the natural resources they manage and or use for their livelihoods are declining and they attribute the problem to stem from, inter alia, climate change (9.3-27.3%), soil fertility loss (0-11.4%), diseases and pests including wildlife attack (11.8-40.6%) and lack of management knowledge (11.4-64.8%). The other factor we found to influence productivity in the district was the size of landholding (P<0.05). The resource users also perceived that a range of capacity building trainings to impart knowledge and technologies such as tree planting (33.3-57.7%) would help address their natural resource productivity problem.
Overall, our findings show that among other interventions, training on natural resource use and management approaches and technologies were required to enhance
ix
knowledge and build capacity of Buliisa communities for sustainable natural resource use and management. To address this need, Uganda Wildlife Society and Buliisa District Local Government will under the Ecosystems Alliance Project carry out community training and supply some of the technologies demanded. This report will also be a useful guideline for other stakeholders who are working to bring about sustainable natural resource use and management in the Albertine Rift Region and elsewhere in agro-ecologies with similar natural resource management challenges.

1
1 Introduction
Sustainable use and management of natural resources in the Albertine Rift is the single most important factor that will help secure the region’s globally unique biodiversity and ecosystems, also critical for the local environment, economy and people’s livelihoods. In the context of this study, the natural resources in the Albertine Rift include biodiversity, land, forests, wetlands, water and soil among others. At the moment, these natural resources and the general ecosystems in the Albertine region are suffering degradation. The degradation is caused inter alia by overuse and inappropriate management resulting from lack of enforcement of policies by mandated institutions, catalysed by the institutions’ weaknesses, political interference, increasing human population, scramble for resources and activities of the oil industry (Plumptre et al., 2007; 2008). A study conducted in the Albertine Rift by Ecosystems Alliance Uganda Country Programme Partners–the National Association of Professional Environmentalists (NAPE), African Institute for Energy Governance (AFIEGO) and Uganda Wildlife Society (UWS), revealed that ecosystem degradation has been escalated by extraction of minerals (NAPE, UWS and AFIEGO, 2012).
In Buliisa District, natural resource sustainability is threatened among others by poor farming and fishing practices, restricted access and use of resources in protected areas and the lake, limited awareness of the need for and means to harness natural resource potential, barriers to community participation in development decision-making, weak or no incentives for compliance to natural resources, development policies and regulations and, poor information flow to inform and influence policy-level planning (Plumptre et al., 2007; 2008; NAPE, UWS and AFIEGO, 2012). The emergence of the oil industry has increased inflow of people to the region, heightened their expectations of benefits and caused restriction of their access to natural resources they had hitherto been using (NAPE, UWS and AFIEGO, 2012). These developments have generated natural resource use and management conflicts which in turn have increased overuse and degradation.
Despite the above scenario, no systematic characterisation of underlying factors to natural resource sustainability in Buliisa has been done so as to elucidate specific interventions required to address the problems. But following the baseline study

2 Unlocking Local Community Potential in Uganda’s Albertine Oil Region
(NAPE, UWS and AFIEGO, 2012) findings, the three national NGOs (NAPE, UWS and AFIEGO) received financial support from the Royal Netherlands Government through Ecosystems Alliance (Wetlands International, BothEnds and IUCN-NL) to undertake interventions to help stem degradation and achieve sustainability of the Albertine Rift natural resources so as to secure the peoples’ ecosystems, economy and livelihoods. There was need for a detailed characterisation of threats to natural resource sustainability in the region so as to identify appropriate interventions. Thus, the purpose of the needs assessment survey was to identify natural resources that local communities use and manage, the resources’ productivity trend, the trend underlying causes (constraints) and interventions for sustainability based on the perception of the resource users and mangers. as well as soil and water conditions. The study sought answers to the following questions:
1. What are the indicators of soil and water resource degradation?
2. What natural resources do communities in Buliisa use and/or manage?
3. Where are the different natural resource users/user groups in Buliisa?
4. In the last fi ve to ten years, what is the productivity trend of the natural resources the communities use/manage?
5. What are the constraints or underlying factors tocauses of the resources productivity trend?
6. What interventions are required to stem the constraints and sustain productivity of the resources?
3
2 Materials and methods
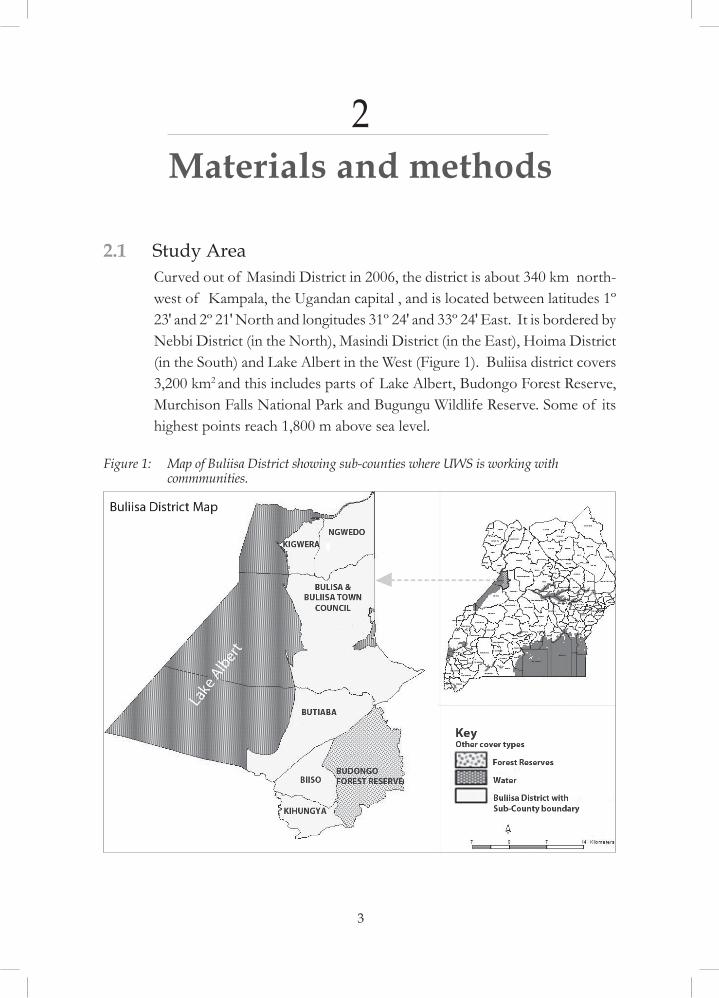
2.1 Study Area Curved out of Masindi District in 2006, the district is about 340 km north-west of Kampala, the Ugandan capital , and is located between latitudes 1º 23′ and 2º 21′ North and longitudes 31º 24′ and 33º 24′ East. It is bordered by Nebbi District (in the North), Masindi District (in the East), Hoima District (in the South) and Lake Albert in the West (Figure 1). Buliisa district covers 3,200 km2 and this includes parts of Lake Albert, Budongo Forest Reserve, Murchison Falls National Park and Bugungu Wildlife Reserve. Some of its highest points reach 1,800 m above sea level.
Figure 1: Map of Buliisa District showing sub-counties where UWS is working with commmunities.
4 Unlocking Local Community Potential in Uganda’s Albertine Oil Region
2.1.1 Demographic and socio-economic indicatorsBuliisa District is composed of six sub-counties and one town council, (Biiso, Buliisa, Butiaba, Kigwera, Kihungya, Ngwedo and Buliisa Town Council,) all in one county (Figure 1) which is the same parliamentary constituency.
There are 110,000 people, and the average household size is seven persons (UBOS, 2002). About 90% of these rely on wood fuel as the main source of energy. Natural resourcedependent communities in the district include fisher folk comprising 2,744 households in eight landing sites (Butiaba, Tungombiri, Walukuba, Bugoigo, Kabolwa, and Wansenko) around Lake Albert. About 150 households are pastoralists while 1500 are farmers engaged in crop farming (UBOS, 2002; NAPE, UWS and AFIEGO, 2012). Land is communally owned and has been zoned based on resource user groups. Lake Albert shores are a fishing zone, crops are grown near Waisoke River, Kabolwa landing site and Walukuba that are adjacent to Bugungu Wild Life Reserve. Main crops are cotton, bananas, cassava and maize (NAPE, UWS and AFIEGO, 2012).
2.2 Data Collection
2.2.1 Soil and water conditionA minimum of five soil samples and five water samples were taken from randomly selected sites following water and soil sampling approaches by Anderson and Ingram (1993). The soil and water samples were analysed in Makerere University Chemistry Laboratory for nutrient composition (Anderson et al., 2002).
2.2.2 Natural resource use/management constraintsA questionnaire (Appendix I) was used to elicit information from households on the natural resources they use and manage, the constraints they face with the resource use and management and the interventions they deem necessary to address the problems. This exercise was carried out in all the six sub-counties and the town council (Figure 2). The households were sampled at systematic intervals of 1000 metres apart, with a random starting point at least 500 metres away from boundary of a given sub county. Where the household at sample interval had no people to be interviewed and or where the sampling interval fell where there was no household/homestead,
Materials and Methods 5
the next immediate household was considered. Subsequent sampling then continued as before that is, 1000 metres apart. Using this approach, at least 50 households were interviewed from each of the six sub-counties and one town council , a total of 374 households in the district.
2.2.3 Mapping locations of households For each of the 374 households interviewed, their household location coordinates (altitude, latitude and longitude) were taken using Geographic Position Equipment (GPS)- (GARMIN, eTrex HC series, 2007 Garmin Ltd, Personal Navigator and, VISTA HCxMade in Taiwan, Canada 2010). The household location coordinates were later used to generate a GIS map showing the households and the resource user groups in the district.
2.2.4 Focus Group Interviews and DiscussionsSome of the respondents, together with key informants (district technical and political leaders, policy makers, private sector and student representatives) were engaged in Focus Group Discussions (Appendix 2) to identify constraints and interventions required to sustain natural resource use and management.
2.3 Data analysis
2.3.1 Soil and water dataValues of the different soil and water nutrients and pH obtained from the soil and water samples from the different sites were entered in MS Excel and analysed for means and variability across and within the sites. The results were used to infer baseline soil and water conditions.
2.3.2 Analysis of survey data Data obtained from interviews conducted with households were coded in MS Excel and imported into Statistical Package for the Social Scientists (SPSS). Percentages were generated to show resources used/resource user groups, their perceptions of constraints to sustainability of natural resources use and management, and interventions (tools and technologies) needed to address the problems including by whom, how and where (sites for the interventions). We performed correlation analysis to identify socio-economic variables (among resource users/managers) that affect natural resource sustainability.
6 Unlocking Local Community Potential in Uganda’s Albertine Oil Region
2.3.3 Map showing households/resource user groups Location coordinates (altitude, latitude, longitude) of the 374 households interviewed in this study, taken using the Geographic Position System (GPS), were sent to the World Agroforestry Centre/ICRAF GIS unit to generate a map. Experts at the centre used Arc-GIS programme by ESRI (1999-2002) to generate the map (Figure 3).
2.3.4 Analysis of Focus Group Discussion dataFocus Group Discussion data on natural resource use and management problems in Buliisa District, and the possible interventions were summarised and cross synthesised with results from the individual-households interviews.
7
3 Survey Findings
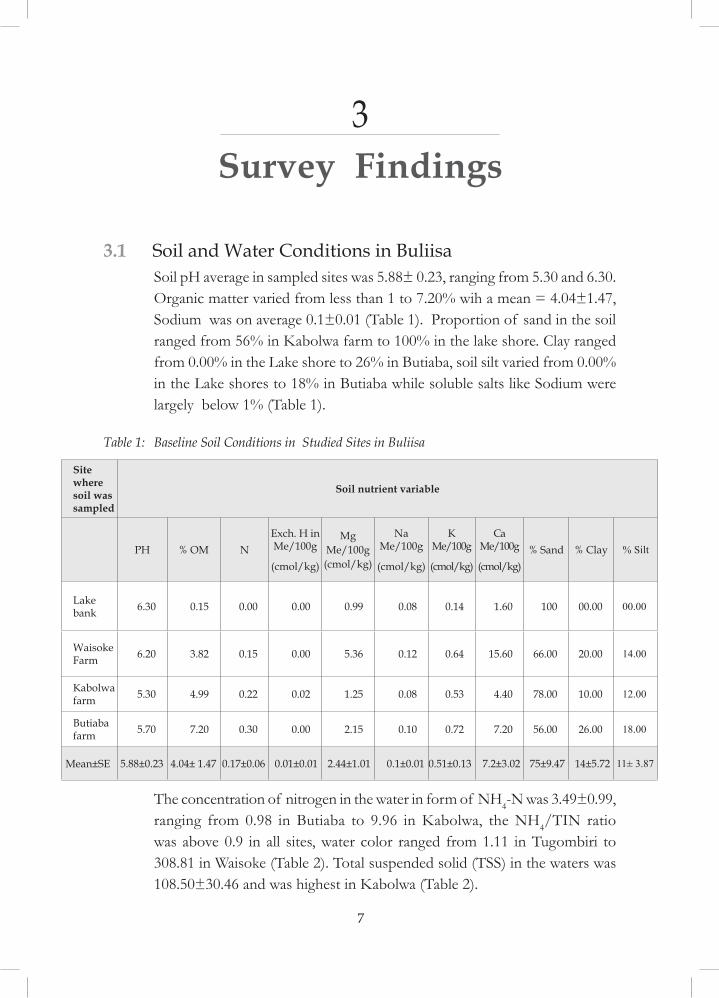
3.1 Soil and Water Conditions in Buliisa Soil pH average in sampled sites was 5.88± 0.23, ranging from 5.30 and 6.30. Organic matter varied from less than 1 to 7.20% wih a mean = 4.04±1.47, Sodium was on average 0.1±0.01 (Table 1). Proportion of sand in the soil ranged from 56% in Kabolwa farm to 100% in the lake shore. Clay ranged from 0.00% in the Lake shore to 26% in Butiaba, soil silt varied from 0.00% in the Lake shores to 18% in Butiaba while soluble salts like Sodium were largely below 1% (Table 1).
Table 1: Baseline Soil Conditions in Studied Sites in Buliisa
Site where soil was sampled
Soil nutrient variable
PH % OM NExch. H in Me/100g
(cmol/kg)
MgMe/100g(cmol/kg)
Na Me/100g
(cmol/kg)
K Me/100g
(cmol/kg)
Ca Me/100g
(cmol/kg)% Sand % Clay % Silt
Lake bank 6.30 0.15 0.00 0.00 0.99 0.08 0.14 1.60 100 00.00 00.00
Waisoke Farm 6.20 3.82 0.15 0.00 5.36 0.12 0.64 15.60 66.00 20.00 14.00
Kabolwa farm 5.30 4.99 0.22 0.02 1.25 0.08 0.53 4.40 78.00 10.00 12.00
Butiaba farm 5.70 7.20 0.30 0.00 2.15 0.10 0.72 7.20 56.00 26.00 18.00
Mean±SE 5.88±0.23 4.04± 1.47 0.17±0.06 0.01±0.01 2.44±1.01 0.1±0.01 0.51±0.13 7.2±3.02 75±9.47 14±5.72 11± 3.87
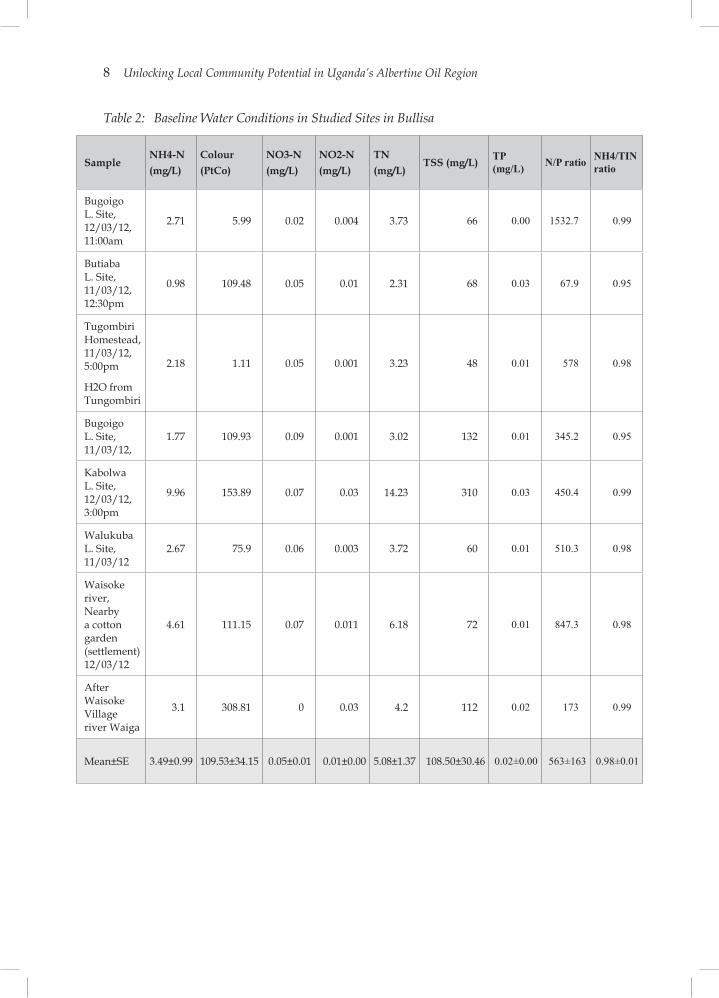
The concentration of nitrogen in the water in form of NH4-N was 3.49±0.99, ranging from 0.98 in Butiaba to 9.96 in Kabolwa, the NH4/TIN ratio was above 0.9 in all sites, water color ranged from 1.11 in Tugombiri to 308.81 in Waisoke (Table 2). Total suspended solid (TSS) in the waters was 108.50±30.46 and was highest in Kabolwa (Table 2).
8 Unlocking Local Community Potential in Uganda’s Albertine Oil Region
Table 2: Baseline Water Conditions in Studied Sites in Bullisa
SampleNH4-N (mg/L)
Colour (PtCo)
NO3-N (mg/L)
NO2-N (mg/L)
TN (mg/L)
TSS (mg/L) TP (mg/L) N/P ratio NH4/TIN
ratio
Bugoigo L. Site, 12/03/12, 11:00am
2.71 5.99 0.02 0.004 3.73 66 0.00 1532.7 0.99
Butiaba L. Site, 11/03/12, 12:30pm
0.98 109.48 0.05 0.01 2.31 68 0.03 67.9 0.95
Tugombiri Homestead, 11/03/12, 5:00pm
H2O from Tungombiri
2.18 1.11 0.05 0.001 3.23 48 0.01 578 0.98
Bugoigo L. Site, 11/03/12,
1.77 109.93 0.09 0.001 3.02 132 0.01 345.2 0.95
Kabolwa L. Site, 12/03/12, 3:00pm
9.96 153.89 0.07 0.03 14.23 310 0.03 450.4 0.99
Walukuba L. Site, 11/03/12
2.67 75.9 0.06 0.003 3.72 60 0.01 510.3 0.98
Waisoke river, Nearby a cotton garden (settlement) 12/03/12
4.61 111.15 0.07 0.011 6.18 72 0.01 847.3 0.98
After Waisoke Village river Waiga
3.1 308.81 0 0.03 4.2 112 0.02 173 0.99
Mean±SE 3.49±0.99 109.53±34.15 0.05±0.01 0.01±0.00 5.08±1.37 108.50±30.46 0.02±0.00 563±163 0.98±0.01
Survey Findings 9
3.2 Natural Resource Use and Management in Buliisa
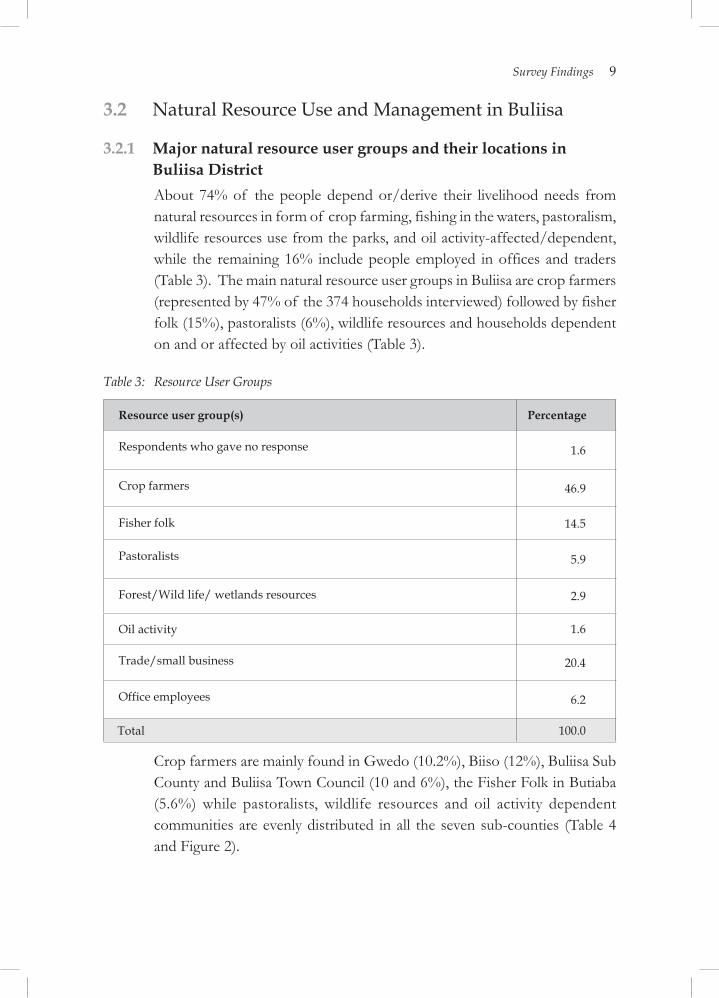
3.2.1 Major natural resource user groups and their locations in Buliisa District About 74% of the people depend or/derive their livelihood needs from natural resources in form of crop farming, fishing in the waters, pastoralism, wildlife resources use from the parks, and oil activity-affected/dependent, while the remaining 16% include people employed in offices and traders (Table 3). The main natural resource user groups in Buliisa are crop farmers (represented by 47% of the 374 households interviewed) followed by fisher folk (15%), pastoralists (6%), wildlife resources and households dependent on and or affected by oil activities (Table 3).
Table 3: Resource User Groups
Resource user group(s) Percentage
Respondents who gave no response 1.6
Crop farmers 46.9
Fisher folk 14.5
Pastoralists 5.9
Forest/Wild life/ wetlands resources 2.9
Oil activity 1.6
Trade/small business 20.4
Office employees 6.2
Total 100.0
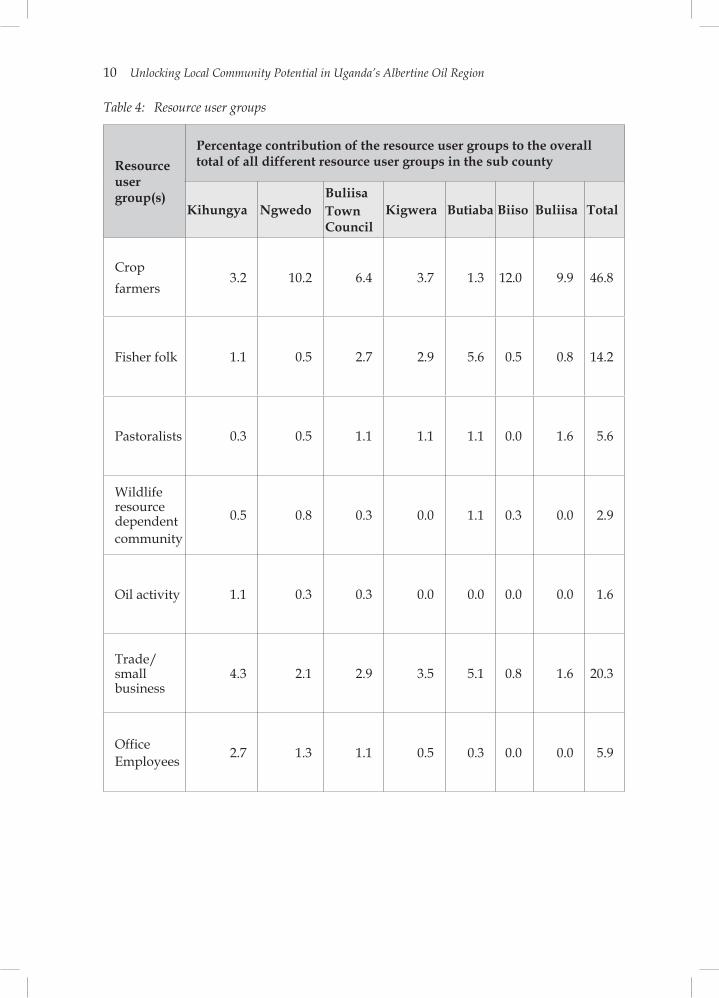
Crop farmers are mainly found in Gwedo (10.2%), Biiso (12%), Buliisa Sub County and Buliisa Town Council (10 and 6%), the Fisher Folk in Butiaba (5.6%) while pastoralists, wildlife resources and oil activity dependent communities are evenly distributed in all the seven sub-counties (Table 4 and Figure 2).
10 Unlocking Local Community Potential in Uganda’s Albertine Oil Region
Table 4: Resource user groups
Resource user group(s)
Percentage contribution of the resource user groups to the overall total of all different resource user groups in the sub county
Kihungya Ngwedo BuliisaTown Council
Kigwera Butiaba Biiso Buliisa Total
Crop farmers
3.2 10.2 6.4 3.7 1.3 12.0 9.9 46.8
Fisher folk 1.1 0.5 2.7 2.9 5.6 0.5 0.8 14.2
Pastoralists 0.3 0.5 1.1 1.1 1.1 0.0 1.6 5.6
Wildlife resource dependent community
0.5 0.8 0.3 0.0 1.1 0.3 0.0 2.9
Oil activity 1.1 0.3 0.3 0.0 0.0 0.0 0.0 1.6
Trade/small business
4.3 2.1 2.9 3.5 5.1 0.8 1.6 20.3
Office Employees 2.7 1.3 1.1 0.5 0.3 0.0 0.0 5.9
Survey Findings 11
3.2.2 Location of the different resource user groups in the seven sub-counties of Buliisa
Figure 2: Map of Buliisa District showing all its seven sub-counties where UWS is working in support of communities (Resource user groups)
3.2.3 Users perception on natural resource productivity trendsFor all resource users, 70% and above percieve the natural resources productivity to have declined in the past five to ten years, except for pastoralists and fisher folk. About 9-13% of the rest of the other resource users percieve productivity of the natural resources they use to be increasing (Table 5).

12 Unlocking Local Community Potential in Uganda’s Albertine Oil Region
Table 5: Resource User Groups’ Perception on productivity trend in the last 5-20 years
Resource user group(s)
Statiscal measure Resource user groups response/perception on resource producitivity trend in the last 5-20 years
Statistics No response Declining Constant Increasing Total
Respondents who gave no response
% within employment status/occupation
100.0% .0% .0% .0% 100.0%
Crop farmers% within employment status/occupation
25.1% 41.1% 20.0% 13.7% 100.0%
Fisher folk% within employment status/occupation
29.6% 50.0% 11.1% 9.3% 100.0%
Pastoralists% within employment status/occupation
18.2% 50.0% .0% 31.8% 100.0%
Forest/Wild life/ wetlands resources
% within employment status/occupation
36.4% 45.5% .0% 18.2% 100.0%
Oil activity% within employment status/occupation
83.3% 16.7% .0% .0% 100.0%
Trade/small business
% within employment status/occupation
26.3% 51.3% 9.2% 13.2% 100.0%
Office employee% within employment status/occupation
78.3% 13.0% 8.7% .0% 100.0%
Total% within employment status/occupation
31.4% 42.4% 13.4% 12.9% 100.0%
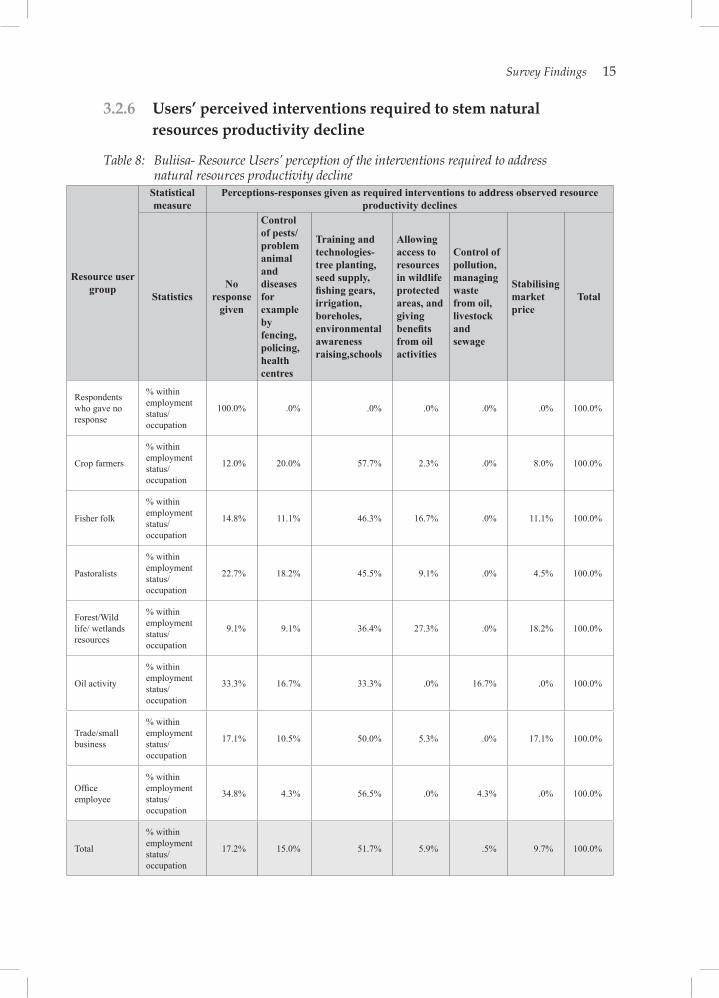
Table 6 shows perceived causes of natural resource producitivity decline, which include pests and disease, wildlife animal attack (40.6% among crop farmers), climate change (27% among pastoralists) and innapropriate management (65% among fisher folk). The other important factors were vegetation cover, drought and/or water availability, soil fertility and size of landholding (Table 7). Across the resource user groups in Buliisa, the majority suggested training in a range of management technologies, pest and disease control as interventions required to address natural resources sustaianability constraints (Table 8). Among the fisher folk and wildlife resourcedependent communities (above 20%), authorised access to resources from the protected area is an important factor for sustainability of the natural resources (Table 8).
Survey Findings 13
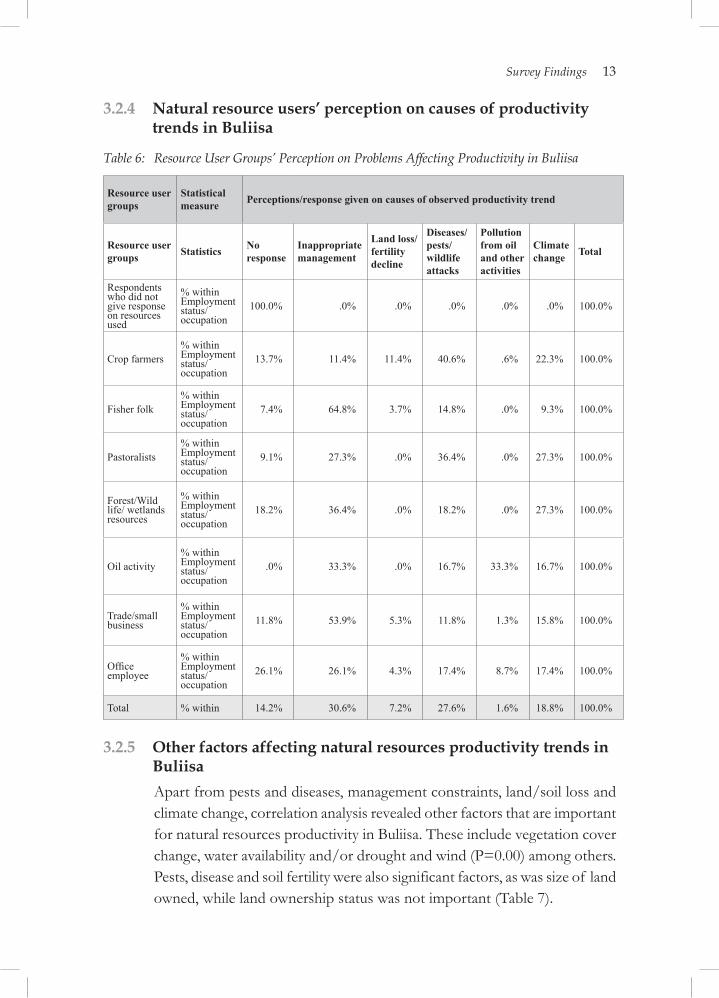
3.2.4 Natural resource users’ perception on causes of productivity trends in Buliisa
Table 6: Resource User Groups’ Perception on Problems Affecting Productivity in Buliisa
Resource user groups
Statistical measure Perceptions/response given on causes of observed productivity trend
Resource user groups Statistics No
response Inappropriate management
Land loss/fertility decline
Diseases/pests/ wildlife attacks
Pollution from oil and other activities
Climate change Total
Respondents who did not give response on resources used
% within Employment status/occupation
100.0% .0% .0% .0% .0% .0% 100.0%
Crop farmers% within Employment status/occupation
13.7% 11.4% 11.4% 40.6% .6% 22.3% 100.0%
Fisher folk% within Employment status/occupation
7.4% 64.8% 3.7% 14.8% .0% 9.3% 100.0%
Pastoralists% within Employment status/occupation
9.1% 27.3% .0% 36.4% .0% 27.3% 100.0%
Forest/Wild life/ wetlands resources
% within Employment status/occupation
18.2% 36.4% .0% 18.2% .0% 27.3% 100.0%
Oil activity% within Employment status/occupation
.0% 33.3% .0% 16.7% 33.3% 16.7% 100.0%
Trade/small business
% within Employment status/occupation
11.8% 53.9% 5.3% 11.8% 1.3% 15.8% 100.0%
Offi ce employee
% within Employment status/occupation
26.1% 26.1% 4.3% 17.4% 8.7% 17.4% 100.0%
Total % within 14.2% 30.6% 7.2% 27.6% 1.6% 18.8% 100.0%
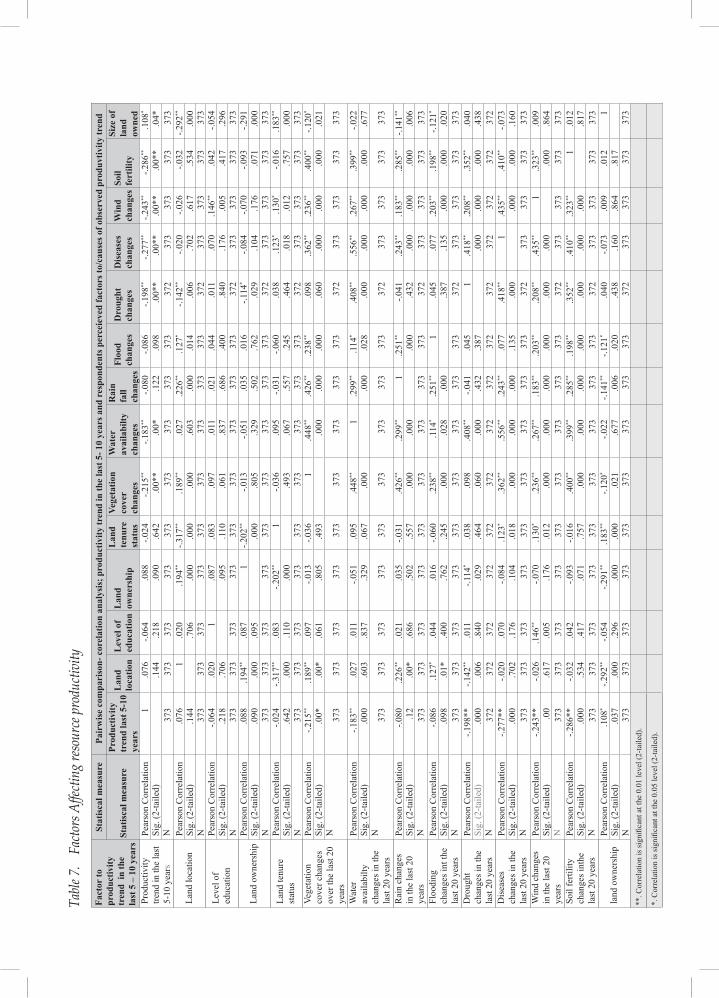
3.2.5 Other factors affecting natural resources productivity trends in Buliisa Apart from pests and diseases, management constraints, land/soil loss and climate change, correlation analysis revealed other factors that are important for natural resources productivity in Buliisa. These include vegetation cover change, water availability and/or drought and wind (P=0.00) among others. Pests, disease and soil fertility were also significant factors, as was size of land owned, while land ownership status was not important (Table 7).
Table
7.
Facto
rs A
ffecti
ng re
sour
ce pr
oduc
tivity
Fact
or to
pr
oduc
tivity
tr
end
in th
e la
st 5
– 1
0 ye
ars
Stat
isca
l mea
sure
Pair
wis
e co
mpa
riso
n- c
orel
atio
n an
alys
is; p
rodu
ctiv
ity tr
end
in th
e la
st 5
- 10
year
s and
res
pond
ents
per
ceie
ved
fact
ors t
o/ca
uses
of o
bser
ved
prod
uvtiv
ity tr
end
Stat
isca
l mea
sure
Prod
uctiv
ity
tren
d la
st 5
-10
year
s
Lan
d lo
catio
nL
evel
of
educ
atio
nL
and
owne
rshi
p
Lan
d te
nure
st
atus
Vege
tatio
n co
ver
chan
ges
Wat
er
avai
labi
lty
chan
ges
Rai
n fa
ll ch
ange
s
Floo
d ch
ange
s D
roug
ht
chan
ges
Dis
ease
s ch
ange
s W
ind
chan
ges
Soil
fert
ility
Size
of
land
ow
ned
Prod
uctiv
ity
trend
in th
e la
st
5-10
yea
rs
Pear
son
Cor
rela
tion
1.0
76-.0
64.0
88-.0
24-.2
15**
-.183
**-.0
80-.0
86-.1
98**
-.277
**-.2
43**
-.286
**.1
08*
Sig.
(2-ta
iled)
.144
.218
.090
.642
.00*
*.0
0*.1
22.0
98.0
0**
.00*
*.0
0**
.00*
*.0
4*N
373
373
373
373
373
373
373
373
373
372
373
373
373
373
Land
loca
tion
Pear
son
Cor
rela
tion
.076
1.0
20.1
94**
-.317
**.1
89**
.027
.226
**.1
27*
-.142
**-.0
20-.0
26-.0
32-.2
92**
Sig.
(2-ta
iled)
.144
.706
.000
.000
.000
.603
.000
.014
.006
.702
.617
.534
.000
N37
337
337
337
337
337
337
337
337
337
237
337
337
337
3Le
vel o
f ed
ucat
ion
Pear
son
Cor
rela
tion
-.064
.020
1.0
87.0
83.0
97.0
11.0
21.0
44.0
11.0
70.1
46**
.042
-.054
Sig.
(2-ta
iled)
.218
.706
.095
.110
.061
.837
.686
.400
.840
.176
.005
.417
.296
N37
337
337
337
337
337
337
337
337
337
237
337
337
337
3
Land
ow
ners
hip
Pear
son
Cor
rela
tion
.088
.194
**.0
871
-.202
**-.0
13-.0
51.0
35.0
16-.1
14*
-.084
-.070
-.093
-.291
Sig.
(2-ta
iled)
.090
.000
.095
.000
.805
.329
.502
.762
.029
.104
.176
.071
.000
N37
337
337
337
337
337
337
337
337
337
237
337
337
337
3La
nd te
nure
st
atus
Pear
son
Cor
rela
tion
-.024
-.317
**.0
83-.2
02**
1-.0
36.0
95-.0
31-.0
60.0
38.1
23*
.130
*-.0
16.1
83**
Sig.
(2-ta
iled)
.642
.000
.110
.000
.493
.067
.557
.245
.464
.018
.012
.757
.000
N37
337
337
337
337
337
337
337
337
337
237
337
337
337
3Ve
geta
tion
cove
r cha
nges
ov
er th
e la
st 2
0 ye
ars
Pear
son
Cor
rela
tion
-.215
**.1
89**
.097
-.013
-.036
1.4
48**
.426
**.2
38**
.098
.362
**.2
36**
.400
**-.1
20*
Sig.
(2-ta
iled)
.00*
.00*
.061
.805
.493
.000
.000
.000
.060
.000
.000
.000
.021
N37
337
337
337
337
337
337
337
337
337
237
337
337
337
3
Wat
er
avai
labi
lty
chan
ges i
n th
e la
st 2
0 ye
ars
Pear
son
Cor
rela
tion
-.183
**.0
27.0
11-.0
51.0
95.4
48**
1.2
99**
.114
*.4
08**
.556
**.2
67**
.399
**-.0
22Si
g. (2
-taile
d).0
00.6
03.8
37.3
29.0
67.0
00.0
00.0
28.0
00.0
00.0
00.0
00.6
77N
373
373
373
373
373
373
373
373
373
372
373
373
373
373
Rai
n ch
ange
s in
the
last
20
year
s
Pear
son
Cor
rela
tion
-.080
.226
**.0
21.0
35-.0
31.4
26**
.299
**1
.251
**-.0
41.2
43**
.183
**.2
85**
-.141
**
Sig.
(2-ta
iled)
.12
.00*
.686
.502
.557
.000
.000
.000
.432
.000
.000
.000
.006
N37
337
337
337
337
337
337
337
337
337
237
337
337
337
3Fl
oodi
ng
chan
ges i
nt th
e la
st 2
0 ye
ars
Pear
son
Cor
rela
tion
-.086
.127
*.0
44.0
16-.0
60.2
38**
.114
*.2
51**
1.0
45.0
77.2
03**
.198
**-.1
21*
Sig.
(2-ta
iled)
.098
.01*
.400
.762
.245
.000
.028
.000
.387
.135
.000
.000
.020
N37
337
337
337
337
337
337
337
337
337
237
337
337
337
3D
roug
ht
chan
ges i
n th
e la
st 2
0 ye
ars
Pear
son
Cor
rela
tion
-.198
**-.1
42**
.011
-.114
*.0
38.0
98.4
08**
-.041
.045
1.4
18**
.208
**.3
52**
.040
Sig.
(2-ta
iled)
.000
.006
.840
.029
.464
.060
.000
.432
.387
.000
.000
.000
.438
N37
237
237
237
237
237
237
237
237
237
237
237
237
237
2D
isea
ses
chan
ges i
n th
e la
st 2
0 ye
ars
Pear
son
Cor
rela
tion
-.277
**-.0
20.0
70-.0
84.1
23*
.362
**.5
56**
.243
**.0
77.4
18**
1.4
35**
.410
**-.0
73Si
g. (2
-taile
d).0
00.7
02.1
76.1
04.0
18.0
00.0
00.0
00.1
35.0
00.0
00.0
00.1
60N
373
373
373
373
373
373
373
373
373
372
373
373
373
373
Win
d ch
ange
s in
the
last
20
year
s
Pear
son
Cor
rela
tion
-.243
**-.0
26.1
46**
-.070
.130
*.2
36**
.267
**.1
83**
.203
**.2
08**
.435
**1
.323
**.0
09Si
g. (2
-taile
d).0
0.6
17.0
05.1
76.0
12.0
00.0
00.0
00.0
00.0
00.0
00.0
00.8
64N
373
373
373
373
373
373
373
373
373
372
373
373
373
373
Soil
ferti
lity
chan
ges i
nthe
la
st 2
0 ye
ars
Pear
son
Cor
rela
tion
-.286
**-.0
32.0
42-.0
93-.0
16.4
00**
.399
**.2
85**
.198
**.3
52**
.410
**.3
23**
1.0
12Si
g. (2
-taile
d).0
00.5
34.4
17.0
71.7
57.0
00.0
00.0
00.0
00.0
00.0
00.0
00.8
17N
373
373
373
373
373
373
373
373
373
372
373
373
373
373
land
ow
ners
hip
Pear
son
Cor
rela
tion
.108
*-.2
92**
-.054
-.291
**.1
83**
-.120
*-.0
22-.1
41**
-.121
*.0
40-.0
73.0
09.0
121
Sig.
(2-ta
iled)
.037
.000
.296
.000
.000
.021
.677
.006
.020
.438
.160
.864
.817
N37
337
337
337
337
337
337
337
337
337
237
337
337
337
3**
. Cor
rela
tion
is si
gnifi
cant
at t
he 0
.01
leve
l (2-
taile
d).
*. C
orre
latio
n is
sign
ifi ca
nt a
t the
0.0
5 le
vel (
2-ta
iled)
.
Survey Findings 15
3.2.6 Users’ perceived interventions required to stem natural resources productivity decline
Table 8: Buliisa- Resource Users’ perception of the interventions required to address natural resources productivity decline
Resource user group
Statistical measure
Perceptions-responses given as required interventions to address observed resource productivity declines
Statistics No
response given
Control of pests/problem animal and diseases for example by fencing, policing, health centres
Training and technologies- tree planting, seed supply, fi shing gears, irrigation, boreholes, environmental awareness raising,schools
Allowing access to resources in wildlife protected areas, and giving benefi ts from oil activities
Control of pollution, managing waste from oil, livestock and sewage
Stabilising market price
Total
Respondents who gave no response
% within employment status/occupation
100.0% .0% .0% .0% .0% .0% 100.0%
Crop farmers
% within employment status/occupation
12.0% 20.0% 57.7% 2.3% .0% 8.0% 100.0%
Fisher folk
% within employment status/occupation
14.8% 11.1% 46.3% 16.7% .0% 11.1% 100.0%
Pastoralists
% within employment status/occupation
22.7% 18.2% 45.5% 9.1% .0% 4.5% 100.0%
Forest/Wild life/ wetlands resources
% within employment status/occupation
9.1% 9.1% 36.4% 27.3% .0% 18.2% 100.0%
Oil activity
% within employment status/occupation
33.3% 16.7% 33.3% .0% 16.7% .0% 100.0%
Trade/small business
% within employment status/occupation
17.1% 10.5% 50.0% 5.3% .0% 17.1% 100.0%
Offi ce employee
% within employment status/occupation
34.8% 4.3% 56.5% .0% 4.3% .0% 100.0%
Total
% within employment status/occupation
17.2% 15.0% 51.7% 5.9% .5% 9.7% 100.0%
16 Unlocking Local Community Potential in Uganda’s Albertine Oil Region
Emerging issues from the focus group discussions1. Resource use and management related confl icts within and among resource
users and resource managers. Currently the problem originates from who livestock owners. who abandon their cattle. The herdsmen (locally referred to as the “Balalo”) who leave the cattle loitering around, and only mind about getting milk which is their source of livelihood. The loitering large herds of cattle destroy crops of other farmers. There exists a conflict between local communities in Wanseko and the Uganda Wildlife Authority (UWA) over the park and Wanseko landing site boundary. UWA arrests fisher folk when they get in the waters within the park near the landing site. Some parts of the water should be demarcated as community zone for fishing. A number of Memoranda of Understanding that gave the local communities access to resources from the park expired and new ones need to be signed to resolve related conflicts. The people need to harvest resources such as papyrus from wetlands inside the park, they need to do bee-keeping and tree planting near and at the buffer zones between their land and the Murchison Falls National Park and Bugungu Wildlife reserve.
2. Inadequate capacity for natural resource use and management and monitoring of compliance to policy. There is need to change people’s attitudes towards keeping large numbers of cattle so that they have few productive and well maintained quality stock. Use of illegal fi shing gear is prominent in Buliisa due to the weak capacity of the nine Beach Management Units (BMUs). In addition, the illegal fi shing gear is cheaper than the standard fi shing gear.
3. Need to develop alternative livelihoods outside the natural resources. Buliisa has no plan for tourism development, but participants noted that this could be developed by promoting handicraft, cultural tourism and leisure parks.
17
4Discussion
4.1 Soil and water condition Buliisa soils are acidic, sandy but with sufficient levels of organic matter and soluble salts. This can be attributed to the geology and climate of the district. Sandy soils though good in drainage and aeration, have a poor ability to retain water and nutrients (soiltests.uconn.edu/factsheets/interpretation Results-new.pdf). Such soils require management interventions like liming or practicing agroforestry, improving soil fertility and growing suitable trees and crops, livestock systems and tolerant genotypes (FAO/IAEA, 1999; FAO/IAEA, 2007; Amede and others in German et al., 2012). These management options could be adopted with modifications to improve nutrient and water rentention capacity of the soil so as to improve its productivity. A number of possible management options for pilot testing are discussed in our other publications (Nantaba et a l., 2011; Nyadoi et al., 2012) but some examples include planting trees that improve soil fertility through agroforestry. Uganda Wildlife Society has documented a number of these technologies and, together with the Buliisa local communities came up with a list of trees that could be adopted (Nyadoi et al., 2012).
Nitrogen concetration (NH4-N) in the water is higher than acceptable levels (WHO, 2011). Ammonium nitrogen originates from metabolic, agricultural and industrial processes (organic pollutants) and from disinfection with chloramine. Ammonia in water is an indicator of possible bacterial, sewage and animal waste pollution and or low dissolved oxygen that inhibit ammonia biochemical oxidation and cause heterotrophic bacteria to use nitrate as an alternative electron acceptor. The process reduces nitrates to nitrogen gas or ammonia (Riley and Chester, 1971) due to the reduction of NO3 to NH4-N via a denitrification process (Seitzniger, 1988).
There are also signs of poor nitrification in the waters as the NH4/TIN ratio was also high. Poor nitrification may be caused by toxic organic chemicals, metals, ammonia gas and nitrous acid that come from farmlands, industrial
18 Unlocking Local Community Potential in Uganda’s Albertine Oil Region
proccesses and air pollution possibly arising from emerging oil activities in the district. Inorganic form of nitrogen was also higher than the acceptable level (0.3mg/L), hence algae bloom likely. Calculated TN/TP ratios were above 30 and and phosphorus levels in Butiaba, Kabolwa and Waiga river were above 0.02 mg/L thus indicating eutrophication due to human activities (Lillie and Mason, 1983; Shaw et al., 2000). In hard water, calcium carbonate does precipitate to the bottom and absorbs phosphorus, consequently regulating its levels and effect on algae growth. In this study we did not evaluate hardiness and therefore we cannot verify the role of calcium carbonate in phosphorus regulation in the waters.
Save for Tugombiri and Bugoigo, water colour in the sampled sites in Buliisa were above the maximum acceptable and allowable-5 and 50 units respectively (WHO, 2011). Values above the allowable and acceptable limit of colour indicate poor water quality, which like the other water quality parameters discussed so far, may be due to europhication. Total suspended solids ratio was high in the Buliisa waters, especially in Kabolwa. Total suspended solid transport includes nitrogen and phosphorus and altogether these increase sedimentation, biological/aquatic plant growth, oxygen depletion, and reduce clarity of water (EPA, 1977).
The above soil and water conditions reveal degradation of the water and soil resources. As has been discussed, causative factors of degradation are due to human activities upstream on farm lands, industrial processes, air pollutants /acid rains and nitrous oxide which come from the mining and or extractive activities in the district. Our samples were limited. However we assured that standard sampling and analytical procedures were followed. Therefore, our findings are important pointers of soil and water degradation in Buliisa. There is a need for detailed studies to determine the degradation sources.
4.2 Natural resource use, management and sustainability constraints This study has revealed that 76% of the the people in Buliisa depend on natural resources for their livelihoods. The resource user groups are crop farmers, fisher folk, pastoralists, wildlife resource, and oil activities dependent households. These groups are aware that the productivity of the natural resources they depend on are declining and they attribute this to decline in soil fertility/land loss, climate change, limited landholding size, restricted
Discussion 19
access to resources from protected areas, pests and diseases including wildlife attack and inappropriate management.
Landholding size in Buliisa is related to natural resource sustainability, whereas land ownership does not. For long, many people have advocated for land ownership to be addressed in Buliisa because it affects the sustainability of natural resources. Currently, much of the land in Buliisa is communally owned. The implication of our findings is that there is need for a strategy to ensure that the Buliisa people have access to and control over land to meet their different needs. It means restriction of access to resources that people need (be it in the protected areas), like other studies have reported in the Albertine Rift (Plumptre et al., 2007), shall escalate natural resource degradation in Buliisa and such resource based conflicts need to be addressed. Our findings thus pinpoint the need for protected area managers (Bugungu Wildlife Reserve, Murchison Falls National Park, Budongo Forest Reserve, and Lake Albert ) to rethink and re-evaluate strategies being applied in the management of these resources. Increased poaching, hostility to wildlife, deforestation and threats may be resolved by implementation of strategies that give the local communities access to resources in a sustainable manner.
4.3 Soil and water analyses in respect to peoples’ perception of natural resource sustainability constraintsIt is evident from our studies that soil and water degradation in Buliisa starts from upstream onland – in the resource use and management practices among the people. This means tackling degradtion in the soils and waters will require sound use and management practices upstream among users and managers of the resources. In other words, when appropriate management practices are instituted upland, it is consequential that soil and water quality in Buliisa District will be secured. Pollutants observed in the water quality parameters (including nutrient levels) in the district point to animal waste/sewage discharges, industrial chemicals and air pollutants from mining companies and the oil sector. A detailed further study however is needed to delineate contributions to soil and water degradation by these different possible sources. The need to deploy a holistic landscape level approach to ecosystem management is a strategy that has been popularised under the REDD+ interventions (Mbow et al., 2012). Such strategy may also work for the entire Albertine Rift and in other regions with similar socio-economic- environmental settings.

21
5Conclusion and
Recommendations
5.1 Conclusion From our findings, the following are the emerging issues in respect to resource management and use in the Albertine Rift:
1. Landscape level management approach , since activities/management practices upstream (in farmlands, industries and mining sector) are sources of soil and water pollutants. Use and management practices upland and downstream should adhere to landscape level management standards entrenched through MoUs, bye-laws and policies that need to be popularised among the resource users and managers.
2. Restricted access and or in proxy–landholding size and not ownership status infl uence natural resources sustainability in Buliisa. This implies that access to land and water resources in the district by the local communities is important and need to be secured by the resource managers.
3. Natural resources are the main sources of livelihoods to over 70% of the people in Buliisa. Trade and offi ce employment is important to only 16%. Sustainable managament and use of natural resources is thus key to securing Buliisa peoples’ ecosystems, economy and livelihoods.
4. Natural resource users and managers in Buliisa understand that their resources are declining and they attribute this to inappropriate managment, pests and disease, climate change, landholding size and restricted access to resources from protected areas. Therefore, management capacity building through training and technologies and, access to resources from protected areas will be critical for attaining sustainable natural resource use and management in Buliisa.
5. Crop farmers are the major natural resource user group in Buliisa and the majority of them live in Ngwedo and Biiso sub-counties. Pastoralists, oil and wildlife resource dependent households are found in all the six sub-counties and the town council in the district but in small numbers. Fisher folk in Buliisa are mainly found in Butiaba.
22 Unlocking Local Community Potential in Uganda’s Albertine Oil Region
6. A range of management technologies including agroforestry and climate change adaptation and mitigation strategies, access to resources from protected areas, control of pests and diseases are interventions that Buliisa people perceive will help address their natural resources sustainability constraints.
5.2 RecommendationsFrom the findings, it is evident that for sustainability of natural resource use and management in Buliisa, there is a need for:
1. Natural resource management capacity building training and technologies to enable all Buliisa communities and natural resources managers (UWA, NFA, BMUs) use and manage their natural resources sustainably and address climate change. The technologies and training will, however, be resource user group specifi c and in a few cases cut across.
2. There is a need for holistic landscape-level management approach with policies and bye-laws to guide practices upland and in the water bodies in Buliisa.
3. Strategies allowing access to resources from protected areas for the local communties need to be instituted to enable sustainability.
4. There is need for a detailed research to elucidate the contribution of farmlands, industrial and mining sector, including activities in the oil industry to natural resources (soil and water) degradation.
23
References
Amede, T., Lyamchai, C., Hailu, G., Kassa, B., Begashaw, L., Wickama, J., Wakjira, A. and Woldegiorgis, G. Participatory Farm-Level Innovations. In German, L., Mowo, J., Amede, T. And Masuki, K. (Eds.) 2007. Integrated Natural Resource Management in the Highlands of Eastern Africa. From Concept to Practice. World Agroforestry Centre and International Development Research Centre.
Anderson, J.M. and Ingram, J.S.I. 1993. Tropical Soil Biology and Fertility: A handbook of Methods (2nd Edition). CAB International, UK.
Booth, B. and Michel, A. 1999-2001. Getting Started with ArcGIS. ESRI 1999-2001.
Buliisa District Local Government. 2007. A Five Year District Integrated Strategic Plan for Orphans and Other Vulnerable Children. 2008 – 2012.
EPA, 1977. Suspended and Dissolved Solids Effects on Freshwater Biota: A Review, Environmental Research Laboratory, U.S. Environmental Protection Agency, Corvallis, OR, EPA 600/3-77/042.
FAO and IAEA, 2007. Management Practices for Improving Sustainable Crop Production in Tropical Acid Soils. Results of Coordinated Research Project Organised by the FAO/IAEA Programme of Nuclear Techniques in Food and Agriculture. ISBN. 92-0-115206-X. P351.
FAO and IAEA, 1999. Management and Conservation of Tropical Acid Soils for Sustainable Crop Production. Joint FAO/IAEA Publication. Vienna, Austria.
Fuller, L.M. and Taricska, C.K. 2011. Water-Quality Characteristics of Michigan’s
Inland Lakes, 2001–10. Scientific Investigations Report 2011–5233. U.S. Department of the Interior U.S. Geological Survey.
Kalff, J. 2002. Limnology—Inland water ecosystems: Upper Saddle River, N.J., Prentice Hall, P. 202–217 and 236–237.
Kishe M. A. 2004. Physical and chemical characteristics of water in selected locations in Lake Victoria, Tanzania. Tanzania Journal of Science. Vol 30(2) 2004.
Lillie, R.A. and Mason, J.W. 1983. Limnological characteristics of Wisconsin Lakes: Wisconsin Department of Natural Resources Technical Bulletin 138, P116.
Mbow,C., Skole, D., Dieng, M., Justice,C., Kwesha, D., Mane, L., El Gamri, M., Vordzogbe, V.V. and Virji, H. 2012. Challenges and Prospects for REDD+ in Africa: Desk Review Of REDD+ Implementation in Africa. GLP Report No. 5. GLP-IPO, Copenhagen.
24 Unlocking Local Community Potential in Uganda’s Albertine Oil Region
Nantaba, O., Pomeroy, D., Nyadoi,P., Atkinson, P., Wabwire,N.D. and Munyulu, T. 2011. Conserving Biodiversity on Farmland- A Guide to Agriculture extension work. Uganda Wildlife Society/British Trust for Ornithology. Kampala, Uganda.
Plumptre, A.J., Davenport, T.R.B., Behangana, M., Kityo, R., Eilu, G., Ssegawa, P., Ewango, C., Meirte, D., Kahindo, C., Herremans, M., Kerbis Peterhans, J., Pilgrim, J., Wilson, M., Languy, M. and Moyer, D. 2007. The Biodiversity of the Albertine Rift. Biological Conservation, 134: 178-194
Plumptre, A.J., Kujirakwinja, D. and Nampindo, S. 2008b. Conservation of landscapes in the Albertine Rift. Pages27-34 in Redford, K.H. and Grippo, C. eds. Protected areas, governance and scale. Working Paper No. 36, Wildlife Conservation Society, Bronx, New York.
Raman R. K. and Twait, R. M. 1994. Water Qualify Characteristics of Lake Bloomington and Lake Evergreen. A Division of the Illinois Department of Energy and Natural Resources.
Riley, J. P. and Chester, R. 1971. Introduction to marine chemistry. Acad. Press, London and New York, P. 465.
Schindler D. W., Hecky, R. E. , Findlay, D. L. , Stainton, M. P. , Parker, B. R. , Paterson, M. J. , Beaty, K. G. and Kasian, S. E. M. 2008. Eutrophication of lakes cannot be controlled by reducing nitrogen input: Results of a 37-year whole-ecosystem experiment. PNAS 105: 11254-11258.
Seitzniger, S. P.1988. Denitrification in freshwater and coastal marine ecosystem: Ecological and Geochemical significance. Limnol. Oceanogr. 33: 702-724.
Shaw, B., Mechanich, C. and Klessig, L. 2000. Understanding Lake Data. UW-Extension.
Tepe, Y. A. T. Mutlu, E. and Ates. A. 2005. Some Physico-chemical Characteristics of Yarseli Lake, Hatay, Turkey. Turk. J. Fish. Aquat. Sci. 5: P. 35-42.
Trommer J.T., DelCharco, M.J. and Lewelling. B.R. 1999. Water Budget and Water Quality of Ward Lake, Flow and Water-Quality Characteristics of the Braden River Estuary, and the Effects of Ward Lake on the Hydrologic System, West-Central Florida, a Water-Resources Investigations Report 98-4251. US Department of the Interior, Tallahassee, Florida.
UBS. 2002. Uganda Population and Housing Census. Uganda Bureau of Statistics, Kampala, Uganda.
WHO. 2011. Guidelines for Drinking-Water Quality, 4ht ed. WHO Press, Switzerland.
WHO.1963. International Standards for Drinking-Water, p 29.
25
Appendices
Appendix 1
Questionnaire
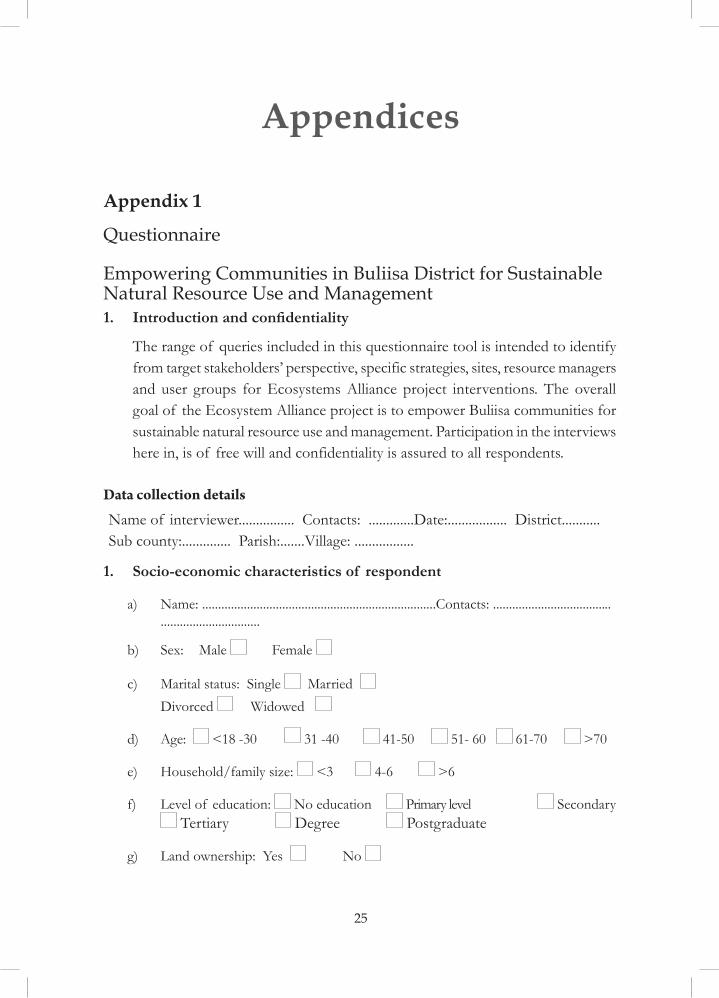
Empowering Communities in Buliisa District for Sustainable Natural Resource Use and Management1. Introduction and confi dentiality
The range of queries included in this questionnaire tool is intended to identify from target stakeholders’ perspective, specific strategies, sites, resource managers and user groups for Ecosystems Alliance project interventions. The overall goal of the Ecosystem Alliance project is to empower Buliisa communities for sustainable natural resource use and management. Participation in the interviews here in, is of free will and confidentiality is assured to all respondents.
Data collection detailsName of interviewer................ Contacts: .............Date:................. District........... Sub county:.............. Parish:.......Village: .................
1. Socio-economic characteristics of respondent
a) Name: .........................................................................Contacts: ....................................................................
b) Sex: Male Female
c) Marital status: Single Married Divorced Widowed
d) Age: <18 -30 31 -40 41-50 51- 60 61-70 >70
e) Household/family size: <3 4-6 >6
f) Level of education: No education Primary level Secondary Tertiary Degree Postgraduate
g) Land ownership: Yes No
26 Unlocking Local Community Potential in Uganda’s Albertine Oil Region
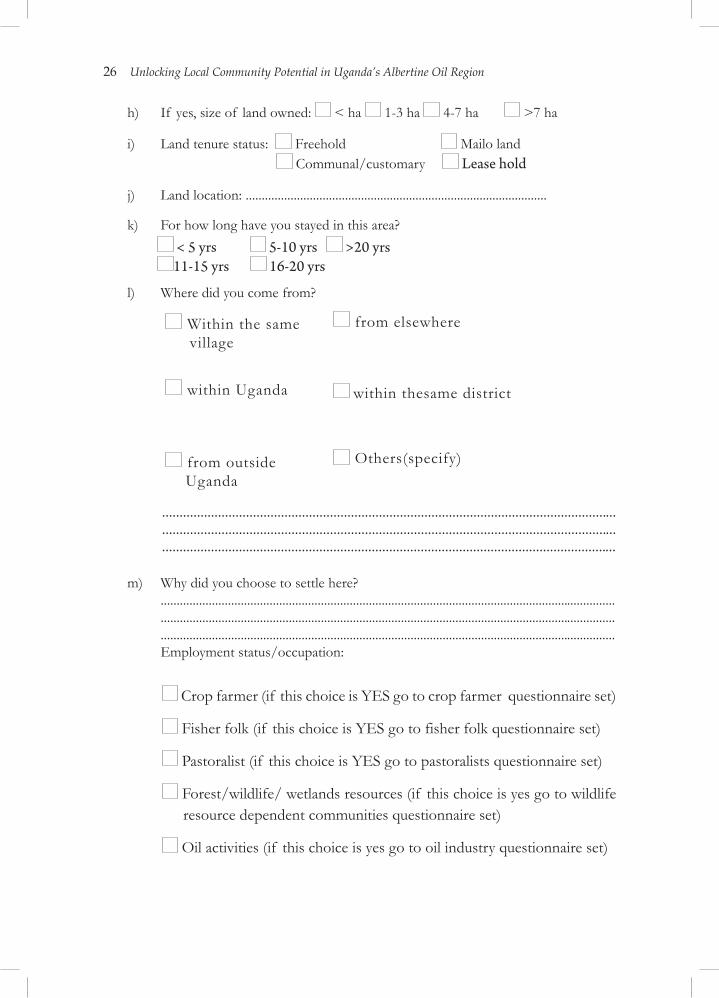
h) If yes, size of land owned: < ha 1-3 ha 4-7 ha >7 ha
i) Land tenure status: Freehold Mailo land Communal/customary Lease hold
j) Land location: ..............................................................................................
k) For how long have you stayed in this area? < 5 yrs 5-10 yrs >20 yrs
11-15 yrs 16-20 yrs
l) Where did you come from?
Within the same village
from elsewhere
within Uganda within thesame district
from outside Uganda
Others(specify)
..................................................................................................................................
..................................................................................................................................
..................................................................................................................................
m) Why did you choose to settle here? ..........................................................................................................................................................................................................................................................................................................................................................................................................................................Employment status/occupation:
Crop farmer (if this choice is YES go to crop farmer questionnaire set)
Fisher folk (if this choice is YES go to fisher folk questionnaire set)
Pastoralist (if this choice is YES go to pastoralists questionnaire set)
Forest/wildlife/ wetlands resources (if this choice is yes go to wildlife resource dependent communities questionnaire set)
Oil activities (if this choice is yes go to oil industry questionnaire set)
Appendices 27
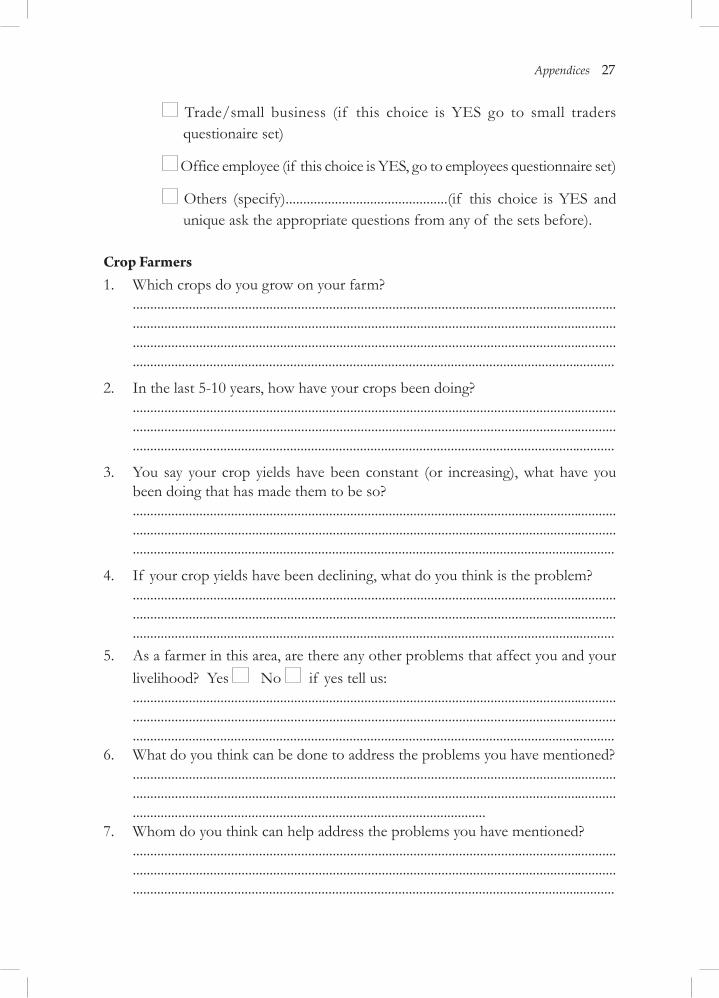
Trade/small business (if this choice is YES go to small traders questionaire set)
Office employee (if this choice is YES, go to employees questionnaire set)
Others (specify)..............................................(if this choice is YES and unique ask the appropriate questions from any of the sets before).
Crop Farmers1. Which crops do you grow on your farm?
..........................................................................................................................................
..........................................................................................................................................
..........................................................................................................................................
..........................................................................................................................................
2. In the last 5-10 years, how have your crops been doing? ..............................................................................................................................................................................................................................................................................................................................................................................................................................
3. You say your crop yields have been constant (or increasing), what have you been doing that has made them to be so? ..............................................................................................................................................................................................................................................................................................................................................................................................................................
4. If your crop yields have been declining, what do you think is the problem? ..............................................................................................................................................................................................................................................................................................................................................................................................................................
5. As a farmer in this area, are there any other problems that affect you and your livelihood? Yes No if yes tell us: ..............................................................................................................................................................................................................................................................................................................................................................................................................................
6. What do you think can be done to address the problems you have mentioned? .........................................................................................................................................................................................................................................................................................................................................................................................
7. Whom do you think can help address the problems you have mentioned? ..............................................................................................................................................................................................................................................................................................................................................................................................................................
28 Unlocking Local Community Potential in Uganda’s Albertine Oil Region
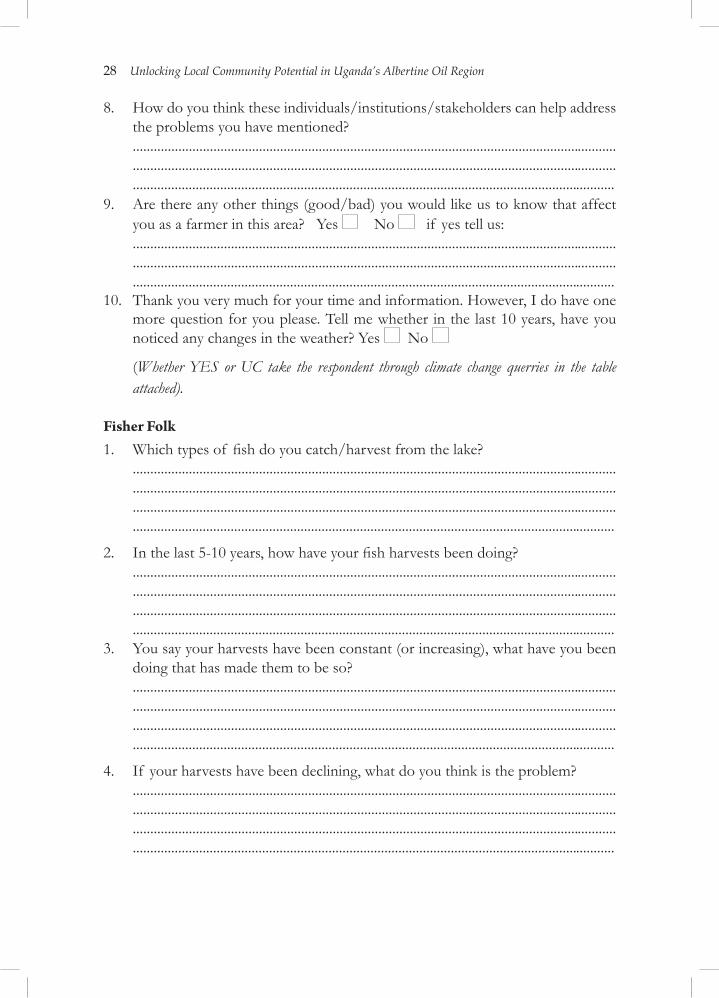
8. How do you think these individuals/institutions/stakeholders can help address the problems you have mentioned? ..............................................................................................................................................................................................................................................................................................................................................................................................................................
9. Are there any other things (good/bad) you would like us to know that affect you as a farmer in this area? Yes No if yes tell us: ..............................................................................................................................................................................................................................................................................................................................................................................................................................
10. Thank you very much for your time and information. However, I do have one more question for you please. Tell me whether in the last 10 years, have you noticed any changes in the weather? Yes No
(Whether YES or UC take the respondent through climate change querries in the table attached).
Fisher Folk1. Which types of fi sh do you catch/harvest from the lake?
..........................................................................................................................................
..........................................................................................................................................
..........................................................................................................................................
..........................................................................................................................................
2. In the last 5-10 years, how have your fi sh harvests been doing? ........................................................................................................................................................................................................................................................................................................................................................................................................................................................................................................................................................................
3. You say your harvests have been constant (or increasing), what have you been doing that has made them to be so? ........................................................................................................................................................................................................................................................................................................................................................................................................................................................................................................................................................................
4. If your harvests have been declining, what do you think is the problem? ........................................................................................................................................................................................................................................................................................................................................................................................................................................................................................................................................................................
Appendices 29
5. As a fi sher folk in this area, are there any other problems that affect you and your livelihood? Yes No if yes tell us: ..............................................................................................................................................................................................................................................................................................................................................................................................................................
6. What do you think can be done to address the problems you have mentioned?
..........................................................................................................................................
..........................................................................................................................................
..........................................................................................................................................
..........................................................................................................................................7. Whom do you think can help address these problems you have mentioned?
..........................................................................................................................................
..........................................................................................................................................
..........................................................................................................................................
..........................................................................................................................................8. How do you think these individuals/institutions/stakeholders can help
address the problems you have mentioned?
..........................................................................................................................................
..........................................................................................................................................
..........................................................................................................................................
..........................................................................................................................................9. Are there any other things (good/bad) you would like us to know that affect
you as a fi sher folk in this area? Yes No if yes tell us:
..........................................................................................................................................
..........................................................................................................................................
..........................................................................................................................................
..........................................................................................................................................10. Thank you very much for your time and information. On my part I just have
one more question for you please tell. me whether in the last 10 years you have noticed any changes in the weather? Yes No
(Whether yes or no take respondent through climate change querries in table next page).
30 Unlocking Local Community Potential in Uganda’s Albertine Oil Region
Pastoralists 1. Which animals do you rear/keep on your farm?
..........................................................................................................................................
..........................................................................................................................................
..........................................................................................................................................
..........................................................................................................................................
2. In the last 5-10 years, how have your animals/yields been doing?
..........................................................................................................................................
..........................................................................................................................................
..........................................................................................................................................
..........................................................................................................................................3. You say your animal yields have been constant (or increasing), what have you
been doing that has made them to be so?
..........................................................................................................................................
..........................................................................................................................................
..........................................................................................................................................
..........................................................................................................................................
4. If your yields have been declining, what do you think is the problem?
..........................................................................................................................................
..........................................................................................................................................
..........................................................................................................................................
..........................................................................................................................................5. As a pastoralist in this area, are there any other problems that affect you and
your livelihood? Yes No if yes tell us: ........................................................................................................................................................................................................................................................................................................................................................................................................................................................................................................................................................................
6. What do you think can be done to address the problems you have mentioned?
...........................................................................................................................................
...........................................................................................................................................
..........................................................................................................................................7. Whom do you think can help address these problems you have mentioned?
..........................................................................................................................................
..........................................................................................................................................
..........................................................................................................................................
..........................................................................................................................................
Appendices 31
8. How do you think these individuals/institutions/stakeholders can help address the problems you have mentioned?
..........................................................................................................................................
..........................................................................................................................................
..........................................................................................................................................
..........................................................................................................................................
9. Are there any other things (good/bad) you would like us to know that affect you as a pastoralist in this area? Yes No if yes tell us: ........................................................................................................................................................................................................................................................................................................................................................................................................................................................................................................................................................................
10. Thank you very much for your time and information. On my part I just have one more question for you please. Tell me whether in the last 10 years you have noticed any changes in the weather? Yes No
(Whether YES or NO take respondent through climate change querries in table attached).
Forest/Wildlife/ Wetlands Resources1. Which resources does your household collect from the wild?
..........................................................................................................................................
..........................................................................................................................................
..........................................................................................................................................
..........................................................................................................................................2. In the last 5-10 years, how have your resource harvesting been?
..........................................................................................................................................
..........................................................................................................................................
..........................................................................................................................................
..........................................................................................................................................3. You say your harvests have been constant (or increasing), what have you been
doing that has made them to be so?
..........................................................................................................................................
..........................................................................................................................................
..........................................................................................................................................
..........................................................................................................................................

32 Unlocking Local Community Potential in Uganda’s Albertine Oil Region
4. If your harvests have been declining, what do you think is the problem?
...........................................................................................................................................
...........................................................................................................................................
...........................................................................................................................................
..........................................................................................................................................
5. As a natural resource dependent in this area, are there any other problems that affect you and your livelihood? Yes No if yes tell us:
..........................................................................................................................................
..........................................................................................................................................
..........................................................................................................................................
..........................................................................................................................................6. What do you think can be done to address the problems you have mentioned?
..........................................................................................................................................
..........................................................................................................................................
..........................................................................................................................................
..........................................................................................................................................
7. Whom do you think can help address these problems you have mentioned?
..........................................................................................................................................
..........................................................................................................................................
..........................................................................................................................................
..........................................................................................................................................
8. How do you think these individuals/institutions/stakeholders can help address the problems you have mentioned?
..........................................................................................................................................
..........................................................................................................................................
..........................................................................................................................................
..........................................................................................................................................
9. Are there any other things (good/bad) you would like us to know that affect you as a natural resource harvester in this area? Yes No if yes tell us:
..........................................................................................................................................
..........................................................................................................................................
..........................................................................................................................................
Appendices 33
10. Thank you very much for your time and information. On my part I just have one more question for you please tell me whether in the last 10 years you have noticed any changes in the weather? Yes No
(Whether YES or NO take the respondent through climate change querries in table attached).
Oil Activities 1. Which oil related activities are you particularly involved in?
..........................................................................................................................................
.........................................................................................................................................
.........................................................................................................................................
.........................................................................................................................................
2. In the last 5 years, have you noticed any changes in resource use patterns? Yes No if yes, list them:
..........................................................................................................................................
.........................................................................................................................................
..........................................................................................................................................
..........................................................................................................................................
3. What do you think is could have possibly have led to this change?
..........................................................................................................................................
..........................................................................................................................................
..........................................................................................................................................
..........................................................................................................................................
4. As an oil benefi ciary in this area, are there any other problems that affect you and your livelihood? Yes No if yes tell us:
..........................................................................................................................................
..........................................................................................................................................
..........................................................................................................................................
..........................................................................................................................................
5. What do you think can be done to address the problems you have mentioned?
..........................................................................................................................................
..........................................................................................................................................
..........................................................................................................................................
34 Unlocking Local Community Potential in Uganda’s Albertine Oil Region
6. Whom do you think can help address these problems you have mentioned?
..........................................................................................................................................
..........................................................................................................................................
..........................................................................................................................................
..........................................................................................................................................
7. How do you think these individuals/institutions/stakeholders can help address the problems you have mentioned?
..........................................................................................................................................
..........................................................................................................................................
..........................................................................................................................................
..........................................................................................................................................
8. Are there any other things (good/bad) you would like us to know that affect you as an oil benefi ciary in this area? Yes No if yes tell us:
..........................................................................................................................................
..........................................................................................................................................
..........................................................................................................................................
..........................................................................................................................................9. Thank you very much for your time and information, on my part just have
one more question for you please. Tell me whether in the last 10 years you have noticed any changes in the weather? Yes No
(Whether YES or NO take respondent through climate change querries in table attached).
Petty Trade/Small Business1. Which kind of business do you deal in?
..........................................................................................................................................
..........................................................................................................................................
..........................................................................................................................................
..........................................................................................................................................
2. In the last 5-10 years, how has your business been doing?
..........................................................................................................................................
..........................................................................................................................................
..........................................................................................................................................
..........................................................................................................................................

Appendices 35
3. You say your profi ts have been constant (or increasing), what have you been doing that has made them to be so?
..........................................................................................................................................
.........................................................................................................................................
..........................................................................................................................................
.........................................................................................................................................
4. If your profi ts have been declining, what do you think is the problem?
..........................................................................................................................................
.........................................................................................................................................
..........................................................................................................................................
.........................................................................................................................................
5. As a business person in this area, are there any other problems that affect you and your livelihood? Yes No if yes tell us:
..........................................................................................................................................
.........................................................................................................................................
..........................................................................................................................................
..........................................................................................................................................
6. What do you think can be done to address the problems you have mentioned?
..........................................................................................................................................
.........................................................................................................................................
..........................................................................................................................................
..........................................................................................................................................
7. Whom do you think can help address these problems you have mentioned?
..........................................................................................................................................
..........................................................................................................................................
..........................................................................................................................................
..........................................................................................................................................
8. How do you think these individuals/institutions/stakeholders can help address the problems you have mentioned?
..........................................................................................................................................
..........................................................................................................................................
..........................................................................................................................................
36 Unlocking Local Community Potential in Uganda’s Albertine Oil Region
9. Are there any other things (good/bad) you would like us to know that affect you as a business person in this area? Yes No if yes tell us:
...........................................................................................................................................
...........................................................................................................................................
..........................................................................................................................................
10. Thank you very much for your time and information, on my part I just have one more question for you please. Tell me whether in the last 10 years you have noticed any changes in the weather? Yes No
(Whether YES or NO take respondent through climate change querries in table attached).
Office Employee
1. As an employee in this area, are there any other problems that affect you and your livelihood? Yes No if yes tell us:
..........................................................................................................................................
..........................................................................................................................................
..........................................................................................................................................
2. What do you think can be done to address the problems you have mentioned?
..........................................................................................................................................
..........................................................................................................................................
3. Whom do you think can help address these problems you have mentioned?
..........................................................................................................................................
..........................................................................................................................................
..........................................................................................................................................
4. How do you think these individuals/institutions/stakeholders can help address the problems you have mentioned?
..........................................................................................................................................
..........................................................................................................................................
..........................................................................................................................................
5. Are there any other things (good/bad) you would like us to know that affect you as an employee in this area? Yes No if yes tell us:
..........................................................................................................................................
..........................................................................................................................................
..........................................................................................................................................

Appendices 37
6. Thank you very much for your time and information. On my part I just have one more question for you please. Tell me whether in the last 10 years, have you noticed any changes in the weather? Yes No
(Whether YES or NO take respondent through climate change querries in table attached).
Table: Queries to Elicit Information on Climate Change in Buliisa District
Climate Change Parameter
Changes over the last 10 to 20 years
Effects/consequences on your livelihood strategies and life
How are you coping with the changes you have mentioned?
What do you think could be done to solve these problems you are facing as a result of climate change?
Whom do you think can help solve these problems?
Who else among your neighbours do you think have similar problems like yours?
Vegetation cover
Water availability
Yield
Temperature
Rain
Flooding
Drought
Diseases
Wind
Wildlife population
Soil fertility
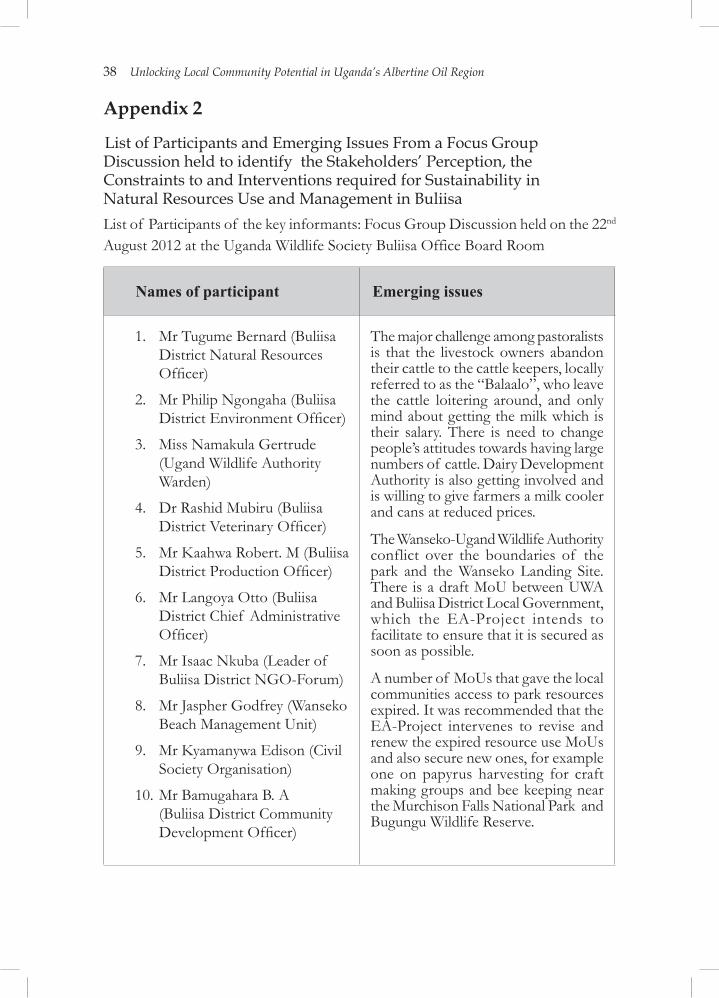
38 Unlocking Local Community Potential in Uganda’s Albertine Oil Region
Appendix 2
List of Participants and Emerging Issues From a Focus Group Discussion held to identify the Stakeholders’ Perception, the Constraints to and Interventions required for Sustainability in Natural Resources Use and Management in BuliisaList of Participants of the key informants: Focus Group Discussion held on the 22nd August 2012 at the Uganda Wildlife Society Buliisa Office Board Room
Names of participant Emerging issues
1. Mr Tugume Bernard (Buliisa District Natural Resources Offi cer)
2. Mr Philip Ngongaha (Buliisa District Environment Offi cer)
3. Miss Namakula Gertrude (Ugand Wildlife Authority Warden)
4. Dr Rashid Mubiru (Buliisa District Veterinary Offi cer)
5. Mr Kaahwa Robert. M (Buliisa District Production Offi cer)
6. Mr Langoya Otto (Buliisa District Chief Administrative Offi cer)
7. Mr Isaac Nkuba (Leader of Buliisa District NGO-Forum)
8. Mr Jaspher Godfrey (Wanseko Beach Management Unit)
9. Mr Kyamanywa Edison (Civil Society Organisation)
10. Mr Bamugahara B. A (Buliisa District Community Development Offi cer)
The major challenge among pastoralists is that the livestock owners abandon their cattle to the cattle keepers, locally referred to as the “Balaalo”, who leave the cattle loitering around, and only mind about getting the milk which is their salary. There is need to change people’s attitudes towards having large numbers of cattle. Dairy Development Authority is also getting involved and is willing to give farmers a milk cooler and cans at reduced prices.
The Wanseko-Ugand Wildlife Authority conflict over the boundaries of the park and the Wanseko Landing Site. There is a draft MoU between UWA and Buliisa District Local Government, which the EA-Project intends to facilitate to ensure that it is secured as soon as possible.
A number of MoUs that gave the local communities access to park resources expired. It was recommended that the EA-Project intervenes to revise and renew the expired resource use MoUs and also secure new ones, for example one on papyrus harvesting for craft making groups and bee keeping near the Murchison Falls National Park and Bugungu Wildlife Reserve.
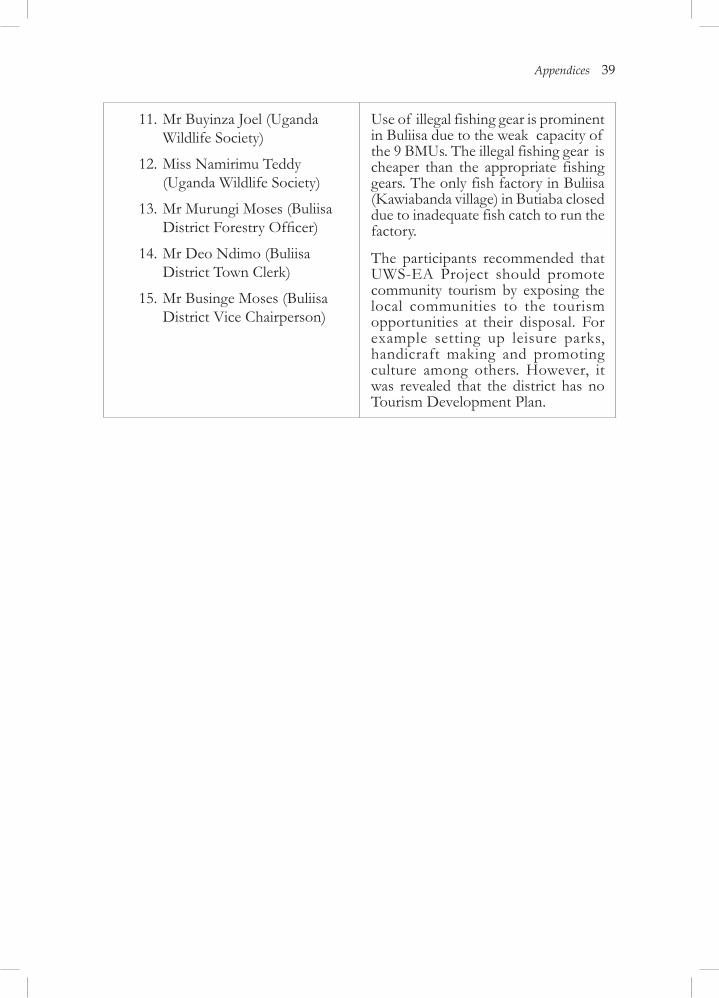
Appendices 39
11. Mr Buyinza Joel (Uganda Wildlife Society)
12. Miss Namirimu Teddy (Uganda Wildlife Society)
13. Mr Murungi Moses (Buliisa District Forestry Offi cer)
14. Mr Deo Ndimo (Buliisa District Town Clerk)
15. Mr Businge Moses (Buliisa District Vice Chairperson)
Use of illegal fishing gear is prominent in Buliisa due to the weak capacity of the 9 BMUs. The illegal fishing gear is cheaper than the appropriate fishing gears. The only fish factory in Buliisa (Kawiabanda village) in Butiaba closed due to inadequate fish catch to run the factory.
The participants recommended that UWS-EA Project should promote community tourism by exposing the local communities to the tourism opportunities at their disposal. For example setting up leisure parks, handicraft making and promoting culture among others. However, it was revealed that the district has no Tourism Development Plan.
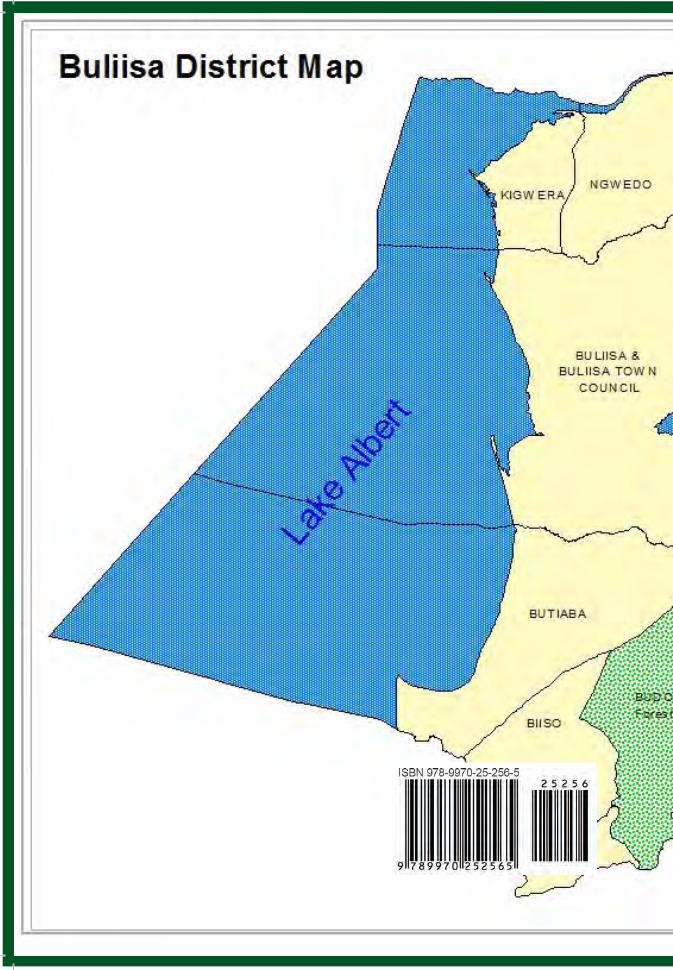
Uganda Wildlife SocietyKampala, Uganda
December, 2012
Unlocking Local Community Potentialfor Sustainable Natural Resource
Management in Uganda’sAlbertine-Oil Region
Fountain Publisherswww.fountainpublishers.co.ug