Embed Size (px)
Citation preview

Unlocking the new currency of AttentionA UK perspective
Over recent years, we have witnessed the evolution and disruption of the media ecosystem, yet for the most part, the industry has been slow to respond to move the dial on media planning and measurement.
Device metrics, such as ‘viewability’ have served a purpose over the years in helping to establish an ‘opportunity to see’ and to try to create similarities between impressions across different channels. But, ads can be made to artificially fit against these standards. They’ve been a stop gap rather than a measure of a meaningful exposure or measure of effectiveness.
Yet with consumers now exposed to more messages than ever before and increasingly savvy in how they consume media, effective media planning is more important than ever to drive cut through. To this end we believe that current metrics and measures of success in media do not go far enough.
Crucially they don’t take into account the huge importance of the human experience of media.
MRC Guidelines around viewability have performed an important function for brands looking to understand the quality of their placements and their ability to deliver an ‘opportunity to see’ in a world where nothing better existed. But for brands who want to understand their true value, Attention is a far better predictor.
Guidelines are just guidelines, not hard and fast rules: The winners will be those that understand best how to value each impression for its ability to a) connect with a human and b) deliver an outcome.
2.
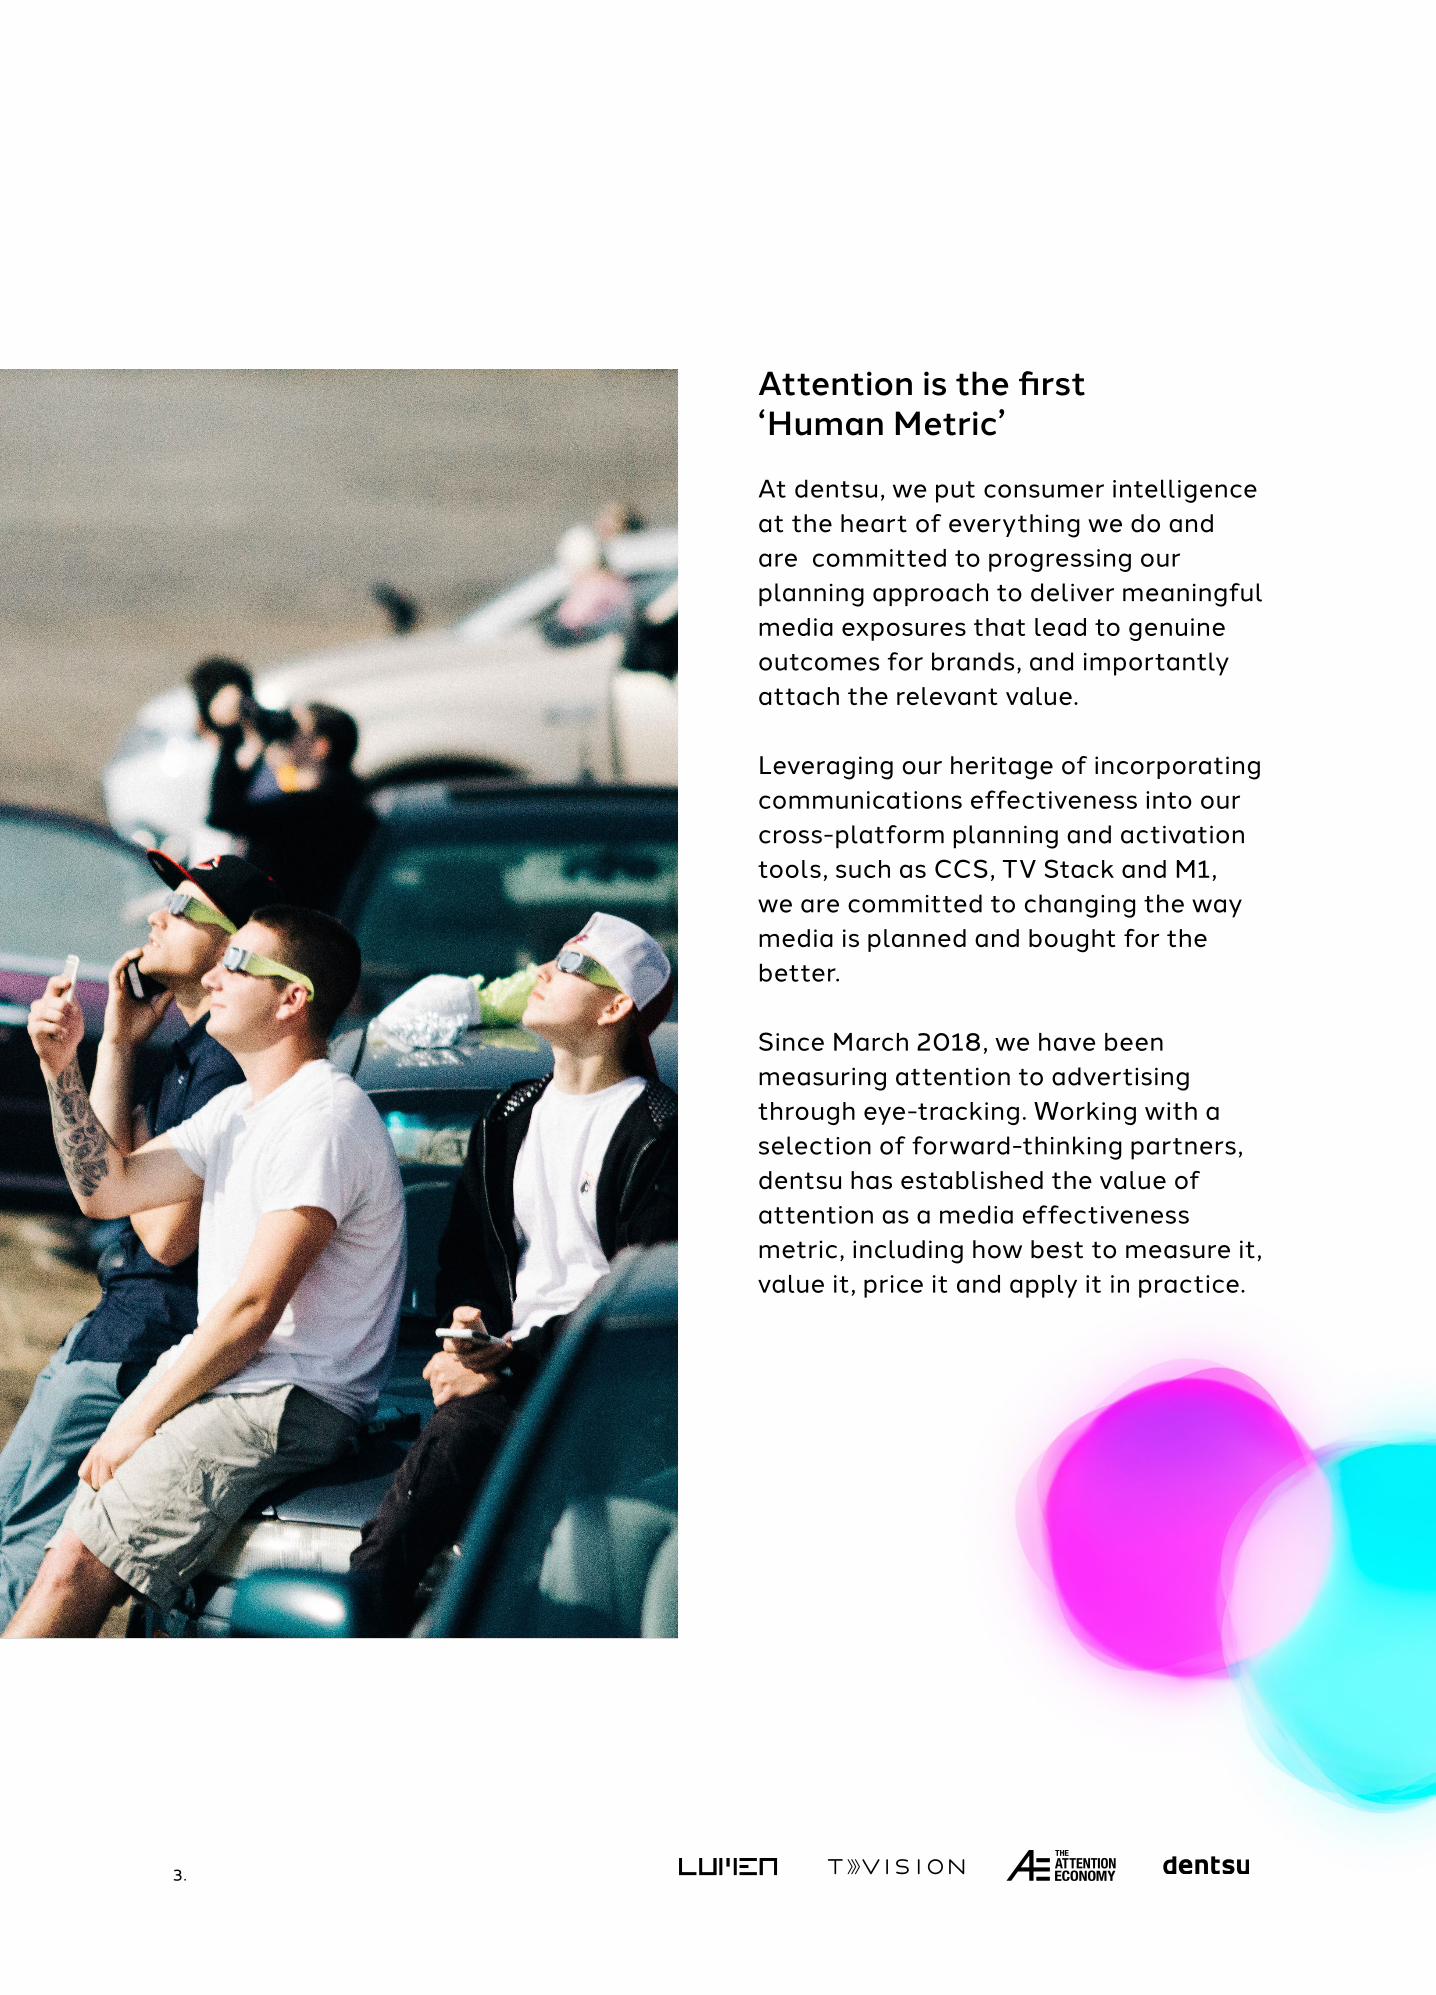
Attention is the first ‘Human Metric’
At dentsu, we put consumer intelligence at the heart of everything we do and are committed to progressing our planning approach to deliver meaningful media exposures that lead to genuine outcomes for brands, and importantly attach the relevant value.
Leveraging our heritage of incorporating communications effectiveness into our cross-platform planning and activation tools, such as CCS, TV Stack and M1, we are committed to changing the way media is planned and bought for the better.
Since March 2018, we have been measuring attention to advertising through eye-tracking. Working with a selection of forward-thinking partners, dentsu has established the value of attention as a media effectiveness metric, including how best to measure it, value it, price it and apply it in practice.
3.
0%
2%
4%
6%
8%
10%
12%
14%
16%
18%
20%
05 10 15 20 25 30
Cho
ice
uplif
t
Dwell time (s)
Eyes-on dwell time and brand choiceEyes-on dwell time and brand choice
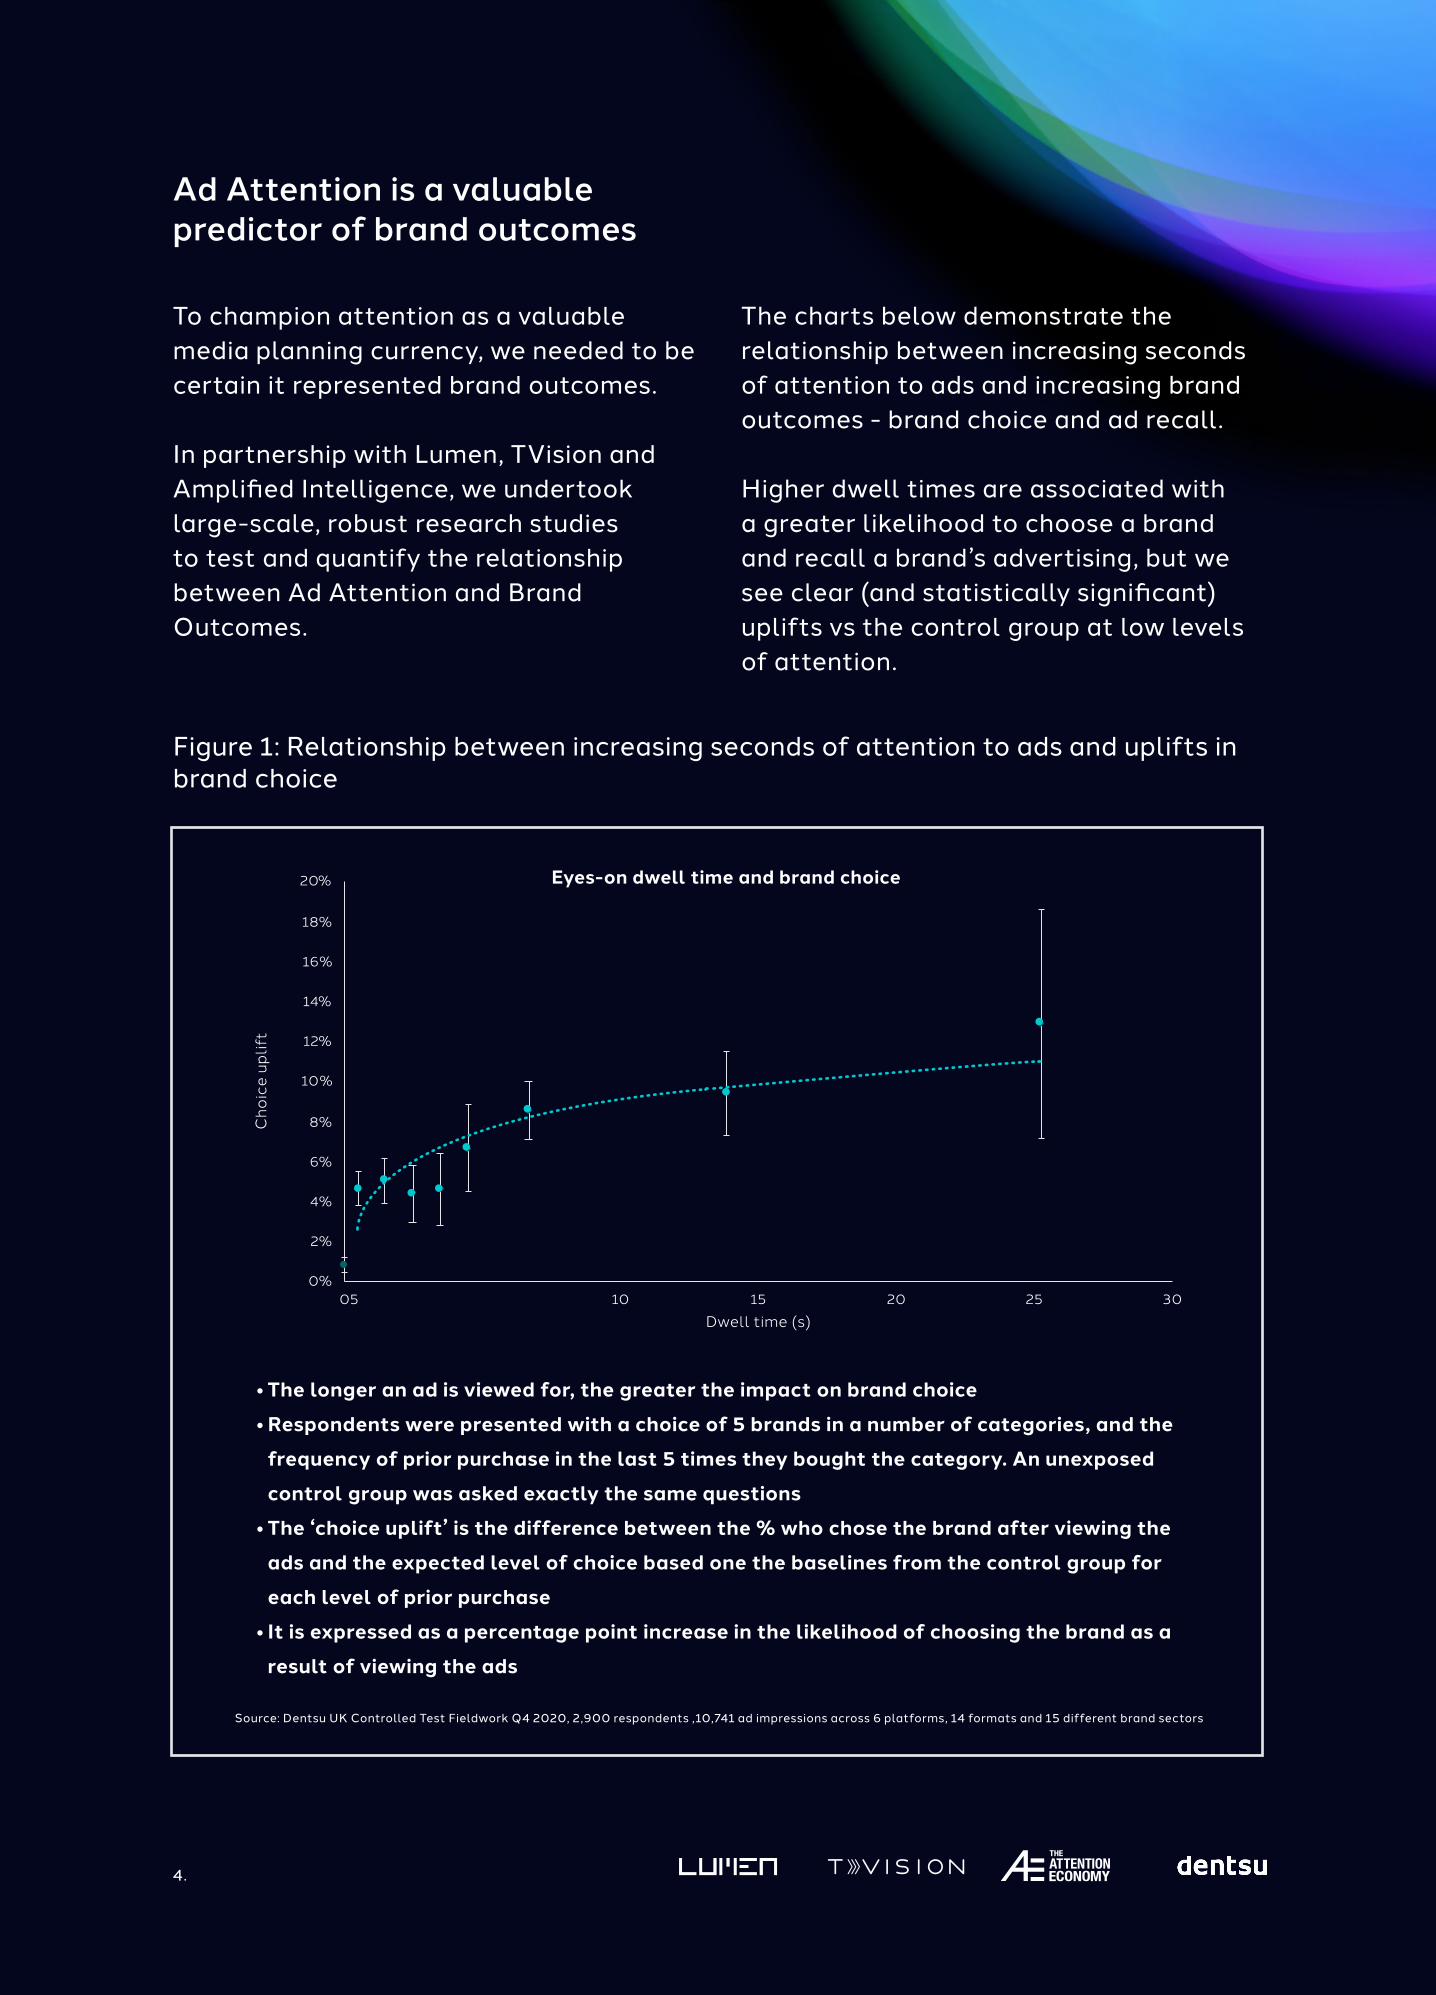
Ad Attention is a valuable predictor of brand outcomes
To champion attention as a valuable media planning currency, we needed to be certain it represented brand outcomes.
In partnership with Lumen, TVision and Amplified Intelligence, we undertook large-scale, robust research studies to test and quantify the relationship between Ad Attention and Brand Outcomes.
The charts below demonstrate the relationship between increasing seconds of attention to ads and increasing brand outcomes - brand choice and ad recall.
Higher dwell times are associated with a greater likelihood to choose a brand and recall a brand’s advertising, but we see clear (and statistically significant) uplifts vs the control group at low levels of attention.
Figure 1: Relationship between increasing seconds of attention to ads and uplifts in brand choice
• The longer an ad is viewed for, the greater the impact on brand choice• Respondents were presented with a choice of 5 brands in a number of categories, and the
frequency of prior purchase in the last 5 times they bought the category. An unexposed control group was asked exactly the same questions
• The ‘choice uplift’ is the difference between the % who chose the brand after viewing the ads and the expected level of choice based one the baselines from the control group for each level of prior purchase
• It is expressed as a percentage point increase in the likelihood of choosing the brand as a result of viewing the ads
Source: Dentsu UK Controlled Test Fieldwork Q4 2020, 2,900 respondents ,10,741 ad impressions across 6 platforms, 14 formats and 15 different brand sectors
4.

• The longer an ad is viewed, the more likely it is to be remembered• After completing the controlled tests, respondents were asked to remember which
brands had advertised on the pages / feeds they have viewed (from a list of 10 brands)• A significant number of respondents correctly recalled the target brand even if there
was no associated eye tracking data. We think that this a result of:• Guessing
• Identification through peripheral vision
Figure 2: Relationship between increasing seconds of attention to ads and uplifts in ad recall
Source: Dentsu UK Controlled Test Fieldwork Q4 2020, 2,900 respondents ,10,741 ad impressions across 6 platforms, 14 formats and 15 different brand sectors
0%
10%
20%
30%
40%
50%
60%
70%
80%
05 10 15 20 25 30
Ad
reca
ll
Dwell time (s)
Eyes on dwell time and prompted recallEyes-on dwell time and prompted recall
5.
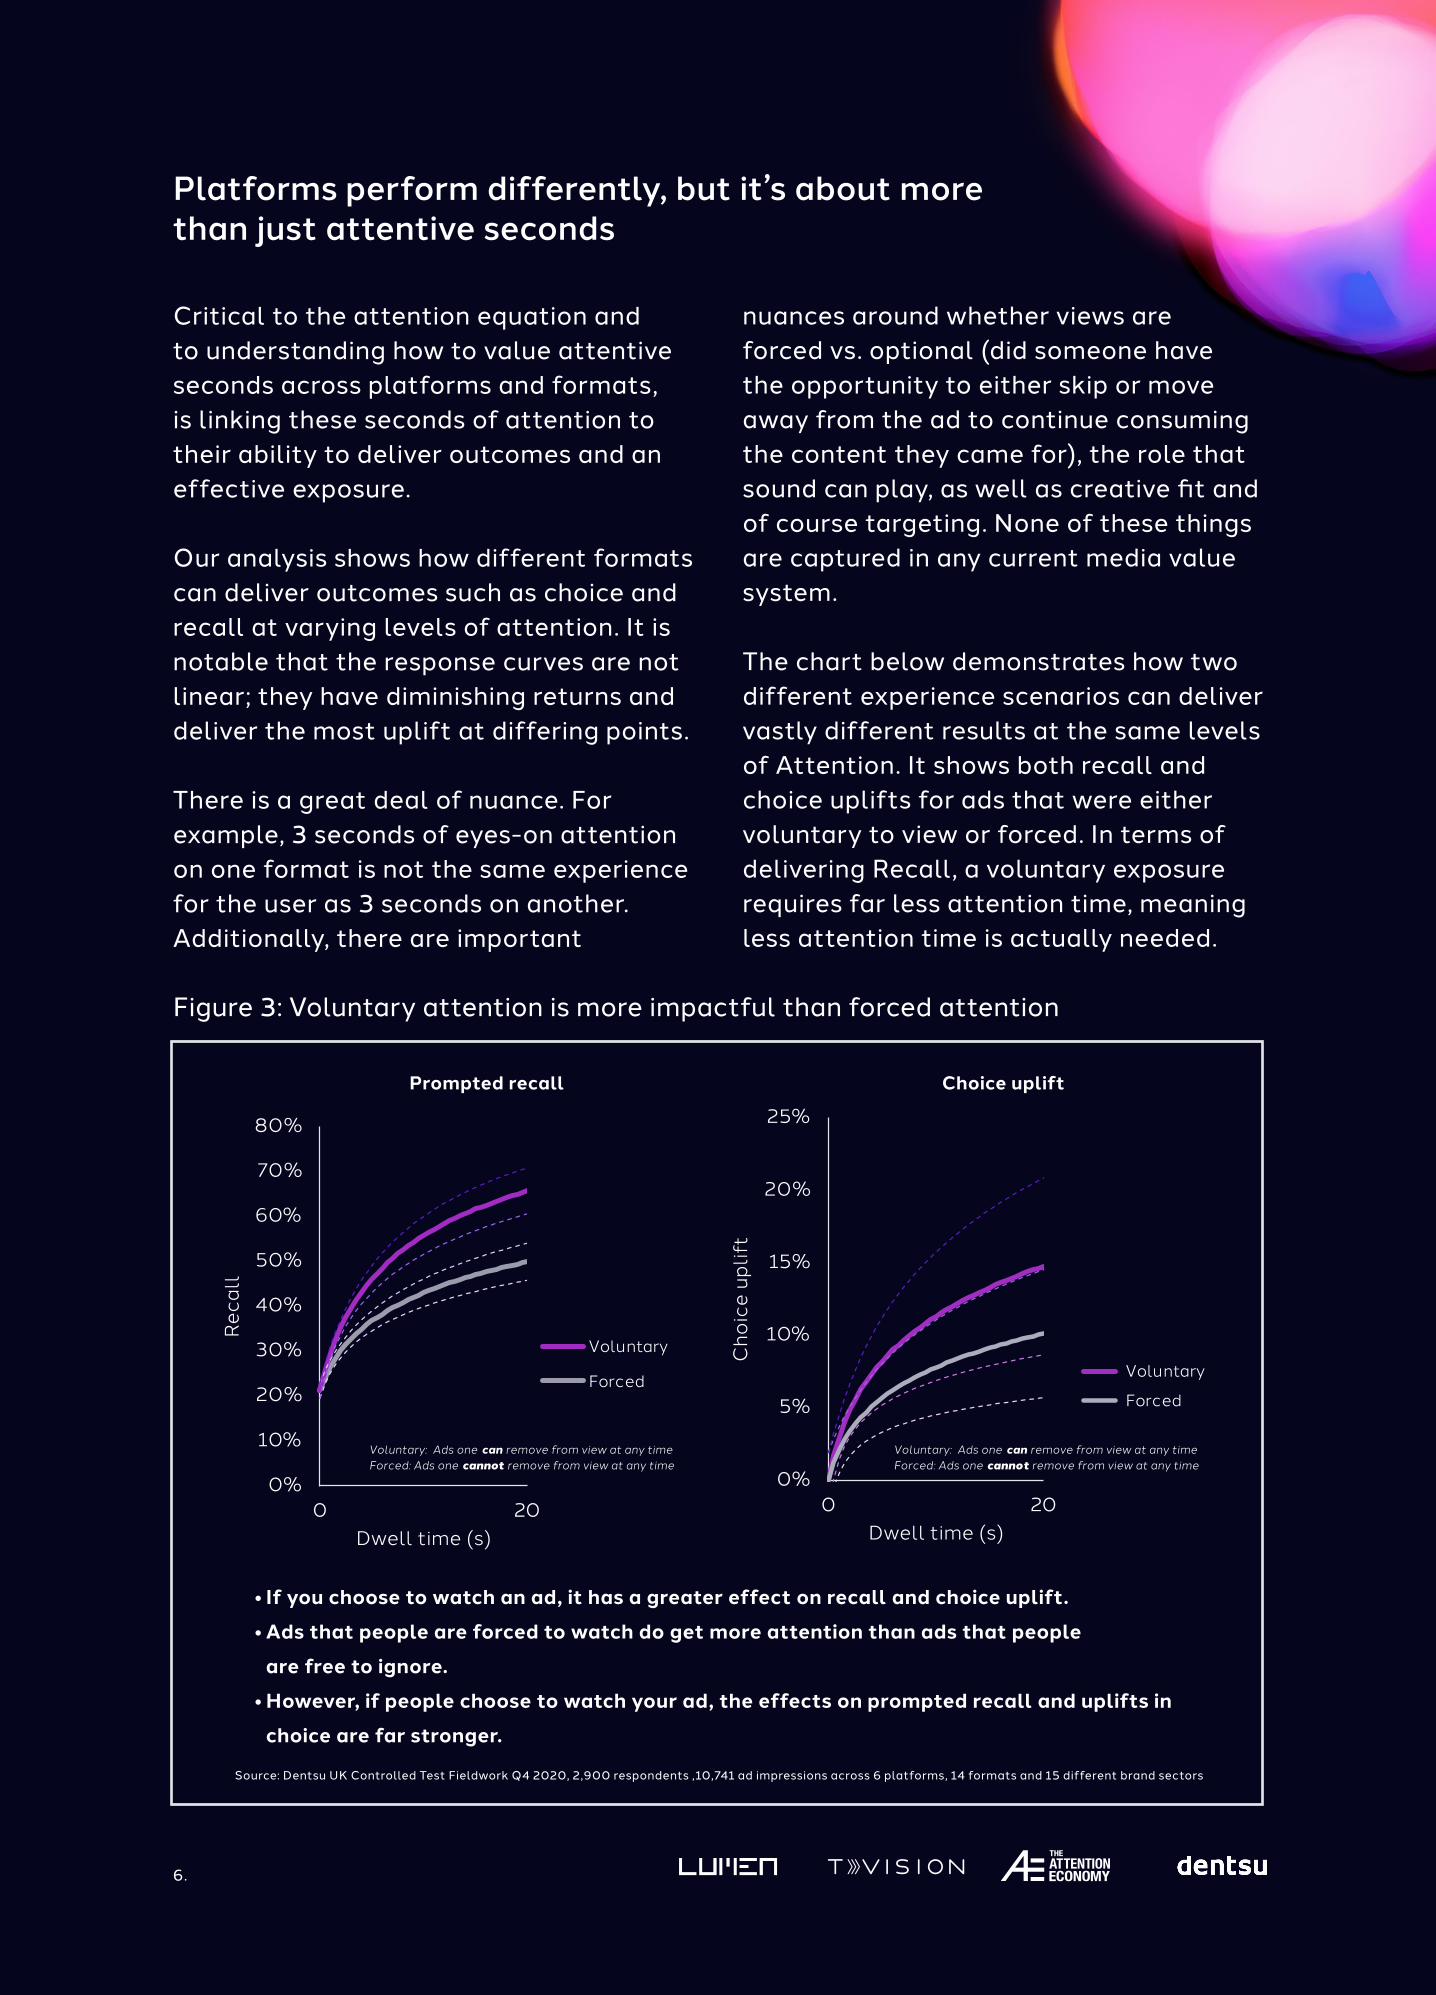
• If you choose to watch an ad, it has a greater effect on recall and choice uplift. • Ads that people are forced to watch do get more attention than ads that people
are free to ignore.• However, if people choose to watch your ad, the effects on prompted recall and uplifts in
choice are far stronger.
Prompted recall Choice uplift
0%
10%
20%
30%
40%
50%
60%
70%
80%
Reca
ll
Dwell time (s)
Forced
Voluntary
Voluntary: Ads one can remove from view at any timeForced: Ads one cannot remove from view at any time
Voluntary: Ads one can remove from view at any timeForced: Ads one cannot remove from view at any time
0%
5%
10%
15%
20%
25%
Cho
ice
uplif
t
Dwell time (s)
Voluntary
Forced
Figure 3: Voluntary attention is more impactful than forced attention
Platforms perform differently, but it’s about more than just attentive seconds
Critical to the attention equation and to understanding how to value attentive seconds across platforms and formats, is linking these seconds of attention to their ability to deliver outcomes and an effective exposure.
Our analysis shows how different formats can deliver outcomes such as choice and recall at varying levels of attention. It is notable that the response curves are not linear; they have diminishing returns and deliver the most uplift at differing points.
There is a great deal of nuance. For example, 3 seconds of eyes-on attention on one format is not the same experience for the user as 3 seconds on another. Additionally, there are important
nuances around whether views are forced vs. optional (did someone have the opportunity to either skip or move away from the ad to continue consuming the content they came for), the role that sound can play, as well as creative fit and of course targeting. None of these things are captured in any current media value system.
The chart below demonstrates how two different experience scenarios can deliver vastly different results at the same levels of Attention. It shows both recall and choice uplifts for ads that were either voluntary to view or forced. In terms of delivering Recall, a voluntary exposure requires far less attention time, meaning less attention time is actually needed.
Source: Dentsu UK Controlled Test Fieldwork Q4 2020, 2,900 respondents ,10,741 ad impressions across 6 platforms, 14 formats and 15 different brand sectors
6.

Figure 4: How much attention you can expect to generate from 1,000 impressions across platforms and formats
Attentive Seconds per 000 impressions
Based on our study, we understand how differing platforms and formats deliver against eyes-on attention (Fig.4), but this alone is too simplistic to create meaningful change in how we deploy media budgets.
The combination of ‘Seconds of Attention per 000’ with our learnings of how these seconds have the power to translate to outcomes for brands, combined with the unit price of media, create a truly new value system for media planning and trading.
Source: Dentsu UK In The Wild Fieldwork Q4 2020, 1,038 panellists, 63,640 ad impressions
Attentive Seconds per 000 = % Viewed (Eyes on Ad min 100ms ) x Av dwell time x 1000
9006
29551985 1702 1588 1444 1345 1020 857 789
2490
10002000
3000400050006000700080009000
10000
ITW attentive Seconds per 000
7.

Viewable: % of ads that are “viewable” according to MRC standards (50% of pixels in view for at least 1” (Display) / 2” (Video).
Viewed: % of ads with eye gaze for a minimum of 100ms
37%
85%
75%81%
35%
98%
55%46%
54%
72%
53% 54%
77%
14%
0%10%20%30%40%50%
60%70%80%90%
100%
MRC Viewabilty rate % Viewed
• Just because an ad is viewable does not guarantee that it will be viewed• In some cases, ads that are technically viewable fail to get noticed• In other cases, more ads are viewed than are technically viewable. • This is an artifact of the arbitrary nature of viewability standards• Note the MRC standard here is 50% pixels on view for at least 2 seconds
Figure 5: Ads viewability and viewing are not always the same thing
Employing our extensive dataset, we can for the first time, robustly test the efficacy of MRC Viewability Guidelines for video and display formats across mobile and desktop.
MRC viewability guidelines have been used as risk management against potentially poor performing buys, but they do not fully represent real audience behavior and sticking to them verbatim may not have been a route to improved ROI for all advertisers.
Standards such as these potentially further the demand and therefore the cost inflation of perceived ‘quality’ media environments and leaves on the table potentially valuable inventory for brands seeking to achieve different communications objectives.
Figure 5 shows that eyes-on-ad attention can be higher and lower than viewability as defined by MRC standards. Viewability does not fully represent the real audience experience of the ad placement, viewable does not mean viewed (or effective).
Testing the efficacy of viewability on mobile and desktop
MRC Viewable versus Viewed
Source: Dentsu UK In The Wild Fieldwork Q4 2020, 1,038 panellists, 63,640 ad impressions
8.

Sticking to MRC viewability standards is not a guaranteed precursor to improved advertising ROI.As identified, our research has established a firm link between attention and brand outcomes. The link is much less certain between viewability and brand outcomes – the charts below show us that attention predicts brand outcomes better than sheer viewability.
As shown in charts 1 and 2 we established that ads could deliver uplifts in brand outcomes at low durations. There is value to lower amounts of attentive seconds because of the experience. Therefore, relying solely on viewability as a measurement standard– certainly in the mobile space - misses significant potential value and opportunity (at the right price).
Recall Choice uplift
Figure 6: Eyes-On Viewing is required to deliver strong uplifts, not just viewability
Source: Dentsu UK Controlled Test Fieldwork Q4 2020, 2,900 respondents ,10,741 ad impressions across 6 platforms, 14 formats and 15 different brand sectors
1%1%
7%
0%
1%
2%
3%
4%
5%
6%
7%
8%
Not viewable orviewed
Viewable, but notviewed
Viewable andviewed
19%
27%
36%
0%
5%
10%
15%
20%
25%
30%
35%
40%
Not viewable orviewed
Viewable, butnot viewed
Viewable andviewed
9.

Delivering Meaningful Progress in the Attention Economy
The Attention Economy Programme, one of the largest in scope and scale of its kind, is an important contribution to improving advertiser’s communication effectiveness. Breaking new ground at scale, to track viewability, eye-tracked attention and communications outcomes for brands.
The research has established the value of attention as a media effectiveness metric, including how best to measure it, value it, price it and more importantly apply it in practice.
We are working in partnership with media partners and bold clients, to ensure we build attention metrics into media frameworks to drive success.
Beyond research and data acquisition, we’re also bringing this to life through real campaign activations. Our ‘Attention Algorithm’ product puts the theory from our Attention Economy programme into practice, optimising toward high attention display or video inventory in real time.
In partnership with Lumen, the solution is powered by a market leading attention prediction model which considers environment, format, size, time of day and viewability and is translated into a programmatic script, then activated inside of a DSP. It has been proven to drive brand outcomes for clients and widely been recognised as a pioneering, first of its kind solution in the attention space.
Dentsu are also building attention metrics into our cross-media planning tools such as TV Stack, where planners can optimize towards Attentive Reach and understand the value of that reach through Attentive Seconds.
It’s our hope that this work and our continued commitment to change can help to build a fairer, more sustainable, and effective advertising landscape.
10.

About the ProgrammeIn one of the largest studies of its kind, dentsu’s Attention Economy programme has significantly invested in the creation and data acquisition across the US, UK, and Australia.
Since March 2018, we have been measuring attention to advertising through eye-tracking. Working with a big selection of forward-thinking partners, including Facebook, Snapchat, Verizon Media, Teads, Spotify, Broadcasters and Technology platforms.
Mobile eye-tracking panels of 3,400 respondents were built with Amplified Intelligence, further mobile eye-tracking panels of 6,000 were built with Lumen and large-scale TVision data was purchased based on a panel of over 5,000 households in the US. Data was collected on both “in the wild” audience behavior across multiple platforms and ad formats as well as conducting extensive controlled experiments for brand ads in 20 plus sectors.
11.

Unlocking the new currency of AttentionA UK perspective