Embed Size (px)
Citation preview
Unobservable Quality, Information and Mineral Fertilizer Demand
Anna Fairbairn1, Hope Michelson2, Brenna Ellison2, Annemie Maertens3, and Victor Manyong4
DRAFT—NOT FOR CITATION—April 2017
Copyright 2017 by A. Fairbairn, H. Michelson, B. Ellison, A. Maertens, and V. Manyong. All rights reserved. Readers may make verbatim copies of this document for non-commercial purposes by any means, provided this copyright notice appears on all such copies.
*This research was made possible by support provided in part by University of Illinois Office of International Programs, University of Illinois Campus Research Board Research Support Program, University of Illinois Department of Agricultural and Consumer Economics, University of Illinois College of ACES AYRE Research and Learning Graduate Fellowship, and a United States Borlaug Graduate Research Grant. Thanks to Leakey Madale and Waza Kavegalo for their research assistance, Chris Magomba and Dr. Johnson Semoka of Sokoine University of Agriculture for their guidance and comments, and IITA & IPAD seminar participants for comments. All views, interpretations, recommendations, and conclusions expressed in this article are those of the authors and not necessarily those of the supporting or collaborating institutions. 1 Department of Agricultural and Consumer Economics, University of Illinois at Urbana-Champaign, [email protected] 2 Department of Agricultural and Consumer Economics, University of Illinois at Urbana-Champaign 3 University of Sussex, Brighton, UK 4 IITA Regional Hub for Eastern Africa, Dar es Salaam, Tanzania
2
Abstract
Though the record is clear that small farmers throughout Sub-Saharan Africa use mineral fertilizer at rates that are detrimentally low, an explanation circulating in these farming communities has not been verified. Producers in the region have voiced suspicion that fertilizer available to them in local shops, often acquired in small quantities from open bags rather than from bulk packages sealed by the manufacturer, has been diluted or adulterated; but their concerns are founded in hearsay rather than backed by reliable evidence. In this paper, we collect and test the quality of more than 800 mineral fertilizer samples acquired from 160 Tanzanian farmers and 225 agricultural input shops. Results from fertilizer nutrient content tests of these samples are combined with farmer and input dealer survey data. We find that mineral fertilizer is, on average, missing about 10% of advertised Nitrogen. In addition, we find that more than 25% of purchased fertilizer exhibits observable quality problems such as caking, clumping, and powdering. Our results suggest the presence of an important quality inference problem in the market as we find that these observable mineral fertilizer quality characteristics misrepresent actual unobserved quality; in particular, observable quality characteristics do not predict missing nitrogen. We find however that farmers rely on observable characteristics to assess unobservable quality, and that they are unwilling to purchase substandard-looking (but agronomically acceptable) mineral fertilizer unless it is sold well below the prevailing market price. Given the prevalence of suspicious-looking mineral fertilizer in the market, our results suggest that (1) quality degradation from poor supply chain management is likely at least as important as adulteration in these markets and (2) because of problems of incomplete information about quality, small-scale farmers may be purchasing and utilizing fertilizer at lower rates than optimal production requires.
3
1. Introduction
Compared with regions of the world where agricultural productivity has increased rapidly
and significantly since the Green Revolution, crop yields in most of Sub-Saharan Africa have
remained largely stagnant over the past 50 years. A conventional explanation for this stalled
productivity is the widespread failure to adopt modern agricultural inputs, including mineral
fertilizer (Sanchez 2002). In Tanzania, the use of mineral fertilizer is low; on average, farmers
apply fewer than nine kilograms of mineral fertilizer per hectare, and application rates among
small farmers are even lower (Tanzania Fertilizer Assessment 2012). Anecdotal evidence suggests
that farmers believe the mineral fertilizer available in local input shops is substandard in quality,
and regional news reports have told dramatic stories of criminal adulteration (Kitabu 2013,
Lugongo 2014). However, hard evidence to confirm the problem has been lacking; nor have
researchers studied how farmers assess the quality of fertilizer available to them in the local market
and how such assessments affect their purchasing.
In particular, no research has addressed the key fact that mineral fertilizer can be
considered an experience good, where actual quality is observable by most customers only after
purchase and use. Especially in locations where regulation and enforcement of product standards
is weak or nonexistent, farmers are largely on their own with regard to quality inference, facing a
lack of information about product quality at the time of purchase. In locations with capital-
constrained mineral fertilizer supply chains, degradation of observable quality is likely to be a
fundamental and recurring challenge, due to limited resources to support investment,
transportation, and storage.
This paper tests whether the anecdotal evidence on poor nutrient quality is veritable and
estimates how prevailing assumptions about poor quality affect farmer purchasing behavior. We
evaluate the nutrient quality of 823 samples of mineral fertilizer; three-quarters of the samples
4
purchased in 225 input shops located in the Morogoro region of Tanzania and one-quarter
acquired directly from farmers. We use farmer survey data collected in the same region to study
the relationship between observed and measured quality parameters and to study how quality
perceptions and information about unobservable quality affect farmer willingness to pay for
mineral fertilizer.
Our research contributes to the literature seeking to explain low fertilizer use rates in Sub-
Saharan Africa. Researchers have explored the effects of credit constraints (Croppenstedt et al
2003), farmer behavioral issues (Duflo et al 2011), and input and output market uncertainty
(Binswanger and Sillers 1983). Nonetheless, the existing research assumes adequate and consistent
mineral fertilizer quality. One exception is Bold et al. (2017), who test the nutrient content of
mineral fertilizer and the germination rates of hybrid maize seed for sale in Ugandan input shops
and find large nutrient deviations. But no research thus far has distinguished between observed and
unobserved quality characteristics; instead, quality is exclusively described and measured in terms of
underlying nutrient content.
A second limitation of the existing literature is that little research as yet has examined how
farmers assess quality and how these quality assessments affect purchasing decisions. Bold et al.
(2017) link input quality problems to farmers’ subjective assessments of fertilizer and seed
performance and argue that farmers’ expectations of input quality may adversely affect their
purchasing. Similarly, Ashour et al. (2015) survey 2400 Ugandan farmers and find that nearly 20%
believe that the quality of mineral fertilizer is lowered due to adulteration or counterfeiting and that
70% reported they did not buy fertilizer in the last two agricultural seasons due to quality concerns.
Finally, the existing literature has not considered whether quality problems might depend on
transaction scale or storage and purchase timing, which ignores the variation in the ways that mineral
fertilizer is acquired by farmers and the way that this might be associated with variable quality
5
outcomes. For example, many farmers, especially poor farmers, in Sub-Saharan Africa purchase
mineral fertilizer in small quantities in open bags from input shops. Are quality problems more
prevalent in these small transactions?
Our research makes three primary contributions to the literature on small farmers and
mineral fertilizer demand. First, we document missing nutrients in mineral fertilizer sold in input
shops. We establish that observable quality problems such as caking and clumping are at least as
prevalent as unobserved nutrient deviations, and that observed mineral fertilizer quality
characteristics are a poor signal of agronomically-important, nutrient content quality. We find that
mineral fertilizer in these markets does show nutrient deficiencies: on average, about 10% or 2.3
kilograms of nitrogen are missing from a 50 kg bag of Urea. Moreover, almost 25% of the samples
exhibited some degradation in physical quality characteristics. Yet, the underlying problem for
farmers is that the observable physical quality characteristics cannot be used to infer which fertilizers
are nutrient deficient. This poor mapping between observed and unobserved quality characteristics
in mineral fertilizer and farmer reliance on physical characteristics to infer quality could have
widespread effects on the functioning and growth prospects of mineral fertilizer markets —
especially in regions where supply chains are short on resources for adequate storage, training, and
transport so essential to preserving quality. This paper is the first to assess both measured nutrient
quality (using laboratory testing) and observed quality characteristics of mineral fertilizer samples,
and also the first to test for relationships between these two important quality dimensions. Our
results suggest that visual quality degradation from poor supply chain management may be at least as
important as adulteration in these markets.
Second, using farmer survey data and willingness to pay (WTP) assessments, we establish
that farmers rely on observable characteristics to assess quality, and that their willingness to pay
for substandard-looking (but agronomically acceptable) mineral fertilizer is well below the
6
prevailing market price. We establish that farmers increase their willingness to pay for “bad-
looking” mineral fertilizer in response to information that the fertilizer contains the correct
nitrogen content. Even in the presence of such information, however, farmers continue to report
lower WTP for clumped and otherwise visually unappealing samples than they do for “good-
looking” Urea. Given the prevalence of suspicious-looking mineral fertilizer in the market, our
results suggest that farmers may be purchasing less fertilizer than optimal due to problems of
quality inference.
Finally, our results suggest that a special inferential problem may exist for poor, resource-
limited farmers. These problems, with regard to inferring low quality from visual inspection, are
conspicuous and consequential among small-scale farmers who purchase mineral fertilizer in small
quantities – as little as one kilogram at a time – from open 50-kilogram bags in local input shops. We
find that sales from these open bags are especially vulnerable to hard caking and clumps, problems
that these small-scale purchasers may over-interpret as nutrient quality issues. Perceived input quality
could be a function of purchase quantity so that expected returns to investing in fertilizer could be
directly (and inversely) related to farmer scale, liquidity, and wealth.
Overall, our research suggests that such problems in the supply chain could have serious
impacts on farmer demand. In sum, we see strong evidence that these low mineral fertilizer use
rates result from a market characterized by incomplete information about unobservable product
quality. The argument is related to Akerlof’s classic study of adverse selection in markets with
asymmetric information (1970) but with an important difference. In Akerlof, the market for high
quality goods ultimately disappears because the WTP is below the seller’s willingness to accept
(WTA), but there is no heterogeneity in Akerlof’s model. In our case, we find evidence that the
average WTP is below the price (WTA). Constrained supply chains are supplying fertilizer that is,
for the most part, agronomically adequate, but which farmers assume to be of poor quality due to
7
their frequent encounters with mineral fertilizer that looks bad. If farmers are unwilling to pay the
prevailing market price for poor-looking fertilizer of adequate nutrient quality, suppliers may
remain unwilling to make investments in supply chain storage, transport, and logistics that
preserve and improve physical appearance, and problems with regard to purchase and utilization
are likely to continue. Moreover, further complications could arise if such problems in observed
quality characteristics transmit to the nutrient quality dimension. This could happen if, for
example, continuing buyer reluctance in a given market market leads to a disappearance of higher-
quality fertilizer from the inventories of agro dealers and importers, who opt instead to supply
lower-quality inputs. Such problems could further complicate efforts to increase adoption of
fertilizer as a means of raising regional agricultural productivity and improving household and
national food security.
The paper is organized as follows. In Section 2 we discuss how and why mineral fertilizer
can physically degrade. Section 3 describes the data and methods. Section 4 presents results and the
final section concludes with discussion.
2. Background: Mineral Fertilizer Quality
Mineral fertilizer grade refers to the guaranteed content of nutrients; this nutrient content is
expressed as a percentage of the fertilizer weight. For example, Urea is 46% nitrogen is referred to
as a straight fertilizer because it only contains one nutrient, whereas DAP contains two nutrients
and is 18% nitrogen and 46% phosphate. International standards specify maximum moisture
content by weight, nutrient content by weight, particle size, and packing guidelines.
Fertilizers can be short of their guaranteed nutrient content for numerous reasons
including adulteration, poor storage and handling, or production problems. Of these, adulteration
perhaps receives the most attention from policy makers, farmers, researchers, and the press.
8
Reports of adulteration are common in Tanzania’s popular press and circulate among farmers; the
majority of such reports describe coordinated and criminal activities. For example, in 2013, a
major Tanzanian newspaper reported that the Tanzania Fertilizer Regulatory Authority (TFRA)
had found adulterated fertilizer in six regions of Tanzania (Iringa, Mbeya, Morogoro, Njombe,
Rukwa, and Ruvuma) (Kitabu 2013). In 2014, more Tanzanian media reports documented the
seizure and destruction of counterfeit fertilizer found in the marketplace (Lugongo 2014). News
stories and anecdotes suggest mineral fertilizers are often adulterated with material that matches
the color and texture of the product. For example, Urea, which is white in color, can be mixed
with table salt, and DAP, a dull gray, can be mixed with concrete.
Considerably less documented or discussed in the popular press or in the academic
literature is the problem of fertilizer that is of lower quality in terms of nutrient content as a result
of poor storage, logistics, or production. Benson et al. (2012) documents the structural
challenges—namely via importation and distribution—that Tanzania faces in circumventing
mineral fertilizer product degradation. The primary issues include the delay in off-loading mineral
fertilizer from cargo ships as well as inefficient and inadequate packaging capacities. For example,
standard unloading and handling capacity at other ports is typically 10,000 metric tons of fertilizer
per day, yet in Tanzania, the 2007 average was 1,560 metric tons per day (Benson et al 2012). As a
result of insufficient off-loading capabilities, delays are frequent and the mineral fertilizer is
subjected to unwarranted exposure to heat, humidity, and sand.
In addition, poor storage, logistics, and production can impact a second mineral fertilizer
quality dimension that has received less attention: the observable physical characteristics. We focus
on four critical observable quality parameters: clumps from caking, discoloration, the presence of
foreign material in the fertilizer (dirt, grass, maize grains), and powdering or dusty prills.
9
• First, mineral fertilizer clumping occurs when the fertilizer is exposed to water or
high humidity — during initial packaging and handling of manufacturer bags as well
as subsequent transportation and storage (Sanabria et al 2013). Several factors
increase the likelihood of caking, particularly the moisture content of the fertilizer
after manufacturing and whether the fertilizer is conditioned with an anti-caking
agent.1 Storage conditions are important as caking is especially sensitive to
temperature and humidity, pressure in piles and stacks, and storage time (Rutland &
Polo 2015).
• Second, mineral fertilizer can become discolored when the fertilizer is exposed to
moisture or high humidity. In the case of DAP and CAN, this exposure discernably
darkens the color of the mineral fertilizer and can produce an oily film that can
secrete through the packaging, leaving an oily residue on the outside of the bag.
• Third, mineral fertilizer can include foreign material such as dirt, sand, insects, or
grains of maize. While deliberate adulteration can be one source of the presence of
foreign material, more incidental cases result from the way that mineral fertilizer is
imported and prepared for wholesalers and retailers in Tanzania. Nearly all mineral
fertilizer in Tanzania is imported to Dar es Salaam. Upon arrival at the port, the
mineral fertilizer is removed from the shipping containers (where it was transported
unbagged and in bulk) and bagged in 25 and 50 kg manufacturer bags.2 While at port,
the fertilizer is often exposed to humidity and high temperatures, as well as sand,
dust, and dirt. Mineral fertilizer sold by agrodealers from opened bags or sold in
1 For example, mineral fertilizer from Yara International is treated with an anti-caking agent in Yara International’s facility in Dar es Salaam. In our samples, if we regress the number of clumps on Yara samples by fertilizer type, we find that Yara samples are significantly less likely to have clumps. 2 The international fertilizer company Yara briefly bagged and sold mineral fertilizer in smaller one and two kilogram bags in Tanzania but discontinued these product lines in 2015.
10
informally repackaged parcels is also vulnerable to the inclusion of foreign material.
Foreign material decreases the per weight nitrogen content of the fertilizer; the
quality dilution can be incidental (in the case of fertilizer which includes a handful of
maize kernels or insects) or more harmful if the fertilizer has been deliberately and
significantly adulterated.
• Finally, mineral fertilizer powdering is a result of the breaking of the small aggregate
prills into smaller, powdery fragments due to poor handling and storage. Fertilizer
that contains powdered or dust particles can be difficult to apply and hazardous to
work with. Storage and transport of mineral fertilizer with broken and powdered
prills can cause farmers problems as the dust is susceptible to trickling out of the
manufacturer bag (Rutland & Polo 2015) and the powder is highly hydroscopic and
likely to quickly absorb water in humid conditions.
While observable quality characteristics are discussed in agro-dealer technical training
manuals (Rutland & Polo 2015) and fertilizer standards and analysis manuals (Sanabria et al. 2013,
Yara 2012), 3 scant literature considers the relationship between observed and underlying quality
(specifically, nutrient content). One explanation for the lack of literature may be the fact that that
there few quality problems exist now in industrial countries related to mineral fertilizer
manufacturing, transport, and storage, but it is surprising that few papers have considered these
issues in developing countries. Technical manuals on fertilizer standards imply a relationship
between observed quality and nutrient content in more severe cases but it is not clear what
3 IFDC agro dealer training manuals mention the importance of a range of physical characteristics and guidelines for storage and transport to preserve quality. For example, on caking: “Caking can cause many handling and application problems and is considered by most fertilizer producers to be the single biggest physical quality problem in fertilizers.” (https://ifdcorg.files.wordpress.com/2015/01/r-15-fertilizer_dealer_handbook.pdf) (p. 7)
11
relationship there is between moderate or more minor cases of caking and clumping, for example,
and nutrients (Rutland & Polo 2015). Our analysis provides evidence on the latter point.
3. Data & Methods
This paper uses data from two related undertakings. First, we use data on the nutrient content of
636 samples of Urea, DAP, and CAN mineral fertilizer purchased by enumerators from 225 input
dealers throughout the Morogoro Region. Samples were purchased before the start of the primary
agricultural season in November and December 2015 and during planting and cultivation in March
and April 2016. These samples were tested for biuret, moisture, and nutrient content in labs in
Kenya and the United States.4 Photographs were taken of all samples and were visually coded by two
independent coders on observable quality characteristics: caking and clumping, discoloration,
presence of foreign material, and whether the sample included powdered granules. The coders also
identified the number of clumps in each sample. Further details on the collection of the samples and
associated input dealer survey can be found in Fairbairn et al. (2016).
We worked with the International Institute of Tropical Agriculture (IITA)'s Africa RISING
initiative to conduct a survey with farmers in the region that included mineral fertilizer quality
assessment and willingness to pay exercises and we collected mineral fertilizer samples from
participant farmers.5 Details on the sample and participant protocols are available in the appendix.
4 A random set of 59 samples were selected and sent to Thorton laboratories for duplicate testing to validate the nitrogen content values. The correlation coefficient between the nitrogen content of samples tested at ICRAF and Thorton is 0.97. 5 We worked with the International Institute of Tropical Agriculture (IITA)'s Africa RISING initiative to identify farmers with experience purchasing and using mineral fertilizer. Africa RISING's institutional objective is to achieve sustainable intensification. In Tanzania, Africa RISING is working with USAID's NAFAKA, a rice and maize value chain project, in two districts in Morogoro region: Mvomero and Ifakara. In order to obtain fertilizer samples that were representative of the quality of the fertilizer at the time of planting or cultivating, we selected Mvomero district as the research site. Mvomero is an area that remains more accessible during the rainy season, which enabled us to obtain samples after planting but during the production and cultivation periods of the growing season. Farmers were purposively selected to have had prior experience purchasing and applying mineral fertilizer to their crops.
12
Surveys were completed during mid-April to the beginning of May 2016, during the primary
agricultural growing season. In total, we surveyed 164 maize and rice farmers in 12 villages in the
Mvomero district. Villages were selected based on a list of 15 extension staff and corresponding
villages for the Africa Rising project. The survey collected data on farmer demographics, crops
grown, and previous experience purchasing and using mineral fertilizer and perceptions of fertilizer
quality in markets. Farmers provided a small (0.25 kg) sample to the research team of mineral
fertilizer from their home and answered questions about the source and use of that fertilizer. In
addition to survey modules, participants were asked to complete a willingness to pay and quality
assessment exercise.
4. Mineral Fertilizer Quality Results
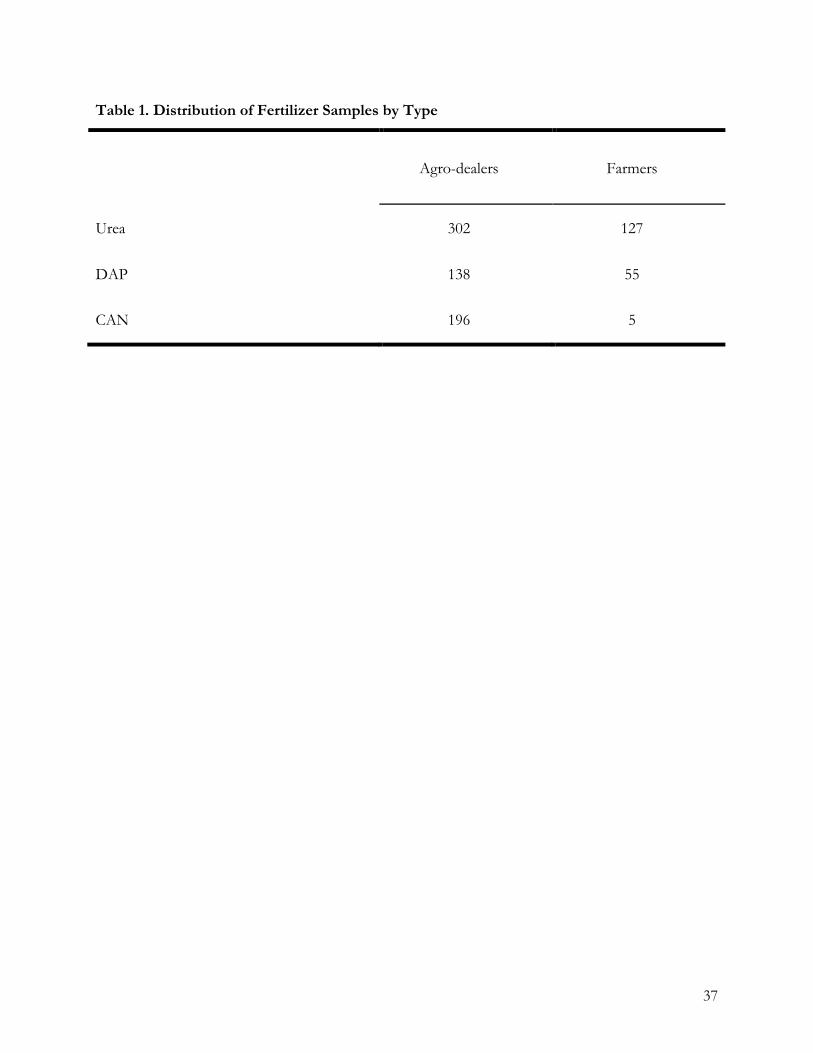
We collected 636 mineral fertilizer samples from agricultural inputs dealers and 187 samples from
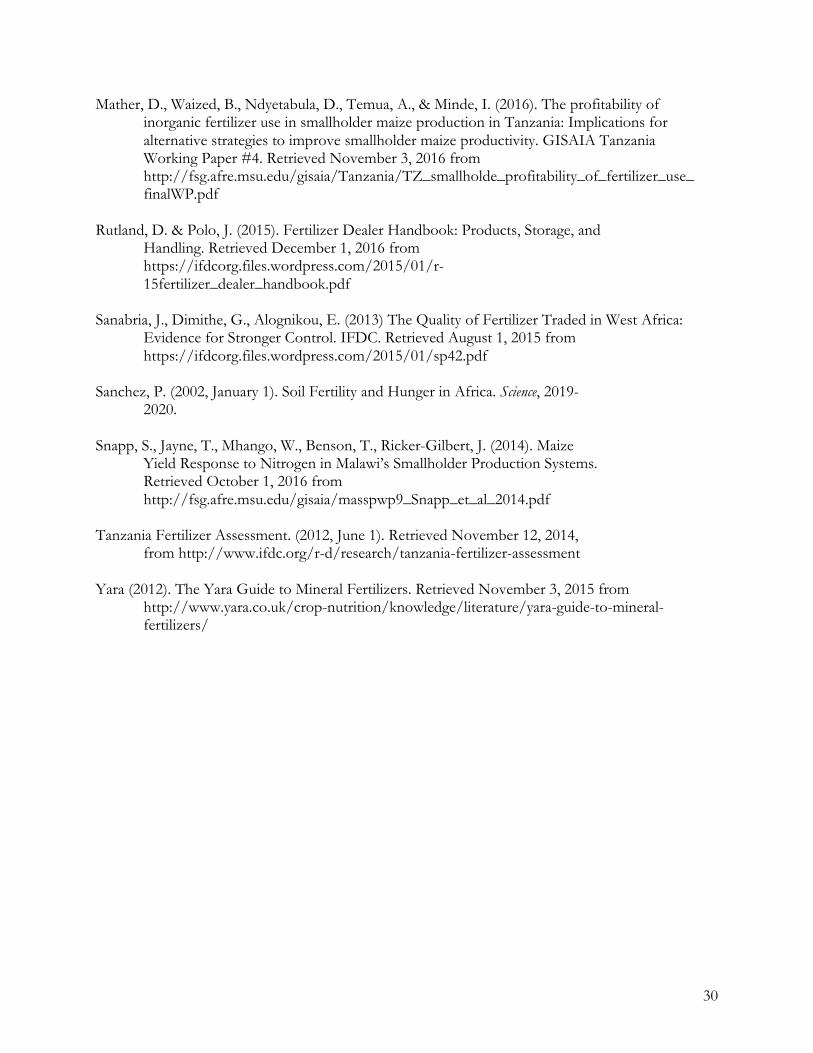
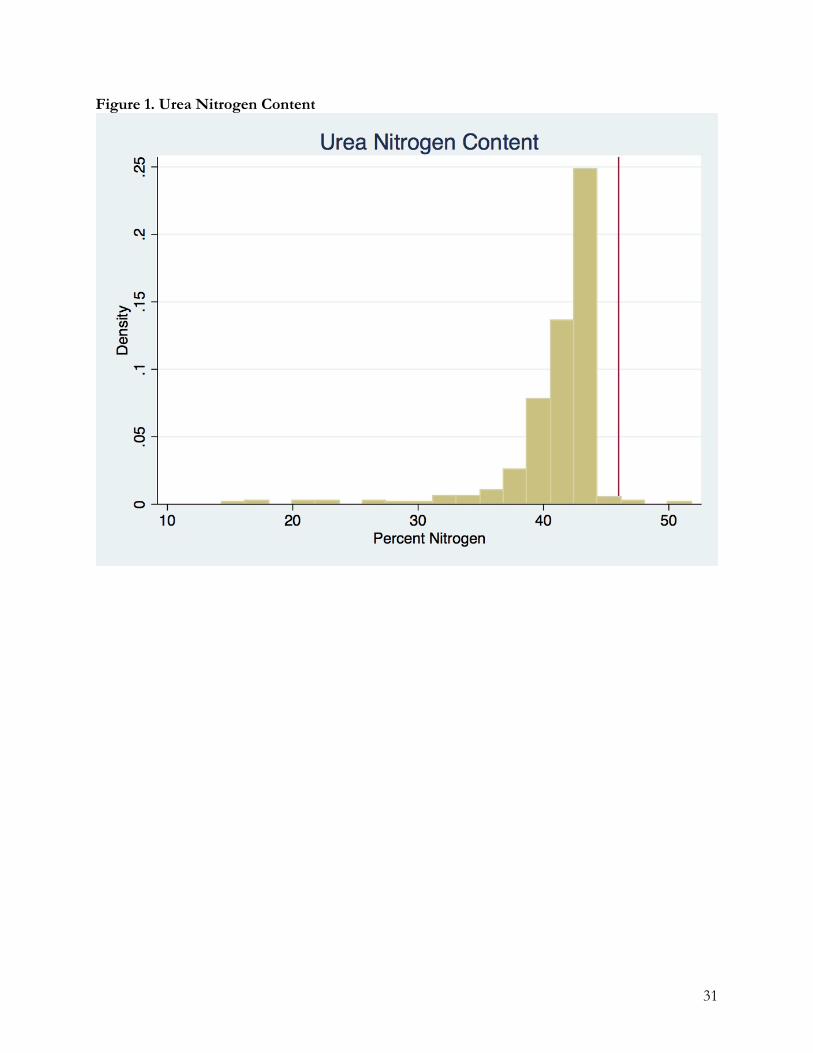
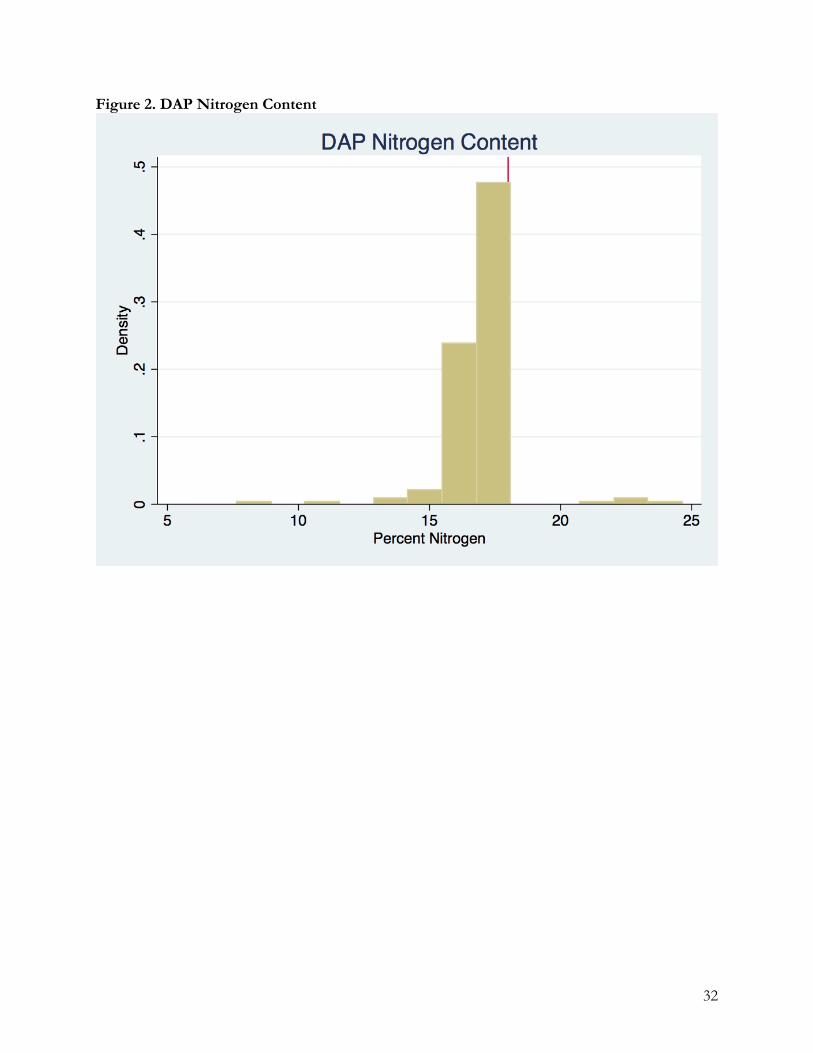
farmers. Table 1 shows the distribution of samples by fertilizer type across farmers and agro-dealers.
Traditionally, mineral fertilizer quality encompasses two scientific measures, the nutrient content and
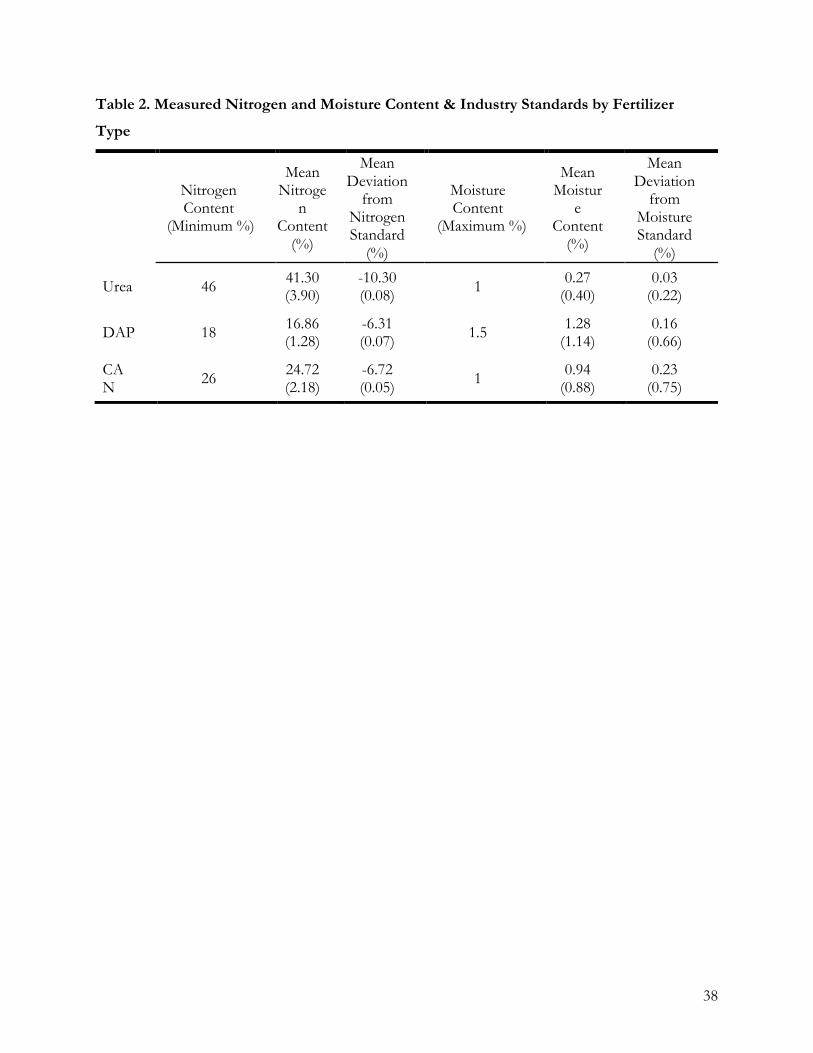
the moisture content. Table 2 presents the nutrient and moisture content standards for Urea, DAP,
and CAN. Figures 1-3 illustrate the variation in nitrogen content across the three types of mineral
fertilizer, with vertical reference lines indicating the standard nitrogen content for each.
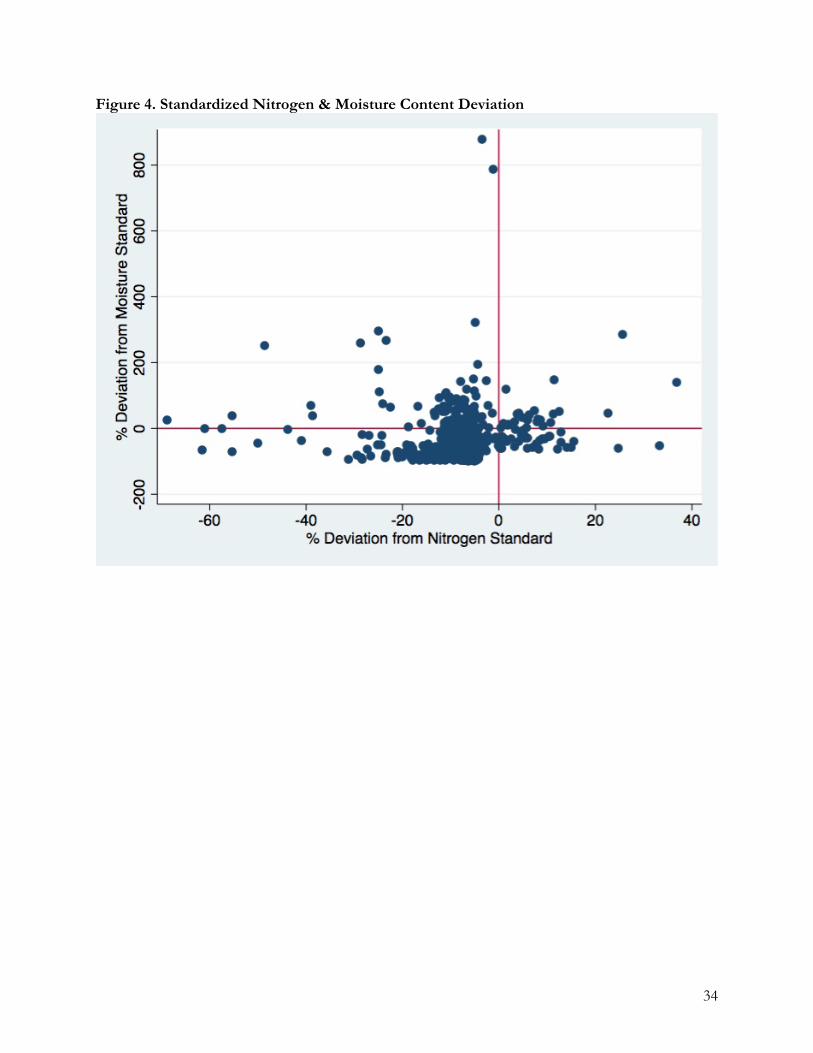
According to results from the laboratory tests, 92.96% of 824 samples are missing nitrogen
(that is, their measured nitrogen is less than their advertised nitrogen level), and 15.17% of the
samples exceed the maximum moisture content standard. On average, ten percent of the nitrogen is
missing from Urea, six percent from DAP, and seven percent from CAN (see Table 2). Figure 4
plots the standardized nitrogen6 and moisture content7 results for the 824 mineral fertilizer samples.
6 For each type of mineral fertilizer, the standardized nitrogen content was calculated as follows: the nitrogen content standard was subtracted from the measured nitrogen content. The difference was divided by the nitrogen content
13
Each quadrant of Figure 4 represents samples characterized by the following measured mineral
fertilizer quality attributes: (1) the upper right quadrant presents samples that were found to have
sufficient nitrogen content but excessive moisture content; (2) the upper left quadrant is samples
both deficient in nitrogen content and with excessive moisture content; (3) the lower left quadrant is
samples with deficient nitrogen content but acceptable moisture content; and (4) the lower right
quadrant is the small number of samples with both sufficient nitrogen content and acceptable
moisture content. Note that a handful of samples have nitrogen contents that exceed the
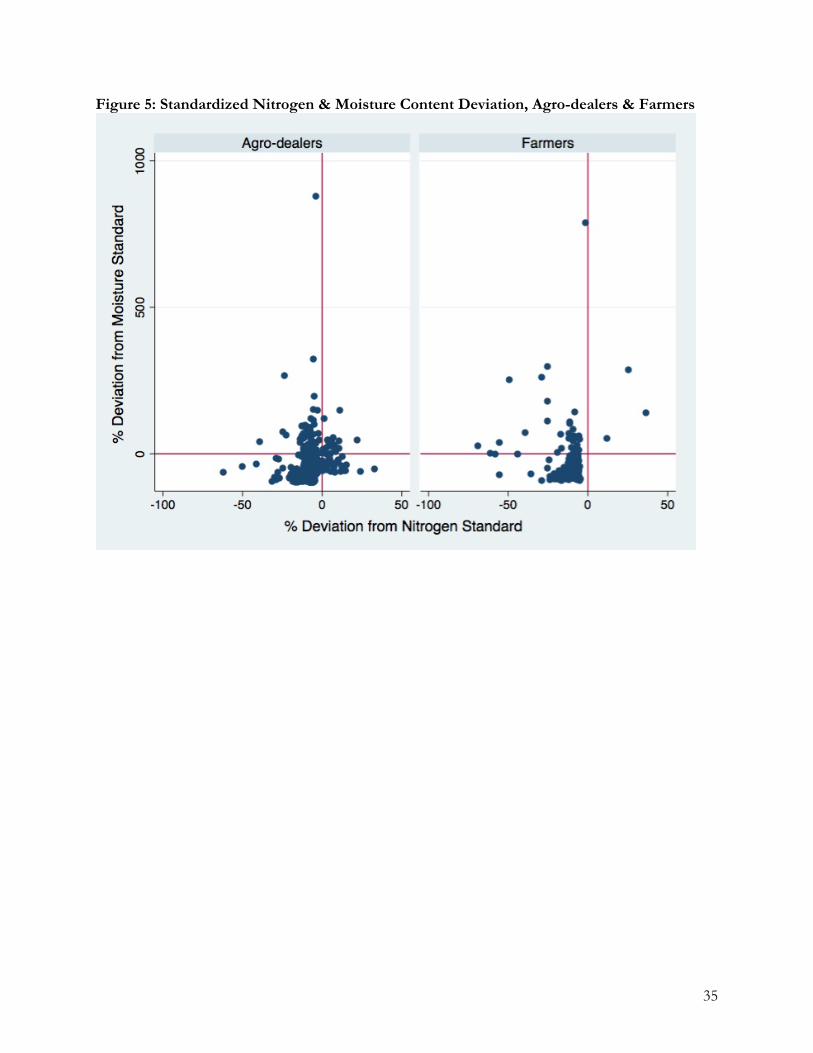
manufactured standards. Figure 5 plots the standardized nitrogen and moisture content results
separately for the agro-dealer and farmer samples.
Our results provide evidence that farmers are paying for mineral fertilizer that does not meet
the national, international, and industry standard for nitrogen content. On average, fertilizers are
short approximately ten percent of advertised nitrogen; for example, a 50 kilogram bag of Urea
fertilizer on average contains 20.7 kilograms of nitrogen rather than the required 23 kilograms or 10
kilograms of Urea would be missing approximately half a kilogram of nitrogen.
Application of mineral fertilizer with inadequate nutrient content will impact yields and
benefits from application will decline accordingly. Mather et al. (2016) calculate a linear maize-
nitrogen response rate for Tanzania of 7.6 kilograms of maize per kilogram of nitrogen applied; a
ten percent nitrogen loss from the input means a ten percent loss in production. It is also important
to observe that the nitrogen response rate at Tanzanian agricultural research centers is nearly 20
kilograms of maize per kilogram of nitrogen applied, a rate similar to other parts of East Africa
(Mather et al. 2016, Snapp et al. 2014). standard, resulting in the standardized nitrogen content. A negative figure represents a nitrogen deficiency, whereas zero or a positive figure represent sufficient nitrogen content. 7 For each type of mineral fertilizer, the standardized moisture content was calculated as follows: the moisture content standard was subtracted from the measured nitrogen content. The difference was divided by the moisture content standard, resulting in the standardized moisture content. A positive figure represents excessive moisture content, whereas zero or a negative figure represent sufficient moisture content.
14
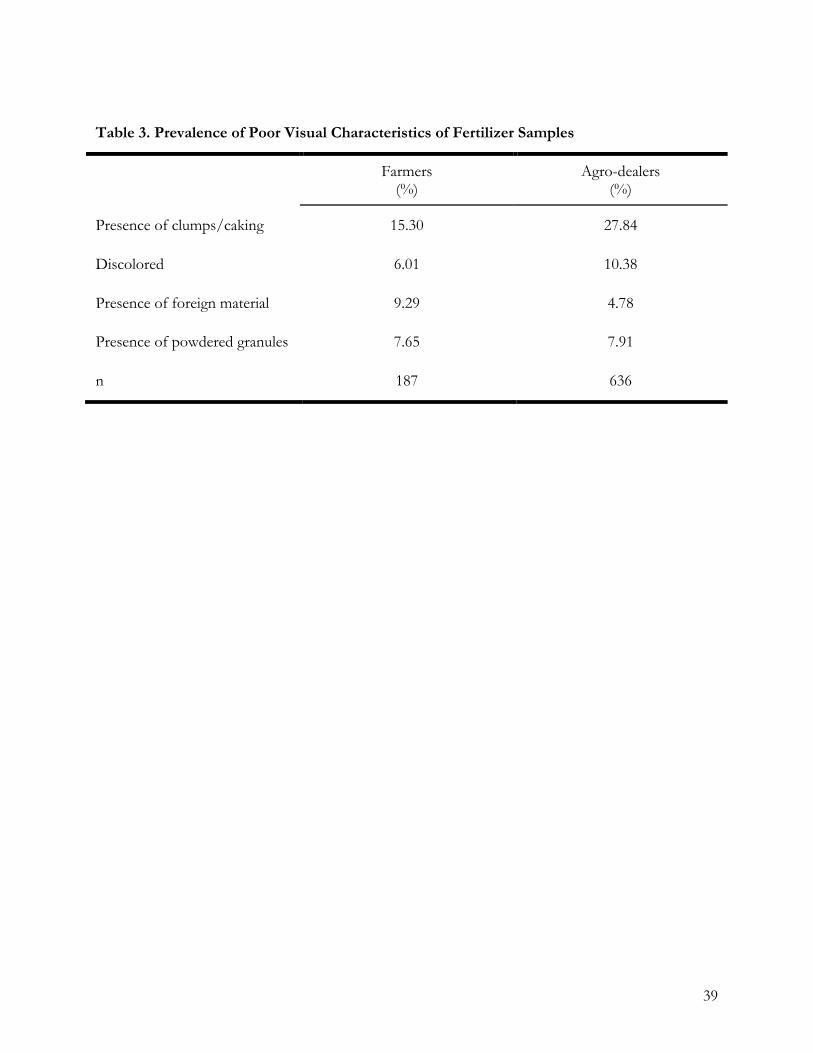
In addition to measured nutrient deficiencies, about one quarter of the mineral fertilizer
samples had observable quality issues such as caking or clumping, discoloration, powdering, or the
presence of foreign material. Table 3 presents the prevalence of poor visual characteristics across the
mineral fertilizer samples collected from farmers and agro-dealers. Caking was observed in 15% of
farmer samples and 28% of samples obtained from agro-dealers; approximately 8% of all samples
contained powdered granules.
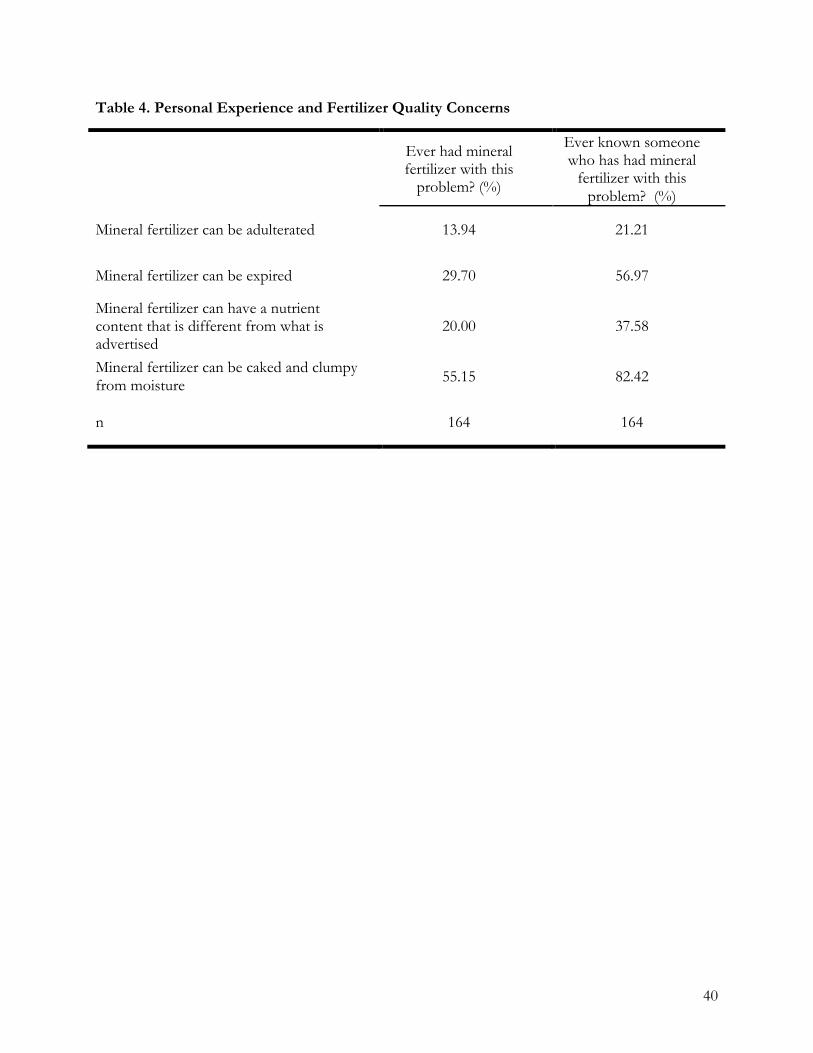
Farmers are attentive to these observable characteristics of mineral fertilizer. Table 4
describes farmers’ previous experience with adulterated, expired, low nutrient content, and caked
mineral fertilizer. More than half of the respondents reported having purchased caked mineral
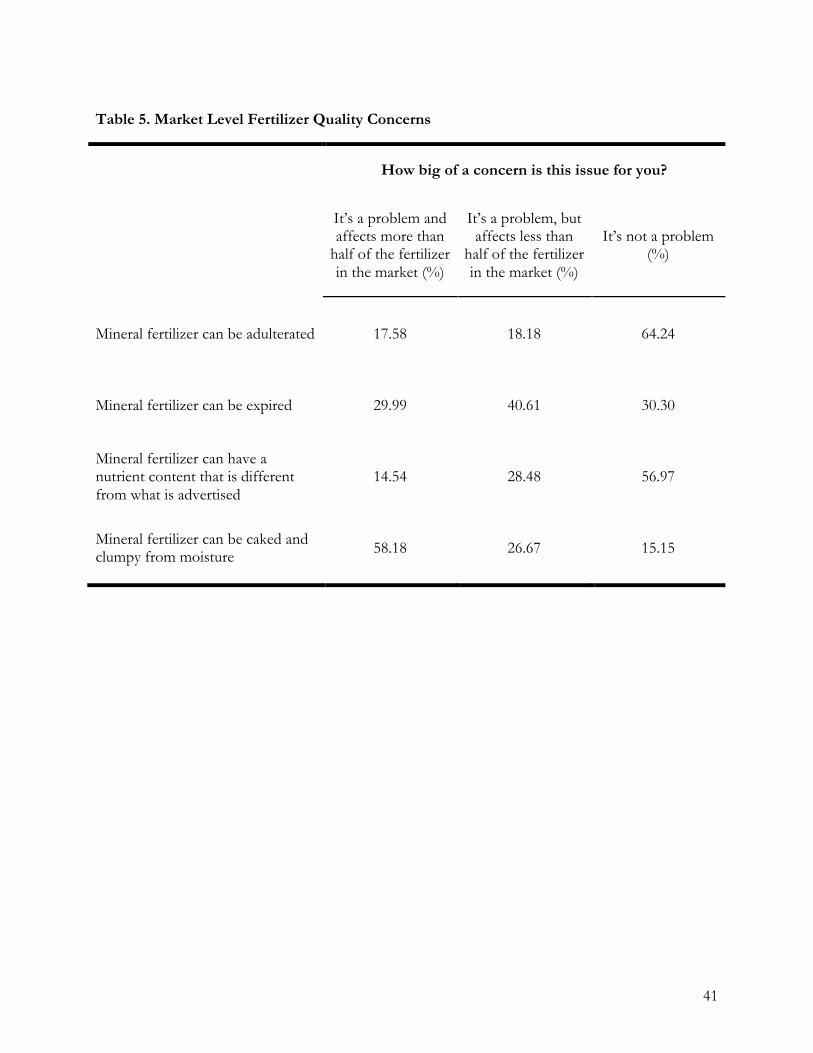
fertilizer before and 82% reported knowing someone who had purchased caked fertilizer. Table 5
describes farmers’ concerns about the quality of mineral fertilizer available in markets. Nearly 60%
of respondents reported that over half of the mineral fertilizer sold in the market had issues with
caking and clumps and 30% of farmers thought that over half of the mineral fertilizer in the market
was expired (meaning the mineral fertilizer was sold past its expiration date).8
Note that just as fertilizer with compromised nutrient content impacts farmer profits,
physical quality problems also can have associated costs for farmers independent of inferred
implications about nutrient content or agronomic efficacy. For example, caked fertilizer must be
broken up by the farmer before application; powdered fertilizer is difficult to apply and can result in
losses during handling or storage. Approximately 30% of surveyed farmers reported that they do not
apply mineral fertilizer with caked clumps and 70% will first break the caked mineral fertilizer prior
to application. 9
8 In Tanzania, several mineral fertilizer manufacturers include a batch date and an expiration date on the labeling of the hermitic bags. 9 Nearly a third of respondents indicated that they will break the clumps with their hand, another third indicated they will use a tool, and the final third of respondents indicated that they will use some combination of the two to break the caked
15
Given the prevalence of observable quality issues and the problems of nutrient quality in the
samples, do observed physical properties reveal anything about the nutrient quality of the mineral
fertilizer? What is the relationship between the nitrogen content of the fertilizer and the observed
characteristics?
Relationship of observed characteristics and nutrient quality
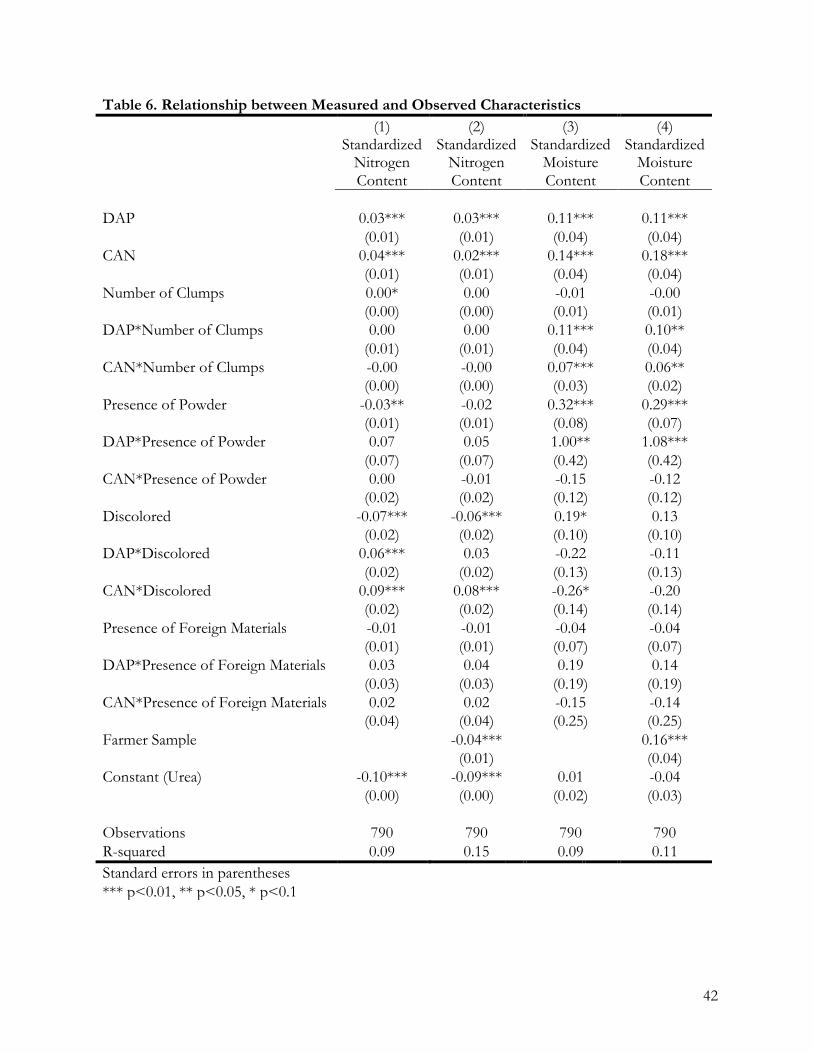
To assess the relationship between these observed characteristics and unobserved quality, we
regress the standardized nitrogen content measure on the four physical attributes with interaction
terms for each fertilizer type (Urea, DAP, CAN). Table 6 presents the results.
In short, the observed properties of the sample exhibit little relationship with the nutrient
quantity.10 That is, physical quality can exhibit degradation without underlying degradation in the
nutrient content (and vice versa). Columns (1) and (3) present the results for the farmer samples
combined with the samples from agro-dealers, but Columns (2) and (4) add a control for whether
the sample came from a farmer. On average, Urea fertilizer samples are 9% deficient in nitrogen,
and DAP and CAN are 6% and 7% percent deficient, respectively (column (2)). Results suggest that
the degree of caking has no relationship with the nutrient content of the mineral fertilizer in our
samples; nor does presence of dust and powders provide any information about the nitrogen
content once we control for farmer samples. For Urea and CAN, evidence of granule discoloration
is associated with a small decrease in measured nitrogen, but there is no relationship between
discoloration and nitrogen for DAP. Finally, the presence of foreign materials does not provide any
information about the nutrient content of the mineral fertilizer.
clumps. Fifteen percent of farmers indicated that they will break the clumps down to the size of a bottle cap, whereas 38% will break the clumps to the size of a grain of maize and then apply the mineral fertilizer 10 Notably, an IFDC study of fertilizer quality in West Africa found caking to be correlated with low nutrient content in a particular blend of NPK (Sanabria et al. 2013).
16
As a check, we also analyze the relationship between the measured moisture content of the
samples and observed quality characteristics; moisture content is directly related to caking and
clumping and powdering of granules (powdering makes the fertilizer likely to more readily and
quickly absorb moisture). We repeat the analysis using the standardized moisture content as the
dependent variable and present the results in Columns (3) and (4). As expected, evidence of
powdering is positively associated with moisture content for Urea (29% higher on average) and
DAP (108% higher on average). Clumping is similarly associated with higher moisture content in the
sample for the CAN and DAP. Discoloration and the presence of foreign material have no
relationship with the measured moisture content.
We find evidence of nutrient problems in mineral fertilizer as well as problems with
observed quality characteristics, but we find that observed characteristics do not help farmers
identify the nutrient-deficient fertilizers. The question we turn to next is how farmers use observable
traits to infer unobservable nutrient quality.
How do observable fertilizer attributes affect farmers' quality assessments and willingness to pay for mineral fertilizer?
We use a willingness to pay assessment to study how farmers use observable characteristics of
mineral fertilizer to assess quality. In the assessment, we showed farmers three samples of fertilizer
that the survey team had purchased from agro-dealers in the Morogoro region and which had been
lab-tested for nutrient and moisture content.11 All samples were of nutrient and moisture content
that met FAO and Tanzanian government fertilizer standards and can therefore be considered good
quality, despite the variation in their physical characteristics. Pictures of the samples provided to
survey participants are included in the appendix (Figures A1 – A3). We showed participants three
samples of Urea fertilizer: Sample A, good appearance (bright white and prilled) and good nutrient
11 Tests were performed at a US-based private lab. Details are available in Fairbairn et al. (2016).
17
quality; Sample B, bad appearance (caked clumps with discoloration) and good nutrient quality;
Sample C, bad appearance (appeared to have been mixed with DAP) and good nutrient quality.
Participants were provided with all three samples to inspect at the same time. They were
given one minute to examine the three samples however they chose (for example, participants were
free to open the bag, touch the fertilizer, etc.). Once the inspection period was over, the enumerator
asked a series of questions about the observed and inferred characteristics of the sample (i.e., was
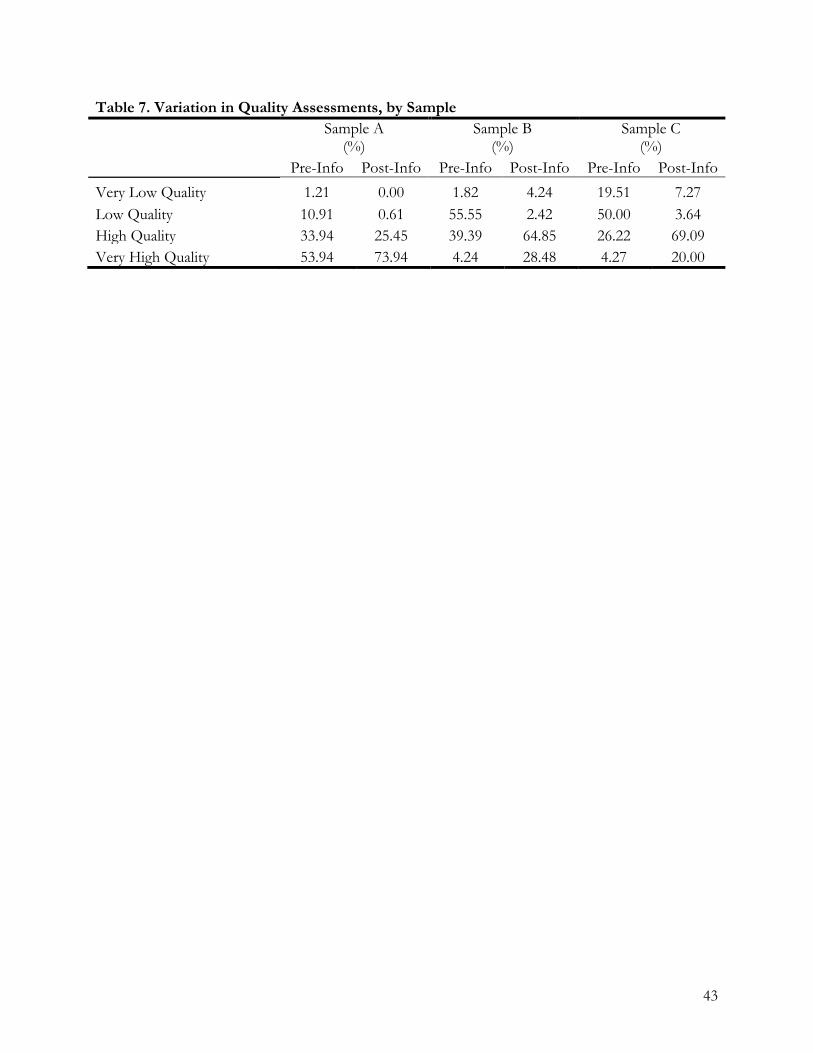
the sample adulterated, expired, etc.). Participants were then asked to rate the quality of the sample
(on a scale of 0: very low quality – 3: very high quality) and to provide the enumerator with the
highest price that they would be willing to pay for the sample. Table 7 describes the variation in
quality ratings for each sample. We also asked participants whether they agreed or disagreed (on a
scale of 0 (extremely disagree) to 3 (extremely agree)) that each of the three samples had the
following characteristics: the sample was adulterated, the sample had a nutrient content lower than
advertised, the sample was expired, and finally, the sample would be easy to apply. After obtaining
the initial willingness to pay and quality ratings, participants were provided with information on the
measured (unobserved) quality of each sample. The following script was used for each sample:
Now, I would like to provide you with information on the nutrient and moisture content of these fertilizer samples. Fertilizers, including Urea, have nutrient and moisture standards that ensure that the fertilizer will improve soil fertility and help the crops to grow. For example, in Urea, the most important element is Nitrogen and samples of Urea should contain 46% Nitrogen. Also, Urea should not have moisture content greater than 1%. We tested the nutrient and moisture content of these Urea samples to ensure that they meet industry and national standards. We tested the fertilizer samples at a laboratory in Florida, USA. This particular laboratory tests the nutrient and moisture content of fertilizers for farmers and agricultural companies in the United States. We have the results of those tests and would like to share them with you. This sample has a Nitrogen content of X% and a moisture content less than Y%. According to the results from the laboratory, this sample meets industry standards and when applied correctly, will improve soil fertility and help crops grow.
Note that “X” and “Y” represent the actual values of the measured nutrient and moisture content,
and the statement was repeated for Sample A, Sample B, and Sample C.
18
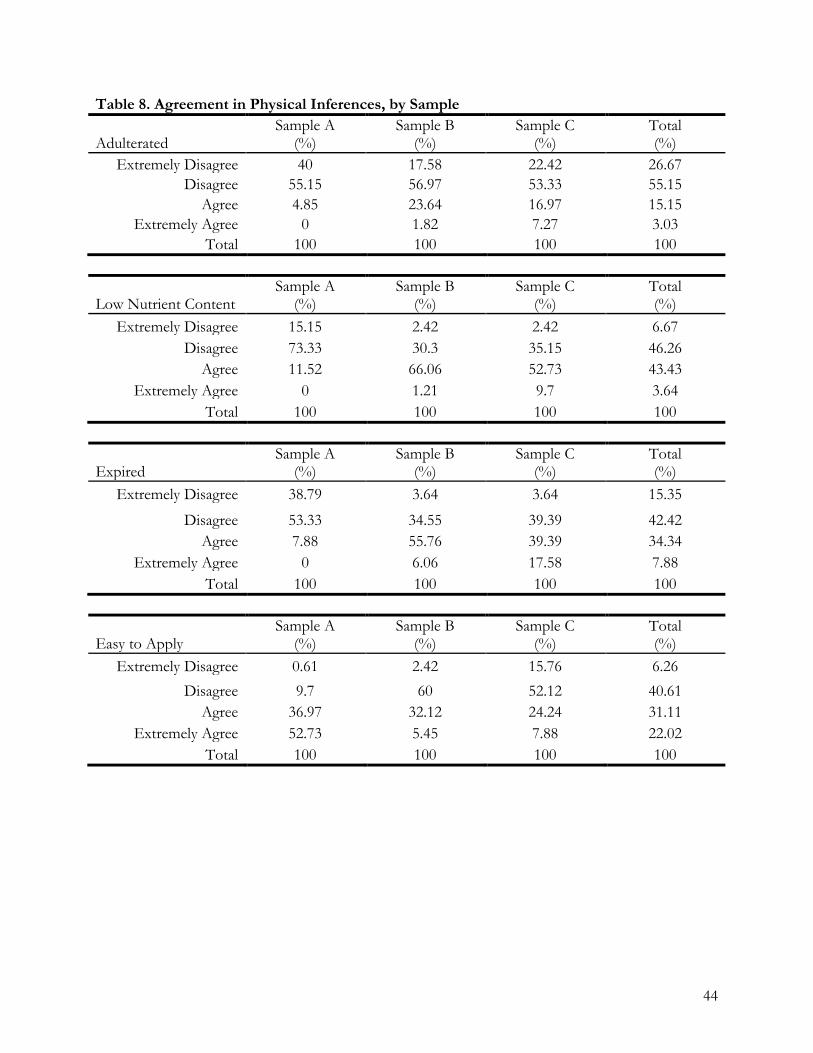
Respondents were attentive to the observable attributes of the fertilizer samples they
inspected and overwhelmingly inferred underlying quality problems from observed characteristics.
Table 8 presents assessments of each sample. Only 5% of the farmers thought that clean and clump-
free Sample A had been adulterated while approximately 25% of farmers agreed or strongly agreed
that Samples B and C had been adulterated. Twelve percent assessed Sample A as likely having a
nutrient content less than advertised (46% nitrogen) while 67% assessed Sample B and 60% assessed
Sample C as likely having low nitrogen. Samples B and C were similarly assessed as likely being past
the expiration date from the manufacturer bag (62 and 57% of respondents agreed, respectively) and
being more difficult to apply to crops. Sixty-two percent of farmers indicated that Sample B
(characterized by caking and clumping) would be difficult to apply, and 67% responded that Sample
C (mixed with DAP) would be difficult to apply. In contrast, 90% of respondents judged Sample A
as easy to apply.
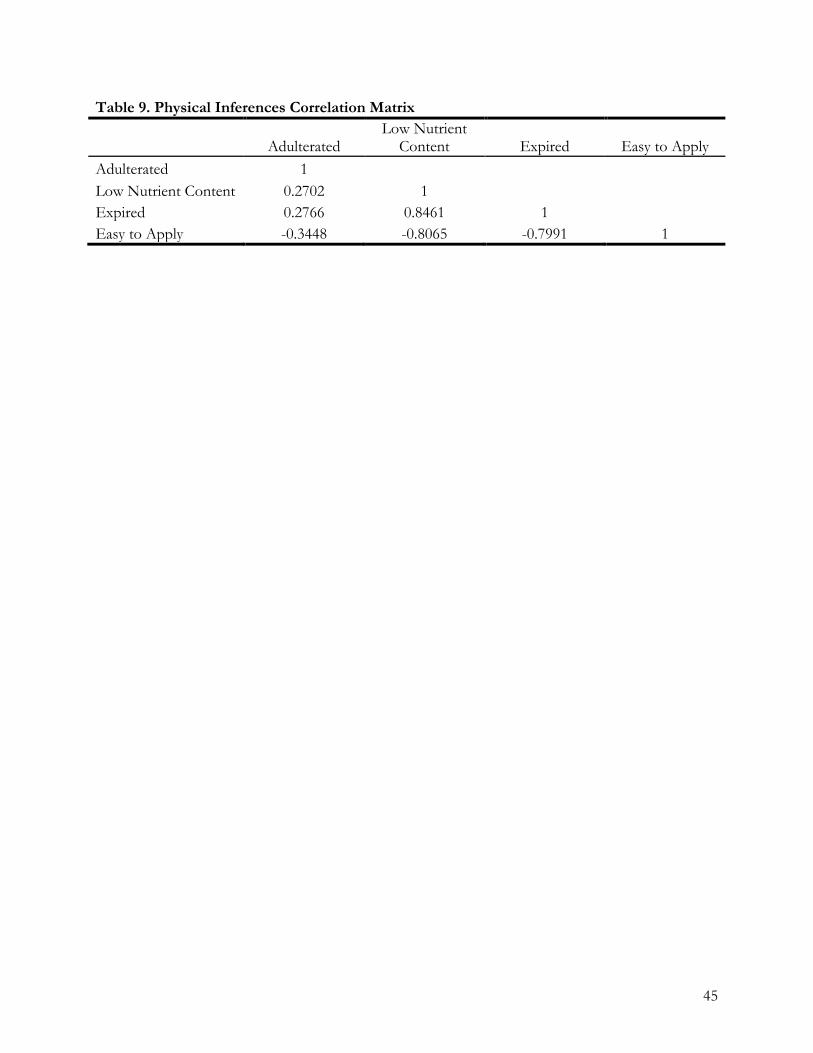
We find strong correlations among the attributes farmers infer from the physical
characteristics of the sample. The correlation matrix for these characteristics is presented in Table 9.
Results suggest that there are two axes of inference for farmers based on observable attributes: one
dimension in which they assess whether the fertilizer is adulterated and a second in which they
jointly assess measures of quality related to nutrient content, ease of application, and whether the
product is past its date of expiration.12 Based on our data, it appears that if a farmer assesses fertilizer
as having a shortcoming in one of these quality characteristics (nutrient, degree of caking/ease of
application, past expiration), it will also be judged as deficient in the others. For example, a sample
that a farmer assesses to be low nutrient (that is, one for which he agrees or strongly agrees with the
statement that the “sample has a nutrient content that is less than what is advertised”) is also likely
to be rated as past its expiration date by the farmer. Similarly, samples assessed as low nutrient
12 It is surprising that nutrient content and adulteration are not more closely correlated.
19
content are also likely to be assessed as more difficult to apply to fields.
Observable Characteristics & Farmers’ Quality Assessments
To understand how farmers use assessed observable characteristics to appraise quality, we
regress the farmers’ sample-specific quality rating on the physical characteristics interacted with the
sample type.13 Given the correlation among the assessed quality characteristics, we use only one
characteristic from each dimension (adulteration and observed physical degradation) in the
specifications. Table 10 presents the results, with each column using a different characteristic of
physical degradation: whether the farmer reported that the nutrient content was likely lower than the
advertised amount (Column (1)), whether the farmer assessed the fertilizer as difficult to apply
(Column (2)), and whether the farmer thought the fertilizer was past its expiration date (Column
(3)). As expected, results are consistent across the columns; that is, regardless of the measure of
physical degradation used. The poor-looking Samples B and C are assessed as worse quality overall
than Sample A. Note that despite the fact that all samples meet the required nitrogen and moisture
standards, farmer quality assessments differ. The pre-information quality rating for Sample B
(caking/clumping) and Sample C (mixed with DAP) are considerably lower than the assessments of
Sample A (good appearance), based solely on observable characteristics. Moreover, rankings were
equally downgraded by farmers – nearly 0.75 points on a three point scale – if they assessed the
sample to be low nutrient, difficult to apply, or likely expired.
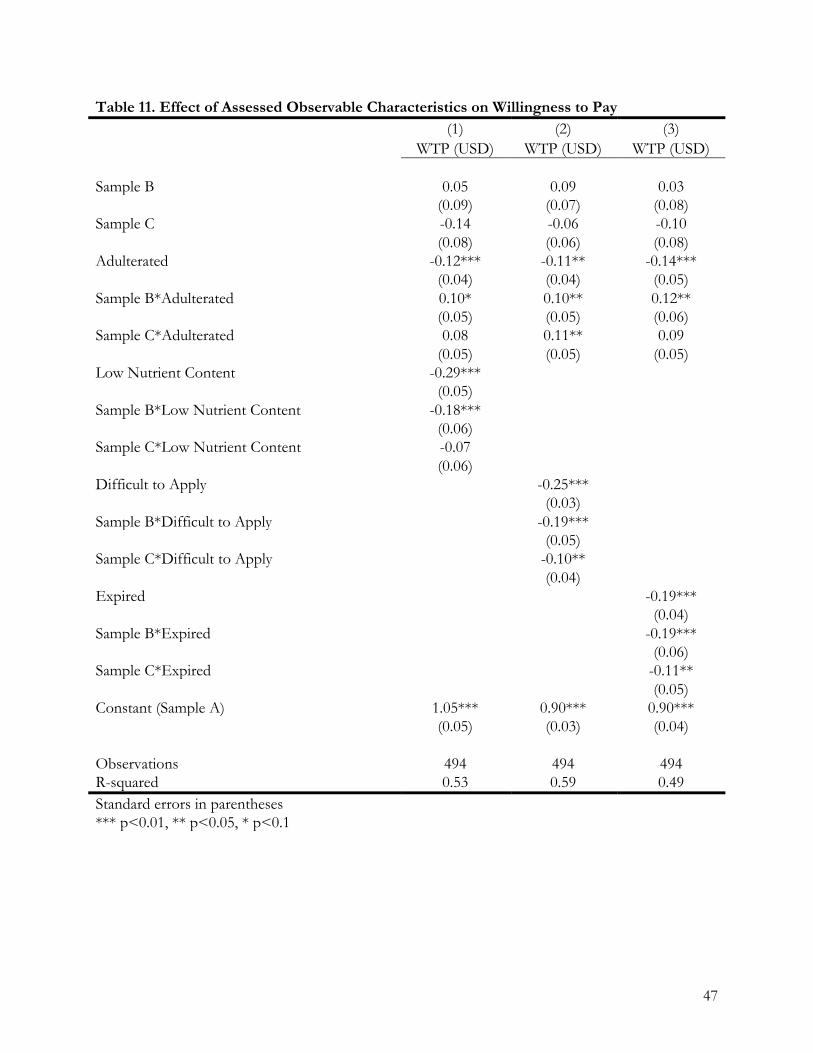
We present results of a similar exercise in Table 11 - regressing the willingness to pay on the
physical characteristics. Results are largely consistent with the analysis of the relationship between
quality assessment and physical attributes and suggest that physical attributes impact willingness to
pay: farmers who assessed the sample as difficult to apply or likely expired reported a lower
willingness to pay for the mineral fertilizer regardless of the sample.
13 Note that our findings are consistent in sign and in magnitude when estimated with an ordered logit. The results are available in Appendix, Table 1.
20
How do farmers respond to information about the quality of mineral fertilizer?
As discussed, after the initial willingness to pay and quality assessments, we provided
participant farmers with information about the actual nutrient and moisture content for each sample.
We then asked participants to rate the quality and to provide their WTP for a second time for each
sample.14 We present the WTP analysis below; results from the quality analysis are consistent.
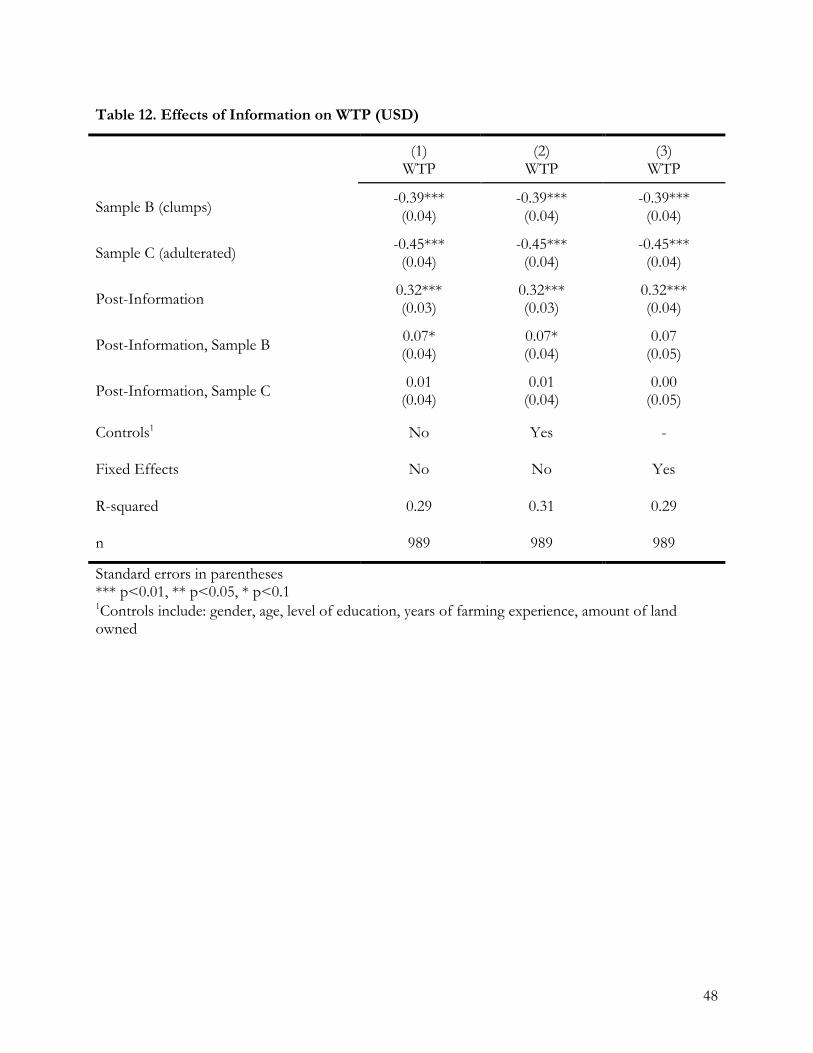
Table 12 presents the regression results of the effects of information provision on farmer
reported willingness to pay. Prior to the information, farmers discounted Sample B
(caking/clumping) and Sample C (adulterated) relative to Sample A (good appearance) by 39 and 45
cents, respectively. This discount is over less than half of the average market price of 1 kilogram of
Urea (74 cents). Willingness to pay for each sample increases post-information by 32 cents on
average – a large effect relative to both the prevailing market price and the pre-information results;
however, the overall change in willingness to pay is slightly larger for Sample B (caking/clumping)
than Sample C (adulterated) or Sample A but interestingly, the effect does not vary much by sample
– farmers increase their WTP for Sample A nearly as much as they do for the poor-looking samples.
Note that results hold with the inclusion of farmer fixed effects.
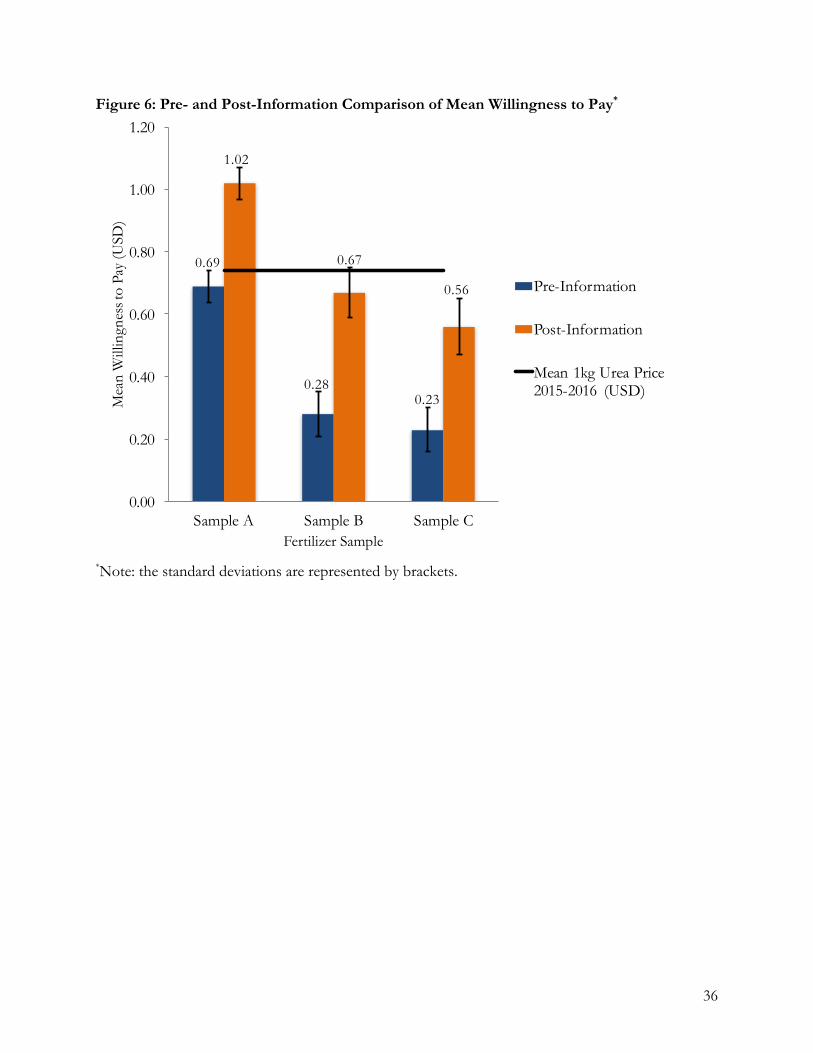
Figure 6 presents the mean willingness to pay for each sample pre- and post-information. To
provide context for the willingness to pay estimates, we include a reference line that represents the
average market price for 1 kilogram of Urea. The mean market price, 74 cents, represents the mean
price of 302 samples of Urea purchased from agro-dealers in 2015 and 2016 in the Morogoro region.
Note that prior to the information, farmers were unwilling to pay the mean market price for any of
14 Directly after the willingness to pay and quality assessment exercise, participants were asked about the extent to which they believed the credibility of the fertilizer test results (the nutrient and moisture content for each sample) that we shared with them. Thirty-five percent of respondents found the testing results to be credible, whereas 63% believed the results to be extremely credible.
21
the samples. After receiving the information, farmers, on average, are willing to pay $1.02 for one
kilogram of Urea of equivalent quality. Sample A (good appearance) is the only sample farmers were
willing to pay more than the average market price; suggesting that farmers remain skeptical of the
quality of Samples B and C even after receiving information about the nutrient content.
Even with the information, however, farmers continue to discount the quality of and to
report a lower willingness to pay for the clumpy and mixed samples relative to clean looking Sample
A. One way to interpret this fact is that farmers care about observed quality characteristics both as a
signal of unobservable nutrient quality and as a separate quality dimension; resolving uncertainty
around unobserved quality obviously does not solve observed quality problems. One reason for this
may be that mineral fertilizer with poor physical characteristics can imply additional costs for
application. Pre-information willingness to pay assessments therefore capture not only the farmer’s
costs of uncertainty about nutrient quality, but also an expected cost of dealing with poor physical
attributes; for example, farmers having to break up the clumps or sift through the adulterated
mineral fertilizer to eliminate unwanted foreign material. Our post-information WTP estimates help
decompose these costs as what remains after the uncertainty is resolved can be interpreted in lost
time and resources from physical quality problems – including the costs of lost fertilizer if the
clumps are discarded; note that in the case of our respondents, nearly a third reported that they
would not apply caked or clumped fertilizer to their crops at all.
Analysis of the mineral fertilizer quality and willingness to pay assessments provides
evidence that farmers make inferences about the unobservable quality from unobservable attributes,
despite the fact that we find that observables are a poor predictor of nutrient quality. If physical
observable quality characteristics are not informative to farmers, can farmers rely on the price of
mineral fertilizer, or quantity purchased, as signals of quality?
22
Is purchasing small quantities of mineral fertilizer from open bags worse?
Small farmers may be especially likely to purchase mineral fertilizer of degraded observable
quality because of the way that mineral fertilizer is packaged and sold in the region. Mineral fertilizer
is sold in large standard quantities; 50 kg bags at a per bag price of $30-$50. The expense of a full 50
kg bag can exceed the limited budget of a small farmer, and farmers often purchase smaller
quantities of fertilizer from open 50 kg bags in markets or input supply stores. This means that input
shops measure the amount of mineral fertilizer the farmer wants to purchase out of an open 50 kg
bag or that the farmer purchases small bags of re-bagged fertilizer sold in 1kg or 2 kg plastic bags.15
The quality of fertilizer sold and stored in open bags could be compromised in one of three ways:
(1) deterioration in fertilizer quality could result from the inputs dealer adulterating the product; (2)
the fertilizer, due to its sensitivity to environmental or storage conditions, may degrade naturally; or
(3) the granules within fertilizer blends may separate during transport or storage, meaning that
farmers purchasing less than a full bag are likely to receive a product with inadequate nutrient
content.
In our sample of farmers, we find that 64% provided us with fertilizer samples purchased
from a previously opened bag. We observe an inverse relationship between quantity purchased and
price paid: on average, farmers pay an additional (statistically significant) 17 cents per kilogram for
mineral fertilizer purchased from an open bag relative to a closed manufacturer’s bag. Given that
farmers pay more per kilogram on average for smaller quantities of mineral fertilizer, we probe this
relationship further to see whether the type of purchase (open vs. closed bag) signals unobserved or
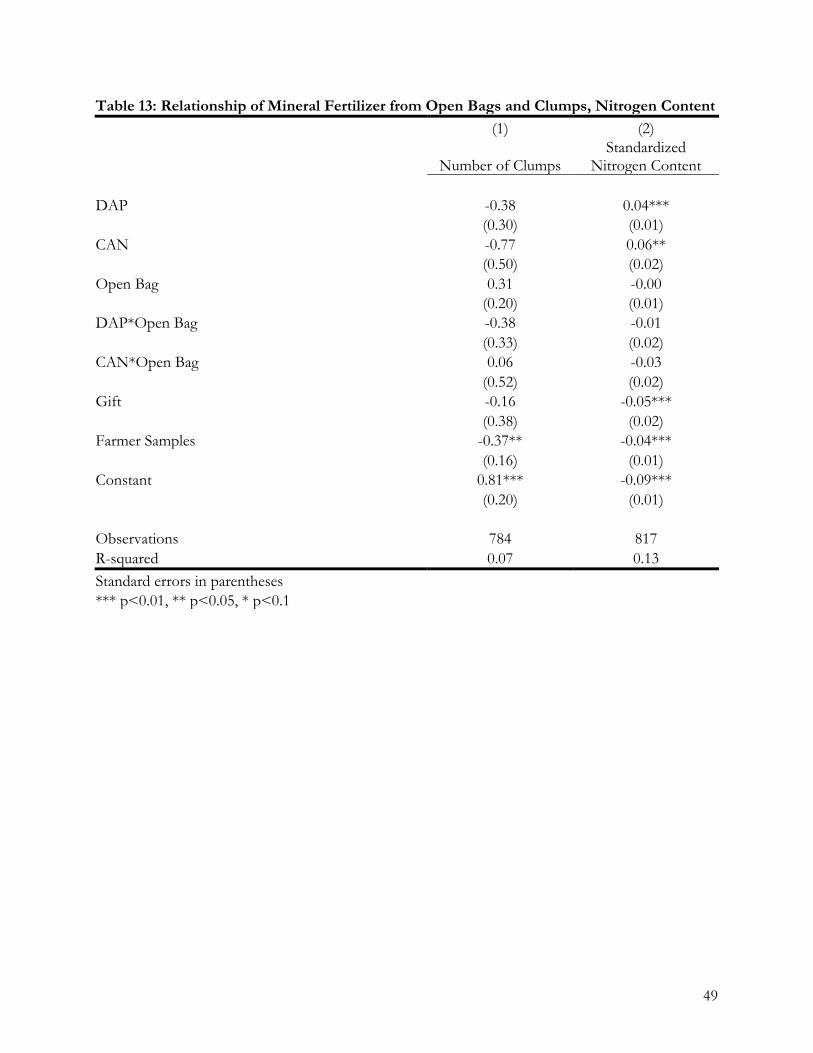
observed quality. To examine the relationship with observed quality, we first regress the number of
clumps on an indicator for open bag (interacted with the fertilizer types) while controlling for farmer
15 In Tanzania, the Fertilizer Act of 2011 prohibited the sale of mineral fertilizer from previously opened bags or unofficial packaging. Despite this, the sale of mineral fertilizer in quantities as small as one kilogram remains common practice.
23
samples and gifted samples.16 In this specification, we observe that Urea purchased from previously
opened bag is statistically more likely to be caked or clumpy, a result one would expect because of
the opened bag’s additional exposure to heat, humidity, and moisture (Table 13, Column (1)). If
Urea from opened bags is more likely to be caked, the evidence from our quality and willingness to
pay assessments suggests that farmers will rely on these observed characters to make assumptions
about the unobserved quality.
Consistent with earlier analyses, we find no evidence that purchases from open bags are
more likely to have nutrient quality problems. We regress the standardized nitrogen content on an
open bag dummy variable, while controlling for farmer samples and gifted samples, to determine
whether purchasing mineral fertilizer from an opened bag is predictive of nitrogen content. We
present these results in Column (2) of Table 13. Purchasing mineral fertilizer from an open bag does
not predict nitrogen content: our interaction terms for DAP and CAN are insignificant and the
linear combination for Urea is also insignificant. Thus, we find no relationship between purchasing
mineral fertilizer from a previously opened bag and standardized nitrogen content.
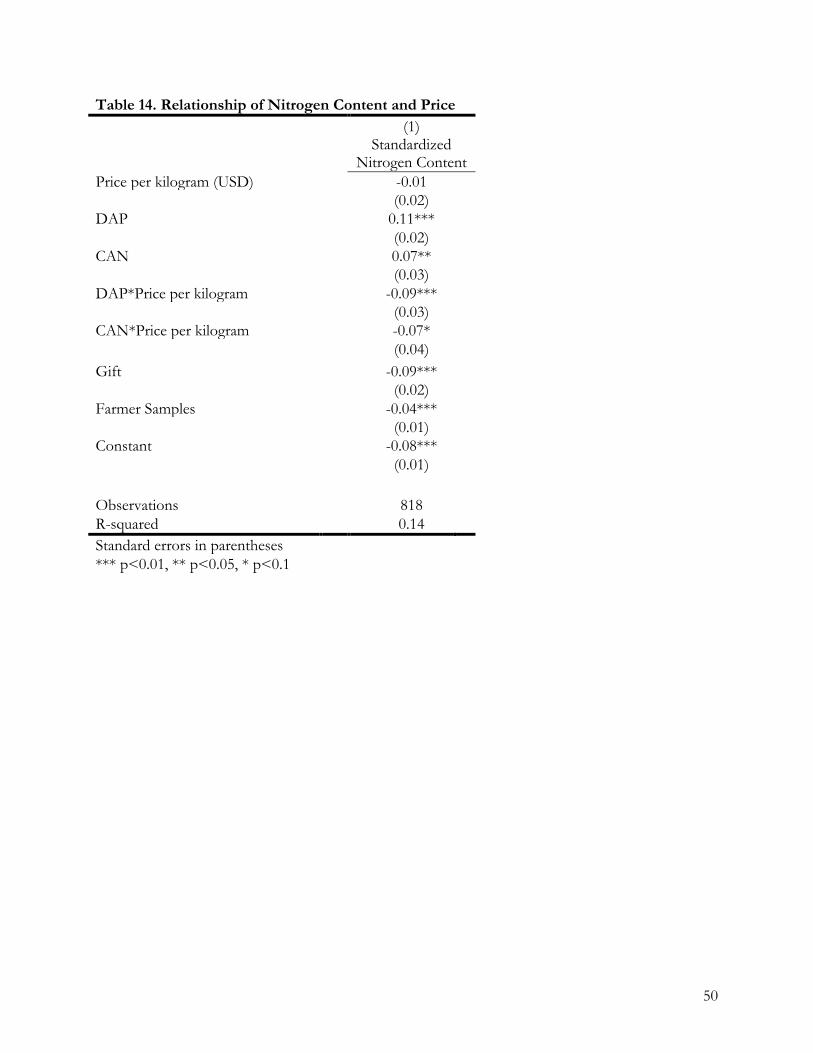
We also examine whether price is an indicator of quality, regressing the standardized
nitrogen content on the price per kilogram of fertilizer, the fertilizer type, whether the sample was
from a farmer, and whether the farmer received the mineral fertilizer as a gift. Results are presented
in Table 14. We find no relationship between the price and the nitrogen content (Table 14),
suggesting that farmers may face limitations to learning about underlying agronomic mineral
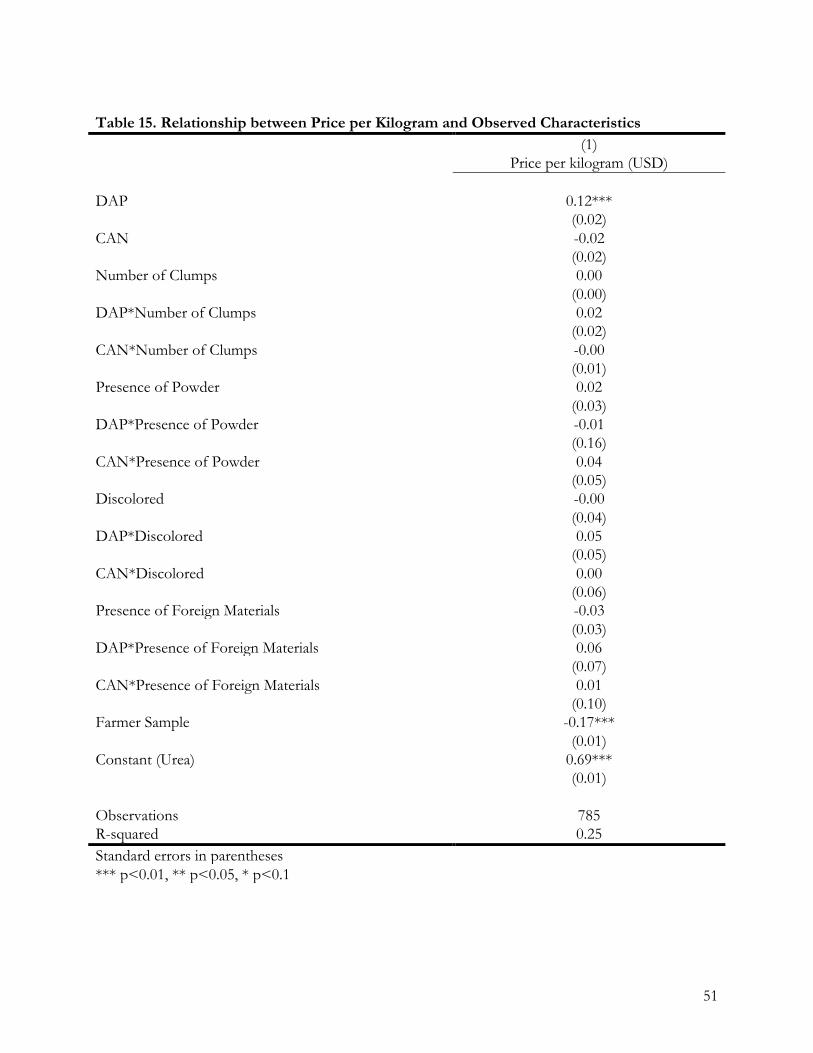
fertilizer quality. Nor do we find any relationship between observable quality characteristics and
price (Table 15).
Mineral fertilizer from open bags is more likely to have physical quality problems but no
16 Samples that were given to farmer participants from a friend, family, neighbor, NGO, or government are considered a gift. In total, 15 of the 824 samples of mineral fertilizer were gifts and account for only 2% of the total number of samples.
24
more likely than mineral fertilizer from closed bags to be deficient in nitrogen. Consequently, if
small farmers purchase mineral fertilizer in small quantities and rely on the physical characteristics to
infer quality, they may misconstrue the true measured quality of the mineral fertilizer. As a result of
this misconception, farmers’ expected returns of investing in mineral fertilizer with poor appearance
may be significantly lower than their expected returns of investing in mineral fertilizer with a good
appearance. Moreover, the expected returns are also likely to be skewed by the prevalence of poor
looking mineral fertilizer on the market (recall Table 5) and may inversely impact purchase quantity
decisions. Because of perceived expectations of poor returns on bad-looking mineral fertilizer,
farmers may be purchasing less mineral fertilizer than they otherwise would.
5. Conclusion
Agricultural input quality in Sub-Saharan Africa has begun to receive attention from
researchers and policy makers, but so far the focus has been exclusively on mineral fertilizer nutrient
quality in markets where nutrient deviations appear to be considerable and pervasive (Bold et al
2015, Sanabria et al 2013).
Our research in Tanzania suggests a related problem with important implications for policy.
We find more modest, but still important percentages of missing nutrients – about 10% on average
– from samples of Urea, CAN, and DAP acquired from input shops and directly from farmers. But
we make an important distinction in quality assessment for the first time: we find widespread
evidence of degradation in physical, observable quality characteristics and we find that these
observable quality characteristics do not provide information about which mineral fertilizer samples
are nutrient deficient. Moreover, we find evidence that farmers are attentive to these observable
quality characteristics, that they are using physical characteristics to infer unobservable nutrient
quality, and that this inference directly impacts their willingness to pay for mineral fertilizer in a way
25
that suggests broader market implications. For example, farmers’ average reported willingness to pay
for clumpy Urea was well below the market price. Yet, we find that farmers’ quality ratings and WTP
respond to information about the tested nutrient quality of the fertilizer but assessments of bad-
looking samples continue to trail assessments of the good-looking sample.
The inability for farmers to use observable characteristics to infer measured quality has two
major market implications for mineral fertilizer: (1) farmers with experience purchasing and applying
mineral fertilizer may purchase less fertilizer than they otherwise would and (2) farmers with no
previous experience purchasing and applying mineral fertilizer may remain unlikely to adopt the
input as part of their soil and farm management practices. In both cases, uncertainty regarding the
influence of observed characteristics on unobserved quality may be an issue of asymmetric or
unobservable information; farmers do not have access to reliable information on the measured
quality of mineral fertilizer. As a result, a complementary question remains: what do input dealers
know about the quality of the mineral fertilizer that they are selling?
We observe nitrogen deficiencies on the order of 10%, possibly a result of degradation due
to capital-constrained supply chains, rather than deliberate adulteration or counterfeiting of mineral
fertilizer. Assuming a linear crop response to nitrogen application, the application of mineral
fertilizer that is missing nitrogen (that is, containing less nitrogen than the standard crop-nutrient
rating) has a direct and negative effect on farmer yields. The average cereal yield per acre for
Tanzanian farmers is 697 kilograms (World Bank 2014). Assume a linear nitrogen-yield response rate
of 7.5 kilos of maize per kilo of nitrogen (Mather et al. 2016). Missing nitrogen effectively lowers the
nitrogen yield response; a farmer will get 6.75 kilos of maize per unit of mineral fertilizer applied
when he or she should get 7.5 kilograms. In 2017, maize prices in Tanzania hovered around 60,000
Tanzanian Shillings per 100 kilograms sold (FEWS Net 2017) and the difference in the per kilo net
benefit of fertilizer application given a mean per kilogram fertilizer price of 1605 TSh (assuming
26
linear pricing) was approximately 207 TSh. This means, that, on average, farmers net profit for
application of a kilo of fertilizer is about 44% less than if there were no missing nutrients (258 TSh
instead of 465 TSh). Note, however, that application of mineral fertilizer missing 10% of nitrogen
content on average still can be expected to result in increased profits for farmers, relative to not
applying mineral fertilizer at all.
A hypothesis in much of the existing research, media coverage17, and policy work on
agricultural inputs quality in Sub-Saharan Africa is that widespread adulteration and malfeasance is
likely to blame for problems with missing nutrients in mineral fertilizer. Yet the reasons for the
missing nutrients in our tested samples are much broader and include the importation of poor
quality inputs, adulteration, or some degradation along the supply chain. Supply chains in the region
moving fertilizer from port to rural input shops are capital constrained and limited in their logistics
and storage capabilities (Fairbairn et al., 2016) and our findings suggest that poor supply chain
management may be a culprit in this region, particularly with respect to degradation of observable
quality characteristics. Our results suggest that capital constraints in markets can have direct effects
on input adoption, agricultural productivity, and farmer investment, which of course impact market
investment and development.
Results raise interesting questions with respect to agro-dealers; specifically in regards to what
they know about fertilizer quality and how they can act to improve it. First, do agro dealers know
about the underlying quality of their mineral fertilizer; is information asymmetric in this market or
unobserved by both buyer and seller? Second, if farmers take observed quality as a signal of
unobserved quality and if these signals inform their WTP, why do traders continue to sell bad-
17 For example, in 2013, a major Tanzanian newspaper reported that the Tanzania Fertilizer Regulatory Authority (TFRA) had found adulterated fertilizer in six regions of Tanzania (Iringa, Mbeya, Morogoro, Njombe, Rukwa, and Ruvuma). After exposing the presence of substandard fertilizer, the Chief Executive Officer of TFRA stated “Most farmers can hardly tell genuine fertilizer from fake ones” and encouraged farmers to “carefully check the information on bags of fertilizer such as type, manufacturer’s address, nutrient contents, manufacturing date, expiration date, batch number, country of origin, and packaging weight” (Kitabu 2013).
27
looking mineral fertilizer? A trader with good-looking mineral fertilizer could expect to capture
significant market share from his or her local competitors with a reputation for (observable) high
quality products. One possibility is that the traders do not understand that farmers infer underlying
quality from observed. A second possibility is that they do understand the importance of visual
quality parameters to farmers (and results in Fairbairn et al. (2017) suggest the dealers themselves
take these observable quality characteristics as a signal of underlying quality) but are receiving
degraded quality mineral fertilizer from their own suppliers further up in the supply chain. If this is
the case, however, why don’t input dealers negotiate for better quality from their suppliers? A final
explanation is that the mineral fertilizer degrades in their possession through poor storage and
handling but the input dealer either does not associate storage conditions with observable quality or
does not consider that the additional expense required to improve quality is valuable for their
business. Nevertheless, each hypothesis suggests that an important area for future research is one
that delves further into understanding what agro-dealers know about fertilizer quality, how they
understand these issues (particularly for observable characteristics), and when they can recognize
problems within the supply chain.
Overall, variable input quality may partially explain the slow uptake of the use of mineral
fertilizer in Tanzania. In the long-term, uncertainty regarding fertilizer quality could have widespread
consequences for the functioning and growth of mineral fertilizer demand. Such problems could
hamper efforts to increase adoption of fertilizer as a means of raising regional agricultural
productivity and improving household and national food security. As a result, it is critical for policy
to understand not merely the determinants of quality and quality degradation but also how farmers
are assessing mineral fertilizer quality, what attributes they care about, and how they decide whether
a purchase has those attributes. Increasing small farmer use of mineral fertilizer and hybrid seeds is
key to improving regional agricultural productivity and raising incomes and food security but use of

28
these inputs remains relatively low. Our results suggest variable quality – both observable and
unobservable – is an important missing piece of the puzzle.
29
References:
Akerlof, G.A. (1970). “The Market for ‘Lemons’: Quality Uncertainty and the Market Mechanism.” The Quarterly Journal of Economics. 84 (3): 488-500.
Ashour, M., Billings, L., Gilligan, D.O., & Karachiwalla (2015). Evaluation of the Impact of E-
verification Counterfeit Agricultural Inputs and Technology Adoption in Uganda: Baseline Report. Washington, DC: International Food Policy Research Institute.
Benson, T., Kirama, S.L., & Selejio, O. (2012). The Supply of Inorganic Fertilizers to Smallholder
Farmers in Tanzania. IFPRI Discussion Paper No. 1230. Washington, D.C.: International Food Policy Research Institute (IFPRI). Retrieved March 3, 2015 from http://ebrary.ifpri.org/cdm/ref/collection/p15738coll2/id/127306
Binswanger, H. P., & Sillers, D. A. (1983). Risk Aversion and Credit Constraints in
Farmers' Decision-Making: A Reinterpretation. Journal of Development Studies, 20(1), 5.
Bold, T., Kaizzi, K., Svensson, J., & Yanagizawa-Drott, D. (2015). Low quality, Low Returns, Low
Adoption: Evidence from the Market for Fertilizer and Hybrid Seed in Uganda. Faculty Research Working Paper Series No. RWP15-033. Retrieved January 11, 2016, from https://research.hks.harvard.edu/publications/workingpapers/citation.aspx?PubId=9765&t ype=FN&PersonId=256
Croppenstedt, A., Demeke, M., & Meschi, M. (2003). Technology Adoption in the Presence of
Constraints: the Case of Fertilizer Demand in Ethiopia. Review of Development Economics, 7(1), 58-70.
Duflo, E., Kremer, M., & Robinson, J. (2011). Nudging Farmers to Use Fertilizer: Theory
and Experimental Evidence from Kenya. American Economic Review, 101(6), 2350-2390. doi:10.1257/aer.101.6.2350
Fairbairn, A., Michelson, H., Ellison, B., & Manyong, V. (2016). Mineral Fertilizer Quality:
Implications for Markets and Small Farmers in Tanzania. Working paper prepared for 2016 AAEA Annual Meeting, Boston, MA, August 2016. Retrieved from http://purl.umn.edu/236818
Jauregui, M. & Sain, G. (1992). Continuous Analysis of Crop Response to Fertilizer in On-Farm
Research. CIMMYT Economics Paper. Retrieved October 21, 2016 from http://libcatalog.cimmyt.org/download/cim/37542.pdf
Kitabu, G. (2013, August 7). Fake fertilizer fills shops-regular. IPP Media. Retrieved June 3, 2015,
from http://www.ippmedia.com/frontend/?l=57912 Lugongo, B. (2014, May 9). New law to protect public from fake fertilizers. Retrieved March 3,
2015, from http://www.thecitizen.co.tz/News/national/New-law-to-protect-public-from- fake-fertilizers/-/1840392/2308462/-/asc4rwz/-/index.html
30
Mather, D., Waized, B., Ndyetabula, D., Temua, A., & Minde, I. (2016). The profitability of inorganic fertilizer use in smallholder maize production in Tanzania: Implications for alternative strategies to improve smallholder maize productivity. GISAIA Tanzania Working Paper #4. Retrieved November 3, 2016 from http://fsg.afre.msu.edu/gisaia/Tanzania/TZ_smallholde_profitability_of_fertilizer_use_finalWP.pdf
Rutland, D. & Polo, J. (2015). Fertilizer Dealer Handbook: Products, Storage, and
Handling. Retrieved December 1, 2016 from https://ifdcorg.files.wordpress.com/2015/01/r-15fertilizer_dealer_handbook.pdf
Sanabria, J., Dimithe, G., Alognikou, E. (2013) The Quality of Fertilizer Traded in West Africa:
Evidence for Stronger Control. IFDC. Retrieved August 1, 2015 from https://ifdcorg.files.wordpress.com/2015/01/sp42.pdf
Sanchez, P. (2002, January 1). Soil Fertility and Hunger in Africa. Science, 2019-
2020. Snapp, S., Jayne, T., Mhango, W., Benson, T., Ricker-Gilbert, J. (2014). Maize
Yield Response to Nitrogen in Malawi’s Smallholder Production Systems. Retrieved October 1, 2016 from http://fsg.afre.msu.edu/gisaia/masspwp9_Snapp_et_al_2014.pdf
Tanzania Fertilizer Assessment. (2012, June 1). Retrieved November 12, 2014,
from http://www.ifdc.org/r-d/research/tanzania-fertilizer-assessment Yara (2012). The Yara Guide to Mineral Fertilizers. Retrieved November 3, 2015 from
http://www.yara.co.uk/crop-nutrition/knowledge/literature/yara-guide-to-mineral-fertilizers/
31
Figure 1. Urea Nitrogen Content
32
Figure 2. DAP Nitrogen Content
33
Figure 3. CAN Nitrogen Content
34
Figure 4. Standardized Nitrogen & Moisture Content Deviation
35
Figure 5: Standardized Nitrogen & Moisture Content Deviation, Agro-dealers & Farmers
36
Figure 6: Pre- and Post-Information Comparison of Mean Willingness to Pay*
*Note: the standard deviations are represented by brackets.
0.69
0.280.23
1.02
0.67
0.56
0.00
0.20
0.40
0.60
0.80
1.00
1.20
Sample A Sample B Sample C
Mea
n W
illin
gnes
s to
Pay
(USD
)
Fertilizer Sample
Pre-Information
Post-Information
Mean 1kg Urea Price 2015-2016 (USD)
37
Table 1. Distribution of Fertilizer Samples by Type
Agro-dealers Farmers
Urea 302 127
DAP 138 55
CAN 196 5
38
Table 2. Measured Nitrogen and Moisture Content & Industry Standards by Fertilizer
Type
Nitrogen Content
(Minimum %)
Mean Nitroge
n Content
(%)
Mean Deviation
from Nitrogen Standard
(%)
Moisture Content
(Maximum %)
Mean Moistur
e Content
(%)
Mean Deviation
from Moisture Standard
(%)
Urea 46 41.30 (3.90)
-10.30 (0.08) 1 0.27
(0.40) 0.03
(0.22)
DAP 18 16.86 (1.28)
-6.31 (0.07) 1.5 1.28
(1.14) 0.16
(0.66)
CAN 26 24.72
(2.18) -6.72 (0.05) 1 0.94
(0.88) 0.23
(0.75)
39
Table 3. Prevalence of Poor Visual Characteristics of Fertilizer Samples
Farmers
(%) Agro-dealers
(%)
Presence of clumps/caking 15.30 27.84
Discolored 6.01 10.38
Presence of foreign material 9.29 4.78
Presence of powdered granules 7.65 7.91
n 187 636
40
Table 4. Personal Experience and Fertilizer Quality Concerns
Ever had mineral fertilizer with this
problem? (%)
Ever known someone who has had mineral
fertilizer with this problem? (%)
Mineral fertilizer can be adulterated 13.94 21.21
Mineral fertilizer can be expired 29.70 56.97
Mineral fertilizer can have a nutrient content that is different from what is advertised
20.00 37.58
Mineral fertilizer can be caked and clumpy from moisture 55.15 82.42
n 164 164
41
Table 5. Market Level Fertilizer Quality Concerns
How big of a concern is this issue for you?
It’s a problem and affects more than
half of the fertilizer in the market (%)
It’s a problem, but affects less than
half of the fertilizer in the market (%)
It’s not a problem (%)
Mineral fertilizer can be adulterated 17.58 18.18 64.24
Mineral fertilizer can be expired 29.99 40.61 30.30
Mineral fertilizer can have a nutrient content that is different from what is advertised
14.54 28.48 56.97
Mineral fertilizer can be caked and clumpy from moisture 58.18 26.67 15.15
42
Table 6. Relationship between Measured and Observed Characteristics (1) (2) (3) (4)
Standardized Nitrogen Content
Standardized Nitrogen Content
Standardized Moisture Content
Standardized Moisture Content
DAP 0.03*** 0.03*** 0.11*** 0.11***
(0.01) (0.01) (0.04) (0.04)
CAN 0.04*** 0.02*** 0.14*** 0.18***
(0.01) (0.01) (0.04) (0.04)
Number of Clumps 0.00* 0.00 -0.01 -0.00
(0.00) (0.00) (0.01) (0.01)
DAP*Number of Clumps 0.00 0.00 0.11*** 0.10**
(0.01) (0.01) (0.04) (0.04)
CAN*Number of Clumps -0.00 -0.00 0.07*** 0.06**
(0.00) (0.00) (0.03) (0.02)
Presence of Powder -0.03** -0.02 0.32*** 0.29***
(0.01) (0.01) (0.08) (0.07)
DAP*Presence of Powder 0.07 0.05 1.00** 1.08***
(0.07) (0.07) (0.42) (0.42)
CAN*Presence of Powder 0.00 -0.01 -0.15 -0.12
(0.02) (0.02) (0.12) (0.12)
Discolored -0.07*** -0.06*** 0.19* 0.13
(0.02) (0.02) (0.10) (0.10)
DAP*Discolored 0.06*** 0.03 -0.22 -0.11
(0.02) (0.02) (0.13) (0.13)
CAN*Discolored 0.09*** 0.08*** -0.26* -0.20
(0.02) (0.02) (0.14) (0.14)
Presence of Foreign Materials -0.01 -0.01 -0.04 -0.04
(0.01) (0.01) (0.07) (0.07)
DAP*Presence of Foreign Materials 0.03 0.04 0.19 0.14
(0.03) (0.03) (0.19) (0.19)
CAN*Presence of Foreign Materials 0.02 0.02 -0.15 -0.14
(0.04) (0.04) (0.25) (0.25)
Farmer Sample
-0.04***
0.16***
(0.01)
(0.04)
Constant (Urea) -0.10*** -0.09*** 0.01 -0.04
(0.00) (0.00) (0.02) (0.03)
Observations 790 790 790 790 R-squared 0.09 0.15 0.09 0.11 Standard errors in parentheses
*** p<0.01, ** p<0.05, * p<0.1
43
Table 7. Variation in Quality Assessments, by Sample
Sample A
(%) Sample B
(%) Sample C
(%)
Pre-Info Post-Info Pre-Info Post-Info Pre-Info Post-Info
Very Low Quality 1.21 0.00 1.82 4.24 19.51 7.27 Low Quality 10.91 0.61 55.55 2.42 50.00 3.64 High Quality 33.94 25.45 39.39 64.85 26.22 69.09 Very High Quality 53.94 73.94 4.24 28.48 4.27 20.00
44
Table 8. Agreement in Physical Inferences, by Sample
Adulterated Sample A
(%) Sample B
(%) Sample C
(%) Total (%)
Extremely Disagree 40 17.58 22.42 26.67 Disagree 55.15 56.97 53.33 55.15
Agree 4.85 23.64 16.97 15.15 Extremely Agree 0 1.82 7.27 3.03
Total 100 100 100 100
Low Nutrient Content Sample A
(%) Sample B
(%) Sample C
(%) Total (%)
Extremely Disagree 15.15 2.42 2.42 6.67 Disagree 73.33 30.3 35.15 46.26
Agree 11.52 66.06 52.73 43.43 Extremely Agree 0 1.21 9.7 3.64
Total 100 100 100 100
Expired Sample A
(%) Sample B
(%) Sample C
(%) Total (%)
Extremely Disagree 38.79 3.64 3.64 15.35
Disagree 53.33 34.55 39.39 42.42 Agree 7.88 55.76 39.39 34.34
Extremely Agree 0 6.06 17.58 7.88 Total 100 100 100 100
Easy to Apply Sample A
(%) Sample B
(%) Sample C
(%) Total (%)
Extremely Disagree 0.61 2.42 15.76 6.26
Disagree 9.7 60 52.12 40.61 Agree 36.97 32.12 24.24 31.11
Extremely Agree 52.73 5.45 7.88 22.02 Total 100 100 100 100
45
Table 9. Physical Inferences Correlation Matrix
Adulterated
Low Nutrient Content Expired Easy to Apply
Adulterated 1 Low Nutrient Content 0.2702 1
Expired 0.2766 0.8461 1 Easy to Apply -0.3448 -0.8065 -0.7991 1

46
Table 10. Effect of Assessed Observable Characteristics on Quality Rating (1) (2) (3)
Quality Quality Quality
Sample B -0.28* -0.16 -0.32**
(0.17) (0.12) (0.14)
Sample C -0.57*** -0.42*** -0.56***
(0.15) (0.11) (0.13)
Adulterated -0.22*** -0.12* -0.16**
(0.08) (0.07) (0.08)
Sample B*Adulterated 0.11 0.04 0.05
(0.10) (0.08) (0.10)
Sample C*Adulterated 0.10 0.10 0.01
(0.09) (0.08) (0.09)
Low Nutrient Content -0.72***
(0.08)
Sample B*Low Nutrient Content -0.12
(0.11)
Sample C*Low Nutrient Content -0.10
(0.10)
Difficult to Apply
-0.74***
(0.06)
Sample B*Difficult to Apply
-0.01
(0.08)
Sample C*Difficult to Apply
-0.01
(0.07)
Expired
-0.67***
(0.08)
Sample B*Expired
0.02
(0.10)
Sample C*Expired
0.03
(0.09)
Constant (Sample A) 3.24*** 2.91*** 2.98***
(0.09) (0.06) (0.07)
Observations 494 494 494 R-squared 0.67 0.74 0.65 Standard errors in parentheses
*** p<0.01, ** p<0.05, * p<0.1
47
Table 11. Effect of Assessed Observable Characteristics on Willingness to Pay (1) (2) (3)
WTP (USD) WTP (USD) WTP (USD)
Sample B 0.05 0.09 0.03
(0.09) (0.07) (0.08)
Sample C -0.14 -0.06 -0.10
(0.08) (0.06) (0.08)
Adulterated -0.12*** -0.11** -0.14***
(0.04) (0.04) (0.05)
Sample B*Adulterated 0.10* 0.10** 0.12**
(0.05) (0.05) (0.06)
Sample C*Adulterated 0.08 0.11** 0.09
(0.05) (0.05) (0.05)
Low Nutrient Content -0.29***
(0.05)
Sample B*Low Nutrient Content -0.18***
(0.06)
Sample C*Low Nutrient Content -0.07
(0.06)
Difficult to Apply
-0.25***
(0.03)
Sample B*Difficult to Apply
-0.19***
(0.05)
Sample C*Difficult to Apply
-0.10**
(0.04)
Expired
-0.19***
(0.04)
Sample B*Expired
-0.19***
(0.06)
Sample C*Expired
-0.11**
(0.05)
Constant (Sample A) 1.05*** 0.90*** 0.90***
(0.05) (0.03) (0.04)
Observations 494 494 494 R-squared 0.53 0.59 0.49 Standard errors in parentheses
*** p<0.01, ** p<0.05, * p<0.1
48
Table 12. Effects of Information on WTP (USD)
(1) WTP
(2) WTP
(3) WTP
Sample B (clumps) -0.39*** (0.04)
-0.39*** (0.04)
-0.39*** (0.04)
Sample C (adulterated) -0.45*** (0.04)
-0.45*** (0.04)
-0.45*** (0.04)
Post-Information 0.32*** (0.03)
0.32*** (0.03)
0.32*** (0.04)
Post-Information, Sample B 0.07* (0.04)
0.07* (0.04)
0.07 (0.05)
Post-Information, Sample C 0.01 (0.04)
0.01 (0.04)
0.00 (0.05)
Controls1 No Yes -
Fixed Effects No No Yes
R-squared 0.29 0.31 0.29
n 989 989 989
Standard errors in parentheses *** p<0.01, ** p<0.05, * p<0.1 1Controls include: gender, age, level of education, years of farming experience, amount of land owned
49
Table 13: Relationship of Mineral Fertilizer from Open Bags and Clumps, Nitrogen Content (1) (2)
Number of Clumps
Standardized Nitrogen Content
DAP -0.38 0.04***
(0.30) (0.01)
CAN -0.77 0.06**
(0.50) (0.02)
Open Bag 0.31 -0.00
(0.20) (0.01)
DAP*Open Bag -0.38 -0.01
(0.33) (0.02)
CAN*Open Bag 0.06 -0.03
(0.52) (0.02)
Gift -0.16 -0.05*** (0.38) (0.02) Farmer Samples -0.37** -0.04***
(0.16) (0.01)
Constant 0.81*** -0.09***
(0.20) (0.01)
Observations 784 817 R-squared 0.07 0.13 Standard errors in parentheses
*** p<0.01, ** p<0.05, * p<0.1
50
Table 14. Relationship of Nitrogen Content and Price (1)
Standardized Nitrogen Content
Price per kilogram (USD) -0.01
(0.02)
DAP 0.11***
(0.02)
CAN 0.07**
(0.03)
DAP*Price per kilogram -0.09***
(0.03)
CAN*Price per kilogram -0.07*
(0.04)
Gift -0.09***
(0.02)
Farmer Samples -0.04***
(0.01)
Constant -0.08***
(0.01)
Observations 818 R-squared 0.14 Standard errors in parentheses
*** p<0.01, ** p<0.05, * p<0.1
51
Table 15. Relationship between Price per Kilogram and Observed Characteristics (1)
Price per kilogram (USD)
DAP 0.12***
(0.02)
CAN -0.02
(0.02)
Number of Clumps 0.00
(0.00)
DAP*Number of Clumps 0.02
(0.02)
CAN*Number of Clumps -0.00
(0.01)
Presence of Powder 0.02
(0.03)
DAP*Presence of Powder -0.01
(0.16)
CAN*Presence of Powder 0.04
(0.05)
Discolored -0.00
(0.04)
DAP*Discolored 0.05
(0.05)
CAN*Discolored 0.00
(0.06)
Presence of Foreign Materials -0.03
(0.03)
DAP*Presence of Foreign Materials 0.06
(0.07)
CAN*Presence of Foreign Materials 0.01
(0.10)
Farmer Sample -0.17***
(0.01)
Constant (Urea) 0.69***
(0.01)
Observations 785 R-squared 0.25 Standard errors in parentheses
*** p<0.01, ** p<0.05, * p<0.1
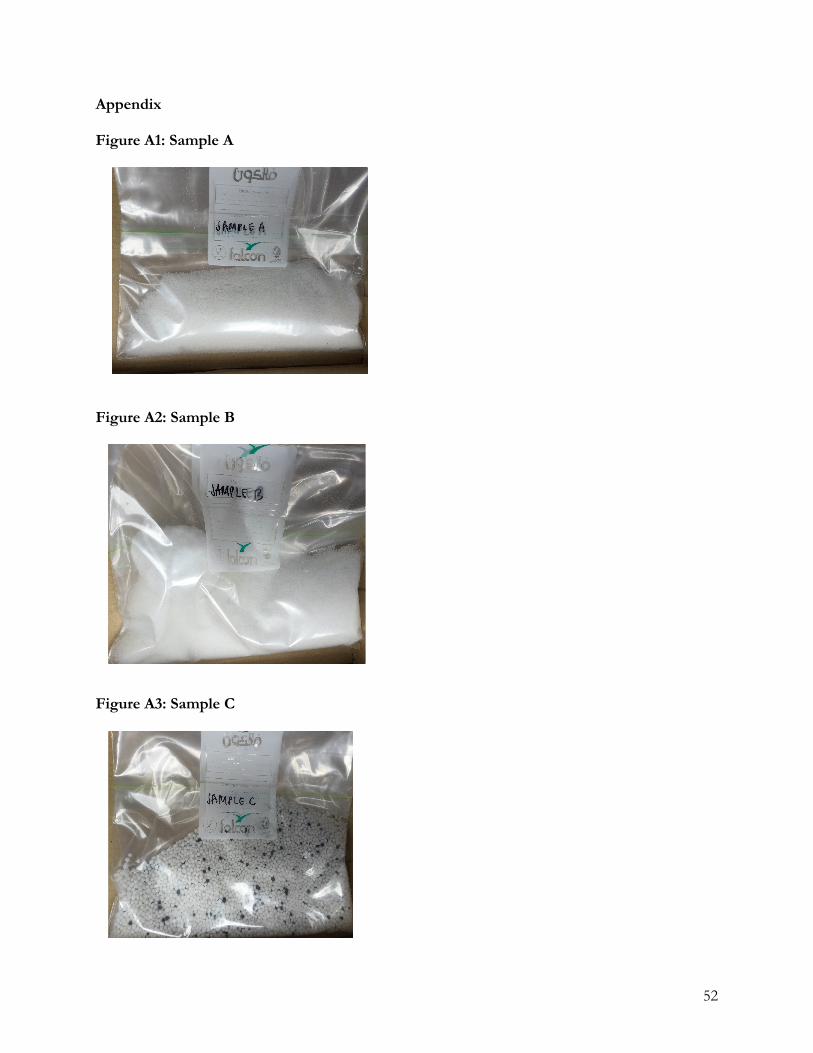
52
Appendix
Figure A1: Sample A
Figure A2: Sample B
Figure A3: Sample C
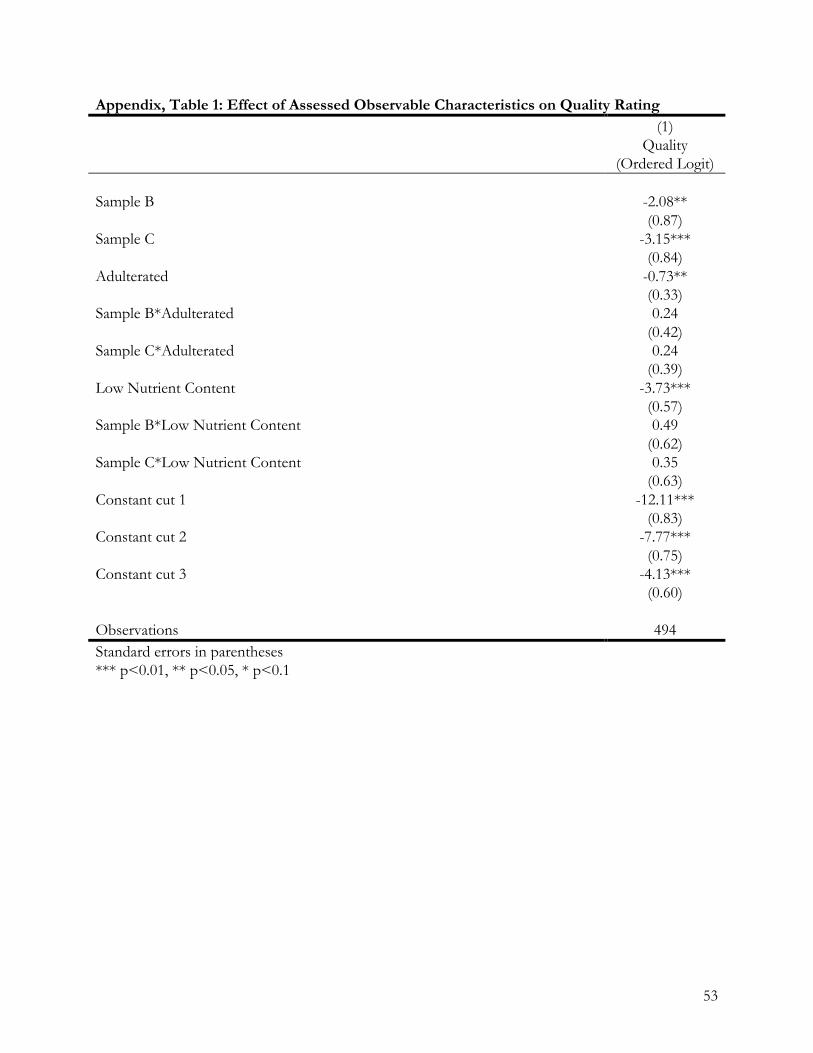
53
Appendix, Table 1: Effect of Assessed Observable Characteristics on Quality Rating (1) Quality
(Ordered Logit)
Sample B -2.08**
(0.87)
Sample C -3.15***
(0.84)
Adulterated -0.73**
(0.33)
Sample B*Adulterated 0.24
(0.42)
Sample C*Adulterated 0.24
(0.39)
Low Nutrient Content -3.73***
(0.57)
Sample B*Low Nutrient Content 0.49
(0.62)
Sample C*Low Nutrient Content 0.35
(0.63)
Constant cut 1 -12.11***
(0.83)
Constant cut 2 -7.77***
(0.75)
Constant cut 3 -4.13***
(0.60)
Observations 494 Standard errors in parentheses
*** p<0.01, ** p<0.05, * p<0.1
54
Survey details
IITA provided us with a list of agricultural extension officers and/or, in some cases, lead
farmers for 19 villages in Mvomero district. This list included extension agents working with IITA to
establish village-level field demonstration plots. Of the 19 villages that we had contact information
for, 14 were actively working with IITA and 10 had already established a farmer field school in
conjunction with IITA.
We implemented the following protocol to identify villages and farmers for the survey. First,
we made in-person visits to the offices of the agricultural extension officers. We visited 11
agricultural extension officers from IITA's list and four villages that were not on our original list. We
met with the extension officer and/or the lead farmer and discussed the needs of our work. The
research team reiterated the criteria for farmers to participate in the study: (1) The farmers needed to
have experience purchasing and applying mineral fertilizer, specifically experience with purchasing
and applying Urea, DAP, and CAN; (2) Farmers needed to possess Urea, DAP, and/or CAN at the
planned time of the survey; and (3) Farmers had to be willing to provide the research team with a
small (0.25 kg) sample of the Urea, DAP, and/or CAN in their possession. Regarding the third
criterion, agricultural extension officers and lead farmers were asked whether farmers could provide
us with an amount of fertilizer that you could hold in the palm of your hand or that would fill a
small cup used for tea.18
On the day of the survey, the research team arrived earlier than the agreed-upon time. This
ensured that the team would be able to observe the behavior of the extension officer, lead farmer, or
18 In all pre-survey communication, we indicated to the agricultural extension officers and lead farmers that participants would not be compensated for their fertilizer or for their time. We stressed this point because we wanted farmers to participate in the work because they wanted to volunteer themselves and not because they wanted compensation. The agricultural extension officer and/or the lead farmer were responsible for contacting farmers directly and recruiting farmers who met the participation criteria. In addition, we asked the agricultural extension officers to consider whether there were farmer groups or associations in the village. In this case, we asked that the agricultural extension officer should call upon one farmer to represent that particular group or association, rather than asking multiple members to participate.
55
other participants and to verify that none of the fertilizer samples had been divided or shared among
participants. In each village, the survey was conducted at the local village government office. As
participants arrived, the research field supervisor began a screening process of each of the
participants and their fertilizer. The field supervisor asked each of the participants a set of questions
about their fertilizer sample/s, including: (1) What type of fertilizer did you bring? (2) To which
crop/s did you apply this fertilizer? (3) Did you apply this fertilizer during the planting stage or the
cultivation stage? (4) Where did you buy this fertilizer? (5) What was the original amount of fertilizer
purchased? (6) How much did you pay for it?
Participants who were able to answer these questions easily and confidently were invited to
participate in the survey. Five participants were excluded from the survey as a result of the screening
process. The fertilizer samples brought by the participating farmers were collected, and the samples
were prepared and packed for laboratory testing immediately.19
Upon successful completion of the screening, participants provided their fertilizer sample/s
to members of the research team. The sample was assigned a unique identification code, a photo
was taken of the sample, and then the sample was packed in a plastic bag. Samples were then
double-packed in a second plastic bag for storage in plastic bins and transported to laboratories for
testing. Once all of the village participants completed the initial screening process and the fertilizer
samples were collected, the survey began. No additional participants were allowed to join the survey
once all of the fertilizer samples were collected. Upon completion of the survey, participants were
provided 5000 TSh ($2.29 USD as of 12/27/16). The payment was provided to compensate for the
19 In the case that participants were unable to answer the screening questions, they were excused from participating in the survey and their fertilizer sample was not collected. In the case that participants were able to answer some questions, but the field supervisor was unsure of whether the participant was being honest, the field supervisor asked the participant whether other members of the research team could accompany the participant to his/her home to see the remaining stock of fertilizer/s. If the research team was able to verify the stock of the fertilizer, the participant was invited to participate in the survey and the research team collected the fertilizer.
56
fertilizer that was offered to the research team and the amount of time spent participating in the
survey.20
Mineral fertilizer testing details
The Soil-Plant Diagnostics Spectral Lab at ICRAF in Nairobi, Kenya, conducted the nutrient
content testing for all of the samples of mineral fertilizer. ICRAF utilized two methods to determine
the nitrogen content: MIR & pXRF.
• assign ids unique to icraf • grind sample • dry sample in oven (?) • 10% of samples (do we have a specific number?) are measured for N content by combustion • Samples are scanned with MIR spectrometer (# of replications, protocol number used?, etc.) • With the combustion, US lab results, and spectra, we are able to arrive at C & N predictions
Samples are scanned with pXRF technology to (1) calibrate the technology, (2) predict remaining
elements, and (3) no approved protocol number as ICRAF is developing protocol/calibration
techniques with Rothamsted.
20 Note that the average 2015-2016 regional price of 1 kilogram of Urea fertilizer is 1605 TSh and we collected approximately 0.25 kilograms of mineral fertilizer from farmers; thus, the compensation provided to farmers ensured that participants were remunerated for the fertilizer they provided us, as well as for the time spent participating in the survey.