Embed Size (px)
Citation preview

Unpacking the implications of the
`Doing Business in South Africa 2015’ report
Roland HunterCities Support Programme
National Treasury

What does Doing Business measure?
Doing Business in South Africa 20152
Doing Business indicators:
Focus on regulations relevant to the life cycle of domestic SMEs.
Are built on standardized case scenarios.
Are focused on the formal sector.
Include rules and regulations at all levels of government
Capture local differences in regulations or enforcement
Provide information on good practices within the same country that
can be easily replicated
Provide a way for locations to tell their story and compete globally
Sub-national reports are available for 26 countries including
Mexico, Russia, Morocco, China, Egypt, Indonesia, Pakistan,
Kenya, India, Nigeria, etc.
DO NOT measure all aspects of the business environment such as
macroeconomic stability, corruption, level of labor skills, proximity to markets,
or of regulation specific to foreign investment or financial markets.

3
Measures administration of services and regulations that are important throughout the life cycle of SMEs

What does Doing Business in South Africa 2015 cover?
Six Indicators
• Starting a business
• Dealing with construction permits
• Registering property
• Getting electricity
• Enforcing contracts
• Trading across borders
4 Doing Business in South Africa 20154
Nine cities
• Buffalo City• Cape Town• Ekurhuleni
• eThekwini• Johannesburg• Mangaung
• Msunduzi• Nelson Mandela Bay• Tshwane
Four maritime ports
• Cape Town• Durban• Ngqura• Port Elizabeth

Results: Starting a businessStarting a business Ranking (1-9) DTF score (100 = best result) % difference from average
Ekurhuleni 1 81.2 2.1%
Tshwane 1 81.2 2.1%
Johannesburg 1 81.2 2.1%
AVERAGE 79.5 0.0%
Cape Town 4 78.7 -1.1%
eThekwini 4 78.7 -1.1%
Mangaung 4 78.7 -1.1%
Buffalo City 4 78.7 -1.1%
Msunduzi 4 78.7 -1.1%
Nelson Mandela Bay 4 78.7 -1.1%

Results: Dealing with construction permitsDealing with construction permits Ranking (1-9) DTF score (100 = best result) % difference from average
Cape Town 1 78.1 5.3%
Nelson Mandela Bay 2 78.1 5.3%
Buffalo City 3 77.5 4.5%
Ekurhuleni 4 76.8 3.6%
eThekwini 5 76.2 2.7%
AVERAGE 74.1 0.0%
Msunduzi 6 74.1 -0.1%
Tshwane 7 69.9 -5.8%
Johannesburg 8 68.5 -7.6%
Mangaung 9 68.2 -8.0%

Dealing with construction permits - detail
7
Rank DTF No of
procedures
Time (days) Cost (% of
warehouse
value)
% better than
average (time)
% better than
average (cost)
Cape Town 1 78.08 16 83 1.06% 25% -3%
Nelson Mandela Bay 2 78.05 15 88 1.60% 21% -56%
Buffalo City 3 77.50 16 88 1.13% 21% -10%
Ekurhuleni 4 76.84 16 98 0.95% 12% 7%
eThekwini 5 76.15 16 104 1.01% 6% 2%
Msunduzi 6 74.07 17 117 0.71% -6% 31%
Tshwane 7 69.88 16 169 1.03% -53% 0%
Johannesburg 8 68.71 19 141 1.06% -27% -3%
Mangaung 9 68.22 22 109 0.68% 2% 34%

Results: Registering property
Registering property Ranking (1-9) DTF score (100 = best result) % difference from average
Johannesburg 1 65.8 5.9%
Tshwane 2 64.7 4.1%
Ekurhuleni 3 64.2 3.3%
Buffalo City 4 62.8 1.1%
Nelson Mandela Bay 5 62.7 0.8%
AVERAGE 62.2 0.0%
eThekwini 6 62.1 -0.2%
Msunduzi 7 59.5 -4.3%
Cape Town 8 59.2 -4.7%
Mangaung 9 58.4 -6.0%

Registering property - detail
9
Rank DTF No of
procedures
Time (days) Cost (% of
property
value)
% better than
average (time)
% better than
average (cost)
Johannesburg 1 65.82 7 23 6.30% 29% 0%
Tshwane 2 64.71 7 30 6.30% 7% 0%
Ekurhuleni 3 64.23 7 33 6.30% -2% 0%
Buffalo City 4 62.84 8 24 6.32% 26% 0%
Nelson Mandela Bay 5 62.69 8 25 6.32% 22% 0%
eThekwini 6 62.05 8 29 6.32% 10% 0%
Msunduzi 7 59.49 8 45 6.32% -40% 0%
Cape Town 8 59.23 9 29 6.34% 10% 0%
Mangaung 9 58.41 8 52 6.30% -61% 0%

Results: Getting electricityGetting electricity Ranking (1-9) DTF score (100 = best result) % difference from average
Mangaung 1 83.9 20.0%
Cape Town 2 81.8 17.1%
eThekwini 3 75.7 8.4%
Buffalo City 4 75.3 7.8%
Ekurhuleni 5 71.8 2.8%
AVERAGE 69.9 0.0%
Tshwane 6 68.5 -2.0%
Msunduzi 7 63.0 -9.9%
Johannesburg 8 55.7 -20.2%
Nelson Mandela Bay 9 53.1 -24.0%

Getting electricity - detail
11
Rank DTF No of
procedures
Time (days) Cost (% of
income per
capita)
% better than
average (time)
% better than
average (cost)
Mangaung 1 83.90 4 80 383% 43% 19%
Cape Town 2 81.81 4 87 640% 38% -35%
eThekwini 3 75.73 5 98 380% 30% 20%
Buffalo City 4 75.32 6 66 257% 53% 46%
Ekurhuleni 5 71.83 6 90 259% 36% 45%
Tshwane 6 68.51 6 104 573% 26% -21%
Msunduzi 7 63.00 5 184 446% -31% 6%
Johannesburg 8 55.74 5 226 730% -60% -54%
Nelson Mandela Bay 9 53.14 5 333 588% -136% -24%

Results: Enforcing contractsEnforcing contracts Ranking (1-9) DTF score (100 = best result)
Mangaung 1 71.0 4.7%
Msunduzi 2 70.8 4.4%
eThekwini 3 69.3 2.1%
Ekurhuleni 6 68.3 0.6%
Tshwane 5 68.2 0.5%
AVERAGE 67.9 0.0%
Cape Town 6 67.5 -0.5%
Nelson Mandela Bay 7 66.9 -1.4%
Johannesburg 8 66.1 -2.5%
Buffalo City 9 62.5 -7.8%

Results: Aggregate of the five indicatorsAggregate of 5 indicators Ranking (1-9) DTF score (100 = best result) % difference from average
Cape Town 1 73.1 3.3%
Ekurhuleni 2 72.5 2.5%
eThekwini 3 72.4 2.3%
Mangaung 4 72.0 1.9%
Buffalo City 5 71.4 0.9%
AVERAGE 70.7 0.0%
Tshwane 6 70.5 -0.3%
Msunduzi 7 69.2 -2.1%
Nelson Mandela Bay 8 67.9 -4.0%
Johannesburg 9 67.5 -4.6%
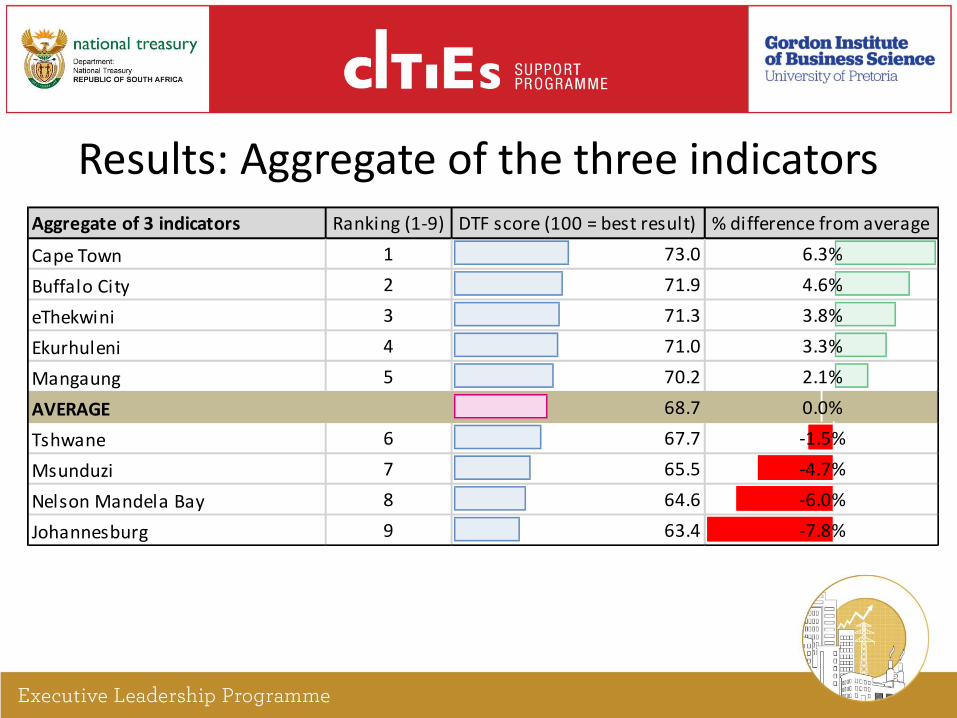
Results: Aggregate of the three indicatorsAggregate of 3 indicators Ranking (1-9) DTF score (100 = best result) % difference from average
Cape Town 1 73.0 6.3%
Buffalo City 2 71.9 4.6%
eThekwini 3 71.3 3.8%
Ekurhuleni 4 71.0 3.3%
Mangaung 5 70.2 2.1%
AVERAGE 68.7 0.0%
Tshwane 6 67.7 -1.5%
Msunduzi 7 65.5 -4.7%
Nelson Mandela Bay 8 64.6 -6.0%
Johannesburg 9 63.4 -7.8%

Units of government which need to be involved in improving process performance
Dealing with Construction Permits
• Department of Human Settlements
• Department of Labour
• Department of Rural Development and Land Reform (National Geo-spatial Information)
• Municipalities (Town Planning; Building Control; Building Inspectorate; GIS Department; Emergency Management; Water and Sanitation Department; Electricity Department)
Registering Property
• Department of Rural Development and Land Reform (Deeds Registries)
• Municipalities (Revenue Departments)
Enforcing contracts
• Department of Justice and Constitutional Development (Magistrates Courts)
Getting Electricity
• Department of Energy (National Electricity Regulator of South Africa)
• Eskom
• Municipalities (Electricity Departments)
Starting a Business
• Department of Trade and Industry (Companies and Intellectual Properties Commission)
• Department of Labour (Compensation Fund; Unemployment Insurance Fund)
• South African Revenue Service
Trading across borders
• South African Revenue Service
• Transnet (National Ports Authority; Port Terminals)
15

Next steps: City level
16
No. STEP CONTENT
1 • High level Presentations to City Mayoral Committees
• More detailed workshops with Focal Points & Technical SNDB Teams
• Review individual city level results in Doing Business SA 2015
• Identify key business regulatory reforms to undertake 2015-2017
• Prepare city-level action plans
2 • City-wide Indicator Peer Learning Events x 4
• Starting a Business, Dealing with Construction Permits, Getting Electricity, Registering Property
3 • City Reform Action Plans Presented to City Budget Forum (November 2016)
4 • Cities Reform progress reports to City Budget Forum (November 2016)
5 • Doing Business SA 2018 survey Technical work begins (March 2017) follow up survey of performance


![[PPT]“Unpacking the Standards” - Griffin Middle Schoolgriffinmiddleschool.typepad.com/files/unpacking-the... · Web view“Unpacking the Standards” Last modified by install](https://img.pdfslide.net/doc/110x75/5b1bbcd97f8b9a28258ee047/pptunpacking-the-standards-griffin-middle-schoo-web-viewunpacking.jpg)