Embed Size (px)
Citation preview
This conference paper has not been peer reviewed. Any opinions stated herein are those of the author(s) and are not necessarily endorsed by or representative of IFPRI or of the cosponsoring or supporting organizations.
Unpacking the Meaning of “Market Access” in Rural Kenya
Jordan Chamberlin & Thomas S. Jayne
1. Introduction
There is widespread agreement that smallholder farmers require improved access to agricultural markets to raise their farm productivity and living standards. The prevailing policy narratives on market access in sub-Saharan Africa may be characterized by two major features. First, a majority of rural smallholders operate under dismal market access conditions, with generally high levels of remoteness and associated high marketing costs and risks, and poor access to information and supporting services. Furthermore, these poor access environments have for the most part been either stagnant or worsening in recent decades: many remote areas have not experienced significant infrastructural changes since independence, and the private sector has generally not filled the void left by the withdrawal of governmental supply of public assets under market liberalization programs. A second feature of the dominant narrative is a generality in both the conceptualization and empirical measurement of market access. The importance of access for agricultural development is readily accepted at the level of stylized fact, as are the general mechanisms of impacts: smallholders in remote areas face higher input costs, lower output prices, fewer buyers competing for their surplus production, and weak access to supporting services, which together result in disincentives to adopt new technologies and produce for the market. These reinforcing market access problems contribute to stagnant productivity growth and mire millions of rural farm households in chronic poverty. In practice, however, indicators of market access seem to be selected on an ad hoc basis, with indicator choice varying widely across studies and rarely discussed in terms of specific marketing channels, explicit transactions costs, or price formation processes.
We suggest that these features of the prevailing discourse may be linked. An under-conceptualization of market access (and ways to represent its multiple aspects) may be associated in part with a highly generalized portrayal of African smallholders challenged by persistently poor access situations. Excessive bundling of assumptions about market access into simple indicators is likely to mask important variation in the modes and costs of access for different input and output marketing chains. The purpose of this paper is to “unpack” the dimensions of market access and, in the process, to investigate changes that have been taking place across a variety of access indicators in a sub-Saharan African rural economy. To achieve this objective, we take advantage of panel survey data on 1,233 farm households in Kenya to explore multi-indicator access changes during the post-liberalization decade spanning 1997-2010.
Our work shows that market access conditions experienced by rural Kenyans exhibits a surprising degree of variation, across time, space and indicator type. The levels of some access indicators are remarkably high, even in areas which alternative indicators would suggest are remote. Additionally, significant improvements have taken place in the post-liberalization decade, although varying somewhat across indicator types.
We use these empirical observations to anchor a broader discussion of market access measurement. The low degree of correlation between alternative indicators in our study, and the fact that these correlations vary widely over time and space, suggest that the choice of indicator has major

2
consequences for analysis. A weakly conceptualized role of access in theoretical models may lead to indicator choices which are un-representative of the processes of interest. The consequences of such choices may be profound: poorly selected variables may result in econometric specification problems, specious analytical conclusions, and misguided implications for policy action. Given our case study findings, we suggest ways in which structured hypothesizing and sensitivity analysis may strengthen empirical treatments of market access issues in other contexts.
The remainder of the paper is organized as follows. The next two sections review the dimensions of market access in the development economics literature, acknowledging the conceptual underpinnings, and examining variables used in empirical analysis of small farm behavior and rural development. Section 4 describes the Kenyan household panel data that we use to explore the relationships between access indicators and trends in these indicators over time, which are then presented in the fifth section. We conclude with some comments about the implications of these relationships for empirical analyses involving market access variables.
2. Theoretical perspectives on market access
A stylized fact of rural development is that remote places are poorer, less productive and less integrated with input and output markets. Physical access has been the principal defining characteristic of remoteness, captured largely if not exclusively through the physical mediation of roads, along with the costs of transportation, travel time to urban markets, and other transactions costs (TCs) implied. Poor access has been identified as an important explanatory factor for persistent underdevelopment in Sub-Saharan Africa, from explicitly theorized microeconomic studies to more generalized perspectives on the costs and consequences of remoteness. Prioritizing a microeconomic view, we briefly review the key conceptual bases for this notion, then lay out some generic issues with empirical measurement, and finally review indicators and analytical results from the literature.
Conceptual foundations
von Thünen’s incorporation of transportation costs into spatial patterns of comparative advantage for market-oriented production (1826) was perhaps the earliest full expression of the idea of economic space. His essential insight was that market prices, relative to production costs, implicitly define a rent value for land. Because of the costs associated with physical transportation of goods between locations of production and exchange, the effective market price decays with physical distance, ultimately defining a threshold beyond which production is not economically feasible (i.e. the point at which location rent is zero). Furthermore, because market prices vary across commodities, at any given location, the production of some commodities will capture a higher location rent than alternative production choices. This effectively results in land uses (tied to production choices) being a function of market access. In other words, abstracting from the specifics of production endowments and issues such as perishability, von Thünen showed that market-oriented rural economic activity is fundamentally conditioned by physical market access. In what might be thought of as a generalized extension of this idea – that market exchange itself has costs – new institutional economics formalized the notion of transaction costs (TCs) as a major conditioner of interactions, influencing not only production and exchange decisions, but also institutional norms and organizational forms (North 1990). Much of the emphasis of this work has been on non-physical coordination costs (e.g. contract enforcement), although most of the essential insights apply equally to place-bound transportation, communication and other costs. de Janvry et al. (1991) proposed idiosyncratic variation in TCs to explain the failure of rational farmers to engage in markets: costs of accessing markets can drive an effective wedge between
3
input and output prices at the farmgate, rending participation non-economic. Because such costs vary both spatially and aspatially, and in a multitude of ways, they are not always readily perceived. An important corollary of this is the observation that transaction costs must be understood from the perspective of a given set of actors in order to be meaningful. Note that even the same actors may use quite different marketing channels for different goods, each of which may have a distinct set of transactions costs and separate processes of price formation.
Furthermore, transaction costs components may be usefully differentiated. Key et al. (2000) distinguished between fixed and variable transactions costs, showing that the decision of whether or not to participate in a market is a function of both, while the decision of how much to trade, conditional on the participation decision, is a function of variable transactions costs only. The implication of this, together with the notion of idiosyncratic wedges, is that, if access is most usefully understood in terms of transactions costs, different indicators of access may mean quite different things for different economic actors and the (multiple) marketing processes they are involved in.
The spatial expression of these costs is important. Available evidence indicates that rural marketing TCs in developing countries are often dominated by transportation costs, e.g. Fafchamps and Gabre-Madhin’s (2001) study of agricultural traders in Benin and Malawi. Such costs involve the costs of transporting commodities as well as trader travel. To the extent that such costs are central components of TCs and that they play out over space in logical ways (e.g. may be expressed as cost per kilogram per kilometer or something similar), physical distance indicators may serve as useful – if partial – proxies for the TCs involved in effective input and output price formation at the farm gate.
Broader views of remoteness and rural infrastructure
In contrast to the specificity of the perspectives above (which heavily emphasize variable transportation costs), is the notion that remoteness in a more general sense matters a great deal for development choices and outcomes. Despite some empirical ambiguity (which we explore further below), the conceptual importance of remoteness and/or poor infrastructure as an exogenous conditioner of a variety of outcomes has resulted in persistent inclusion of a wide variety of access indicators in rural development studies. Many studies, for example, have used aggregate data to link infrastructure investment levels with indicators of smallholder productivity growth and related outcomes (e.g., Fan and Zhang 2004). While the idea of cumulative transactions costs remains important in conceptual exegeses, multiple and diffuse channels of impact may be traced. Pinstrup-Anderson and Shinokawa (2006), for example, sketch several channels by which rural infrastructure impacts productivity and, ultimately, production and market decisions (Figure 1).
There is ample evidence of the importance of multiple pathways by which “access” affects rural development outcomes, both directly and indirectly. Improvements in rural road networks have been linked with higher agricultural wages and crop production in Bangladesh (Khandker et al., 2006), increased food availability, school completion rates and agricultural wages in Vietnam (Mu and van de Walle, 2007), and expanded non-agricultural opportunities in Peru (Escobal and Ponce, 2002). Escobal (2005) found a positive association between road infrastructure and a variety of household health and education indicators in rural Peru. Jacoby (2000) found evidence of a negative relationship between distance to markets and land values in rural Nepal. de Janvry and Sadoulet (2001) and Escobal (2001) found positive relationship between rural road indicators and farm and non-farm employment. Proximity to urban centers has been positively correlated with specialization of production and labor (Fafchamps and Shilpi 2003) and with patterns of child education and labor in Nepal (Fafchamps and

4
Wahba 2005), and with collective action and social capital formation in the Philippines (Godquin and Quisumbing 2005). Escobal and Torero (2005) find that household welfare outcomes in rural Peru are associated with access to primary and secondary schools (which they characterize as human capital generating public services) and access to telephones (which they suggest captures important dimensions of access to information) as well as access to roads. Furthermore, they document positive interaction effects: access to multiple services had an additionally positive impact on outcomes, what Escobal and Torero refer to as public asset complementarities.
Figure 1: “How Infrastructure Promotes Agricultural Development”
Source: adapted from Pinstrup-Anderson and Shinokawa 2006
de Janvry et al.’s (1999) work on transactions costs also recognized multi-dimensionality: “the poorer the infrastructure, the less competitive the marketing systems, the less information is available, and the more risky the transactions, the greater the size of [the gap between buying and selling price of a given commodity]” (p. 1204). This multidimensionality is at the heart of the spatial poverty trap literature, in which such traps occur where “geographic capital” -- which may be local biophysical production endowments, supply of public goods and infrastructure or the endowment of local private goods -- is lower or less efficient than elsewhere (Jalan and Ravallion 2002). Where geographic capital conditions the marginal productivity of private assets, it directly affects aggregate productivity and welfare outcomes. In addition to reducing transactions costs, improved access to infrastructure and services may raise the value of household assets (such as land or human capital).
In a recent paper, Stifel and Minten (2008) evaluate the impact of remoteness in rural Madagascar on food crop productivity (and, by implication, on output market participation and poverty). They find a strong negative relationship between remoteness and yields, controlling for land quality and other factors. Their use of road-based travel time and cost to define remoteness is consistent with other access studies over the last two decades. Unlike many other studies, they offer a fairly detailed
5
conceptualization of what remoteness entails: with respect to productivity, they identify remoteness in terms of increasing transportation-induced transactions costs, increasing price risk and, for Madagascar in particular, decreasing plot size and increasing insecurity. This represents a more explicit conceptual treatment of what remoteness means, as well as a move toward the spatialization of productivity determinants previously treated aspatially. However, a discussion of empirical indicator selection alternatives is still absent. Related to this, we believe, is the fact that market access is still very often proxied by a single variable without reference to either (a) whether or not there are other and/or multiple dimensions of access that are important to the question being investigated, (b) whether the access indicator being used is the correct one; or (c) whether the correlation between alternative indicators is high enough that one indicator should adequately proxy for other more conceptually appropriate indicators.
3. Empirical measurement of market access
Despite agreement about the theoretical importance of market access, empirical evidence concerning its impacts is sometimes ambiguous. For example, Pender et al. (1999) found access to roads to have no significant impact on either profitability or productivity in the northern highlands of Ethiopia, contrasting with theoretical perspectives and local expert opinion. In another study, Pender et al. (2001) found, based on analysis of community survey data for the highlands of Tigray and Amhara regions, that better access to towns was associated with cereals-perennial production as a livelihood strategy and with better outcomes in terms of several welfare and natural resource indicators, while access to all-weather roads was found to have less significant impacts. Using the same community survey data from Tigray, Kruseman et al. (2006) conducted a factor analysis of several market access variables (distance and travel times to towns, all weather roads and bus service), and found all of these variables to be highly correlated with a single market access factor. This factor was found to be associated with significantly more production of teff (the most important cash crop in the region), less production of relatively subsistence-oriented sorghum, less ownership of livestock, but a higher indicator of household wealth (proportion of houses with metal roofs). Using household-level survey data from Tigray, Pender and Gebremedhin (2006) found that access to roads and towns had significant impacts on several agricultural practices (e.g., increasing use of labor, oxen and fertilizer) and that access to towns was associated with higher crop productivity, but that neither factor was significantly associated with differences in household income. Using similar household data for Amhara, Benin (2006) found market and road access to be associated with some differences in input use and land management practices, that these impacts were different in high vs. low rainfall areas of the region, and that crop yields were higher further from roads in high potential areas and not significant elsewhere. Thus, while market and road access, based on the ways in which they were defined, are often found to have positive impacts, this is not always the case.
The multiplicity of ways in which market access can be conceptualized and translated into measurable variables may be a factor in this empirical ambiguity. Even within the same geographic area, indicators vary widely. Studies in the Ethiopian highlands, for example, include the distance or walking time to the nearest district administrative seat (“woreda town”), “market town” (which may be different than the woreda town), all-weather road, seasonal road, bus service, development agent, input supply shop, or grain mill; whether access to a road had improved in the recent past; whether an all-weather road passes through the woreda; and road density in the woreda. Access indicators used in similar explanatory frameworks elsewhere have included: whether or not a road passes through a local district capital (Pender et al., 1999), district road density (von Oppen et al., 1999), and dummy variables for
6
“road access” (Dercon et al., 2007) or “distant” markets (Alene et al., 2008). In practice, there is considerable ambiguity about what constitutes a “market”; in some cases this is further refined as “nearest” wholesale or retail market, “usual” market, “local” market, “urban” market. etc.; in other cases, it is not defined. In any case, the specification is fundamentally subjective. (Proximity defined in relation to nearest “urban area” is usually similarly vague.) Furthermore, a single indicator is often used for multiple commodities and for both input and output markets, although others have noticed that multiple market locations may be relevant to a household (Wood 2007).
Distance to market is frequently argued as being a meaningful proxy of access to buyers, services, or the degree of non-competitive behavior that a farmer may face. Yet on this point as well, the assumed relationship is tenuous at best. The conceptual relationship between distance and market structure is conditioned by a multitude of factors, and because of data limitations, the validity of this implied relationship is seldom tested. We present evidence below from two independent samples of Kenyan maize farmers to show that the number of traders buying grain directly in the village in the most recent marketing year is roughly the same in villages regarded as relatively accessible vs. remote on the basis of distance to nearest district market. Hence it may not be too surprising that empirical findings on the impacts of conventional market access indicators tend to vary widely.1
4. Data
To investigate changes in farm households’ access to markets and services in Kenya, we used household data from a nationally representative panel survey collected by the Tegemeo Institute of Egerton University. Detailed plot and farm data was collected from 1,233 agricultural households interviewed in 1997, 2000, 2004, 2007 and 2010. The balanced panel survey contains information on household production, marketing activities, and a variety of self-reported indicators of access to markets, related infrastructure and services.
In addition to the nationwide household panel survey data, this study also draws from a separate survey and set of focus group discussions undertaken by Tegemeo Institute, ACDI/VOCA, and Moi University in June 2009. The survey was specifically designed to understand the marketing constraints faced by maize-selling farmers in Kenya. The survey covered four maize surplus districts (Trans Nzoia, Nakuru, Bomet, and Bungoma) and two districts that are generally maize deficit (Kisii, and Machakos). Within these districts, 41 survey villages were stratified into relatively accessible (n=26) vs remote (n=15) areas. Villages were categorized as isolated or accessible by the study team in consultation with the local District Agricultural Officers, based on multiple criteria: distance of most households in the village to the nearest wholesale market center, distance from the village to the nearest tarmac road, conditions of the tarmac road and the road linking the village to that tarmac road. A total of 534 maize-selling farmers were assembled for focus group discussions and for individual interview.
1 Note: An expanded analysis of market access indicators used in recent literature is included in a version of this paper found at http://purl.umn.edu/110014
7
5. Smallholder access to markets in Kenya: 1997-2010
Levels of smallholder accessibility indicators
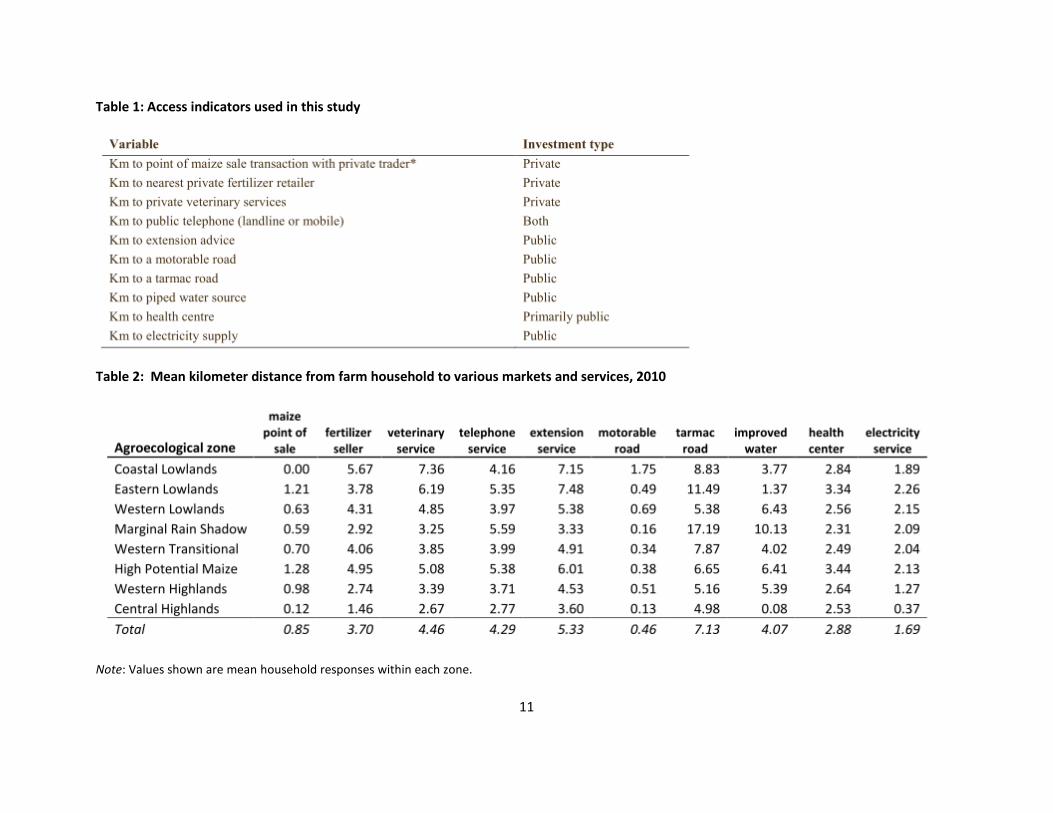
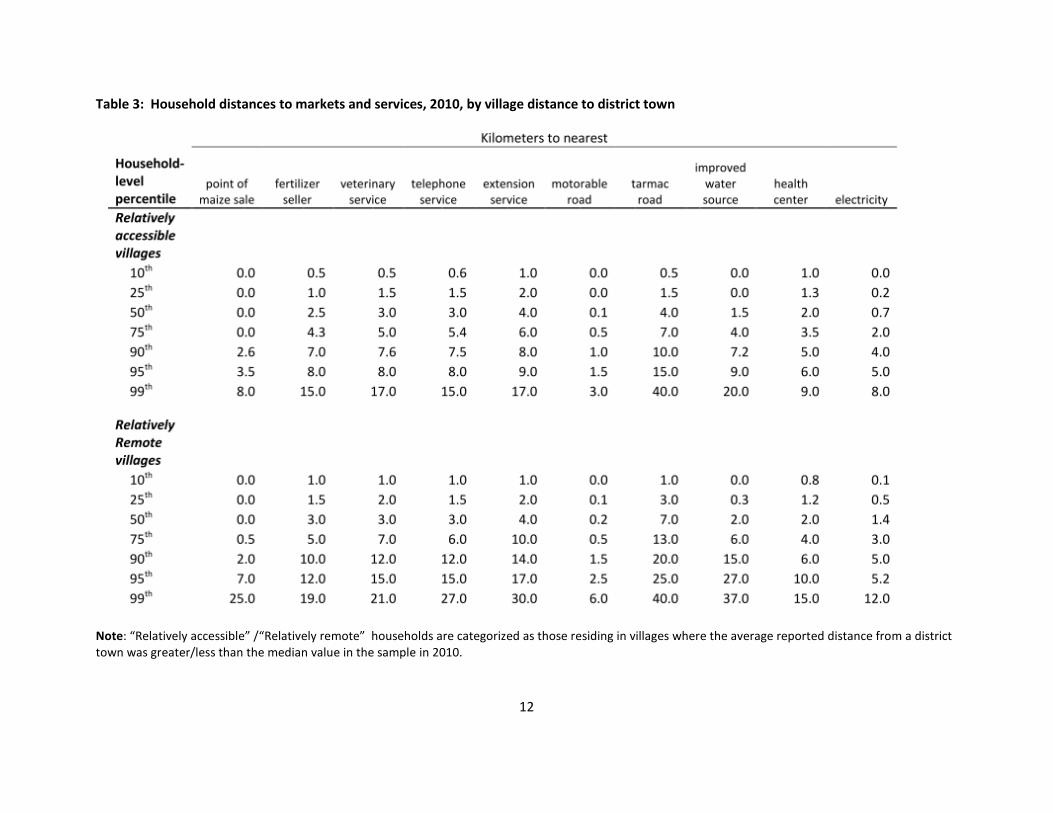
Basic patterns in access are summarized for 2010 in Tables 2 and 3. The intent of these tables is to convey the absolute and relative magnitudes of indicator values across sample space and how they vary according to conventional measures of market access, in this case the distance to the nearest district town. Although most farmers live quite close to motorable roads, the distance to the nearest all-weather road averages about 7 kilometers. In the absence of motorized transportation, this may represent about an hour by bicycle and up to several hours’ travel by foot. Electricity and telephone services are generally located somewhat closer than all-weather roads, while the distance to the nearest improved water source is surprisingly long on average, and varies highly across zones. Market- and production-oriented services show similar magnitudes of variation: on average these services are 3 to 5 kilometers distance from farmers’ homes. Many of the services (fertilizer sellers, extension and veterinary services) and infrastructure (motorable roads, health centers and telephones) appear fairly uniformly distributed, although others (tarmac road and improved water) are less uniformly so.
Small farm maize marketing and village remoteness characteristics
There is evidence that even where villages are “remote” in terms of roads or other indicators, other indicators of market accessibility and competition do not always differ greatly from less remote areas. Recent survey data from Kenya and Malawi indicate that in both remote and accessible village there are (a) a large number of small traders competing for local purchases, and (b) many villagers are both able to and choose to sell their grain surpluses at the farm gate (Kirimi et al., 2011; Jayne et al., 2010). This second point is corroborated by findings in the first column of Table 3, showing that the distance travelled from the farm to the point of maize sale was zero for over 50 percent of the farmers selling maize to private traders. In other words, traders collected and bought maize directly from households’ farms for the majority of farmers who sold maize.
Farmers’ subjective perceptions about market liberalization also appear to bear a surprising relationship to conventional measures of remoteness. A common view in sub-Saharan Africa is that market liberalization cut off farmers from access to markets that was previously provided by state marketing board buying stations. One of the questions asked in the 1997 and 2000 Tegemeo household surveys (n=1,468 and n=1,377 respectively) was “in the past 10 years since the maize market was liberalized, do you prefer the current maize marketing situation or the state-led system prior to reform?” Respondents preferring the current liberalized marketing system in 1997 ranged from 57% in the more accessible areas to 66% in the relatively remote areas. In 2000, this percentage rose to 64% in the relatively accessible areas to 69% in the relatively remote areas. Evidently, smallholder farmers’ perceptions that the maize marketing environment improved after liberalization was most discernable in the relatively remote areas.
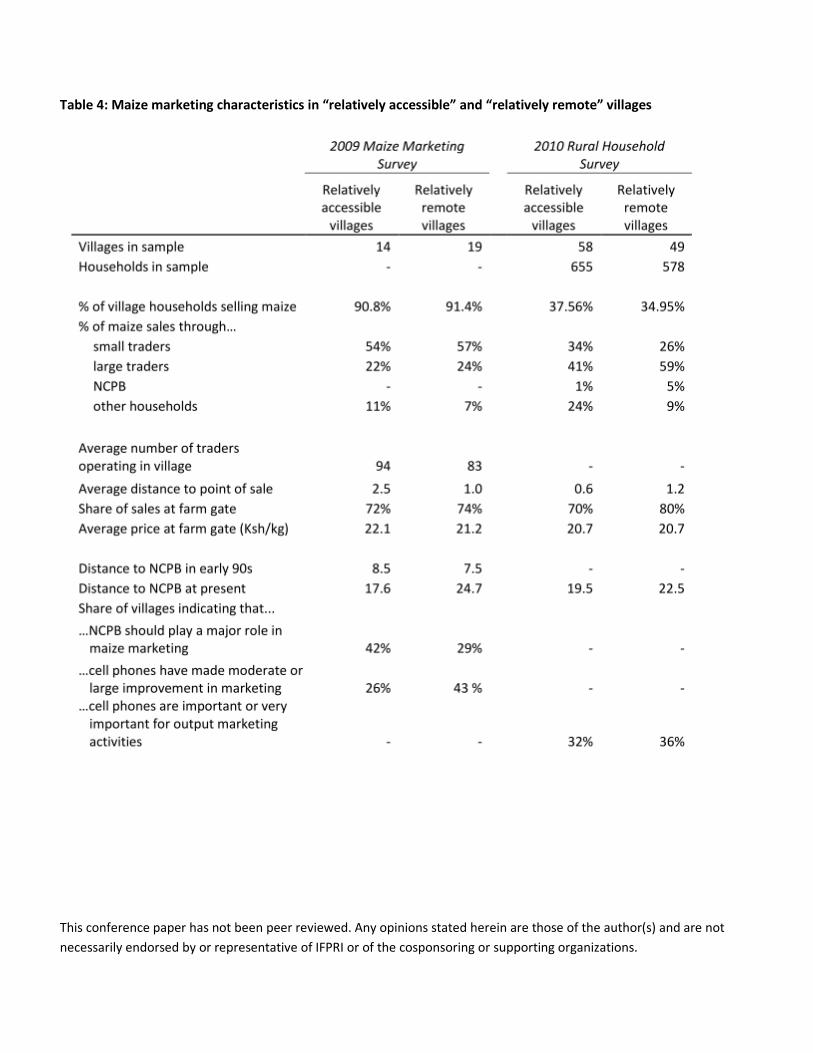
Table 4 presents findings from the independent 2009 farmer maize marketing survey and the 2010 Tegemeo rural household survey designed to understand farmers’ maize marketing constraints as described in Section 4. These data indicate that villagers in nominally remote areas appear to have competitive local maize marketing conditions that do not differ considerably from those of non-remote areas. Maize channel choices are similar in most areas, and the share of farmers selling at the farm gate is similar. In all environments, a large number of small traders were found to be buying and assembling grain in the village, and focus group discussions indicate that farmers find trader competition to have
8
beneficial effects on price. The average distance to point-of-sale was actually higher for farmers in the relatively accessible areas. This is because a small proportion of farmers, especially those with greater surpluses to sell, preferred to organize their own transport to sell directly to buyers in regional markets, thereby by-passing the smaller assembly middlemen who travelled into the villages to buy maize from most maize-selling households; this is evident from examining the distribution of distance traveled to the point of maize sale in Table 3. These findings indicate that for at least some grain selling farmers, long distances between the farm and point of sale do not reflect major market access problems but rather a deliberate strategy to bypass rural assembly traders to fetch a higher price with larger buyers in towns. Table 4, which stratifies the nationwide samples from both surveys into “relatively accessible” and “relatively remote” groups according to their distance to the nearest district town, also shows that farmgate maize prices show little variation between the two access categories.
Collectively, these data stand in stark contrast to the generic picture of remote villages suffering from lack of marketing services and intermediaries and disadvantaged by huge price wedges. Furthermore, the changes brought about by liberalizing markets do not seem to have systematically disadvantaged the more remote communities in this sample. Although it is true that contraction of the state marketing system (NCPB) is relatively pronounced in more remote areas (shown by larger travel distances in 2009 compared with the early 1990s), these changes do not seem to be perceived as disadvantageous: fewer villages in remote areas reported that the NCPB should play a big role in future maize marketing. This may indicate that private marketing intermediaries have stepped in to fill the gap left by the NCPB’s contraction. According to the 2009 survey, for 72 and 74 percent of the households that sold maize to private traders in the “accessible” and “remote” areas, respectively, the distance traveled from the farm to the point of sale was zero, indicating that traders were penetrating deep into rural areas to buy grain. The 2010 survey largely matches this finding, with 70/80 percent of accessible/remote maize sellers transacting at the farmgate. Private market development has almost certainly been facilitated by changing technologies. In these data, mobile phones were much more frequently cited as a significant positive factor in marketing conditions in remote areas.
Of course, these findings do not imply that farmers no longer face major problems in selling their agricultural commodities. Even though most Kenyan smallholders report having many grain traders to choose from, travel very short distances from their farms to sell their maize, and are paid in cash immediately, the focus group discussions revealed several serious grain marketing problems. In order of frequency mentioned in the focus group discussions, these are: under-weighing of commodity by traders, feelings of receiving usuriously low prices by traders, and general feelings of being at an informational disadvantage relative to traders.
Trends in smallholder accessibility indicators
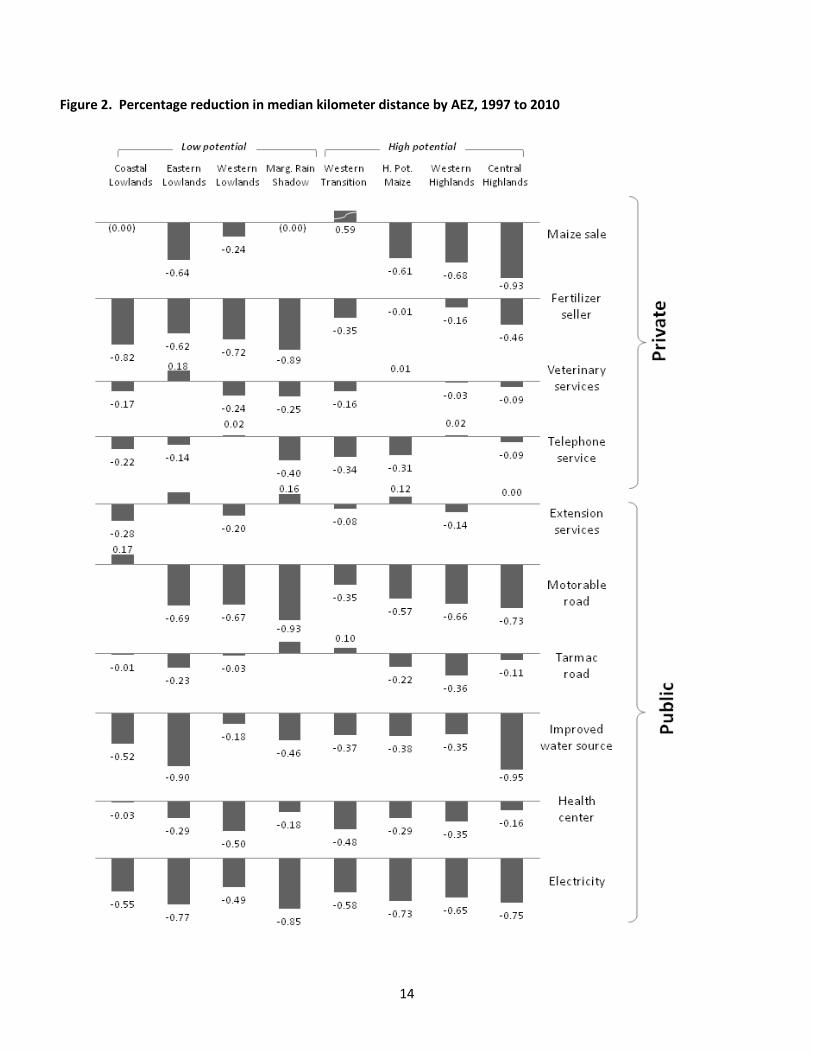
From 1997 to 2010 average distances to services and infrastructure improved throughout the country. Figure 2 summarizes such changes as percentage reductions in the median kilometer distance to a variety of resources (or marketing activity) by agroecological zone. Changes are calculated over the 1997 to 2010 period. From these data, a picture of broadly improving access emerged with several interesting characteristics. First, access indicators attributed to public sector investment improved in virtually all regions, and these improvements were relatively similar across relatively high-potential and low-potential areas. The changes in access deriving from public investments in have tended to be more or less geographically equitable. This may be due to political considerations, but further exploration of the reasons for these patterns is beyond the scope of this paper.

9
Second, there were also broad improvements in indicators of market access attributable to private sector investment. In particular, the average distance households traveled to the point of maize sale and to the nearest fertilizer retailer declined by 1.8 km and 4.5 km, respectively, between 1997 and 2010. This represents a 67% and 55% reduction in distance and reflects an increased density of grain buyers and fertilizer sellers operating in rural areas. By 2010, over 75% of smallholder households selling maize stated that the private trader to which they sold came to their farm or village to buy their maize. Private traders accounted for 81% of the sales transactions in 2010; neighboring households and the NCPB accounted for the remaining 16% and 3% of transactions. There were also improvements in the distance travelled to access veterinary services. Maize and fertilizer markets were fully liberalized in Kenya in the mid-1990s, hence the proximity of farm households to fertilizer retailers and maize buyers reflects changes in the density of traders operating in smallholder areas. Similarly, the distance travelled by farmers to access veterinary services reflects the extent to which private veterinary provides have penetrated into rural areas.
Third, the improvements in access to markets reflecting private sector investment were greatest in the relatively low-potential areas. For example, the decline in distance to the nearest fertilizer retailer was greatest in the Eastern Lowlands, Western Lowlands, the Marginal Rain Shadow and the Coast. The greatest improvements in access to veterinary services were in the Coast, Eastern Lowlands, and Central Highlands (the latter being a relatively high-potential area). The tendency for access indicators reflecting private investment to improve to a greater extent in the relatively low-potential zones may reflect where unmet profit opportunities are the greatest. The highest marginal returns to new private investment in input retailing and output marketing might very well be in the medium- to lower-potential areas which have been historically underserved.
One way of summarizing the access changes is by comparing indicator changes relative to their initial values. Figure 3 shows average indicator changes indexed to that indicator’s average value in 1997. Although general trends across all indicator types were of similar direction and absolute magnitude, the relative improvements differ markedly. The greatest relative improvements can be seen to have occurred for distance to fertilizer seller, followed by distances to motorable roads, telephone service and improved water sources.
Of particular note is the pronounced reduction in mean distances to the nearest fertilizer retailer, which decreased steadily over the first decade of this 13-year period after the deregulation of the fertilizer market in the early 1990s. Smallholders’ purchases of fertilizer over the sample period rose rapidly during this period and their purchases were all from private stockists. The reduction in the distance to fertilizer retailers during this period as measured in the survey data reflects the expansion of geographical coverage that occurred after the liberalization of this market. Thus, the trends shown may be interpreted as the expanding discovery of and response to opportunities for fertilizer sales.
Although many indicators showed pronounced reductions in distances during the 2004 to 2007 period, there is a notable slackening of improvement (and, in some cases, deterioration) in the final 2007-2010 period. This is particularly true for services (extension, vet, telephone) rather than fixed infrastructure. We suspect that the widespread social unrest associated with the 2008 presidential elections played a major role in the implied contraction of service provision. Nonetheless, the overall trends across the entire period can easily be described as improvements.

10
In general, when changes in access are calculated across each panel period, we note a fairly strong pattern of improvement in the first decade, followed by slight worsening in the final 2007-2010 period. Table 5 summarizes average annual rates of change for each pair of sequential panel rounds.
11
Table 1: Access indicators used in this study
Table 2: Mean kilometer distance from farm household to various markets and services, 2010
Note: Values shown are mean household responses within each zone.
12
Table 3: Household distances to markets and services, 2010, by village distance to district town
Note: “Relatively accessible” /“Relatively remote” households are categorized as those residing in villages where the average reported distance from a district town was greater/less than the median value in the sample in 2010.
This conference paper has not been peer reviewed. Any opinions stated herein are those of the author(s) and are not necessarily endorsed by or representative of IFPRI or of the cosponsoring or supporting organizations.
Table 4: Maize marketing characteristics in “relatively accessible” and “relatively remote” villages
14
Figure 2. Percentage reduction in median kilometer distance by AEZ, 1997 to 2010

15
Figure 3: Relative changes in mean indicator values, indexed to 1997
Table 5. Average annual change in distance from farm to selected services and market infrastructure, 1997-2010
This conference paper has not been peer reviewed. Any opinions stated herein are those of the author(s) and are not necessarily endorsed by or representative of IFPRI or of the cosponsoring or supporting organizations.
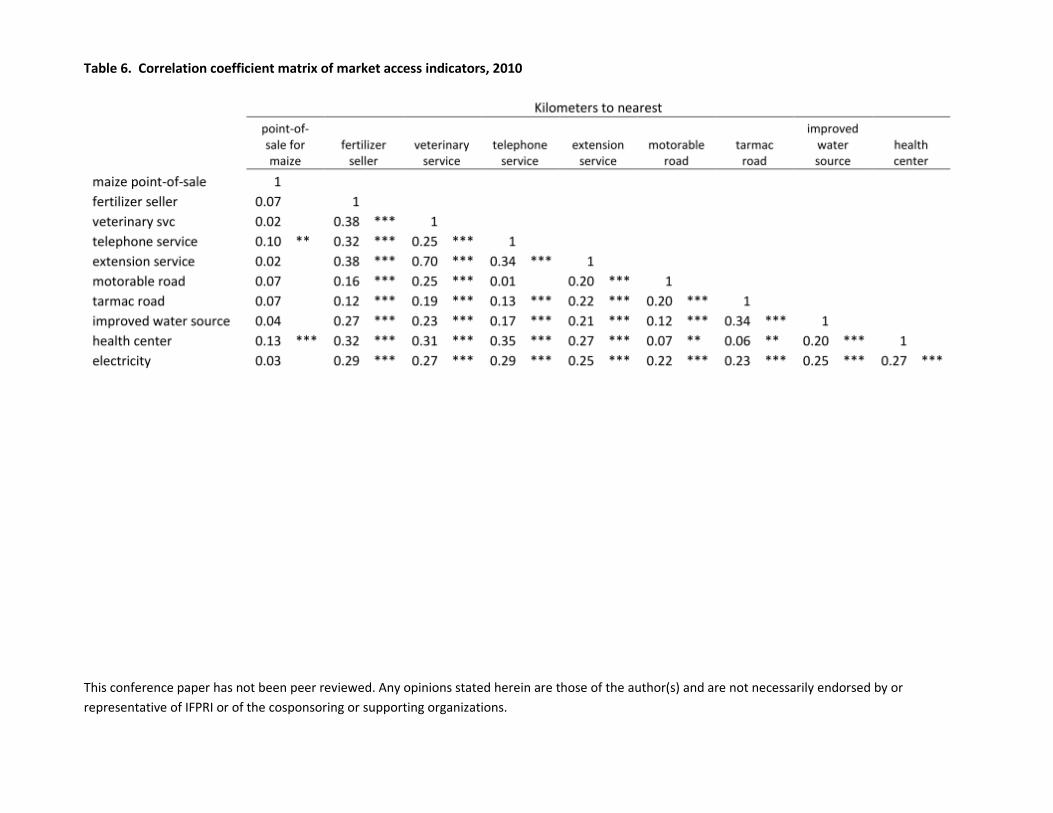
Table 6. Correlation coefficient matrix of market access indicators, 2010
17
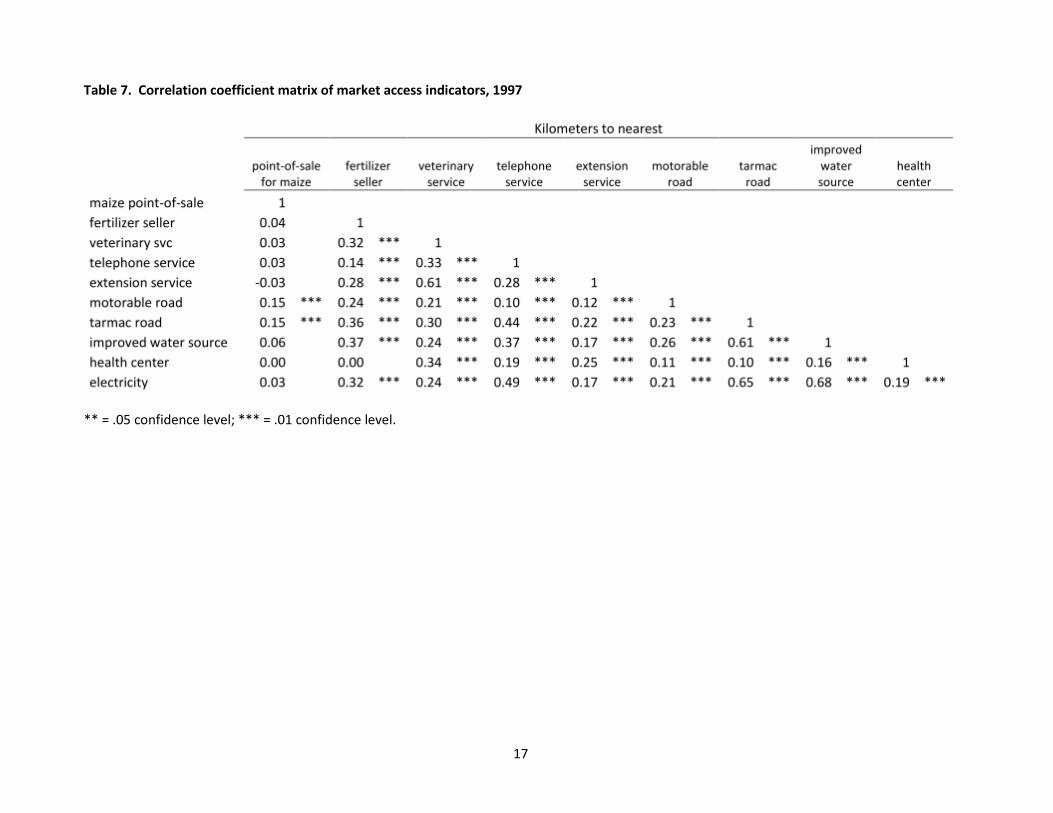
Table 7. Correlation coefficient matrix of market access indicators, 1997
** = .05 confidence level; *** = .01 confidence level.
Access paper 1B
18
Correlation across indicators
An important observation is the generally low level of correlation between access measures. Tables 6 and 7 show correlation matrices for indicator observations in 2010 and 1997, respectively.2 Two immediate conclusions may be drawn. First, it is quite difficult to identify a single indicator which represents the overall state of access to markets. Indicators of access to markets and services are of moderate or low correlation across most indicators collected in the surveys. The distance from farm to point of maize sale is particularly uncorrelated with most other access indicators. Hence, despite the plausible idea that remoteness will generally mean greater distances to all types of infrastructure and services, this dataset indicates that any single indicator would do a mediocre job at best of summarizing an overall access situation.
Correlation over time
We also observe, somewhat more surprising, that the correlation between market access indicators varies considerably over time. For data from a household survey, some response variability might be expected to derive from sample variation and/or outlying values. However, because all respondents in this analysis are part of a balanced panel, response variation due to sample variation can be ruled out. Furthermore, the correlations shown in the tables below are for village-level means (averaged across all households in a village), which further controls for idiosyncratic household responses. This suggests that indicators of physical access to markets vary widely according to the indicator used, that there is a varying and somewhat unstable degree of correlation among these access indicators across time, and that it may therefore be highly problematic to use only one or two indicators as a generalizable measure of market access.
Lastly, it might be hypothesized that the overall degree of correlation between these indicators has increased over time. Increasing correlation would indicate increasing convergence in these indicators as markets develop over time. To examine this, we computed mean and median values of village-level correlation coefficients for each year and compared them over time. We find no evidence of increasing correlation (in fact, the degree of correlation among publicly provided indicators of market access has been notably declining).
6. Discussion
Market access conditions in Kenya are diverse and multidimensional. Many variables typically used to represent market access in empirical studies are not highly correlated with one another. Some indicators of market access vary little between areas defined as accessible and remote on the basis of distances to a regional town or wholesale market. Furthermore, changes in access over the past decade appear similarly complex. Although all indicators of access have shown a general pattern of improvement over the last decade, there are considerable differences in the patterns of change across time, across space and across indicator types.
Indicators of market access that reflect private sector investment all show an improvement in access conditions over time, especially in fertilizer retailing, with the exception of the last survey period in 2010, which followed a period of widespread disruption caused by post-election violence. The reduction in distances to services provided by private traders and service providers are most apparent in the relatively low-potential regions, which may reflect where unmet profit opportunities are the greatest. For example, if most farmers in the higher potential areas (e.g. Central Highlands, Western Highlands) 2 Correlation matrices for 2007, 2004 and 2000 show similar patterns and are available from the authors..
Access paper 1B
19
are already participating in marketing chains with interlinked crop marketing-input provision, then there may be less scope for new entrants. In such a case, the highest marginal returns to new private investment in input retailing might very well be in the medium- to lower-potential areas which have been historically underserved. This interpretation might indeed explain the higher rates of change in indicators of private investment in areas which were previously underserved. Fan and Hazell (2003) found a similar pattern of greater private investment in relatively low-potential areas of India during the 1990s because substantial investments had already been made earlier in the high-potential areas, thus providing greater returns to additional investment in the relatively under-served areas. Public investments, on the other hand, show much more uniform distributions of change between high- and low-potential areas (Figure 2), perhaps reflecting political demands for equity in resource distribution.
Several indicators from this nationwide panel survey reveal market access conditions that are quite inconsistent with views commonly articulated by local policy makers. For example, most farmers who sell maize do so directly on their farms. The mean distance traveled from the farm to the point of maize sale was under one kilometer. Over 80 percent of maize-selling farmers indicated that at least 50 grain traders came directly into their villages during the buying season to buy maize. Distances traveled by farmers to acquire fertilizer was somewhat higher at 3.70 km in 2010 but this distance has declined dramatically from 8.7km in 1997.
In contrast to the general trend of improvement across all access indicator types is the fact that there is considerable divergence across the levels and changes of alternative indicators for any particular location. Alternative measures of access are characterized by relationships which are weak and unstable across time and space. These changing patterns of correlation strongly suggest that the choice of indicator to employ in empirical analysis may have important consequences for derived analytical conclusions. In our Kenyan case study, for example, any single indicator would do a poor job of summarizing a multivariate access situation. At the same time, our review of recent literature suggests that the selection of access indicators may often be ad hoc. Certainly, researchers are at the mercy of available data. Nonetheless, we suggest that, given the importance of indicator choice on analytical outcomes, explicitly structured conceptualizations of access should guide survey design and indicator selection wherever possible – e.g. what variable best represents the actual marketing channel used for a particular commodity, by a particular actor, or at a particular time of year. Finally, where possible, the variable selection process should include sensitivity analysis of alternative indicators.
The findings of this study hold several implications for the empirical measurement of market accessibility. We offer these issues as a conceptual checklist for indicator identification.
• Specificity of access indicators to the issue being addressed
Different production choices are associated with marketing chains that have different spatial expressions (for example, from the farmgate, grain may go mainly to local buyers in the village, bananas to the nearest city, and cotton to the nearest ginnery). The many loci of exchange mean that there may be crop-specific market structures and access conditions that may not be highly correlated with each other. Hence, empirical study of market access conditions and their impacts on farmer behavior could provide more accurate insights by using variables that are highly specific to the issue being addressed.
Added to the difficulty of multiple markets, is that of synthesizing multiple modes of physical access to a market. For example, in the highlands of Ethiopia, basing a travel time model on the average vehicle speed for different road types will not reflect walking speeds (in a country where the majority of smallholder production is carried to market by hand or by donkey).
Access paper 1B
20
The non-physical elements of market access may also interact with physical/spatial elements. For example, market information may influence the perceived costs of market participation over and above actual transportation costs. Institutional and cultural factors likely also play a role in actual market accessibility at the community level. At the household level, of course, even more factors come into play. Such interactions may be non-linear and for this and other reasons be difficult to detect.
• Variation over time
Incorporating the temporal dynamics of accessibility is an additional challenge. These dynamics may be regular (e.g., seasonality), probabilistic (e.g., different degrees of stability associated with different markets), or may change according to changes in trader behavior or the shifting of local supply and demand conditions that alter the direction of trade between source and destination markets. Clearly, time-invariant variables such as the distance to the nearest town are unable to capture temporal variations in access conditions due to such dynamics. Finally, changes in urbanization, infrastructure development (and decay), regional trade reforms, etc. will translate into changing geographical patterns of physical accessibility to markets. These factors can all limit the ability of even well-conceptualized metrics which are based on solid data, to hold up over time and over a diversity of analytical applications.
• Liberalization and technology changes
Changing technologies and market institutions may result in changes in the economic meaning of a given indicator over time. For example, Overå (2006) describes ways in which recent changes in access to telecommunications technology are affecting the transactions costs of local trade. Her study of small traders in Ghana illustrates how mobile phones are lowering the transaction costs of interactions over dispersed areas: discovery and exchange of information, negotiation, and monitoring. She identifies a number of mechanisms by which cell phones lower transaction costs: by reducing the number of physical trips necessary to carry out these functions, overall costs are reduced; enhanced communication leads to the potential for more rapid establishment of new trading relationships and social capital in low-trust, high-risk environments; traders may cultivate more spatially diffuse networks and use faster discovery and negotiation times to take advantage of shorter trade opportunity windows. More broadly, Overå’s study shows how marketing and communication technologies may reduce transaction costs and effectively extend geographical thresholds of viable market participation. In liberalized settings elsewhere in Sub-Saharan Africa, similar changes may be taking place which are not necessarily captured by local physical infrastructure indicators. Such changes are not limited to new technologies. Our Kenya data, for example, indicate the important expansion of fertilizer retailer activity following liberalization of this market.
• Infrastructural and non-infrastructural components of access
Our documentation of trader presence in otherwise remote villages indicates the need to question assumptions about market access conditions based on physical infrastructure. Many “remote” villages appear to have competitive local marketing conditions, characterized by large numbers of independent traders buying directly in the villages, and farmgate prices that reflect modest adjustments for distance from principal markets. The conditions apparent from the nationwide survey of Kenya from which our findings are derived may or may not closely approximate conditions in many other areas of Sub-Saharan Africa. It is likely that market access conditions are considerably worse in many parts of the continent and it is therefore important to conduct similar analysis elsewhere to assess the robustness of our main findings. However, we see no major a priori reason why commonly used uni-dimensional indicators of
Access paper 1B
21
market access based on distance or travel time to towns or physical infrastructure should necessarily perform better in most other parts of the region than they do in Kenya. At a minimum, the findings of this paper call for a broader rethinking of the meaning of market access in the context of African agriculture and how to measure it. Packing in too many assumptions about the economic implications of road conditions is tantamount to a kind of infrastructural determinism which may not accord with the actual modes or costs of the exchange processes being researched.
References
Alene, A., Manyong, V., Omanya, G., Mignouna, H., Bokanga, M., & Odhiambo, G. (2008). Smallholder market participation under transactions costs: Maize supply and fertilizer demand in Kenya. Food Policy 33 (2008), 318–328.
Benin, S. (2006). Policies and programs affecting land management practices, input use and productivity in the highlands of Amhara region, Ethiopia. In: Pender, J., Place, F., and Ehui, S. (eds.), Strategies for Sustainable Land Management in the East African Highlands. IFPRI, Washington, D.C.
de Janvry, A. & Sadoulet, E. (2001). Income Strategies among Rural Households in Mexico: The Role of Off-farm Activities. World Development 29(3), 467-480.
de Janvry, A., Fafchamps, M., & Sadoulet, E. (1991). Peasant household behavior with missing markets: Some paradoxes explained, The Economic Journal 101 (409): 1400-1417.de Janvry et al 1991
Dercon, S., Gilligan, D., Hoddinott, J. & Woldehanna, T. (2007). The impact of roads and agricultural extension on consumption growth and poverty in fifteen Ethiopian villages. University of Oxford, Department of Economics, Centre for the Study of African Economies Working Paper Series, CSAE WPS/2007-01, January 2007.
Escobal, J. (2001). The benefits of roads in rural Peru: a transaction costs approach. Grupo de Análisis par el Desarrollo-GRADE. Lima, Peru. Photocopy.
Escobal, J. (2005). The role of public infrastructure in market development in rural Peru. PhD thesis, Wageningen University.
Escobal, J., & M. Torero. (2005). Measuring the Impact of Asset Complementarities: The Case of Rural Peru. Cuadernos de Economía, vol. 42 (Mayo), pp. 137-164, 2005
Escobal, J., and C. Ponce. (2002). The benefits of rural roads: enhancing income opportunities for the rural poor. GRADE working paper 40-I. Lima: GRADE.
Fafchamps, M. and J. Wahba. (2006). Child Labor, Urban Proximity, and Household Composition. Journal of Development Economics 79 (2006) 374– 397
Fafchamps, M., & Gabre-Madhin, E. (2001). Agricultural markets in Benin and Malawi: operation and performance of traders. World Bank Policy Research Working Paper No. 2734. World Bank, Washington, DC. December 2001

Access paper 1B
22
Fafchamps, M., & Shilpi, F. (2003). The spatial division of labor in Nepal. Journal of Development Studies 39, 23–66.
Fan. S., & Hazell, P. (2003). Strategies for Sustainable Development of Less-Favoured Areas: Returns to Public Investments in the Less-Favored Areas of India and China, American Journal of Agricultural Economics, 83(5): 1217-1222.
Fan. S., and X. Zhang. (2004). Infrastructure and regional economic development in rural China. China Economic Review 15(2), 203-214
Godquin, M. and A. Quisumbing. (2005). Groups, networks, and social capital in rural Philippine communities. International Research Workshop on ‘Gender and Collective Action’, 17-21 October 2005, Chiang Mai, Thailand.
Jacoby, H.G. (2000). Access to Markets and the Benefits of Rural Roads. Policy Research Working Paper 2028. Development Research Group, Rural Development. Washington D.C.: World Bank.
Jalan, J. and M. Ravallion. (2002). Geographic poverty traps? A micro model of consumption growth in rural China. Journal of Applied Econometrics 17, 329–346.
Jayne, T.S., Sitko, N., Ricker-Gilbert, J., & Mangisoni, J. (2010). Malawi’s Maize Marketing System. Report prepared under the Evaluation of the 2008/9 Agricultural Input Subsidy Programme, Malawi, School of Oriental and African Studies (SOAS), London.
Key, N., E. Sadoulet, and A. de Janvry. (2000). Transaction costs and agricultural household supply response. American Journal of Agricultural Economics Association 82 (2): 245- 259.
Khandker, S.R., Bakht, Z. & Koolwal, G.B. (2006). The Poverty Impact of Rural Roads: Evidence from Bangladesh. World Bank Policy Research Working Paper No. 3875.
Kirimi, L., N. Sitko, T.S. Jayne, F. Karin, M. Muyanga, M. Sheahan, J. Flock, and G. Bor. (2011). A Farm Gate-to-Consumer Value Chain Analysis of Kenya’s Maize Marketing System. MSU International Development Working Paper #111. January 2011. Department of Agricultural, Food, and Resource Economics, Michigan State University, East Lansing, USA.
Kruesman, G., Ruben, R., & Tesfay, G. (2006). Diversity and development domains in the Ethiopian highlands. Agricultural Systems 88 (2006) 75–91.
Mu, R. and D. van de Walle. (2007). Rural Roads and Poor Area Development in Vietnam. Policy Research Working Paper 4340 (Impact Evaluation Series No. 18). The World Bank, Development Research Group, Human Development and Public Services Team, August 2007.
North, D.C. (1990). Institutions, institutional change and economic performance. Cambridge: Cambridge University Press.

Access paper 1B
23
Overå, R. (2006). Networks, distance, and trust: Telecommunications Development and changing trading practices in Ghana. World Development 34(7):1301-1315, July 2006.
Pender, J. & Gebremedhin, B. (2006). Land management, crop production and household income in the highlands of Tigray, northern Ethiopia. In: Pender, J., Place, F., and Ehui, S. (eds.), Strategies for Sustainable Land Management in the East African Highlands. IFPRI, Washington, D.C.
Pender, J., B. Gebremedhin, S. Benin and S. Ehui. (2001). Strategies for sustainable development in the Ethiopian highlands. American Journal of Agricultural Economics 83(5):1231-40.
Pender, J., F. Place, and S. Ehui. (1999). Strategies for sustainable agricultural development in the East African Highlands. In: A. Knox McCullough, S. Babu, and P. Hazell (eds.), Strategies for Poverty Alleviation and Sustainable Resource Management in the Fragile Lands of Sub-Saharan Africa. Proceedings of the International Conference held from 25-29 May, 1998 in Entebbe, Uganda. Food and Agriculture Development Centre (DSE/ZEL), Feldafing, Germany.
Pinstrup-Anderson, P. and S. Shinokawa. (2006). Rural Infrastructure and Agricultural Development. Paper prepared for presentation at the Annual Bank Conference on Development Economics, Tokyo, Japan, May 29-30, 2006.
Stifel, D. & Minten, B. (2008). Isolation and agricultural productivity. Agricultural Economics 39 (2008) 1–15.
von Oppen, M., S. Abele, and F. Heidhues. (1999). The impact of market access on agricultural development in West Niger. University of Hohenheim Special Research Programme 308. Stuttgart, Germany.
von Thünen, J.H. (1826). Der isolietre Staat in Beziehung auf Landwirtschaft und Nationalökonomie, Gustav Fisher, Stuttgart; translation by C.M. Wartenburg (1966) The Isolated State, Oxford University Press, Oxford. (1966) The Isolated State, Oxford University Press, Oxford.
Wood, S. (2007). Spatial Dimensions of the Regional Evaluation of Agricultural Livelihood Strategies: Insights from Uganda. PhD Dissertation. Department of Economics, University of London.


![[PPT]“Unpacking the Standards” - Griffin Middle Schoolgriffinmiddleschool.typepad.com/files/unpacking-the... · Web view“Unpacking the Standards” Last modified by install](https://img.pdfslide.net/doc/110x75/5b1bbcd97f8b9a28258ee047/pptunpacking-the-standards-griffin-middle-schoo-web-viewunpacking.jpg)