Embed Size (px)
Citation preview

UGANDA NATIONAL PANEL SURVEY
2009/2010 (WAVE I)
REPORT ON THE
Uganda Bureau of Statistics
Colville Street, Plot 9
P.O. Box 7186, Kampala
Tel: 041 320740, 0772 705127
Fax: 041 237 553
E-mail: [email protected]
Website: www.ubos.org
UGANDA BUREAU OF STATISTICS
KEY FINDINGS
August 2011
THE REPUBLIC OF UGANDA

i
PREFACE
The Uganda National Panel Survey (UNPS) 2009/10 is the first that the Uganda Bureau
of Statistics (UBOS) has conducted in a series of household surveys that started in
1988. The overall objective of the survey was to collect high quality data on key outcome
indicators such as poverty, service delivery, governance and employment among others;
to monitor Government’s development programmes like the PEAP (Poverty Eradication
Action Plan) and its successor the National Development Plan (NDP) on an annual
basis. The survey collected information on Socio-economic characteristics at household,
individual and community levels as well as information for the agricultural module.
The UNPS 2009/10 comprised of six modules namely; the Socio-economic, Woman,
Agriculture, Community and Price modules. This report presents some of the key
findings based on the afore-mentioned modules. It generally shows the changes in mean
values of individual or household characteristics/indicators. Indicators on population
characteristics, education, health, household expenditure and poverty among others
have been presented at national, regional and at rural-urban levels.
We are grateful to the Royal Netherlands Kingdom/Embassy for the financial assistance
that enabled the survey to take place. We would also like to acknowledge the technical
support provided by the World Bank before the data analysis phase. Our gratitude is
extended to all the field staff who work hard to successfully implement the survey and to
the survey respondents who provide us the information on which this report is based. To
the Local Governments, thank you for your unreserved support during the data
collection. We are greatly indebted to you all for the invaluable cooperation.
J.B. Male-Mukasa Executive Director August 2011

ii
TABLE OF CONTENTS PREFACE ................................................................................................................. I
TABLE OF CONTENTS........................................................................................... II
LIST OF TABLES.....................................................................................................1
LIST OF FIGURES ..................................................................................................4
LIST OF ACRONYMS..............................................................................................5
EXECUTIVE SUMMARY .........................................................................................6
CHAPTER ONE .......................................................................................................9
INTRODUCTION .....................................................................................................9
1.0 OVERVIEW......................................................................................................9 1.1 SURVEY OBJECTIVES ......................................................................................9 1.2 SCOPE AND COVERAGE.................................................................................10 1.3 SURVEY DESIGN ...........................................................................................11 1.4 TRACKING ....................................................................................................12 1.5 ATTRITION ....................................................................................................13 1.6 SURVEY ORGANIZATION ................................................................................14 1.7 DATA PROCESSING AND MANAGEMENT ..........................................................14 1.8 FUNDING ......................................................................................................14
CHAPTER TWO ....................................................................................................15
CHARACTERISTICS OF HOUSEHOLDS AND HOUSEHOLD POPULATION ...15
2.0 INTRODUCTION..............................................................................................15 2.1 HOUSEHOLD CHARACTERISTICS ....................................................................15 2.2 RESIDENCE OF INDIVIDUALS ..........................................................................16 2.3 MARITAL STATUS OF HOUSEHOLD MEMBERS ..................................................17 2.4 SUMMARY OF FINDINGS.................................................................................20
CHAPTER THREE.................................................................................................21
EDUCATION..........................................................................................................21
3.0 INTRODUCTION..............................................................................................21 3.1 LITERACY .....................................................................................................21 3.2 AVERAGE DISTANCE TO SCHOOL ....................................................................22 3.3 REASONS FOR LEAVING SCHOOL....................................................................22 3.4 MANAGEMENT OF SCHOOLS ATTENDED .........................................................23 3.5 TYPE OF SCHOOLS ATTENDED.......................................................................24 3.6 SUMMARY OF FINDINGS.................................................................................24
CHAPTER FOUR...................................................................................................25
LABOUR FORCE AND TIME USE........................................................................25
4.0 INTRODUCTION..............................................................................................25 4.1 ACTIVITY STATUS ..........................................................................................25 4.2 TRANSITIONS IN THE LABOUR FORCE .............................................................25 4.3 CHANGED OCCUPATION ................................................................................30 4.4 CHANGED INDUSTRY .....................................................................................32 4.5 CHANGED ACTIVITY BY SECTOR......................................................................34 4.6 SUMMARY OF FINDINGS.................................................................................36

iii
CHAPTER FIVE.....................................................................................................37
HEALTH.................................................................................................................37
5.0 INTRODUCTION..............................................................................................37 5.1 HEALTH STATUS OF THE POPULATION............................................................37 5.2 PREVALENCE OF ILLNESS ..............................................................................38 5.3 MEDICAL ATTENTION/CARE SOUGHT..............................................................39 5.4 REASONS FOR NOT CONSULTING....................................................................40 5.5 SUMMARY OF FINDINGS .................................................................................41
CHAPTER SIX .......................................................................................................42
POVERTY DYNAMICS IN UGANDA.....................................................................42
6.0 INTRODUCTION..............................................................................................42 6.1 DATA TRANSFORMATION ...............................................................................42 6.2 POVERTY TRANSITIONS FROM 2005/06 TO 2009/10 .......................................44 6.3 ECONOMIC ACTIVITY AND POVERTY STATUS ...................................................45 6.4 SECTOR OF EMPLOYMENT AND POVERTY STATUS...........................................46 6.5 SUMMARY OF THE FINDINGS...........................................................................47
CHAPTER SEVEN.................................................................................................48
CHANGES IN WELFARE CORRELATES.............................................................48
7.0 INTRODUCTION..............................................................................................48 7.1 POSSESSION OF TWO SETS OF CLOTHES BY HOUSEHOLD MEMBER(S) ............48 7.2 OWNERSHIP OF BLANKET FOR HOUSEHOLD MEMBERS LESS THAN 18 YEARS...49 7.3 EVERY HOUSEHOLD MEMBER POSSESSING AT LEAST A PAIR OF SHOES..........50 7.4 FEEDING PRACTICES.....................................................................................52 7.5 FOOD SECURITY ...........................................................................................53 7.6 OWNERSHIP OF SELECTED HOUSEHOLD ASSETS............................................54 7.7 SUMMARY OF FINDINGS.................................................................................55
CHAPTER EIGHT..................................................................................................57
TRANSITIONS IN HOUSING CHARACTERISTICS.............................................57
8.0 INTRODUCTION..............................................................................................57 8.1 TYPE OF DWELLING UNIT...............................................................................57 8.2 TENURE STATUS OF DWELLING UNIT ...............................................................58 8.3 TYPE OF MATERIALS USED FOR CONSTRUCTION..............................................60 8.4 WATER SOURCES..........................................................................................63 8.5 TYPE OF TOILET FACILITIES............................................................................65 8.6 SUMMARY OF FINDINGS.................................................................................66
CHAPTER NINE ....................................................................................................67
CHANGES IN THE AGRICULTURAL SECTOR ...................................................67
9.0 INTRODUCTION .............................................................................................67
9.1 CHARACTERISTICS OF AGRICULTURAL HOUSEHOLDS (AG HHS) ........69
9.2 MEDIAN LAND HOLDING SIZE......................................................................71
9.3 LIVESTOCK AND POULTRY NUMBERS.......................................................72
9.4 FISHING...........................................................................................................73
9.5 EXTENSION SERVICES...............................................................................74
9.6 SUMMARY OF FINDINGS ............................................................................76

iv
CHAPTER TEN......................................................................................................77
TEACHER AND HEALTH WORKER ABSENTEEISM..........................................77
10.0 EDUCATION SYSTEM OF UGANDA ...........................................................77
10.1 GENERAL SCHOOL CHARACTERISTICS ..................................................77
10.2 TEACHER CHARACTERISTICS.................................................................80
10.3 HEALTH CARE SYSTEM OF UGANDA .......................................................83
10.4 GENERAL HEALTH FACILITY CHARACTERISTICS ................................84
10.5 HEALTH WORKER ABSENTEEISM.............................................................86
10.6 SUMMARY OF FINDINGS ............................................................................88
CHAPTER ELEVEN...............................................................................................89
FAMILY PLANNING...............................................................................................89
11.0 INTRODUCTION.............................................................................................89 11.1 KNOWLEDGE OF CONTRACEPTIVE METHODS..................................................89 11.2 EVER USE OF CONTRACEPTIVES ....................................................................91 11.3 CURRENT USE OF CONTRACEPTIVES .............................................................93 11.4 SUMMARY OF FINDINGS.................................................................................96
LIST OF REFERENCES........................................................................................97
QUESTIONNAIRE .................................................................................................98

1
LIST OF TABLES Table 1.1: Overview of Household Questionnaire .......................................................................11 Table 1.2: Attrition Rates and Reasons for Attrition (%) ..............................................................14 Table 2.1: Changes in Household Size over the two Survey Periods (%)...................................16 Table 2.2: Average Household Size by Place of Residence .......................................................16 Table 2.3: Change in the place of residence of Persons over the two survey years (%) ............17 Table 2.4: Changes in Marital status of persons 10 years and above (%)..................................18 Table 2.5: Marital status of persons by sex and age (%).............................................................19 Table 3.1: Transitions in Literacy status for Respondents 12 years and above by selected
background characteristics (2005/06-2009/10) ...........................................................................22 Table 3.2: Changes in the Distance Traveled to Nearest Primary School by Day Scholars over
the two survey years ....................................................................................................................22 Table 3.3: Reasons for not attending school for persons of school going age............................23 Table 3.4: Changes in the Distribution of Children by type of Management of School ...............24 Table 3.5: Type of School Attended.............................................................................................24 Table 4.1: Labour market indicators of the working age population 14-64..................................25 Table 4.2: Transition in activity status..........................................................................................26 Table 4.3: Entered the work force by Background Characteristics..............................................28 Table 4.4: Entered the work force by occupation, industry and status in employment ...............29 Table 4.5: Entered the work force by Education Attainment........................................................30 Table 4.6: Entered the work force by reason of being not economically active in 2005/06.........30 Table 4.7: Changes in occupation by background characteristics ..............................................31 Table 4.8: Changes in occupation by education..........................................................................31 Table 4.9: Distribution of changes by occupation ........................................................................32 Table 4.10: Changed industry by background characteristics.....................................................33 Table 4.11: Changed industry by education and status in employment ......................................33 Table 4.12: Distribution of those who changed industry ..............................................................34 Table 4.13: Transition of the working population in sectors.........................................................35 Table 4.14: Transition of the working population by status in employment .................................35 Table 4.15: Wage quintile mobility matrix for persons in paid employment.................................36 Table 5.1: Transitions in the Health Status of Household Members 30 days prior to the survey
between 2005/06 and 2009/10 by Sex, Residence and Region (%) ...........................................38 Table 5.2: Changes in Prevalence Rates of illnesses/major symptoms suffered within 30 days
prior to the survey (%)..................................................................................................................39 Table 5.3: Transitions in the type of facility where patients first sought medical care for the two
survey periods (%) .......................................................................................................................40 Table 5.4: Transitions in the major reasons for not seeking medical attention for the major
illness suffered (%).......................................................................................................................40 Table 6.1: Share of Household Expenditure by Item Groups (%) ...............................................44 Table 6.2: Poverty Transition Matrix 2005/06-2009/2010............................................................44
2
Table 6.3: Transitions in Poverty status of households (2005/06 - 2009/10) ..............................45 Table 6.4: Transitions in Poverty status of households by Residence 2005/06- 2009/10...........45 Table 6.5: Main economic activity by poverty status 2005/06 - 2009/10 ....................................46 Table 6.6: Poverty Status by Sector 2005/06 - 2009/10 ..............................................................47 Table 7.1: Possession of at Least Two Sets of Clothes by Residence (%).................................49 Table 7.2: Possession of at Least Two Sets of Clothes by Region (%) ......................................49 Table 7.3: Possession of Blanket by Residence (%) ...................................................................50 Table 7.4: Possession of Blanket by Region (%)........................................................................50 Table 7.5: Possession of a Pair of Shoes by every Household member(s) by Residence .........51 Table 7.6: Possession of a Pair of Shoes by every Household member(s) by Region (%) ........51 Table 7.7: Feeding Practices of Households in regards to a number of Meals taken per Day by
Residence ....................................................................................................................................52 Table 7.8: Feeding Practices of Households in regards to a number of Meals taken per Day by
Region ..........................................................................................................................................53 Table: 7.9: Changes in Ownership of Assets 2005/06-2009/10 ..................................................55 Table 8.1: Transitions in Type of Dwelling Units by Residence and Region (%) ........................58 Table 8.2: Transitions in Tenure status of Dwelling Unit by Residence and Region (%) ............59 Table 8.3: Transitions in Roof Type by Residence and Region (%)............................................61 Table 8.4: Transitions in Wall type by Residence and Region (%)..............................................62 Table 8.5: Transitions in Floor type by Residence and Region (%) ............................................63 Table 8.6: Transitions in use of Water sources by Residence and Region (%) ..........................64 Table 8.7: Transitions in Type of Toilet Facilities by Residence and Region (%) .......................66 Table 9.1: Distribution of Agricultural households by Region and survey year (%).....................69 Table 9.2: Transitions of households into and out of agriculture (%) ..........................................70 Table 9.3: Average household size of households engaged in agriculture by region .................70 Table 9.4: Changes in headship for Ag HHs (%).........................................................................71 Table 9.5: Median Land Holding Size ..........................................................................................71 Table 9.6: Percentage number of households owning parcels....................................................72 Table 9.7: Mean Herd size per household by region ...................................................................72 Table 9.8: Households engaged in fishing activities (2009/10) ...................................................73 Table 9.9: Average daily Catch and Value (2009/10) ..................................................................74 Table 9.10: Agricultural Households Visited by and extension worker (%) .................................75 Table 9.11: Number of extension worker visits to Agricultural Households (%)..........................75 Table 10.1: Availability and adequacy of facilities in schools by ownership (%) .........................78 Table 10.2: Services/Items provided by schools and whether schools charge for them by
ownership (%) ..............................................................................................................................79 Table 10.3: Distribution of schools by pupils’ access to essential school requirements/items (%)
......................................................................................................................................................79 Table 10.4: Teacher Qualification by sex and type of ownership (%) .........................................81 Table 10.5: Teacher qualification by grade category, sex, and type of ownership......................81 Table 10.6: Teacher Absenteeism by grade category and sex of Teacher (%) ..........................82 Table 10.7: Reasons for Absenteeism by grade categories, sex and ownership........................83

3
Table 10.8: Level of health facility by ownership .........................................................................84 Table 10.9: Availability of equipment and services at the health facility......................................85 Table 10.10: Absenteeism faced in last 12 months as Reported by Respondent (%) ................86 Table 10.11: Government Health worker Absenteeism rates by Level of Health Center, sex and
Function........................................................................................................................................87 Table 10.12: Reasons for absenteeism among Government health workers of HC II and HC III
(%) ................................................................................................................................................87 Table 11.1: Knowledge of contraceptive methods (%) ................................................................90 Table 11.2: Knowledge of contraceptive methods by region (%) ................................................90 Table 11.3 Ever use of contraception (%)....................................................................................91 Table 11.4: Ever use of Contraceptives by Region .....................................................................92 Table 11.5: Percentage distribution of all women currently using contraceptives by residence .94 Table 11.6 Current Use of contraception by Region (%) .............................................................94 Table 11.7: Current use of contraception by Rural Urban residence and age-group..................95
4
LIST OF FIGURES
Figure 1.1: Distribution of Households by status of tracking (%).....................................12 Figure 4.1: Summary of change in activity status ............................................................27 Figure 8.1: Households that Reported not having Enough Food to feed in the Last 12 Months
preceding the survey (%) .................................................................................................54 Figure 11.1: Distribution of most commonly used school by type of ownership (%) .......78 Figure 11.2: Learner Attendance by grade category and type of ownership...................80 Figure 11.3: Distribution of most commonly used Health Facilities in Uganda ...............84 Figure 12.1: Ever Use of contraceptive Methods by Residence......................................92 Figure 12.2: Current use of contraception among married women .................................93

5
LIST OF ACRONYMS Ag hhs Agricultural Households
CPR Contraceptive Prevalence Rate
EA Enumeration Area
EPR Employment to Population Ratio
GoU Government of Uganda
GPS Global Positioning System
HC Health Center
HSSP Health Sector Strategic Plan
ILO Internal Labour Organisation
LC I Local Council
LFPR Labour Force Participation Rate
MDGs Millennium Development Goals
MoES Ministry of Education and Sports
MOH Ministry of Health
NAADS National Agricultural Advisory Services
NDP National Development Plan
NEA Not Economically Active
NHP National Health Policy
NSDS National Service Delivery Survey
PEAP Poverty Eradication Action Plan
PFA Prosperity for All
PHC Population and Housing Census
PMA Plan for Modernization of Agriculture
RDS Rural Development Strategy
UBOS Uganda Bureau of Statistics
UDHS Uganda Demographic Health Survey
UNHS Uganda National Household Survey
UNPS Uganda National Panel Survey
UPE Universal Primary Education
USE Universal Secondary Education

6
EXECUTIVE SUMMARY The demand for and use of data for evidence-based policy and decision making has extended
beyond the confines of administrative boundaries to cover household activities and behavior.
Monitoring changes at household level through household surveys has, therefore, become more
important now than ever before. The Uganda Bureau of Statistics (UBOS) has been carrying out
Integrated Household Surveys (IHS) popularly known as Uganda National Household Surveys
(UNHS). In a bid to track the key outcome indicators on an annual basis; UBOS undertook the
Uganda National Panel Survey (UNPS) whose purpose was to fill the existing data gaps by
providing annual data to monitor the PEAP and its successor the National Development Plan
(NDP).
The data will be the main source of statistical information for monitoring changes and transitions
in poverty dynamics, trends and related welfare indicators. The 2009/10 UNPS was undertaken
from September 2009 to August 2010. Using the 2005/06 UNHS as its baseline, 3200 out of the
7400 households were scientifically selected and followed for re-interview. The survey was
comprehensive and had five modules, namely; Socio-economic, Agriculture, Woman,
Community and Price modules.
Over the two survey periods, three percent of persons who shifted from the urban to rural areas
over the two survey period were mainly those in the Northern region who were resettling from
the IDP camps. Divorce rates for those who were married in 2005/06 were highest in the
Central region (7%) by the time of the survey in 2009/10. Nine percent of the households that
comprised of one person in 2005/06 had grown to more than five members in 2009/10.
Twenty six percent of respondents aged 12 years and above, who were illiterate in 2005/06
were literate at the time of the 2009/10 UNPS. Males were more likely to have become literate
(38%) as compared to females (19%). The cost of schooling being too expensive was the main
reason given for leaving school. Fifteen percent of children who were in boarding schools in
2005/06 were now attending day schools. Thirty six percent of children who were attending
private schools in 2005/06 were now attending those managed by government while 20 percent
of children in government managed schools in 2005/06 had joined privately managed schools in
2009/10.
The working population increased by 10 percent over the two survey periods. On the other
hand, the not economically active population decreased by 22 percent while the Employment to
Population Ratio (EPR) increased from 73 percent to 80 percent over two the survey periods. Of
the persons who were not economically active in 2005/06, 42 percent maintained the same
activity status in 2009/10; two percent became unemployed, 51 percent went in self employment
while six percent went in paid employment. More than three quarters of the working age
population did not change their activity status; 15 percent of the not economically active became
7
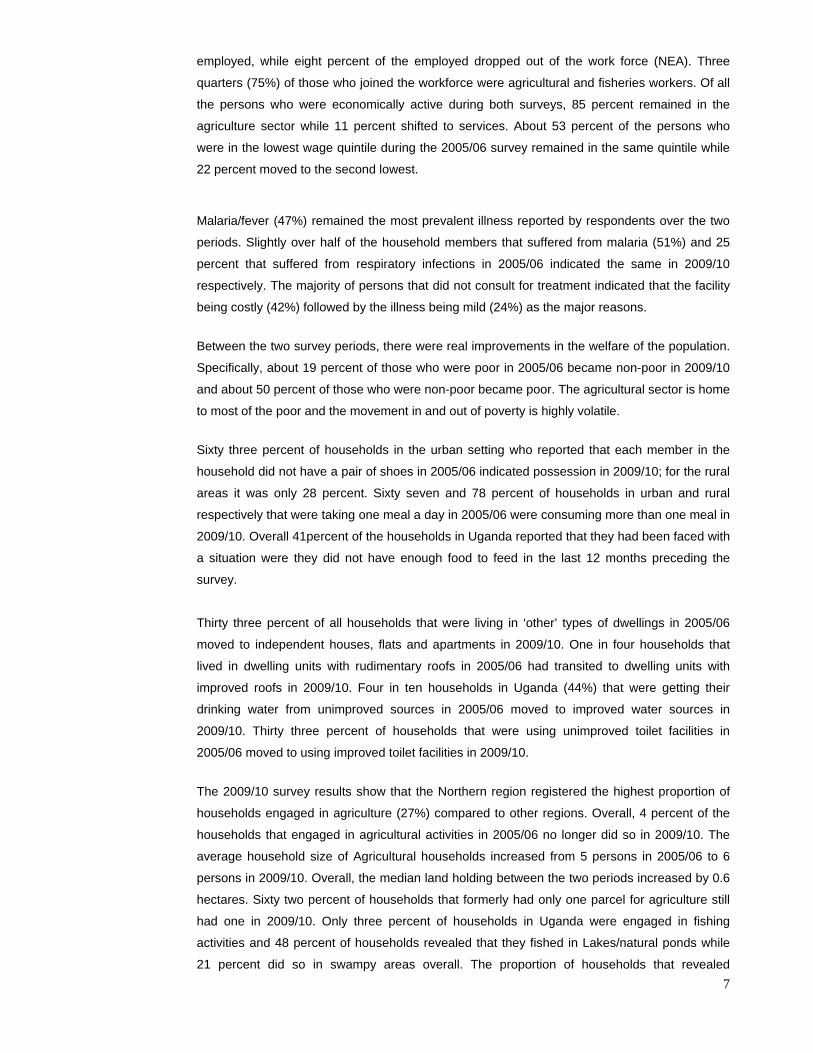
employed, while eight percent of the employed dropped out of the work force (NEA). Three
quarters (75%) of those who joined the workforce were agricultural and fisheries workers. Of all
the persons who were economically active during both surveys, 85 percent remained in the
agriculture sector while 11 percent shifted to services. About 53 percent of the persons who
were in the lowest wage quintile during the 2005/06 survey remained in the same quintile while
22 percent moved to the second lowest.
Malaria/fever (47%) remained the most prevalent illness reported by respondents over the two
periods. Slightly over half of the household members that suffered from malaria (51%) and 25
percent that suffered from respiratory infections in 2005/06 indicated the same in 2009/10
respectively. The majority of persons that did not consult for treatment indicated that the facility
being costly (42%) followed by the illness being mild (24%) as the major reasons.
Between the two survey periods, there were real improvements in the welfare of the population.
Specifically, about 19 percent of those who were poor in 2005/06 became non-poor in 2009/10
and about 50 percent of those who were non-poor became poor. The agricultural sector is home
to most of the poor and the movement in and out of poverty is highly volatile.
Sixty three percent of households in the urban setting who reported that each member in the
household did not have a pair of shoes in 2005/06 indicated possession in 2009/10; for the rural
areas it was only 28 percent. Sixty seven and 78 percent of households in urban and rural
respectively that were taking one meal a day in 2005/06 were consuming more than one meal in
2009/10. Overall 41percent of the households in Uganda reported that they had been faced with
a situation were they did not have enough food to feed in the last 12 months preceding the
survey.
Thirty three percent of all households that were living in ‘other’ types of dwellings in 2005/06
moved to independent houses, flats and apartments in 2009/10. One in four households that
lived in dwelling units with rudimentary roofs in 2005/06 had transited to dwelling units with
improved roofs in 2009/10. Four in ten households in Uganda (44%) that were getting their
drinking water from unimproved sources in 2005/06 moved to improved water sources in
2009/10. Thirty three percent of households that were using unimproved toilet facilities in
2005/06 moved to using improved toilet facilities in 2009/10.
The 2009/10 survey results show that the Northern region registered the highest proportion of
households engaged in agriculture (27%) compared to other regions. Overall, 4 percent of the
households that engaged in agricultural activities in 2005/06 no longer did so in 2009/10. The
average household size of Agricultural households increased from 5 persons in 2005/06 to 6
persons in 2009/10. Overall, the median land holding between the two periods increased by 0.6
hectares. Sixty two percent of households that formerly had only one parcel for agriculture still
had one in 2009/10. Only three percent of households in Uganda were engaged in fishing
activities and 48 percent of households revealed that they fished in Lakes/natural ponds while
21 percent did so in swampy areas overall. The proportion of households that revealed
8
receiving advice in or for agricultural activities in 2009/10 had increased to 24 percent compared
to only six percent in 2005/06
Overall, pupils in 26 and 36 percent of government and other schools do not have any access to
text books in the classroom. In terms of learner attendance, the majority lower primary pupils i.e.
45 and 48 percent of government and other schools did not attend class on the day of interview
respectively. Overall; teacher absenteeism was higher in government schools (20%) compared
to only nine percent in other schools. irrespective of the type of ownership, majority of teachers
(over 20%) were on the school premises but not in class at the time of the interview.
Forty eight and 46 percent of government health providers in Health centers II and III were
absent at the time of interview respectively. The major reason for absenteeism in HC II was that
the health worker was off-duty/night duty (37%) while 13 percent were absent without reason.
The major reasons for absenteeism among health workers in HC III were that the health worker
was off-duty/night duty (35%) followed by absent for no reason (13%) and annual/maternity
leave (10%)
Overall, knowledge of contraception is almost universal in Uganda with 99 percent of currently
married women having heard of at least one method of contraception. The pill, injectables, and
condom are the most widely known modern methods among women. Seven in every ten
currently married women have used a family planning method at least once in their lifetime.
Thirty eight percent of currently married women are using a method of contraception. Modern
methods are more widely used than traditional methods, with 26 percent of currently married
women using a modern method and 13 percent using a traditional method. The most popular
modern method is the injectable used by twenty four percent of the currently married women.

9
CHAPTER ONE INTRODUCTION
1.0 Overview Household surveys are an important source of information for monitoring outcome and impact
indicators of national and international development frameworks. Since 1989, the Uganda
Bureau of Statistics (UBOS) has conducted large-scale surveys that have nationwide coverage
with varying core modules and objectives.
The Government of Uganda developed a results matrix to track progress in achieving the
objectives of the National development framework. Many of the indicators identified in the PEAP
matrix (poverty, access to clean water, governance) could only be collected through household
surveys. The frequency at which the surveys are implemented has not enabled tracking of the
outcome indicators on an annual basis. The Uganda National Panel Survey (UNPS) aims to fill
this gap by providing annual data to monitor the PEAP and its successor the National
Development Plan (NDP). In addition, considering the scarcity of accurate information required
for monitoring the progress of policies, a panel survey which tracks households on an annual
basis is better suited to inform policy makers about growth and the reasons for change (in
income, poverty or service delivery). It also cross-checks the validity of routine data systems
and provides frequent feedback on the performance of key government programmes.
The collection of data from the same households annually, and setting up structures for
independent analysis of the data, the UNPS will provide analyses that will allow the Government
of Uganda, Civil Society Organisations and Development Partners to significantly improve their
understanding of the reasons for change.
1.1 Survey Objectives The overall objective of the panel survey was to collect high quality data on key outcome
indicators such as poverty, service delivery, governance and employment among others; to
monitor Government’s development programmes like the PEAP and its successor the NDP on
an annual basis.
The specific objectives of the survey were:
• To provide information required for monitoring the PEAP (and its successor the NDP)
and other development objectives like the Millennium Development Goals (MDGs) as
well as specific programs such as National Agricultural Advisory Services (NAADS).
• To provide high quality nationally representative information on income dynamics at the
household level as well as annual consumption expenditure estimates to monitor
poverty in years between Uganda National Household Surveys (UNHS)

10
• To supply regular data on agriculture in order to characterise and monitor the
performance of the agricultural sector.
• To produce an annual Uganda Development Report.
1.2 Scope and Coverage
During the 2009/10 UNPS, all the 80 districts in Uganda as of 2009 were covered. Five modules
were administered to suit the survey’s multiple objectives. These included the Socio-economic,
Woman, Agriculture, Community and Price modules. These core modules may be revised after
a given period of time to account for the changing socio-economic environment; though they are
generally expected to remain the same in every annual survey round to ensure comparability.
The details of each of the modules are highlighted below:
1. The Socio-economic questionnaire covers a set of core sections which will be
implemented annually. This questionnaire collects information on household
characteristics including education and literacy, the health status, health seeking
behavior and disability status of household members, child nutrition and health, Labour
force status, housing conditions, water and sanitation, energy use, incomes and use of
financial services, household assets, household expenditure and per capita
consumption, shocks and coping strategies, welfare indicators and food security;
transport services and infrastructure.
2. The agriculture questionnaire covers the subset of UNPS households engaged in
agricultural activities such as crop and/or livestock production. The questionnaire
focuses on questions to do with; land, livestock ownership and main crops. The
extensive agricultural module allows for the annual estimation of land area, both owned
and cultivated, as well as production figures for main crops and livestock among others.
In intermittent years, the collection of additional information for the characterisation of
the sector, e.g. access to extension services and irrigation facilities, will also be
pursued.
3. The Woman questionnaire targets women of reproductive age (15-49 years). It
specifically collects information on knowledge and use of contraceptives for purposes of
measuring the current contraceptive prevalence rate in Uganda.
4. The Community survey questionnaire collects information about the general
characteristics of the community (LC I), availability and access to community facilities,
client satisfaction with the health services provided, education and health infrastructure
with a special interest in teacher and health worker absenteeism; as well as works and
transport.
5. The Price module was undertaken to provide standard equivalents of non-standard
units through weighing items sold in markets. This entailed visiting some markets in the
sampled Enumeration Areas (EAs) and weighing the various items being sold. In cases

11
where there was no market/ trading centre, the market most frequented by the residents
of the sampled EA would be visited and measurements taken. Different local prices and
their non-standard units which in many cases are used in selling various items were
collected in this module. Since the price and units of measurement for different items
vary across regions and in some cases across districts, they were measured and an
equivalent in standard units recorded.
In addition to the core modules, which are fairly comprehensive, the design of the UNPS allows
for the introduction of thematic modules on a rotational basis. Rotating modules will be added to
the UNPS to capture information on outcomes that either might not change quickly over time
(e.g. perceptions such as those currently captured in the National Service Delivery Surveys
(NSDS) or in the Corruption surveys); or those that reflect recent policies and programs of
interest. There may also be questions that could be included as a result of special interest such
as a module to test the abilities of primary school pupils.
Table 1.1: Overview of Household Questionnaire Core Modules
Section Level of observations
A Survey information Household
B Household member roster Individual
C Education Individual
D Health Individual
F Labor and Time Use (Adults and Children 10+) Individual
G Housing Household
H Water, Sanitation and Energy Use Household
I Consumption of Food (recall) -core Household
J Household non-food consumption -core Household
K Agriculture (core module) Household
L Assets Household
M Household Enterprises Enterprise
N Transfers and remittances Household
O Credit Loans
P Recent Shocks Household
Rotating (optional) Modules
Non-core topics
Examples: Nutrition and anthropometrics, perceptions about government services, sanitation and crime among others
1.3 Survey Design
The sample for the 2009/10 UNPS was designed to revisit some of the very households that
participated in the 2005/06 UNHS. Households were tracked and re-interviewed using
identification particulars available in the 2005/06 UNHS. Out of the 7,400 households

12
interviewed during the UNHS 2005/06, about 3,200 households were selected for the 2009/10
UNPS. During data collection, households that had migrated to known places were followed-up
and re-interviewed based on the contact information provided by knowledgeable persons.
1.4 Tracking Tracking considers the mobility of the target population, the success with which those who move
are found and interviewed, and the number of refusals. During the 2009/10 UNPS data
collection phase, tracking was done at both household and individual levels. The tracking
targeted all the 3123 households that had been selected for the panel survey. In addition, 20
percent of the targeted households were considered for individual tracking also known as split-
offs tracking.
1.4.1 Tracking of households
The UNPS aimed at tracking all the 3123 original (2005/06 UNHS) households including those
that could have shifted from their original location in 2005/06 to any other location; either within
the same EA or outside. These were referred to as shifted households. An original household
refers to one that was found in same location as during the 2005/06 UNHS.
Figure 1.1 shows the distribution of the households by the tracking status. Out of the 3123
original households, 2604 (83%) were tracked and found, 309 households had shifted to an
unknown destination and could not be traced, 73 had disintegrated, 36 had died while 10
households were away for a very long period of time.
Figure 1.1: Distribution of Households by status of tracking (%)
2.9
0.3
1.2
2.3
9.9
83.4
0.0 10.0 20.0 30.0 40.0 50.0 60.0 70.0 80.0 90.0
Other*
Absent for extended period
Died
Disintegrated
Shifted
Found
Stat
us o
f Tra
ckin
g
Proportion
Other* includes household not known, more information needed to locate household.
13
1.4.2 Tracking of Individuals/split-offs
As part of the management of individual/split-off tracking, a 20 percent sample of households
was drawn from each of the 322 Enumeration Areas selected for the UNPS. The intention was
to calibrate the size and composition of the sample of traceable split-offs (referred to as tracking
targets) in order to compensate for losses due to attrition.
A random sub-sample of 20 percent (two households) from each EA was drawn from the
already sampled panel households. If it the household indicated that any of the persons that
were members in 2005/06 had left, those movers referred to as split-offs would be followed.
Once a split-off was identified, all the necessary contact information on the split-off/mover as
well as new location was first gathered from the original household members and any other
knowledgeable person. The information was then entered into an individual tracking form.
Based on the available details, the mover was contacted, traced and interviewed. All
interviewed movers/split-offs then became part of the panel households and will be interviewed
in every wave of the UNPS just like the original households.
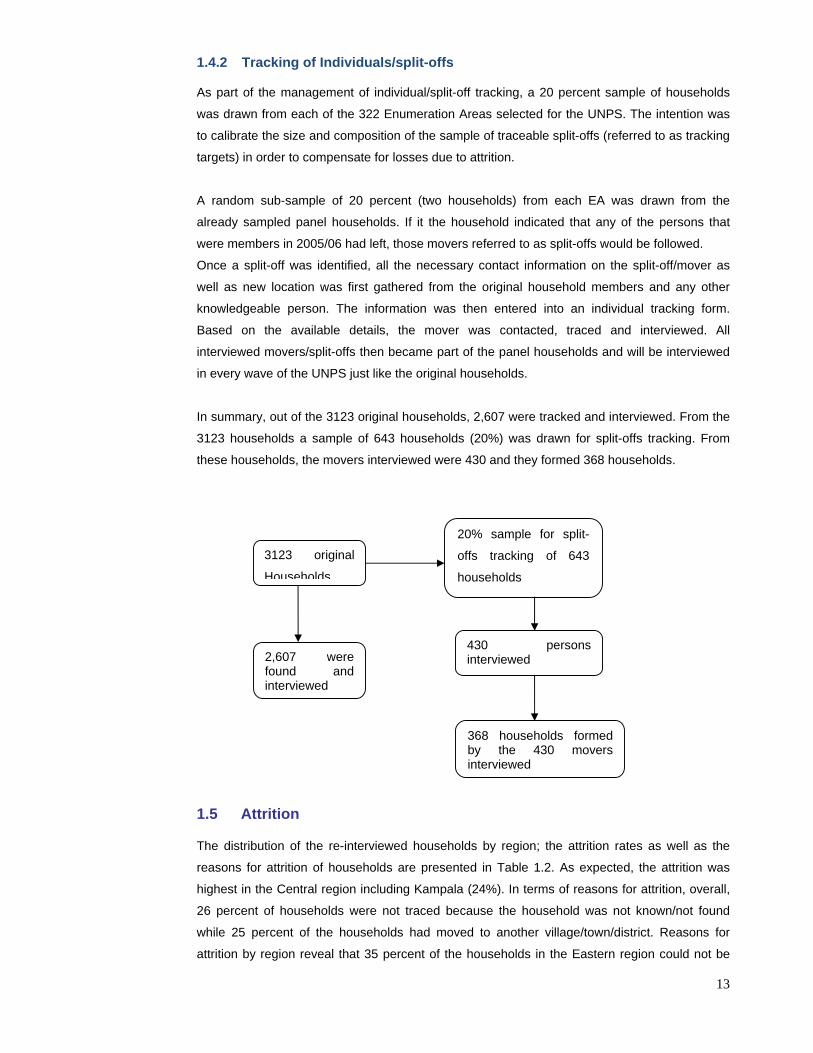
In summary, out of the 3123 original households, 2,607 were tracked and interviewed. From the
3123 households a sample of 643 households (20%) was drawn for split-offs tracking. From
these households, the movers interviewed were 430 and they formed 368 households.
1.5 Attrition
The distribution of the re-interviewed households by region; the attrition rates as well as the
reasons for attrition of households are presented in Table 1.2. As expected, the attrition was
highest in the Central region including Kampala (24%). In terms of reasons for attrition, overall,
26 percent of households were not traced because the household was not known/not found
while 25 percent of the households had moved to another village/town/district. Reasons for
attrition by region reveal that 35 percent of the households in the Eastern region could not be
3123 original
Households
20% sample for split-
offs tracking of 643
households
2,607 were found and interviewed
430 persons interviewed
368 households formed by the 430 movers interviewed

14
traced because they had moved to another village/town/district while 34 percent of households
in the Northern region had disintegrated. The response rate at the household level for those that
had been traced and re-interviewed was 82 percent.
Table 1.2: Attrition Rates and Reasons for Attrition (%)
Region
Central Eastern Northern Western Overall
Households selected from UNHS 2005/06 1,024 701 695 703 3,123
Households interviewed in UNPS 2009/10 775 595 621 575 2,566
Households not interviewed 249 106 74 128 557
Attrition Rate (%) 24.3 15.1 10.7 18.2 17.8
Reasons for Attrition
Refused 3.8 10.3 3.1 0.0 4.7
No competent respondent at time of visit 0.5 0.0 0.0 0.0 0.3
HH not known/not found 32.3 17.2 16.9 15.4 25.8
HH disintegrated 9.1 6.9 33.9 7.7 13.7
Not at home for extended periods 6.5 5.2 6.2 7.7 6.2
Dwelling destroyed 0.0 5.2 1.5 0.0 1.2
Moved to another village/town/district 23.7 34.5 21.5 7.7 24.5
Moved to a neighbouring country 0.5 1.7 7.7 0.0 2.2
Shifted to unknown location 19.9 10.3 4.6 0.0 14.3
Transferred due to work/education 0.0 3.5 3.1 0.0 1.2
Not stated 3.8 5.2 1.5 61.5 5.9
Total 100.0 100.0 100.0 100.0 100.0
1.6 Survey Organization
A centralized approach to data collection was employed whereby 9 mobile field teams recruited
from the headquarters were dispatched to different sampled areas. Each team consisted of one
Supervisor, three Enumerators, one data entrant and one Driver. The teams were recruited
based on the languages mostly used in each of the four statistical regions. The field teams
visited UNPS households two times in a year in order to capture seasonality for the households
engaged in agricultural activities.
1.7 Data Processing and Management
A system of field-based data entry was utilized to guarantee good quality data. Range and
consistency checks were included in the data-entry program. Any errors realized while still in
the field were corrected accordingly.
1.8 Funding The Royal Netherlands Kingdom provided the financial support that enabled the first wave of the
survey.

15
CHAPTER TWO CHARACTERISTICS OF HOUSEHOLDS AND HOUSEHOLD POPULATION
2.0 Introduction This chapter presents the demographic characteristics of the sample household population in
Uganda including composition by age and sex, residence, household size and marital status.
Population censuses have been and remain Uganda’s main source of socio-demographic data.
Other sources of socio-economic data at national level in the country include Demographic and
Health Surveys (UDHS), National Household Surveys (UNHS) and National Service Delivery
Surveys (NSDS).
One of the objectives of the National Development Plan is to integrate population factors and
variables at various levels of development planning. Since the last Population and Housing
Census of 2002, two Uganda National Household Surveys 2005/06 and 2009/10 have been
conducted to provide estimates on various household characteristics. The 2005/06 UNHS
(UNPS baseline) collected information on various demographic characteristics of household
members including age, sex, residence, marital status and relationship to household head
among others.
UNPS collected information on personal characteristics of household members in the selected
households. The survey also sought to identify changes in the various demographic
characteristics of the household members such as age, sex, relationship to the household head,
marital status and household size among others. The changes and transitions in the afore-
mentioned indicators across the two survey periods are presented in this chapter.
2.1 Household Characteristics The UNPS defined a household as a group of persons who normally cook, eat and live together.
Household characteristics are key variables for determining the demographic characteristics of
a population and affect the social and economic well-being of the members of the household.
Large household size may be associated with crowding, which can lead to unfavorable health
conditions. Single-parent families, especially if they are headed by females, usually have limited
financial resources.
2.1.1 Household size
Household size refers to the number of usual members in a household. Usual members are
defined as those who have lived in the household for at least 6 months in the past 12 months;
however, they also include persons who may have spent less than 6 months during the last 12
months in the household with the intention to live permanently or for an extended period of time.
16
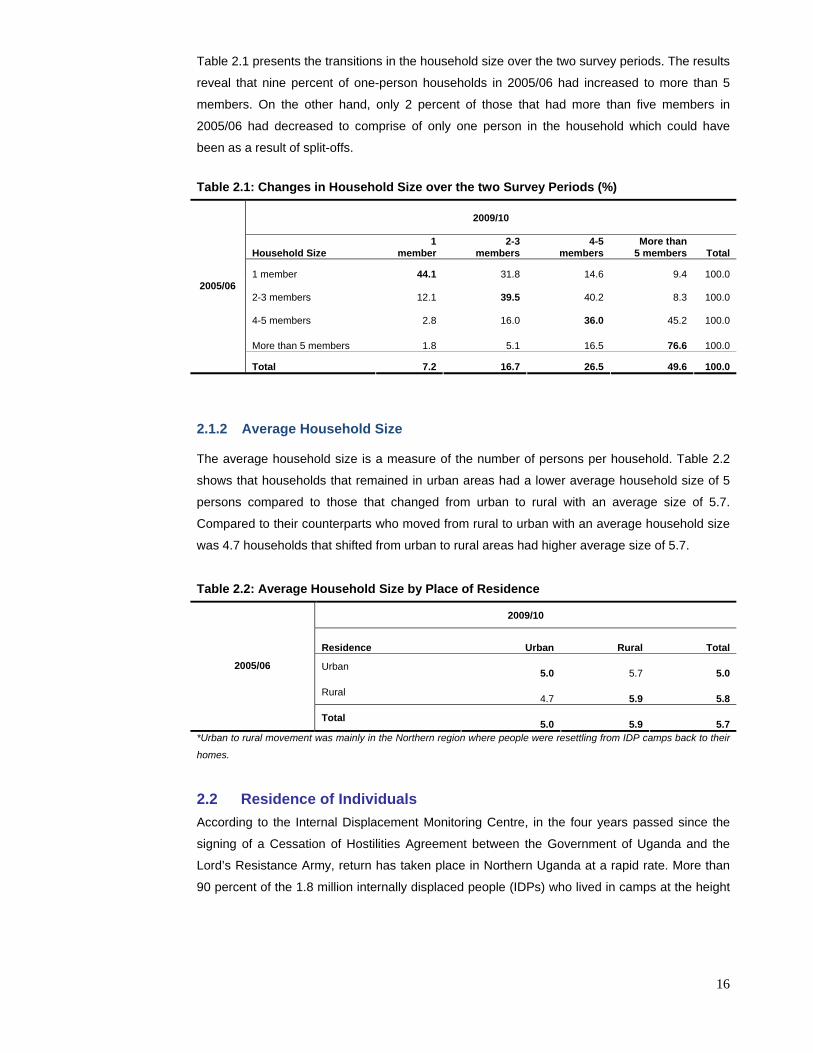
Table 2.1 presents the transitions in the household size over the two survey periods. The results
reveal that nine percent of one-person households in 2005/06 had increased to more than 5
members. On the other hand, only 2 percent of those that had more than five members in
2005/06 had decreased to comprise of only one person in the household which could have
been as a result of split-offs.
Table 2.1: Changes in Household Size over the two Survey Periods (%)
2009/10
Household Size 1
member 2-3
members 4-5
members More than
5 members Total
1 member 44.1 31.8 14.6 9.4 100.0
2-3 members 12.1 39.5 40.2 8.3 100.0
4-5 members 2.8 16.0 36.0 45.2 100.0
More than 5 members 1.8 5.1 16.5 76.6 100.0
2005/06
Total 7.2 16.7 26.5 49.6 100.0
2.1.2 Average Household Size
The average household size is a measure of the number of persons per household. Table 2.2
shows that households that remained in urban areas had a lower average household size of 5
persons compared to those that changed from urban to rural with an average size of 5.7.
Compared to their counterparts who moved from rural to urban with an average household size
was 4.7 households that shifted from urban to rural areas had higher average size of 5.7.
Table 2.2: Average Household Size by Place of Residence
2009/10
Residence Urban Rural Total
Urban 5.0 5.7 5.0
Rural 4.7 5.9 5.8
2005/06
Total 5.0 5.9 5.7 *Urban to rural movement was mainly in the Northern region where people were resettling from IDP camps back to their
homes.
2.2 Residence of Individuals According to the Internal Displacement Monitoring Centre, in the four years passed since the
signing of a Cessation of Hostilities Agreement between the Government of Uganda and the
Lord’s Resistance Army, return has taken place in Northern Uganda at a rapid rate. More than
90 percent of the 1.8 million internally displaced people (IDPs) who lived in camps at the height

17
of the crisis have returned to their areas of origin or have resettled in new locations. Only an
estimated 182,000 IDPs remain in camps or transit sites as of December 20101.
Table 2.3 shows that two percent of persons had changed their residence from urban to rural
areas. This could have mainly been driven by the resettlement of people from the IDP camps in
the Northern region. Only a negligible percentage of persons (less than one percent) indicated
that they had moved from rural to urban areas over the two survey periods; possibly for
economic reasons.
Table 2.3: Change in the place of residence of Persons over the two survey years (%)
2009/10
Residence Urban Rural Total
Urban 97.8 2.2 100.0
Rural 0.5 99.5 100.0
2005/06
Total 16.0 84.0 100.0 *Urban to rural movement was mainly in the Northern region where people were resettling home from IDP camps.
2.3 Marital Status of Household members
Information on marital status is useful in studying the change in trends of widowhood, marriage
practices and the occurrence of under-age marriages. Uganda’s statutory minimum age for
marriage is 18 years. The question on marital status was administered to all household
members aged 10 years and above at the time of the two surveys. The changes in the marital
status of the persons interviewed during the survey are those that occurred over the five year
period and are presented in Table 2.4.
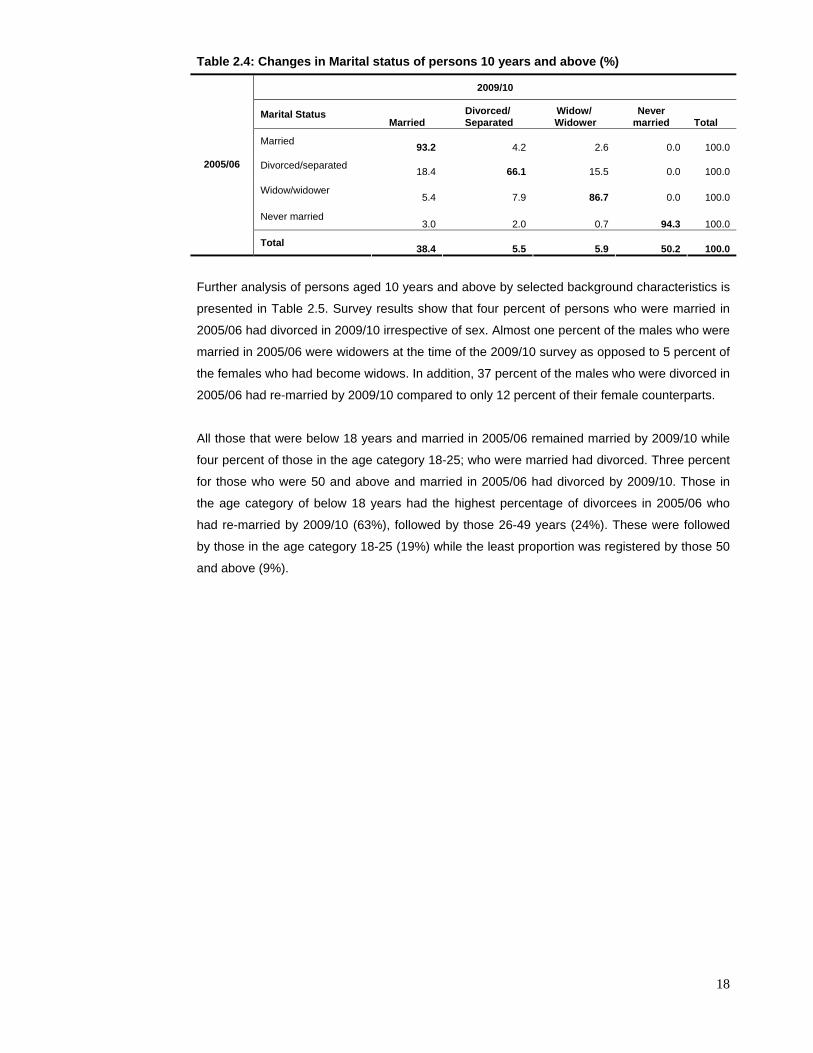
The survey findings show that four percent of the persons who were married in 2005/06 were
divorced by the time of the survey in 2009/10 while 3 percent were widows or widowers.
Eighteen percent of those that were divorced in 2005/06 had re-married while only five percent
of the widows or widowers had re-married by 2009/10. Only three percent of those who were
never married in 2005/06 were married in 2009/10 while two percent had already divorced.
1 http://www.internal-displacement.org
18
Table 2.4: Changes in Marital status of persons 10 years and above (%)
2009/10
Marital Status Married
Divorced/ Separated
Widow/ Widower
Never married Total
Married 93.2 4.2 2.6 0.0 100.0
Divorced/separated 18.4 66.1 15.5 0.0 100.0
Widow/widower 5.4 7.9 86.7 0.0 100.0
Never married 3.0 2.0 0.7 94.3 100.0
2005/06
Total 38.4 5.5 5.9 50.2 100.0
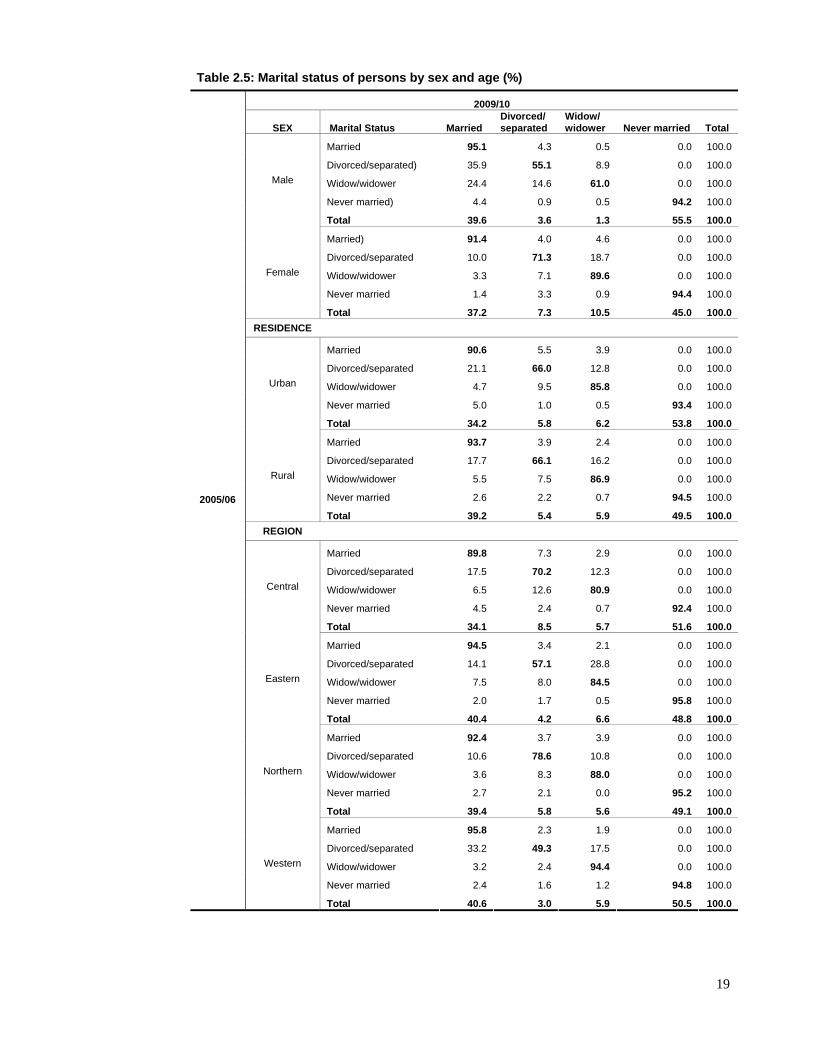
Further analysis of persons aged 10 years and above by selected background characteristics is
presented in Table 2.5. Survey results show that four percent of persons who were married in
2005/06 had divorced in 2009/10 irrespective of sex. Almost one percent of the males who were
married in 2005/06 were widowers at the time of the 2009/10 survey as opposed to 5 percent of
the females who had become widows. In addition, 37 percent of the males who were divorced in
2005/06 had re-married by 2009/10 compared to only 12 percent of their female counterparts.
All those that were below 18 years and married in 2005/06 remained married by 2009/10 while
four percent of those in the age category 18-25; who were married had divorced. Three percent
for those who were 50 and above and married in 2005/06 had divorced by 2009/10. Those in
the age category of below 18 years had the highest percentage of divorcees in 2005/06 who
had re-married by 2009/10 (63%), followed by those 26-49 years (24%). These were followed
by those in the age category 18-25 (19%) while the least proportion was registered by those 50
and above (9%).
19
Table 2.5: Marital status of persons by sex and age (%)
2009/10
SEX Marital Status Married Divorced/ separated
Widow/ widower Never married Total
Married 95.1 4.3 0.5 0.0 100.0
Divorced/separated) 35.9 55.1 8.9 0.0 100.0
Widow/widower 24.4 14.6 61.0 0.0 100.0
Never married) 4.4 0.9 0.5 94.2 100.0
Male
Total 39.6 3.6 1.3 55.5 100.0
Married) 91.4 4.0 4.6 0.0 100.0
Divorced/separated 10.0 71.3 18.7 0.0 100.0
Widow/widower 3.3 7.1 89.6 0.0 100.0
Never married 1.4 3.3 0.9 94.4 100.0
Female
Total 37.2 7.3 10.5 45.0 100.0 RESIDENCE
Married 90.6 5.5 3.9 0.0 100.0
Divorced/separated 21.1 66.0 12.8 0.0 100.0
Widow/widower 4.7 9.5 85.8 0.0 100.0
Never married 5.0 1.0 0.5 93.4 100.0
Urban
Total 34.2 5.8 6.2 53.8 100.0
Married 93.7 3.9 2.4 0.0 100.0
Divorced/separated 17.7 66.1 16.2 0.0 100.0
Widow/widower 5.5 7.5 86.9 0.0 100.0
Never married 2.6 2.2 0.7 94.5 100.0
Rural
Total 39.2 5.4 5.9 49.5 100.0 REGION
Married 89.8 7.3 2.9 0.0 100.0
Divorced/separated 17.5 70.2 12.3 0.0 100.0
Widow/widower 6.5 12.6 80.9 0.0 100.0
Never married 4.5 2.4 0.7 92.4 100.0
Central
Total 34.1 8.5 5.7 51.6 100.0
Married 94.5 3.4 2.1 0.0 100.0
Divorced/separated 14.1 57.1 28.8 0.0 100.0
Widow/widower 7.5 8.0 84.5 0.0 100.0
Never married 2.0 1.7 0.5 95.8 100.0
Eastern
Total 40.4 4.2 6.6 48.8 100.0
Married 92.4 3.7 3.9 0.0 100.0
Divorced/separated 10.6 78.6 10.8 0.0 100.0
Widow/widower 3.6 8.3 88.0 0.0 100.0
Never married 2.7 2.1 0.0 95.2 100.0
Northern
Total 39.4 5.8 5.6 49.1 100.0
Married 95.8 2.3 1.9 0.0 100.0
Divorced/separated 33.2 49.3 17.5 0.0 100.0
Widow/widower 3.2 2.4 94.4 0.0 100.0
Never married 2.4 1.6 1.2 94.8 100.0
2005/06
Western
Total 40.6 3.0 5.9 50.5 100.0

20
2.4 Summary of Findings
Three percent of persons who shifted from the urban to rural areas over the two survey period
were mainly those in the Northern region who were resettling from the IDP camps. Divorce
rates for those who were married in 2005/06 were highest in the Central region (7%) by the time
of the survey in 2009/10. Four percent of the females who were married in 2005/06 had become
widows. Overall, four percent of those who were married in 2005/06 were divorcees by 2009/10.
The findings also indicate that nine percent of the households that comprised of one person in
2005/06 had grown to more than five members in 2009/10.

21
CHAPTER THREE EDUCATION
3.0 Introduction
Education is universally recognized as one of the most fundamental building blocks for human
development and poverty reduction. It is key to attaining the Millennium Development Goals
(MDGs). Studies have further consistently shown that educational attainment has a strong effect
on the behaviour and attitudes of persons. The Uganda Government has over the years put
together a number of strategies to promote the right to education. Universal Primary Education
(UPE) was introduced in 1997 where boys and girls access primary schools and benefit
equitably. In 2007, Universal Secondary Education (USE) was also introduced.
It is in this regard, that most surveys conducted include questions on education to keep track of
the status and progress made in this sector over time. The UNPS included a set of questions on
schooling status of children, reasons for not attending school, ownership and management of
schools, distance to nearest schools among others. This chapter comprises of some indicators
that have been generated from the survey results to enable assessment of progress over the
years.
3.1 Literacy
Literacy is defined as the ability to read and write meaningfully in any language. As was the
case in the 2005/06 UNHS; the 2009/10 UNPS included a question which asked respondents
whether they could read and write. Questions were asked for all persons aged 5 years and
above; however, in this analysis, only those 12 years and above are considered. According to
the Ministry of Education and Sports (MoES), by the age of 12, one is expected to be in Primary
Seven and as such be able to read and write.
Table 3.1 shows that 25 percent of respondents aged 12 years and above who were illiterate in
2005/06 had transitioned to a literate status by 2009/10. Males were more likely to have become
literate (38%) compared to their female counterparts (19%). Furthermore, disaggregating by
region shows that residents from Central and Western regions were more likely to have become
literate (32% and 33% respectively) compared to those from the Eastern (18%) and Northern
(23%) regions. Considering place of residence, a bigger proportion (38%) of those who lived in
urban areas and were illiterate during the 2005/06 survey had changed to a literate status in
2009/10 compared to 25 percent of their rural counterparts.

22
Table 3.1: Transitions in Literacy status for Respondents 12 years and above by selected
background characteristics (2005/06-2009/10)
Illiterate in 2005
but literate in 2009/10 Illiterate in 2005 and
still Illiterate in 2009/10
Sex
Male 38 62
Female 19 81
Residence
Rural 25 75
Urban 38 62
Region
Central 32 68
Eastern 18 82
Northern 23 77
Western 33 67
Uganda 25 75
3.2 Average distance to school
Information about the distance to the nearest primary school is a useful indicator of children’s
access to schooling. The MoES recommends that a child starts primary school at the age of 6
years. Hence if the distance to school is too long, children may be hindered from starting at the
recommended age. The survey solicited information from household members on the distance
traveled to school for only day scholars.
The results presented in Table 3.2 show that 64 percent of day scholars who used to travel a
distance of between 3 and 5 km in the 2005/06 were now attending schools within a distance of
less than 3 km. It is also important to note that 53 percent of children who used to walk a
distance of over 5km in 2005/06 were now attending schools within a radius of 3km.
Table 3.2: Changes in the Distance Traveled to Nearest Primary School by Day Scholars
over the two survey years
2009/10
Distance 0 to less than 3km
Between 3 and 5km
5km and Above
0 to less than 3km 78.3 16.1 5.6
Between 3 and 5 km 63.6 25.9 10.5
2005/06
5 km and Above 52.7 28.2 19.1
3.3 Reasons for leaving school The survey also solicited information from respondents about those who had dropped out of
school. Over the two survey periods, the cost of schooling being too expensive was the main
reason advanced for leaving school (54% and 56%) in the UNPS and 2005/06 UNHS
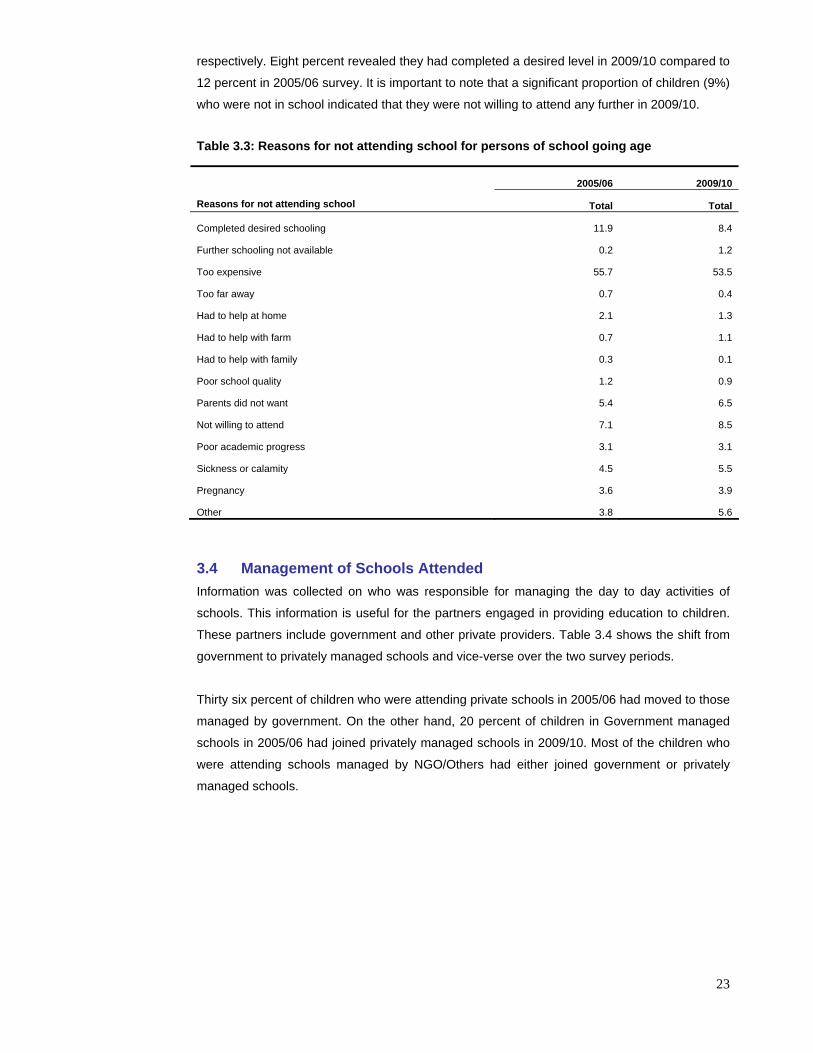
23
respectively. Eight percent revealed they had completed a desired level in 2009/10 compared to
12 percent in 2005/06 survey. It is important to note that a significant proportion of children (9%)
who were not in school indicated that they were not willing to attend any further in 2009/10.
Table 3.3: Reasons for not attending school for persons of school going age
2005/06 2009/10
Reasons for not attending school Total Total
Completed desired schooling 11.9 8.4
Further schooling not available 0.2 1.2
Too expensive 55.7 53.5
Too far away 0.7 0.4
Had to help at home 2.1 1.3
Had to help with farm 0.7 1.1
Had to help with family 0.3 0.1
Poor school quality 1.2 0.9
Parents did not want 5.4 6.5
Not willing to attend 7.1 8.5
Poor academic progress 3.1 3.1
Sickness or calamity 4.5 5.5
Pregnancy 3.6 3.9
Other 3.8 5.6
3.4 Management of Schools Attended Information was collected on who was responsible for managing the day to day activities of
schools. This information is useful for the partners engaged in providing education to children.
These partners include government and other private providers. Table 3.4 shows the shift from
government to privately managed schools and vice-verse over the two survey periods.
Thirty six percent of children who were attending private schools in 2005/06 had moved to those
managed by government. On the other hand, 20 percent of children in Government managed
schools in 2005/06 had joined privately managed schools in 2009/10. Most of the children who
were attending schools managed by NGO/Others had either joined government or privately
managed schools.

24
Table 3.4: Changes in the Distribution of Children by type of Management of School
2009/10
Who manages the school Government Private NGO/Other
Government 78.8 19.7 1.4
Private 36.2 60.3 3.5
2005/06
NGO/Other 54.3 40.7 5.0
3.5 Type of Schools Attended The Survey also sought information on the type of school attended i.e. whether day, boarding or
day/boarding. Table 3.5 shows that eight percent of children who were attending day schools in
2005/06 had been taken in boarding schools while 15 percent of those in boarding schools had
joined day schools. Over three quarters of the children who were in day schools did not change
the type of school. Slightly over a half of the children who were in boarding schools remained in
boarding schools.
Table 3.5: Type of School Attended
2009/10
Type of School Day Boarding
Both Day & Boarding
Day 75.5 8.0 5.3
Boarding 15.1 53.9 31.0
2005/06
Both Day & Boarding 30.0 32.6 37.5
3.6 Summary of Findings
Twenty five percent of respondents aged 12 years and above who were illiterate in 2005/06
were literate at the time of the UNPS. Males were more likely to have become literate (38%) as
compared to females (19%). About two in three day scholars (64%) who used to travel a
distance of between 3 and 5 km in the 2005/06 survey were now attending schools within a
distance of less than 3 km.
Over the two survey periods, the cost of schooling being too expensive was the main reason
given for leaving school. Fifteen percent of children who were in boarding schools in 2005/06
were now attending day schools. Thirty six percent of children who were attending private
schools in 2005/06 were now attending those managed by government while 20 percent of
children in government managed schools in 2005/06 had joined privately managed schools in
2009/10.

25
CHAPTER FOUR
LABOUR FORCE AND TIME USE
4.0 Introduction
The National Development Plan (NDP) which replaced the Poverty Eradication Action Plan
(PEAP) among other issues; outlines the government's intention to create quality employment
opportunities and, improve the labour force distribution in the country. The demand for data to
monitor indicators on the labour market so as to inform the National Development Plan is high.
In order to meet this demand, a set of indicators on the labour market will be frequently
monitored.
The results presented in this chapter show changes of selected Labour Market indicators in the
Uganda National Panel Survey (UNPS) 2009/10. For purposes of this analysis, working children
who were schooling at the same time were treated as not economically active (NEA).
4.1 Activity status The working age population (14 to 64) is divided into three mutually exclusive categories i.e.
working, unemployed and not economically active. The labour force comprises of the
combination of those working and the unemployed. Table 4.1 presents a comparison of the
persons who were tracked in both surveys. The working population increased by 10 percent
over the two survey periods. On the other hand, the not economically active population
decreased by 22 percent while the Employment to Population Ratio (EPR) increased from 73
percent to 80 percent over two the survey periods.
Table 4.1: Labour market indicators of the working age population 14-64
2005/06 2009/10
Number (‘000) % Number (‘000) % % change
Working 9,323 72.7 10,253 79.9 10
Unemployed 112 0.9 118 0.9 5.3
Not economically active 3,396 26.5 2,641 19.2 -22.2 Total 12,831 100 12,831 100 EPR 72.7 79.9 7.2
4.2 Transitions in the Labour Force Panel data, which tracks persons and the kind of jobs they engage in over time, is invaluable in
resolving policy related issues. For policy analysis, it is often desirable to know whether

26
observed changes are the result of changes in the individual units in the population or whether
the structure of the population itself has changed.
4.2.1 Activity status
The results presented in Table 4.2 show the shift in the activity status of the working age
population over the two survey periods. This analysis only includes the working age population
as of the 2009/10 survey who also had 2005/06 information available. Of the total persons who
were not economically active in 2005/06, 42 percent maintained the same activity status in
2009/10; while 51 percent went in self employment. There were generally high movements of
unemployed persons into the other categories. Of the total unemployed persons in 2005/06,
only seven percent remained unemployed, 35 percent moved out of the labour force, while 28
percent and 31 percent shifted to self employment and paid employment respectively.
Eighty one percent of persons, who were in self-employment in 2005/06, maintained the same
activity status while 11 percent dropped out of the labour force. It is worth noting that there were
relatively high proportions of persons in paid employment who shifted to other activity statuses
over the two survey periods. Fifty two percent of those in paid employment remained in paid
employment while 41 percent changed to self employment.
Table 4.2: Transition in activity status
2009/10
2005/06 NEA Unemployed Self-employed Paid
employment Total Number
(‘000)
NEA 41.7 1.9 50.6 5.8 100 3,396
Unemployed 34.5 7.3 27.6 30.6 100 112
Self-employed 11.4 0.5 80.5 7.6 100 8,062
Paid employment 6.7 0.6 40.9 51.9 100 1,261
Total 19.2 0.9 68.2 11.7 100 12,831 Note: NEA – Not Economically Active
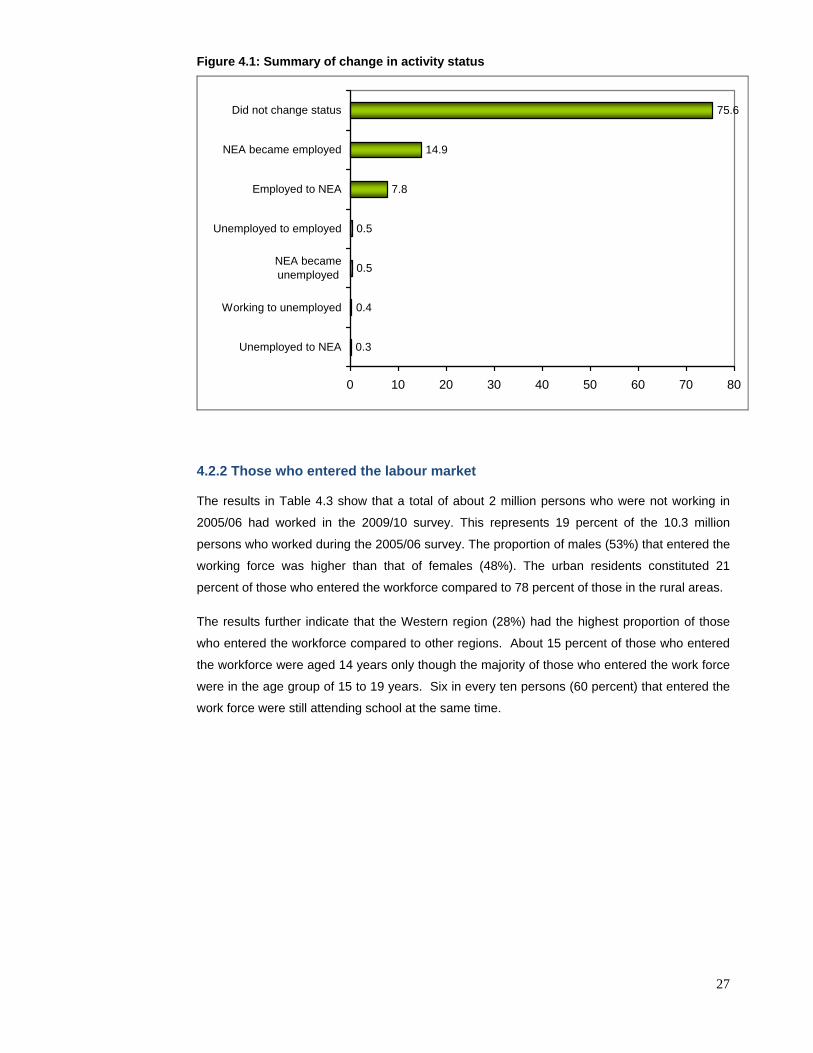
Figure 4.1 presents the summary of the transitions that occurred in the activity status of the
working population (14-64 years). More than three quarters of the working age population did
not change their activity status; 15 percent of the not economically active became employed,
while eight percent of the employed dropped out of the work force (NEA). There were negligible
proportions of the persons who shifted from unemployment to employment, NEA to
unemployment, employment to unemployment; and unemployment to NEA.
27
Figure 4.1: Summary of change in activity status
0.3
0.4
0.5
0.5
7.8
14.9
75.6
0 10 20 30 40 50 60 70 80
Unemployed to NEA
Working to unemployed
NEA becameunemployed
Unemployed to employed
Employed to NEA
NEA became employed
Did not change status
4.2.2 Those who entered the labour market
The results in Table 4.3 show that a total of about 2 million persons who were not working in
2005/06 had worked in the 2009/10 survey. This represents 19 percent of the 10.3 million
persons who worked during the 2005/06 survey. The proportion of males (53%) that entered the
working force was higher than that of females (48%). The urban residents constituted 21
percent of those who entered the workforce compared to 78 percent of those in the rural areas.
The results further indicate that the Western region (28%) had the highest proportion of those
who entered the workforce compared to other regions. About 15 percent of those who entered
the workforce were aged 14 years only though the majority of those who entered the work force
were in the age group of 15 to 19 years. Six in every ten persons (60 percent) that entered the
work force were still attending school at the same time.

28
Table 4.3: Entered the work force by Background Characteristics
Background Characteristics Percent
Male 52.5
Female 47.5
Urban 21.4
Rural 77.6
Central 26.9
Eastern 24.9
Northern 20.4
Western 27.9
14 15.4
15-19 47.3
20-24 17.9
25-29 6.6
Others 12.8
Never been to school 4.6
Left school 36.0
Currently attending school 59.5
Not stated 0.1
Total 100
Number (‘000) 1,897
Number (‘000) worked 2005/06 10,207
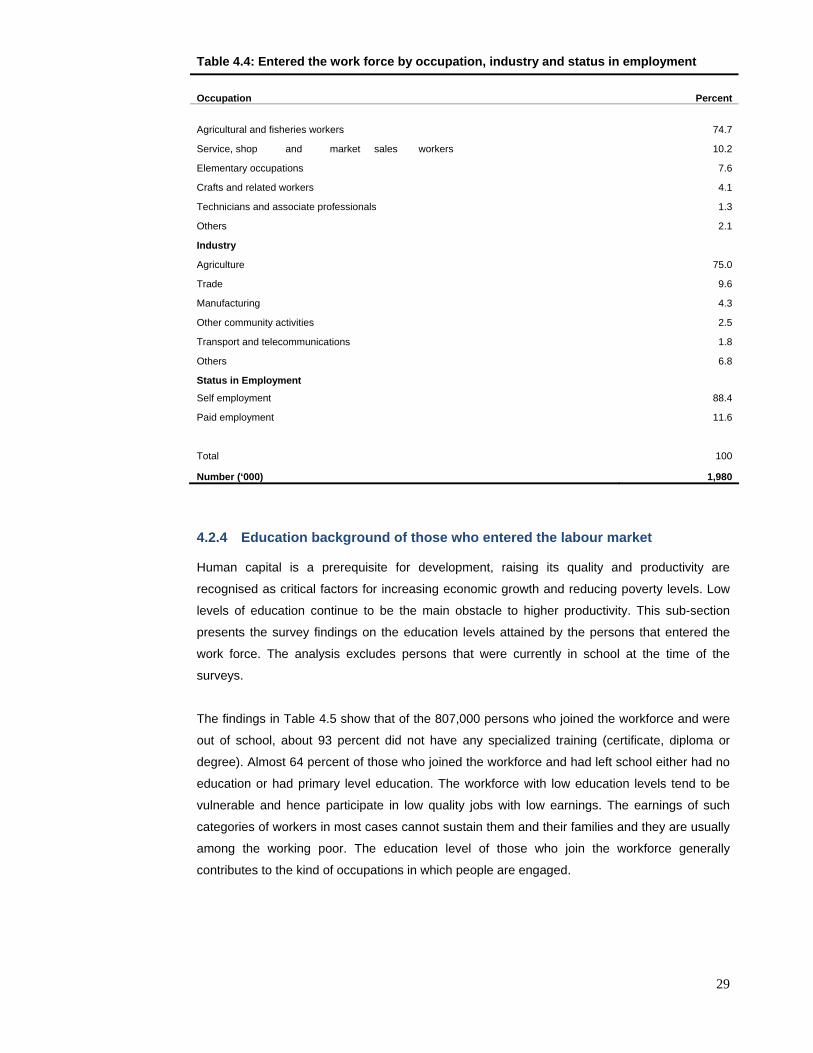
4.2.3 Occupation, Industry and Status in employment of those who entered the labour market
Table 4.4 shows that, three quarters (75%) of those who joined the workforce were agricultural
and fisheries workers; while 10 percent were service, shop or market sales workers while eight
percent were engaged in elementary occupations. The elementary occupations which mainly
include; agricultural, fisheries and related labourers, shoe cleaners, car washers, house maids,
messengers, and other labourers who accounted for more than 90 percent of those who joined
the workforce.
In terms of status in employment, 88 percent of those who joined the workforce were self
employed compared to only 12 percent that were in paid employment. The existence of a
sizeable proportion of self employed is an indication of low growth in the formal sector and high
rate of job creation in the informal sector. According to the ILO, these categories of workers are
in the vulnerable kind of employment which is most likely to be characterised by low and
insecure employment as well as low earnings and productivity.
29
Table 4.4: Entered the work force by occupation, industry and status in employment
Occupation Percent
Agricultural and fisheries workers 74.7
Service, shop and market sales workers 10.2
Elementary occupations 7.6
Crafts and related workers 4.1
Technicians and associate professionals 1.3
Others 2.1
Industry
Agriculture 75.0
Trade 9.6
Manufacturing 4.3
Other community activities 2.5
Transport and telecommunications 1.8
Others 6.8
Status in Employment
Self employment 88.4
Paid employment 11.6
Total 100
Number (‘000) 1,980
4.2.4 Education background of those who entered the labour market
Human capital is a prerequisite for development, raising its quality and productivity are
recognised as critical factors for increasing economic growth and reducing poverty levels. Low
levels of education continue to be the main obstacle to higher productivity. This sub-section
presents the survey findings on the education levels attained by the persons that entered the
work force. The analysis excludes persons that were currently in school at the time of the
surveys.
The findings in Table 4.5 show that of the 807,000 persons who joined the workforce and were
out of school, about 93 percent did not have any specialized training (certificate, diploma or
degree). Almost 64 percent of those who joined the workforce and had left school either had no
education or had primary level education. The workforce with low education levels tend to be
vulnerable and hence participate in low quality jobs with low earnings. The earnings of such
categories of workers in most cases cannot sustain them and their families and they are usually
among the working poor. The education level of those who join the workforce generally
contributes to the kind of occupations in which people are engaged.

30
Table 4.5: Entered the work force by Education Attainment
Education Attainment Percent
No education 11.3
Primary 53.0
Some secondary 21.9
Completed S6 4.3
Post primary specialized training 1.9
Post secondary specialized training 4.0
Degree and above 3.2
Not stated 0.5
Total 100
Number (‘000) 807
The results in Table 4.6 show the reasons given for not being economically active during the
2005/06 survey for those who joined the work force. Fifty three percent of those who were not
economically active were less than 14 years during the 2005/06 survey while 24 percent were
students by then and eight percent were attending to household duties (chores). The labour
force does not include persons engaged in non-economic activities and domestic chores such
as cooking at home or caring for own children, because the activities do not contribute to
measured national income according to the System of National Accounts (SNA).
Table 4.6: Entered the work force by reason of being not economically active in 2005/06
Reason Percent
Below 14 years 53.1
Student 23.7
Attending to household duties 8.2
Unemployed 3.3
Others 7.4
Not stated 4.3
Total 100
Number (‘000) 1,897
4.3 Changed Occupation Table 4.7 presents the distribution of persons who worked and were aged 14 years or more as
of 2005/06 survey by selected background characteristics; whose occupation changed between
the two surveys. Given the likelihood that working persons participate in various economic
activities; only the main occupation was considered.
Overall, of the 8.2 million persons who worked during both surveys; 3.1 million persons (38%)
had changed their occupations. The proportion was higher for males (49%) compared to that of
females (28%). The proportion of urban residents who changed their occupation was 68 percent

31
compared to 34 percent of the rural residents. Working persons in the Central region including
Kampala (50%) were more likely to change their occupations compared to those in other
regions, especially the Eastern region.
Table 4.7: Changes in occupation by background characteristics
Background Percent Male 48.6
Female 27.7
Urban 68.3
Rural 33.7
Central 50.1
Eastern 28.0
Northern 40.2
Western 33.0
Total 38.2
Number changed (‘000) 3,132
Total number worked (‘000) 8,204
The findings on the change of occupation by education level are based on the education level of
the respondent as of the 2009/10 survey. The results in Table 4.8 indicate that persons with
higher levels of education are more likely to have changed their occupations compared to those
with no or lower levels of education. More than twice the proportion of persons in paid
employment changed their occupation compared to those in self employment over the two
survey periods.
Table 4.8: Changes in occupation by education
Education Level Percent No education 31.9 Primary 34.3 Some secondary 47.5 Completed S6 65.9 Post primary specialized training 51.9 Post secondary specialized training 70.1 Degree and above 62.5 Status in Employment Self employment 31.7 Paid employment 77.3 Total 38.2 Number (‘000) 3,132 Total number worked (‘000) 8,204
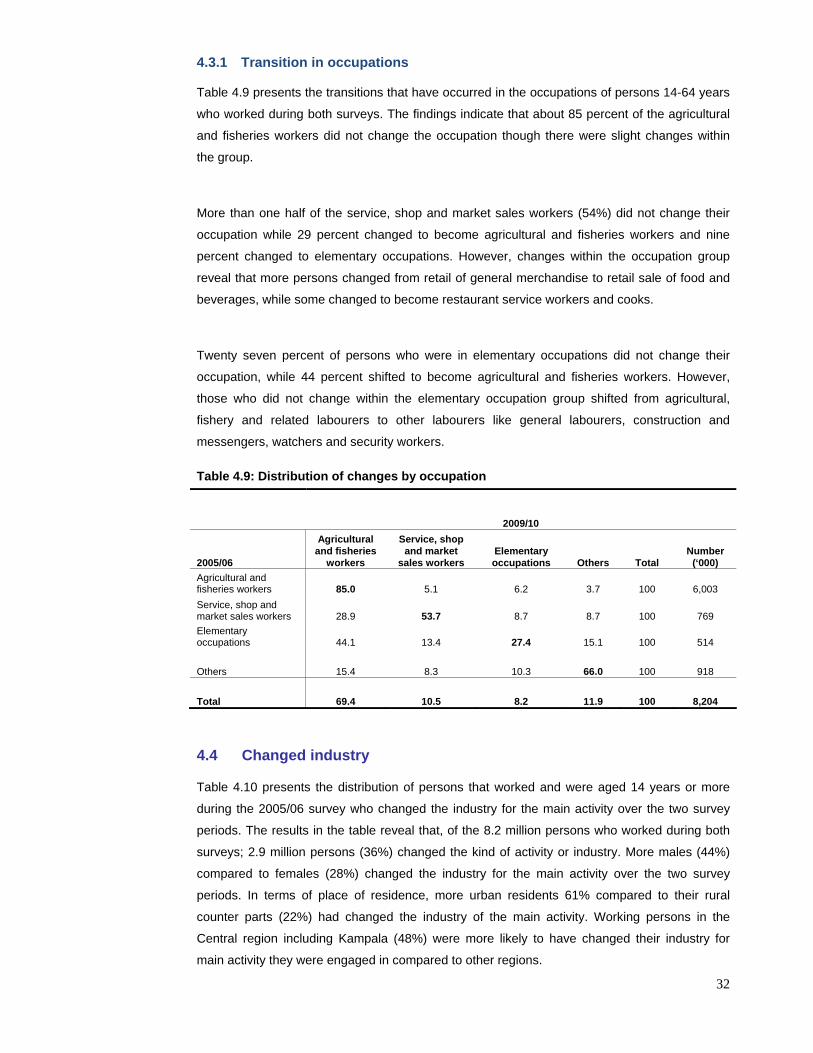
32
4.3.1 Transition in occupations
Table 4.9 presents the transitions that have occurred in the occupations of persons 14-64 years
who worked during both surveys. The findings indicate that about 85 percent of the agricultural
and fisheries workers did not change the occupation though there were slight changes within
the group.
More than one half of the service, shop and market sales workers (54%) did not change their
occupation while 29 percent changed to become agricultural and fisheries workers and nine
percent changed to elementary occupations. However, changes within the occupation group
reveal that more persons changed from retail of general merchandise to retail sale of food and
beverages, while some changed to become restaurant service workers and cooks.
Twenty seven percent of persons who were in elementary occupations did not change their
occupation, while 44 percent shifted to become agricultural and fisheries workers. However,
those who did not change within the elementary occupation group shifted from agricultural,
fishery and related labourers to other labourers like general labourers, construction and
messengers, watchers and security workers.
Table 4.9: Distribution of changes by occupation
2009/10
2005/06
Agricultural and fisheries
workers
Service, shop and market
sales workers Elementary occupations Others Total
Number (‘000)
Agricultural and fisheries workers 85.0 5.1 6.2 3.7 100 6,003 Service, shop and market sales workers 28.9 53.7 8.7 8.7 100 769 Elementary occupations 44.1 13.4 27.4 15.1 100 514
Others 15.4 8.3 10.3 66.0 100 918
Total 69.4 10.5 8.2 11.9 100 8,204
4.4 Changed industry
Table 4.10 presents the distribution of persons that worked and were aged 14 years or more
during the 2005/06 survey who changed the industry for the main activity over the two survey
periods. The results in the table reveal that, of the 8.2 million persons who worked during both
surveys; 2.9 million persons (36%) changed the kind of activity or industry. More males (44%)
compared to females (28%) changed the industry for the main activity over the two survey
periods. In terms of place of residence, more urban residents 61% compared to their rural
counter parts (22%) had changed the industry of the main activity. Working persons in the
Central region including Kampala (48%) were more likely to have changed their industry for
main activity they were engaged in compared to other regions.

33
Table 4.10: Changed industry by background characteristics
Background Characteristics Percent Male 43.5
Female 27.8
Urban 61.2
Rural 31.9
Central 47.6
Eastern 33.5
Northern 36.4
Western 24.7
Total 35.7
Number (‘000) 2,928 Total number worked (‘000) 8,202 The findings on the change of industry by education attainment are based on the education
level of the respondent as of the 2009/10 survey. The results in Table 4.11 indicate that more
persons with higher levels of education had changed their industry for the main activity
compared to those with no or lower levels of education. Fifty two percent of the persons in paid
employment had changed the industry for the main activity compared to 33 percent for those
that were self-employed.
Table 4.11: Changed industry by education and status in employment
Level of Education
Percent
No education 29.8
Primary 32.3
Some secondary 48.1
Completed S6 52.8
Post primary specalised training 41.2
Post secondary specalised training 48.8
Degree and above 61.1
Status in Employment
Self employment 32.9
Paid employment 52.4
Total 35.7
Number (‘000) 2,928
Total number worked (‘000) 8,202

34
The results in Table 4.12 indicate the distribution of the persons who changed their industry of
activity over the two survey periods. Fifty four percent of the persons who changed their industry
of activity were in agriculture. The change in activity includes change from growing of crops to
growing of crops combined with farming of animals and vice versa.
Table 4.12: Distribution of those who changed industry
Industry Percent
Agriculture 53.8
Trade 17.0
Manufacturing 9.3
Other community activities 3.4
Hotels and restaurants 3.3
Education 2.9
Construction 2.8
Transport and communications 2.3
Others 5.2
Total 100
Number (‘000) 2,928
Total number worked (‘000) 8,202
4.5 Changed activity by sector The indicator for employment by sector divides employment into three broad groupings of
economic activity: agriculture, production and services. With the high rates of world urbanisation
and a leveling of world manufacturing employment, the service sector has come to dominate
global employment. In some developing countries, the service sector has become a leading
driver of economic growth. However, the service sector also includes many less skilled
occupations such as petty trade and personal services. Such jobs are important for absorbing
surplus labour, though they do not drive economic growth.
The results in Table 4.13 indicate that of all the persons who were economically active during
both surveys, 85 percent remained in the agriculture sector while 11 percent shifted to the
service sectors. For persons who were in the service sector during 2005/06 survey, 72 percent
remained in the service sector while 22 percent shifted to agriculture sector.
Persons who were in the production sector seem to be more fluid than those in the other two
sectors. The production referred to here, mostly involves simple manufacturing e.g. making
cassava cakes, chapatti, pancakes, brewing local brew, carpentry, brick making, among others.
About 45 percent of those that were in the production sector in 2005/06 survey remained in the
same sector while 28 percent and 26 percent shifted to agriculture and services respectively.
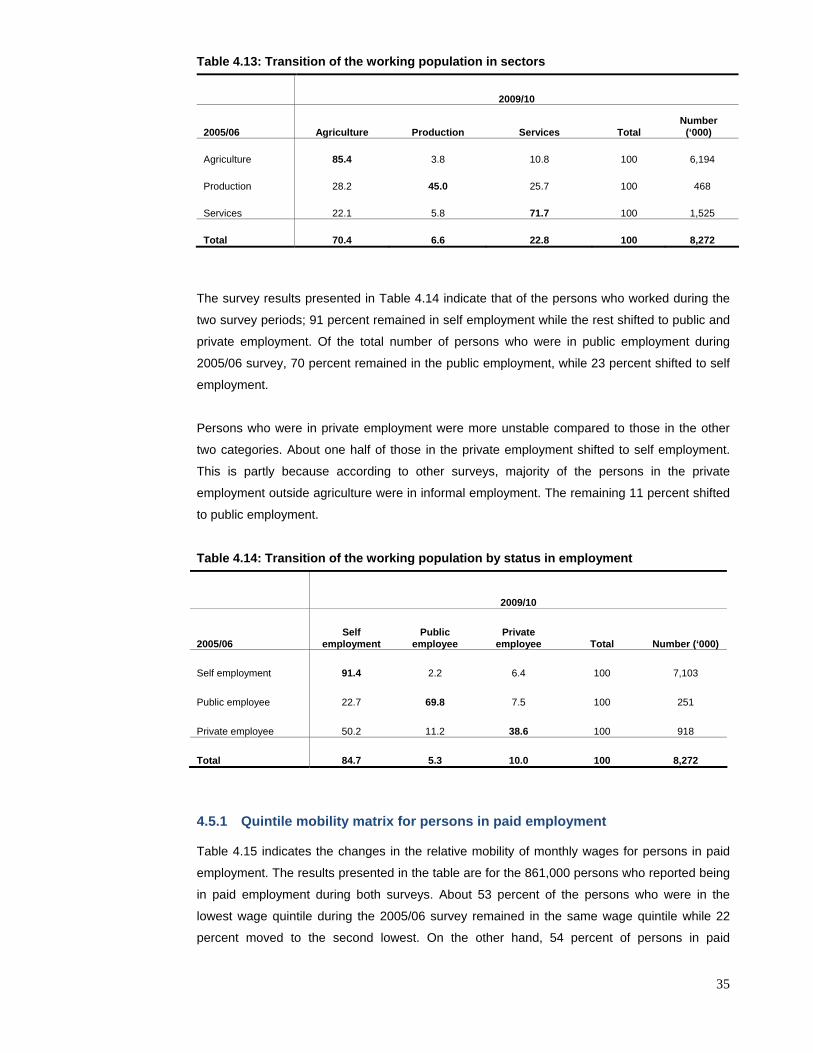
35
Table 4.13: Transition of the working population in sectors
2009/10
2005/06 Agriculture Production Services Total Number
(‘000)
Agriculture 85.4 3.8 10.8 100 6,194
Production 28.2 45.0 25.7 100 468
Services 22.1 5.8 71.7 100 1,525
Total 70.4 6.6 22.8 100 8,272
The survey results presented in Table 4.14 indicate that of the persons who worked during the
two survey periods; 91 percent remained in self employment while the rest shifted to public and
private employment. Of the total number of persons who were in public employment during
2005/06 survey, 70 percent remained in the public employment, while 23 percent shifted to self
employment.
Persons who were in private employment were more unstable compared to those in the other
two categories. About one half of those in the private employment shifted to self employment.
This is partly because according to other surveys, majority of the persons in the private
employment outside agriculture were in informal employment. The remaining 11 percent shifted
to public employment.
Table 4.14: Transition of the working population by status in employment
2009/10
2005/06 Self
employment Public
employee Private
employee Total Number (‘000)
Self employment 91.4 2.2 6.4 100 7,103
Public employee 22.7 69.8 7.5 100 251
Private employee 50.2 11.2 38.6 100 918
Total 84.7 5.3 10.0 100 8,272
4.5.1 Quintile mobility matrix for persons in paid employment
Table 4.15 indicates the changes in the relative mobility of monthly wages for persons in paid
employment. The results presented in the table are for the 861,000 persons who reported being
in paid employment during both surveys. About 53 percent of the persons who were in the
lowest wage quintile during the 2005/06 survey remained in the same wage quintile while 22
percent moved to the second lowest. On the other hand, 54 percent of persons in paid

36
employment that were in the highest wage quintile remained in the same quintile while 33
percent dropped to the second highest quintile.
Table 4.15: Wage quintile mobility matrix for persons in paid employment
2009/10
Quintile
2005/06 1st 2nd 3rd 4th 5th Total Number
(‘000)
1st 53.1 22.3 17.8 4.3 2.4 100 103
2nd 27.4 33.8 15.1 21.4 2.3 100 77
3rd 15.0 22.4 39.0 18.1 5.5 100 132
4th 6.2 10.6 14.2 56.4 12.7 100 242
5th 2.4 3.1 6.8 33.4 54.3 100 307
Total 13.7 13.2 15.9 33.0 24.3 100 861 Note that this is relative mobility but not absolute mobility.
4.6 Summary of Findings The working population increased by 10 percent over the two survey periods. On the other
hand, the not economically active population decreased by 22 percent while the Employment to
Population Ratio (EPR) increased from 73 percent to 80 percent over the two survey periods. Of
the total persons who were not economically active in 2005/06, 42 percent maintained the same
activity status in 2009/10; while 51 percent went in self employment. More than three quarters of
the working age population did not change their activity status; 15 percent of the not
economically active became employed, while eight percent of the employed dropped out of the
work force (NEA).
The findings indicate that about 85 percent of the agricultural and fisheries workers did not
change the occupation though there were slight changes within the group. Overall, of the 8.2
million persons who worked during both surveys; 2.9 million persons (36%) changed the kind of
activity or industry. Of all the persons who were economically active during both surveys, 85
percent remained in the agriculture sector while 11 percent shifted to services. About 53 percent
of the persons who were in the lowest wage quintile during the 2005/06 survey remained in the
same wage quintile while 22 percent moved to the second lowest.

37
CHAPTER FIVE HEALTH 5.0 Introduction The Government of Uganda has developed several policies and programmes to improve the
health status and lives of its people. The Health sector aims at reducing morbidity and mortality
in order to attain good standards of health among Ugandans through the National Health Policy
(NHP) and Health Sector Strategic Plan (HSSP). According to the National Development Plan
(NDP)2, the health sector is tasked with the role of ensuring universal access to a quality
Uganda National Minimum Health Care Package (UNMHCP) i.e. one consisting of promotive,
preventive, curative and rehabilitative services for all priority diseases and conditions to
everyone especially vulnerable groups.
The 2009/10 UNPS sought to establish the health status of the Ugandan population in order to
monitor the progress made by the health sector. This chapter presents findings on transitions or
changes in prevalence of illness, type of illness suffered, type of treatment sought.
5.1 Health Status of the Population
The UNPS 2009/10 sought to establish the frequency of occurrence of an illness; specifically,
whether a household member fell sick in the 30 days preceding the date of the survey. Table
5.1 presents the findings on the changes that occurred in terms of the health status of
household members. The results show that, overall, 48 percent of the persons that suffered
from an illness or injury in the 30 days preceding the date of the survey in 2005/06 indicated
falling sick in 2009/10 while 35 percent of those who reported not falling sick in 2005/06
reported falling sick in 2009/10. Differentials by sex show that more females (50%) compared to
males (45%) that fell sick in 2005/06 revealed falling sick in 2009/10.
Regional variations reveal that 53 percent of the persons in the Central followed by 50 percent
in the Eastern regions fell sick in 2005/06 as well as in 2009/10. Considering differentials by
residence, there were no major differences in the proportions of persons that fell sick over the
two time periods.
2 National Planning Authority, National Development Plan (2010/11-2014/15), April 2010

38
Table 5.1: Transitions in the Health Status of Household Members 30 days prior to the
survey between 2005/06 and 2009/10 by Sex, Residence and Region (%)
2009/10
2005/06 Fell sick Did not fall sick Male Fell sick 45.2 54.8 Did not fall sick 32.8 67.2 Female Fell sick 50.4 49.6 Did not fall sick 37.7 62.3 Urban Fell sick 46.0 54.0 Did not fall sick 33.9 66.1 Rural Fell sick 48.2 51.8 Did not fall sick 35.4 64.6 Central Fell sick 53.2 46.8 Did not fall sick 39.1 60.9 Eastern Fell sick 49.8 50.2 Did not fall sick 36.2 63.8 Northern Fell sick 44.4 55.6 Did not fall sick 37.0 63.0 Western Fell sick 41.6 58.4 Did not fall sick 28.9 71.1 Uganda Fell sick 47.9 52.1 Did not fall sick 35.1 64.9
5.2 Prevalence of Illness
According to the Health Sector Strategic Plan (HSSP III)3, communicable diseases like Malaria,
HIV/AIDS and TB account for over half of the total burden of disease and are leading causes of
ill health and mortality in Uganda.
The 2009/10 UNPS collected information on major symptoms that household members suffered
during the 30 day recall period. The findings in Table 5.2 show that, overall, malaria/fever (47%)
was the most prevalent illness reported by respondents. Half of the household members that

39
suffered from malaria (51%) and 25 percent that suffered from respiratory infections in 2005/06
indicated the same in 2009/10 respectively. It is worth noting that there were relatively high
proportions of household members that reported suffering from malaria in 2009/10 that had
suffered from other illnesses in 2005/06.
Table 5.2: Changes in Prevalence Rates of illnesses/major symptoms suffered within 30
days prior to the survey (%)
2009/10
2005/06 Malaria /Fever
Respiratory Infections Diarrhea
Urinary infections
Skin infection Injury Others Total
Malaria /Fever 50.7 18.1 1.3 0.2 1.8 2.1 25.9 100.0 Respiratory Infections 44.4 25.0 2.3 0.0 0.5 1.0 26.8 100.0
Diarrhea 30.0 29.7 1.4 0.0 6.6 2.3 30.0 100.0 Urinary infections 48.2 12.4 0.0 0.0 0.0 0.0 39.4 100.0 Skin infection 47.2 23.2 4.2 0.0 0.0 4.9 20.6 100.0
Injury 60.3 8.0 2.4 0.0 0.0 2.7 26.7 100.0
Others 38.5 12.4 1.6 0.8 0.5 3.4 42.8 100.0
Uganda 47.0 18.3 1.6 0.3 1.4 2.2 29.2 100.0 *Others includes weight loss, weakness, fainting, vomiting, mental disorder, abdominal pain, child-birth related illnesses and others
5.3 Medical Attention/Care Sought
The delivery of health services in Uganda is done by both the public and private sectors with the
Government of Uganda owning most of the facilities. In all public health facilities curative,
preventive, rehabilitative and promotive health services are free, having abolished user fees in
2001. However, user fees in public facilities remain in private wings of public hospitals4.
The household members that fell sick were asked about where they first sought health care for
the major illness suffered 30 days prior to the date of the survey. The results presented in Table
5.3 show that overall, 46 percent of persons that fell sick, first sought treatment from private
clinics.
With regard to transitions, 55 percent of the population that fell sick sought medical care from
private clinics in 2005/06 went back to the private clinics for medical care in 2009/10. The
corresponding percentages for health centres and hospitals were 32 percent 31 percent
respectively. It is worth noting that about 88 percent of persons that used home treatment in
2005/06 had transited to using a health facility (private clinic, health center or hospital).
3 Ministry of Health (2010), Health Sector Strategic Plan 2010/11-2014/15
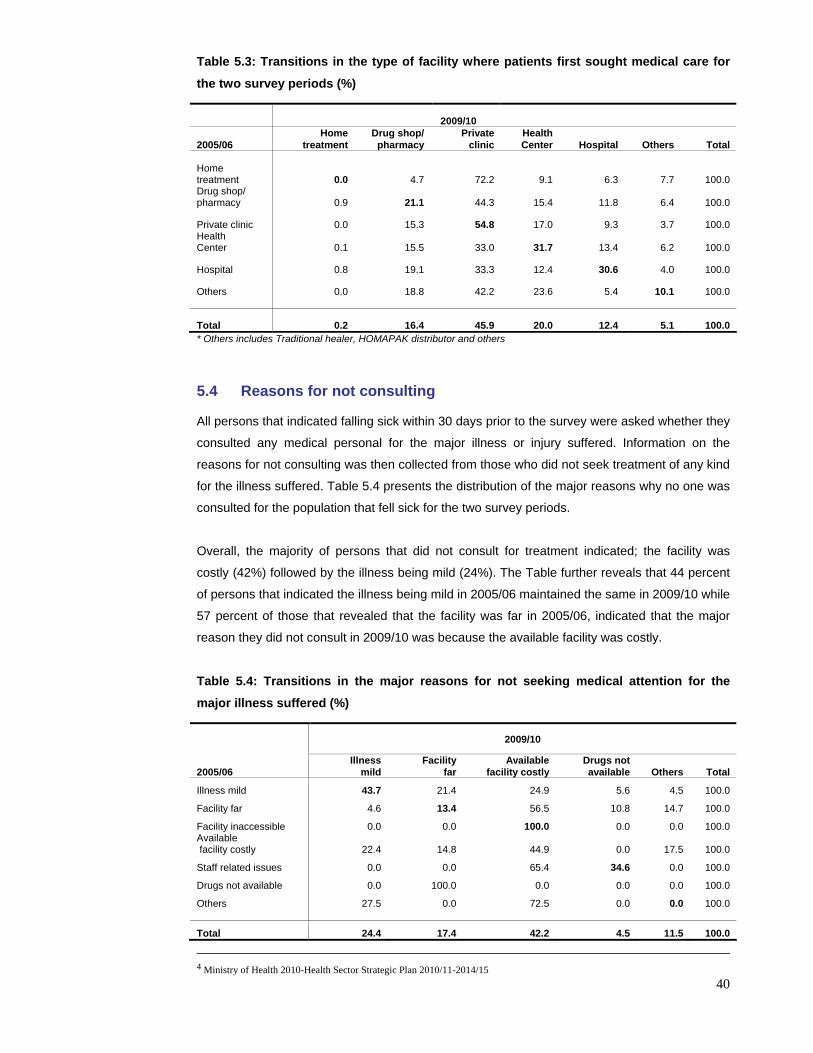
40
Table 5.3: Transitions in the type of facility where patients first sought medical care for
the two survey periods (%)
2009/10
2005/06 Home
treatment Drug shop/
pharmacy Private clinic
Health Center Hospital Others Total
Home treatment 0.0 4.7 72.2 9.1 6.3 7.7 100.0 Drug shop/ pharmacy 0.9 21.1 44.3 15.4 11.8 6.4 100.0
Private clinic 0.0 15.3 54.8 17.0 9.3 3.7 100.0 Health Center 0.1 15.5 33.0 31.7 13.4 6.2 100.0
Hospital 0.8 19.1 33.3 12.4 30.6 4.0 100.0
Others 0.0 18.8 42.2 23.6 5.4 10.1 100.0
Total 0.2 16.4 45.9 20.0 12.4 5.1 100.0 * Others includes Traditional healer, HOMAPAK distributor and others
5.4 Reasons for not consulting
All persons that indicated falling sick within 30 days prior to the survey were asked whether they
consulted any medical personal for the major illness or injury suffered. Information on the
reasons for not consulting was then collected from those who did not seek treatment of any kind
for the illness suffered. Table 5.4 presents the distribution of the major reasons why no one was
consulted for the population that fell sick for the two survey periods.
Overall, the majority of persons that did not consult for treatment indicated; the facility was
costly (42%) followed by the illness being mild (24%). The Table further reveals that 44 percent
of persons that indicated the illness being mild in 2005/06 maintained the same in 2009/10 while
57 percent of those that revealed that the facility was far in 2005/06, indicated that the major
reason they did not consult in 2009/10 was because the available facility was costly.
Table 5.4: Transitions in the major reasons for not seeking medical attention for the
major illness suffered (%)
2009/10
2005/06 Illness
mild Facility
far Available
facility costly Drugs not available Others Total
Illness mild 43.7 21.4 24.9 5.6 4.5 100.0
Facility far 4.6 13.4 56.5 10.8 14.7 100.0
Facility inaccessible 0.0 0.0 100.0 0.0 0.0 100.0 Available facility costly 22.4 14.8 44.9 0.0 17.5 100.0
Staff related issues 0.0 0.0 65.4 34.6 0.0 100.0
Drugs not available 0.0 100.0 0.0 0.0 0.0 100.0
Others 27.5 0.0 72.5 0.0 0.0 100.0
Total 24.4 17.4 42.2 4.5 11.5 100.0
4 Ministry of Health 2010-Health Sector Strategic Plan 2010/11-2014/15
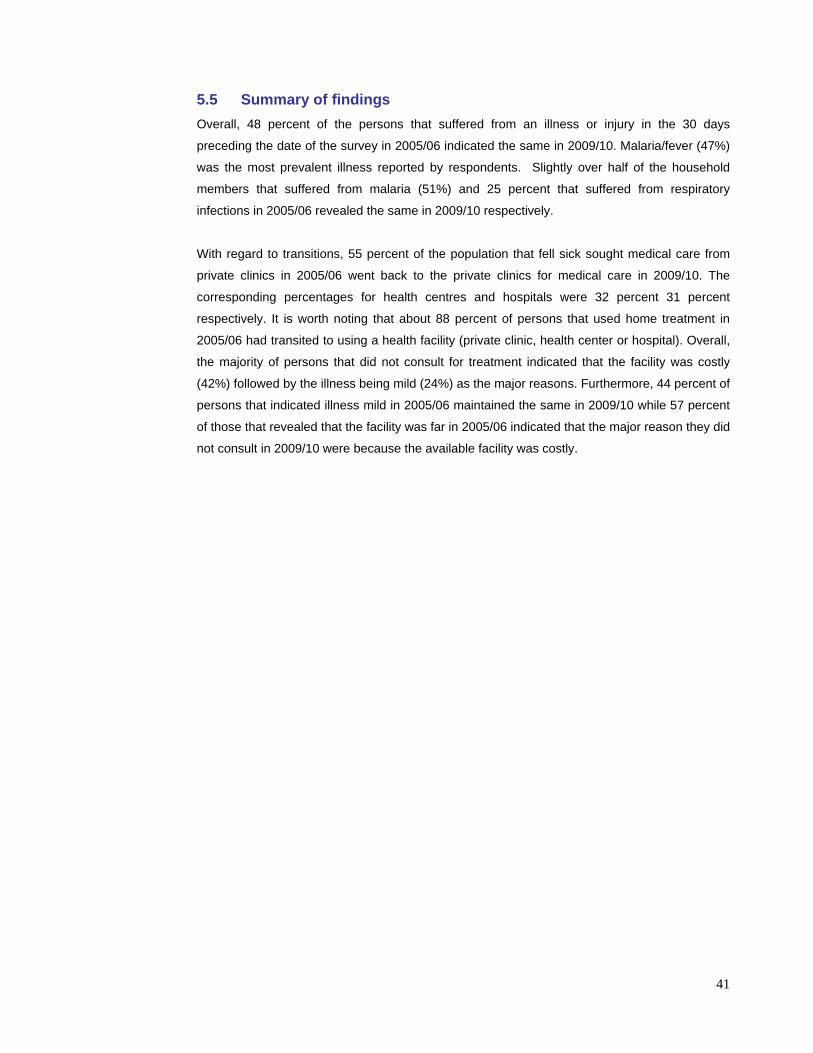
41
5.5 Summary of findings Overall, 48 percent of the persons that suffered from an illness or injury in the 30 days
preceding the date of the survey in 2005/06 indicated the same in 2009/10. Malaria/fever (47%)
was the most prevalent illness reported by respondents. Slightly over half of the household
members that suffered from malaria (51%) and 25 percent that suffered from respiratory
infections in 2005/06 revealed the same in 2009/10 respectively.
With regard to transitions, 55 percent of the population that fell sick sought medical care from
private clinics in 2005/06 went back to the private clinics for medical care in 2009/10. The
corresponding percentages for health centres and hospitals were 32 percent 31 percent
respectively. It is worth noting that about 88 percent of persons that used home treatment in
2005/06 had transited to using a health facility (private clinic, health center or hospital). Overall,
the majority of persons that did not consult for treatment indicated that the facility was costly
(42%) followed by the illness being mild (24%) as the major reasons. Furthermore, 44 percent of
persons that indicated illness mild in 2005/06 maintained the same in 2009/10 while 57 percent
of those that revealed that the facility was far in 2005/06 indicated that the major reason they did
not consult in 2009/10 were because the available facility was costly.

42
CHAPTER SIX POVERTY DYNAMICS IN UGANDA 6.0 Introduction Cross sectional surveys have been used to inform the policy processes and have formed the
basis for all the benchmarks used in the poverty eradication efforts in Uganda since 1992. As a
result, poverty incidence declined from 56 percent in 1992 to 24.5 percent in 2010. However, to
understand the real changes that households and persons undergo, panel surveys provide a
major resource to the policy debate.
This chapter discusses some of the highlights of the poverty dynamics using the Uganda
National Panel Survey (UNPS) data. Collection of consumption and non-consumption
expenditure data is a key component in the Uganda National Panel Survey. These data are
instrumental in understanding the real changes in the wellbeing of Ugandans. The main focus of
this chapter is the observed changes in welfare between 2005/06 and 2009/10. In keeping with
previous poverty works (Appleton, 2001a; Appleton and Ssewanyana, 2003; Ssewanyana and
Okidi, 2007, Ssewanyana, 2010), the poverty estimate is derived by following the methods
applied to earlier surveys presented in Appleton (2001a, b)5. Thus consumption and welfare
measures are comparable across the surveys.
6.1 Data Transformation
As already presented in chapter one, the UNPS 2009/10 is a sub-sample of the Uganda
National Household Survey of 2005/06 (UNHS-3). The consumption modules are comparable in
many respects. First, both surveys share the same sampling frame based on the Population and
Housing Census of 2002. Both the 2009/10 UNPS and the UNHS-3 used a region as a stratum
divided into rural and urban, visited the Enumeration Areas (EAs) twice, share very similar
consumption sections and are nationally representative. The 2009/10 UNPS covered about
2560 out of the originally sampled 3200 households. In addition, 20 percent of the panel
households (about 375 out of 600 interviewed) with members who moved either to form new
households or to join other existing households were also traced and interviewed.
Consistent with earlier household surveys, different recall periods were used to capture
information on different sub-components of household expenditures. While a 7-day recall period
was used for expenditure on food, beverages and tobacco, a 30-day recall period was used in
the case of household consumption expenditure on non-durable goods and frequently
purchased services. A 365-day recall period was used for the semi-durable and durable goods
5 . While methodological issues have been raised about measuring poverty in Uganda, we must be aware of the large number of
methodological decisions, both theoretical and practical, that has to be taken.
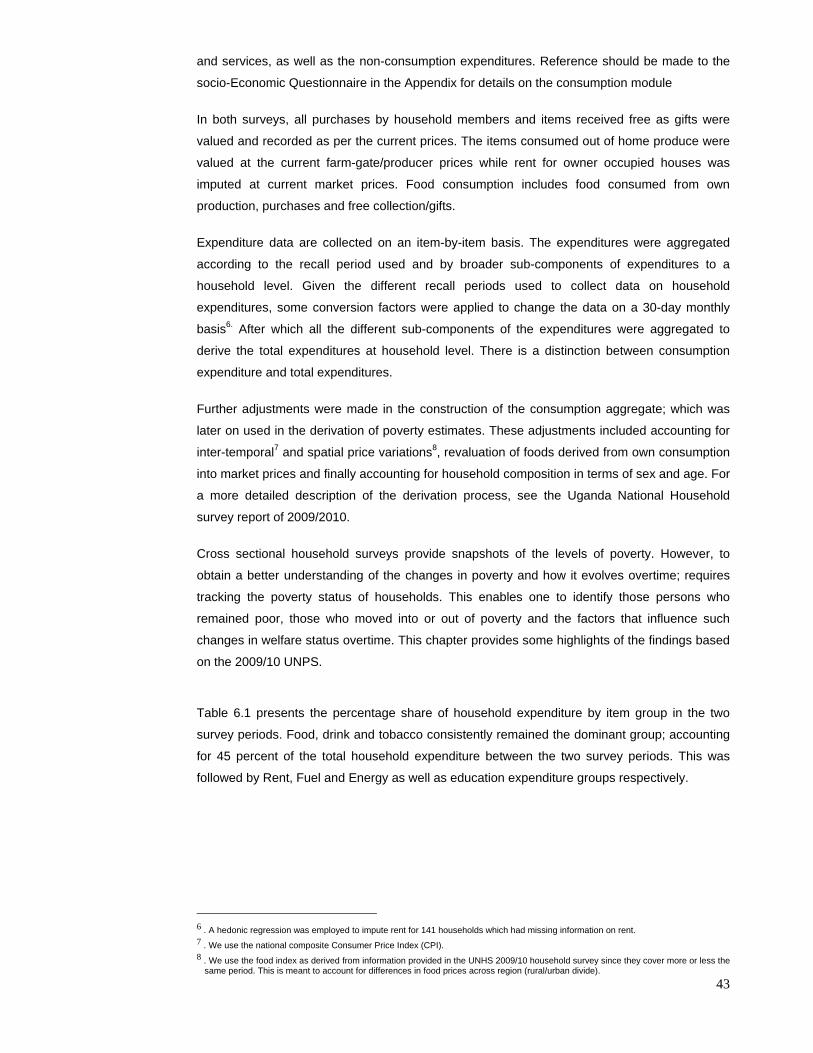
43
and services, as well as the non-consumption expenditures. Reference should be made to the
socio-Economic Questionnaire in the Appendix for details on the consumption module
In both surveys, all purchases by household members and items received free as gifts were
valued and recorded as per the current prices. The items consumed out of home produce were
valued at the current farm-gate/producer prices while rent for owner occupied houses was
imputed at current market prices. Food consumption includes food consumed from own
production, purchases and free collection/gifts.
Expenditure data are collected on an item-by-item basis. The expenditures were aggregated
according to the recall period used and by broader sub-components of expenditures to a
household level. Given the different recall periods used to collect data on household
expenditures, some conversion factors were applied to change the data on a 30-day monthly
basis6. After which all the different sub-components of the expenditures were aggregated to
derive the total expenditures at household level. There is a distinction between consumption
expenditure and total expenditures.
Further adjustments were made in the construction of the consumption aggregate; which was
later on used in the derivation of poverty estimates. These adjustments included accounting for
inter-temporal7 and spatial price variations8, revaluation of foods derived from own consumption
into market prices and finally accounting for household composition in terms of sex and age. For
a more detailed description of the derivation process, see the Uganda National Household
survey report of 2009/2010.
Cross sectional household surveys provide snapshots of the levels of poverty. However, to
obtain a better understanding of the changes in poverty and how it evolves overtime; requires
tracking the poverty status of households. This enables one to identify those persons who
remained poor, those who moved into or out of poverty and the factors that influence such
changes in welfare status overtime. This chapter provides some highlights of the findings based
on the 2009/10 UNPS.
Table 6.1 presents the percentage share of household expenditure by item group in the two
survey periods. Food, drink and tobacco consistently remained the dominant group; accounting
for 45 percent of the total household expenditure between the two survey periods. This was
followed by Rent, Fuel and Energy as well as education expenditure groups respectively.
6 . A hedonic regression was employed to impute rent for 141 households which had missing information on rent. 7 . We use the national composite Consumer Price Index (CPI). 8 . We use the food index as derived from information provided in the UNHS 2009/10 household survey since they cover more or less the
same period. This is meant to account for differences in food prices across region (rural/urban divide).

44
Table 6.1: Share of Household Expenditure by Item Groups (%)
2005/06 2009/10
Item Group Rural Urban Uganda Rural Urban Uganda
Food, drink & tobacco 50 34 45 49.9 34.7 45.1
Clothing & footwear 4 4 4 3.0 3.6 3.2
Rent, fuel & energy 15 20 16 15.7 19.2 16.8
Household & personal goods 5 6 5 5.0 6.8 5.6
Transport & communication 6 10 7 6.8 11 8.1
Education 8 13 10 9.3 12.5 10.3
Health 8 4 7 5.3 3.5 4.7
Other consumption expenditure 2 4 3 1.7 2.5 1.9
Non-consumption expenditure 3 5 4 2.2 4.9 3.1
Total 100 100 100 100 100 100
6.2 Poverty transitions from 2005/06 to 2009/10 Understanding the real changes in poverty requires monitoring the same individual or groups of
persons over time. This enables one to identify those who have benefited from the development
policies and programmes. The UNPS provides an opportunity to investigate the poverty status
of a cohort of people during the period 2005/06 and 2009/10. The information presented in this
chapter pertains to only the original panel households found and interviewed in 2009/10; in
order to highlight the movements into and out of poverty between 2005/06 and 2009/10.
Information relating to the split-off households is available to data users.
The transition matrix was constructed by ranking the consumption expenditure in the two
surveys. Table 6.2 shows that between the two surveys, 42 percent of the households remained
in the bottom twenty percent while 51 percent remained in the top quintile. Households in the
lower quintiles are more likely to move to quintiles within their proxy i.e. either immediately
above or below the reference quintile. At least one in every five households remained in the
same quintile between the two periods but this was particularly so with the highest quintile.
Table 6.2: Poverty Transition Matrix 2005/06-2009/2010
2009/10
2005/06 Lowest Quintile Quintile 2 Quintile 3 Quintile 4 Highest Quintile
Lowest Quintile 42.2 26.9 18.6 12.0 3.7
Quintile 2 28.1 25.2 30.0 17.9 6.3
Quintile 3 21.0 25.2 22.1 24.7 13.5
Quintile 4 6.8 16.9 20.3 26.8 25.1
Highest Quintile 2.0 5.7 8.9 18.6 51.4
Table 6.3 presents the persistence of poverty through a transition matrix of a households’
poverty status over the period 2005/06 and 2009/10. Overall, 25 percent of Uganda’s
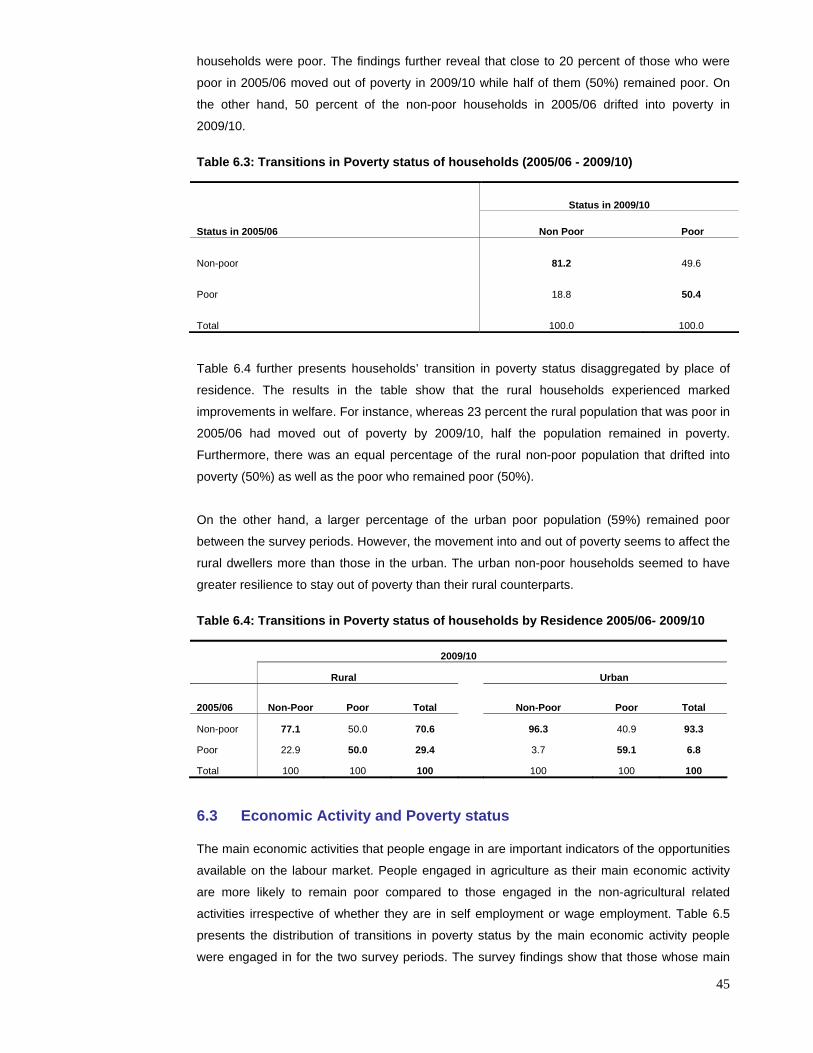
45
households were poor. The findings further reveal that close to 20 percent of those who were
poor in 2005/06 moved out of poverty in 2009/10 while half of them (50%) remained poor. On
the other hand, 50 percent of the non-poor households in 2005/06 drifted into poverty in
2009/10.
Table 6.3: Transitions in Poverty status of households (2005/06 - 2009/10)
Status in 2009/10
Status in 2005/06 Non Poor Poor
Non-poor 81.2 49.6
Poor 18.8 50.4
Total 100.0 100.0 Table 6.4 further presents households’ transition in poverty status disaggregated by place of
residence. The results in the table show that the rural households experienced marked
improvements in welfare. For instance, whereas 23 percent the rural population that was poor in
2005/06 had moved out of poverty by 2009/10, half the population remained in poverty.
Furthermore, there was an equal percentage of the rural non-poor population that drifted into
poverty (50%) as well as the poor who remained poor (50%).
On the other hand, a larger percentage of the urban poor population (59%) remained poor
between the survey periods. However, the movement into and out of poverty seems to affect the
rural dwellers more than those in the urban. The urban non-poor households seemed to have
greater resilience to stay out of poverty than their rural counterparts.
Table 6.4: Transitions in Poverty status of households by Residence 2005/06- 2009/10
2009/10
Rural Urban
2005/06 Non-Poor Poor Total Non-Poor Poor Total
Non-poor 77.1 50.0 70.6 96.3 40.9 93.3
Poor 22.9 50.0 29.4 3.7 59.1 6.8
Total 100 100 100 100 100 100 6.3 Economic Activity and Poverty status
The main economic activities that people engage in are important indicators of the opportunities
available on the labour market. People engaged in agriculture as their main economic activity
are more likely to remain poor compared to those engaged in the non-agricultural related
activities irrespective of whether they are in self employment or wage employment. Table 6.5
presents the distribution of transitions in poverty status by the main economic activity people
were engaged in for the two survey periods. The survey findings show that those whose main
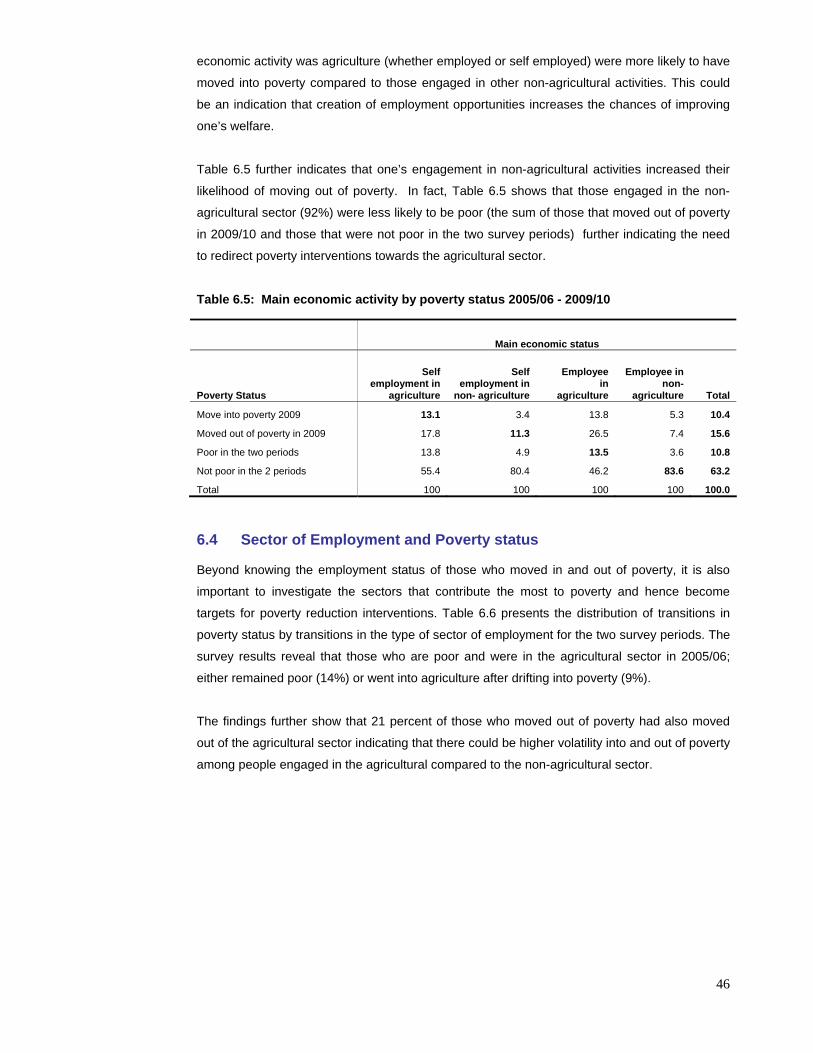
46
economic activity was agriculture (whether employed or self employed) were more likely to have
moved into poverty compared to those engaged in other non-agricultural activities. This could
be an indication that creation of employment opportunities increases the chances of improving
one’s welfare.
Table 6.5 further indicates that one’s engagement in non-agricultural activities increased their
likelihood of moving out of poverty. In fact, Table 6.5 shows that those engaged in the non-
agricultural sector (92%) were less likely to be poor (the sum of those that moved out of poverty
in 2009/10 and those that were not poor in the two survey periods) further indicating the need
to redirect poverty interventions towards the agricultural sector.
Table 6.5: Main economic activity by poverty status 2005/06 - 2009/10
Main economic status
Poverty Status
Self employment in
agriculture
Self employment in
non- agriculture
Employee in
agriculture
Employee in non-
agriculture Total
Move into poverty 2009 13.1 3.4 13.8 5.3 10.4
Moved out of poverty in 2009 17.8 11.3 26.5 7.4 15.6
Poor in the two periods 13.8 4.9 13.5 3.6 10.8
Not poor in the 2 periods 55.4 80.4 46.2 83.6 63.2
Total 100 100 100 100 100.0
6.4 Sector of Employment and Poverty status
Beyond knowing the employment status of those who moved in and out of poverty, it is also
important to investigate the sectors that contribute the most to poverty and hence become
targets for poverty reduction interventions. Table 6.6 presents the distribution of transitions in
poverty status by transitions in the type of sector of employment for the two survey periods. The
survey results reveal that those who are poor and were in the agricultural sector in 2005/06;
either remained poor (14%) or went into agriculture after drifting into poverty (9%).
The findings further show that 21 percent of those who moved out of poverty had also moved
out of the agricultural sector indicating that there could be higher volatility into and out of poverty
among people engaged in the agricultural compared to the non-agricultural sector.

47
Table 6.6: Poverty Status by Sector 2005/06 - 2009/10
Sector of employment
Poverty status Remained
in Agriculture
Never in agriculture
sector
Moved to Agriculture
sector
Moved out of
agriculture
Move into poverty 2009 13.5 2.8 11 6.79
Moved out of poverty in 2009 19.0 4.2 12.2 20.6
Poor in the two periods 13.5 1.4 8.8 8.9
Not poor in the 2 periods 53.9 91.6 68.0 63.8
Total 100.0 100.0 100.0 100.0
6.5 Summary of the findings This chapter only highlights some of the findings and shows that between the two survey
periods, there were real improvements in the welfare of the population. Specifically, about 19
percent of those who were poor in 2005/06 became non-poor in 2009/10 and about 50 percent
of those who were non-poor became poor. The agricultural sector is home to most of the poor
and the movement in and out of poverty is highly volatile.
48
CHAPTER SEVEN CHANGES IN WELFARE CORRELATES
7.0 Introduction
Literature review shows that welfare can take a variety of forms depending on the given
community or society. However, in a more general sense welfare refers to the well-being of
persons or groups with consideration to their health, happiness, safety, prosperity, and
fortunes9.
The questions related to welfare in the two surveys 2005/06 and 2009/10 were designed to
provide a set of indicators for monitoring poverty and the effects of development policies,
programmes and projects on living standards in the country. The welfare indicators also aim at
providing reliable data for monitoring changes in the welfare status of various sub-groups of the
population.
The chapter discusses the findings on vital needs and living conditions of the same households
in the two survey periods of 2005/06 and 2009/2010. The welfare indicators are measured by
ownership of two sets of clothes, a blanket and a pair of shoes; average number of meals taken
per day among others. In addition, the survey included a question that solicited information on
food security.
7.1 Possession of Two Sets of Clothes by Household Member(s)
Both the 2005/06 and 2009/10 surveys asked a question to establish whether every member of
the household had at least two sets of clothes. Only clothes in good and average condition were
considered. Old and tattered clothes for work and school uniforms were excluded.
Table 7.1 shows the survey findings with respect to whether every household member
possessed at least two sets of clothes by residence. The results reveal that seven percent of
urban households that reported having two sets of clothes in 2005/06 did not possess the same
in 2009/10. However, a significant proportion (76%) of those in urban areas that did not possess
at least two sets of clothes in 2005/06 were in possession by 2009/10.
A similar trend was observed for households in the rural setting. Sixteen percent of households
that did not possess two set of clothes in 2005/06 revealed possession in 2009/10 while 67
percent of those which did not have in 2005/06 had managed to acquire at least two sets of
clothes by 2009/10.
9 Wikipedia, 2006, Free Encyclopedia, www.wikipedia.org

49
Table 7.1: Possession of at Least Two Sets of Clothes by Residence (%)
2009/10 Residence
2005/06 Yes No Total
Yes 93.2 6.8 100
Urban No 76.3 23.7 100
Yes 84.2 15.8 100
Rural No 67.1 32.9 100
Furthermore, Table 7.2 presents households’ possession of at least two sets of clothes by
region over the two survey periods. The Northern region registered the highest percentage of 22
percent of households who previously had two sets of clothes in 2005/06 but no longer had by
2009/10. This was followed by the Western with 15 percent while the Eastern region had the
lowest proportion of only 11 percent. In regards to the proportion of households who reported
not possessing two sets of clothes in 2005/06 but managed to possess in 2009/10, the Northern
region still recorded the lowest with 43 percent compared to the rest of the region with 80
percent or more.
Table 7.2: Possession of at Least Two Sets of Clothes by Region (%)
2009/10
Region
2005/06 Yes No Total
Yes 88.1 11.9 100
Central No 87.9 12.1 100
Yes 89.0 11.0 100
Eastern No 88.3 11.7 100
Yes 78.0 22.0 100
Northern No 43.1 56.9 100
Yes 84.9 15.1 100
Western No 80.6 19.4 100
7.2 Ownership of Blanket for Household Members less than 18 Years Possessing a blanket is among the basic necessities of life regardless of whether an individual
is an adult or a child (under 18 years). The two surveys collected information on whether each
child less than 18 years in the household possessed a blanket. Possession of an own blanket
implied no sharing with any other member. Households with no children (less than 18 years)
gave the response Not Applicable (N/A).
Table 7.3 presents the changes in the possession of a blanket by residence for household
members aged less than 18 years. The results indicate that in the urban areas, 24 percent of
the households that reported each child possessing a blanket in 2005/06 were not in
possession of a blanket any more by 2009/10. However, for the households that reported that
each child was not in possession of a blanket in 2005/06, by 2009/10 thirty eight percent of

50
them revealed that each child had a blanket. The urban areas were generally doing better than
those in the rural in that regard. For instance, 44 percent of rural households that had reported
possession of a blanket for children less than 18 years in 2005/06 revealed that they no longer
did so in 2009/10.
Table 7.3: Possession of Blanket by Residence (%)
2009/10
Residence 2005/06 Yes No N/A Total
Yes 66.1 24.3 9.6 100
Urban No 38.0 54.0 8.0 100
Yes 49.1 43.9 7.0 100
Rural No 24.9 71.0 4.1 100
In terms of regional differentials, the Northern region registered the highest proportion (65%) of
households with children under 18 years that no longer possessed a blanket by 2009/10.This
could have been due the provisions and aid from different sources that were given to people in
the camps. The Eastern and Western regions had almost the same proportions (46 and 44
percent respectively) while Central had the lowest with only 28 percent. On the other hand, the
Central region registered the highest percentage (39%), followed by the Western (29%) while
the Northern region had the lowest percentage (14%) of households that reported each child not
possessing a blanket in 2005/06 but had one in 2009/10.
Table 7.4: Possession of Blanket by Region (%)
2009/10 Region 2005/06 Yes No N/A Total
Yes 63.3 27.8 8.9 100
Central No 39.0 55.6 5.4 100
Yes 46.9 46.1 7.0 100
Eastern No 22.2 72.7 5.1 100
Yes 25.0 65.3 9.7 100
Northern No 13.5 82.2 4.3 100
Yes 51.2 44.3 4.5 100
Western No 29.4 66.8 3.8 100
7.3 Every Household Member Possessing at Least a Pair of Shoes Possession of a pair of shoes by every household member is considered among the vital needs
which can be used in the assessment of a household’s welfare. The pair of shoes in reference
is one in good condition excluding slippers, tyre shoes (lugabire) and gumboots. Table 7.5
presents the changes in possession of a pair of shoes by every household member over the two
survey periods.

51
The results reveal that 13 percent of urban households whose members had at least a pair of
shoes in 2005/06; reported that they did not have in2009/10. Conversely, a significant
proportion of urban households (63%) that did not have at least a pair of shoes for every
household member in 2005/06 had upgraded by 2009/10. A different trend was observed for 32
percent of rural households that earlier reported each member possessing a pair of shoes and
were no longer in possession by 2009/10. In addition, only 28 percent of rural households that
did not possess a pair of shoes in 2005/06 had revealed possession in 2009/10 compared to 63
percent of those in the urban areas.
Table 7.5: Possession of a Pair of Shoes by every Household member(s) by Residence
2009/10
Residence
2005/06 Yes No Total
Yes 87.5 12.5 100
Urban No 62.7 37.3 100
Yes 67.8 32.2 100
Rural No 27.5 72.5 100
Table 7.6 presents changes in possession of a pair of shoes by household members and
region. The Northern region had the highest percentage of households (38%) whose household
members possessed a pair of shoes each in 2005/06 though they were not in possession by
2009/10. This was followed by the Eastern (36%) while the Central region had the lowest (20%).
With regard, to upgrading from no possession to possession of a pair of shoes by every
household member between the two survey periods, the Central region registered the highest
percentage (53%), followed by the Western (37%) while the Northern region had the lowest
(17%).
Table 7.6: Possession of a Pair of Shoes by every Household member(s) by Region (%)
2009/10
Region
2005/06 Yes No Total
Yes 80.5 19.5 100
Central No 52.9 47.1 100
Yes 64.0 36.0 100
Eastern No 22.9 77.1 100
Yes 62.3 37.7 100
Northern No 16.5 83.5 100
Yes 69.6 30.4 100
Western No 37.0 63.0 100
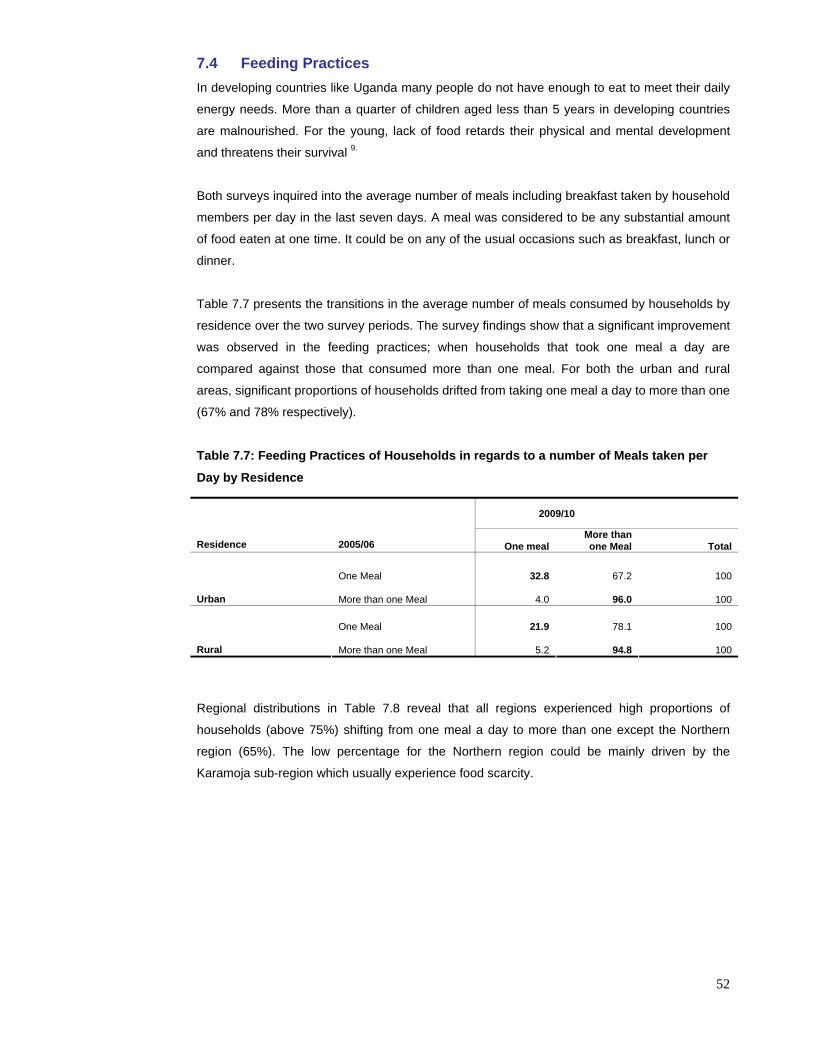
52
7.4 Feeding Practices In developing countries like Uganda many people do not have enough to eat to meet their daily
energy needs. More than a quarter of children aged less than 5 years in developing countries
are malnourished. For the young, lack of food retards their physical and mental development
and threatens their survival 9.
Both surveys inquired into the average number of meals including breakfast taken by household
members per day in the last seven days. A meal was considered to be any substantial amount
of food eaten at one time. It could be on any of the usual occasions such as breakfast, lunch or
dinner.
Table 7.7 presents the transitions in the average number of meals consumed by households by
residence over the two survey periods. The survey findings show that a significant improvement
was observed in the feeding practices; when households that took one meal a day are
compared against those that consumed more than one meal. For both the urban and rural
areas, significant proportions of households drifted from taking one meal a day to more than one
(67% and 78% respectively).
Table 7.7: Feeding Practices of Households in regards to a number of Meals taken per
Day by Residence
2009/10
Residence
2005/06 One meal
More than one Meal Total
One Meal 32.8 67.2 100
Urban More than one Meal 4.0 96.0 100
One Meal 21.9 78.1 100
Rural More than one Meal 5.2 94.8 100
Regional distributions in Table 7.8 reveal that all regions experienced high proportions of
households (above 75%) shifting from one meal a day to more than one except the Northern
region (65%). The low percentage for the Northern region could be mainly driven by the
Karamoja sub-region which usually experience food scarcity.

53
Table 7.8: Feeding Practices of Households in regards to a number of Meals taken per
Day by Region
2009/10
Region
2005/06 One
Meal
More than
one Meal Total
One Meal 9.7 90.3 100
Central More than one Meal 6.3 93.7 100
One Meal 25.5 74.5 100
Eastern More than one Meal 3.8 96.2 100
One Meal 35.2 64.8 100
Northern More than one Meal 6.5 93.5 100
One Meal 16.4 83.4 100
Western More than one Meal 3.4 96.6 100
7.5 Food Security Uganda’s agricultural production, which was a key to its growth during the 1990s, registered
declining growth in the recent past. More importantly, population growth rates have superseded
increases in agricultural production. Food shortages have been mitigated by food aid/assistance
and food imports.10
The UNPS also solicited information on food security by asking households whether they had
been faced with a situation in which they did not have enough food to feed in the last 12
months. Figure 7.1 presents the distribution of households that experienced the afore-
mentioned situation in the last 12 months by residence and region. It should be noted that this
information only exists for original households that were interviewed in 2009/10 including split-
off households.
Overall, 41 percent of households in Uganda reported not having enough food to feed during
the last 12 months preceding the survey. The situation was more pronounced amongst rural
households (84%) compared to their urban counterparts (16%). There were no major variations
across regions; however, three in every ten households in the Northern region (30%) had
experienced a situation of insufficient food for the household to feed in the last 12 months while
only 21 percent of households in the Western region had experienced the same.
10 S. Ssewanyana (2006) “Understanding Food Insecurity in Uganda: A special study,” EPRC & MEMS, USAID.
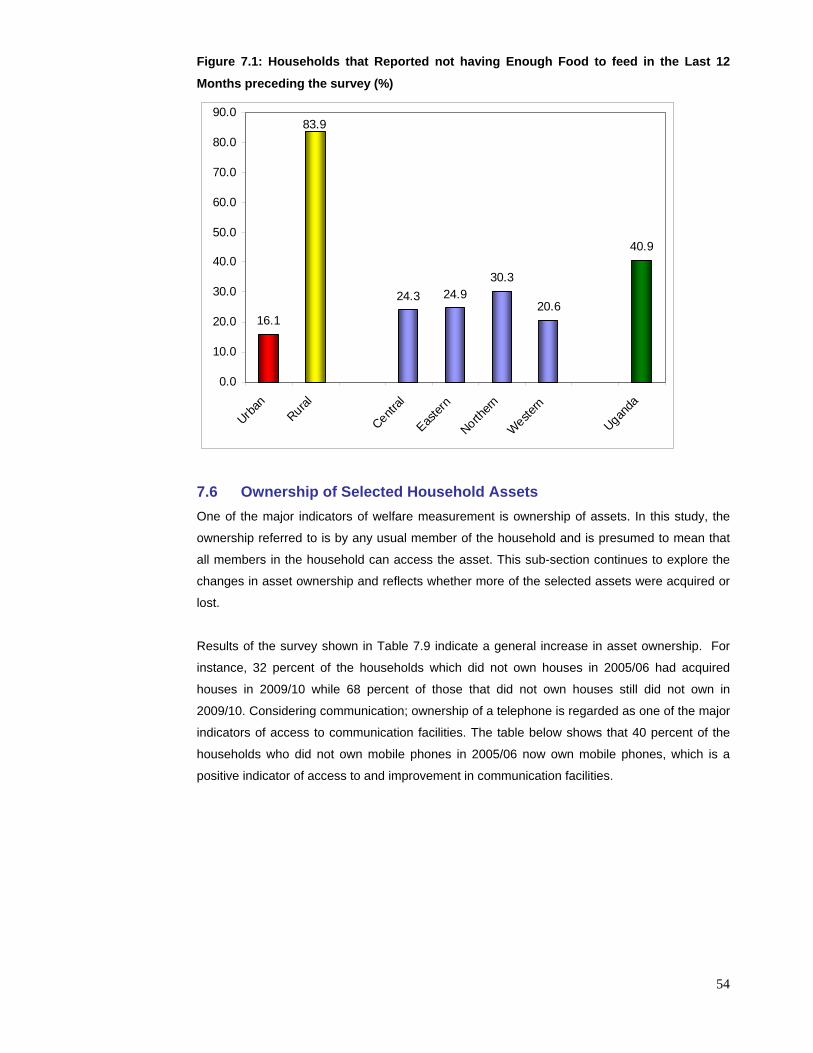
54
Figure 7.1: Households that Reported not having Enough Food to feed in the Last 12
Months preceding the survey (%)
16.1
24.3 24.930.3
20.6
40.9
83.9
0.0
10.0
20.0
30.0
40.0
50.0
60.0
70.0
80.0
90.0
Urban
Rural
Central
Easter
n
Northern
Western
Uganda
7.6 Ownership of Selected Household Assets One of the major indicators of welfare measurement is ownership of assets. In this study, the
ownership referred to is by any usual member of the household and is presumed to mean that
all members in the household can access the asset. This sub-section continues to explore the
changes in asset ownership and reflects whether more of the selected assets were acquired or
lost.
Results of the survey shown in Table 7.9 indicate a general increase in asset ownership. For
instance, 32 percent of the households which did not own houses in 2005/06 had acquired
houses in 2009/10 while 68 percent of those that did not own houses still did not own in
2009/10. Considering communication; ownership of a telephone is regarded as one of the major
indicators of access to communication facilities. The table below shows that 40 percent of the
households who did not own mobile phones in 2005/06 now own mobile phones, which is a
positive indicator of access to and improvement in communication facilities.
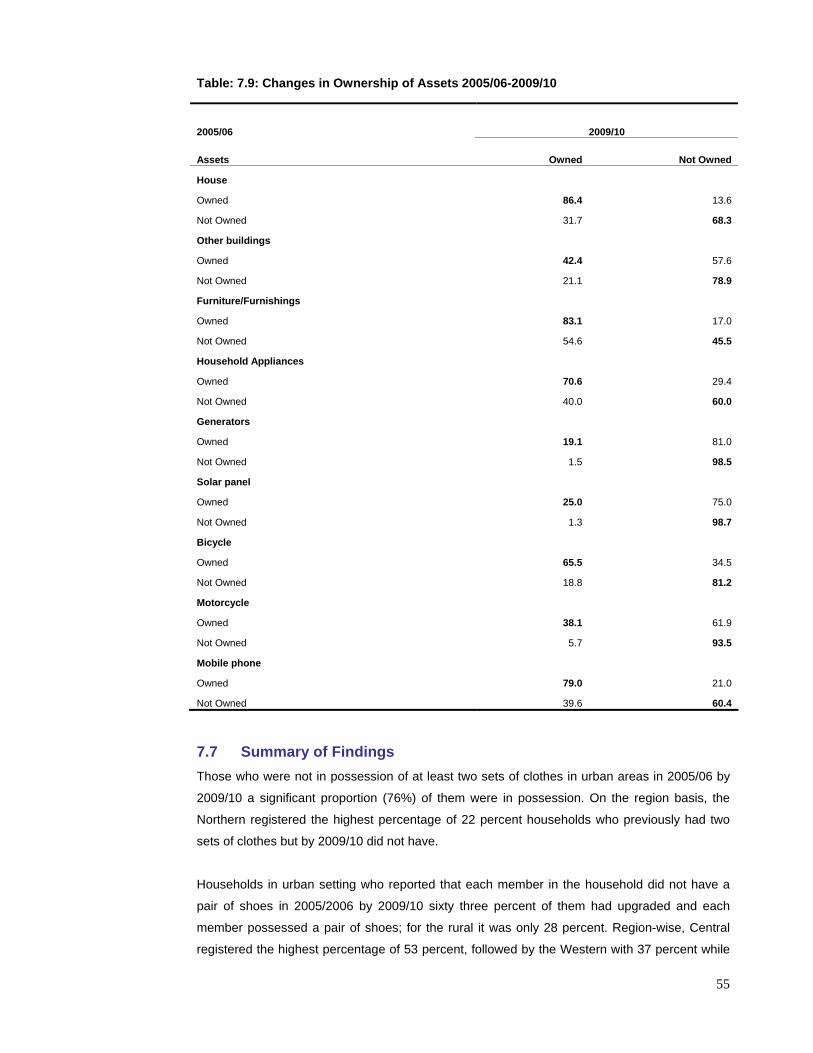
55
Table: 7.9: Changes in Ownership of Assets 2005/06-2009/10
2005/06 2009/10
Assets Owned Not Owned
House
Owned 86.4 13.6
Not Owned 31.7 68.3
Other buildings
Owned 42.4 57.6
Not Owned 21.1 78.9
Furniture/Furnishings
Owned 83.1 17.0
Not Owned 54.6 45.5
Household Appliances
Owned 70.6 29.4
Not Owned 40.0 60.0
Generators
Owned 19.1 81.0
Not Owned 1.5 98.5
Solar panel
Owned 25.0 75.0
Not Owned 1.3 98.7
Bicycle
Owned 65.5 34.5
Not Owned 18.8 81.2
Motorcycle
Owned 38.1 61.9
Not Owned 5.7 93.5
Mobile phone
Owned 79.0 21.0
Not Owned 39.6 60.4 7.7 Summary of Findings Those who were not in possession of at least two sets of clothes in urban areas in 2005/06 by
2009/10 a significant proportion (76%) of them were in possession. On the region basis, the
Northern registered the highest percentage of 22 percent households who previously had two
sets of clothes but by 2009/10 did not have.
Households in urban setting who reported that each member in the household did not have a
pair of shoes in 2005/2006 by 2009/10 sixty three percent of them had upgraded and each
member possessed a pair of shoes; for the rural it was only 28 percent. Region-wise, Central
registered the highest percentage of 53 percent, followed by the Western with 37 percent while

56
Northern had the lowest with only 17 percent. In the rural areas the households who reported
each child having a blanket in 2005/06, by 2009/10 forty four percent of them reported not
having. Further more, it was only 25 percent of those who did not have a blanket by 2006/05
who had a blanket by 2009/10.
In both urban and rural, significant strides have been made in households who have shifted
from taking one meal a day to more than one meal by 67 percent and 78 percent for urban and
rural respectively. Overall 41 percent of the households in Uganda reported not having enough
food for their households during the last 12 months preceding the survey.
Much as assets were lost by some households, the general trend shows that there were more
assets acquired than were lost. This is a positive trend and seems to indicate an improvement in
the welfare of the panel households.

57
CHAPTER EIGHT TRANSITIONS IN HOUSING CHARACTERISTICS 8.0 Introduction The physical characteristics of the dwelling in which a household lives are important
determinants of the health status of household members. They can also be used as indicators
for the socio-economic status of households. This Chapter examines changes in housing
characteristics of households between 2005/06 and 2009/10 focusing on change in type of
dwelling unit, tenure status, type of construction materials used, water sources and toilet
facilities used by the household.
8.1 Type of Dwelling Unit
A dwelling unit is defined as a building or group of buildings occupied by a household as
separate living quarters. It can be a hut, a group of huts, a single house; a group of houses, an
apartment, or tenement among others. Both UNHS 2005/06 and the 2009/10 UNPS collected
information on the type of dwelling unit that a household lived in. For purposes of the analysis,
dwelling units were classified into two broad categories namely independent houses, flats and
apartments and ‘other’ types of dwellings which include tenement, boys’ quarters, garage, hut,
uniport among others.
Table 8.1 shows the results of the transitions in types of dwelling units over the two survey
periods. The percentages highlighted in bold indicate the households with the same type of
dwelling over both survey years. Overall, 89 percent of household that lived in independent
houses, flats and apartments in 2005/06 still did in 2009/10 while 11 percent moved from
independent houses, flats and apartments into ‘other’ types of dwellings. Of the households
that were living in ‘other’ types of dwellings in 2005/06, 67 percent still lived in the same type of
dwelling in 2009/10 while 33 percent moved into independent houses, flats and apartments.
Considering the place of residence, about 89 percent of urban households that lived in
independent houses, flats and apartments in 2005/06 were still living in the same type of
dwelling units in 2009/10 while 12 percent moved to ‘other’ types of dwelling units. Thirty eight
percent of the rural households that were residing in ‘other’ types of dwelling units in 2005/06
moved to independent houses, flats and apartments in 2009/10. Region-wise, the Northern
region had the highest proportion of households that were living in independent houses, flats
and apartments in 2005/06 that moved to ‘other’ types of dwellings (26%) followed by Eastern
region (13%) while the Western region had the lowest (6%). On the other hand, the Western
region had the highest proportion of households living in ‘other’ types of dwellings who moved to

58
independent houses, flats and apartments (54%) while the Central and Northern regions had
the least proportion (29%).
Table 8.1: Transitions in Type of Dwelling Units by Residence and Region (%)
2009/10 2005/06
Other types of dwelling
Independent house /flat/ apartment
Residence
Urban
Other types of dwelling 79.5 20.5
Independent house/ flat/ apartment 11.5 88.6
Rural
Other types of dwelling 62.5 37.6
Independent house/ flat/ apartment 10.6 89.4
Region
Central
Other types of dwelling 70.7 29.3
Independent house/ flat/ apartment 9.9 90.1
Eastern
Other types of dwelling 65.1 34.9
Independent house/ flat/ apartment 12.6 87.4
Northern
Other types of dwelling 70.6 29.4
Independent house/ flat/ apartment 25.6 74.4
Western
Other types of dwelling 45.6 54.4
Independent house/ flat/ apartment 6.3 93.7
Uganda
Other types of dwelling 67.2 32.8
Independent house/ flat/ apartment 10.7 89.3
8.2 Tenure status of dwelling unit The tenure status of dwelling units refers to the arrangements under which households reside in
dwelling units. Tenure status in the survey was categorised into owner occupied, rented,
supplied free by employer/relative and rent paid by relative or other person. Ownership of the
dwelling unit represents security of tenure of the household. In both survey periods under
consideration, households were asked about the tenure status of the dwelling units they
occupied. For this analysis, tenure status of the dwelling units has been categorised into owner
occupied and ‘other’ which includes rented, supplied free by employer/relative and rent paid by
relative or other person. The transitions in the tenure status of dwellings units are presented in
Table 8.2.

59
Overall, 88 percent the households that lived in owner occupied dwelling units in Uganda in
2005/06 still lived in dwelling units of the same tenure status in 2009/10 while 12 percent moved
to dwelling units with ‘other’ types of tenure status. On the other hand, 73 percent of the
households that lived in dwelling units with ‘other’ tenure status in 2005/06 still occupied
dwelling units with the same tenure status in 2009/10 while only 27 percent moved to owner
occupied dwelling units.
Considering rural-urban differentials, 81 percent of urban and 88 percent of rural households
that lived in owner occupied dwellings in 2005/06 were still living in dwelling units with the same
tenure status in 2009/10. Conversely, 17 percent of urban and 38 percent of rural households
that lived in dwelling units with ‘other’ tenure status in 2005/06 moved to owner occupied
dwelling units in 2009/10. Transitions by region reveal that the Northern region (61%) had the
highest percentage of households that moved from dwelling units with ‘other’ tenure to owner
occupied dwelling units followed by the Western region (30%). The Central and Western
regions had the highest proportions of households that transited from owner occupied dwelling
units to dwelling units with ‘other’ tenure status (15% for each) respectively.
Table 8.2: Transitions in Tenure status of Dwelling Unit by Residence and Region (%)
2009/10 2005/06 Other
tenure Owner
occupied Residence
Urban
Other tenure 82.7 17.3
Owner occupied 19.3 80.7
Rural
Other tenure 62.4 37.6
Owner occupied 11.6 88.4
Region
Central
Other tenure 77.2 22.8
Owner occupied 15.2 84.8
Eastern
Other tenure 81.3 18.7
Owner occupied 5.8 94.2
Northern
Other tenure 38.9 61.1
Owner occupied 12.7 87.4
Western
Other tenure 70.0 30.0
Owner occupied 15.4 84.6
Uganda
Other tenure 72.9 27.1
Owner occupied 12.4 87.6

60
8.3 Type of materials used for Construction The materials used for construction of a dwelling unit can be used as a proxy measure of the
quality of housing as well as an indicator of health risk. Both surveys collected information on
the main type of construction materials of the roof, external walls and floor.
8.2.1 Materials used for Roofing
Roof types were categorised into two namely rudimentary and improved types for purposes of
this analysis. Rudimentary roof includes, thatch, straw, mud, wood planks among others.
Improved roof refers to iron sheets, asbestos, tiles and concrete/cement.
Table 8.3 present the transition of households with the different types of roof materials. The
findings indicate that, overall, slightly over one in every four households (27%) that lived in
dwelling units with rudimentary roofs in 2005/06 transited to dwelling units with improved roofs
in 2009/10. Furthermore, 53 percent of the urban households that had dwellings with
rudimentary roofs in 2005/06 transited to dwellings with improved roofs in 2009/10 while 25
percent of rural households that had dwellings with rudimentary roofs in 2005/06 had transited
to dwellings with improved roofs in 2009/10.
Variations at regional level show that the Central region had the highest proportion of
households (54%) transiting from dwelling units with rudimentary roofs in 2005/06 to dwellings
with improved roofs in 2009/10 followed by the Western region (39%). The Northern region had
the lowest proportion of households (5%) that transited from dwellings with rudimentary roofs in
2005/06 to dwellings with improved roofs in 2009/10 and the same region also had the highest
proportion of households (12%) that experienced transition from dwelling units with improved
roofs in 2005/06 to dwellings with rudimentary roofs in 2009/10 compared to other regions.

61
Table 8.3: Transitions in Roof Type by Residence and Region (%)
2009/10 2005/06 Rudimentary
roof Improved
roof Residence
Urban
Rudimentary roof 46.9 53.1
Improved roof 3.2 96.8
Rural
Rudimentary roof 74.7 25.3
Improved roof 2.5 97.5
Region
Central
Rudimentary roof 45.9 54.1
Improved roof 1.8 98.3
Eastern
Rudimentary roof 63.7 36.3
Improved roof 2.7 97.3
Northern
Rudimentary roof 94.7 5.4
Improved roof 11.5 88.5
Western
Rudimentary roof 61.2 38.8
Improved roof 2.9 97.1
Uganda
Rudimentary roof 73.6 26.5
Improved roof 2.7 97.3
8.2.2 Materials used for Wall
Quality wall materials ensure that household members are protected from hazardous
conditions. For purposes of this analysis, walls made of burnt bricks with mud or cement,
cement blocks and stone were considered as permanent walls while walls made of thatch,
straw, mud and poles, timber etc were categorized as temporary walls.
Table 8.4 shows the transitions in type of wall material over the two survey periods. Overall, the
results show that 17 percent of households in Uganda that lived in dwelling units with temporary
walls in 2005/06 had transited to dwelling units with permanent walls in 2009/10. The Table
further shows that 36 percent of the urban households that lived in dwellings with temporary
walls in 2005/06 moved to dwellings with permanent walls in 2009/10. Fifteen percent of the
households in rural areas that lived in dwellings with temporary walls in 2005/06 transited to
dwellings with permanent walls in 2009/10.
Among the regions, the Central had the highest proportion of households (30%) that had
transited from dwellings with temporary walls in 2005/06 to dwellings with permanent walls in
2009/10 followed by Eastern region (19%). The Northern region had the highest proportion of

62
households (25%) that had transited from dwelling units with permanent walls in 2005/06 to
dwelling units with temporary walls in 2009/10 followed by the Western region (13%).
Table 8.4: Transitions in Wall type by Residence and Region (%)
2009/10 2005/06
Temporary walls
Permanent walls
Residence
Urban
Temporary walls 64.2 35.8
Permanent walls 6.6 93.4
Rural
Temporary walls 84.6 15.4
Permanent walls 11.8 88.2
Region
Central
Temporary walls 70.1 29.9
Permanent walls 7.5 92.5
Eastern
Temporary walls 80.8 19.3
Permanent walls 9.4 90.6
Northern
Temporary walls 87.7 12.3
Permanent walls 25.1 74.9
Western
Temporary walls 88.5 11.5
Permanent walls 13.3 86.7
Uganda
Temporary walls 83.0 17.0
Permanent walls 9.9 90.1
8.2.3 Materials used for Floor
The type of construction material used for flooring is also an important indicator of the socio-
economic status and to some extent determines the household’s vulnerability to exposure to
disease causing agents. For this analysis, floors have been categorised into finished and
natural floors. Finished floors include those made of cement, mosaic or tiles, bricks, stone and
wood while natural floors are made of earth with or without cow dung etc.
Table 8.5 presents the transitions in the type of floor materials over the two survey periods. The
survey findings reveal that, overall, in Uganda nine percent of the households that lived in
dwellings with natural floors in 2005/06 moved on to dwellings with finished floors in 2009/10
while 13 percent of households that lived in dwelling units with finished floors in 2005/06
transited to dwellings with unfinished floors in 2009/10. Thirty five percent of the urban
households that lived in dwelling units with natural floors in 2005/06 moved to dwelling units with
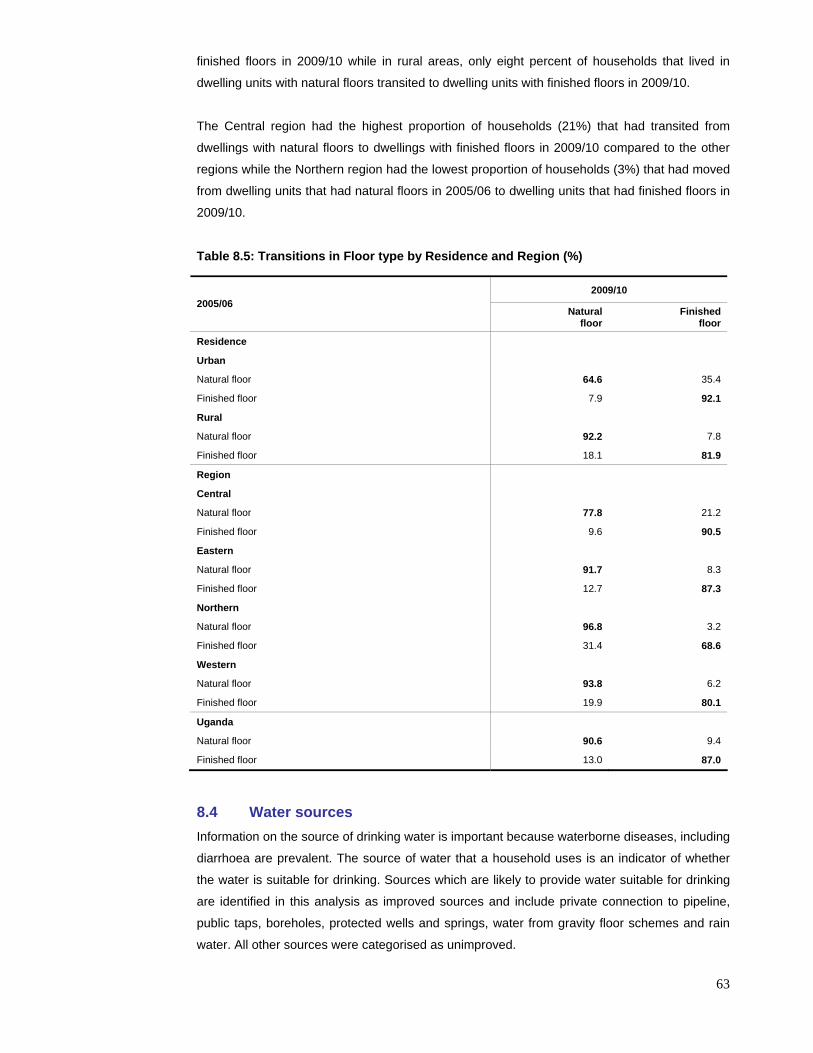
63
finished floors in 2009/10 while in rural areas, only eight percent of households that lived in
dwelling units with natural floors transited to dwelling units with finished floors in 2009/10.
The Central region had the highest proportion of households (21%) that had transited from
dwellings with natural floors to dwellings with finished floors in 2009/10 compared to the other
regions while the Northern region had the lowest proportion of households (3%) that had moved
from dwelling units that had natural floors in 2005/06 to dwelling units that had finished floors in
2009/10.
Table 8.5: Transitions in Floor type by Residence and Region (%)
2009/10 2005/06
Natural floor
Finished floor
Residence
Urban
Natural floor 64.6 35.4
Finished floor 7.9 92.1
Rural
Natural floor 92.2 7.8
Finished floor 18.1 81.9
Region
Central
Natural floor 77.8 21.2
Finished floor 9.6 90.5
Eastern
Natural floor 91.7 8.3
Finished floor 12.7 87.3
Northern
Natural floor 96.8 3.2
Finished floor 31.4 68.6
Western
Natural floor 93.8 6.2
Finished floor 19.9 80.1
Uganda
Natural floor 90.6 9.4
Finished floor 13.0 87.0
8.4 Water sources Information on the source of drinking water is important because waterborne diseases, including
diarrhoea are prevalent. The source of water that a household uses is an indicator of whether
the water is suitable for drinking. Sources which are likely to provide water suitable for drinking
are identified in this analysis as improved sources and include private connection to pipeline,
public taps, boreholes, protected wells and springs, water from gravity floor schemes and rain
water. All other sources were categorised as unimproved.

64
Table 8.6 presents household transitions in sources of drinking water over the two surveys. The
survey results show that overall, 56 percent of households in Uganda that were getting their
drinking water from unimproved sources in 2005/06 were still getting their drinking water from
unimproved sources in 2009/10 while 44 percent moved to improved water sources in 2009/10.
Eighty six percent of the households that were using improved water sources in 2005/06 were
still using improved water sources in 2009/10.
Seventy eight percent of households in the urban areas that were using unimproved water
sources in 2005/06 transited to using improved water sources in 2009/10 while only 8 percent of
urban households that were using improved water sources in 2009/10 transited to using
unimproved sources. The results further show that 42 percent of households in rural areas that
used unimproved water sources in 2005/06 transited to using improved sources in 2009/10. The
Eastern region had the highest proportion of households (66%) that moved from use of
unimproved water sources in 2005/06 to improved water sources in 2009/10 among the regions
while the Western region had the lowest proportion of households (37%) that moved to using
improved water sources.
Table 8.6: Transitions in use of Water sources by Residence and Region (%)
2009/10 2005/06
Not improved source
Improved source
Residence
Urban
Not improved source 21.6 78.4
Improved source 8.4 91.6
Rural
Not improved source 58.0 42.0
Improved source 15.7 84.3
Region
Central
Not improved source 62.8 37.2
Improved source 14.7 85.3
Eastern
Not improved source 34.5 65.5
Improved source 7.6 92.4
Northern
Not improved source 42.7 57.3
Improved source 14.6 85.4
Western
Not improved source 63.5 36.5
Improved source 20.4 79.6
Uganda
Not improved source 55.9 44.1
Improved source 14.0 86.0
65
8.5 Type of toilet facilities
Ensuring adequate sanitation facilities is one of the Millennium Development Goals that
countries like Uganda are striving to achieve along with other countries. A household was
classified as having an improved toilet facility if the facility was used only by members of that
household (i.e. not shared) and if the facility separates the waste from human contact
(WHO/UNICEF Joint Monitoring Programme for Water Supply and Sanitation, 2004).
Table 8.7 shows the transitions in the type of toilet facilities used by households over the two
survey periods. The results presented, show that in Uganda, 33 percent of households that
were using unimproved toilet facilities in 2005/06 moved to using improved toilet facilities in
2009/10 while about 28 percent of households that were using improved facilities in 2005/06
moved to using unimproved toilet facilities in 2009/10.
Considering the household’s place of residence, 20 percent of the households in urban areas
that were using unimproved toilet facilities in 2005/06 were using improved toilet facilities in
2009/10. On the other hand, about 32 percent of households in urban areas that were using
improved toilet facilities in 2005/06 had moved to using unimproved toilet facilities in 2009/10. In
rural areas, 37 percent of households that were using unimproved toilet facilities in 2005/06
transited to use of improved toilets in 2009/10.
Transitions by region show that the Western region had the highest proportion of households
(48%) using unimproved toilet facilities in 2005/06 that transited to use of improved toilets in
2009/10 while the Northern region had the lowest (24%). On the other hand, the Northern region
had the highest proportion of households (48%) that transited from the use of improved toilet
facilities in 2005/06 to unimproved toilet facilities in 2009/10 while Western region had the
lowest (18%).

66
Table 8.7: Transitions in Type of Toilet Facilities by Residence and Region (%)
2009/10 2005/06
Not improved toilet facility
Improved toilet facility
Residence
Urban
Not improved toilet facility 80.3 19.7
Improved toilet facility 31.6 68.4
Rural
Not improved toilet facility 63.4 36.6
Improved toilet facility 27.2 72.9
Region
Central
Not improved toilet facility 70.6 28.8
Improved toilet facility 29.1 70.9 Eastern
Not improved toilet facility 63.1 37.0
Improved toilet facility 34.2 65.8 Northern
Not improved toilet facility 76.3 23.7
Improved toilet facility 48.1 51.9 Western
Not improved toilet facility 51.6 48.4
Improved toilet facility 17.6 82.4
Uganda
Not improved toilet facility 67.0 33.0
Improved toilet facility 27.8 72.2
8.6 Summary of Findings
Thirty three percent of all households that were living in ‘other’ types of dwellings in 2005/06 had
moved to independent houses, flats and apartments by 2009/10. The Northern region had the
highest percentage of households that were living in independent houses, flats and apartments
in 2005/06 that moved to ‘other’ types of dwelling units in 2009/10.
Eighty eight percent of all households in Uganda that lived in owner occupied dwelling units in
2005/06 still lived in owner occupied dwelling units in 2009/10. One in every four households
that lived in dwelling units with rudimentary roofs in 2005/06 transited to dwelling units with
improved roofs in 2009/10. Northern region had the highest percentage of households (11%)
that transited from dwellings with improved roofs in 2005/06 to dwellings with rudimentary roofs
in 2009/10.
Four in ten households in Uganda (44%) that were getting their drinking water from unimproved
sources in 2005/06 moved to improved water sources in 2009/10. Thirty three percent of
households that were using unimproved toilet facilities in 2005/06 moved to using improved
toilet facilities in 2009/10.

67
CHAPTER NINE CHANGES IN THE AGRICULTURAL SECTOR 9.0 Introduction According to the World Development Report on Agriculture for Development (World Bank,
2007), agriculture is critical if countries are to achieve the poverty targets set forth by the
Millennium Development Goals within the agreed timeframe. Persistent under-investment in
women and agriculture together with gender disparities in knowledge, technology, access to
credit and land result into less food being grown, less income being earned, higher levels of
poverty and greater food insecurity. Thus, efforts to fight poverty in Africa must focus on rural
areas, agriculture, and must be gender-sensitive. Indeed, this is one of the central tenets
common to most Poverty Reduction Strategies.
In Uganda, the agricultural sector is of great importance to the economy. According to the 2002
Uganda Population and Housing Census (PHC), the agricultural sector accounted for 73
percent of the total employment for the persons aged 10 years and above. In addition, the
2005/06 UNHS estimated the numbers of Agricultural Households (Ag HHs) to be 4.2 million,
which was about 79 percent of all households in Uganda. In order to eradicate poverty from the
majority of the population in rural areas, the government established and has been
implementing the Plan for Modernization of Agriculture (PMA) in line with the Poverty
Eradication Action Plan (PEAP). In the last eight years the policy environment for the agriculture
sector in Uganda has been shaped by the Plan for Modernization of Agriculture (PMA) which is
a multi-sectoral policy framework for agriculture and rural development. The multi-sectoral
nature of PMA gave it breadth that agriculture needs to move forward. Its scope covered seven
pillars: research and technology development; National Agricultural Advisory Services; rural
finance; agro-processing and marketing; agricultural education; physical infrastructure as well
as sustainable natural resource utilization and management. The PMA implementation mandate
spread across 13 ministries and agencies, which among other factors, affected implementation.
In 2005, the Rural Development Strategy (RDS) was formulated with the overall objective of
raising household incomes with a focus on the sub-county as a basic unit for planning. In 2006,
a much broader vision of Prosperity for All (PFA) was formulated and subsequently Government
formulated the National Development Plan (NDP). The NDP embodies investment priorities
which include: Physical infrastructure development mainly in energy, railway, waterways and air
transport; Human resources development in areas of education, skills development, health,
water and sanitation; Facilitating availability and access to critical production inputs especially in
agriculture and industry; and Promotion of science, technology and innovation. The
development approach of the NDP intertwines economic growth and poverty eradication.
Information on the changes taking place in agricultural sector is therefore crucial for monitoring
the RDS, the PFA programme; the NDP as well as the Millennium Development Goals (MDGs).

68
9.0.1 Objectives of the agricultural module
The purpose of the agricultural module in the 2009/10 UNPS was to give a better descriptive
picture of Uganda’s farm economy, and deeper insight into factors affecting farm incomes.
These include a better understanding of the influence of farmers’ resources and marketing
opportunities on farm-household income; as well as how the farmers’ situation has changed in
the past few years.
Data collected by the survey allows for analysis of the factors most highly associated with
greater farm profitability. These can broadly be classified into two categories: commodity/factor
markets, and technology. A second level of analysis would allow for independent assessment of
factors associated with higher profitability, such as commodity mix, level of input use, degree of
commercialization, land market participation, etc.
9.0.2 Number of visits to Household
During the survey, two visits were made to each selected Agricultural Household in order to
capture seasonality patterns in both the Socio-Economic and Agricultural Module where
applicable. The visits were as follows:
i) The first visit (January-June 2009)
The Agricultural module was administered to all households that were engaged in agricultural
activities and collected information for the first Season of 2009 (January-June). In addition, the
Socio-Economic Module was administered to five out of the ten selected households in each EA
during the first visit.
ii) Second visit (July-December 2009)
The Agricultural Module was administered to all households that were engaged in agriculture
and collected information for the Second Season of 2009 (July-December). The Socio-
Economic module was then administered to the remaining five out of the ten selected
households in each EA. Therefore, the data used for the analysis in this chapter was collected
for both the first and second agricultural seasons of the year 2009.
9.0.3 Problems Encountered and Constraints
During the survey some problems and experiences related to the agricultural module were
experienced and are outlined below:
Measuring Large Areas: Enormously large parcels especially with in the Western region of Uganda were difficult to
measure using the Global Positioning System (GPS) and yet in some circumstances the land
owners did not know the exact size of their parcels nor could they accurately estimate the area.
Nonetheless, the entire land areas had to be measured even if it took a lot of time.

69
Timing of the two Visits: Information collected on the two major cropping seasons required the respondents to recall
what took place several months back long after the harvest periods. For that reason, memory
lapse of the respondents could have led to production of more of estimated information instead
of the actual especially during the first visit.
Resistance to area measurement: Some respondents did not want their plot areas to be measured. As a result measuring land in
some districts was a real challenge and in a number of cases, some communities did not
cooperate in spite of the intervention of the district leadership- so land was not measured.
Under-reporting: Under-reporting of livestock and poultry numbers emerged as a challenge to the data collectors
since the majority of farmers engaged in those activities usually gave estimates.
9.1 Characteristics of Agricultural Households (Ag HHs)
This section gives an overview of the characteristics of Ag hhs by discussing the definition,
numbers, size, regional and distribution of Ag HHs; plus the parcels and plots that the
Agricultural HHs operate.
9.1.1 Regional Distribution of Ag HHs
An Agricultural Holding or Household is an economic unit of agricultural production under single
management comprising of all livestock kept and all land used wholly or partially for agricultural
production purposes, without regard to title, legal form or size. Table 9.1 presents the
distribution of Ag hhs as well as non-Ag hhs by region over the two survey periods.
The 2009/10 survey results show that the Northern region registered the highest proportion of
household engaged in agriculture (27%) followed by the Eastern region (25%), the Western
region (24%) and the Central region (23%) which had the least proportion of agricultural
households reported. A similar pattern was observed from the 2005/06 UNHS.
Table 9.1: Distribution of Agricultural households by Region and survey year (%)
2005/6 2009/10
Non Agric
households
HHs engaged in agriculture
Non Agric households
HHs engaged in Agriculture
Central 66.7 22.6 64.5 23.3
Eastern 9.6 26.0 15.0 25.4
Northern 13.3 26.4 10.6 27.2
Western 10.4 25.1 9.9 24.1
UGANDA 100.0 100.0 100.0 100.0
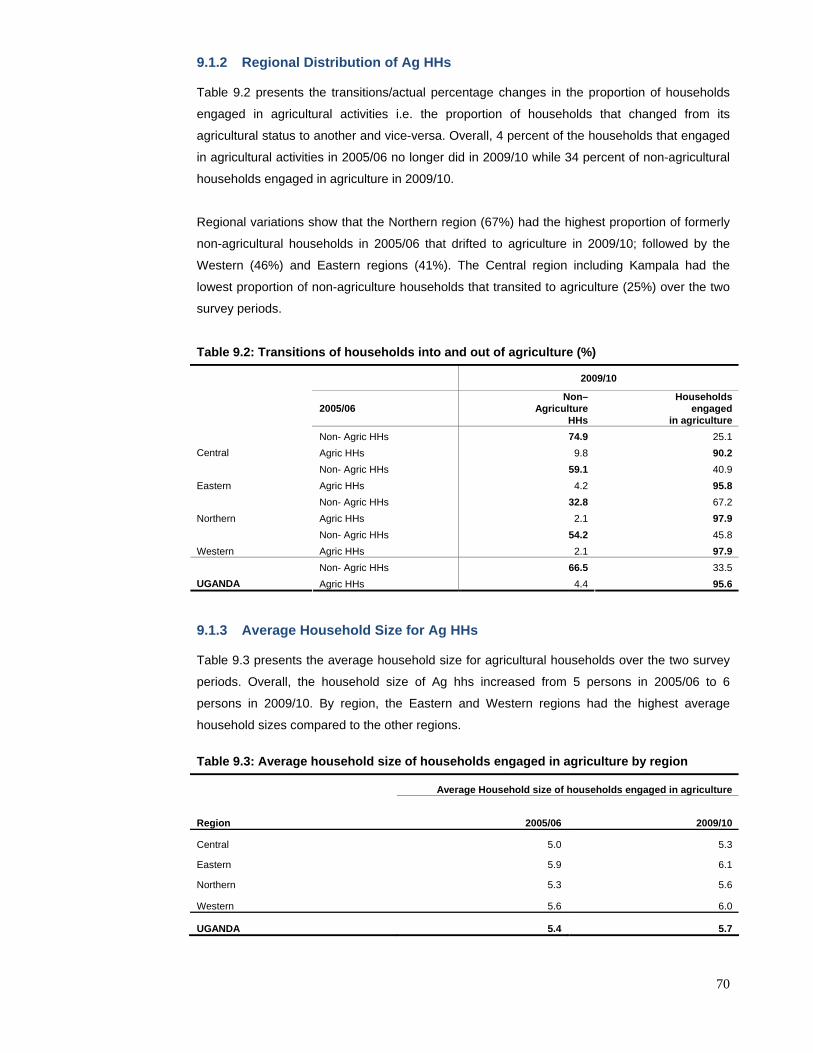
70
9.1.2 Regional Distribution of Ag HHs
Table 9.2 presents the transitions/actual percentage changes in the proportion of households
engaged in agricultural activities i.e. the proportion of households that changed from its
agricultural status to another and vice-versa. Overall, 4 percent of the households that engaged
in agricultural activities in 2005/06 no longer did in 2009/10 while 34 percent of non-agricultural
households engaged in agriculture in 2009/10.
Regional variations show that the Northern region (67%) had the highest proportion of formerly
non-agricultural households in 2005/06 that drifted to agriculture in 2009/10; followed by the
Western (46%) and Eastern regions (41%). The Central region including Kampala had the
lowest proportion of non-agriculture households that transited to agriculture (25%) over the two
survey periods.
Table 9.2: Transitions of households into and out of agriculture (%)
2009/10
2005/06 Non–
Agriculture HHs
Households engaged
in agriculture Non- Agric HHs 74.9 25.1
Central Agric HHs 9.8 90.2 Non- Agric HHs 59.1 40.9
Eastern Agric HHs 4.2 95.8 Non- Agric HHs 32.8 67.2
Northern Agric HHs 2.1 97.9 Non- Agric HHs 54.2 45.8
Western Agric HHs 2.1 97.9 Non- Agric HHs 66.5 33.5
UGANDA Agric HHs 4.4 95.6
9.1.3 Average Household Size for Ag HHs
Table 9.3 presents the average household size for agricultural households over the two survey
periods. Overall, the household size of Ag hhs increased from 5 persons in 2005/06 to 6
persons in 2009/10. By region, the Eastern and Western regions had the highest average
household sizes compared to the other regions.
Table 9.3: Average household size of households engaged in agriculture by region
Average Household size of households engaged in agriculture
Region 2005/06 2009/10
Central 5.0 5.3
Eastern 5.9 6.1
Northern 5.3 5.6
Western 5.6 6.0
UGANDA 5.4 5.7

71
9.1.4 Headship of Ag HHs
In Uganda, most households are headed by males; this sub-section however, aims to show the
possible transitions in headship for Ag HHs that occurred over the two survey periods. Table 9.4
reveals that, the Central region including Kampala (6%) had the highest proportion of formerly
male-headed households in 2005/06 that were being headed by a female in 2009/10. On the
other hand, in the same region, 16 percent of the formerly female headed households were
found to be male headed in 2009/10.
Table 9.4: Changes in headship for Ag HHs (%)
2009/10
Region 2005/06 Male
headedFemale headed
Central Male headed 93.8 6.2
Female headed 16.3 83.7
Eastern Male headed 97.2 2.8
Female headed 17.5 82.5
Northern Male headed 94.5 5.5
Female headed 21.2 78.9
Western Male headed 95.9 4.1
Female headed 21.7 78.3
UGANDA Male headed 95.4 4.6
Female headed 18.9 81.1 9.2 Median Land Holding Size Table 9.5 presents the median land holding area in acres for both 2005/06 and 2009/10 by
region. The survey results reveal that, overall; there was a 0.6 hectare increase in the median
land holding between the two periods. In terms of regional variations, the Northern region
experienced the highest increase in median land holding area compared to the other regions.
Table 9.5: Median Land Holding Size
Median land holding area in hectares
Region 2005/06 2009/10
Central 1.1 1.8
Eastern 1.2 1.8
Northern 1.6 3.7
Western 1.0 1.0
UGANDA 1.2 1.8
9.2.1 Changes in Number of Parcels owned
With regard to the number of parcels that a household owns, Table 9.6 shows that 62 percent of
the households that formerly had only one parcel for agriculture still had one in 2009/10.

72
Interesting to note is that nine percent of households that originally had five or more parcels
were left with only one in 2009/10 while less than two percent of the households that had one or
two parcels in 2005/06 had managed to acquire up to five or more parcels.
Table 9.6: Percentage number of households owning parcels
No. of parcels in 2009/10
No. of parcels in 2005/06 1 2 3 4 5+
1 61.8 27.8 8.5 1.2 0.7
2 39.0 40.3 15.7 3.3 1.7
3 22.4 35.6 25.6 10.1 6.4
4 19.0 25.3 21.1 24.2 10.5
5+ 8.6 17.3 24.7 17.3 32.1
UGANDA 44.5 31.8 14.5 5.2 4.0
9.3 Livestock and poultry numbers The survey also collected information on livestock, poultry or other related animals owned by
the household; earnings from the sale of such animals, expenditures on purchases, and the
general dynamics of rearing such animals over the reference period. The reference periods
varied for different sub-sections; for instance, information on cattle and pack animals was
collected using a 12 months recall period, while that for small stock (i.e. Goats, Sheep and Pigs)
had a reference period of 6 months. In addition, poultry and other related animals had a
reference period of 3 months prior to the date of the survey. Table 9.7 presents the mean herd
size per households by region over the two survey periods. The survey results generally show
that there wasn’t much variation in the mean number of livestock and poultry over the two
survey periods across all regions.
Table 9.7: Mean Livestock and Poultry size per household by region over the two survey periods
Cattle (all) Goats Sheep Donkeys Rabbit Pigs Chicken Turkey Ducks
Bee hives
2005/06 3 3 2 0 2 2 7 5 3 6 Central 2009/10 3 3 2 0 2.5 2 7 2 5 8
2005/06 2 3 3 0 7 2 8 4 4 2 Eastern 2009/10 2 3 2 0 4 2 9 2 2.5 2
2005/06 3 5 4 1 9 1 7 2.5 4.5 2 Northern 2009/10 3 4 3 2 2 1 7 4 3 2
2005/06 4 4 2 2 5 1 5 6 2 2 Western 2009/10 5 3 3 3 4 2 5 3.5 2 10

73
9.4 Fishing Uganda has 20 percent of its surface area as water. This comprises of five major lakes (Victoria,
Albert, Kyoga, Edward and George and about 160 minor lakes, rivers and wetlands). In 2009,
the fishing industry was regarded as the second largest exports earnings generating activity11 .
Unlike the UNHS 2005/06, the 2009/10 UNPS solicited information on fishing for households
that were engaged in the activity.
The Table 9.8 presents the distribution of households that were engaged in fishing activities in
2009/10. The survey findings show that, only three percent of households in Uganda were
engaged in fishing activities. Regional distributions show that the Eastern (4%) and Central
region (4%) dominated in the proportion of agricultural households engaged in fishing followed
by the Northern region (3%).
In terms of where the fishing was done, 48 percent of households fished in Lakes/natural ponds
while 21 percent did it in swampy areas. Most of the fishing in the Northern region took place in
rivers (34%); while in the Central and Eastern regions, it was done in Lakes/natural ponds (60%
and 49% respectively). Overall, only 8 percent of the households practiced fishing in artificial
ponds with the majority of households in the Western region (29%).
Table 9.8: Households engaged in fishing activities (2009/10)
Type of fishing (%)
Ag Households Engaged
in fishing (%) River
Lake/ natural
pond Artificial
pond Swamp
Central 4.1 0.0 60.2 6.2 5.0
Eastern 4.3 0.0 49.4 8.6 35.7
Northern 3.4 33.8 22.2 0.0 30.5
Western 1.0 0.0 55.1 28.5 0.0
Uganda 3.1 7.3 47.7 7.8 21.0
9.4.1 Average Daily Fish Caught
Table 9.9 shows that the average number of fishing days per year per household is 126
days/year and the average fish catch is approximately 44 kilograms. Furthermore, households
indicated that they sell 60 percent of their total daily catch and the average value of each daily
catch is UGX 902 per kilogram.
11 MAAIF, UFPEA & UBOS: 2009 Statistical Abstract and MAAIF DSIP: 2010

74
Table 9.9: Average daily Catch and Value (2009/10) Average
number of fishing days
per year
Average daily
catch (KG)
Proportion of daily
Catch sold (%)
Average value of
catch sold (UGX/kg)
Central 160 54 80.1 1300
Eastern 81 18 40.5 350
Northern 101 60 57.0 750
Western 243 75 72.8 1700
Uganda 126 44 60.3 902 9.5 Extension Services The National Agricultural Advisory Services (NAADS) programme under the Ministry of
Agriculture, Animal industry and Fisheries was created under the Plan for Modernisation of
Agriculture (PMA) to support government efforts in poverty reduction. The NAADS programme
is responsible for provision of agricultural advice to farmers. It empowers farmers, particularly
the poor, women and youth, to demand for agricultural advice that will improve production,
productivity and profitability for their agricultural enterprises. The agricultural advice may include
better management practices, market information, new technologies and where to access
inputs.
The survey also sought information on Extension Services delivered to agricultural households;
which included the following:
i) Participation of agricultural household members in NAADS training programmes;
ii) Membership of an agricultural household member in a farmers’ group under the Farmer
Institutional Development Scheme in NAADS;
iii) Participation of agricultural household members in prioritizing enterprises to demand for
advisory services under NAADS training programmes;
Table 9.10 presents the proportion of agricultural households that were visited by an extension
worker over the two survey periods. The survey findings show that, overall; the proportion of
households that revealed receiving advice in or for agricultural activities in 2009/10 had
increased to 24 percent compared to only six percent in 2005/06. Additionally regional variations
over the two survey periods show that the Northern region experienced the highest increase in
the proportion of households that had received advice in or for agricultural activities.
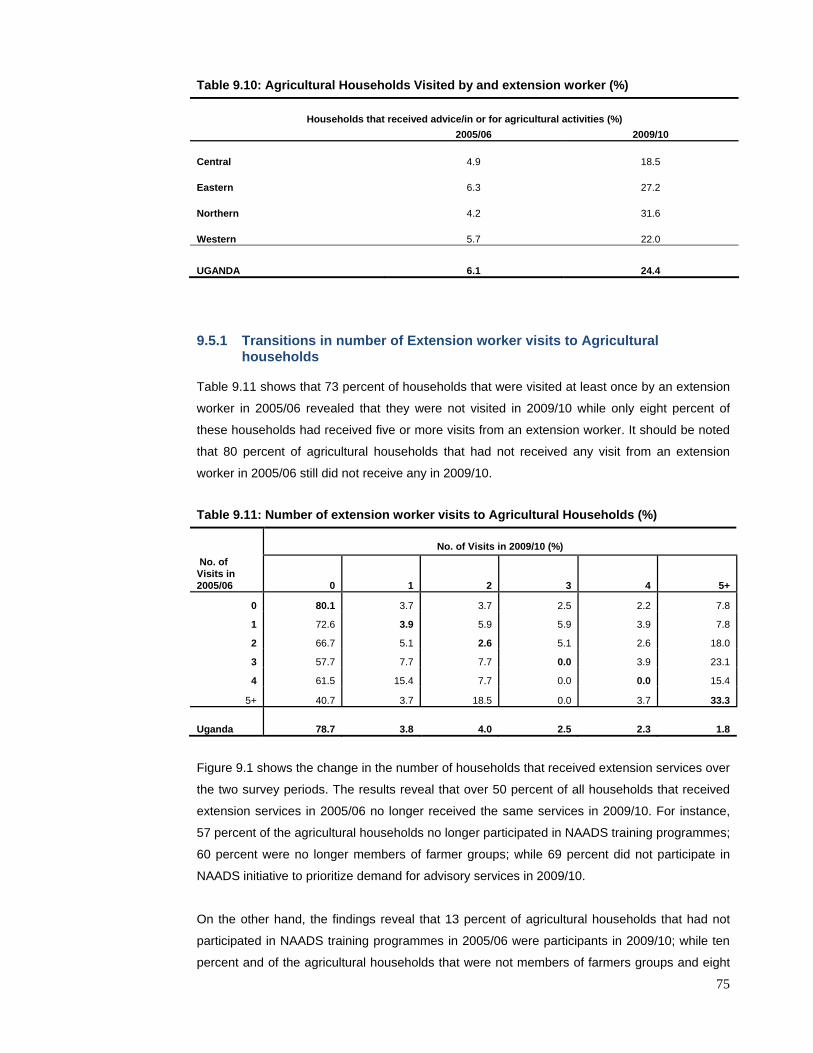
75
Table 9.10: Agricultural Households Visited by and extension worker (%)
Households that received advice/in or for agricultural activities (%) 2005/06 2009/10
Central 4.9 18.5
Eastern 6.3 27.2
Northern 4.2 31.6
Western 5.7 22.0
UGANDA 6.1 24.4
9.5.1 Transitions in number of Extension worker visits to Agricultural households
Table 9.11 shows that 73 percent of households that were visited at least once by an extension
worker in 2005/06 revealed that they were not visited in 2009/10 while only eight percent of
these households had received five or more visits from an extension worker. It should be noted
that 80 percent of agricultural households that had not received any visit from an extension
worker in 2005/06 still did not receive any in 2009/10.
Table 9.11: Number of extension worker visits to Agricultural Households (%)
No. of Visits in 2009/10 (%) No. of Visits in 2005/06 0 1 2 3 4 5+
0 80.1 3.7 3.7 2.5 2.2 7.8
1 72.6 3.9 5.9 5.9 3.9 7.8
2 66.7 5.1 2.6 5.1 2.6 18.0
3 57.7 7.7 7.7 0.0 3.9 23.1
4 61.5 15.4 7.7 0.0 0.0 15.4
5+ 40.7 3.7 18.5 0.0 3.7 33.3
Uganda 78.7 3.8 4.0 2.5 2.3 1.8 Figure 9.1 shows the change in the number of households that received extension services over
the two survey periods. The results reveal that over 50 percent of all households that received
extension services in 2005/06 no longer received the same services in 2009/10. For instance,
57 percent of the agricultural households no longer participated in NAADS training programmes;
60 percent were no longer members of farmer groups; while 69 percent did not participate in
NAADS initiative to prioritize demand for advisory services in 2009/10.
On the other hand, the findings reveal that 13 percent of agricultural households that had not
participated in NAADS training programmes in 2005/06 were participants in 2009/10; while ten
percent and of the agricultural households that were not members of farmers groups and eight

76
percent of those that did not participate in NAADS initiative to prioritize demand for advisory
services respectively were members in 2009/10.
Figure 9.1: Percentage change in number of households that received extension services
23.2
13.2 10 8.3
57.3 60 56.8
68.9
0
10
20
30
40
50
60
70
80
Received advice Participated in NAADStraining
Members of farmers'group
Participated in NAADSinitiatives to prioritise
enterprises to demandfor advisory services
Did not receive extension services in 2005/06 but received in 2009/10Received extension services in 2005/06 but did not in 2009/10
9.6 Summary of Findings
The 2009/10 survey results show that the Northern region registered the highest proportion of
households engaged in agriculture (27%) compared to other regions. Overall, 4 percent of the
households that engaged in agricultural activities in 2005/06 no longer did in 2009/10, while 34
percent of non-agricultural households engaged in agriculture in 2009/10. The household size of
Ag hhs increased from 5 persons in 2005/06 to 6 persons in 2009/10. The Central region (6%)
experienced the highest proportion of formerly male-headed households in 2005/06 that were
being headed by a female in 2009/10.
Overall, the median land holding between the two periods increased by 0.6 hectares. Sixty two
percent of households that formerly had only one parcel for agriculture still had one in 2009/10.
Only three percent of households in Uganda were engaged in fishing activities and 48 percent
of households revealed that they fished in Lakes/natural ponds while 21 percent did so in
swampy areas overall. The survey findings show that, overall; the proportion of households that
revealed receiving advice in or for agricultural activities in 2009/10 had increased to 24 percent
compared to only six percent in 2005/06

77
CHAPTER TEN TEACHER AND HEALTH WORKER ABSENTEEISM 10.0 Education System of Uganda Education is the key element for anyone desiring to improve on their situation and to move
towards a better future. The existing structure of the education system in Uganda has been in
force since the early 1960s. It consists of seven years of primary education followed by the
lower secondary cycle of four years and the upper secondary cycle of two years, after which
there are three to five years of university studies. The demand for primary education has
increased with the introduction of free primary education for four children in every family in
1997. This saw school enrolment increase from 2 million pupils in 1986 to over 6 millions pupils
by 1999.
The 2009/10 Uganda National Panel Survey (UNPS) visited the most commonly used primary
schools that communities in the selected EAs irrespective of type of ownership. In an attempt to
measure teacher absence, a commonly used methodology based on direct observations during
unannounced visits was utilised. Firstly, interviewers established the most commonly used
school from community opinion leaders including the Local Council executive. On identification
of the schools, unannounced visits were made to the schools in order to collect the required
information. After completion of the regular interview with the school representative at the time
of the visit, the interviewer acquired permission to be shown round the school in order to obtain
additional information as well as make some observations. The streams from which information
was collected were selected at random in cases where a school had more than one stream per
class.
The information in this chapter does not present any transitions in the different indicators under
analysis. This is mainly because no data on the same was collected in 2005/06. However,
subsequent Uganda National Panel Surveys will have transitions.
10.1 General School Characteristics
Figure 10.1 shows the distribution of schools by type of ownership. As expected, government
owned schools account for the majority of the most commonly used schools (94%) in Uganda
compared to all others.

78
Figure 10.1: Distribution of most commonly used school by type of ownership (%)
Private4%
Other1%
Government94%
NGO/Religious1%
10.1.1 Availability and Adequacy of school facilities
During the interviews conducted at the different primary schools, respondents were asked about
the availability and adequacy of the existing school infrastructure. The results in Table 10.1
indicate that classrooms were universally available although 26 and 52 percent of respondents
in government and other schools revealed that the available classrooms are not adequate
respectively. This pattern was the same for the availability and adequacy of toilets/latrines in
both Government and Private schools.
Table 10.1: Availability and adequacy of facilities in schools by ownership (%)
Availability Adequacy
Facility Government Others Government Others
Classrooms 99.0 100.0 25.9 51.7
Library 11.0 10.0 47.1 24.0
Teachers' houses 65.4 29.0 3.3 5.7
Toilets/Latrines 99.8 90.3 23.5 62.0
Others 8.6 46.9 38.1 30.3
10.1.2 Services/items provided by schools
Several items and services are essential for pupils to maximally benefit from what is offered at
school. The survey sought to establish the type of services that primary schools offered to pupils
and whether they were charged any fees. The findings presented in Table 10.2 reveal that only
60 percent of government schools provided text books compared to 80 percent of the others
schools. It is also worth noting that only 27 percent of government primary schools compared to
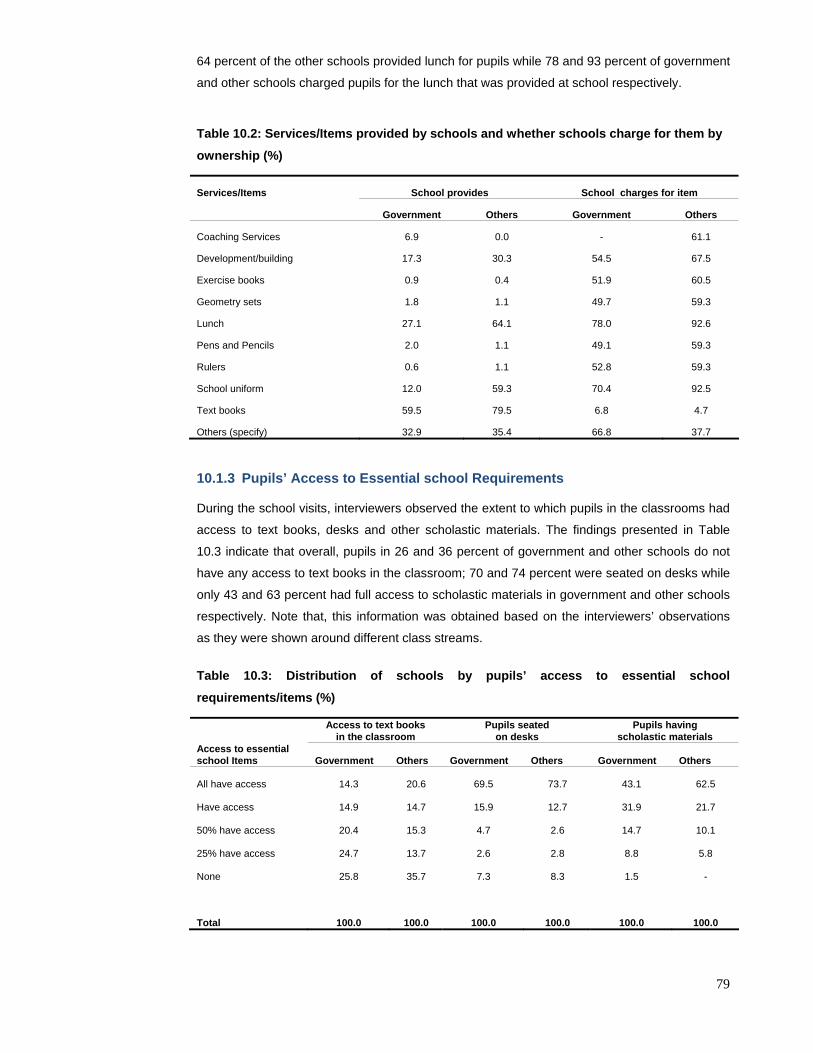
79
64 percent of the other schools provided lunch for pupils while 78 and 93 percent of government
and other schools charged pupils for the lunch that was provided at school respectively.
Table 10.2: Services/Items provided by schools and whether schools charge for them by
ownership (%)
Services/Items School provides School charges for item
Government Others Government Others
Coaching Services 6.9 0.0 - 61.1
Development/building 17.3 30.3 54.5 67.5
Exercise books 0.9 0.4 51.9 60.5
Geometry sets 1.8 1.1 49.7 59.3
Lunch 27.1 64.1 78.0 92.6
Pens and Pencils 2.0 1.1 49.1 59.3
Rulers 0.6 1.1 52.8 59.3
School uniform 12.0 59.3 70.4 92.5
Text books 59.5 79.5 6.8 4.7
Others (specify) 32.9 35.4 66.8 37.7
10.1.3 Pupils’ Access to Essential school Requirements
During the school visits, interviewers observed the extent to which pupils in the classrooms had
access to text books, desks and other scholastic materials. The findings presented in Table
10.3 indicate that overall, pupils in 26 and 36 percent of government and other schools do not
have any access to text books in the classroom; 70 and 74 percent were seated on desks while
only 43 and 63 percent had full access to scholastic materials in government and other schools
respectively. Note that, this information was obtained based on the interviewers’ observations
as they were shown around different class streams.
Table 10.3: Distribution of schools by pupils’ access to essential school
requirements/items (%)
Access to text books
in the classroom Pupils seated
on desks Pupils having
scholastic materials Access to essential school Items Government Others Government Others Government Others
All have access 14.3 20.6 69.5 73.7 43.1 62.5
Have access 14.9 14.7 15.9 12.7 31.9 21.7
50% have access 20.4 15.3 4.7 2.6 14.7 10.1
25% have access 24.7 13.7 2.6 2.8 8.8 5.8
None 25.8 35.7 7.3 8.3 1.5 -
Total 100.0 100.0 100.0 100.0 100.0 100.0
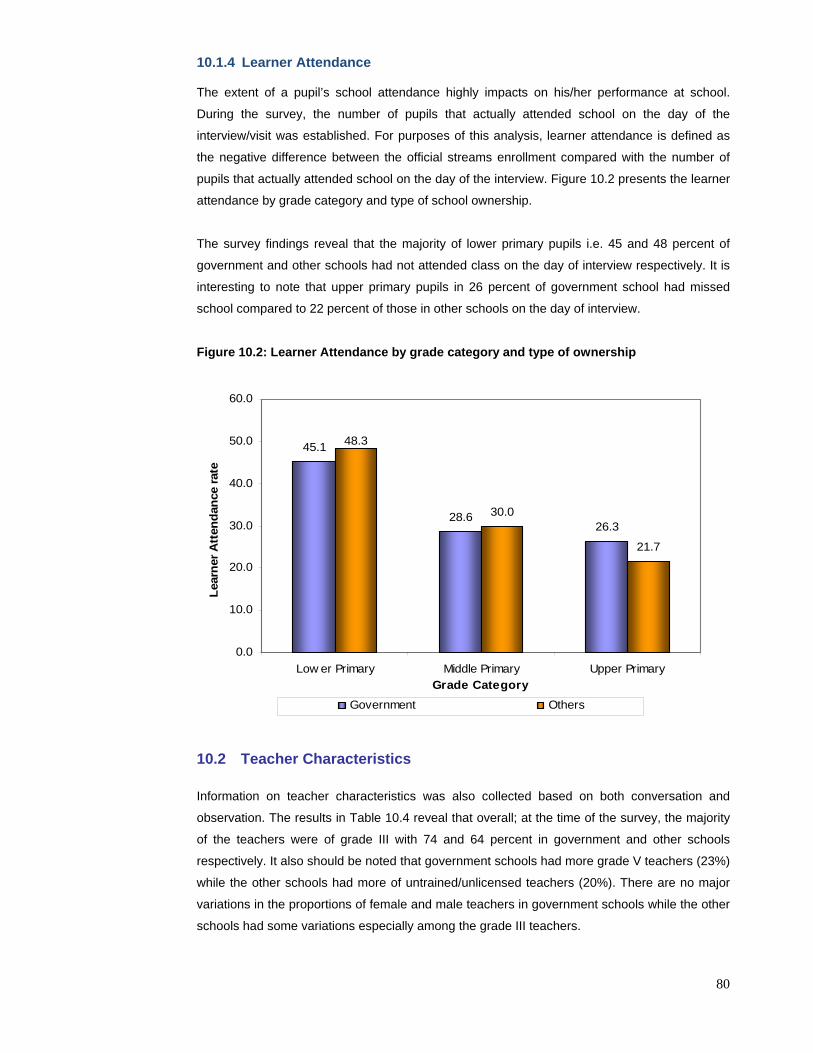
80
10.1.4 Learner Attendance
The extent of a pupil’s school attendance highly impacts on his/her performance at school.
During the survey, the number of pupils that actually attended school on the day of the
interview/visit was established. For purposes of this analysis, learner attendance is defined as
the negative difference between the official streams enrollment compared with the number of
pupils that actually attended school on the day of the interview. Figure 10.2 presents the learner
attendance by grade category and type of school ownership.
The survey findings reveal that the majority of lower primary pupils i.e. 45 and 48 percent of
government and other schools had not attended class on the day of interview respectively. It is
interesting to note that upper primary pupils in 26 percent of government school had missed
school compared to 22 percent of those in other schools on the day of interview.
Figure 10.2: Learner Attendance by grade category and type of ownership
45.1
28.626.3
30.0
21.7
48.3
0.0
10.0
20.0
30.0
40.0
50.0
60.0
Low er Primary Middle Primary Upper PrimaryGrade Category
Lear
ner A
tten
danc
e ra
te
Government Others
10.2 Teacher Characteristics
Information on teacher characteristics was also collected based on both conversation and
observation. The results in Table 10.4 reveal that overall; at the time of the survey, the majority
of the teachers were of grade III with 74 and 64 percent in government and other schools
respectively. It also should be noted that government schools had more grade V teachers (23%)
while the other schools had more of untrained/unlicensed teachers (20%). There are no major
variations in the proportions of female and male teachers in government schools while the other
schools had some variations especially among the grade III teachers.

81
Table 10.4: Teacher Qualification by sex and type of ownership (%)
Government Others
Sex Sex
Teacher Qualification Male Female Total Male Female Total
Grade V 25.0 20.3 23.2 15.7 17.3 16.4
Grade III 72.4 75.8 73.7 58.6 70.2 63.8
Untrained/ unlicensed 2.6 3.9 3.1 25.6 12.5 19.7
Total 100.0 100.0 100.0 100.0 100.0 100.0
10.2.1 Teacher Qualifications
As interviewers made observations in the randomly selected class streams, they obtained
information on the qualifications of each of the teachers that were found in the class at the time
of the visit. The results in Table 10.5 reveal that regardless of the type of ownership, majority of
untrained/unlicensed teachers were found teaching lower and middle primary classes.
Interesting to note also is that a relatively large proportion of grade V teachers were found
teaching lower primary classes with 35 and 28 percent in government and other schools
respectively.
Table 10.5: Teacher qualification by grade category, sex, and type of ownership
Government Grade V
Grade III
Untrained/ unlicensed
Male Female Total Male Female Total Male Female Total
Lower Primary 28.2 49.6 35.4 34.4 62.1 45.4 49.8 62.4 55.9
Middle Primary 28.3 29.2 28.6 32.4 23.5 28.9 26.8 33.4 30.0
Upper Primary 43.5 21.2 36.0 33.3 14.3 25.7 23.4 4.3 14.1
Total 100.0 100.0 100.0 100.0 100.0 100.0 100.0 100.0 100.0
Other Schools Grade V Grade III Untrained/ unlicensed
Male Female Total Male Female Total Male Female Total
Lower Primary 17.4 38.8 27.5 28.5 68.1 48.1 49.1 41.0 46.8
Middle Primary 34.9 42.7 38.6 33.3 18.8 26.1 32.7 36.1 33.7
Upper Primary 47.8 18.6 33.9 38.3 13.2 25.8 18.2 22.9 19.5
Total 100.0 100.0 100.0 100.0 100.0 100.0 100.0 100.0 100.0

82
10.2.2 Teacher Absenteeism
Based on the interviewer’s observation, information on whether or not the teacher was found
teaching on the day of the visit was collected. The findings presented in Table 10.6 show that,
overall; teacher absenteeism was higher in government schools (20%) compared to only 9
percent in other schools. There were no major differentials in teacher absenteeism for both
lower and upper primary teachers in government schools while teacher absenteeism was higher
amongst upper primary teachers (13%) for other schools. With regard to sex, teacher
absenteeism was more common among males compared to their female counterparts
irrespective of the type of school ownership.
Table 10.6: Teacher Absenteeism by grade category and sex of Teacher (%)
Government Others
Grade category
Lower Primary 21.3 7.4
Middle Primary 19.5 7.2
Upper Primary 21.1 12.9
Sex
Male 19.8 10.8
Female 15.5 6.7
Uganda 20.2 8.8
10.2.3 Reasons for Teacher Absenteeism
During the survey, the reasons for teacher absenteeism were also collected. Table 10.7
presents the survey findings on the reasons for teacher absenteeism by the grade/class taught
and sex. The survey results reveal that irrespective of the type of ownership, the majority of
teachers (22%) that were not found teaching were on the school premises at the time of the
interview. Twenty one percent (21%) of government school teachers were absent without
reason compared to only 4 percent of those in other schools. It is interesting to note that 16
percent of female teachers in government schools did not teach because they were sick while
27 percent of upper primary teachers were not found teaching though they were on the school
premises.

83
Table 10.7: Reasons for Absenteeism by grade categories, sex and ownership
Government Schools Grade Categories
Sex
Reasons for absenteeism Lower
Primary Middle
primary Upper
primary Male Female Uganda
Training 1.1 3.4 4.7 3.4 1.1 2.6
Sick 14.5 9.6 6.1 8.4 15.6 10.9
Annual leave 1.5 1.4 1.4 1.4 1.8 1.5
Collecting Salary 1.5 0.0 4.5 2.5 1.0 2.0
On school errand 4.2 9.0 14.5 10.8 4.8 8.7
Absent without reason 21.5 22.7 15.4 19.0 24.1 20.7
Teacher at school premises 19.5 18.7 26.7 24.4 17.5 22.0
Maternity leave 2.6 0.5 1.8 0.2 4.9 1.9
Other 33.6 34.7 24.9 30.0 29.3 29.8
Total 100.0 100.0 100.0 100.0 100.0 100.0
Other Schools
Reasons for absenteeism Lower
Primary Middle
primary Upper
primary Male Female Uganda
Sick 57.9 44.7 0.0 32.5 34.0 33.1
On school errand 0.0 14.0 0.0 5.5 0.0 3.4
Absent without reason 5.2 0.0 5.4 0.0 10.5 4.0
Teacher at school premises 37.0 41.3 9.1 26.2 30.1 27.6
Other 0.0 0.0 85.5 35.8 25.4 31.9
Total 100.0 100.0 100.0 100.0 100.0 100.0
10.3 Health care system of Uganda
Uganda's healthcare system works on a referral basis; if a level II facility cannot handle a case;
it refers it to a unit the next level up. According to the Ugandan government's health policy,
every parish is supposed to have a Health Center II (HC II). This facility is supposed to over
seen by an enrolled nurse, working with a midwife, two nursing assistants and a health assistant
and should be in position to treat common diseases like malaria. It could also run an out-patient
clinic, treating common diseases and offering antenatal care.
A health centre III facility should be found in every sub-county and should have about 18 staff,
led by a senior clinical officer. It could also run a general outpatient clinic, a maternity ward and
should also have a functioning laboratory. A health Center of level IV serves a county or a
parliamentary constituency. It should have the kind of services found at health centre III, but it
should have wards for men, women, and children and should be able to admit patients. It should
have a senior medical officer and another doctor as well as a theatre for carrying out emergency
operations. Each district is ideally supposed to have a hospital, which should have all the

84
services offered at a health centre IV, plus specialized clinics – such as those for mental health
and dentistry as well as consultant physicians.
During the 2009/10 UNPS, interviewers were required to move around health centers at level II
and III only. Before they were shown around, they obtained a complete list of medical personnel
that work at the facility. As they moved around the facility, they recorded additional information
on the medical personnel present as well as those absent at the time of the visit.
10.4 General Health facility Characteristics
The percentage distribution of health facilities by type of ownership is presented in Figure 10.3.
As expected, government health facilities (89%) account for the majority of health centers most
commonly used in Uganda compared to all the others.
Figure 10.3: Distribution of most commonly used Health Facilities in Uganda
Government89%
NGO/ Religious Association
6%Private4%
Others1%
10.3.1 Level of Health facility
The distribution of health facilities by level and ownership show that, overall, 54 percent of the
health facilities are Health Center (HC) III; 56 and 41 percent of which are managed by
government and other owners respectively.
Table 10.8: Level of health facility by ownership
Government Others Total Facility
Health center II 29.7 39.8 30.7
Health center III 55.7 40.6 54.1
Health center IV 12.6 0.0 11.3
Others 2.1 19.6 3.9
Total 100.0 100.0 100.0

85
10.3.2 Availability of Equipment and Services
Existence of a health facility eases accessibility to the surrounding populations though
availability of relevant services is an important determinant of whether or not the available
facility is actually utilized. Table 10.9 presents the analysis of the availability of equipment and
services at the different health facilities that were visited during the survey.
The survey findings reveal that overall, only 26 percent of government health facilities had
electricity compared to 56 percent of other Health facilities irrespective of the source of
electricity. In terms of functioning items in government health facilities, it is worth noting that only
18 percent had an ambulance, 37 percent had a bicycle while 57 percent had a sterilization
machine. Communication services and items were more common amongst other health facilities
compared to those owned by government.
Table 10.9: Availability of equipment and services at the health facility
Government facilities Other facilities
HC
II HC III
HC IV Others Total
HC II
HC III Others Total
Electricity
Hydro 1.6 26.2 34.5 88.0 21.2 23.5 29.5 100.0 40.9
Thermo 3.3 3.9 11.8 0.0 4.6 34.3 2.9 0.0 14.9
Functioning
Generator 1.2 1.8 75.1 100.0 12.9 10.9 13.2 45.7 18.7
Solar Panel 14.3 44.9 58.1 48.5 37.6 45.5 67.6 7.1 46.9
Ambulance 2.9 11.0 73.9 72.9 17.8 8.8 42.6 12.4 23.2
Provision of food at Health Facility 5.3 3.3 5.4 26.8 4.6 19.5 33.1 100.0 40.8
Provision of food for in-patients 0.0 0.0 0.0 63.5 1.3 0.0 0.0 8.0 1.6
Computer 0.0 7.7 43.3 100.0 11.8 11.0 23.1 57.0 24.9
Official telephone
Land line 0.0 2.6 25.8 34.1 5.4 13.1 10.0 55.5 20.2
Mobile 28.3 30.9 23.7 9.4 28.7 20.3 22.0 24.5 21.8
Radio call 4.0 17.0 14.2 12.0 12.7 7.0 29.7 0.0 14.9
Laboratory 2.0 69.6 100.0 100.0 54.0 58.9 96.6 100.0 82.2
CD-4 machine 0.0 1.0 0.4 64.4 2.1 0.0 3.2 8.4 3.0
Refrigerator for vaccines 42.6 89.3 96.2 100.0 76.6 48.4 75.8 57.8 61.4
Ice box 78.8 91.1 95.3 100.0 88.2 67.7 96.6 67.5 79.4
Working microscope 7.7 70.3 86.6 100.0 54.4 73.0 88.5 100.0 84.6
Delivery bed 21.8 82.1 98.1 100.0 66.6 69.4 100.0 57.0 79.8
BP machine 61.1 81.6 95.2 100.0 77.6 90.8 100.0 100.0 96.3
Sterilization equipment 30.9 63.0 87.4 100.0 57.3 59.3 67.7 87.7 68.0
Bicycle 47.3 36.3 15.2 47.0 37.2 37.4 70.3 8.7 45.7
Motorcycle 7.3 45.1 68.9 19.9 36.3 18.5 5.7 8.7 11.4
Standing weighing scales 47.5 67.7 93.8 82.6 65.3 90.2 100.0 81.5 92.6
Hanging weighing scale 81.5 92.8 92.1 82.6 89.2 81.4 90.0 49.7 79.1
Height measurement equipment 10.5 32.1 62.0 100.0 31.1 26.7 67.5 61.8 49.7

86
10.5 Health worker Absenteeism
The main respondents from health facilities were asked to indicate whether the facility has faced
any absenteeism of its staff in the last 12 months. Results in Table 10.10 reveal that overall, 31
and 26 percent of respondents indicated that the facility had faced absenteeism in government
and other health facilities respectively. A higher absenteeism rate (50%) was reported by HC IV
respondents in government health centers.
Table 10.10: Absenteeism faced in last 12 months as Reported by Respondent (%)
Absenteeism faced in last 12 months
Facility Government Others
Health center II 25.4 19.6
Health center III 30.1 35.8
Health center IV 49.6 -
Others 36.5 17.0
Total 31.3 25.7
10.5.1 Government Health Worker Absenteeism
During the 2009/10 Panel survey, random unannounced visits were made to Health centers of
level II and III. Interviewers sought permission to be shown around in order to establish the
number of staff that were present at the time of the visit. Health providers were counted as
absent if they could not be found in the facility for any reason at the time of the visit. The survey
findings in Table 10.11 show that 48 and 46 percent of government health providers in Health
centers II and III were absent at the time of interview respectively.
Differentials by sex of health workers reveal that 49 percent of females in government HC II and
51 percent males of other HC III were absent on the day of interview. In terms of one’s function,
the majority of health assistants in government HC II (85 percent) as well as 59 percent in other
HC III were not found at work in the health facility.
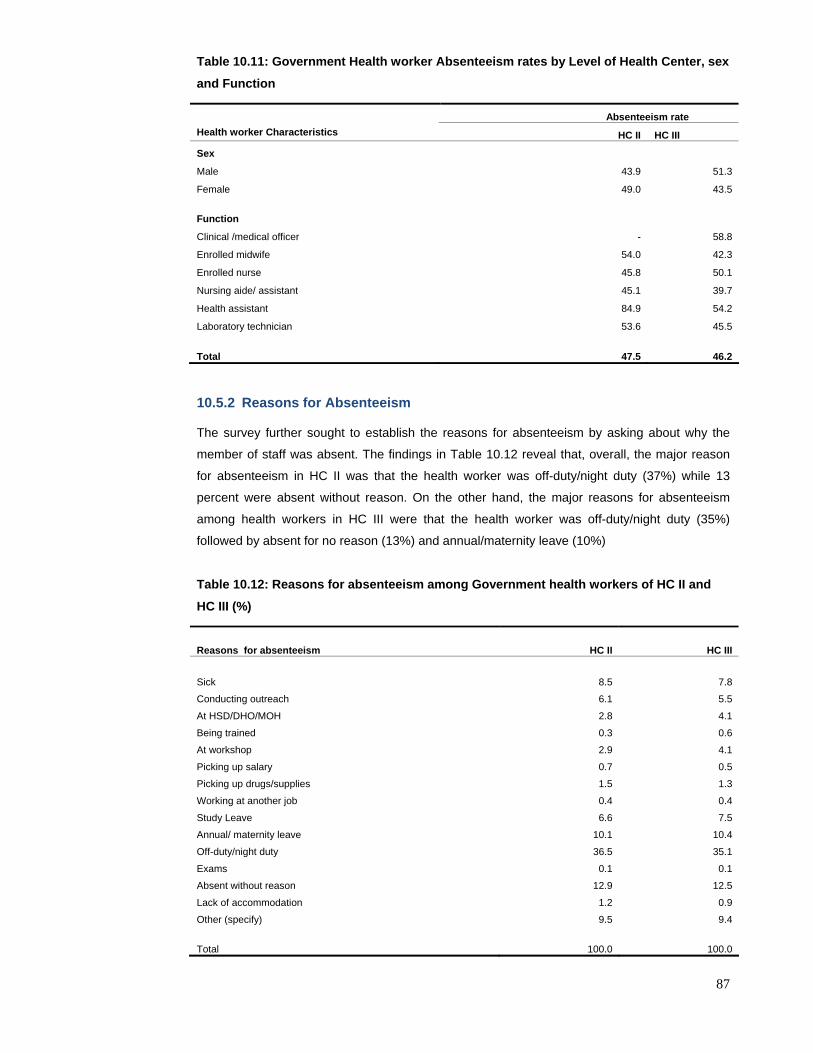
87
Table 10.11: Government Health worker Absenteeism rates by Level of Health Center, sex
and Function
Absenteeism rate Health worker Characteristics HC II HC III
Sex
Male 43.9 51.3
Female 49.0 43.5
Function
Clinical /medical officer - 58.8
Enrolled midwife 54.0 42.3
Enrolled nurse 45.8 50.1
Nursing aide/ assistant 45.1 39.7
Health assistant 84.9 54.2
Laboratory technician 53.6 45.5
Total 47.5 46.2
10.5.2 Reasons for Absenteeism
The survey further sought to establish the reasons for absenteeism by asking about why the
member of staff was absent. The findings in Table 10.12 reveal that, overall, the major reason
for absenteeism in HC II was that the health worker was off-duty/night duty (37%) while 13
percent were absent without reason. On the other hand, the major reasons for absenteeism
among health workers in HC III were that the health worker was off-duty/night duty (35%)
followed by absent for no reason (13%) and annual/maternity leave (10%)
Table 10.12: Reasons for absenteeism among Government health workers of HC II and
HC III (%)
Reasons for absenteeism HC II HC III Sick 8.5 7.8
Conducting outreach 6.1 5.5
At HSD/DHO/MOH 2.8 4.1
Being trained 0.3 0.6
At workshop 2.9 4.1
Picking up salary 0.7 0.5
Picking up drugs/supplies 1.5 1.3
Working at another job 0.4 0.4
Study Leave 6.6 7.5
Annual/ maternity leave 10.1 10.4
Off-duty/night duty 36.5 35.1
Exams 0.1 0.1
Absent without reason 12.9 12.5
Lack of accommodation 1.2 0.9
Other (specify) 9.5 9.4
Total 100.0 100.0

88
10.6 Summary of Findings
As expected, government owned schools account for the majority of schools (94%) most
commonly used in Uganda compared to all others. Overall, pupils in 26 and 36 percent of
government and other schools do not have any access to text books in the classroom. The
majority of lower primary pupils i.e. 45 and 48 percent of government and other schools had not
attended class on the day of interview respectively.
The majority of the primary teachers were of grade III with 74 and 64 percent in government and
other schools respectively. It should be noted that government schools have more grade V
teachers (23%) while the other schools have more untrained/unlicensed teachers (20%).
Overall; teacher absenteeism was higher in government schools (20%) compared to 9 percent
in other schools. Regardless of the type of ownership, majority of teachers (over 20 percent)
were on the school premises but not in class at the time of the interview.
Government health facilities (89%) account for the majority of health centers most commonly
used in Uganda compared to all the others. Forty eight and 46 percent of government health
providers in Health centers II and III were absent at the time of interview respectively. The major
reason for absenteeism in HC II was that the health worker was off-duty/night duty (37%) while
13 percent were absent without reason. The major reasons for absenteeism among health
workers in HC III were that the health worker was off-duty/night duty (35%) followed by absent
for no reason (13%) and annual/maternity leave (10%).

89
CHAPTER ELEVEN FAMILY PLANNING 11.0 Introduction
Contraceptive use among women not only varies across countries and regions, but varies within
a given country as well. Knowledge and use of contraceptives depends on factors like one’s
education background and income. This chapter therefore presents results from the 2009
Uganda National Panel Survey (UNPS) regarding the respondent’s knowledge about
contraceptive methods, current use and whether they have ever used any of the contraceptive
methods in their life time.
11.1 Knowledge of Contraceptive Methods
Knowledge of contraceptives and contraceptive use are important indicators of health among
women. Women with adequate information about the various available methods of
contraception are in a better position to plan their families and child spacing. Knowledge of
family planning methods and the financial cost of contraception are alternative indicators of
effective “access” to family planning methods in the population.
Information on contraceptives in the survey was collected by asking females within the
reproductive age bracket of 15-49 years to name the different ways or methods that one would
use to avoid/delay getting pregnant. The interviewers would then describe the methods
mentioned to the respondent incase she failed to mention any spontaneously.
Table 11.1 shows the extent of knowledge of contraceptive methods among all women.
Contraceptive knowledge is higher among married women than all women. This applies to each
contraceptive method too. The results show that knowledge of any contraceptive method among
females aged 15-49 is almost universal.
Modern methods are more widely known than the traditional ones. Of all women aged 15-49,
98 percent know at least one modern method compared to 83 percent who know at least one
traditional method of contraceptive. Among all women, the most known methods are; male
condom (96%), Pill (95%) and Injectables (95%), while emergency contraceptive (19%) is the
least known method. A similar pattern is observed among married women. The mean number of
contraceptive methods known by married women is 8.1 percent and 8.5 percent among all
women and those currently married, respectively.

90
Table 11.1: Knowledge of contraceptive methods (%)
All Women Married Women
Any Method 99.3 99.3
Any modern method 98 98.5
Female sterilization 75.6 81.8
Male sterilization 48.7 52.3
Pill 94.7 96.3
IUD 56.7 60.4
Injectables 94.8 96
Implants 66.3 71.5
Male Condom 96 95.9
Female condom 53.4 53.8
LAM 36.9 40.1
Emergency contraceptives 18.7 18.2
Any traditional Method 82.9 88.8
Rhythm 61.2 64.5
Withdrawal 58.3 65.2
Moon beads 29 30
Foam/Jelly 17.9 17.8
Others 12.2 12
Mean number of methods known 8.1 8.5
Knowledge of any type of contraceptives by region (Table 11.2) is almost uniform. The results
show higher percentages of knowledge for modern methods than traditional methods across all
regions. The Western region ranks lowest with 78 percent of the women having heard of any
traditional contraceptive method compared to other regions.
Table 11.2: Knowledge of contraceptive methods by region (%)
Region Any method Any modern method Any traditional method
Central 98.2 98.2 81.1
Eastern 99.5 99.5 87.8
Northern 97.7 93.9 87.1
Western 99.4 99.4 78.2
Total 98.7 98.0 82.9

91
11.2 Ever use of Contraceptives
Ever use of contraception provides a measure of the cumulative experience of a population with
family planning. The 2009/10 UNPS collected data on ever use of family planning methods from
women by asking respondents whether they had ever used each of the methods that they have
heard about. All women who said that they had heard of any method of contraceptive/family
planning were asked whether they had ever used that method.
Table 11.3 presents ever use of contraception among all women and currently married women.
Overall, the results indicate that 61 percent of all women and 70 percent of currently married
women have used a method at some point. Women are much more likely to have used a
modern method than a traditional method. For example, 47 percent of currently married women
have used a modern method at some time compared with 12 percent who have used a
traditional method. Injectables have been the most commonly used modern method (50%)
among currently married women, while rhythm has been the most widely employed traditional
method among respondents for the 2009/10 UNPS.
Table 11.3 Ever use of contraception (%)
Type All women Married women
Any modern 46.7 51.2
Female sterilization 2.3 2.9
Male sterilization 0.1 0.1
Pill 27.0 28.4
IUD 1.1 1.4
Injectables 45.1 49.9
Implants 3.4 3.9
Condom 40.2 34.7
Female condom 1.7 1.7
LAM 12.0 14.1
Moon beads 3.1 3.2
Any Traditional 11.5 14.2
Rhythm 32.9 35.3
Withdrawal 22.3 23.4
Foam/Jelly 1.6 1.4
Emergency Contraception 2.3 2.5
Others 9.3 6.2
Any Method 61.2 70.1
Ever use of contraceptives by rural -urban residence (Figure 11.1) shows the wider variations
among rural and urban dwellers. Over sixty percent of the women in the urban areas had ever
used a modern method compared to 42 percent of their rural counterparts. A reverse pattern is
observed for women who had ever used any traditional method. Slightly over 13 percent of the

92
women in rural areas had ever used a traditional method compared to 6 percent of the urban
women.
Figure 11.1: Ever Use of contraceptive Methods by Residence
58.1
42
13.2
2.9
70.3
60.4
6.33.6
0
10
20
30
40
50
60
70
80
Any Method Modern Traditional Other
Rural Urban
Variations by region of residence (Table 11.4) show that the Western region (48%) had the
lowest rates for females who had ever used any contraceptive method, compared to the Central
region that had the highest rates (68%). The Northern region had the highest rates of women
who had ever used traditional methods (29%) while the Western region had the lowest (4%).
The data further reveals similar findings for women who were currently married at the time of the
survey.
Table 11.4: Ever use of Contraceptives by Region
All Women Any Method Modern Traditional Other None Total
Central 68.3 55.9 7.8 4.6 31.7 100
Eastern 63.4 49.2 10.3 3.9 36.6 100
Northern 64.1 31.6 29.1 3.4 35.9 100
Western 47.9 43.6 4.2 0.0 52.2 100
Total 61.2 46.7 11.5 3.1 38.8 100
Married women
Central 79.2 67.89 9.81 1.46 20.83 100
Eastern 70.1 54.66 13.12 2.28 29.95 100
Northern 75.3 38.02 33.18 4.14 24.66 100
Western 57.6 51.1 6.52 0 42.38 100
Total 70.1 54.15 14.17 1.76 29.92 100
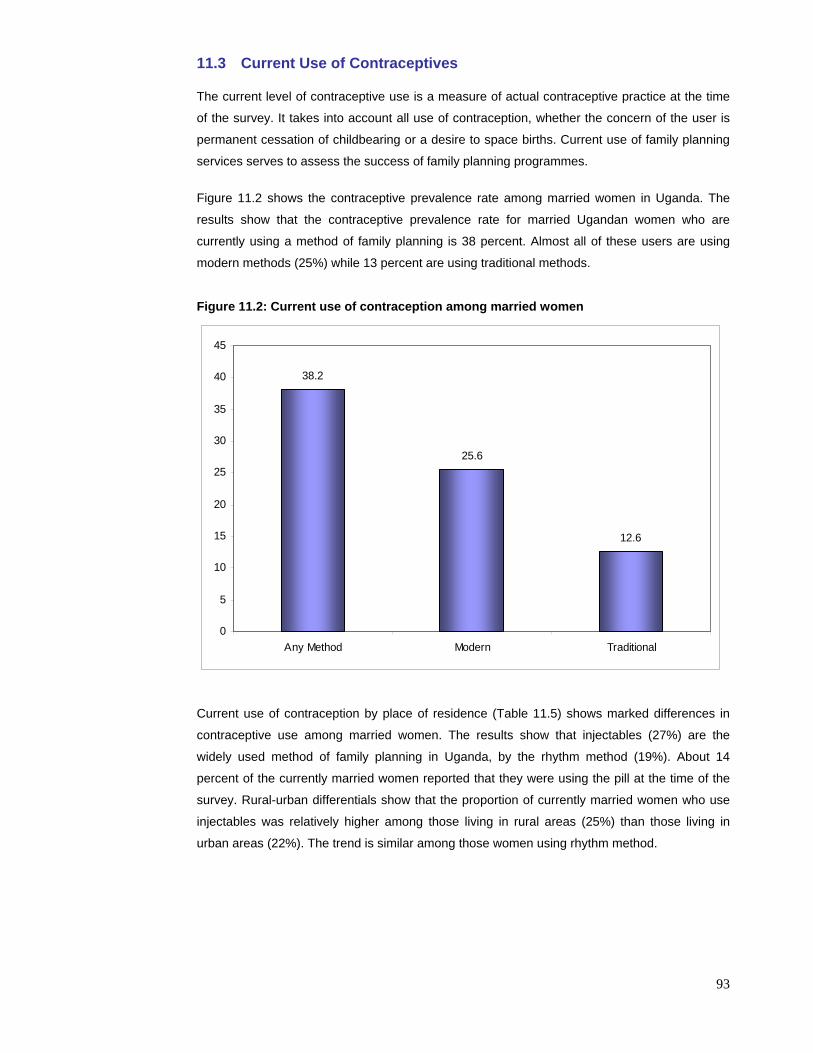
93
11.3 Current Use of Contraceptives
The current level of contraceptive use is a measure of actual contraceptive practice at the time
of the survey. It takes into account all use of contraception, whether the concern of the user is
permanent cessation of childbearing or a desire to space births. Current use of family planning
services serves to assess the success of family planning programmes.
Figure 11.2 shows the contraceptive prevalence rate among married women in Uganda. The
results show that the contraceptive prevalence rate for married Ugandan women who are
currently using a method of family planning is 38 percent. Almost all of these users are using
modern methods (25%) while 13 percent are using traditional methods.
Figure 11.2: Current use of contraception among married women
38.2
25.6
12.6
0
5
10
15
20
25
30
35
40
45
Any Method Modern Traditional
Current use of contraception by place of residence (Table 11.5) shows marked differences in
contraceptive use among married women. The results show that injectables (27%) are the
widely used method of family planning in Uganda, by the rhythm method (19%). About 14
percent of the currently married women reported that they were using the pill at the time of the
survey. Rural-urban differentials show that the proportion of currently married women who use
injectables was relatively higher among those living in rural areas (25%) than those living in
urban areas (22%). The trend is similar among those women using rhythm method.

94
Table 11.5: Percentage distribution of all women currently using contraceptives by residence
All women Married women
Type Rural Urban Total Rural Urban Total
Pill 5.7 13.4 8.2 12.2 16.8 13.6
Injectables 29.7 20.8 26.9 24.9 21.6 23.9
Condom 9.8 18.9 12.7 15.0 20.2 16.6
Rhythm 19.2 18.4 19.0 18.1 14.2 16.9
Withdrawal 12.4 11.8 12.2 11.4 10.7 11.2
Moon beads 1.8 1.1 1.6 1.7 1.1 1.5
Foam/Jelly 1.3 0.2 0.9 0.8 0.5 0.7
Contraception 0.3 2.0 0.9 0.7 2.2 1.2
Female sterilisation 3.4 2.8 3.2 1.5 1.2 1.4
Male sterilisation 0.0 0.0 0.0 0.0 0.1 0.0
IUD 0.5 1.2 0.7 0.5 1.0 0.7
Implants 4.0 1.8 3.3 2.2 1.1 1.9
Female condom 0.4 0.0 0.3 0.6 1.3 0.8
LAM 6.2 2.4 5.0 7.3 5.6 6.8
Others 5.4 5.3 5.4 3.2 2.5 3.0
100 100 100 100.0 100.0 100.0
Table 11.6 shows contraceptive use by region of residence. The results show that married
women in the Central region had the highest contraceptive prevalence rates (45%) while the
Western region had the lowest rates (32%). Use of modern methods was lowest in the Northern
region (17%) and highest in the Central region (31%). Traditional methods were more likely to
be used by currently married women in the Northern region.
Table 11.6 Current Use of contraception by Region (%)
All Women Any Method Modern Traditional Other No Total
Central 34.7 25.5 9.3 4.6 60.7 100
Eastern 32.6 22.9 9.7 3.5 63.9 100
Northern 30.0 13.5 16.5 3.8 66.3 100
Western 26.3 22.6 3.7 0.0 73.7 100
Total 31.2 21.9 9.3 3.0 65.8 100
Married Women
Central 44.8 31.12 13.72 2.04 53.11 100
Eastern 37.8 25.44 12.32 2.53 59.71 100
Northern 38.0 16.54 21.44 4.78 57.24 100
Western 32.2 26.49 5.74 0 67.77 100
Total 38.2 25.6 12.6 2.1 59.7 100
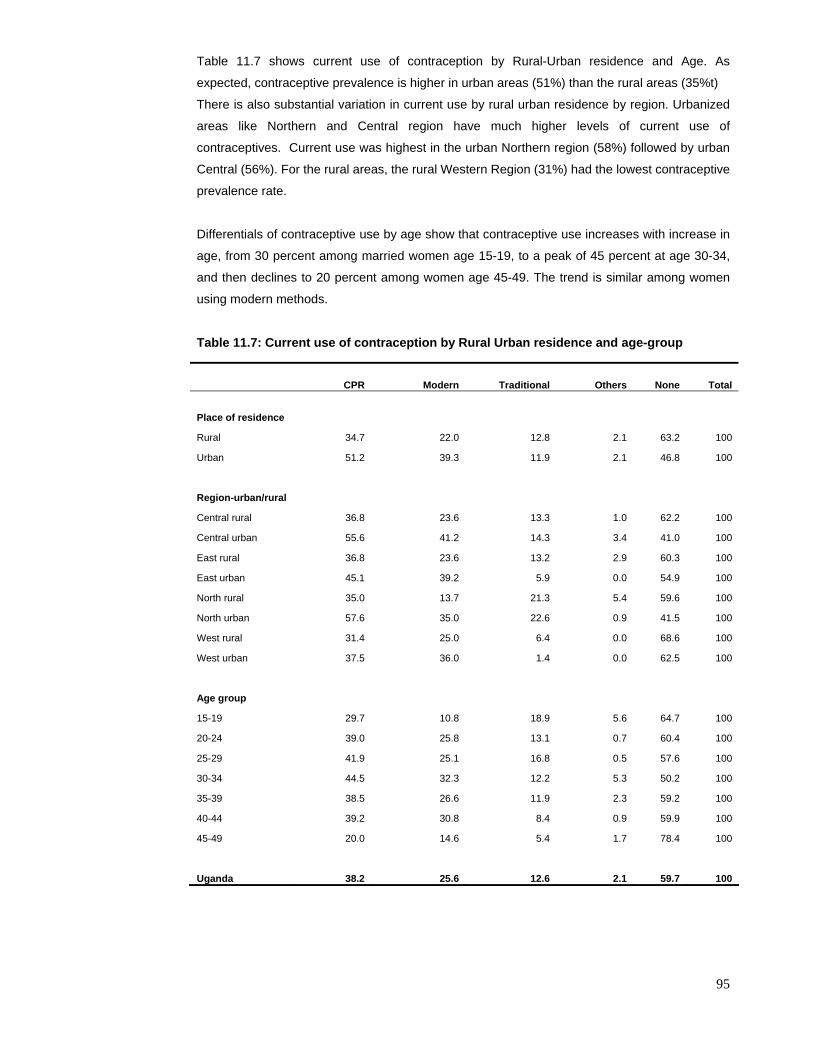
95
Table 11.7 shows current use of contraception by Rural-Urban residence and Age. As
expected, contraceptive prevalence is higher in urban areas (51%) than the rural areas (35%t)
There is also substantial variation in current use by rural urban residence by region. Urbanized
areas like Northern and Central region have much higher levels of current use of
contraceptives. Current use was highest in the urban Northern region (58%) followed by urban
Central (56%). For the rural areas, the rural Western Region (31%) had the lowest contraceptive
prevalence rate.
Differentials of contraceptive use by age show that contraceptive use increases with increase in
age, from 30 percent among married women age 15-19, to a peak of 45 percent at age 30-34,
and then declines to 20 percent among women age 45-49. The trend is similar among women
using modern methods.
Table 11.7: Current use of contraception by Rural Urban residence and age-group
CPR Modern Traditional Others None Total
Place of residence
Rural 34.7 22.0 12.8 2.1 63.2 100
Urban 51.2 39.3 11.9 2.1 46.8 100
Region-urban/rural
Central rural 36.8 23.6 13.3 1.0 62.2 100
Central urban 55.6 41.2 14.3 3.4 41.0 100
East rural 36.8 23.6 13.2 2.9 60.3 100
East urban 45.1 39.2 5.9 0.0 54.9 100
North rural 35.0 13.7 21.3 5.4 59.6 100
North urban 57.6 35.0 22.6 0.9 41.5 100
West rural 31.4 25.0 6.4 0.0 68.6 100
West urban 37.5 36.0 1.4 0.0 62.5 100
Age group
15-19 29.7 10.8 18.9 5.6 64.7 100
20-24 39.0 25.8 13.1 0.7 60.4 100
25-29 41.9 25.1 16.8 0.5 57.6 100
30-34 44.5 32.3 12.2 5.3 50.2 100
35-39 38.5 26.6 11.9 2.3 59.2 100
40-44 39.2 30.8 8.4 0.9 59.9 100
45-49 20.0 14.6 5.4 1.7 78.4 100
Uganda 38.2 25.6 12.6 2.1 59.7 100
96
11.4 Summary of Findings Overall, knowledge of contraception is almost universal in Uganda with 99 percent of currently
married women having heard of at least one method of contraception. The pill, injectables, and
condom are the most widely known modern methods among women. Seven in every ten
currently married women have used a family planning method at least once in their lifetime.
Thirty eight percent of currently married women are using a method of contraception. Modern
methods are more widely used than traditional methods, with 26 percent of currently married
women using a modern method and 13 percent using a traditional method. The most popular
modern method is the injectable used by twenty four percent of the currently married women.
Differentials of contraceptive use by age show that contraceptive use increases with increase in
age, from 30 percent among married women age 15-19, to a peak of 46 percent at age 40-44,
and then declines to 20 percent among women age 45-49. The trend is similar among women
using modern methods.

97
LIST OF REFERENCES
1. Appleton, S. (2001a) “Changes in poverty in Uganda, 1992-1997", chapter in P. Collier
and R. Reinnikka (eds.) “Firms, households and government in Uganda’s recovery”,
World Bank: Washington DC
2. Appleton, S. and S. Ssewanyana (2003) “Poverty estimates from the Uganda National
Household Survey II, 2002/03, mimeo, Economic Policy Research Centre.
3. Ministry of Health (2010), Health Sector Strategic Plan 2010/11-2014/15
4. National Planning Authority (April 2010), National Development Plan (2010/11-2014/15)
5. S. Ssewanyana (2006) “Understanding Food Insecurity in Uganda: A special study,”
EPRC & MEMS, USAID.
6. Ssewanyana, S. (2010), Combating chronic poverty in Uganda: Towards a new
strategy, EPRC Research Series #67.
7. Ssewanyana, S.N. and J.A. Okidi (2007), Poverty estimates from the Uganda National
Household Survey III, 2005/06, Economic Policy Research Centre, Occassional Paper
#34.
8. Wikipedia, 2006, Free Encyclopedia, www.wikipedia.org
9. World Bank, (2007) World Development Report on Agriculture for Development
10. World Health Organisation/United Nations International Children’s Emergency Fund
(2004), Joint Monitoring Programme for Water Supply and Sanitation,
11. http://www.internal-displacement.org

98
QUESTIONNAIRE Section 2: Household Roster We would like to make a complete list of household members.
SECOND VISIT
During the past 12 months, how many months did [NAME] live here?
WRITE 12
IF ALWAYS PRESENT
OR IF AWAY LESS
THAN A MONTH
WRITE 00
IF PRESENT FOR LESS
THAN A MONTH
What is the date of birth of [NAME]?
IF DAY OR MONTH
IS UNKNOWN, MARK ‘99’.
P E R S O N I D
We would like to make a complete list of household members in the last 12 months including guests who slept here last night and those that left the household permanently. ASK IF ALL MEMBERS ARE LISTED
Sex 1= M 2= F
What is the relationship of [NAME] to the head of the household? 1= Head 2= Spouse 3= Son/daughter 4= Grand child 5= Parent of head or spouse 6= Sister/Brother of head or spouse 7= Nephew/Niece 8= Other relatives 9= Servant 10= Non-relative 96= Other (specify)
IF ’12 months’, >>7
If [NAME] has not stayed for 12 months, what is the main reason for absence? SEE CODE BOOK.
What is the residential status of [NAME]? 1=Usual member present 2= Usual member absent 3=Regular member present 4=Regular member absent 5=Guest (>> NEXT PERSON) 6=Usual member who left hh more than 6 months ago (>> NEXT PERSON) 7=Left permanently (>> NEXT PERSON) INTERVIEWER: FOR RESPONSES 1-4, WRITE NAME ON FLAP AT SAME ID NUMBER
How old is [NAME] in completed years? IF LESS THAN ONE YEAR, WRITE 0
DD MM YYYY
For persons 10 years and above What is the present marital status of [NAME]? 1= Married monogamously 2= Married polygamous 3=Divorced /Separated 4= Widow/ Widower 5= Never Married
Is [NAME] still a member of your household? 1= Yes (>> NEXT PERSON) 2= No
Why did [NAME] leave the household?
USE THE SAME CODE AS 6
Where did [NAME] go? USE DISTRICT CODE
1 2 3 4 5 6 7 8 9A 9B 9C 10 11 12 13 01 02 03 04 05 06

99
Section 3: General Information on Household Members Ask only household members (USUAL AND REGULAR MEMBERS).
ORPHANHOOD For household members below 18 years
COMMITTEE MEMBERSHIP For members 18 years & above
ETHNICITY For all household members
MALARIA For all household members
IF COL 2A IS YES=1
IF COL 5A IS YES=1
P E R S O N I D
Is the natural father of [NAME] living in this household? 1= Yes 2= No (>>3) 3= Dead (>>5)
ID CODE OF FATHER >> 5A
What is the highest level of father’s education completed? 1=No formal education 2=Less than Primary 3=Completed Primary 4=Completed O-Level 5=Completed A-Level 6=Completed University 8=Don’t Know 9=Other (Specify)
What is his usual occupation? SEE CODE BOOK.
Is the natural mother of [NAME] living in this household? 1= Yes 2= No (>>6) 3= Dead (>>9)
ID CODE OF MOTHER >> 9
What is the highest level of mother’s education completed? 1=No formal education 2=Less than Primary 3=Completed Primary 4=Completed O-Level 5=Completed A-Level 6=Completed University 8=Don’t Know 9=Other (Specify)
What is her usual occupation? SEE CODE BOOK.
Is [NAME] a committee member of an LC1, LC2 or LC3? 1= Yes 2= No
What is [NAME]’s ethnic group/tribe? SEE CODE BOOK.
Did [NAME] sleep under a mosquito net last night? 1= Yes, Untreated Net (>> 13) 2= Yes, Insecticide Treated Net 3= No (>> 13) 9= Don’t Know (>> 13)
Under which kind or brand did [NAME] sleep? 1= Olyset 2= Permanet 3= Duranet 4= Net protect 5= Interceptor 6= Other 9= Don’t Know/net not labelled
Was this net ever soaked or dipped in a liquid to repel mosquitoes or bugs during the past 12 months? 1= Yes 2= No 3= Not sure
1 2A 2B 3 4 5A 5B 6 7 8 9 10 11 12
01
02
03
04
05
06

100
Section 3 Cont’d: General Information on Household Members MIGRATION For all household members
What was the name/location of the camp?
P E R S O N I D
In which district/ country was [NAME] born? SEE CODE BOOK.
In which district/ country did [NAME] live 5 years ago? SEE CODE BOOK.
How many years has [NAME] lived in this place/village? RECORD 100 IF SINCE BIRTH (>> NEXT PERSON) IF <1 YEAR, RECORD 00
In which district/ country did [NAME] live before moving to current place of residence? SEE CODE BOOK.
Was the place where [NAME] lived before coming here a rural or urban area? 1= Gazetted urban 2= Other Urban 3=Rural
What was the main reason for moving to the current place of residence? 1= To look for work 2= Other income reasons 3= Drought, flood or other weather related condition 4= Eviction 5= Other land related problems 6= Illness, injury 7= Disability 8=Education 9= Marriage 10= Divorce 11= To escape insecurity 12= To return home from displacement 13= Abduction 14= Follow/join family 96= Other (specify)
In how many other places (such as another village, town or abroad) did [NAME] live for 6 or more months at one time since 2005/06?
During the past 5 years did [NAME] ever live in a settlement camp? 1=Yes 2=No (>> NEXT PERSON)
NAME AND LOCATION CODE
How many years did [NAME] live in this camp?
IF LESS THAN 1 YEAR,
RECORD 00
1 13 14 15 16 17 18 19 20 21A 21B 22 01
02
03
04
05
06
07
08
09
10

101
Section 4: Education (All Persons 5 Years and above) Ask the following questions about all members of the household (usual and regular) who are 5 years and above.
INTERVIEWER:
P E R S O N I D
IS [NAME] ANSWERING FOR HIMSELF OR HERSELF? (FOR CHILDREN UNDER THE AGE OF 7, THE GUARDIAN SHOULD RESPOND FOR THEM) 1= Yes (>>4) 2= No
WHAT IS THE ID CODE OF THE PERSON RESPONDING FOR [NAME]?
Can [NAME] read and write with understanding in any language? SEE CODES AT RIGHT
Has [NAME] ever attended any formal school? 1= Never attended 2= Attended school in the past (>> 7) 3= Currently attending school (>> 9)
Why has [NAME] not attended school? SEE CODES AT RIGHT
[>> NEXT PERSON]
What was the highest grade/class that [NAME] completed? SEE CODE BOOK.
What was the main reason that [NAME] left school? SEE CODES AT RIGHT
[>> NEXT PERSON]
What grade/class was [NAME] attending in [THE LAST COMPLETED SCHOOL YEAR]? SEE CODE BOOK.
What grade/class is [NAME] currently attending? SEE CODE BOOK.
Who manages the school [NAME] attends? 1= Government 2= Private 3= NGO 4= Religious organization (Faith-based) 96= Other (specify)
What type of school is [NAME] currently attending? 1= Day 2= Boarding (>> 15) 3= Day and Boarding
1 2 3 4 5 6 7 8 9 10 11 12 01
02
03
04
05
06
07
08
09
10
CODES FOR COL 4 1= Unable to read and write 2= Able to read only 3= Able to write only 4= Able to read and write CODES FOR COL 6 1= Too expensive 2= Too far away 3= Poor school quality 4= Had to help at home 5= Had to help with farm work 6= Had to help with family business 7= Education not useful 8= Parents did not want 9= Not willing to attend 10= Too young 11= Orphaned 12= Displaced 13= Disabled 14= Insecurity 96= Other (specify) CODE FOR COL 8 1= Completed desired schooling 2= Further schooling not available 3= Too expensive 4= Too far away 5= Had to help at home 6= Had to help with farm work 7= Had to help with family business 8= Poor school quality 9= Parents did not want 10= Not willing to attend further 11= Poor academic progress 12= Sickness or calamity in family 13= Pregnancy 96= Other (specify)

102
Section 4 Cont’d: Education (All Persons 5 Years and above) Ask the following questions about all members of the household (usual and regular) who are 5 years and above who are currently attending school
Distance to the school in km?
Time to school
How much has this household spent during the past 12 months on [NAME]’s schooling? IF NOTHING WAS SPENT, WRITE 0. IF THE RESPONDENT CAN ONLY GIVE A TOTAL AMOUNT, WRITE ‘999999’ IN THE RELEVANT COLUMNS AND THE TOTAL AMOUNT IN COLUMN 15G.
P E R S O N I D
ONLY FOR DAY
SCHOLARS TIME IN
MINUTES
School and registration fees (contribution to school development fund)
Uniforms and sport clothes
Books and school supplies
Costs to and from school
Boarding fees
Other expenses
Total expenses
Is [NAME] currently receiving a scholarship or subsidy given by the government/ any organisation or school (including UPE/USE) to support [NAME]’s education? 1= Yes 2= No (>>18)
Source of Funding 1= Govt 2= NGO 3= Religious organization 4=School 6=Other(specify) 9= Don’t Know
For day scholars only Does [NAME] get meals at school? 1= Yes, provided free 2= Yes, parents pay/ contribute 3= No
1 13 14 15A 15B 15C 15D 15E 15F 15G 16 17 18 01
02
03
04
05
06
07
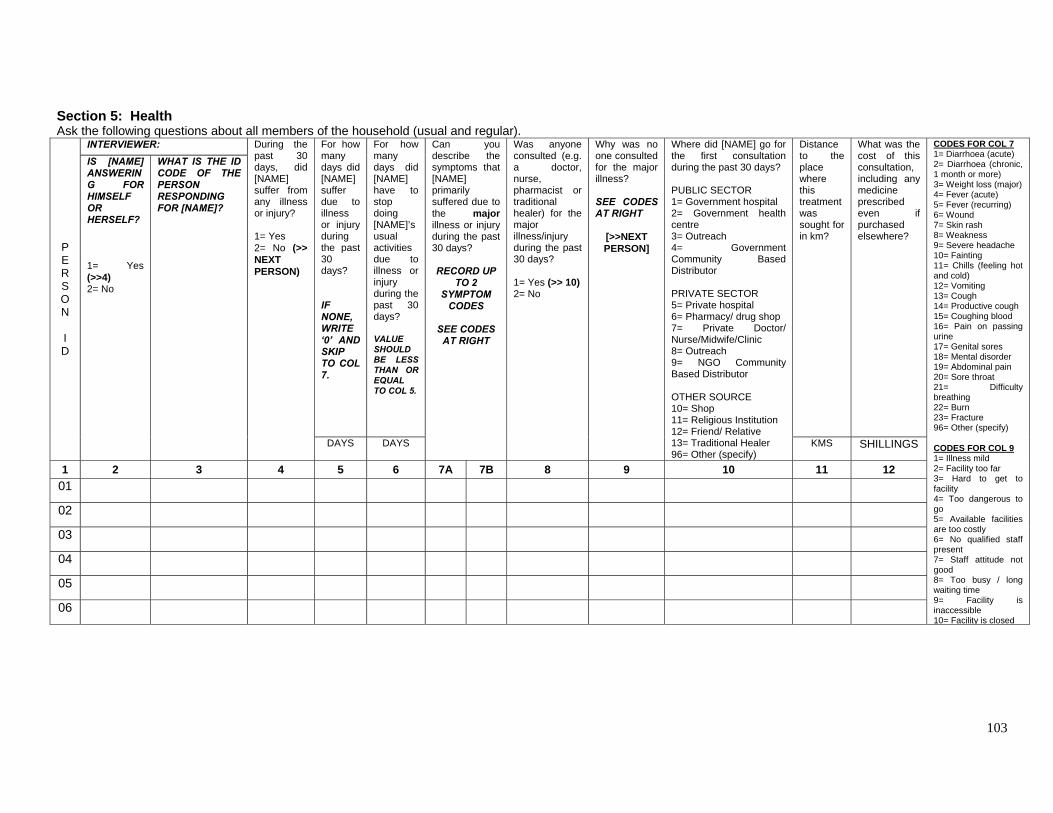
103
Section 5: Health Ask the following questions about all members of the household (usual and regular).
INTERVIEWER: For how many days did [NAME] suffer due to illness or injury during the past 30 days?
IF NONE, WRITE ‘0’ AND SKIP TO COL 7.
For how many days did [NAME] have to stop doing [NAME]’susual activities due to illness or injury during the past 30 days? VALUE SHOULD BE LESS THAN OR EQUAL TO COL 5.
Distance to the place where this treatment was sought for in km?
What was the cost of this consultation, including any medicine prescribed even if purchased elsewhere?
P E R S O N I D
IS [NAME] ANSWERING FOR HIMSELF OR HERSELF? 1= Yes (>>4) 2= No
WHAT IS THE ID CODE OF THE PERSON RESPONDING FOR [NAME]?
During the past 30 days, did [NAME] suffer from any illness or injury? 1= Yes 2= No (>> NEXT PERSON)
DAYS DAYS
Can you describe the symptoms that [NAME] primarily suffered due to the major illness or injury during the past 30 days? RECORD UP
TO 2 SYMPTOM
CODES
SEE CODES AT RIGHT
Was anyone consulted (e.g. a doctor, nurse, pharmacist or traditional healer) for the major illness/injury during the past 30 days? 1= Yes (>> 10) 2= No
Why was no one consulted for the major illness? SEE CODES AT RIGHT
[>>NEXT PERSON]
Where did [NAME] go for the first consultation during the past 30 days? PUBLIC SECTOR 1= Government hospital 2= Government health centre 3= Outreach 4= Government Community Based Distributor PRIVATE SECTOR 5= Private hospital 6= Pharmacy/ drug shop 7= Private Doctor/ Nurse/Midwife/Clinic 8= Outreach 9= NGO Community Based Distributor OTHER SOURCE 10= Shop 11= Religious Institution 12= Friend/ Relative 13= Traditional Healer 96= Other (specify)
KMS SHILLINGS
1 2 3 4 5 6 7A 7B 8 9 10 11 12 01
02
03
04
05
06
CODES FOR COL 7 1= Diarrhoea (acute) 2= Diarrhoea (chronic, 1 month or more) 3= Weight loss (major) 4= Fever (acute) 5= Fever (recurring) 6= Wound 7= Skin rash 8= Weakness 9= Severe headache 10= Fainting 11= Chills (feeling hot and cold) 12= Vomiting 13= Cough 14= Productive cough 15= Coughing blood 16= Pain on passing urine 17= Genital sores 18= Mental disorder 19= Abdominal pain 20= Sore throat 21= Difficulty breathing 22= Burn 23= Fracture 96= Other (specify) CODES FOR COL 9 1= Illness mild 2= Facility too far 3= Hard to get to facility 4= Too dangerous to go 5= Available facilities are too costly 6= No qualified staff present 7= Staff attitude not good 8= Too busy / long waiting time 9= Facility is inaccessible 10= Facility is closed

104
Section 6: Child Nutrition and Health (for all children 0-59 months old) To be answered by mothers or caregivers of surviving children born in the last five years (i.e. aged 0-59 months)
Age of Child (IN MONTHS)
For how many months was [NAME] breast- fed?
At what age was [NAME] given liquid and/or food items for the first time?
P E R S O N I D
ID CODE OF RESPONDENT
RELATIONSHIP OF RESPONDENT TO CHILD 1=Mother 2=Father 3=Other Caregiver
MONTHS
IS CHILD 24 MONTHS OLD OR LESS? 1=0-24 months 2=25-59 months (>>26)
Has [NAME] ever been breastfed in his/her life? 1=Yes 2=No (>>11)
How long after birth did [NAME] start breast-feeding? 1= 0-6hrs 2= more than 6hrs 9= Don’t know
Is [NAME] breast-feeding now? 1=Yes (>>10) 2=No 9=Don’t know (>>10)
MONTHS
Has [NAME] begun eating daily any food or fluids other than breast milk? 1=Yes 2=No
Has any water, juice, breast milk substitutes, other liquids or semi-solid foods apart from breast milk, vitamins, minerals liquid and/or food items ever been given to [NAME]? 1=Yes 2=No (>>14)
MONTHS
Since this time yesterday, how many times was [NAME] given soft food, mashed or solid food, porridge or food other than liquids (milk, water, tea and juice)? 1=Never 2=Once 3=Two to three 4=Four to five 5=Six or more times 6=Child not present at visit
Has [NAME] received a Vitamin A capsule in the last 6 months? SHOW THE BLUE AND RED CAPSULES FOR DIFFERENT DOSES. 1=Yes with card 2=Yes without card 3=No with card (>>16) 4=No without card (>>16) 9=Don’t know (>>16)
Where did the Vitamin A capsule come from? 1= On routine visit to health facility 2=Sick child visit to health facility 3=Child Health Days 8=Other (specify) 9=Don’t know
Has [NAME] had diarrhea in the last 2 weeks? DIARRHOEA IS 3 OR MORE LOOSE OR WATERY STOOLS PER DAY 1=Yes 2=No (>>21) 9=Don’t know (>>21)
1 2 3 4 5 6 7 8 9 10 11 12 13 14 15 16
01
02
03
04
05

105
Section 6 Cont’d: Child Nutrition and Health (for all children 0-59 months old)
P E R S O N I D
If [NAME] had diarrhea, was there blood in it? BLOODY DIARRHOEA IS 3 OR MORE LOOSE OR WATERY STOOLS WITH BLOOD PER DAY 1=Yes 2=No 9=Don’t know
During the last episode of diarrhea, did [NAME] take any of the following as treatment? 1=Fluid from ORS sachet 2=Recommended home make fluid (sugar/salt solution) 8=Other (specify) 9=Don’t know
During [NAME]’s last episode of diarrhea, did he/she drink much less, about the same or more than usual? 1=Much less or None 2=About the Same or Somewhat Less 3=More 9=Don’t Know
During [NAME]’s last episode of diarrhea, did he/ she eat less, about the same, or more food than usual? IF “LESS”, PROBE MUCH LESS OR A LITTLE LESS? 1=None 2=Much less 3=Somewhat less 4=About the same 5=More 9=Don’t know
Has [NAME] had a cough during which he/she breathed faster than usual with short quick breaths, or had difficulty breathing in the last two weeks? 1=Yes 2=No 9=Don’t Know
Has [NAME] had fever in the last two weeks? 1=Yes 2=No 9=Don’t Know IF 21 AND 22 ARE BOTH NO/DON’T KNOW, >>24
From where did you seek care for [NAME]? A=Government Hospital B=Government Health Center C=NGO/private health facility D=Mobile/ Outreach Clinic E=Village/ Community Health Worker F=Relative or Friend G=Traditional Practitioner H=Pharmacy/ Drug Shop I=Other Government (specify) J=Other Private (specify) K=No care was sought
Has [NAME] received a measles vaccination? SHOW VACCINATION SPOT- UPPER LEFT ARM 1=Yes with card 2=Yes with exercise book 3=Yes from NIDS 4=Yes from memory 5=No with card 6=No with exercise book 7=No from NIDS 8=No from memory 9=Don’t know
Has [NAME] received a DPT3 vaccination? SHOW VACCINATION SPOT- LEFT THIGH 1=Yes with card 2=Yes with exercise book 3=Yes from NIDS 4=Yes from memory 5=No with card 6=No with exercise book 7=No from NIDS 8=No from memory 9=Don’t know
1 17 18 19 20 21 22 23 24 25 01
02
03
04
05
06
07
08
09
10

106
Section 6 Cont’d: Child Nutrition and Health (for all children 6-59 months old)
Does [NAME] have edema? 1=Yes (>>28) 2=No
WEIGHT INCLUDE TWO PLACES AFTER DECIMAL
RECORD HEIGHT / LENGTH ONLY ONCE PER CHILD DEPENDING ON SIZE
P E R S O N I D
LENGTH (CM) LYING DOWN CHILD <24 MONTHS OR (≤ 85 CM)
HEIGHT (CM) STANDING UP CHILD >24 MONTHS OR (≥ 85 CM)
RESULT 1=Measured 2=Not present 3=Refused 4=Child has edema 96=Other (specify)
1 26 27 28A 28B 29
01 |__|__|.|__|__| Kg |__|__|__|.|__| cm |__|__|__|.|__| cm
02 |__|__|.|__|__| Kg |__|__|__|.|__| cm |__|__|__|.|__| cm
03 |__|__|.|__|__| Kg |__|__|__|.|__| cm |__|__|__|.|__| cm
04 |__|__|.|__|__| Kg |__|__|__|.|__| cm |__|__|__|.|__| cm
05 |__|__|.|__|__| Kg |__|__|__|.|__| cm |__|__|__|.|__| cm
06 |__|__|.|__|__| Kg |__|__|__|.|__| cm |__|__|__|.|__| cm
07 |__|__|.|__|__| Kg |__|__|__|.|__| cm |__|__|__|.|__| cm
08 |__|__|.|__|__| Kg |__|__|__|.|__| cm |__|__|__|.|__| cm
09 |__|__|.|__|__| Kg |__|__|__|.|__| cm |__|__|__|.|__| cm
10 |__|__|.|__|__| Kg |__|__|__|.|__| cm |__|__|__|.|__| cm
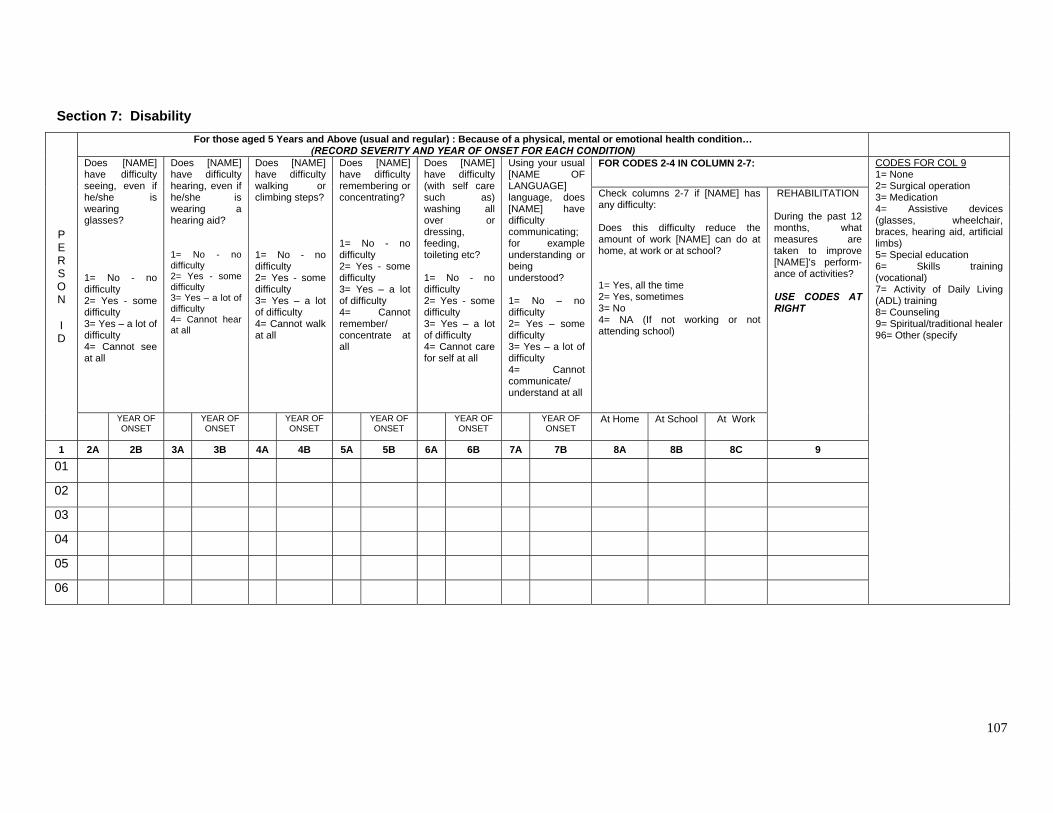
107
Section 7: Disability
For those aged 5 Years and Above (usual and regular) : Because of a physical, mental or emotional health condition… (RECORD SEVERITY AND YEAR OF ONSET FOR EACH CONDITION)
FOR CODES 2-4 IN COLUMN 2-7: Does [NAME] have difficulty seeing, even if he/she is wearing glasses? 1= No - no difficulty 2= Yes - some difficulty 3= Yes – a lot of difficulty 4= Cannot see at all
Does [NAME] have difficulty hearing, even if he/she is wearing a hearing aid? 1= No - no difficulty 2= Yes - some difficulty 3= Yes – a lot of difficulty 4= Cannot hear at all
Does [NAME] have difficulty walking or climbing steps? 1= No - no difficulty 2= Yes - some difficulty 3= Yes – a lot of difficulty 4= Cannot walk at all
Does [NAME] have difficulty remembering or concentrating? 1= No - no difficulty 2= Yes - some difficulty 3= Yes – a lot of difficulty 4= Cannot remember/ concentrate at all
Does [NAME] have difficulty (with self care such as) washing all over or dressing, feeding, toileting etc? 1= No - no difficulty 2= Yes - some difficulty 3= Yes – a lot of difficulty 4= Cannot care for self at all
Using your usual [NAME OF LANGUAGE] language, does [NAME] have difficulty communicating; for example understanding or being understood? 1= No – no difficulty 2= Yes – some difficulty 3= Yes – a lot of difficulty 4= Cannot communicate/ understand at all
Check columns 2-7 if [NAME] has any difficulty: Does this difficulty reduce the amount of work [NAME] can do at home, at work or at school? 1= Yes, all the time 2= Yes, sometimes 3= No 4= NA (If not working or not attending school)
P E R S O N I D
YEAR OF ONSET
YEAR OF ONSET
YEAR OF ONSET
YEAR OF ONSET
YEAR OF ONSET
YEAR OF ONSET
At Home At School At Work
REHABILITATION
During the past 12 months, what measures are taken to improve [NAME]’s perform-ance of activities? USE CODES AT RIGHT
1 2A 2B 3A 3B 4A 4B 5A 5B 6A 6B 7A 7B 8A 8B 8C 9
01
02
03
04
05
06
CODES FOR COL 9 1= None 2= Surgical operation 3= Medication 4= Assistive devices (glasses, wheelchair, braces, hearing aid, artificial limbs) 5= Special education 6= Skills training (vocational) 7= Activity of Daily Living (ADL) training 8= Counseling 9= Spiritual/traditional healer 96= Other (specify

108
Section 8 Cont’d: Labour Force Status (for all household members 5 years and above)
MAIN JOB What kind of work does [NAME] usually do in the (main) job/business that [NAME] had during the last week? DESCRIBE THE OCCUPATION AND MAIN TASKS OR DUTIES IN AT LEAST 2 WORDS.
What are the main goods/services produced at [NAME]’s place of work or its main function? DESCRIBE THE INDUSTRY E.G. restaurant, primary school, appliance factory, real estate office.
When did [NAME] start to work for this employer or start running the business?
P E R S O N I D
In the last four weeks, was [NAME] looking for any kind of job? 1 = Yes 2 = No
In the last four weeks, was [NAME] trying to start any kind of business? 1=Yes [>>48] 2=No
What best describes [NAME]’s situation at this time? For example, [NAME] is ill, disabled, in school, taking care of household family, or something else? 1=Ill/sick 2=Disabled 3=In school 4=Taking care of house or family 5=Retired 6=Waiting for reply from employer 7=Waiting for busy season 8=Other (specify) [>>48] DESCRIPTION CODE DESCRIPTION CODE YEAR MONTH
In this (main) job/business that [NAME] had during the last week, was [NAME] 1=Working for someone else for pay? 2=An employer? (>>32) 3=An own-account worker? (>>32) 4=Helping without pay in a household business? (>>32) 5=An apprentice? (>> 34) 6=Working on the household farm or with household livestock? (>> 36)
1 16 17 18 19A 19B 20A 20B 21A 21B 22 01
02
03
04
05
06
07
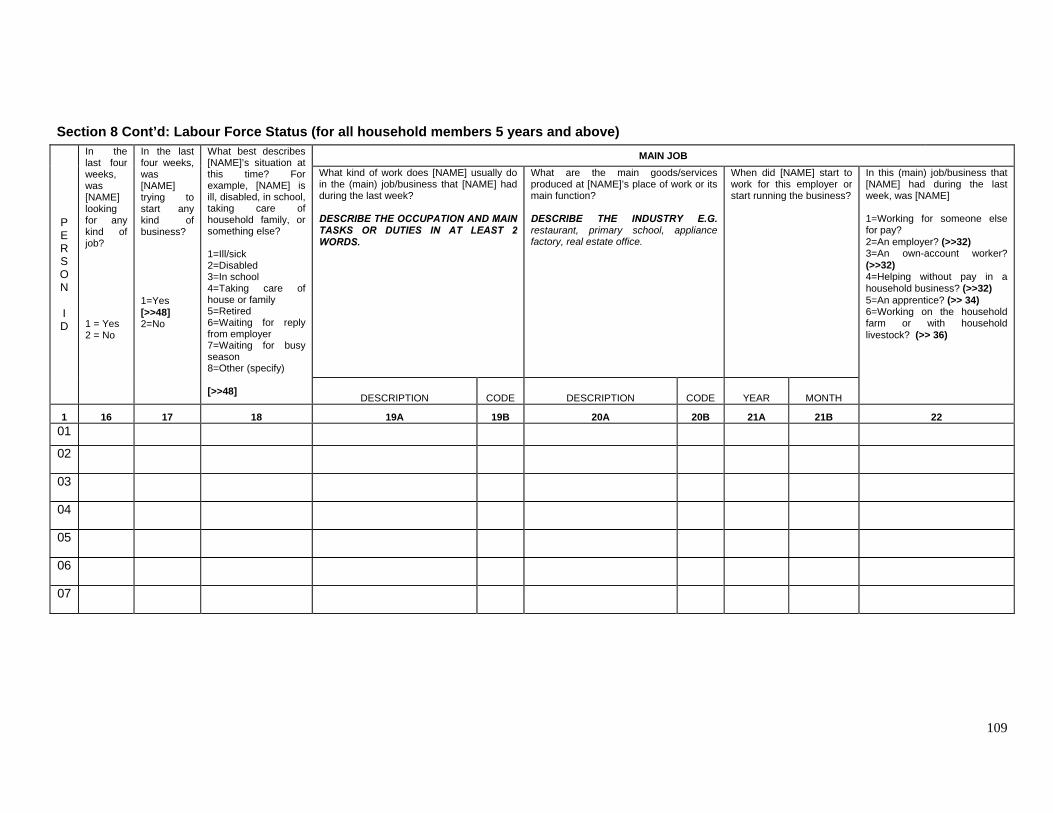
109
Section 8 Cont’d: Labour Force Status (for all household members 5 years and above)
MAIN JOB What kind of work does [NAME] usually do in the (main) job/business that [NAME] had during the last week? DESCRIBE THE OCCUPATION AND MAIN TASKS OR DUTIES IN AT LEAST 2 WORDS.
What are the main goods/services produced at [NAME]’s place of work or its main function? DESCRIBE THE INDUSTRY E.G. restaurant, primary school, appliance factory, real estate office.
When did [NAME] start to work for this employer or start running the business?
P E R S O N I D
In the last four weeks, was [NAME] looking for any kind of job? 1 = Yes 2 = No
In the last four weeks, was [NAME] trying to start any kind of business? 1=Yes [>>48] 2=No
What best describes [NAME]’s situation at this time? For example, [NAME] is ill, disabled, in school, taking care of household family, or something else? 1=Ill/sick 2=Disabled 3=In school 4=Taking care of house or family 5=Retired 6=Waiting for reply from employer 7=Waiting for busy season 8=Other (specify) [>>48]
DESCRIPTION CODE DESCRIPTION CODE YEAR MONTH
In this (main) job/business that [NAME] had during the last week, was [NAME] 1=Working for someone else for pay? 2=An employer? (>>32) 3=An own-account worker? (>>32) 4=Helping without pay in a household business? (>>32) 5=An apprentice? (>> 34) 6=Working on the household farm or with household livestock? (>> 36)
1 16 17 18 19A 19B 20A 20B 21A 21B 22 01
02
03
04
05
06
07

110
Section 8 Cont’d: Labour Force Status (for all household members 5 years and above) MAIN JOB
FOR EMPLOYEES FOR EMPLOYERS, OWN
ACCOUNT WORKERS, AND UNPAID FAMILY
WORKERS
FOR APPRENTICES
P E R S O N I D
During the last 12 months, for how many months did [NAME] work in this job?
How much was [NAME]’s last cash payment and the estimated value of what [NAME] last received in kind for the main job during the last week? What period of time did this payment cover? CASH PAYMENTS SHOULD INCLUDE SET RATE, COMMISSIONS, TIPS ANDF CASH ALLOWANCES. IF NOT CASH OR IN-KIND PAYMENT WAS RECEIVED, RECORD ‘0’ IN COL 31A & 31B.
Does this employer contribute to any pension/ retire-ment fund (e.g. NSSF) for [NAME]? 1 = Yes 2 = No
Is [NAME] entitled to any paid leave from this employer? 1 = Yes 2 = No
Is [NAME] entitled to medical benefits from this em- ployer? 1 = Yes 2 = No
Does this employer deduct or pay income tax (PAYE) from [NAME]’s salary/ wage? 1 = Yes 2 = No
Is [NAME]’s employ-ment agree-ment 1 = Written 2 = Verbal
Is [NAME]’s position… 1= Permanent and pensionable (>>30) 2=An open ended appoint-ment (>>30) 3=A fixed term
What is the duration of [NAME]’s employment agreement? 1=A week or less 2=More than a week but less than a month 3=One to six months 4=Seven to eleven months 5=One to five years 6=More than 5 years
MONTHS
Cash
Estimated cash value of in-kind payments
Time 1= Hour 2= Day 3=Week 4=Month 5=Other (specify)
Is [NAME]’s business (or household business where [NAME] works) registered for VAT? 1=Yes 2=No 8=Don’t know 9=Refused
Is [NAME]’s business (or household business where [NAME] works) registered for income tax? 1=Yes 2=No 8=Don’t know 9=Refused
In this apprenticeship was [NAME]? READ TO RESPOND-ENT AND MARK UP TO 2. A=Unpaid B=Paid cash C=Paid in kind D=Required to pay to participate
1 23 24 25 26 27 28 29 30 31A 31B 31C
32 33 34A
34B
01
02
03
04
05
06
07
08
09
10

111
Section 8 Cont’d: Labour Force Status
MAIN JOB SECOND JOB
P E R S O N I D
During the last 7 days, how many hours did [NAME] work on each day? ACTUAL NUMBER OF HOURS WORKED STARTING FROM THE PREVIOUS DAY AND GOING BACKWARDS ON MAIN JOB.
In the last week, did [NAME] have more than one economic activity, such as a job, business, household enterprise or farm? 1=Yes 2=No (>>46)
What kind of work do [NAME] usually do in the secondary job/business that you had during the last week? DESCRIBE THE OCCUPATION AND MAIN TASKS OR DUTIES IN AT LEAST 2 WORDS. (E.g. vegetable farmer, primary school teacher, computer programmer.)
What are the main goods/services produced at [NAME]‘s second place of work or its main function? DESCRIBE THE INDUSTRY E.G. restaurant, primary school, appliance factory, real estate office.
When did [NAME] start to work for this employer or start running the business?
Is [NAME]’s employer /business (at [NAME]’s main job) 1=National Government 2=Local government 3=Government controlled business (NWSC, UMEME) 4=A commercial bank 5=A private enterprise (other than a commercial bank) 6= Non-profit organization (NGO/CBO) 7= A private household
Sun Mon Tue Wed Thu Fri Sat DESCRIPTION CODE DESCRIPTION CODE YEAR MONTH
In this (second) job/business that [NAME] had during the last week, was [NAME] 1=Working for someone else for pay? 2=An employer? 3=An own-account worker? 4=Helping without pay in a household business? 5=An apprentice? 6=Working on the household farm or with household livestock? (>> 43)
1
35
36A
36B
36C
36D 36E
36F
36G
37
38A
38B
39A
39B
40A
40B 41
01
02
03
04
05
06
07
08
09
10
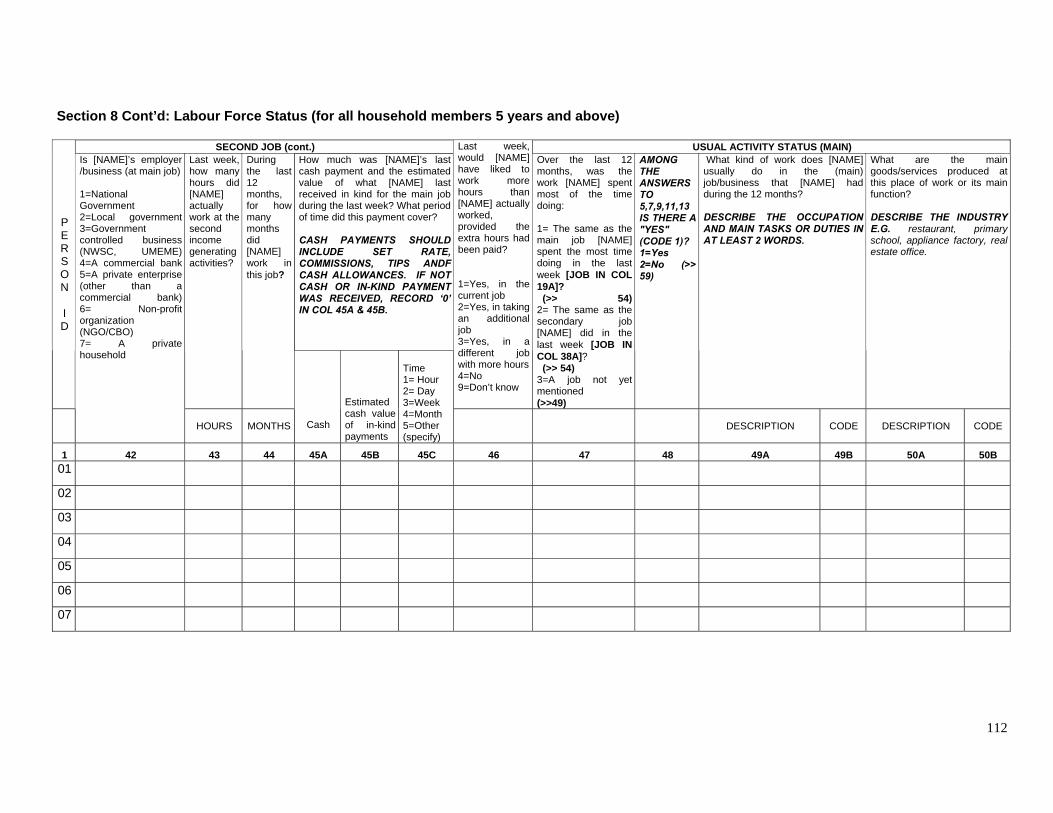
112
Section 8 Cont’d: Labour Force Status (for all household members 5 years and above)
SECOND JOB (cont.) USUAL ACTIVITY STATUS (MAIN) How much was [NAME]’s last cash payment and the estimated value of what [NAME] last received in kind for the main job during the last week? What period of time did this payment cover? CASH PAYMENTS SHOULD INCLUDE SET RATE, COMMISSIONS, TIPS ANDF CASH ALLOWANCES. IF NOT CASH OR IN-KIND PAYMENT WAS RECEIVED, RECORD ‘0’ IN COL 45A & 45B.
P E R S O N I D
Last week, how many hours did [NAME] actually work at the second income generating activities?
During the last 12 months, for how many months did [NAME] work in this job?
Last week, would [NAME] have liked to work more hours than [NAME] actually worked, provided the extra hours had been paid? 1=Yes, in the current job 2=Yes, in taking an additional job 3=Yes, in a different job with more hours 4=No 9=Don’t know
Over the last 12 months, was the work [NAME] spent most of the time doing: 1= The same as the main job [NAME] spent the most time doing in the last week [JOB IN COL 19A]? (>> 54) 2= The same as the secondary job [NAME] did in the last week [JOB IN COL 38A]? (>> 54) 3=A job not yet mentioned (>>49)
AMONG THE ANSWERS TO 5,7,9,11,13 IS THERE A "YES" (CODE 1)? 1=Yes 2=No (>> 59)
What kind of work does [NAME] usually do in the (main) job/business that [NAME] had during the 12 months? DESCRIBE THE OCCUPATION AND MAIN TASKS OR DUTIES IN AT LEAST 2 WORDS.
What are the main goods/services produced at this place of work or its main function? DESCRIBE THE INDUSTRY E.G. restaurant, primary school, appliance factory, real estate office.
Is [NAME]’s employer /business (at main job) 1=National Government 2=Local government 3=Government controlled business (NWSC, UMEME) 4=A commercial bank 5=A private enterprise (other than a commercial bank) 6= Non-profit organization (NGO/CBO) 7= A private household
HOURS MONTHS Cash
Estimated cash value of in-kind payments
Time 1= Hour 2= Day 3=Week 4=Month 5=Other (specify)
DESCRIPTION CODE DESCRIPTION CODE
1 42 43 44 45A 45B 45C 46 47 48 49A 49B 50A 50B 01
02
03
04
05
06
07

113
Section 8 Cont’d: Labour Force Status (for all household members 5 years and above)
USUAL ACTIVITY STATUS (MAIN) cont. USUAL ACTIVITY (SECONDARY)
P E R S O N I D
During the last 12 months, for how many months did [NAME] work in this job?
How much was [NAME]’s last cash payment and the estimated value of what [NAME] last received in kind for the main job during the last 12 months? What period of time did this payment cover? CASH PAYMENTS SHOULD INCLUDE SET RATE, COMMISSIONS, TIPS ANDF CASH ALLOWANCES. IF NOT CASH OR IN-KIND PAYMENT WAS RECEIVED, RECORD ‘0’ IN COL 53A & 53B.
How much was [NAME]’s last cash payment and the estimated value of what [NAME] last received in kind for the main job during the last 12 months? What period of time did this payment cover? CASH PAYMENTS SHOULD INCLUDE SET RATE, COMMISSIONS, TIPS ANDF CASH ALLOWANCES. IF NOT CASH OR IN-KIND PAYMENT WAS RECEIVED, RECORD ‘0’ IN COL 58A & 58B.
What kind of work does [NAME] usually do in the (main) job/business that [NAME] had during the 12 months? DESCRIBE THE OCCUPATION AND MAIN TASKS OR DUTIES IN AT LEAST 2 WORDS.
What are the main goods/services produced at this place of work or its main function? DESCRIBE THE INDUSTRY E.G. restaurant, primary school, appliance factory, real estate office.
During the last 12 months, for how many months did [NAME] work in this job?
In this job/business that [NAME] had during the last 12 months, was [NAME]? 1=Working for someone else for pay? 2=An employer? 3=An own-account worker? 4=Helping without pay in a household business? 5=An apprentice? 6=Working on the household farm or with household livestock?
MONTHS Cash
Estimated cash value of in-kind payments
Time 1= Hour 2= Day 3=Week 4=Month 5=Other (specify)
Over the last 12 months, did [NAME] have any other job that has not yet been mentioned [NOT LISTED IN COL 19A, COL 38A, COL 49A]? 1=Yes 2=No (>>59)
DESCRIPTION CODE DESCRIPTION CODE MONTHS Cash
Estimated cash value of in-kind payments
Time 1= Hour 2= Day 3=Week 4=Month 5=Other (specify)
1 51 52 53A 53B 53C 54 55A 55B 56A 56B 57 58A 58B 58C 01
02
03
04
05
06
07
08
09
10

114
Section 8 Cont’d: Labour Force Status (for all household members 5 years and above) NON-MARKET LABOUR ACTIVITIES
P E R S O N I D
In the last 7 days, how much time in hours did [NAME] spend collecting firewood for the household, including travel time?
In the last 7 days, how much time in hours did [NAME] spend fetching water for the household, including travel time?
In the last 7 days, how much time in hours did [NAME] spend constructing your dwelling, farm buildings, private roads, or wells?
In the last 7 days, how much time in hours did [NAME] spend making major repairs to their dwelling, farm buildings, private roads, or wells?
In the last 7 days, how much time in hours did [NAME] spend on milling and other food processing for the household? (This includes threshing and milling grain, making butter and cheese, slaughtering livestock, curing hides and skins, preserving food for later consumption, making beer and alcohol, and other similar activities. It does not include preparing food for immediate consumption)
In the last 7 days, how much time in hours did[NAME] spend making handicrafts for household use? (This includes making furniture, clothing, clay pots, baskets, mats, and other similar activities.)
In the last 7 days, how much time in hours did [NAME] spend on agriculture? (This includes growing or gathering field crops, fruits, and vegetables; producing eggs and milk; burning charcoal; and other similar activities)
In the last 7 days, how much time in hours did [NAME] spend on hunting and fishing? (This includes hunting animals and birds;catching fish, crabs, and shellfish; and other similar activities.)
HOURS HOURS HOURS HOURS HOURS HOURS HOURS HOURS
Does [NAME] get income or support from any of the following sources? LIST ALL THAT APPLY A=Remittances B=Charity/church C=Retirement pension D=NSSF E=Welfare grants F=Bursary/study loan G=Other (specify) H=None
1 59 60 61 62 63 64 65 66 67 01
02
03
04
05
06
07

115
Section 9: Housing Conditions, Water and Sanitation Now we would like to ask you about your housing conditions: all the rooms and all separate building used by your household members.
How long does it take to collect the drinking water from the main source? (Skip if the answer in question 7 is different from 1, 7, and 9 in the relevant box )
How far is the main source from your dwelling?
How much water does the household use per day?
How many rooms does your household occupy?
TIME IN MINUTES
What type of dwelling is it? 1= Independent house 2= Tenement (Muzigo) 3= Independent flat/apartment 4= Sharing house/ flat/apartment 5= Boys quarters 6= Garage 7= Hut 8= Uniport 96= Other (specify)
What is its tenure status? 1= Owned, by Head 2= Owned, by Spouse 3= Owned, Jointly (Head and Spouse) 4= Owned, by Others 5= Rented (Normal) 6= Rented (subsidized) 7= Supplied free by employer 8 = Supplied free by relative or other person 9= Rent paid by relative or other person 96= Other (specify)
NUMBER OF ROOMS
What is the major construction material of the roof? 1= Thatch, Straw 2= Mud 3= Wood, Planks 4= Iron sheets 5= Asbestos 6= Tiles 7= Tin 8= Concrete/ Cement 96= Other (specify)
What is the major construction material of the external wall? 1= Thatch, Straw 2= Mud and poles 3= Timber 4= Un-burnt bricks 5= Burnt bricks with mud 6= Burnt bricks with cement 7= Cement blocks 8= Stone 96= Other (specify)
What is the major material of the floor? 1= Earth 2= Earth and cow dung 3= Cement 4= Mosaic or tiles 5= Bricks 6= Stone 7= Wood 96= Other (specify)
What is the main source of water for drinking for your household? 1= Private connection to pipeline (Tap) >>9 2=Public taps>>9 3=Bore-hole >>9 4= Protected well/spring >>9 5=Unprotected well/spring 6= River, stream, lake, pond 7= Vendor/Tanker truck 8= Gravity flow scheme 9= Rain water 96= Other (specify)
What is the main reason for not using protected water sources? 1=Long distance 2=Unreliable 3=Water does not taste good 4=Require contribution 5=Long queues 6=Open source is okay 96=Other (specify)
To and From
Waiting Time
Distance in kilometers
UNITS 1=Litres 2=Jerry-cans (20l) 8=Other QUANTITY
1 2 3 4 5 6 7 8 9a 9b 10 11A 11B
IF CODES 1 TO 4 IN QUESTION 7:
IF SOURCE IN 7 IS NOT 1, 7 or 9:
Is the water used by the household paid for? 1=Yes 2=No (>>15)
What is the purpose for payment? 1=User fees/tariffs 2=main-tenance costs 8=Other (specify)
How much money, on average, does the household pay per month for the water?
SHILLINGS
Who normally collects the water in this household? A=Boys B=Girls C=Women D=Men
Are the safe water sources in your community managed by user committees? 1=Yes 2=No 9=Don’t Know
What do you do to the water to make it safer for drinking? 1=Boil and filter 2=Boil only 3=Filter only 4=Nothing is done 8=Other (specify)
How is the water for drinking usually stored? 1=Pot 2=Jerry can 3=Saucepan 4=Drums 5=Jug/Kettle 8=Other (specify)
Is it usually covered? 1=Yes 2=No
How has the availability of safe water for household consumption changed in your community since 2005? 1=Improved 2=Same 3=Worsened 9=Don’t Know
What are the main constraints that your household faces in accessing safe water sources? 1=Long distance 2=Inadequate sources 3=High Costs 4=Insecurity 5=No problem 8=Other (specify)
What type of toilet is mainly used in your household? 1= Covered pit latrine private 2= Covered pit latrine shared 3= VIP latrine private 4= VIP latrine shared 5= Uncovered pit latrine 6= Flush toilet private 7= Flush toilet shared 8= Bush 9= Other (specify)
Do you have a hand washing facility at the toilet? 1= No 2= Yes with water only 3= Yes with water and soap
12 13 14 15 16 17 18 19 20 21 22 23
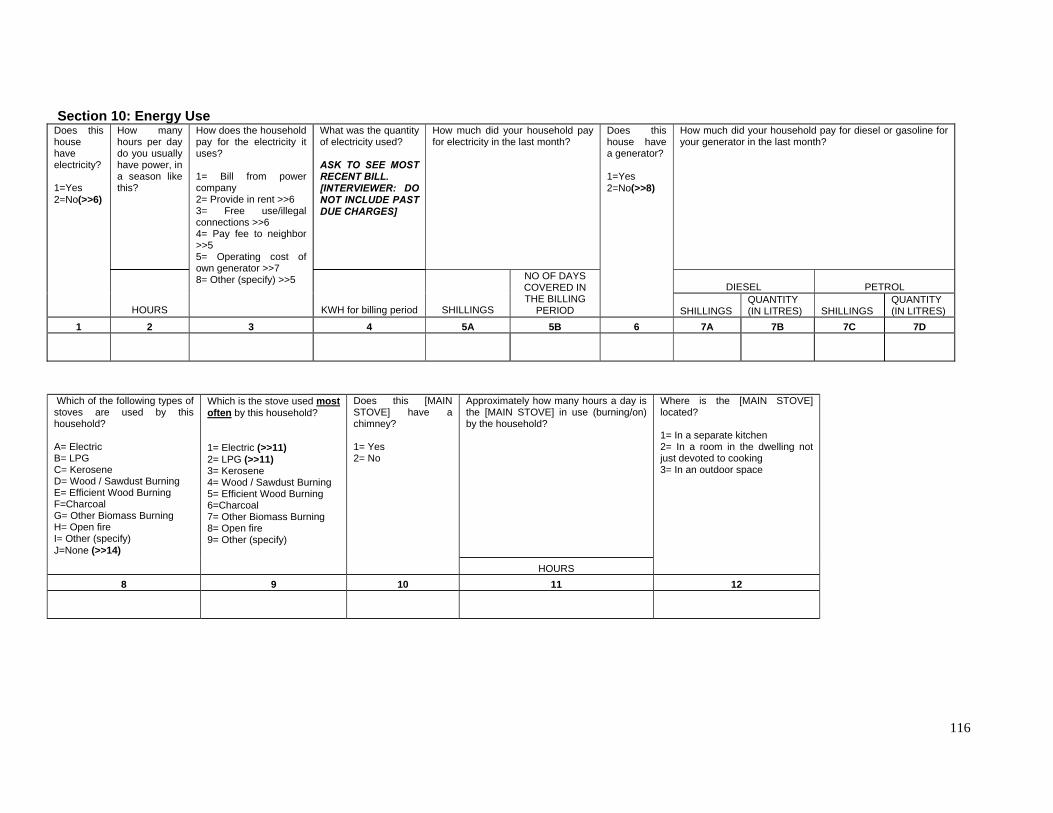
116
Section 10: Energy Use How many hours per day do you usually have power, in a season like this?
What was the quantity of electricity used? ASK TO SEE MOST RECENT BILL. [INTERVIEWER: DO NOT INCLUDE PAST DUE CHARGES]
How much did your household pay for electricity in the last month?
How much did your household pay for diesel or gasoline for your generator in the last month?
DIESEL PETROL
Does this house have electricity? 1=Yes 2=No(>>6)
HOURS
How does the household pay for the electricity it uses? 1= Bill from power company 2= Provide in rent >>6 3= Free use/illegal connections >>6 4= Pay fee to neighbor >>5 5= Operating cost of own generator >>7 8= Other (specify) >>5
KWH for billing period SHILLINGS
NO OF DAYS COVERED IN THE BILLING
PERIOD
Does this house have a generator? 1=Yes 2=No(>>8)
SHILLINGS QUANTITY (IN LITRES) SHILLINGS
QUANTITY (IN LITRES)
1 2 3 4 5A 5B 6 7A 7B 7C 7D
Approximately how many hours a day is the [MAIN STOVE] in use (burning/on) by the household?
Which of the following types of stoves are used by this household? A= Electric B= LPG C= Kerosene D= Wood / Sawdust Burning E= Efficient Wood Burning F=Charcoal G= Other Biomass Burning H= Open fire I= Other (specify) J=None (>>14)
Which is the stove used most often by this household? 1= Electric (>>11) 2= LPG (>>11) 3= Kerosene 4= Wood / Sawdust Burning 5= Efficient Wood Burning 6=Charcoal 7= Other Biomass Burning 8= Open fire 9= Other (specify)
Does this [MAIN STOVE] have a chimney? 1= Yes 2= No
HOURS
Where is the [MAIN STOVE] located? 1= In a separate kitchen 2= In a room in the dwelling not just devoted to cooking 3= In an outdoor space
8 9 10 11 12
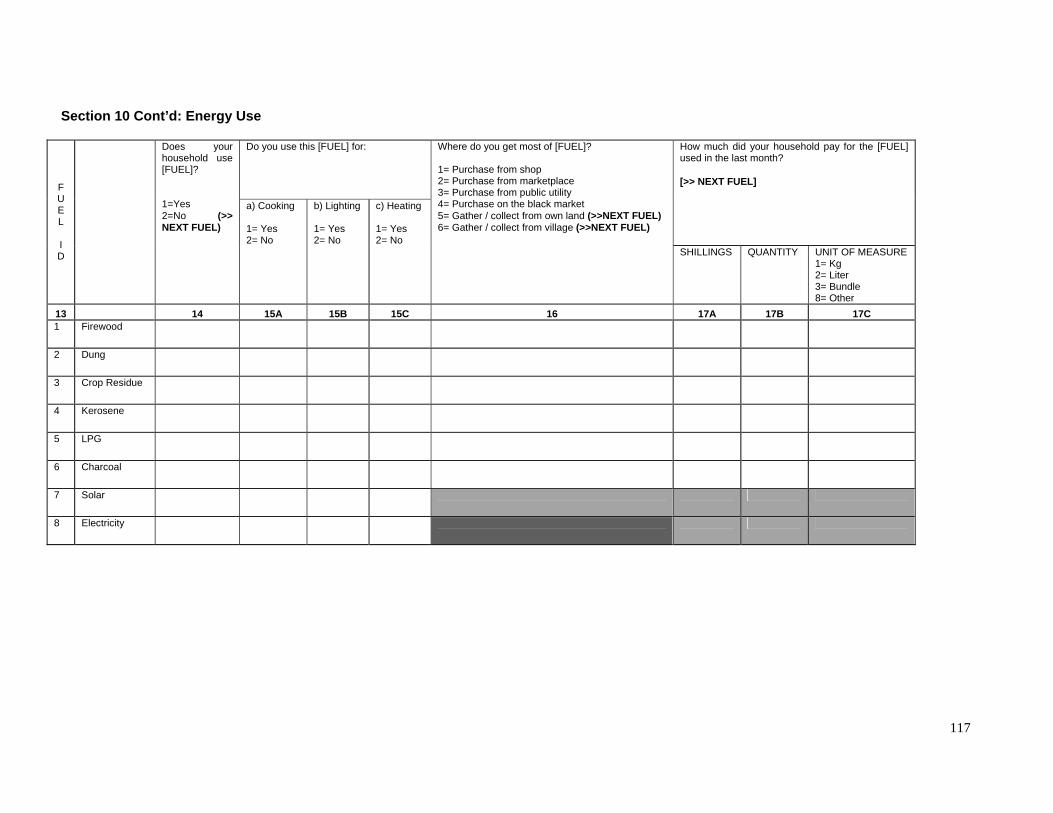
117
Section 10 Cont’d: Energy Use
Do you use this [FUEL] for:
How much did your household pay for the [FUEL] used in the last month? [>> NEXT FUEL] F
U E L I D
Does your household use [FUEL]? 1=Yes 2=No (>> NEXT FUEL)
a) Cooking 1= Yes 2= No
b) Lighting 1= Yes 2= No
c) Heating 1= Yes 2= No
Where do you get most of [FUEL]? 1= Purchase from shop 2= Purchase from marketplace 3= Purchase from public utility 4= Purchase on the black market 5= Gather / collect from own land (>>NEXT FUEL) 6= Gather / collect from village (>>NEXT FUEL)
SHILLINGS QUANTITY UNIT OF MEASURE 1= Kg 2= Liter 3= Bundle 8= Other
13 14 15A 15B 15C 16 17A 17B 17C 1 Firewood
2 Dung
3 Crop Residue
4 Kerosene
5 LPG
6 Charcoal
7 Solar
8 Electricity
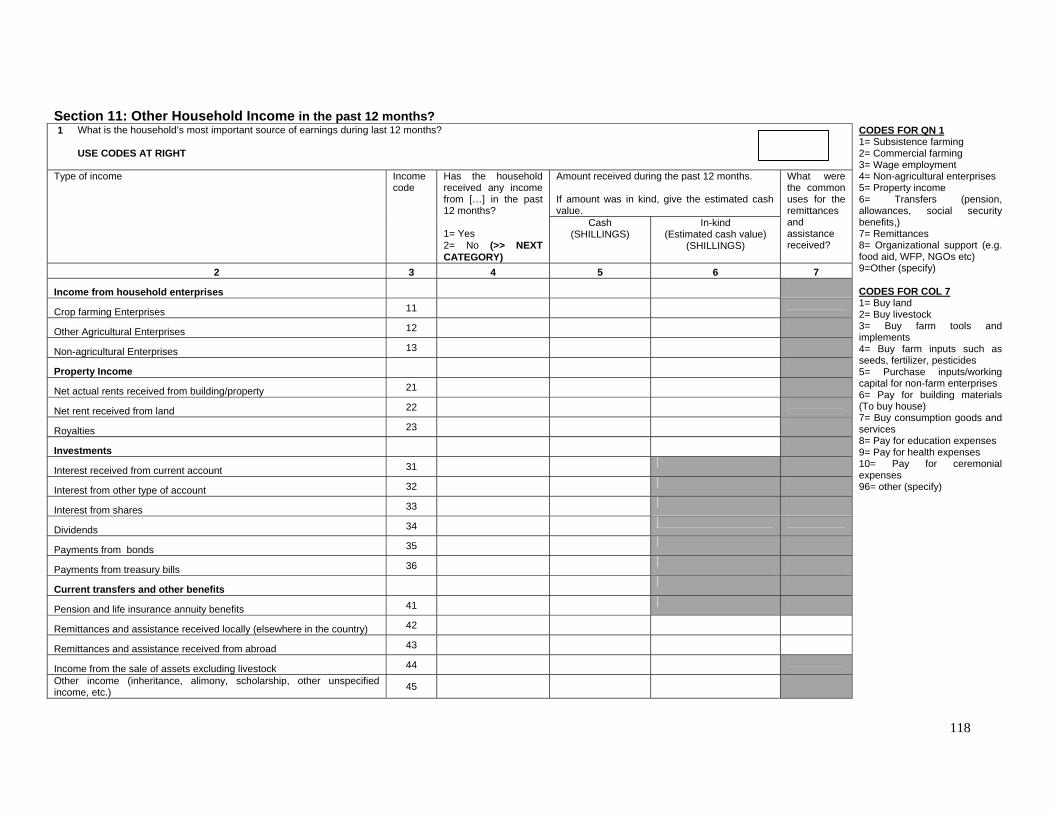
118
Section 11: Other Household Income in the past 12 months? 1 What is the household’s most important source of earnings during last 12 months?
USE CODES AT RIGHT
Amount received during the past 12 months. If amount was in kind, give the estimated cash value.
Type of income Income code
Has the household received any income from […] in the past 12 months? 1= Yes 2= No (>> NEXT CATEGORY)
Cash (SHILLINGS)
In-kind (Estimated cash value)
(SHILLINGS)
What were the common uses for the remittances and assistance received?
2 3 4 5 6 7
Income from household enterprises
Crop farming Enterprises 11
Other Agricultural Enterprises 12
Non-agricultural Enterprises 13
Property Income
Net actual rents received from building/property 21
Net rent received from land 22
Royalties 23
Investments
Interest received from current account 31
Interest from other type of account 32
Interest from shares 33
Dividends 34
Payments from bonds 35
Payments from treasury bills 36
Current transfers and other benefits
Pension and life insurance annuity benefits 41
Remittances and assistance received locally (elsewhere in the country) 42
Remittances and assistance received from abroad 43
Income from the sale of assets excluding livestock 44
Other income (inheritance, alimony, scholarship, other unspecified income, etc.) 45
CODES FOR QN 1 1= Subsistence farming 2= Commercial farming 3= Wage employment 4= Non-agricultural enterprises 5= Property income 6= Transfers (pension, allowances, social security benefits,) 7= Remittances 8= Organizational support (e.g. food aid, WFP, NGOs etc) 9=Other (specify) CODES FOR COL 7 1= Buy land 2= Buy livestock 3= Buy farm tools and implements 4= Buy farm inputs such as seeds, fertilizer, pesticides 5= Purchase inputs/working capital for non-farm enterprises 6= Pay for building materials (To buy house) 7= Buy consumption goods and services 8= Pay for education expenses 9= Pay for health expenses 10= Pay for ceremonial expenses 96= other (specify)

119
Section 12: Non-Agricultural Household Enterprises/Activities 1 Over the past 12 months, has anyone in your household operated any non-agricultural enterprise which produces goods or services (for example,
artisan, metalworking, tailoring, repair work; also include processing and selling your outputs from your own crops if done regularly) or has anyone in your household owned a shop or operated a trading business or profession?
1=Yes 2=No (>>SECTION 13)
2 WHAT IS THE ID CODE OF THE RESPONDENT TO THIS SECTION? When was this enterprise first started?
ENTERPR I SE I D
Description of enterprise
Industry code SEE CODE SHEET
Who in the household owns/ manages this enterprise? LIST UP TO 2 ID CODES
MONTH YEAR
Where was this business operated? 1 = Home Inside the Residence 2 = Home Outside the Residence 3 = Industrial Site 4 = Traditional Market 5 = Commercial District Shop 6 = Roadside 7 = Other Fixed Place 8 = Mobile
What was the main source of money for setting up this business? 1= Didn’t need any money 2= Own savings 3= Commercial/ Development bank 4= Microfinance institutions 5= Local group 6= NGO 8= Other (Specify)
Did this business receive a credit to operate or expand your business during the past 12 months? 1= Yes 2= No (>> 11)
What was the major source? 1= Formal Banks (commercial/ development) 2= Micro finance institutions 3= NGO 4= Credit union 5= Landlord 6= Employer 7= Local group 8= Relative 9= Friend 10= Local money lender 96= Other (Specify)
3 4 5A 5B 6A 6B 7 8 9 10 1 2
Is this enterprise registered for VAT? 1=Yes 2=No 8=Refused 9=Don’t Know
Who in the household works on this activity? LIST UP TO 5 ID CODES FROM ROSTER
In the past 12 months, how many months did the enterprise operate?
What is/was the average monthly gross revenues during the months of operation?
SHILLINGS
How many people does this enterprise hire during a typical month of operation?
What is/was the average expenditure on wages during a typical month of operation?
SHILLINGS
What is/was the average expenditure on raw materials during a typical month of operation?
SHILLINGS
Other operating expenses such as fuel, kerosene, electricity etc. during typical month of operation?
SHILLINGS
Is this enterprise registered for income tax? 1=Yes 2=No 8=Refused 9=Don’t Know
11A 11B 11C 11D 11E 12 13 14 15 16 17 18 19 1
2
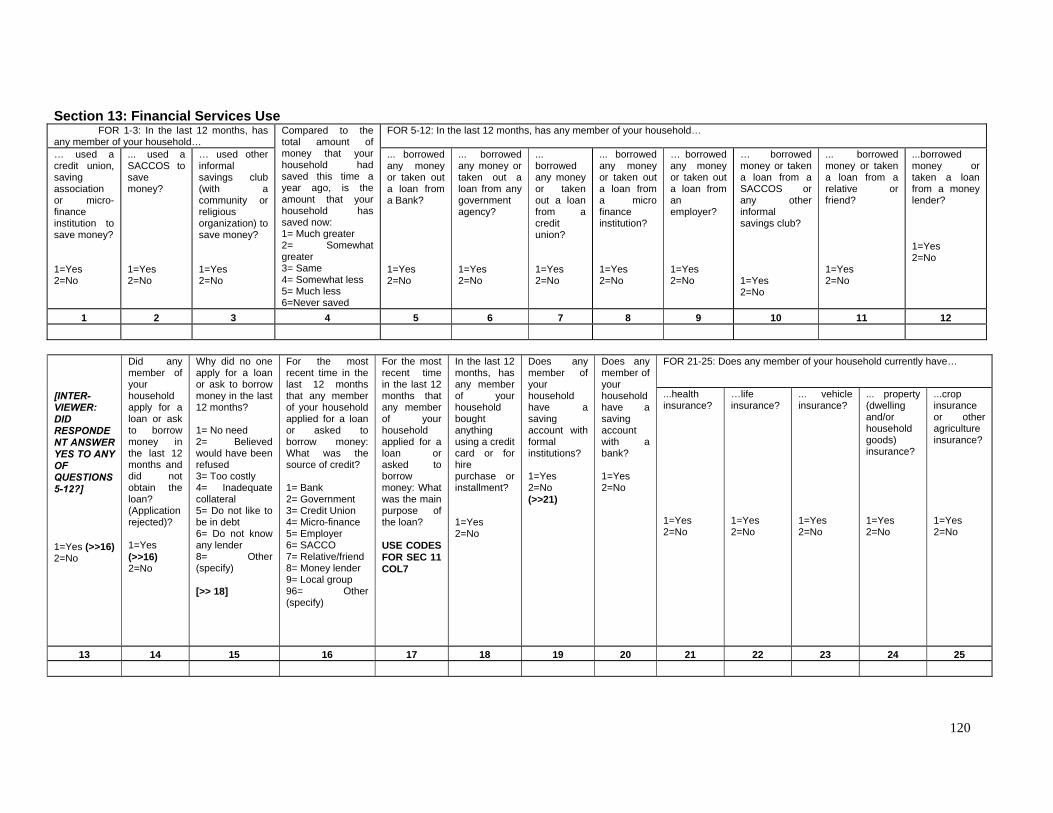
120
Section 13: Financial Services Use FOR 1-3: In the last 12 months, has any member of your household…
FOR 5-12: In the last 12 months, has any member of your household…
… used a credit union, saving association or micro-finance institution to save money? 1=Yes 2=No
... used a SACCOS to save money? 1=Yes 2=No
… used other informal savings club (with a community or religious organization) to save money? 1=Yes 2=No
Compared to the total amount of money that your household had saved this time a year ago, is the amount that your household has saved now: 1= Much greater 2= Somewhat greater 3= Same 4= Somewhat less 5= Much less 6=Never saved
... borrowed any money or taken out a loan from a Bank? 1=Yes 2=No
... borrowed any money or taken out a loan from any government agency? 1=Yes 2=No
... borrowed any money or taken out a loan from a credit union? 1=Yes 2=No
... borrowed any money or taken out a loan from a micro finance institution? 1=Yes 2=No
… borrowed any money or taken out a loan from an employer? 1=Yes 2=No
… borrowed money or taken a loan from a SACCOS or any other informal savings club? 1=Yes 2=No
... borrowed money or taken a loan from a relative or friend? 1=Yes 2=No
...borrowed money or taken a loan from a money lender? 1=Yes 2=No
1 2 3 4 5 6 7 8 9 10 11 12
FOR 21-25: Does any member of your household currently have…
[INTER-VIEWER: DID RESPONDENT ANSWER YES TO ANY OF QUESTIONS 5-12?] 1=Yes (>>16) 2=No
Did any member of your household apply for a loan or ask to borrow money in the last 12 months and did not obtain the loan? (Application rejected)? 1=Yes (>>16) 2=No
Why did no one apply for a loan or ask to borrow money in the last 12 months? 1= No need 2= Believed would have been refused 3= Too costly 4= Inadequate collateral 5= Do not like to be in debt 6= Do not know any lender 8= Other (specify) [>> 18]
For the most recent time in the last 12 months that any member of your household applied for a loan or asked to borrow money: What was the source of credit? 1= Bank 2= Government 3= Credit Union 4= Micro-finance 5= Employer 6= SACCO 7= Relative/friend 8= Money lender 9= Local group 96= Other (specify)
For the most recent time in the last 12 months that any member of your household applied for a loan or asked to borrow money: What was the main purpose of the loan? USE CODES FOR SEC 11 COL7
In the last 12 months, has any member of your household bought anything using a credit card or for hire purchase or installment? 1=Yes 2=No
Does any member of your household have a saving account with formal institutions? 1=Yes 2=No (>>21)
Does any member of your household have a saving account with a bank? 1=Yes 2=No
...health insurance? 1=Yes 2=No
…life insurance? 1=Yes 2=No
... vehicle insurance? 1=Yes 2=No
... property (dwelling and/or household goods) insurance? 1=Yes 2=No
...crop insurance or other agriculture insurance? 1=Yes 2=No
13 14 15 16 17 18 19 20 21 22 23 24 25
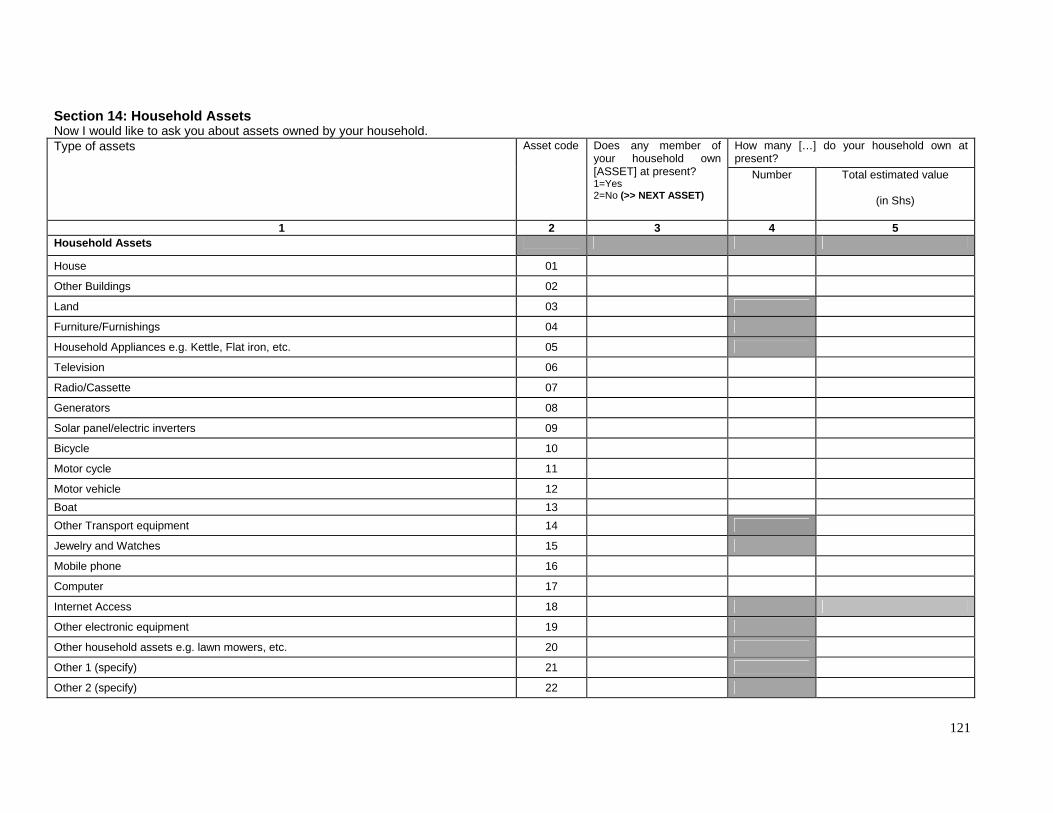
121
Section 14: Household Assets Now I would like to ask you about assets owned by your household.
How many […] do your household own at present?
Type of assets Asset code Does any member of your household own [ASSET] at present? 1=Yes 2=No (>> NEXT ASSET)
Number
Total estimated value
(in Shs)
1 2 3 4 5 Household Assets
House 01
Other Buildings 02
Land 03
Furniture/Furnishings 04
Household Appliances e.g. Kettle, Flat iron, etc. 05
Television 06
Radio/Cassette 07
Generators 08
Solar panel/electric inverters 09
Bicycle 10
Motor cycle 11
Motor vehicle 12 Boat 13 Other Transport equipment 14
Jewelry and Watches 15
Mobile phone 16
Computer 17
Internet Access 18
Other electronic equipment 19
Other household assets e.g. lawn mowers, etc. 20
Other 1 (specify) 21
Other 2 (specify) 22

122
Section 15: Household Consumption Expenditure Part A: Number of household members present On average, how many people were present in the last 7 days? In this section children are defined as less than 18 years.
Household Members Visitors Male adults Female adults Male children Female children Male adults Female adults Male children Female children Part B: Food, Beverage, and Tobacco (During the Last 7 Days)
Consumption out of Purchases Household Away from home
Consumption out of home produce
Received in-kind/Free Item Description Code Did you consume
[ITEM] 1= Yes 2= No
How many days was
[ITEM] consumed out of the
last 7 days?
Unit of Qty
Qty Value Qty Value Qty Value Qty
Value
Market Price
Farm gate price
1 2 3A 3B 3C 4 5 6 7 8 9 10 11 12 13 Matooke (Bunch) 101 Matooke (Cluster) 102 Matooke (Heap) 103 Matooke (Others) 104 Sweet Potatoes (Fresh) 105 Sweet Potatoes (Dry) 106 Cassava (Fresh) 107 Cassava (Dry/ Flour) 108 Irish Potatoes 109 Rice 110 Maize (grains) 111 Maize (cobs) 112 Maize (flour) 113 Bread 114 Millet 115 Sorghum 116 Beef 117 Pork 118 Goat Meat 119 Other Meat 120 Chicken 121 Fresh Fish 122 Dry/ Smoked fish 123 Eggs 124 Fresh Milk 125 Infant Formula Foods 126 Cooking oil 127 Ghee 128 Margarine, Butter, etc 129

123
Part B cont’d: Food, Beverage, and Tobacco (During the Last 7 Days) Consumption out of Purchases
Household Away from home Consumption out of home
produce Received in-kind/Free Item Description Code Did you
consume [ITEM] 1= Yes 2= No
How many days was [ITEM]
consumed out of the last 7 days?
Unit of Qty
Qty Value Qty Value Qty Value Qty Value
Market Price
Farm gate price
1 2 3A 3B 3C 4 5 6 7 8 9 10 11 12 13 Passion Fruits 130
Sweet Bananas 131
Mangos 132
Oranges 133
Other Fruits 134
Onions 135
Tomatoes 136
Cabbages 137
Dodo 138
Other vegetables 139
Beans fresh) 140
Beans (dry) 141
Ground nuts (in shell) 142
Ground nuts (shelled) 143
Ground nuts (pounded) 144
Peas 145
Sim sim 146
Sugar 147
Coffee 148
Tea 149
Salt 150
Soda* 151
Beer* 152
Other Alcoholic drinks 153
Other drinks 154
Cigarettes 155
Other Tobacco 156
Expenditure in Restaurants on:
1. Food 157 2. Soda 158
3. Beer 159
Other juice 160
Other foods 161 * Sodas and Beers to be recorded here are those that are not taken with food in restaurants.

124
PART B Cont’d: Food Fortification CHECK WHETHER THE HOUSEHOLD CONSUMED ANY MAIZE FLOUR, SUGAR, SALT OR COOKING OIL DURING THE LAST 7 DAYS
Item Description Code Did the household consume
[ITEM]
1= Yes 2= No
Is the [ITEM] fortified?
1= Yes 2= No 3= Don’t Know
CHECK FOR
FORTIFICATION LOGO OR SHOW
SAMPLE TO RESPONDENT
What Brand of MAIZE FLOUR was consumed?
SPECIFY
What brand of COOKING OIL was consumed?
What brand of SUGAR was consumed?
What brand of SALT was consumed?
1 2 14 15 16A CODE 16B
17A CODE 17B
18A CODE 18B
19A CODE 19B
Maize flour 113 Cooking oil 127 Sugar 147 Salt 150

125
Part C: Non-Durable Goods and Frequently Purchased Services (During the last 30 days)
Purchases Home produced Received in-kind/Free Item Description Code Unit of Quantity
Qty Value Qty Value Qty Value
Unit Price
1 2 3 4 5 6 7 8 9 10 Rent of rented house/Fuel/power Rent of rented house 301 Imputed rent of owned house 302 Imputed rent of free house 303 Maintenance and repair expenses 304 Water 305 Electricity 306 Generators/lawn mover fuels 307 Paraffin (Kerosene) 308 Charcoal 309 Firewood 310 Others 311 Non-durable and Personal Goods Matches 451 Washing soap 452 Bathing soap 453 Tooth paste 454 Cosmetics 455 Handbags, travel bags etc 456 Batteries (Dry cells) 457 Newspapers and Magazines 458 Others 459 Transport and communication Tires, tubes, spares, etc 461 Petrol, diesel etc 462 Taxi fares 463 Bus fares 464 Boda boda fares 465 Stamps, envelops, etc. 466 Air time & services fee for owned fixed/ mobile phones
467
Expenditure on phones not owned 468 Others 469

126
Part C cont’d: Non-Durable Goods and Frequently Purchased Services (During the last 30 days) Purchases Home produced Received in-kind/Free Item Description Code Unit of
Quantity
Qty Value Qty Value Qty Value
Unit Price
1 2 3 4 5 6 7 8 9 10 Health and Medical Care Consultation Fees 501 Medicines etc 502 Hospital/ clinic charges 503 Traditional Doctors fees/ medicines 504 Others 505 Other services Sports, theaters, etc 601 Dry Cleaning and Laundry 602 Houseboys/ girls, Shamba boys etc 603 Barber and Beauty Shops 604 Expenses in hotels, lodging, etc 605

127
Part D: Semi-Durable Goods and Durable Goods and Service (During the last 365 days)
Purchases Consumption out of household /enterprise stock Received in-kind/Free
Item Description Code
Value Value Value 1 2 3 4 5
Clothing and Footwear Men’s clothing 201 Women’s clothing 202 Children’s clothing (excluding school uniforms) 203 Other clothing and clothing materials 204 Tailoring and Materials 205 Men’s Footwear 206 Women’s Footwear 207 Children’s Footwear 208 Other Footwear and repairs 209 Furniture, Carpet, Furnishing etc Furniture Items 301 Carpets, mats, etc 302 Curtains, Bed sheets, etc 303 Bedding Mattresses 304 Blankets 305 Others and Repairs 306 Household Appliances and Equipment Electric iron/ Kettles etc 401 Charcoal and Kerosene Stoves 402 Electronic Equipment (TV, radio cassette etc) 403 Bicycles 404 Radio 405 Motors, Pick-ups, etc 406 Motor cycles 407 Computers for household use 408 Phone Handsets (both fixed and mobile) 409 Other equipment and repairs 410 Jewelry, Watches, etc 411

128
Part D cont’d: Semi-Durable Goods and Durable Goods and Service (During the last 365 days)
Purchases Consumption out of household enterprise stock Received in-kind/Free
Item Description Code
Value Value Value 1 2 3 4 5
Glass/ Table were, Utensils, etc Plastic basins 501 Plastic plates/ tumblers 502 Jerry canes and plastic buckets 503 Enamel and metallic utensils 504 Switches, plugs, cables, etc 505 Others and repairs 506 Education School fees including PTA 601 Boarding and Lodging 602 School uniform 603 Books and supplies 604 Other educational expenses 605 Services Not elsewhere Specified Expenditure on household functions 701 Insurance Premiums 702 Other services N.E.S. 703 Part E: Non-consumption Expenditure Item description Code Value (During the last 365 days)
1 2 3 Income tax 801 Property rates (taxes) 802 User fees and charges 803 Local Service tax 804 Pension and social security payments 805 Remittances, gifts, and other transfers 806 Funerals and other social functions 807 Interest on loans 808 Others (like subscriptions, interest to consumer debts, etc.) 809

129
Section 16: Shocks & Coping Strategies When did the [SHOCK] first occur?
Code Description of distress events Did you experience [SHOCK] during the past 12 months? 1 = Yes 2 = No (>> NEXT SHOCK)
As a result of the [SHOCK], was there a decline in your household's...
1 = Yes 2 = No
How did your household cope with this [SHOCK]?
UP TO 3 ANSWERS WITH RANK FOR EACH SHOCK EXPERIENCED. USE CODES BELOW.
1=Jan 2=Feb 3=Mar 4=Apr 5=May 6=Jun
7=July 8=Aug 9=Sept 10=Oct 11=Nov 12=Dec
How long did the shock last? (RECORD NUMBER OF MONTHS) IF LESS THAN 1 MONTH RECORD ‘00’
Income Assets Food Production
Food Purchases
1st 2nd 3rd
1 2A 2B 3A 3B 3C 3D 4A 4B 4C 101 Drought/Irregular Rains
102 Floods
103 Landslides/Erosion
104 Unusually High Level of Crop Pests & Disease
105 Unusually High Level of Livestock Disease
106 Unusually High Costs of Agricultural Inputs
107 Unusually Low Prices for Agricultural Output
108 Reduction in the Earnings of Currently (Off-Farm) Employed Household Member(s)
109 Loss of Employment of Previously Employed Household Member(s) (Not Due to Illness or Accident)
110 Serious Illness or Accident of Income Earner(s)
111 Serious Illness or Accident of Other Household Member(s)
112 Death of Income Earner(s)
113 Death of Other Household Member(s)
114 Theft of Money/Valuables/Non-Agricultural Assets
115 Theft of Agricultural Assets/Output (Crop or Livestock)
116 Conflict/Violence
117 Fire
118 Other (Specify)
CODES FOR COL 4A, 4B, 4C 1 = Unconditional help provided by relatives/friends 2 = Unconditional help provided by local government 3 = Changed dietary patterns involuntarily (Relied on less preferred food options, reduced the proportion or number of meals per day, skipped days without eating, etc…) 4 = Changed cropping practices (crop choices or technology)
5 = Household member(s) took on more non-farm (wage- or self-) employment 6 = Household member(s) took on more farm wage employment 7 = Household member(s) migrated 8 = Relied on savings 9 = Obtained credit
10 = Sold durable household assets (agricultural or non-agricultural) 11 = Sold land/building 12 = Rented out land/building 13 = Distress sales of animal stock 14 = Sent children to live elsewhere 15 = Reduced expenditures on health and education 96=Other (specify)

130
Section 17: Welfare and Food Security FOR HOUSEHOLD WITH CHILDREN UNDER AGE 5 (IF NONE, WRITE ‘12’):
FOR HOUSEHOLD WITH CHILDREN 5-13 (IF NONE, WRITE ‘12’):
WHAT IS THE ID CODE OF THE RESPONDENT TO THIS SECTION?
Does every member of the household have at least two sets of clothes? 1= Yes 2= No
Does every child in this household (all those under 18 years old) have a blanket? 1= Yes 2= No 3= Not Applicable
Does every member of the household have at least one pair of shoes? 1= Yes 2= No
How many meals, including breakfast are taken per day in your household?
What did you do when you last ran out of salt? 1= Borrowed from neighbors 2= Bought 3= Did without 4= Does not cook at all 5= Not applicable
What did your children below 5 years old (0-4 years) have for breakfast yesterday? 01=Tea/drink with sugar 02=Milk/milk tea with sugar 03=Solid food only 04=Tea/drink with solid food 05=Tea/drink without sugar with solid food 06=Porridge with solid food 07=Porridge with sugar 08=Porridge with milk 09=Porridge without sugar 11=Nothing 12=No under 5s in the household 96=Other (Specify)
What did your children between 5 to 13 years old have for breakfast yesterday? 01=Tea/drink with sugar 02=Milk/milk tea with sugar 03=Solid food only 04=Tea/drink with solid food 05=Tea/drink without sugar with solid food 06=Porridge with solid food 07=Porridge with sugar 08=Porridge with milk 09=Porridge without sugar 11=Nothing 12=No 5-13 in the household 96=Other (Specify)
Have you been faced with a situation when you did not have enough food to feed the household in the last 12 months? 1=Yes 2=No [>>SECTION 18]
1 2 3 4 5 6 7 8 9
10 When did you experience this situation?
INTERVIEWER: CIRCLE ALL THAT APPLY.
11 Why? INTERVIEWER: DO NOT READ OUT THE ANSWERS, CIRCLE ALL THAT APPLY.
A. Because of inadequate household stocks due to drought/poor rains
A. January
B. Inadequate food stocks from previous season because insecurity prevented us from harvesting the crop
B. February
C. Inadequate household food stocks because of pest damage to crop
C. March
D. Inadequate household food stocks because we did not plant enough
D. April
E. We did not have enough money to buy food from the market
E. May
F. Food in the market was very expensive
F. June
G. No one was willing to offer us some food
G. July
H. We could not cook because we had no fuel wood
H. August
I. There was no food distribution
I. September
J. Bread winner/head of household died or moved away
J. October
K. We were not able to reach the market because of distance or insecurity or lack of transport
K. November
L. There was no food in the market
L. December
M. Floods / water logging
N. Other (Specify)

131
Section 18: Transport Services and Road Infrastructure How long does it take you to travel to the nearest [ROAD]?
SER. NO.
Do you have a […….] in your community?
1=Yes 2=No (>>NEXT ROAD)
What is the commonest mode of transport used to reach the nearest [ROAD]?
1= Walking
2= Taxi (car)
3= Boda-boda
4= Bus/minibus
5= Motorcycle
6= Bicycle
7= Boat
8= Other (Specify)
TIME IN MINUTES
Is the road usable all the year round? 1=Yes (>>NEXT ROAD) 2=No
Why was the road unusable? 1=Bad weather 2=Bad terrain 3=Potholes 4=Poor drainage 5=Bushy roads 6=Insecurity 8=Other (specify)
1 2 3 4 5 6
A Trunk road (Tarmac)
B Trunk road (Murram)
C District/feeder road
D Community Access Road
What is the distance from your household to the nearest public transport point/stage?
KILOMETERS
What type of road is this public transportation point/stage? 1= Trunk road (Tarmac) 2= Trunk road (Murram) 3= District/feeder road 4= Community Access Road 8=Other (specify)
HOUSEHOLD ACTIVITY
Was [ACTIVITY] affected by your local road conditions? 1=Yes 2=No (>>NEXT ACTIVITY)
How was [ACTIVITY] affected? INTERVIEWER: IF NEGATIVELY, PROBE FOR SEVERITY. 1=Made it easier 2=Did not affect much 3=Made it a little more difficult 4=Made it much more difficult 5=Made it impossible / almost impossible
7 8 9 10 11
A Agricultural
Marketing
B Economic Activities
C Trade Costs
D Costs of Vehicle Operation
E Access to Basic Services (including
END TIME : F Other (specify)

132
Section 19: Link with the Agriculture Questionnaire 1. During the last completed cropping season (1st Season of 2009: Jan. – June 2009) and
the current cropping season (2nd Season of 2009 July – Dec. 2009), has any member of your household cultivated crops including perennial crops (e.g. fruits)?
1= Yes 2= No
2. During the last 12 months, has any member of your household raised livestock, poultry,
or fishery?
1= Yes 2= No
INTERVIEWER:
(1) IF THE ANSWER TO QUESTION 1 IS YES, THE AGRICULTURE QUESTIONNAIRE SHOULD BE ADMINISTERED.
(2) IF ONLY THE ANSWER TO QUESTION 2 IS YES, THEN ONLY ‘SECTIONS 6 TO 10’ OF THE AGRICULTURE QUESTIONNAIRE SHOULD BE ADMINISTERED. (3) IF THE ANSWERS TO QUESTIONS 1 AND 2 ARE BOTH NO, THE AGRICULTURE QUESTIONNAIRE SHOULD NOT BE ADMINISTERED TO THE HOUSEHOLD.

133
FLAP
P E R S O N I D
NAME
SEX 1= M 2= F
AGE
ELIGIBLE FOR LABOUR MODULE
(AGED 5 YEARS AND ABOVE)
(CIRCLE LINE
NUMBER)
CHILD UNDER 5
(CIRCLE LINE NUMBER)
WOMAN AGED 15-49 ELIGIBLE FOR WOMAN’S
SURVEY
(CIRCLE LINE NUMBER)
01 01 01 01
02 02 02 02
03 03 03 03
04 04 04 04
05 05 05 05
06 06 06 06
07 07 07 07
08 08 08 08
09 09 09 09
10 10 10 10