Embed Size (px)
Citation preview
1
Unpublished supporting data to
Online URL: http://www.impactjournals.com/oncotarget/index.php?journal=oncotarget&page=article&op=view&path%5B%5D=11647
2
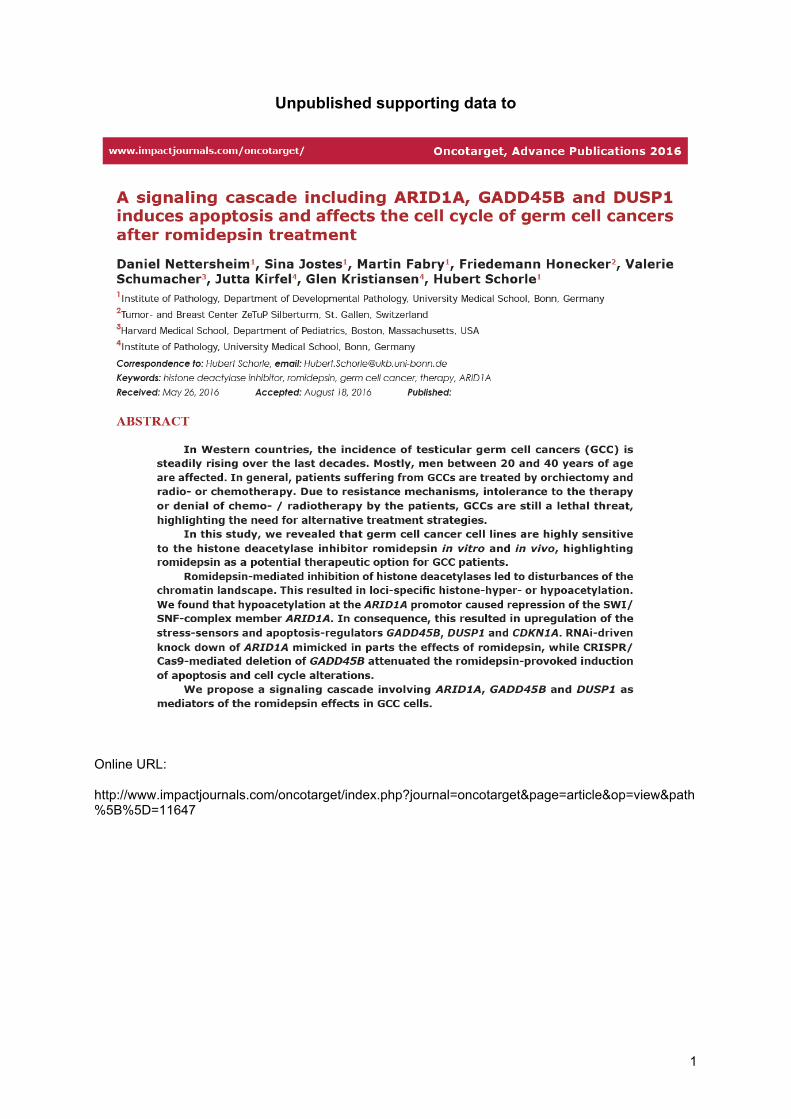
Morphology of romidepsin treated GCC cell lines, fibroblasts and Sertoli cells Lately 16h after romidepsin application, GCC cells appeared morphologically as
apoptotic, while fibroblasts and FS1 cells did not show any morphological signs of
cell death.
Fig. 1: Brightfield pictures of GCC cell lines, fibroblasts (MPAF, ARZ) and Sertoli cells (FS1) 2 - 16h after 10 nM romidepsin (ISTODAX) application. Scale-bars: 100 µm.
3
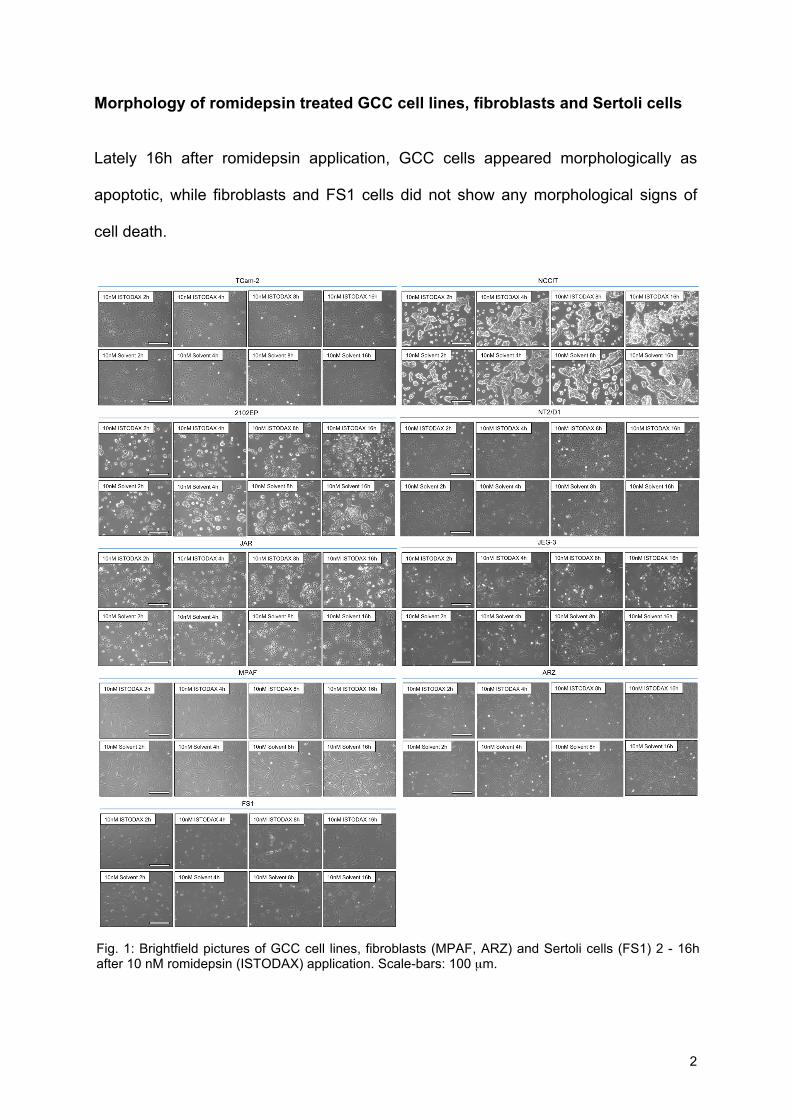
The effect of romidepsin on HDAC1 - 3 expression A qRT-PCR analysis demonstrated that the expression levels of HDAC1 and HDAC2
remained nearly unaffected in GCC cell lines and fibroblasts after romidepsin
treatment (Fig. 2 A, B). In contrast, HDAC3 expression was strongly upregulated in
most cell lines 16h after romidepsin treatment (Fig. 2 C). In NCCIT and 2102EP,
HDAC3 expression peaked after 4h and 8h, respectively (Fig. 2 C). These data
suggest that GCC cells upregulate HDAC3 in response to romidepsin, maybe to
counteract the romidepsin-mediated inhibition of HDACs.
Fig. 2: qRT-PCR analysis of HDAC1 - 3 expression in GCC cell lines and fibroblasts 2 - 16h after 10 nM romidepsin application. Inlay: averaged expression over time (only GCC cell lines).
4
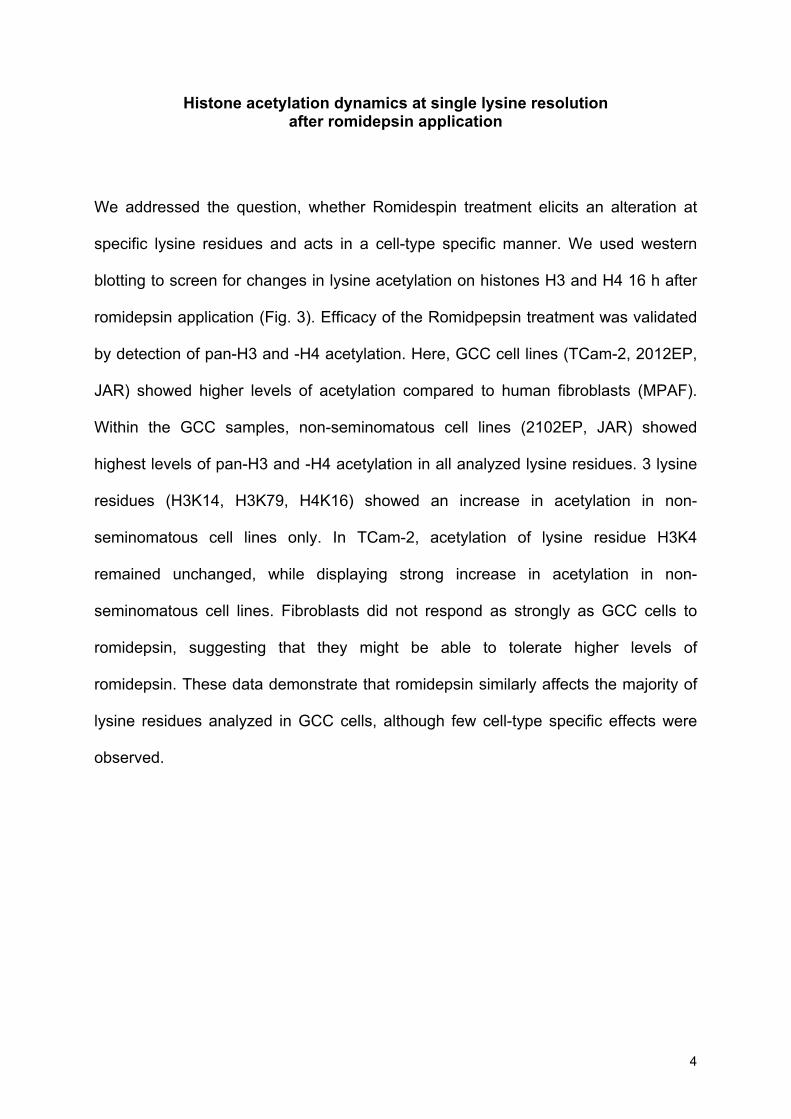
Histone acetylation dynamics at single lysine resolution after romidepsin application
We addressed the question, whether Romidespin treatment elicits an alteration at
specific lysine residues and acts in a cell-type specific manner. We used western
blotting to screen for changes in lysine acetylation on histones H3 and H4 16 h after
romidepsin application (Fig. 3). Efficacy of the Romidpepsin treatment was validated
by detection of pan-H3 and -H4 acetylation. Here, GCC cell lines (TCam-2, 2012EP,
JAR) showed higher levels of acetylation compared to human fibroblasts (MPAF).
Within the GCC samples, non-seminomatous cell lines (2102EP, JAR) showed
highest levels of pan-H3 and -H4 acetylation in all analyzed lysine residues. 3 lysine
residues (H3K14, H3K79, H4K16) showed an increase in acetylation in non-
seminomatous cell lines only. In TCam-2, acetylation of lysine residue H3K4
remained unchanged, while displaying strong increase in acetylation in non-
seminomatous cell lines. Fibroblasts did not respond as strongly as GCC cells to
romidepsin, suggesting that they might be able to tolerate higher levels of
romidepsin. These data demonstrate that romidepsin similarly affects the majority of
lysine residues analyzed in GCC cells, although few cell-type specific effects were
observed.
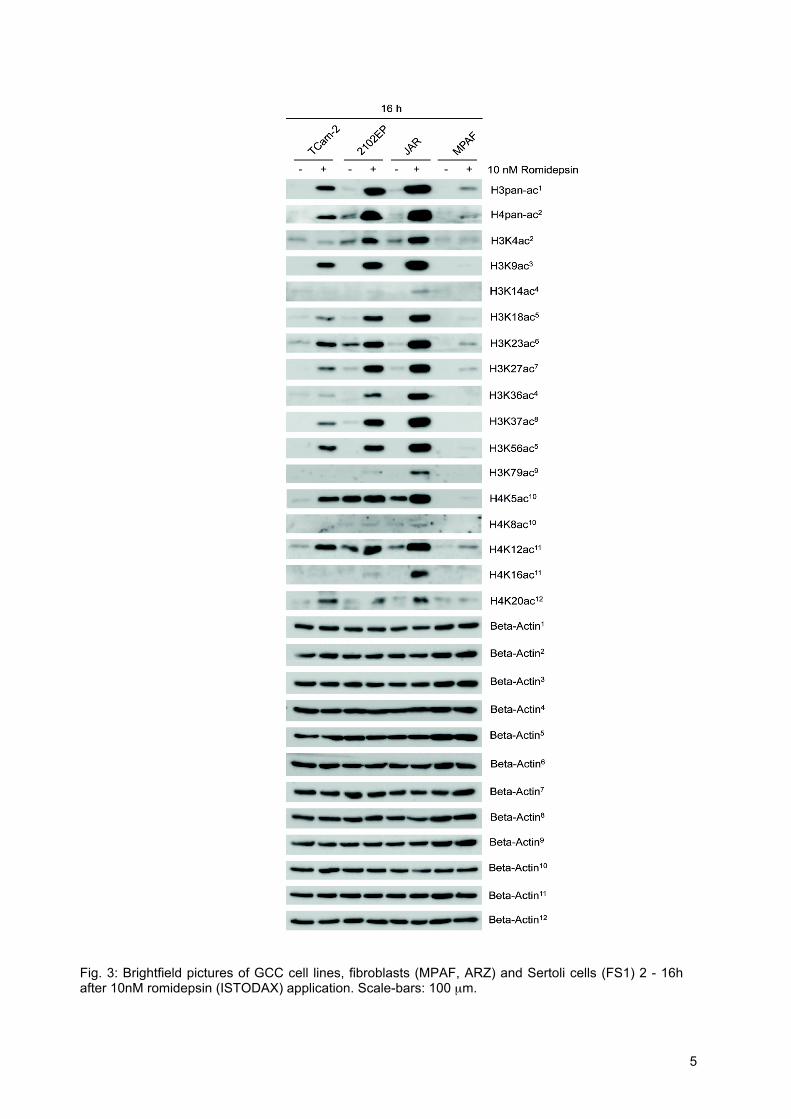
5
Fig. 3: Brightfield pictures of GCC cell lines, fibroblasts (MPAF, ARZ) and Sertoli cells (FS1) 2 - 16h after 10nM romidepsin (ISTODAX) application. Scale-bars: 100 µm.
6
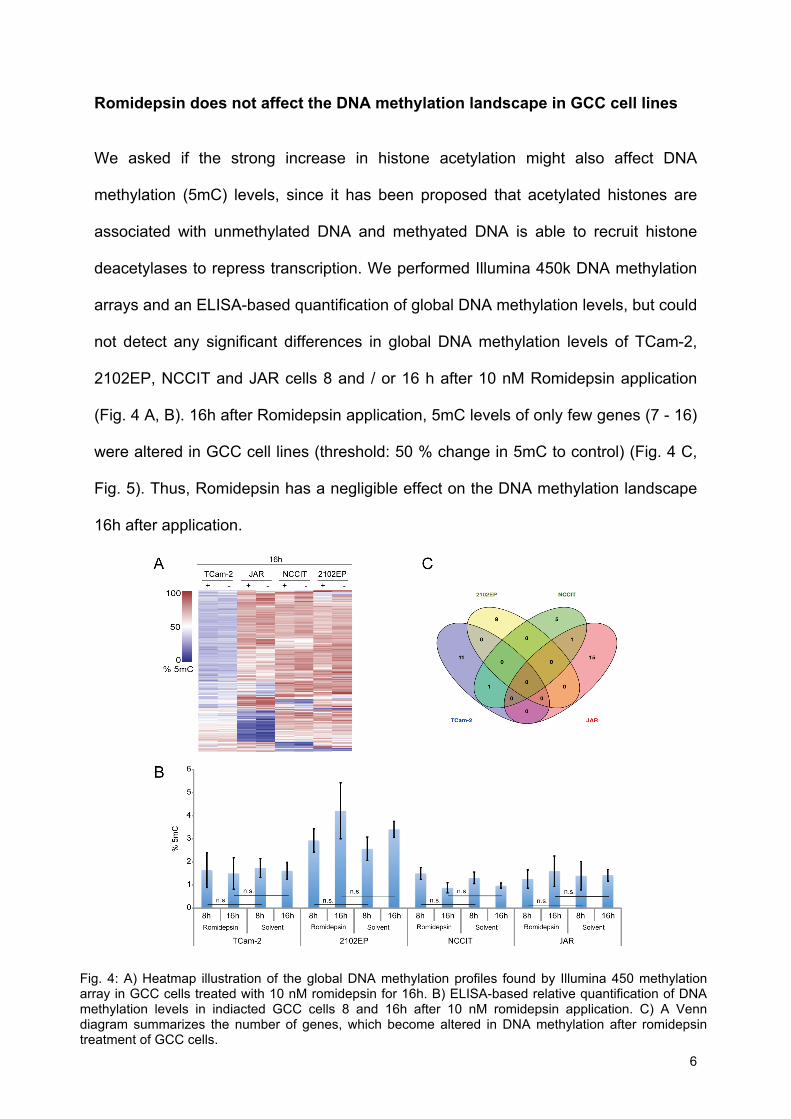
Romidepsin does not affect the DNA methylation landscape in GCC cell lines We asked if the strong increase in histone acetylation might also affect DNA
methylation (5mC) levels, since it has been proposed that acetylated histones are
associated with unmethylated DNA and methyated DNA is able to recruit histone
deacetylases to repress transcription. We performed Illumina 450k DNA methylation
arrays and an ELISA-based quantification of global DNA methylation levels, but could
not detect any significant differences in global DNA methylation levels of TCam-2,
2102EP, NCCIT and JAR cells 8 and / or 16 h after 10 nM Romidepsin application
(Fig. 4 A, B). 16h after Romidepsin application, 5mC levels of only few genes (7 - 16)
were altered in GCC cell lines (threshold: 50 % change in 5mC to control) (Fig. 4 C,
Fig. 5). Thus, Romidepsin has a negligible effect on the DNA methylation landscape
16h after application.
Fig. 4: A) Heatmap illustration of the global DNA methylation profiles found by Illumina 450 methylation array in GCC cells treated with 10 nM romidepsin for 16h. B) ELISA-based relative quantification of DNA methylation levels in indiacted GCC cells 8 and 16h after 10 nM romidepsin application. C) A Venn diagram summarizes the number of genes, which become altered in DNA methylation after romidepsin treatment of GCC cells.
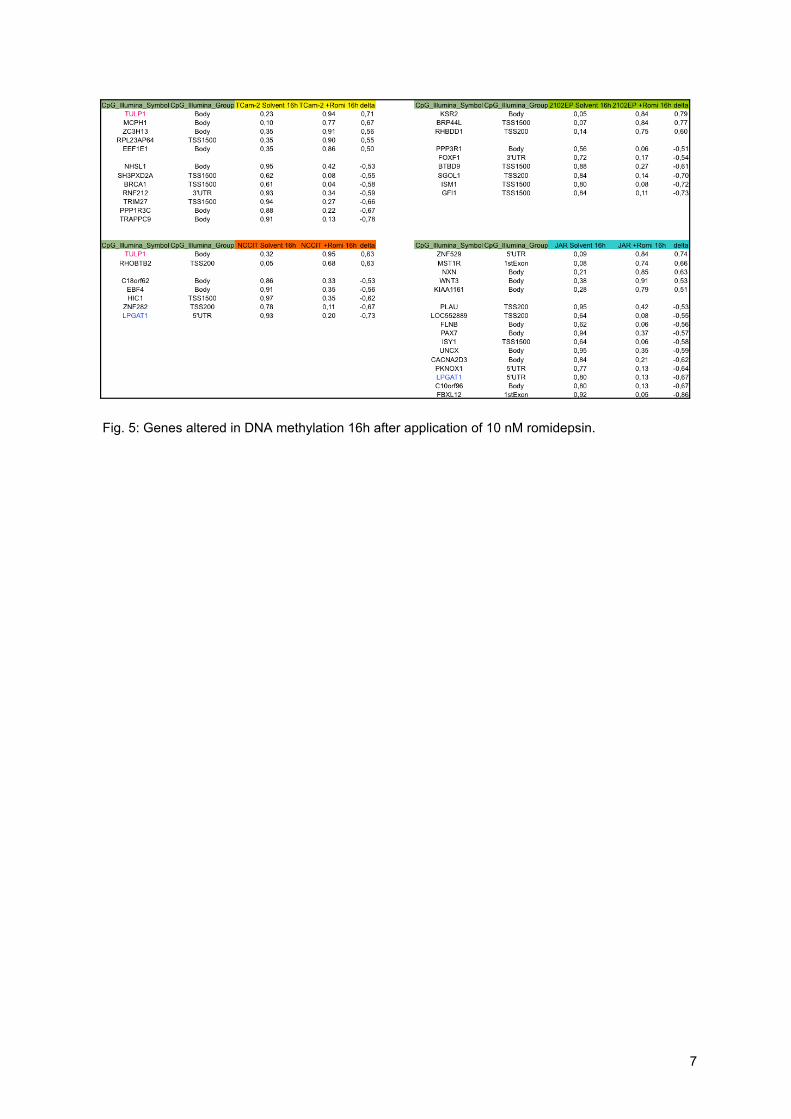
7
Fig. 5: Genes altered in DNA methylation 16h after application of 10 nM romidepsin.
8
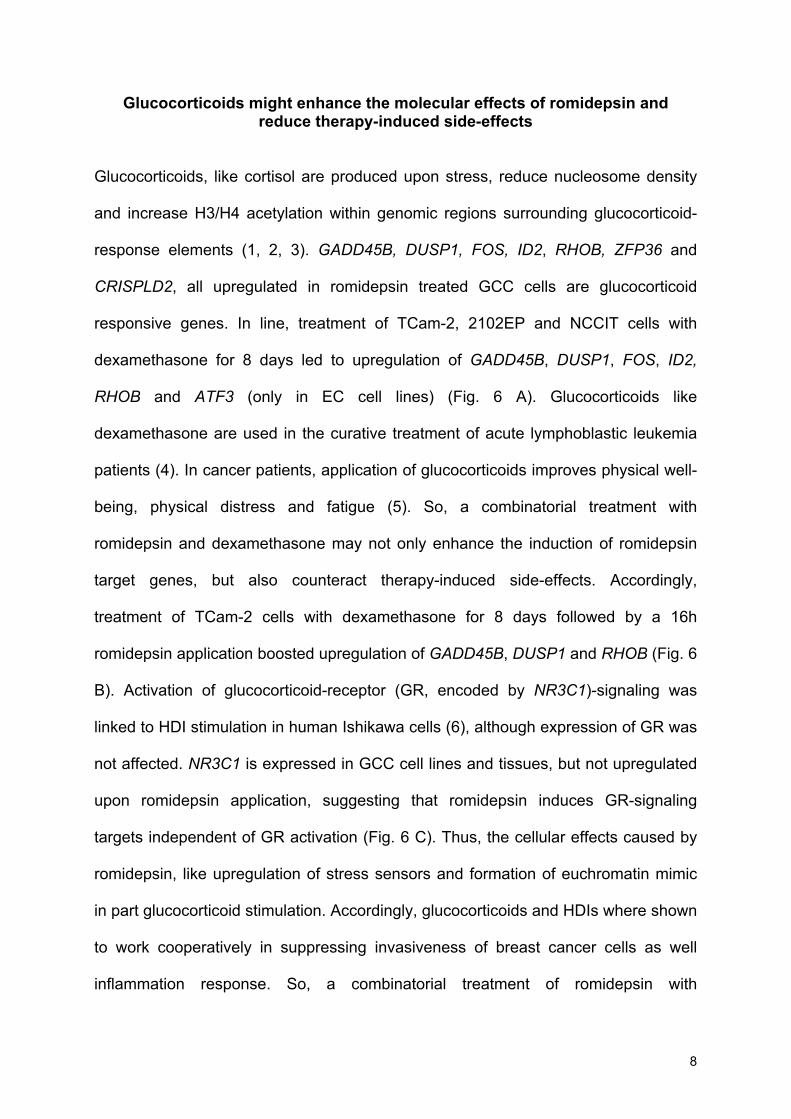
Glucocorticoids might enhance the molecular effects of romidepsin and reduce therapy-induced side-effects
Glucocorticoids, like cortisol are produced upon stress, reduce nucleosome density
and increase H3/H4 acetylation within genomic regions surrounding glucocorticoid-
response elements (1, 2, 3). GADD45B, DUSP1, FOS, ID2, RHOB, ZFP36 and
CRISPLD2, all upregulated in romidepsin treated GCC cells are glucocorticoid
responsive genes. In line, treatment of TCam-2, 2102EP and NCCIT cells with
dexamethasone for 8 days led to upregulation of GADD45B, DUSP1, FOS, ID2,
RHOB and ATF3 (only in EC cell lines) (Fig. 6 A). Glucocorticoids like
dexamethasone are used in the curative treatment of acute lymphoblastic leukemia
patients (4). In cancer patients, application of glucocorticoids improves physical well-
being, physical distress and fatigue (5). So, a combinatorial treatment with
romidepsin and dexamethasone may not only enhance the induction of romidepsin
target genes, but also counteract therapy-induced side-effects. Accordingly,
treatment of TCam-2 cells with dexamethasone for 8 days followed by a 16h
romidepsin application boosted upregulation of GADD45B, DUSP1 and RHOB (Fig. 6
B). Activation of glucocorticoid-receptor (GR, encoded by NR3C1)-signaling was
linked to HDI stimulation in human Ishikawa cells (6), although expression of GR was
not affected. NR3C1 is expressed in GCC cell lines and tissues, but not upregulated
upon romidepsin application, suggesting that romidepsin induces GR-signaling
targets independent of GR activation (Fig. 6 C). Thus, the cellular effects caused by
romidepsin, like upregulation of stress sensors and formation of euchromatin mimic
in part glucocorticoid stimulation. Accordingly, glucocorticoids and HDIs where shown
to work cooperatively in suppressing invasiveness of breast cancer cells as well
inflammation response. So, a combinatorial treatment of romidepsin with

9
dexamethasone does only enhance the induction of romidepsin target genes, but
may also counteract romidepsin induced side-effects.
Fig. 6: A) qRT-PCR analysis of indicated genes 8 days after dexamethasone treatment of GCC cell lines. B) qRT-PCR analysis of indicated genes 8 days after dexamethasone treatment followed by a 16h romidepsin application. C) Detection of the GR protein in GCC cells (+ / - 10 nM romidepsin) (left side) and in normal testis tissue (NTT) and GCC tissues (right side).
10
Material and Methods
Most of the experimental setups were described in the corresponding publication
(Nettersheim et al., 2016, Oncotarget). Here, only new / unpublished methods will be
described.
Illumina 450k DNA methylation array
The Illumina DNA methylation array analyses were performed as published before
(Nettersheim et al., 2015, PLoS Genetics). 500 ng of genomic DNA were used for
sodium-bisulfite conversion. Samples were processed on Illumina's (San Diego,
California, USA) human ‚Infinium Methylation 450k’ bead chips. All data were
analyzed using ‚Bioconductor R’ (www.bioconductor.org). A subset quantile
normalization approach developed by N. Touleimat and J. Tost was applied (7).
Expression values were quantile normalized using the ‚limma’ software package
(‘Linear Models for Microarray Data’, www.bioconductor.org). For analysis of 450k
microarray data, beta-values were transformed to M-values (8). Microarray data sets
are publically available via GEO (ncbi.nlm.nih.gov/geo/) (GSE76709).
Quantification of DNA methylation levels
DNA methylation (5mC) levels were quantified according to the manual of the
‘MethylFlash Methylated DNA 5-mC Quantification Kit (Colorimetric)’ (Epigentek).
200ng of genomic DNA was used. All samples were analyzed in triplicates.
Dexamethasone application
Dexamethasone (Sigma-Aldrich, Taufkirchen, Germany) was solved in 100%
ethanol.
11
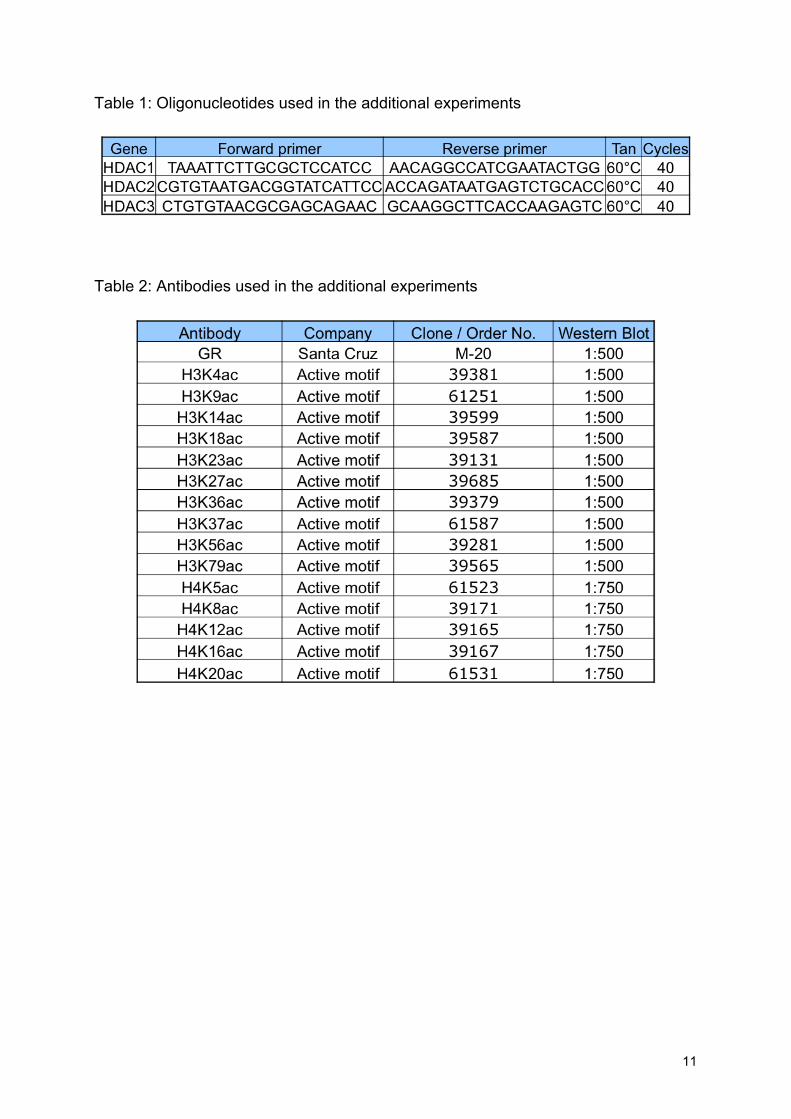
Table 1: Oligonucleotides used in the additional experiments
Table 2: Antibodies used in the additional experiments
12
Literature
1. Himes BE, Jiang X, Wagner P, Hu R, Wang Q, Klanderman B et al. RNA-Seq Transcriptome Profiling Identifies CRISPLD2 as a Glucocorticoid Responsive Gene that Modulates Cytokine Function in Airway Smooth Muscle Cells. PLoS ONE 2014; 9: e99625–13.
2. Pottier N, Yang W, Assem M, Panetta JC, Pei D, Paugh SW et al. The SWI/SNF Chromatin-Remodeling Complex and Glucocorticoid Resistance in Acute Lymphoblastic Leukemia. JNCI Journal of the National Cancer Institute 2008; 100: 1792–1803.
3. Wang J-C, Derynck MK, Nonaka DF, Khodabakhsh DB, Haqq C, Yamamoto KR. Chromatin immunoprecipitation (ChIP) scanning identifies primary glucocorticoid receptor target genes. Proc Natl Acad Sci U S A 2004; 101: 15603–15608.
4. Reddy TE, Pauli F, Sprouse RO, Neff NF, Newberry KM, Garabedian MJ et al. Genomic determination of the glucocorticoid response reveals unexpected mechanisms of gene regulation. Genome Research 2009; 19: 2163–2171.
5. Yennurajalingam S, Frisbee-Hume S, Palmer JL, Delgado-Guay MO, Bull J, Phan AT et al. Reduction of Cancer-Related Fatigue With Dexamethasone: A Double-Blind, Randomized, Placebo-Controlled Trial in Patients With Advanced Cancer. Journal of Clinical Oncology 2013; 31: 3076–3082.
6. Rocha W. Opposite effects of HDAC inhibitors on glucocorticoid and estrogen signaling in human endometrial Ishikawa cells. Molecular Pharmacology 2005; : 1–11.
7. Touleimat N, Tost J. Complete pipeline for Infinium(®) Human Methylation 450K BeadChip data processing using subset quantile normalization for accurate DNA methylation estimation. Epigenomics. Future Medicine Ltd London, UK; 2012;4:325–41.
8. Du P, Zhang X, Huang C-C, Jafari N, Kibbe WA, Hou L, et al. Comparison of Beta-value and M-value methods for quantifying methylation levels by microarray analysis. BMC Bioinformatics. BioMed Central Ltd; 2010;11:587.


![QRN Op Bretzelburg [Unpublished]](https://img.pdfslide.net/doc/110x75/55cf92b4550346f57b98e15f/qrn-op-bretzelburg-unpublished.jpg)