Embed Size (px)
Citation preview
UNR, MATH/STAT 352, Spring 2007
UNR, MATH/STAT 352, Spring 2007
UNR, MATH/STAT 352, Spring 2007
UNR, MATH/STAT 352, Spring 2007

UNR, MATH/STAT 352, Spring 2007
UNR, MATH/STAT 352, Spring 2007
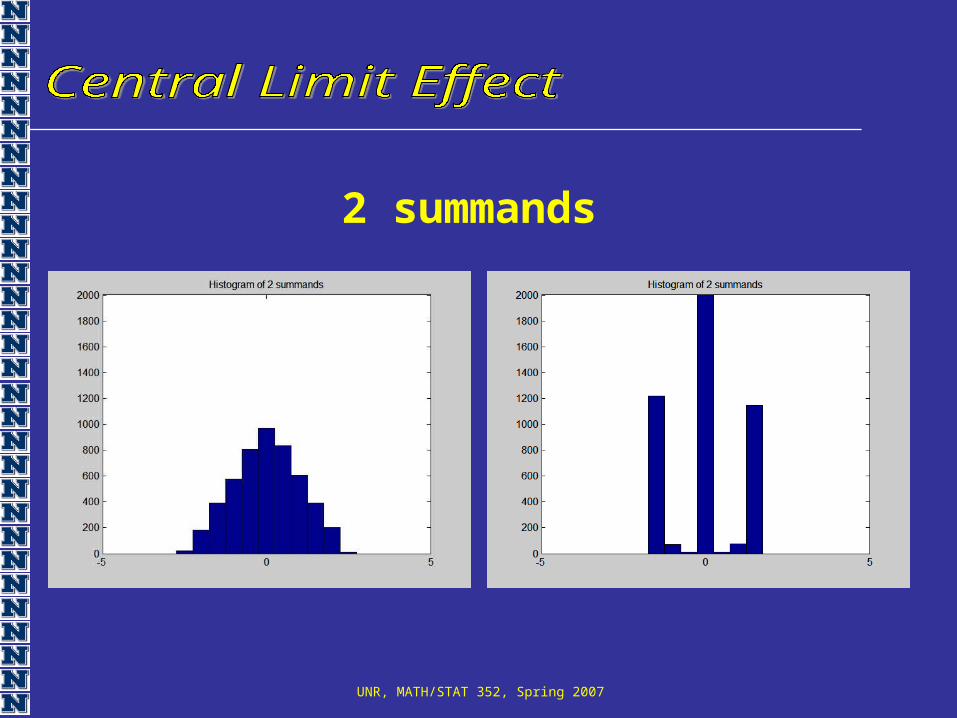
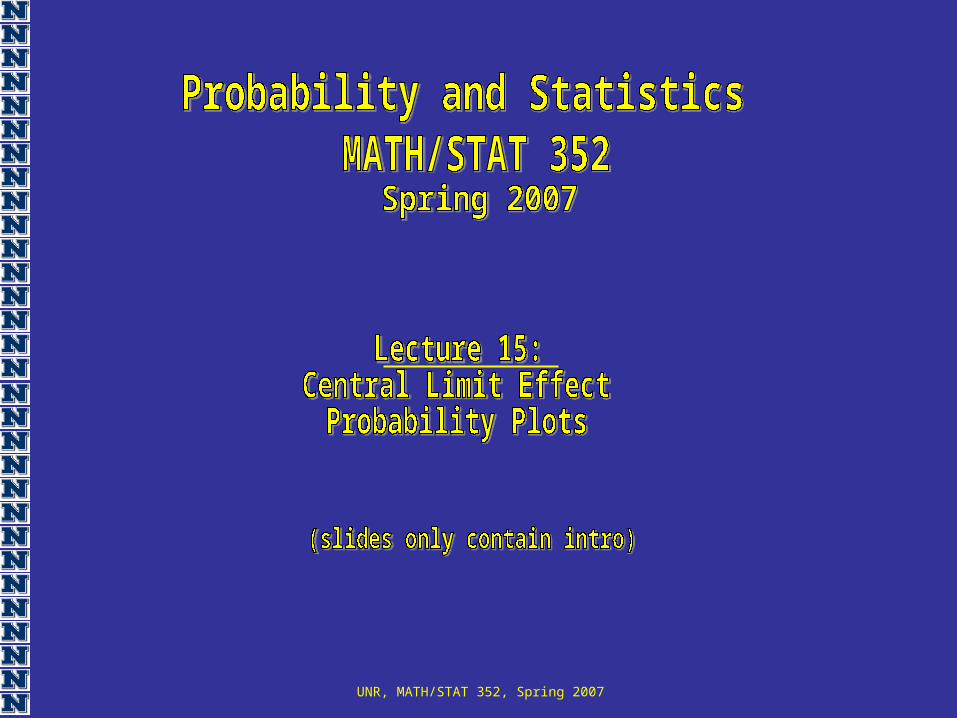
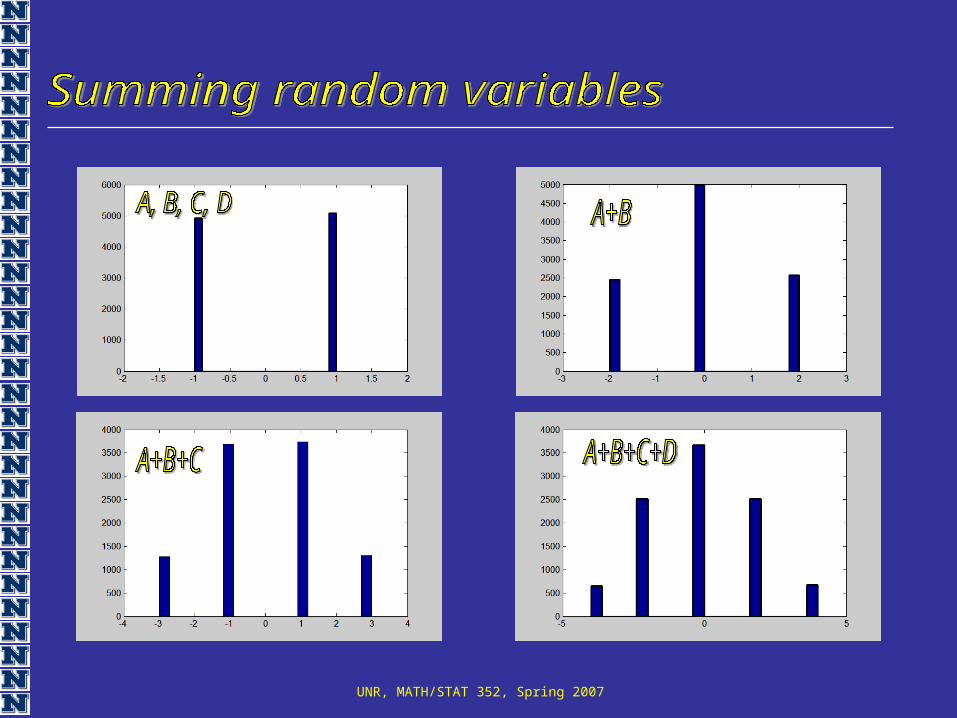
2 summands
UNR, MATH/STAT 352, Spring 2007
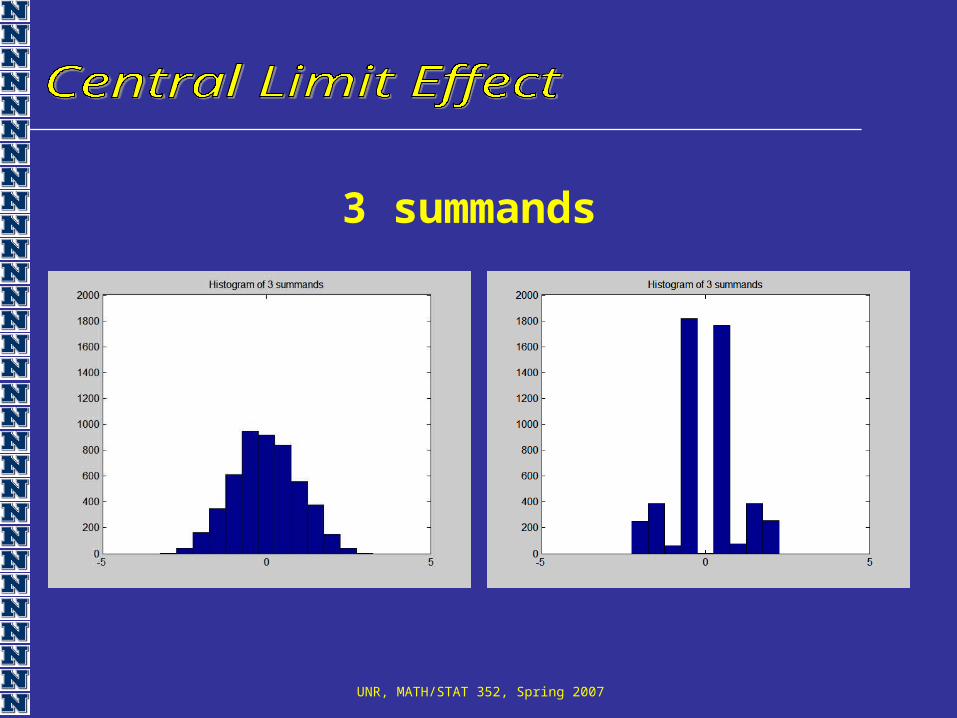
3 summands
UNR, MATH/STAT 352, Spring 2007

4 summands
UNR, MATH/STAT 352, Spring 2007
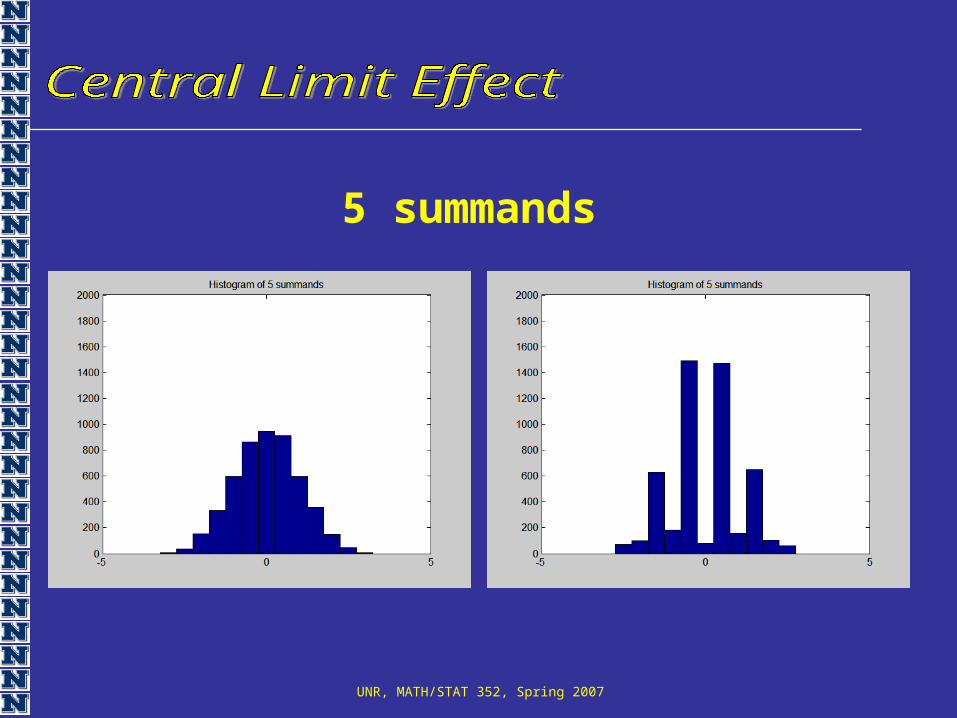
5 summands
UNR, MATH/STAT 352, Spring 2007
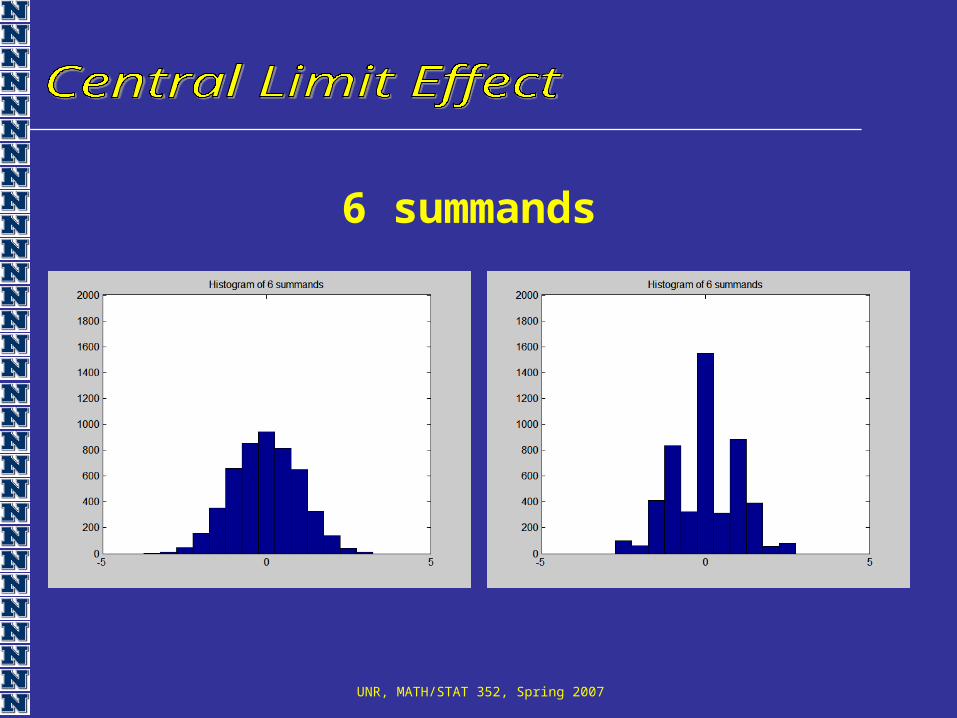
6 summands
UNR, MATH/STAT 352, Spring 2007
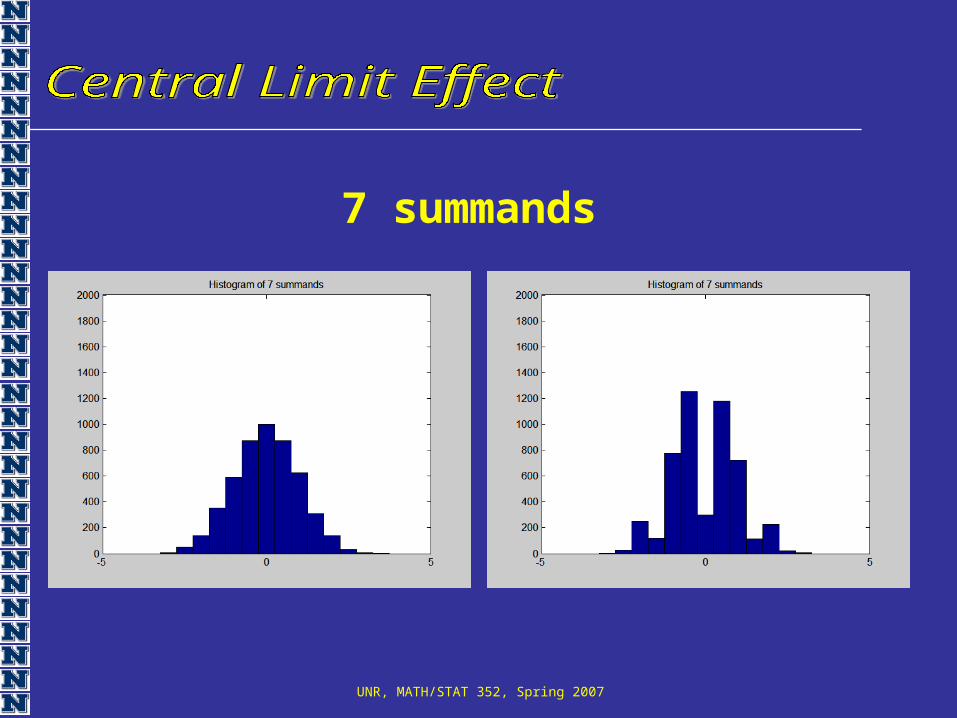
7 summands
UNR, MATH/STAT 352, Spring 2007
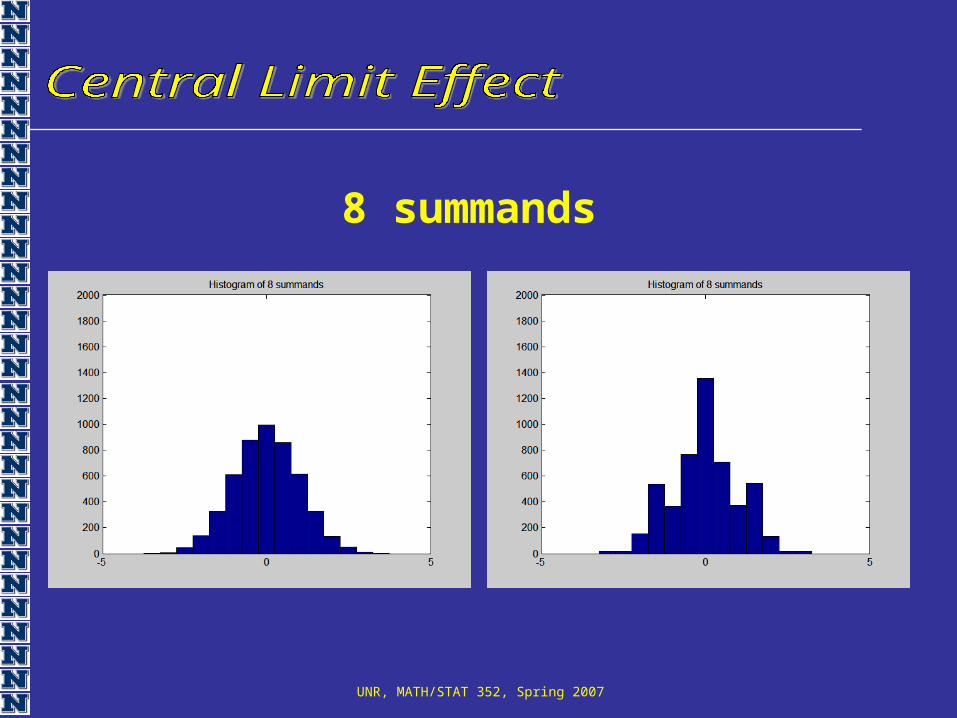
8 summands
UNR, MATH/STAT 352, Spring 2007
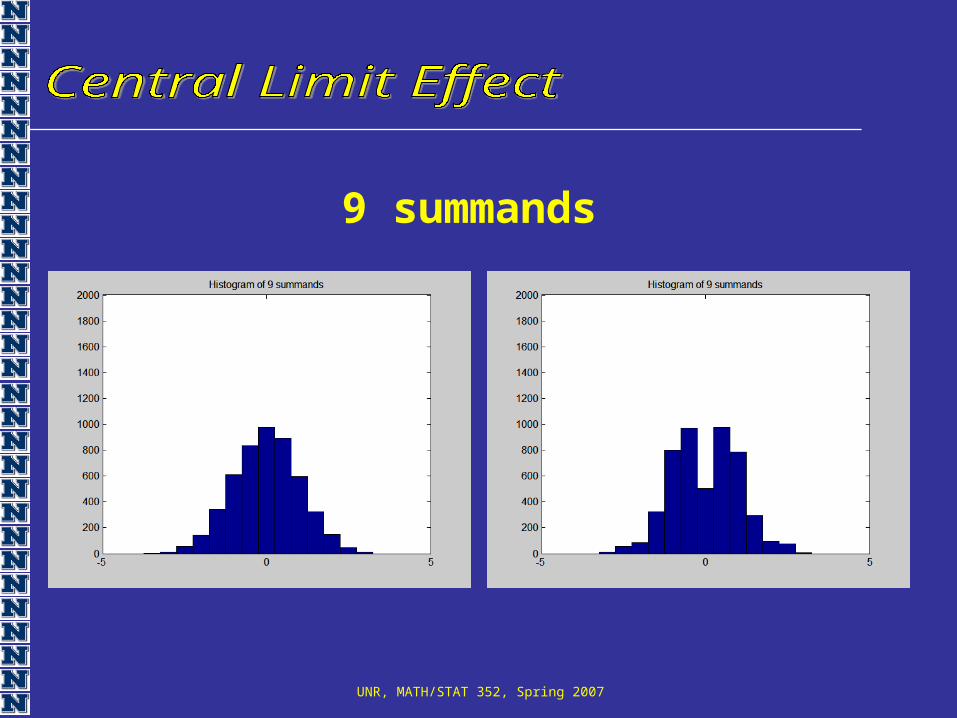
9 summands
UNR, MATH/STAT 352, Spring 2007
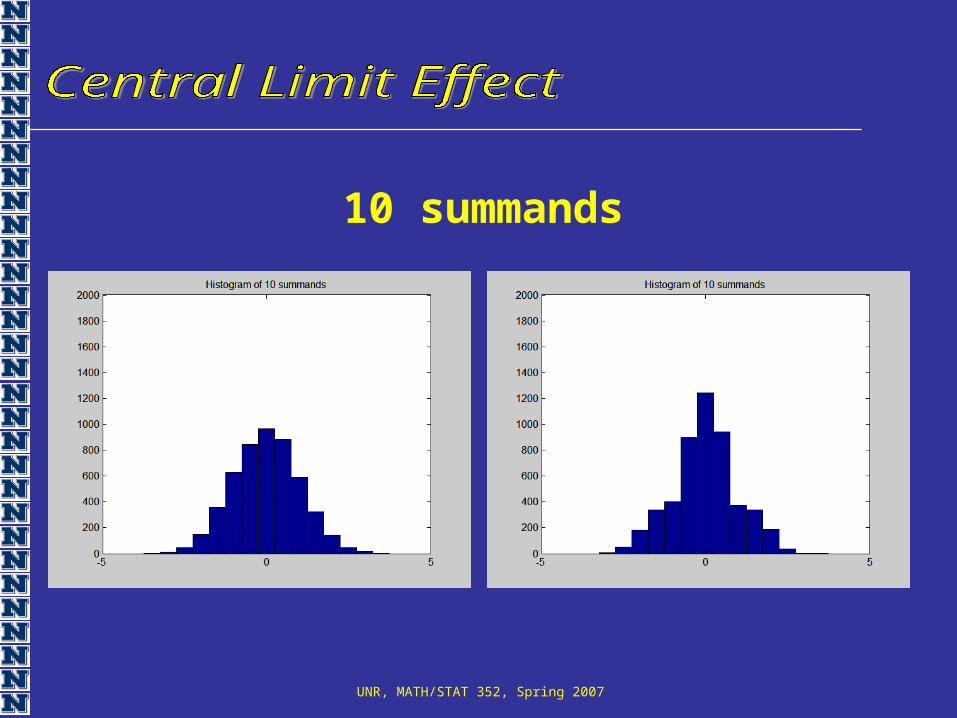
10 summands
UNR, MATH/STAT 352, Spring 2007
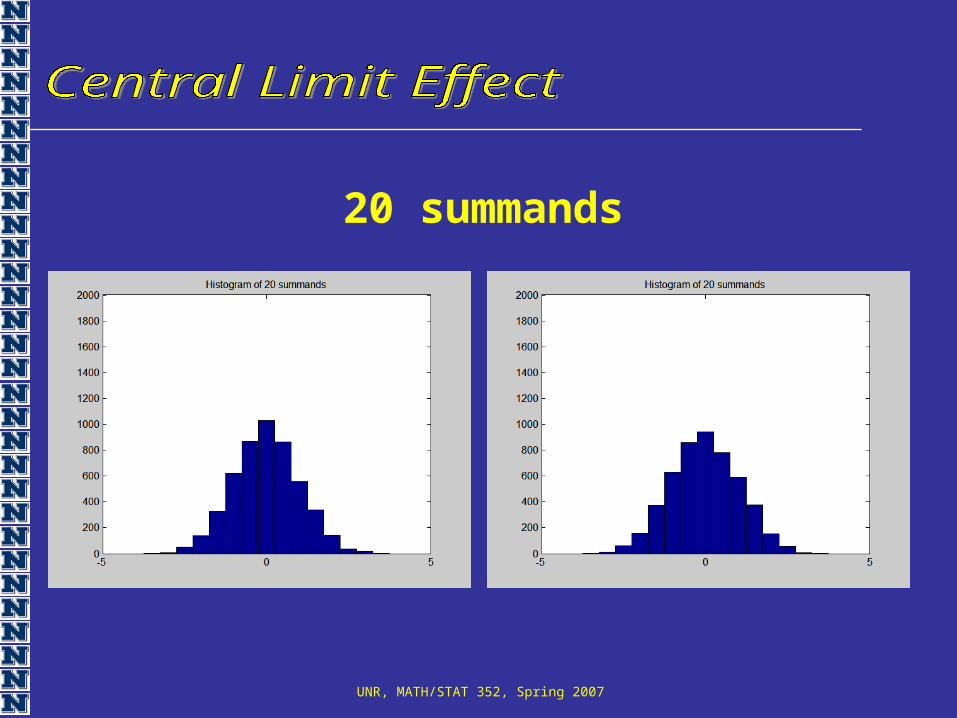
20 summands
UNR, MATH/STAT 352, Spring 2007
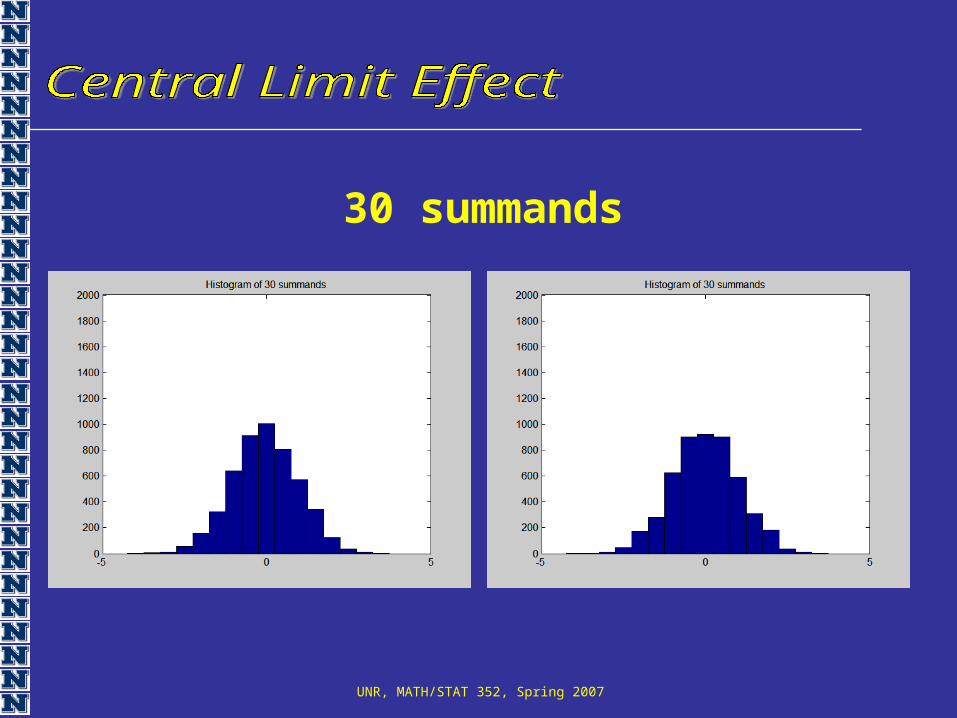
30 summands
UNR, MATH/STAT 352, Spring 2007
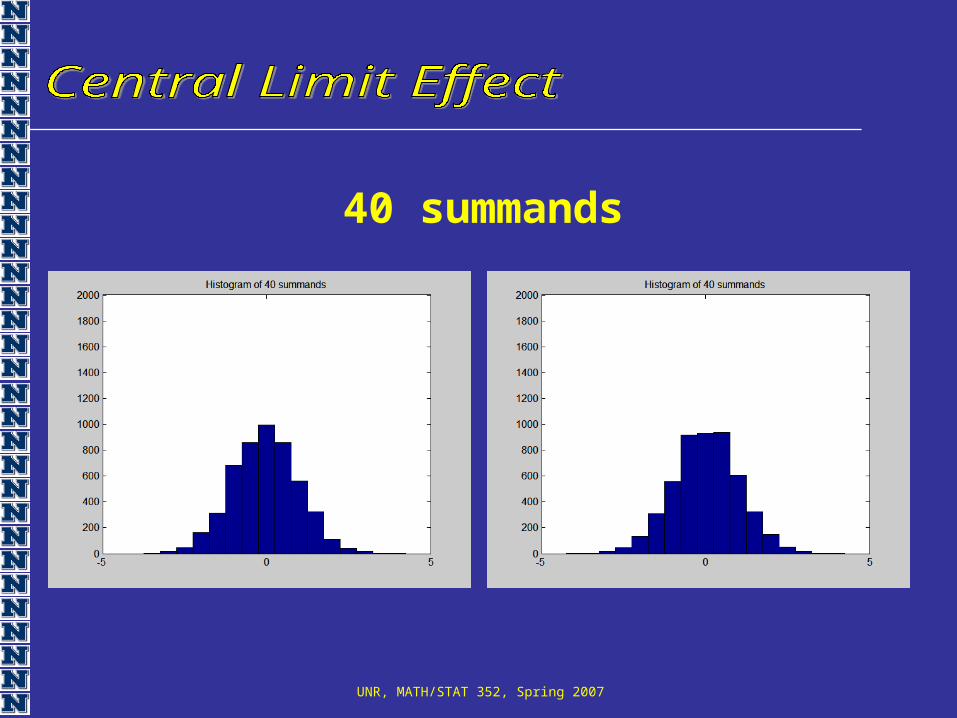
40 summands
UNR, MATH/STAT 352, Spring 2007
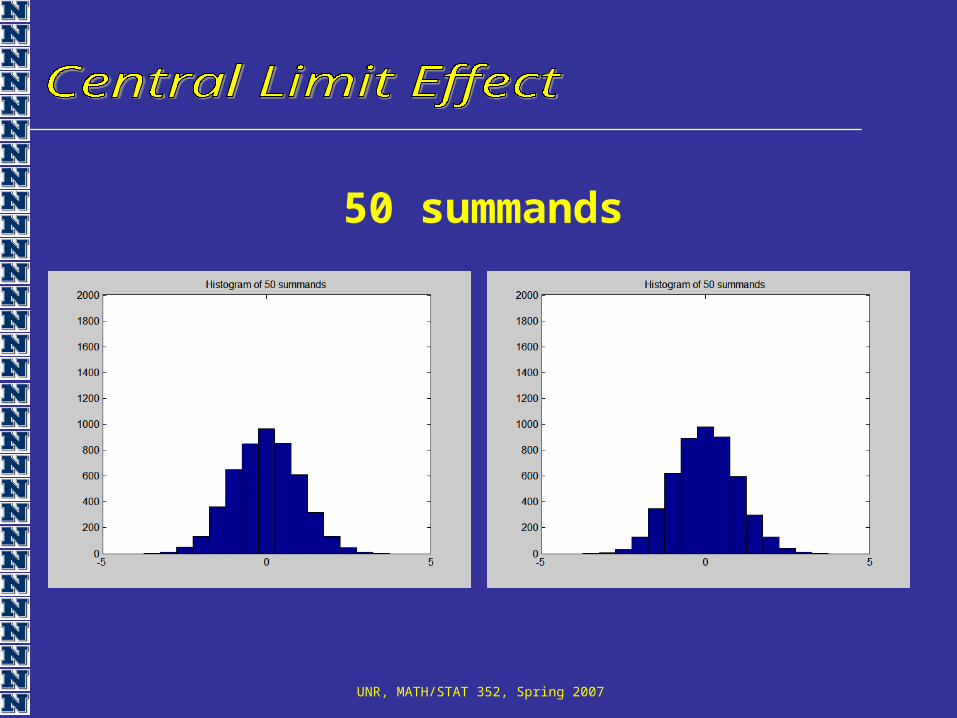
50 summands
UNR, MATH/STAT 352, Spring 2007
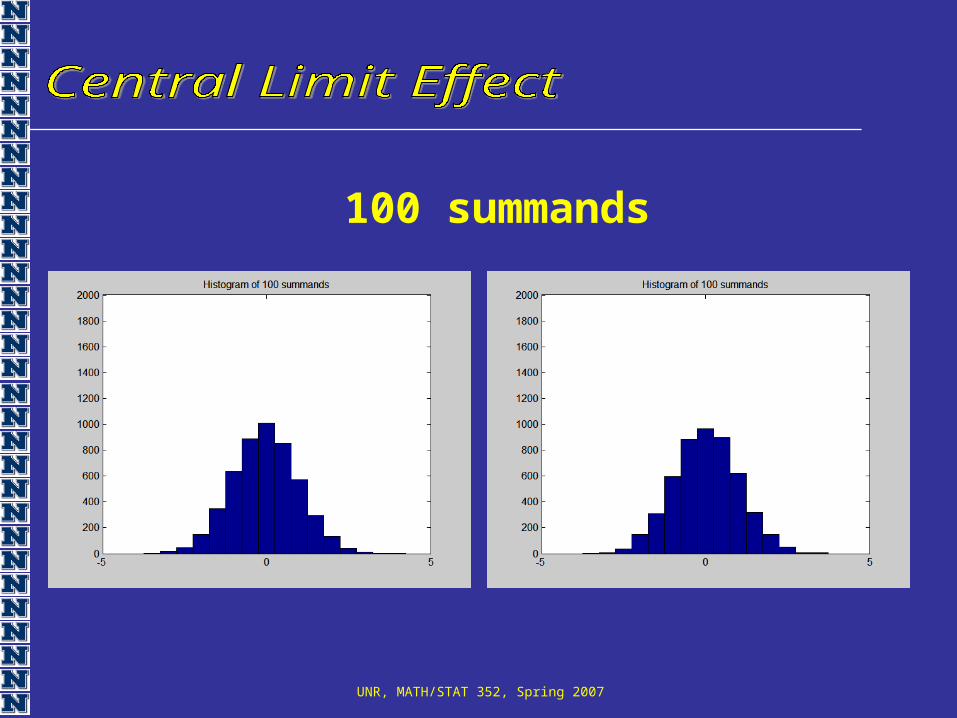
100 summands
UNR, MATH/STAT 352, Spring 2007
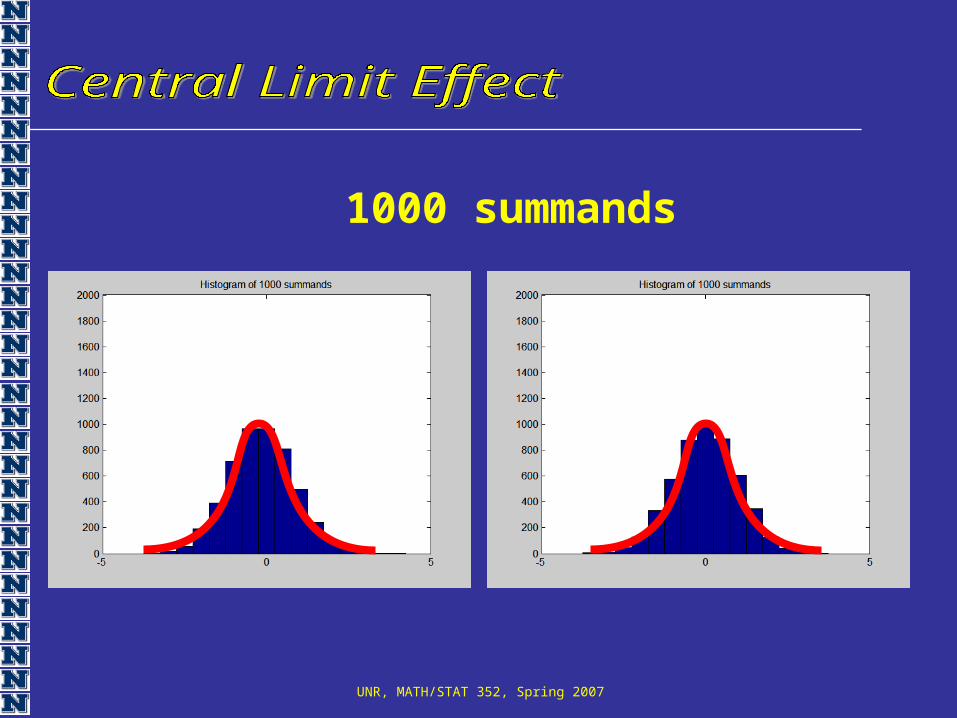
1000 summands
UNR, MATH/STAT 352, Spring 2007
UNR, MATH/STAT 352, Spring 2007
UNR, MATH/STAT 352, Spring 2007
Consider Normal random variable X with mean 5 and variance 1
UNR, MATH/STAT 352, Spring 2007
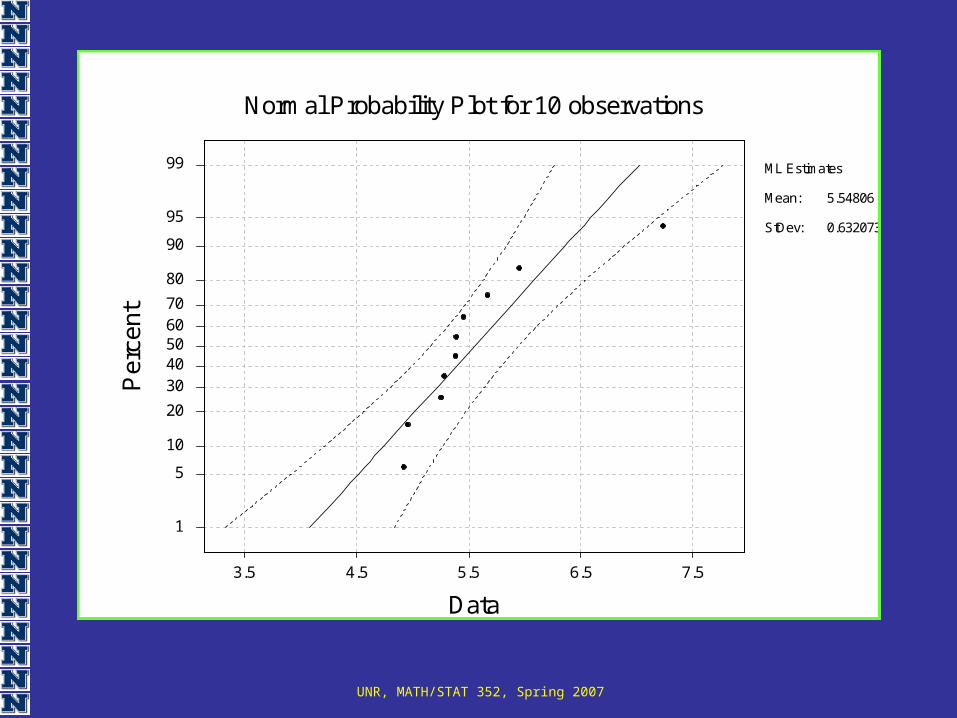
7.56.55.54.53.5
99
95
90
80
7060504030
20
10
5
1
Data
Per
cent
Normal Probability Plot for 10 observations
ML Estimates
Mean:
StDev:
5.54806
0.632073
UNR, MATH/STAT 352, Spring 2007
8765432
99
95
90
80
7060504030
20
10
5
1
Data
Per
cent
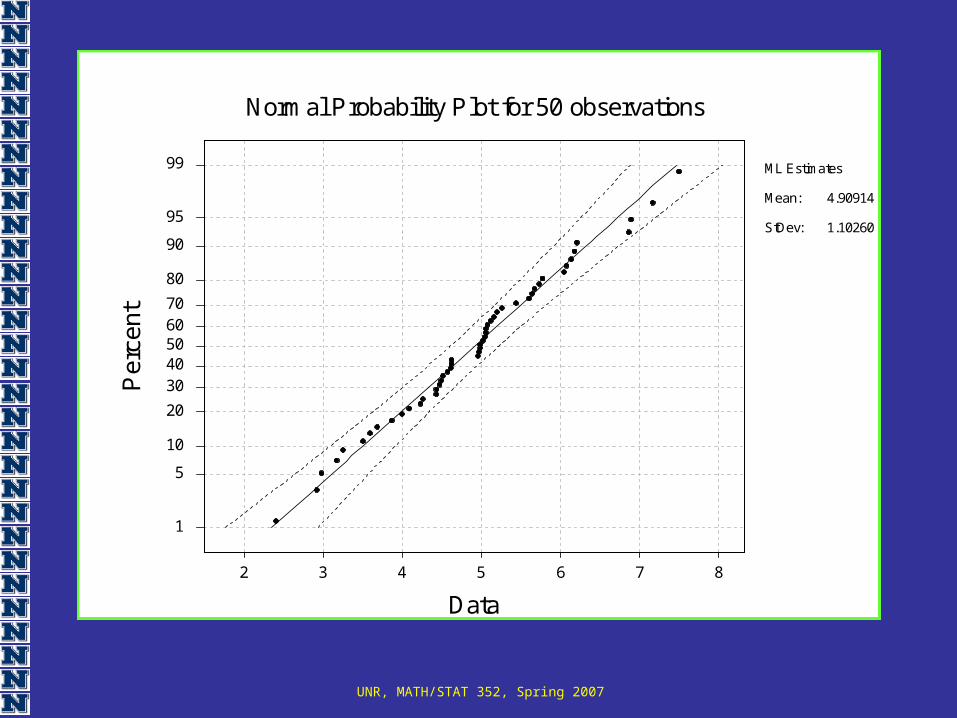
Normal Probability Plot for 50 observations
ML Estimates
Mean:
StDev:
4.90914
1.10260
UNR, MATH/STAT 352, Spring 2007
8765432
99
9590
80706050403020
10 5
1
Data
Per
cent
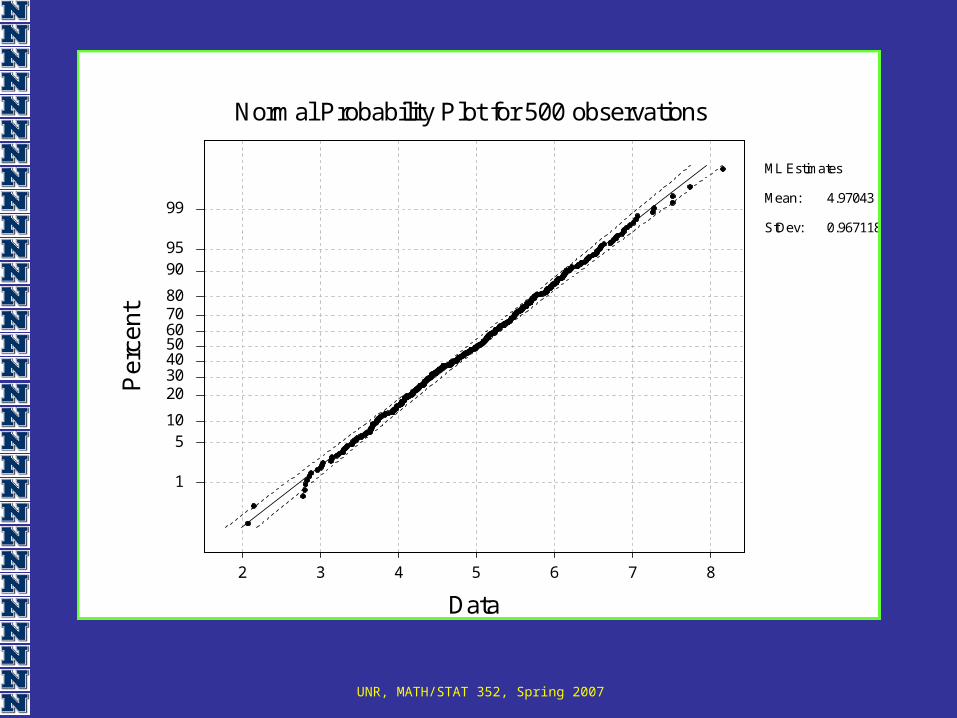
Normal Probability Plot for 500 observations
ML Estimates
Mean:
StDev:
4.97043
0.967118
UNR, MATH/STAT 352, Spring 2007
Consider Normal random variable X with mean 5 and variance 1,
consider now Y = X2
UNR, MATH/STAT 352, Spring 2007
55453525155
99
95
90
80
7060504030
20
10
5
1
Data
Per
cent
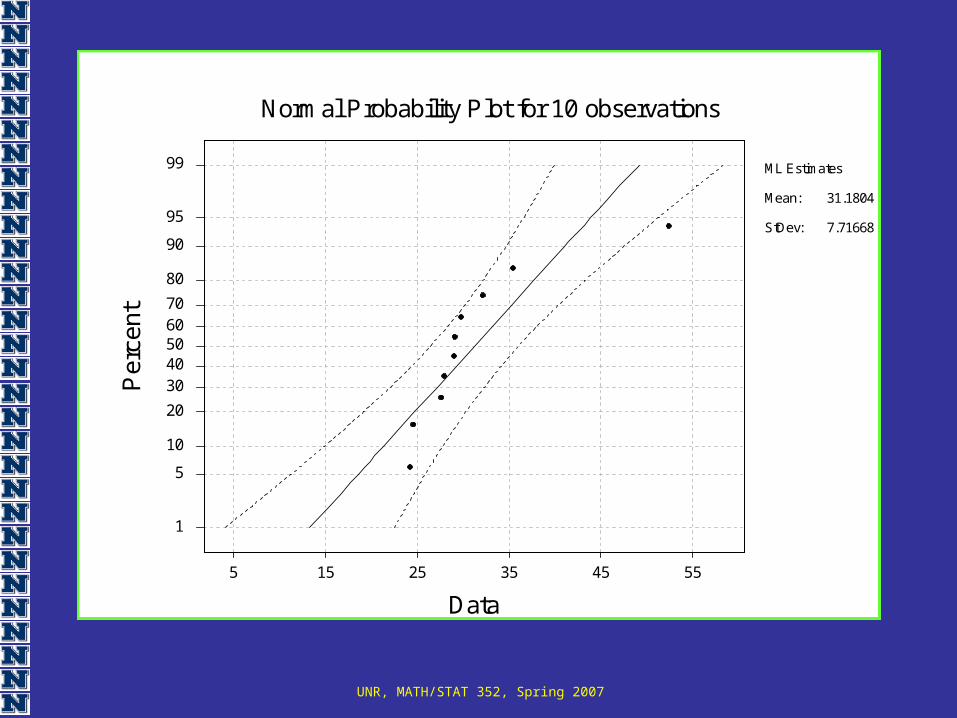
Normal Probability Plot for 10 observations
ML Estimates
Mean:
StDev:
31.1804
7.71668
50403020100
99
95
90
80
7060504030
20
10
5
1
Data
Per
cent
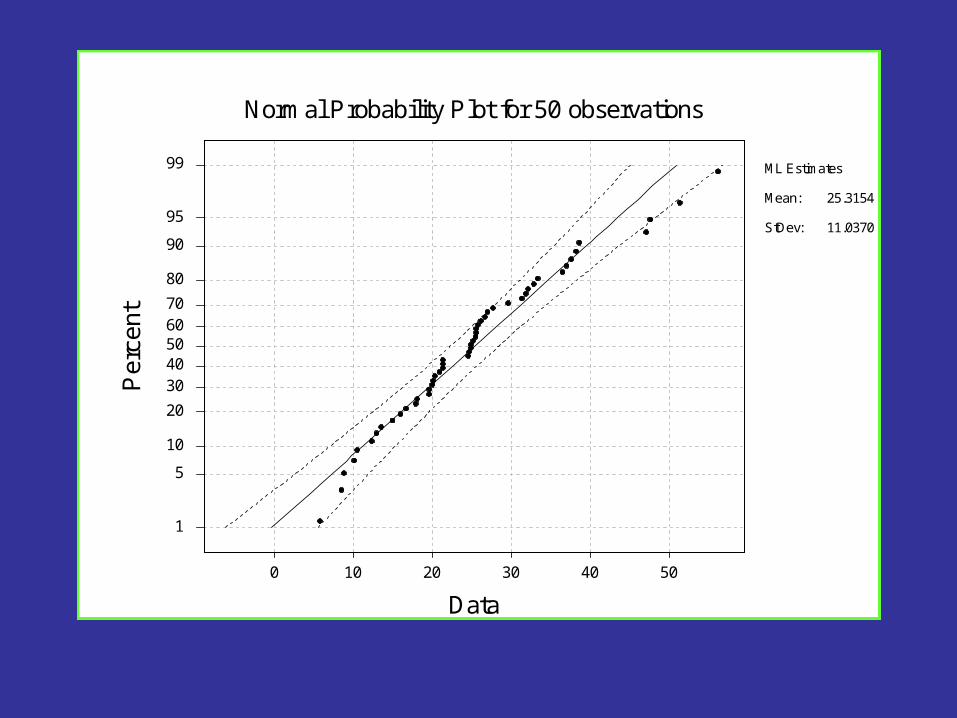
Normal Probability Plot for 50 observations
ML Estimates
Mean:
StDev:
25.3154
11.0370
6040200
99
9590
80706050403020
10 5
1
Data
Per
cent
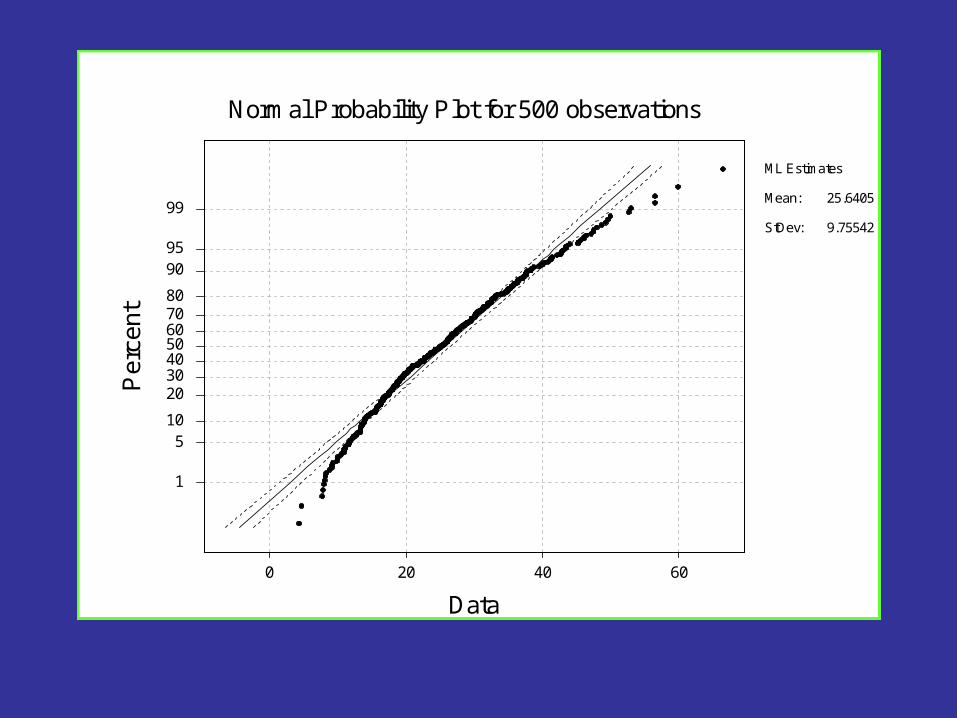
Normal Probability Plot for 500 observations
ML Estimates
Mean:
StDev:
25.6405
9.75542
UNR, MATH/STAT 352, Spring 2007
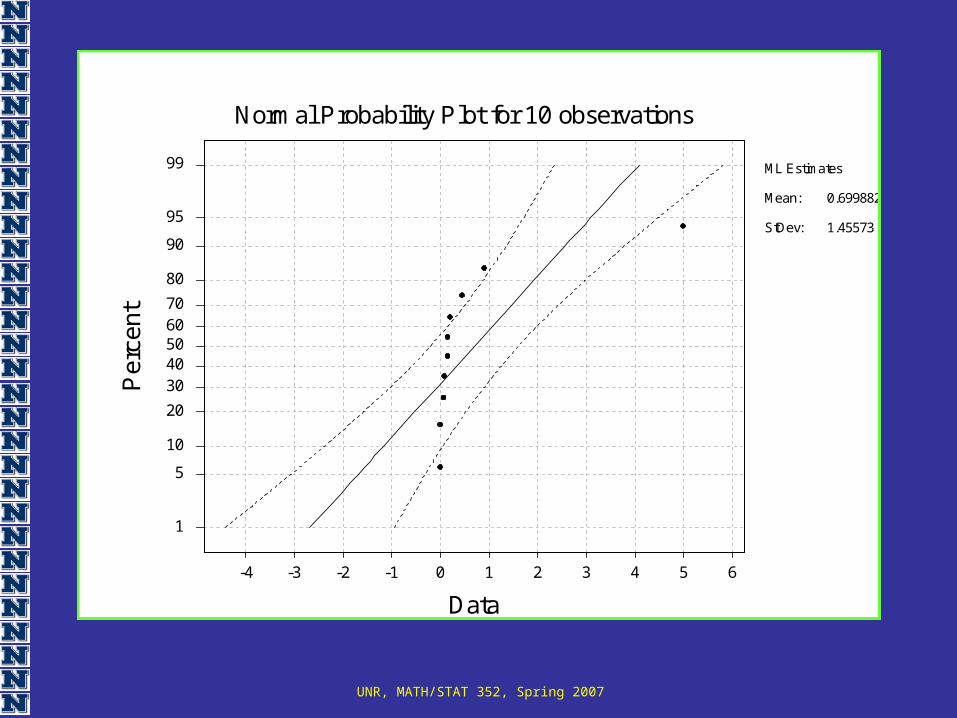
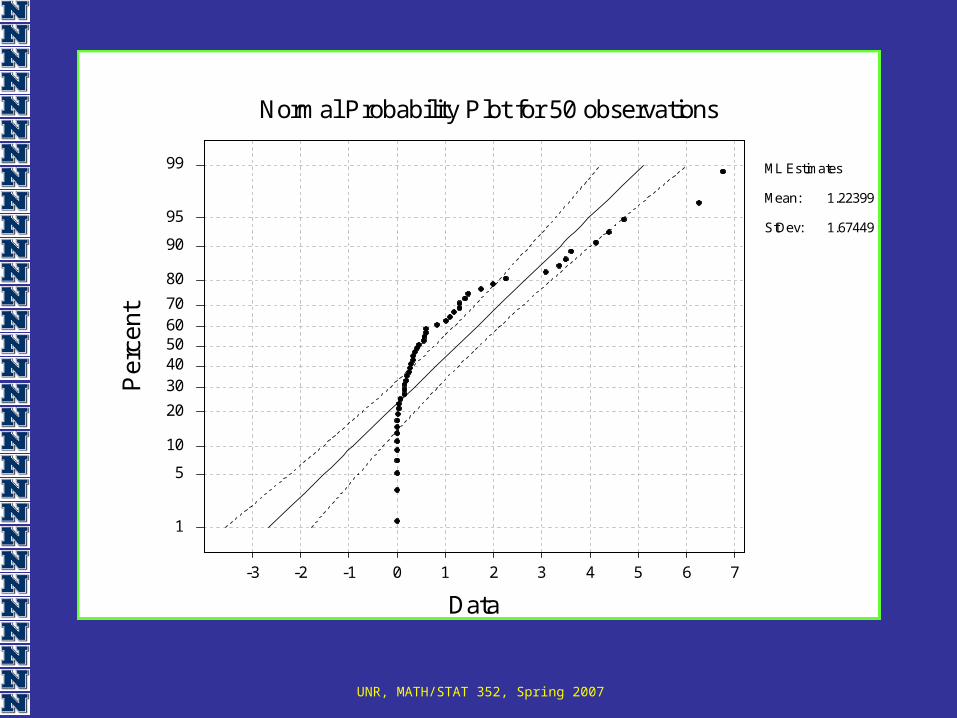
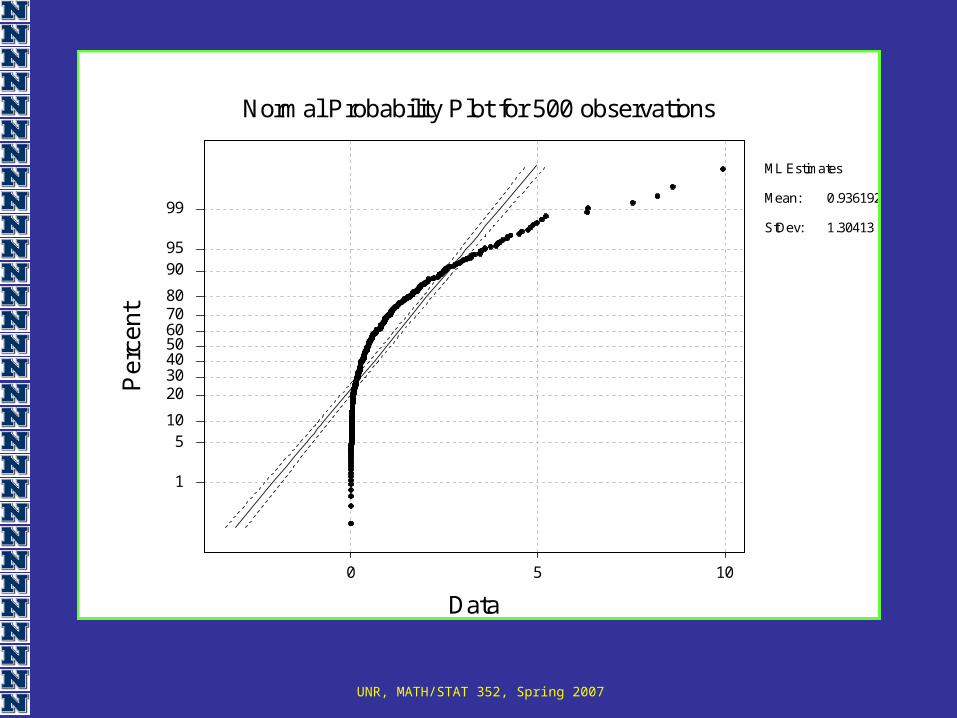
Consider Normal random variable X with mean 5 and variance 1,
consider now Y = (X-5)2
UNR, MATH/STAT 352, Spring 2007
6543210-1-2-3-4
99
95
90
80
7060504030
20
10
5
1
Data
Per
cent
Normal Probability Plot for 10 observations
ML Estimates
Mean:
StDev:
0.699882
1.45573
UNR, MATH/STAT 352, Spring 2007
76543210-1-2-3
99
95
90
80
7060504030
20
10
5
1
Data
Per
cent
Normal Probability Plot for 50 observations
ML Estimates
Mean:
StDev:
1.22399
1.67449
UNR, MATH/STAT 352, Spring 2007
1050
99
9590
80706050403020
10 5
1
Data
Per
cent
Normal Probability Plot for 500 observations
ML Estimates
Mean:
StDev:
0.936192
1.30413


![78 STAT. ] PUBLIC LAW 88-352-JULY 2, 1964 241 · 78 STAT. ] PUBLIC LAW 88-352-JULY 2, 1964 243 TITLE II—INJUNCTIVE EELIEF AGAINST DISCRIMINA TION IN PLACES OF PUBLIC ACCOMMODATION](https://img.pdfslide.net/doc/110x75/5ece0abd5bea4a1901128213/78-stat-public-law-88-352-july-2-1964-241-78-stat-public-law-88-352-july.jpg)