Embed Size (px)
Citation preview
Unsupervised Pattern Recognition for the Interpretation of Ecological Data
by Mark A. O’Connor
Centre for Intelligent Environmental Systems
School of Computing
Staffordshire University
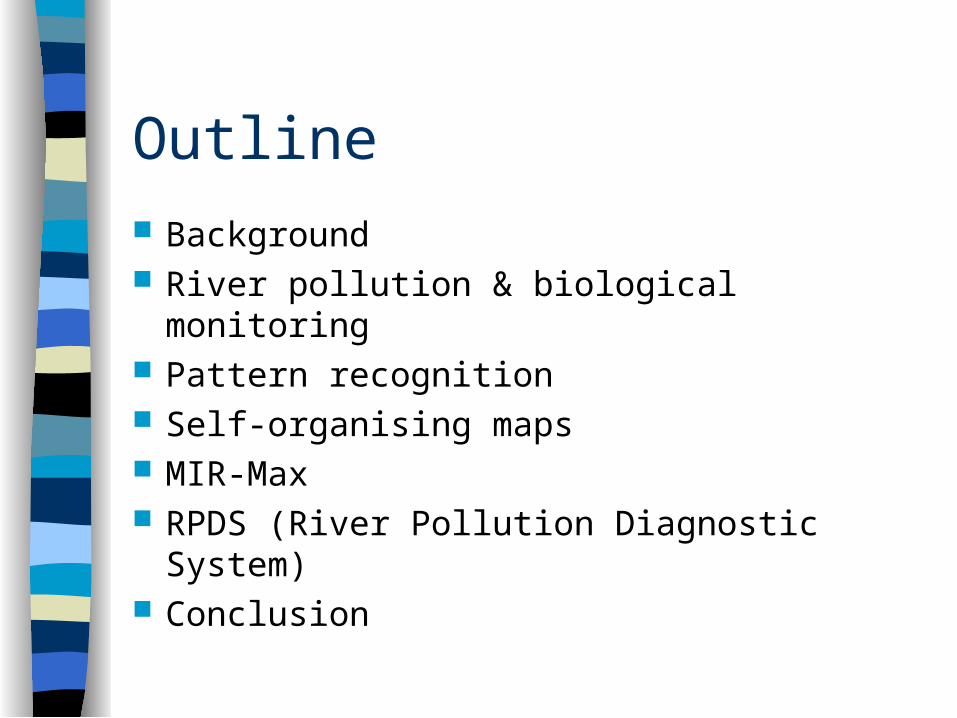
Outline
Background River pollution & biological monitoring Pattern recognition Self-organising maps MIR-Max RPDS (River Pollution Diagnostic System) Conclusion
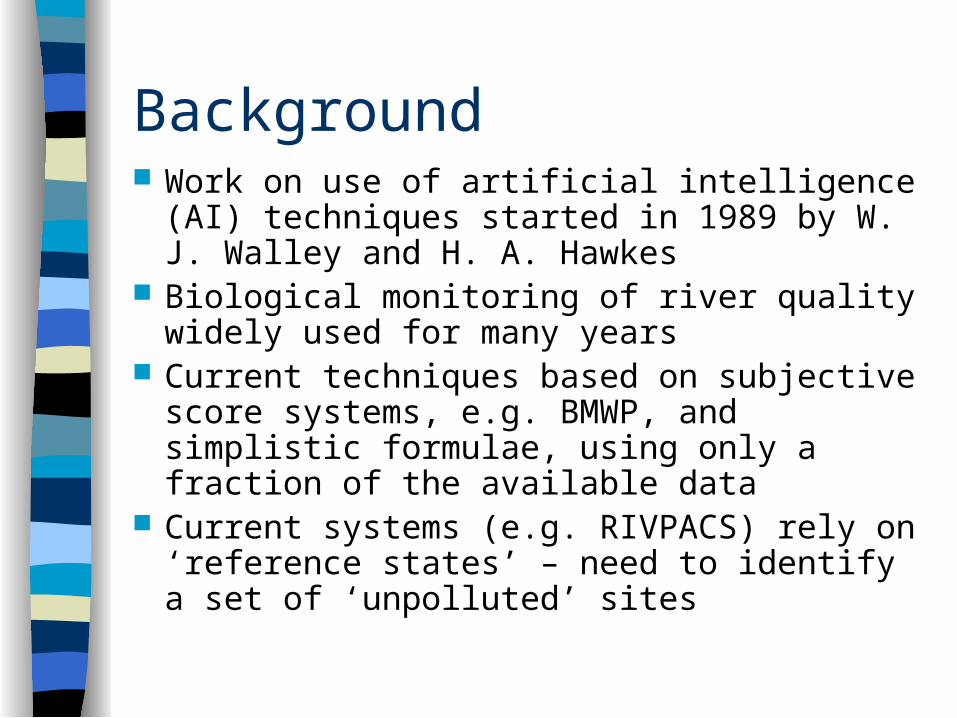
Background Work on use of artificial intelligence (AI)
techniques started in 1989 by W. J. Walley and H. A. Hawkes
Biological monitoring of river quality widely used for many years
Current techniques based on subjective score systems, e.g. BMWP, and simplistic formulae, using only a fraction of the available data
Current systems (e.g. RIVPACS) rely on ‘reference states’ – need to identify a set of ‘unpolluted’ sites
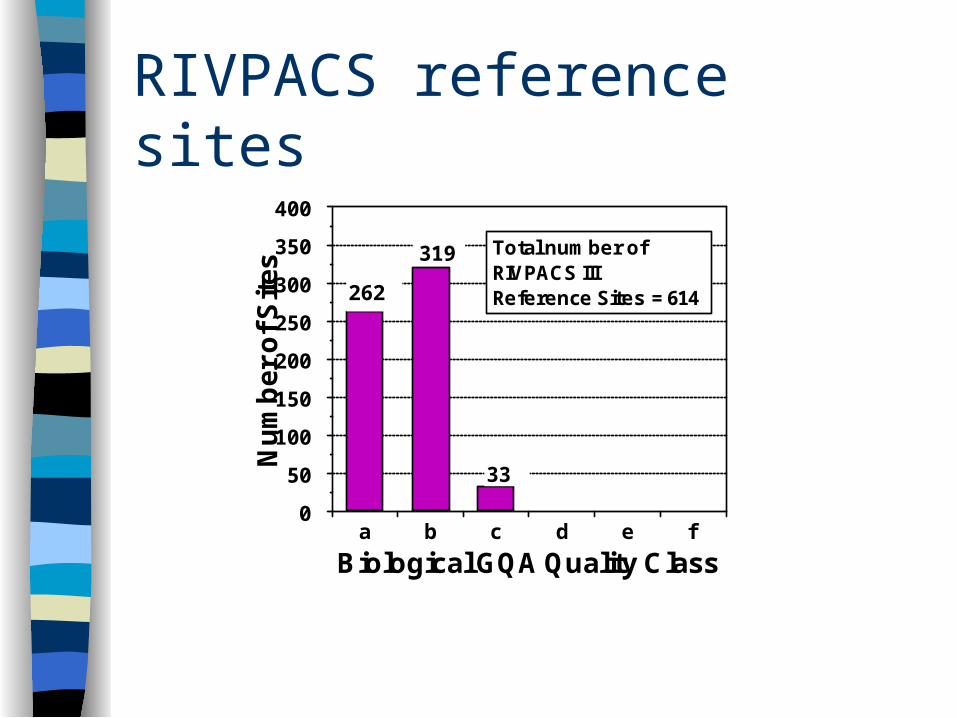
RIVPACS reference sites
0
50
100
150
200
250
300
350
400
Nu
mb
er
of
Sit
es
a b c d e f
Biological GQA Quality Class
262
319
33
Total number ofRIVPACS IIIReference Sites = 614
Aims
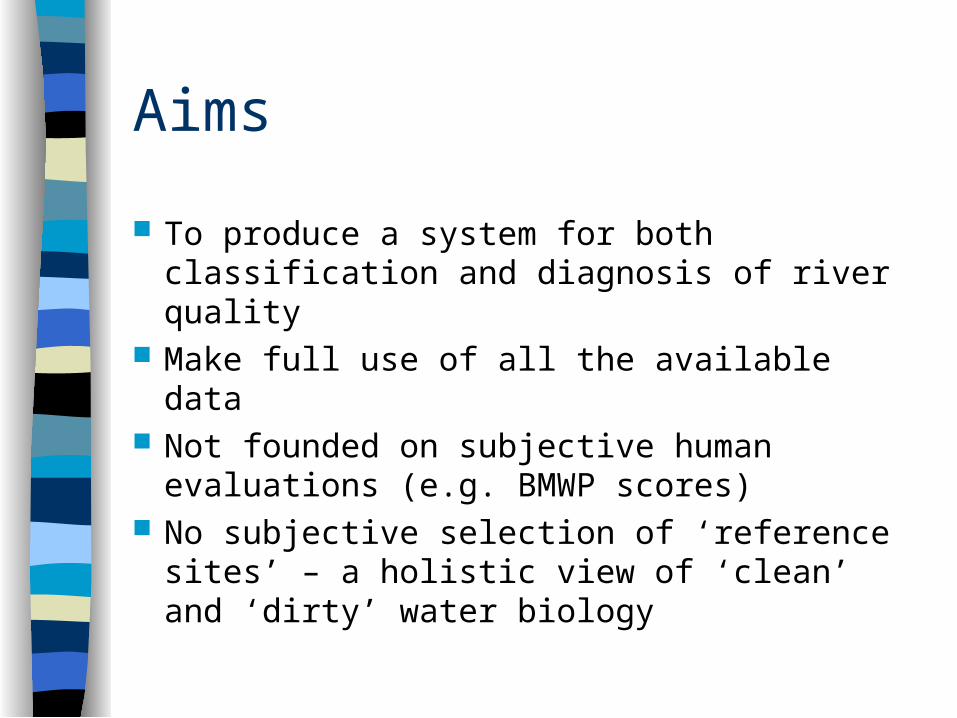
To produce a system for both classification and diagnosis of river quality
Make full use of all the available data Not founded on subjective human evaluations
(e.g. BMWP scores) No subjective selection of ‘reference sites’ – a
holistic view of ‘clean’ and ‘dirty’ water biology
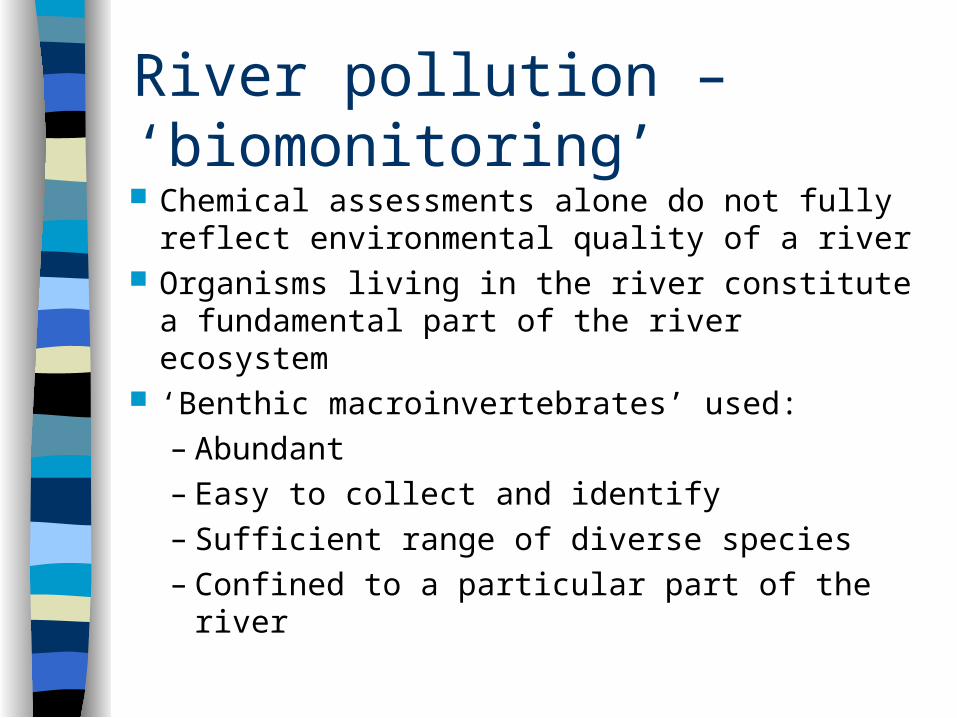
River pollution – ‘biomonitoring’ Chemical assessments alone do not fully
reflect environmental quality of a river Organisms living in the river constitute a
fundamental part of the river ecosystem ‘Benthic macroinvertebrates’ used:
– Abundant– Easy to collect and identify– Sufficient range of diverse species– Confined to a particular part of the river
Interpretation of data
Experts use two complementary processes when interpreting biological data
‘Plausible reasoning’ based on scientific knowledge of the ecological system
‘Pattern recognition’ based on experience of past cases
Data from a site are interpreted ‘holistically’, rather than using e.g. specific ‘if … then …’ rules
Pattern recognition
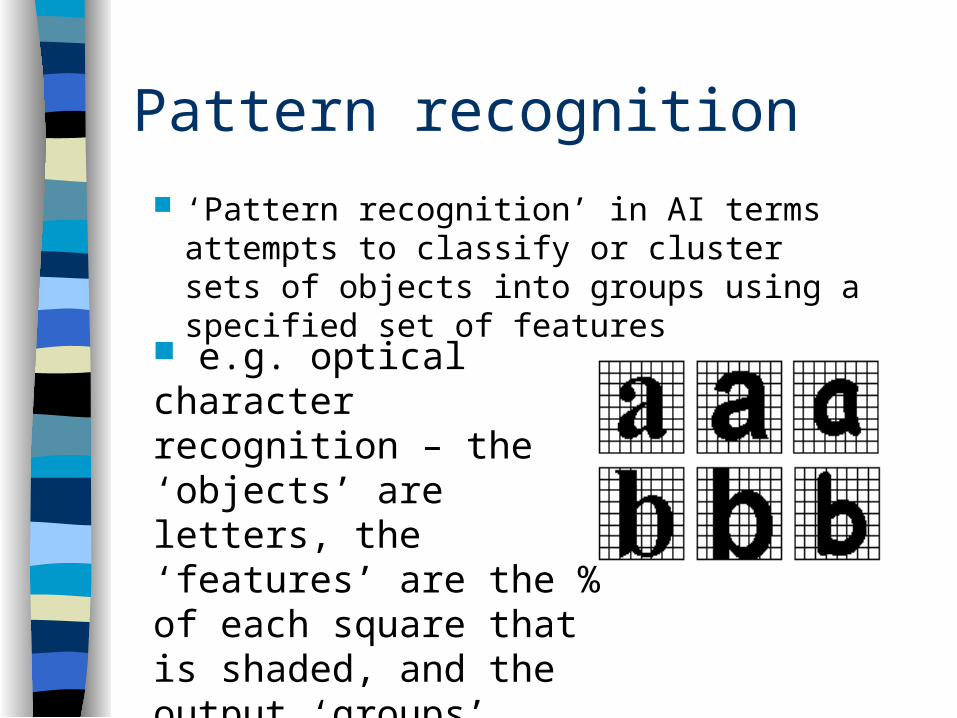
‘Pattern recognition’ in AI terms attempts to classify or cluster sets of objects into groups using a specified set of features
e.g. optical character recognition – the ‘objects’ are letters, the ‘features’ are the % of each square that is shaded, and the output ‘groups’ correspond to ‘a’, ‘b’, ‘c’, etc
PR system for river quality
For river quality, the ‘objects’ are the river sites, the ‘features’ are the abundance levels of 76 selected creatures together with information such as width, depth, discharge, composition of river bed
The ‘output groups’ correspond to varying river quality types or classes
Self-organising maps (SOMs)
Output lattice or ‘map’ of ‘nodes’ represent the clusters, each node is associated with a ‘prototype’ set of features
Training is ‘unsupervised’ New input data is classified according to
which prototype it best matches Arranged so that nearby nodes on the output
map represent similar patterns
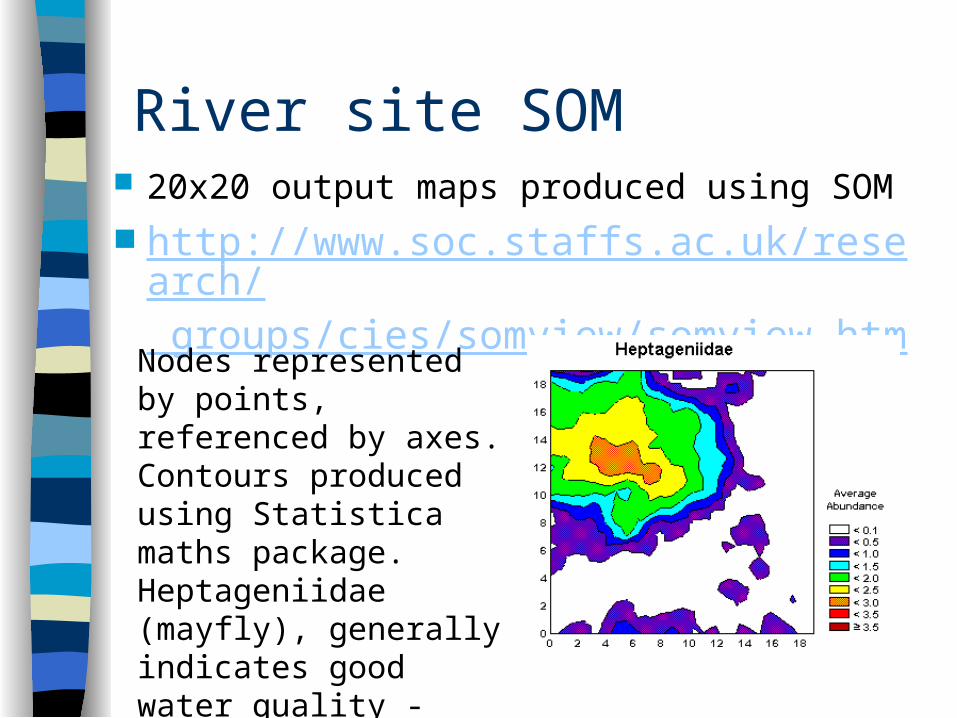
River site SOM 20x20 output maps produced using SOM http://www.soc.staffs.ac.uk/research/
groups/cies/somview/somview.htmNodes represented by points, referenced by axes. Contours produced using Statistica maths package. Heptageniidae (mayfly), generally indicates good water quality - sensitive to pollution.
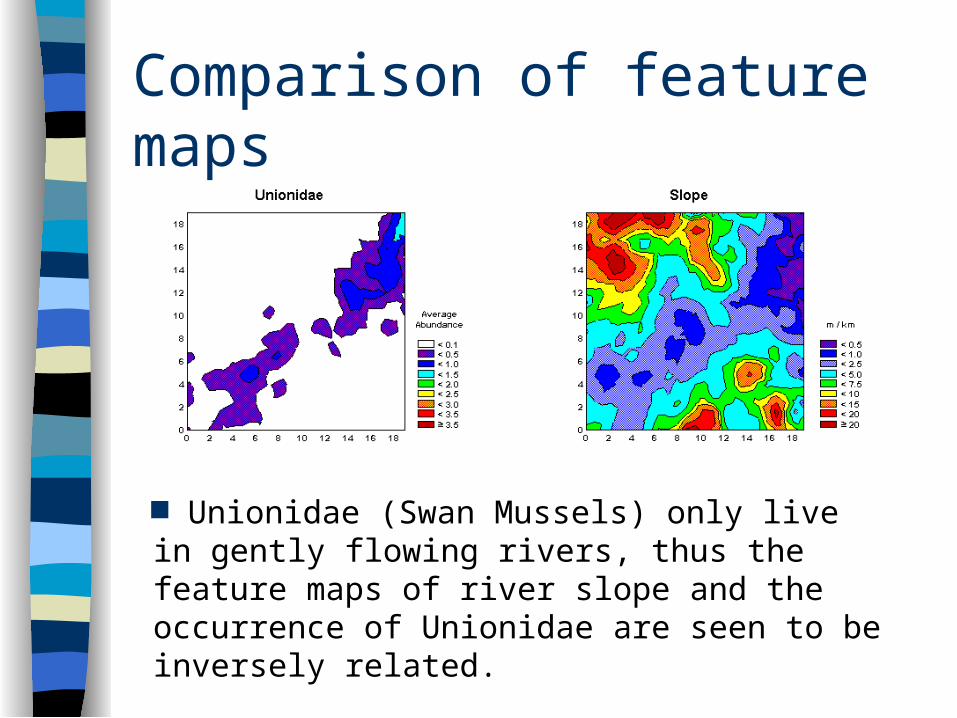
Comparison of feature maps
Unionidae (Swan Mussels) only live in gently flowing rivers, thus the feature maps of river slope and the occurrence of Unionidae are seen to be inversely related.
Measurement of SOM quality
2 aspects: How well the data is classified (e.g. are
very similar examples allocated to the same node/bin/neuron?)
How well the output nodes are ordered (e.g. do nodes that are close together in output space contain examples that are similar?)
Classification Mathematical theory of information
introduced by C. Shannon (1949) ‘Mutual information’ between two variables
(X and Y, say) quantifies the amount of ‘information’ about X that is gained by a knowledge of Y
A ‘good’ classification should maximise the M.I. between inputs (i.e. taxonomic and environmental data) and outputs (i.e. allocated nodes)
Ordering
Also need to ensure a good ordering across the output ‘map’ (a preservation of the neighbourhood relations in the input space)
Ordering can be measured using the correlation (r) between distances in data space (given some ‘distance’ or ‘dissimilarity’ measure between input feature sets) and Euclidean distances on the output map
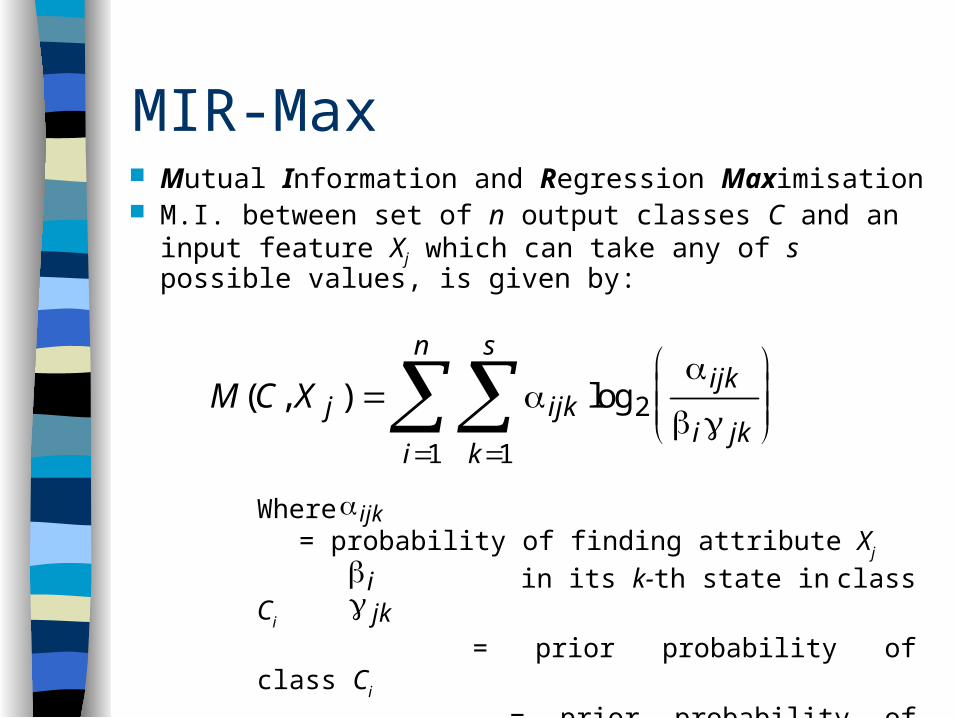
MIR-Max Mutual Information and Regression Maximisation M.I. between set of n output classes C and an input
feature Xj which can take any of s possible values, is given by:
M C X j ijk
k
s
i
nijk
i jk( , ) log
11
2
Where = probability of finding attribute Xj
in its k-th state in class Ci
= prior probability of class Ci
= prior probability of finding attribute Xj in its k-th state.
ijk
i jk
MIR-Max clustering ‘Clustering’ aim is to optimise the M.I. between the
output groupings and the input variables (averaged over all of the variables)
Start from a sub-optimal clustering, randomly allocating the input samples to the output classes
Choose a sample and assess the effect of transferring from its current class (the ‘departure’ class) to another class (the ‘arrival’ class)
Make the transfer if it produces an increase in M.I. Continue procedure until a stopping criterion is
satisfied
MIR-Max ordering ‘Ordering’ aim is to optimise the representation of the
output classes in a 2d output space Start from a random ordering of the output classes in
an output space made up of a number of discrete locations
Select 2 output locations and assess the effect of exchanging their contents
If this results in an increase in the correlation r between distances in data space and distances in output space, make the swap
Continue procedure until a stopping criterion is satisfied
MIR-Max results Initial testing found that MIR-Max
outperformed SOM with respect to ‘clustering’ (as measured by average mutual information)
MIR-Max specifically designed to maximise this measure; results show (on average) 18% improvement over SOM
MIR-Max maps were also better ‘ordered’ overall than those produced by SOM; ‘global’ ordering was better, but ‘local’ ordering was worse
RPDS
River Pollution Diagnostic System Developed for use by the British Environment
Agency Based on a MIR-Max clustering/classification
of spring and autumn samples from over 6000 sites across England and Wales
‘New’ samples are classified by RPDS, classifications help biologists to determine possible causes of pollution at the site
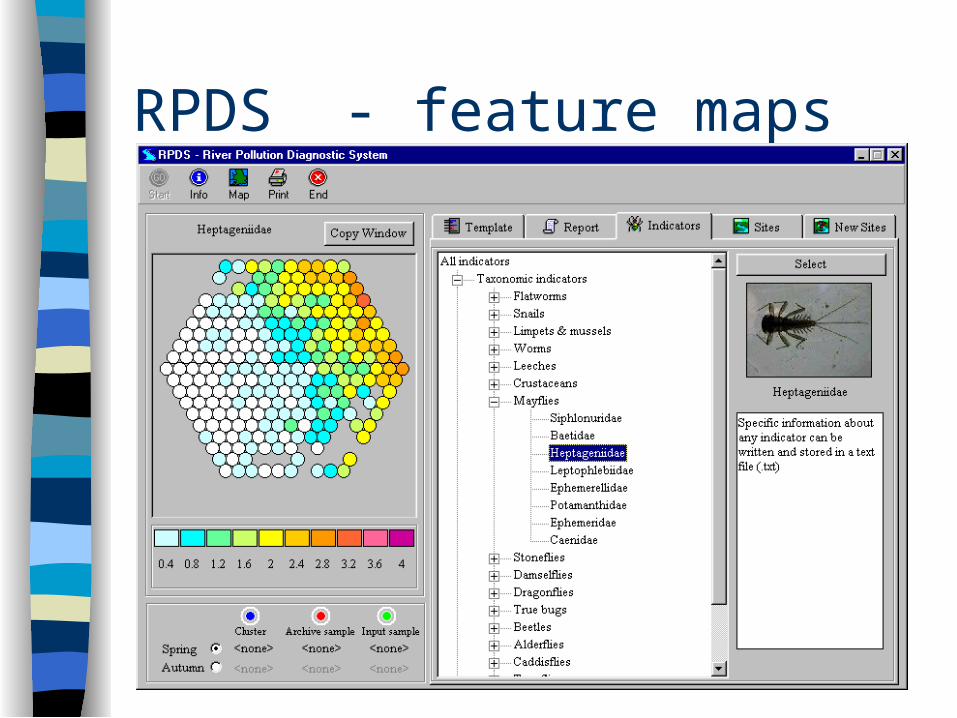
RPDS - feature maps
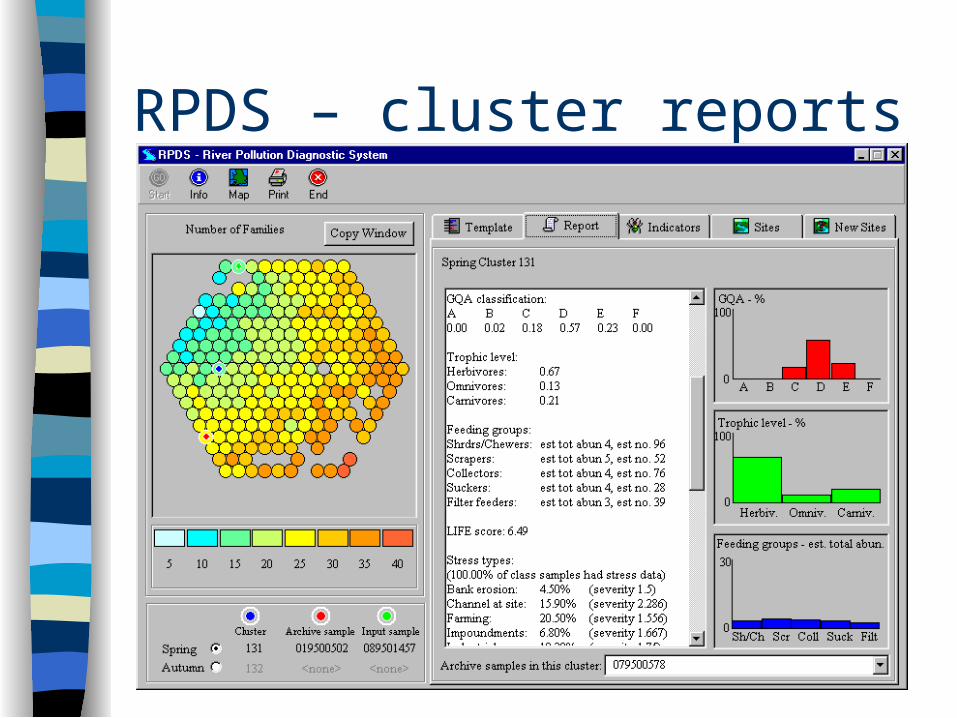
RPDS – cluster reports
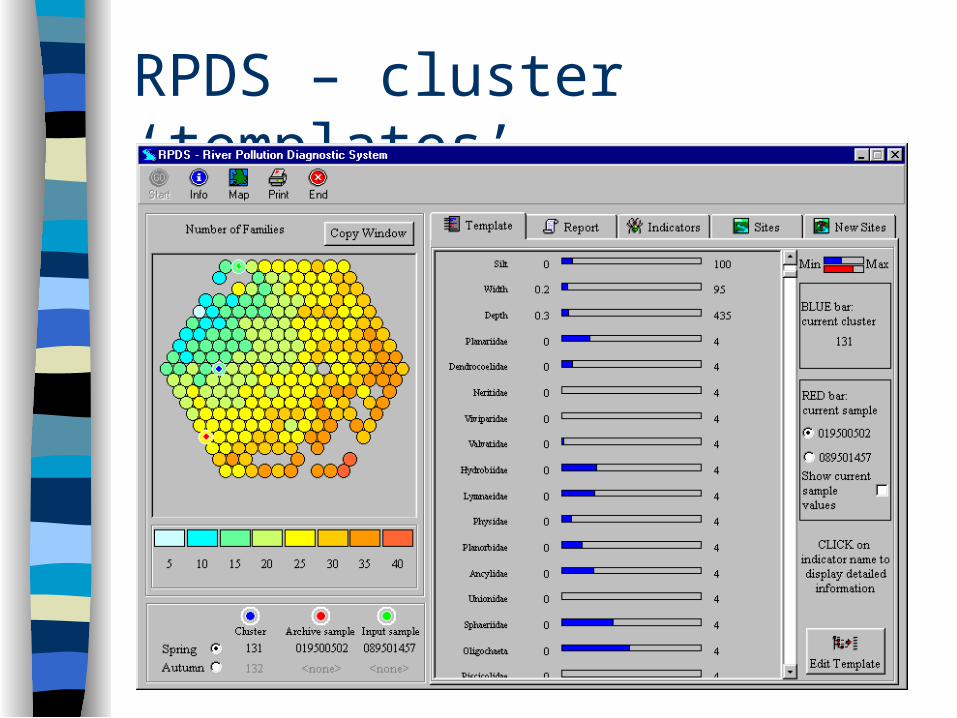
RPDS – cluster ‘templates’
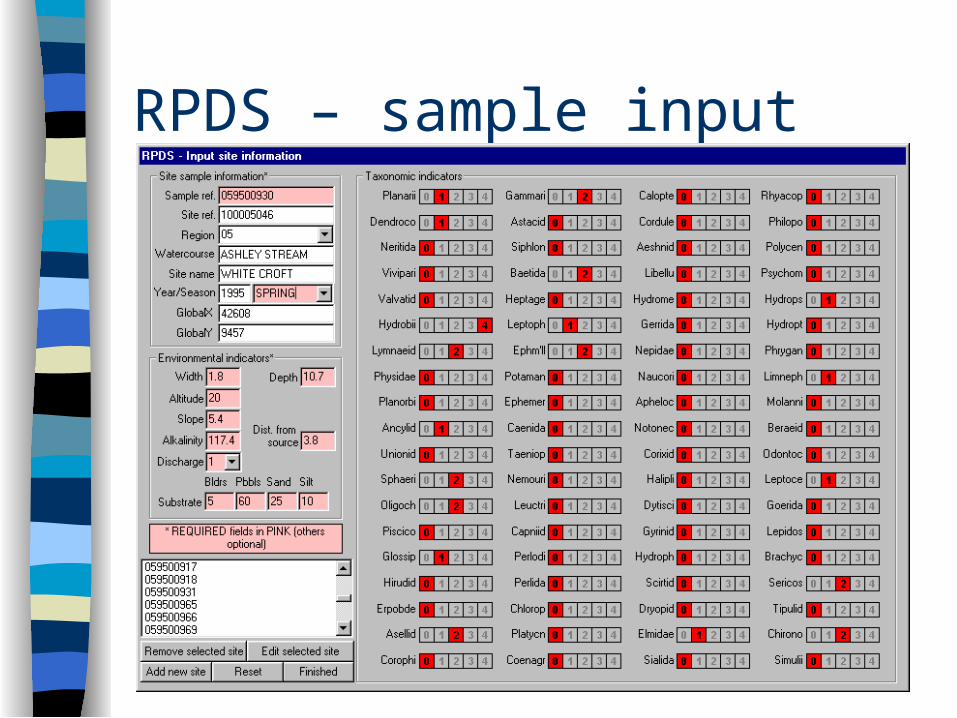
RPDS – sample input
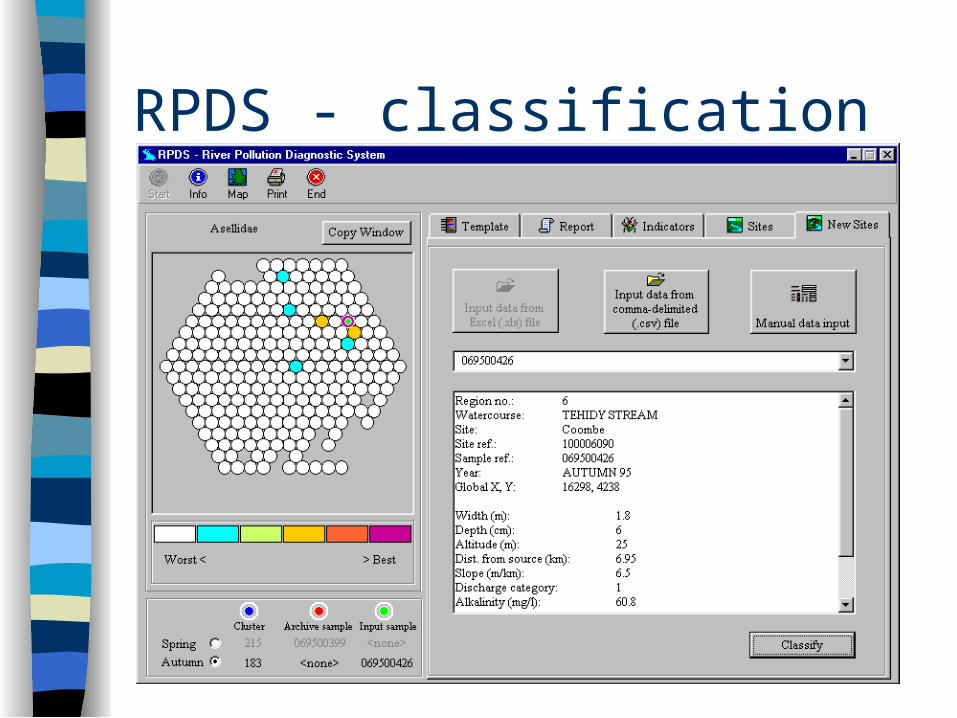
RPDS - classification

Conclusion
MIR-Max provides a means of organising and visualising complex high-dimensional data
Can provide a powerful tool for environmental monitoring/classification and diagnosis.
Find out more about AI and the environment from our website at: http://www.soc.staffs.ac.uk/research/groups/cies/


![Flannery O’Connor[1]](https://img.pdfslide.net/doc/110x75/577d26321a28ab4e1ea080c5/flannery-oconnor1.jpg)