Embed Size (px)
Citation preview

109Final Report on Development of Deep Aquifer Database and Preliminary Deep Aquifer Map
6CHAPTER
Water Quality Data Analysis and Mapping
6.1 Introduction
Quality of pumped groundwater is a major issue in terms of its usefulness and is particularly important for
the deep aquifer as there is limited data availability on the quality issues as well as possibilities of occurrences
of higher amount of total dissolved solids. The quality issue of deep aquifer becomes more important
because of the fact that over most of the country the available data show relative low concentrations of
arsenic in deeper groundwater and is considered as one of the main sources of arsenic safe water.
Available water quality data on the deep test or production wells has been collected mainly from DPHE
sources. Data on the parameters like Electrical Conductivity (EC), pH, Total Hardness (TH), Arsenic (As), Iron
(Fe), Chloride (Cl) and Manganese (Mn) are collected from various DPHE laboratories. However, results on all
the parameters are not available for all cases. In addition, the quality of the existing water quality data is a
major issue. Keeping these in minds, the following parameters have been selected for appraisal of deep
aquifer water quality. Considering WHO and Bangladesh standards, the following decision system has been
adopted for the four selected parameters:
As = <0.01 mg/L - OK as per WHO
As = > 0.01-0.05 - OK as per BDS
As = > 0.05 mg/L - NOT acceptable
Fe = 0.3 mg/L - OK as per WHO
Fe >0.3 -1.00 mg/L - OK as per BDS
Fe 1-5.00 mg/L - OK for HTWs
Fe >5.00 mg/L - NOT acceptable
Cl = 600 mg/L - OK for All over Bangladesh
Cl >600- 1000 mg/L - OK for coastal region
Cl >1000 mg/L - May NOT be acceptable
Mn = 0.1 mg/L - OK
Mn = 0.1-0.4 mg/L - may be acceptable
Mn = >0.4 mg/L - NOT acceptable
Though water quality data from the DPHE sources are used for a preliminary assessment of the quality of
deep groundwater, there remains certain factor that needs proper attention.

114 Final Report on Development of Deep Aquifer Database and Preliminary Deep Aquifer Map
n No QA/QC results are available
n Not all the data available for all locations
n Depth integrated data available from DPHE R&D activities at Pourashava and Growth Centers
n Some quality trends seem unusual hydrogeologically e.g. Gohat, Kalia Pourashava, Narail
n Some quality trends conforms with local geology, e.g. Trishal Pourashava, Mymensingh
n Some parameters like pH, EC, Temperature reported in the lab results should be done onsite
6.2 Summary Statistics on Four WQ Parameters
6.2.1 Arsenic
Arsenic samples with depth information (n= 820) have been categorized is different classes as per WHO and
Bangladesh drinking water limits. Most of the samples (80%) comply with the WHO standard. 98% of the
samples comply with the Bangladesh standard and only 2% samples exceed the 0.05 mg/L limit (Figure 6.1).
Though most of the data comply with WHO standard, a relatively large number of samples fall in between the
WHO and Bangladesh limits. This number is much higher than the previously reported investigations such
the BGS & DPHE (2001). Figure 6.2 shows the location of the wells with As measurements.
Another set of data is also available from the DPHE zonal laboratories where these are recorded as deep tube
wells but without any depth. More than 6000 arsenic analysis data have been collected from the laboratories.
The analyses results show that almost all the samples comply with the Bangladesh standard as shown in
Table 6.1 and Figure 6.3. However, in terms of compliance with the WHO standard, there are variations among
the six divisions. About 20% samples exceed the WHO limit in Chittagong division whereas no sample
exceeds the 0.01 mg/L limit in Sylhet Division. About 8% samples exceed the same limit in Dhaka and Khulna
divisions whereas 3% samples exceed the same in Barisal division. This dataset also confirms that a
significant number of samples fall in between the Bangladesh and WHO limits in Chittagong division. Figure
6.4 shows the location of deep tube wells with arsenic analysis results.
Figure 6.1: Concentration ranges of arsenic (n = 820).
% o
f Sam
ple
s
<0.01 >0.10-0.05 >0.50
As concentrations (mg/L)
0
20
40
60
80
100

115Final Report on Development of Deep Aquifer Database and Preliminary Deep Aquifer Map
Figure 6.2: Location map showing various arsenic concentrations of deep tub wells included in the database

116 Final Report on Development of Deep Aquifer Database and Preliminary Deep Aquifer Map
Figure 6.3: Percentage of samples exceeding the Bangladesh and WHO drinking water limits for Arsenic in different
divisions
0
5
10
15
20
% o
f Sam
ple
s
DHA (1608) CHI (1724) SYL (293) KHU (1846) BAR (588) TOT (6059)
Division
>0.05 mg/L >0.01 mg/L
Total SampleBangladesh Standard WHO
(0.05 mg/L) (0.01 mg/L)
Dhaka Division As 1598 1483 1608
Percentage 99.38 92.23 1723
Chittagang Division As 1718 1404
Percentage 99.71 81.49
Sylhet Division As 291 291 291
Percentage 100 100 1845
Khulna Division As 1827 1699
Percentage 99.02 92.09
Barisal Division As 588 576 588
Percentage 100 97.96
Table 6.1: Samples exceeding Bangladesh and WHO standards for arsenic in six divisions of Bangladesh

117Final Report on Development of Deep Aquifer Database and Preliminary Deep Aquifer Map
Figure 6.4: Location map showing arsenic concentrations of deep tub wells collected from DPHE zonal laboratories


120 Final Report on Development of Deep Aquifer Database and Preliminary Deep Aquifer Map
Figure 6.8: Location map showing iron concentrations of deep tub wells collected from DPHE zonal laboratories

121Final Report on Development of Deep Aquifer Database and Preliminary Deep Aquifer Map
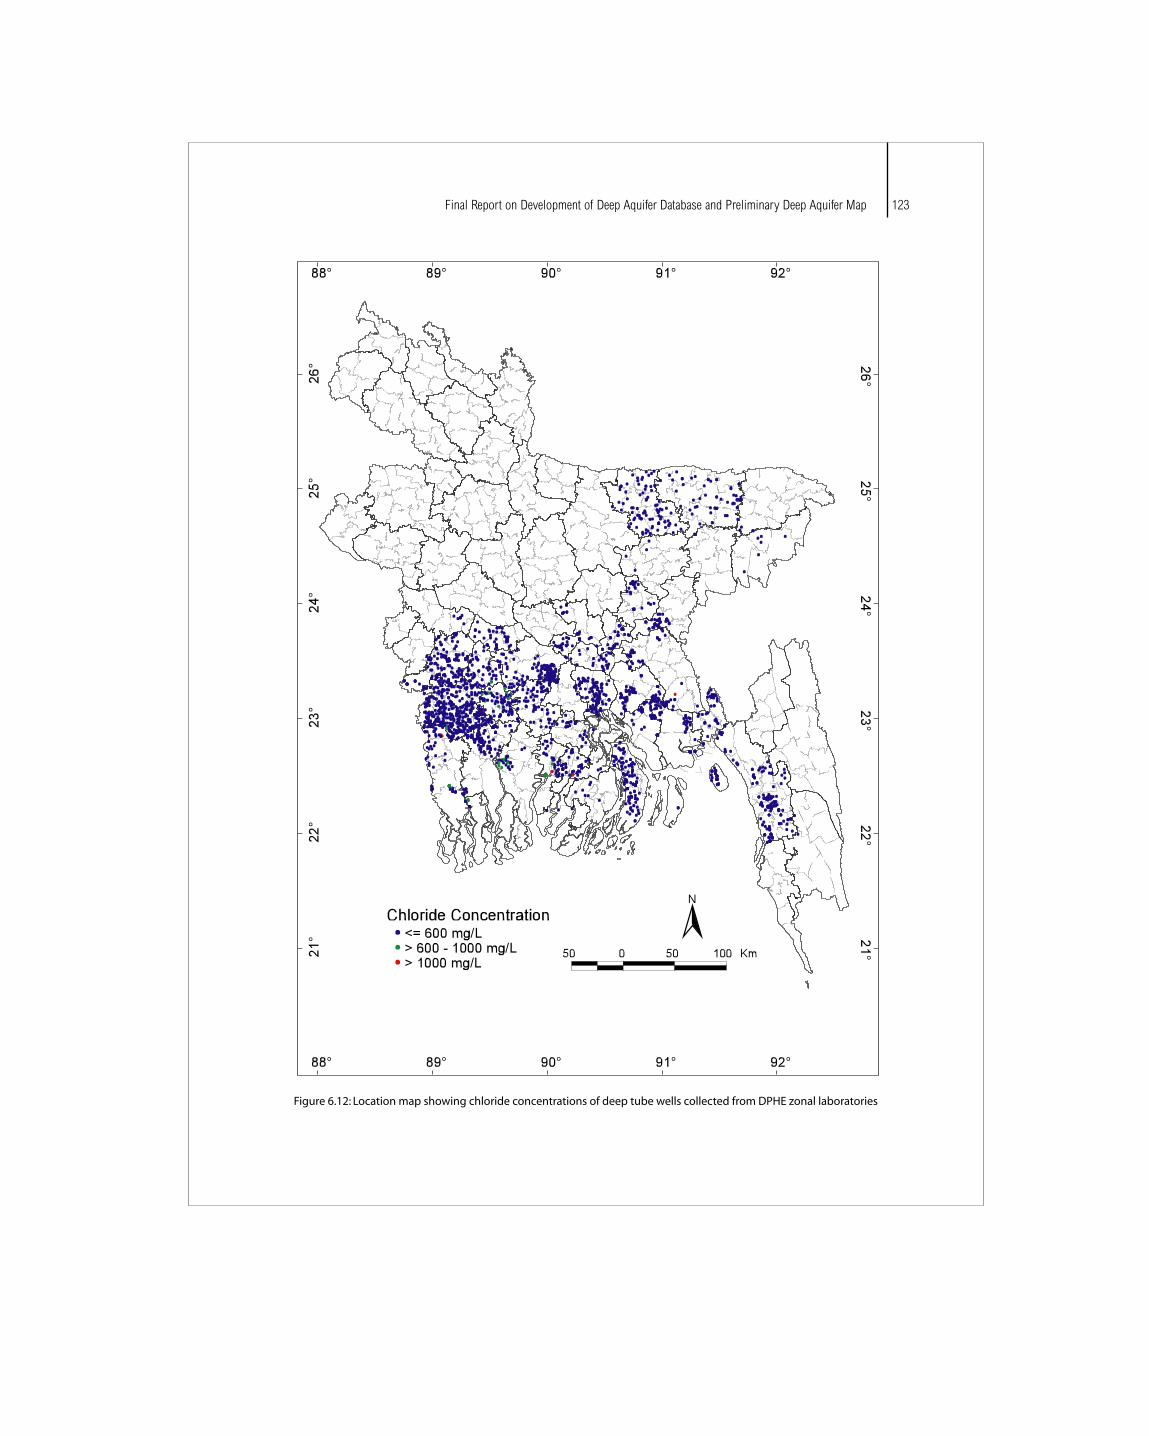
6.2.3 Chloride
The 3rd edition of the WHO Water Quality Guideline does not set a limiting value for chloride, as there is no
evidence of health problem associated with high chloride in groundwater. If we consider the Bangladesh drinking
water limits, most samples comply with the 600 mg/L threshold and only a very few samples exceed the 1000
mg/L, accepted limit for the coastal area as shown in Figure 6.5. DPHE zonal laboratory results also demonstrate
the same where almost all the samples comply with the 600 mg/L limit in all divisions as shown in Figure 6.6.
Figure 6.9: Concentration ranges of chloride (n = 890)
Figure 6.10: Percentage of samples exceeding various concentrations for chloride in different divisions
0
10
20
30
40
50
60
70
80
90
100
% s
amp
les
DHA(1431)
CHI(1713)
SYL (293) KHU(1490)
BAR(538)
TOT(5465)
Division
<600 mg/L >600-1000 mg/L >1000 mg/L
% s
amp
les
<600 >600-1000 >1000
Cl concentrations (mg/L)
0
20
40
60
80
100

122 Final Report on Development of Deep Aquifer Database and Preliminary Deep Aquifer Map
Figure 6.11: Location map showing chloride concentrations of deep tube wells included in the database
123Final Report on Development of Deep Aquifer Database and Preliminary Deep Aquifer Map
Figure 6.12: Location map showing chloride concentrations of deep tube wells collected from DPHE zonal laboratories

124 Final Report on Development of Deep Aquifer Database and Preliminary Deep Aquifer Map
6.2.4 Manganese
Manganese in drinking water is drawing more attention these days as there are some evidence of its role in
mental growth, particularly is infants. Only a small set of results are available compared to other parameters.
The current Bangladesh standard for Mn is more stringent than the WHO limit. If the Bangladesh limit is
considered almost all samples exceed the limit where majority of the samples comply with the WHO
guideline value as shown in Figure 6.13.
Figure 6.13: Concentration ranges of Mn (n = 136)
6.3 Vertical Variations in Water Quality
6.3.1 Arsenic
Although a large data set of arsenic analyses results are available from DPHE zonal laboratories, many of
those do not have any depth record. The small subset of data with depth records has been plotted against
depth as shown in Figure 6.15. The figure, shows that there are wider variations in depth range in the smaller
depth compared to grater depths. However, it is very important to note here that a good number of sample
exceed the WHO limit up to a depth of 300m. Relatively small number of samples from wells deeper than
300m show a much smaller variation in arsenic concentrations where most samples lie within the 0.01 mg/L
threshold.
0
20
40
60
80
100
% s
amp
les
~0.1 >0.1-0.4 >0.4
Mn concentrations (mg/L)

125Final Report on Development of Deep Aquifer Database and Preliminary Deep Aquifer Map
Figure 6.14: Location map showing manganese concentrations of deep tub wells included in the database

126 Final Report on Development of Deep Aquifer Database and Preliminary Deep Aquifer Map
Figure 6.15: Vertical variations in arsenic concentrations in the samples with depth records (samples deeper than 100m
has been plotted; n = 820)
0
50
100
150
200
250
300
350
0.00 0.05 0.10 0.15
As concentrations (mg/L)
Scre
en D
epth
(mb
gl)
<150m >150-200m >200-250m >250-300m >300-350m

127Final Report on Development of Deep Aquifer Database and Preliminary Deep Aquifer Map
6.3.2 Iron
Dissolved iron at high concentrations is wide spread in Bangladesh groundwater and deep groundwater is
not exception to this. As show in Figure 6.16, high dissolved iron occur up to a depth of 300m and below this
depth the concentrations are relatively low.
Figure 6.16: Vertical variations in iron concentrations in the samples with depth records (only samples deeper than 100m
has been plotted (n = 927)
0
50
100
150
200
250
300
350
400
0.00 3.00 6.00 9.00 12.00 15.00
Fe concentrations (mg/L)
Scre
en D
epth
(mb
gl)
<150m >150-200m >200-250m >250-300m >300m

128 Final Report on Development of Deep Aquifer Database and Preliminary Deep Aquifer Map
6.3.3 Chloride
As mentioned earlier, chloride is not considered as a health significant parameter in drinking water. However,
relatively higher concentrations can give rise to complaints from the consumer and may not be used as a
source of drinking water. Chloride concentrations in most of the exploited aquifers in Bangladesh are within
600 mg/L. However, there are sporadic occurrences of very high concentrations at various depths as shown in
Figure 6.17. From the somewhat decreasing trend with depth deeper than 250m is apparent.
Figure 6.17: Vertical variations in chloride concentrations in the samples with depth records (only samples deeper than
100m has been plotted (n = 890)
0
50
100
150
200
250
300
350
400
0 1000 2000 3000 4000 5000 6000
Cl concentrations (mg/L)
Scre
en D
epth
(mb
gl)
<150m >150-200m >200-250m >250-300m >300m

129Final Report on Development of Deep Aquifer Database and Preliminary Deep Aquifer Map
6.3.4 Manganese
Manganese is mostly low in deep groundwater as evident from the limited data plotted in Figure 6.18. In
most cases, the concentrations are within 0.1 mg/L with few high ones. However, samples deeper than 300m,
though very few in number, show characteristically low manganese concentrations.
Figure 6.18: Vertical variations in manganese concentrations in the samples with depth records (only samples deeper than
100m has been plotted; n = 136)
0
50
100
150
200
250
300
350
0.00 0.50 1.00 1.50 2.00 2.50
Mn concentrations (mg/L)
Scre
en D
epth
(mb
gl)
<150m >150-200m >200-250m >250-300m >300m

130 Final Report on Development of Deep Aquifer Database and Preliminary Deep Aquifer Map
6.4 Vertical Variations in Water Quality in DPHE Growth Centre Study
Results from DPHE R&D Division's investigations of water quality at various depths at the same locations are
available. As, Fe and Cl have been measured from test tube wells installed at various depths at the same
location. Few such results from three different locations are presented here with some comments:
Figure 6.19 presents the results from four test tubewells drilled at Trishal in Mymensingh district. There is only
one aquifer up to a depth of 1000feet and which is most likely the Plio-Pleistocene Dupi Tila aquifer. Test tube
wells developed at 200, 500, 850 and 1000 feet. Arsenic is high at the shallowest (0.034 mg/L; below detection
level (bdl) at 500 and 850 feet but reappears at 1000 feet (0.006 mg/L). Fe is very low at the shallowest,
highest at 500 feet (9.80 mg/L) and decreases with depth to 0.51 at 1000 feet. Cl concentrations are very
similar at all depths.
Figure 6.19: Vertical variations in water quality at Trishal, Mymensingh
Depth (ft)
100As = 0.034Fe = 0.5Cl = 40
200
300
400 As = bdlFe = 9.80Cl = 28
500
600
700
As = bdlFe = 6.50
800 Cl = 34
Legend:
900 ClayAs = 0.006
Fine sand Fe = 2.51Cl = 28
1000 Medium sand

Depth (ft)
100
200
300
As: <0.01
Fe: 1.11
400 Cl: 533
500
600 Clay
Silty Clay
700 V F Sand
As: <0.01
F Sand Fe: 0.56
Cl: 414 As: <0.01
800 M Sand Fe: 0.64
Cl: 35
C Sand
900
1000
131Final Report on Development of Deep Aquifer Database and Preliminary Deep Aquifer Map
Figure 6.20 presents the vertical water quality data from Kalia in Narail district. Kalia Pourashava, Narail where
the following features are noted:
n Two aquifer system separated by a 250 feet silty clay layer at 450 to 700 feet
n No variation in As in the shallow and deep aquifer
n Fe little higher at the shallowest well, similar at the deep ones
n Very unusual variation in Cl at 815 and 850 feet
Figure 6.20: Vertical water quality variations at Kalia in Narail district

Depth (ft)
100
200
300
400
As: 0.04
Fe: 3.46
Cl: 41
500
Clay
600 Silty Clay
V F Sand
700 F Sand
As: 0.01
M Sand Fe: 2.57
Cl: 154
800
900
As: <0.01
Fe: 0.53
Cl: 179
1000
132 Final Report on Development of Deep Aquifer Database and Preliminary Deep Aquifer Map
Figure 6.21 presents the vertical water quality profile from 500, 800 and 1000 feet at Swarupkathi in Pirojpur
district where the following facts are noticed:
n Multiple aquifer systems with a thick aquitard at 100 to 250 feet; other thinner aquitards at 350 and 650
feet
n As decreases with depth
n Cl low in all depths
n Fe decreases with depth
Figure 6.21: Vertical water quality variations at Swarupkathi in Pirojpur

133Final Report on Development of Deep Aquifer Database and Preliminary Deep Aquifer Map
6.5 Sampling of DTWs for Arsenic Measurements
As the water quality data in general, and arsenic data in particular, are consider unreliable in terms of
analytical accuracy a subset 100 deep tube wells have been sampled under this study. The samples were
collected from SW (greater districts of Kushtia, Jessore, Khulna, and Faridpur) and SE (greater districts of
Comilla and Noakhali) regions of the country. Two teams, each consisting of a graduate geologist with
adequate knowledge of groundwater sampling, were sent out for the sampling. Each team was given a list of
target deep wells based on the information contained in the deep aquifer database. In selecting the wells,
DPHE Zonal Laboratory reported arsenic concentrations were considered. All wells above the Bangladesh
limit were selected for re-sampling, numbering about 10. As a large number of wells exceeded the WHO limit,
around 40 wells with arsenic above 10 µg/L were listed for re-sampling. Remaining samples were selected
randomly from various parts of the sampled districts. Special emphasis was given to collect a few extra
samples from Satkhira-Khulna region as per DPHE's request. However, in many occasions the target wells
could not be sampled because of number of problems such as incorrect information about the locations,
non-functioning of the wells, non-existence of any pumping device and non-existence of the well. A few wells
could not be reached because of difficult accessibility.
At each site a 50 ml filtered sample (filtered with 0.45 µm membrane filter) has been collected. The well was
purged for enough time to get rid of the well bore storage and thus collect representative groundwater
sample from the aquifer. The sample was acidified on the spot using ~1% concentrated HNO3 as per
suggestion of Environmental Laboratory of BUET. Handheld GPS was used to record the geographical
coordinates of the sample location. As per request from the DPHE R&D Division, electrical conductivity (EC) of
each sample was measured on site using portable EC meters. Details of the sampled wells including depth
were collected from the caretaker/owner/user of the well.
Details of the collected samples along with the arsenic concentrations as obtained from the Environmental
Engineering Laboratory of BUET are presented in Table 6.2. Figure 6.22 shows the locations of the samples.
Ten blind duplicate samples were also sent to the same laboratory for assessing the quality of analysis. The
results are discussed in the following sections.

1M
d. H
abib
ur r
ahm
an
Kan
uti
aB
ino
dep
ur
Mo
ham
mad
pu
rM
agu
ra
181.
04
89.5
4815
23
.427
265
55
2M
d.R
asel
Ju
itar
aC
hau
lia
Mag
ura
Sad
ar
Mag
ura
17
0.07
89
.438
73
23.4
5088
54
111
3M
d.W
ajed
Sh
ard
ar
Shim
akh
ali
Shat
akh
ali
Shal
ikh
aM
agu
ra
185.
92
89.3
1976
23
.323
46
695
40
4M
d.A
bu
l Bas
har
Sar
kar
Bh
itak
ho
la
Mal
iat
Kal
igan
jJh
enai
dah
13
9.44
89
.230
41
23.3
3991
75
937
5Sh
orf
ud
din
Ah
med
B
hag
aban
nag
ar
Kal
ich
aran
pu
rJh
enai
dah
a Sa
dar
Jh
enai
dah
15
4.98
89
.208
77
23.5
2297
77
87
6M
d.A
bd
ul M
ojid
Jo
ard
ar
Kh
od
do
rhu
aSr
iko
lSr
ipu
rM
agu
ra
148.
89
89.3
5049
23
.611
41
908
15
7M
d.A
zim
ud
di
Phal
si
Har
inak
un
da
Har
inak
un
da
Jhen
aid
ah
119.
93
89.0
7749
23
.647
27
718
10
8M
d.K
hal
ilur R
ahm
an
Kar
inch
aSw
aru
pp
ur
Mo
hes
hp
ur
Jhen
aid
ah
154.
98
88.8
2762
23
.351
62
508
14
9Ji
bo
nn
agar
Po
uro
shav
a
Jib
on
nag
ar
Jib
on
nag
ar
Jib
on
nag
ar
Ch
uad
ang
16
7.63
88
.820
723
.432
31
700
9
Co
mp
ou
nd
10
Md
.Kh
alilu
r Rah
man
M
ahir
an
Dar
ajh
at
Bag
erp
ara
Jess
ore
18
2.93
89
.345
923
.212
67
976
43
11
Dak
hil
mad
rash
aA
rpar
a M
irza
pu
rB
ich
hal
iN
arai
l sad
ar
Nar
ail
286.
03
89.5
0245
23
.052
45
668
2
12
Nir
anjo
n B
osh
u
Sukt
og
ram
B
abra
Hac
hla
K
alia
N
arai
l25
1.59
89
.616
49
23.0
6959
80
9<
1
13
Tap
osh
Ku
mar
Sh
aha
Kam
than
aLo
hag
ara
Loh
agar
aN
arai
l21
2.03
89
.672
13
23.2
0295
16
47
4
14
Md
.Mo
shar
of H
oss
ain
H
idia
Su
bh
arar
aA
bh
ayn
agar
Je
sso
re
261.
66
89.4
8937
23
.011
69
1871
<
1
15
Mo
lla K
amal
Ud
din
Jo
gin
ipas
ha
Phu
ltal
aPh
ult
ala
Kh
uln
a22
9.37
89
.993
64
23.4
319
2600
<
1
16
Md
.Nu
rul I
slam
M
oh
anp
ur
Man
iram
pu
rM
anir
amp
ur
Jess
ore
20
9.84
89
.234
61
23.0
143
1238
<
1
17
Man
iram
pu
r Gir
ls
M
anir
amp
ur
Man
iram
pu
rJe
sso
re
164.
63
89.2
3287
23
.014
38
1636
<
1
Deg
ree
Co
lleg
e
18
Md
. Go
lam
mo
sto
fa
Fari
dp
ur
Dia
ra
Ko
twal
iJe
sso
re
207.
32
89.1
4446
23
.179
88
865
16
19
Bih
arip
ara
Eid
gah
Fie
ld
Jh
iko
rgac
ha
Jhik
org
ach
aJe
sso
re
169.
76
89.0
9567
23
.094
93
908
<1
(w
ell-
3)
20
Md
. Sad
ek H
oss
ain
Pu
ron
do
pu
rJh
iko
rgac
ha
Jhik
org
ach
aJe
sso
re
217.
68
89.0
9202
23
.097
58
976
<1
( E
x C
hai
rman
)
21
Md
.Ab
du
r Raz
zak
Sars
ha
Sars
ha
Sars
ha
Jess
ore
19
9.39
88
.945
97
23.0
5936
17
14
<1
22
Md
.Sh
ahid
ul I
slam
U
ttar
Dig
ang
H
elat
ala
Ko
laro
aSa
tkh
ira
222.
09
89.0
252
23.9
0824
48
30
<1
Sampleno.
Ow
ner
/Car
etak
er's
nam
eV
illag
eU
nio
nU
paz
ilaD
istr
ict
Dep
th (m
) L
on
g (0
)La
t (0
)EC
(µS/
cm)
Ars
enic
(ug
/L)
Tab
le 6
.2: D
escr
ipti
on
of d
eep
tu
be
wel
l sam
ple
s co
llect
ed u
nd
er t
his
pro
ject
134 Final Report on Development of Deep Aquifer Database and Preliminary Deep Aquifer Map

23
Md
.Go
lam
Mo
sto
fa
Shan
karp
ur
Jalla
bad
K
ola
roa
Satk
hir
a20
1.16
89
.074
37
23.8
536
4200
34
24
Md
.Sh
iraj
ul i
slam
G
ore
r Dan
ga
Dh
and
ia
Tala
Sa
tkh
ira
202.
44
89.1
0368
22
.826
89
5440
<
1
25
Ob
ani m
on
do
lG
oal
pat
aN
agag
hat
aTa
la
Satk
hir
a17
5.00
89
.131
74
22.7
2304
15
31
94
26
Dili
p k
um
ar D
as
Bh
atsh
ala
Srip
ur
Deb
hat
aSa
tkh
ira
198.
17
88.9
603
22.6
0366
18
67
<1
27
Md
.Ali
Shei
kh
Kal
ikap
ur
kris
hn
anag
ar
Kal
igan
jSa
tkh
ira
219.
51
89.1
4852
22
.397
08
2420
<
1
28
Md
.Ab
du
l Kh
alek
h
Ind
ira
Ag
ard
ari
Satk
hir
a Sa
dar
Sa
tkh
ira
185.
92
89.0
2717
22
.762
34
1690
<
1
29
Ram
Pra
shad
Pa
rpar
a G
ho
na
Gh
on
aSa
tkh
ira
Sad
ar
Satk
hir
a18
9.00
88
.993
54
22.7
352
1767
33
30
Md
.Hab
ibu
r Rah
man
Pa
rpar
a G
ho
na
Gh
on
aSa
tkh
ira
Sad
ar
Satk
hir
a23
7.43
88
.960
41
22.7
4511
20
50
2
31
Md
.Ab
du
l Gaf
far (
chai
rman
)B
had
ra
Kush
khal
iSa
tkh
ira
Sad
ar
Satk
hir
a22
0.00
88
.976
65
22.7
7369
20
90
80
32
Bra
hm
araj
pu
r Sh
ard
arp
ara
B
rah
mar
ajp
ur
Bra
hm
araj
pu
rSa
tkh
ira
Sad
ar
Satk
hir
a18
9.02
89
.107
322
.681
09
859
101
M
osq
ue
33
Md
.Nis
ar A
liB
ara
Path
ra
Mo
ng
alko
tK
esh
abp
ur
Jess
ore
26
5.16
89
.286
22
.855
57
1056
5
34
Gir
idh
arn
agar
Jam
e m
osq
ue
Gir
idh
arn
agar
Su
fala
kati
K
esh
abp
ur
Jess
ore
22
9.57
89
.331
97
22.8
9502
63
2<
1
35
Du
mu
ria
Bu
ssta
nd
Bai
tul
Du
mu
ria
Du
mu
ria
Du
mu
ria
Kh
uln
a23
2.36
89
.419
59
22.8
0744
57
24
Fa
lah
Pan
jeg
ana
Mo
squ
e
36
Md
.Sh
eikh
Ab
du
l Kad
er
Bar
a Pa
ikp
ara
Rak
hal
gac
hi
Bag
erh
at s
adar
B
ager
hat
28
3.53
89
.667
01
22.7
1481
15
42
<1
37
Md
.Bab
ul s
hei
kh
Bar
a Pa
ikp
ara
Rak
hal
gac
hi
Bag
erh
at s
adar
B
ager
hat
27
4.28
89
.664
74
22.7
1625
17
59
<1
38
Shik
dar
par
a M
osq
ue
Bad
ukh
ali
Sat
Gam
bu
jB
ager
hat
sad
ar
Bag
erh
at
239.
48
89.7
4466
22
.693
85
1463
<
1
39
Rah
ima
Beg
um
(U. P
. Mem
ber
)B
adu
khal
iSa
t G
amb
uj
Bag
erh
at s
adar
B
ager
hat
22
8.67
89
.746
74
22.6
9813
15
73
<1
40
Dili
p B
isw
as
Hat
bat
i2
NO
.Bat
igh
ata
Bat
iag
hat
aK
hu
lna
134.
15
89.5
1957
22
.740
12
980
<1
41
Md
.Ala
mg
ir H
awla
dar
H
atb
ati
2 N
O.B
atig
hat
aB
atia
gh
ata
Kh
uln
a16
1.58
89
.514
18
22.7
3778
98
23
42
San
ato
n G
old
ar
Jolm
a1N
O. J
olm
aB
atia
gh
ata
Kh
uln
a14
0.24
89
.524
13
22.7
4462
93
43
43
Ran
jon
Ku
mar
Tik
adar
C
hak
rakh
ali
1NO
. Jo
lma
Bat
iag
hat
aK
hu
lna
137.
19
89.5
2391
22
.759
13
1383
<
1
44
Md
.Ab
ul K
alam
Haw
lad
ar
Go
bin
do
pu
rU
jalk
ur
Ram
pal
B
ager
hat
25
6.10
89
.651
19
22.6
3314
15
44
<1
45
Go
bin
do
pu
r 5 N
O. W
ell
Go
bin
do
pu
rU
jalk
ur
Ram
pal
B
ager
hat
42
6.83
89
.660
13
22.6
311
1935
<
1
( Fo
r wat
er s
up
ply
to M
on
gla
)
46
Sho
ntu
Sh
ilN
oap
ara
Pilja
ng
aFa
kirh
at
Bag
erh
at
271.
34
89.6
5017
22
.737
17
1868
<
1
Sampleno.
Ow
ner
/Car
etak
er's
nam
eV
illag
eU
nio
nU
paz
ilaD
istr
ict
Dep
th (m
) L
on
g (0
)La
t (0
)EC
(µS/
cm)
Ars
enic
(ug
/L)
135Final Report on Development of Deep Aquifer Database and Preliminary Deep Aquifer Map

47
Bis
wan
ath
Ch
akra
bo
rti
Pilja
ng
aPi
ljan
ga
Faki
rhat
B
ager
hat
29
2.68
89
.651
44
22.7
3863
33
00
<1
48
CM
B J
ame
Mo
squ
eB
agm
ara
Nay
ahat
iRu
psh
aK
hu
lna
292.
68
89.5
8503
22
.800
39
1214
<
1
( nea
r fer
rig
hat
)
49
Md
. Ab
ul K
ash
em
Bag
mar
aN
ayah
ati
Rup
sha
Kh
uln
a22
8.67
89
.591
29
22.7
9899
12
21
<1
50
Md
.Th
and
a Fa
kir
Kah
alp
ur
Atj
uri
M
olla
hat
B
ager
hat
24
8.48
89
.803
45
22.9
1236
22
00
<1
51
Am
aren
dra
nat
h s
hah
aG
arak
ho
la
Mad
hu
khal
iM
adh
ukh
ali
Fari
dp
ur
184.
71
89.6
3355
23
.545
11
1000
1
mad
hu
khal
i
52
Ab
du
l Ras
hid
kh
an
Mu
rari
dia
Ja
hap
ur
mad
hu
khal
iFa
rid
pu
r17
3.30
89
.682
48
23.5
1106
11
10
<1
53
Ab
du
l Hal
im S
hei
kh
Sota
si
Bo
alm
ari
Bo
alm
ari
Fari
dp
ur
189.
42
89.6
7185
23
.433
323
0<
1
54
Ab
du
l sal
am S
hei
kh
Har
ihan
agar
G
un
bah
aB
oal
mar
iFa
rid
pu
r33
9.23
89
.369
87
23.3
6987
80
03
55
Ran
zon
ku
mar
Bis
was
Le
bu
tala
D
om
uri
aTu
ng
ipar
aG
op
alg
anj
304.
88
89.9
1277
22
.876
55
>20
00
<1
56
Mir
inal
kar
ti B
isw
as
Leb
uta
la
Do
mu
ria
Tun
gip
ara
Go
pal
gan
j24
3.90
89
.920
81
22.8
7571
30
0<
1
57
Ab
du
l Azi
z Sh
eikh
ka
julia
ka
julia
G
op
alg
anj S
adar
G
op
alg
anj
233.
62
89.9
497
23.0
2004
50
0<
1
58
Kat
hi p
rim
ary
Kat
hi
kath
iG
op
alg
anj S
adar
G
op
alg
anj
131.
10
89.8
9755
23
.024
13
500
141
g
over
nm
ent
sch
oo
l
59
Up
azila
Do
rmit
ory
G
ang
Jag
dia
N
agar
kan
da
N
agar
kan
da
Fari
dp
ur
214.
42
89.8
9501
2
3.41
869
260
1
60
Sham
im G
om
asta
Jo
do
ar c
har
B
oh
erat
ola
Sh
ib C
har
M
adar
ipu
r 22
8.66
90
.162
29
23.3
338
200
6
61
Mo
nsh
i kad
arp
ur
hig
h s
cho
ol
Kad
arm
on
shi
Mo
nsh
iSh
ib C
har
M
adar
ipu
r 21
3.41
90
.213
84
23.3
7032
40
03
kan
di
kad
arp
ur
62
Shah
Sah
eb B
ari
Ch
hila
dh
ar C
har
B
han
ga
Bh
ang
aFa
rid
pu
r 23
7.80
89
.986
13
23.3
835
300
<1
63
Fon
ibh
ush
on
Das
A
mg
ram
A
mg
ram
R
ajo
ir
Mad
arip
ur
231.
63
90.0
5294
23
.277
76
300
<1
64
A. K
. Sh
ahab
ud
din
Pa
shch
im ra
joir
R
ajo
ir
Raj
oir
M
adar
ipu
r18
3.33
90
.033
84
23.2
0934
30
0<
1
65
Shah
Ala
m K
han
K
hu
dra
ch
ar
Sah
ebra
mp
ur
Kal
kin
i M
adar
ipu
r24
3.9
90.2
8417
23
.017
16
400
<1
66
Ab
du
l Sat
ter
Ho
wla
der
ka
yari
aka
yari
aK
alki
ni
Mad
arip
ur
241.
24
90.2
8208
22
.995
930
0<
1
67
Sob
ahan
Mas
ter
Dak
shin
kan
di
C.D
. Kh
an
Kal
kin
i
Mad
arip
ur
243.
90
90.2
7157
23
.271
57
300
<1
68
Kal
ach
an M
on
dal
C
har
Fat
eh
Shik
arm
on
go
lK
alki
ni
Mad
arip
ur
381.
10
90.2
6663
23
.049
43
400
<1
69
DPH
E
Jau
tola
K
alki
ni
Kal
kin
i M
adar
ipu
r 19
8.17
90
.233
09
23.0
741
300
<1
Sampleno.
Ow
ner
/Car
etak
er's
nam
eV
illag
eU
nio
nU
paz
ilaD
istr
ict
Dep
th (m
) L
on
g (0
)La
t (0
)EC
(µS/
cm)
Ars
enic
(ug
/L)
136 Final Report on Development of Deep Aquifer Database and Preliminary Deep Aquifer Map

70
Bah
adu
rpu
r un
ion
par
ish
ad
Bah
adu
rpu
rB
ahad
urp
ur
Mad
arip
ur S
adar
M
adar
ipu
r22
8.66
90
.145
323
.234
85
300
<1
71
Ab
du
l Ku
dd
us
Kh
an
Hau
sdi
Du
dkh
ali
Mad
arip
ur S
adar
M
adar
ipu
r 25
9.15
90
.169
04
23.2
0456
30
02
Du
rgab
ard
i
72
Md
. Ala
ud
din
Ho
wla
dar
R
anad
ia
Gh
atm
ajh
iM
adar
ipu
r Sad
ar
Mad
arip
ur
289.
63
90.2
0402
23
.148
36
300
<1
73
Nar
ia B
azar
Bo
nik
sh
om
iti
Nar
ia
Nar
ia
Nar
ia
Shar
iatp
ur
365.
85
90.4
082
23.3
0708
>
2000
<
1
74
Mo
ng
ol H
ow
lad
ar
Putu
rju
ri
Mo
hip
al
Vad
org
on
jSh
aria
tpu
r27
4.39
90
.433
07
23.2
9083
>
2000
<
1
75
B. A
. Sh
amsu
al H
uq
A
kkal
Mah
amu
d
Zan
jira
Zan
jira
Shar
iatp
ur
274.
39
90.3
287
23.3
3729
10
50
2
M
on
shi k
and
i
76
Iqb
al m
aste
rN
ayen
pu
rK
had
erkh
aM
atla
b
Ch
and
pu
r19
8.17
90
.762
16
23.3
6706
19
80
<1
77
Kaz
i Su
ltan
M
ub
arak
kan
di
Mo
tlab
M
atla
b
Ch
and
pu
r14
3.90
90
.687
18
23.3
2303
15
50
<1
78
Ab
ul k
hae
r Tal
ukd
ar
Mo
nto
la
Sub
itp
ur
Fari
dg
on
jC
han
dp
ur
213.
414
90.8
5349
23
.184
14
570
<1
79
Raf
iqu
l Isl
am
Des
gao
n
Dak
shim
H
ajig
anj
Ch
and
pu
r25
0.66
90
.886
63
23.1
7791
10
70
<1
Gan
dh
arb
apu
r
80
Md
. Ru
hu
l am
in
Bal
um
ura
Pu
rba
Gu
pti
Fa
rid
go
nj
Ch
and
pu
r23
5.70
90
.865
76
23.1
7722
10
40
<1
81
Ab
du
l Mal
ek
Ho
tan
i D
aksh
im
Haj
igan
jC
han
dp
ur
245.
01
90.8
7531
23
.186
43
570
1
Gan
dh
arb
apu
r
82
Md
. Ab
ed (
U.P
.mem
ber
)B
rah
man
Sak
hu
aB
agh
adi
Ch
and
pu
r Sad
ar
Ch
and
pu
r21
5.33
90
.681
13
23.1
885
680
<1
83
Go
lam
Mo
staf
a S
hei
kdi
Pasc
him
B
alu
thu
pa
Fari
dg
on
jC
han
dp
ur
259.
14
90.7
1674
23
.187
14
540
<1
84
Ab
du
l Ham
id M
aste
rPa
ikas
ta
Ash
ikat
i C
han
dp
ur S
adar
C
han
dp
ur
208.
32
90.7
1398
23
.281
19
>20
00
<1
85
Zila
ni C
his
hti
Co
lleg
eB
ara
Sah
atal
iSh
ah
Ch
and
pu
r Sad
ar
Ch
and
pu
r20
9.23
90
.725
16
23.2
443
965
<1
M
ahm
ud
pu
r
86
Idri
sh S
hei
kh
Go
gra
Dak
shin
R
ajar
gao
n
Haj
igan
jC
han
dp
ur
221.
43
90.7
707
23.2
5235
12
80
<1
87
Mr.
Saifu
l Isl
am
Suar
apar
aSh
ahra
sti
Shah
rast
iC
han
dp
ur
233.
47
90.9
538
23.2
5377
10
20
<1
88
Md
. Kaw
ser
An
ayet
pu
rPu
rbo
K
ach
ua
Ch
and
pu
r25
9.14
90
.844
43
23.3
5624
>
2000
<
1
mo
had
ebp
ur
89
Eng.
Zah
iru
l Haq
ue
Pi
pu
lko
ra
Asr
up
pu
rK
ach
ua
Ch
and
pu
r21
3.41
91
. 012
53
23.2
4875
>
2000
13
5
90
Ad
u t
ahai
r Pat
uw
ari
Ban
sh p
ara
C
hh
agai
nai
ya
Ch
hag
ain
aiya
Fe
ni
146.
341
91.5
0621
23
.042
676
08
91
Up
azila
Par
ish
ad
Ch
hag
ain
aiya
C
hh
agai
nai
ya
Ch
hag
ain
aiya
Fe
ni
137.
20
91.5
062
23.0
4259
42
04
Sampleno.
Ow
ner
/Car
etak
er's
nam
eV
illag
eU
nio
nU
paz
ilaD
istr
ict
Dep
th (m
) L
on
g (0
)La
t (0
)EC
(µS/
cm)
Ars
enic
(ug
/L)
137Final Report on Development of Deep Aquifer Database and Preliminary Deep Aquifer Map

92
Shah
Ala
m
Mad
hya
bas
ura
Fu
lgaz
i Fu
lgaz
i Fe
ni
202.
07
91. 4
2269
23
.142
99
410
6
93
Am
inu
l Haq
ue
Mo
jum
der
Ja
gat
pu
rD
arb
arp
ur
Fu
lgaz
iFe
ni
178.
60
91.4
5608
23
.121
12
790
8
94
Haz
i Ab
du
l Kh
aer
Ch
ar K
ho
az
Son
agaz
i So
nag
azi
Fen
i22
8.66
91
.403
99
22.8
3979
50
0<
1
95
Nu
rul H
ud
aD
aksh
in K
arim
pu
r D
agan
bh
uiy
an
Dag
anb
hu
iyan
Fe
ni
215.
50
91.3
226
0.91
507
>20
00
<1
96
Man
iru
l Isl
am
Mo
karb
pu
r M
oka
rbp
ur
Nan
gal
kot
C
om
illa
167.
33
91.1
9367
23
.183
24
550
5
97
Mo
fizu
r Rah
aman
A
sokt
ola
B
agm
ara
Sad
ar D
aksh
in
Co
mila
25
9.14
91
.148
11
23.3
3621
85
0<
1
98
Md
. Naz
rul I
slam
B
uri
chan
g
Bu
rich
ang
B
uri
chan
g
Co
mill
a17
9.37
91
.124
56
23.5
6458
43
011
99
Md
. Ab
du
l ku
dd
us
Nai
gh
or
Bra
hm
an P
ara
Bra
hm
an P
ara
Co
mill
a19
8.17
91
.119
87
23.6
1372
45
01
100
Up
azila
Par
ish
ad
Bra
hm
an P
ara
Bra
hm
an P
ara
Bra
hm
an P
ara
Co
mill
a17
9.40
91
.103
27
23.6
1448
66
01
Sampleno.
Ow
ner
/Car
etak
er's
nam
eV
illag
eU
nio
nU
paz
ilaD
istr
ict
Dep
th (m
) L
on
g (0
)La
t (0
)EC
(µS/
cm)
Ars
enic
(ug
/L)
138 Final Report on Development of Deep Aquifer Database and Preliminary Deep Aquifer Map

139Final Report on Development of Deep Aquifer Database and Preliminary Deep Aquifer Map
Fig
ure
6.2
2: L
oca
tio
n m
ap o
f dee
p t
ub
e w
ells
sam
ple
s fo
r ars
enic
an
alys
is u
nd
er t
his
pro
ject

140 Final Report on Development of Deep Aquifer Database and Preliminary Deep Aquifer Map
The quality of analysis is very good as good agreement between the original sample and blind duplicate
sample have been reported as shown in Figure 6.23. Only for one sample, where the arsenic concentration
was very high, there was a wide variation between the original and duplicate sample. This has been analyzed
a number of time and the variations seems to stay for some unknown reasons.
Figure 6.23: Comparison of original and duplicate sample analysis results of 10 samples analyzed at the Environmental
Engineering Laboratory of BUET.
Results of the analyses of groundwater samples collected from 100 deep tube wells show that most of the
well water (85%) contains arsenic below the WHO provisional limit of 10 µg/L; 10% of the wells fall in
between the Bangladesh and WHO limit and only 5% exceeded the Bangladesh limit (Figure 6.24). These
results are consistent with previous investigations such as the BGS & DPHE (2001). A large number of samples
reported to have arsenic in the range of 10 to 50 µg/L by the DPHE Zonal Laboratories could not be
confirmed by this study. This is another confirmation about the uncertainty of analytical accuracy of arsenic at
the DPHE Zonal Laboratories.
Figure 6.24: Distribution of arsenic concentrations in 100 samples analyzed at the Environmental Engineering Laboratory of BUET collected under this project
0
50
100
150
200
250
300
1 2 3 4 5 6 7 8 9 10Sample Number
As
Co
nce
ntr
atio
ns
(ug
/L)
Original Duplicate
85
10 5
0
20
40
60
80
100
% o
f Sam
ple
s
<10 >10<50 >50
As Concentrations (ug/L)
141Final Report on Development of Deep Aquifer Database and Preliminary Deep Aquifer Map
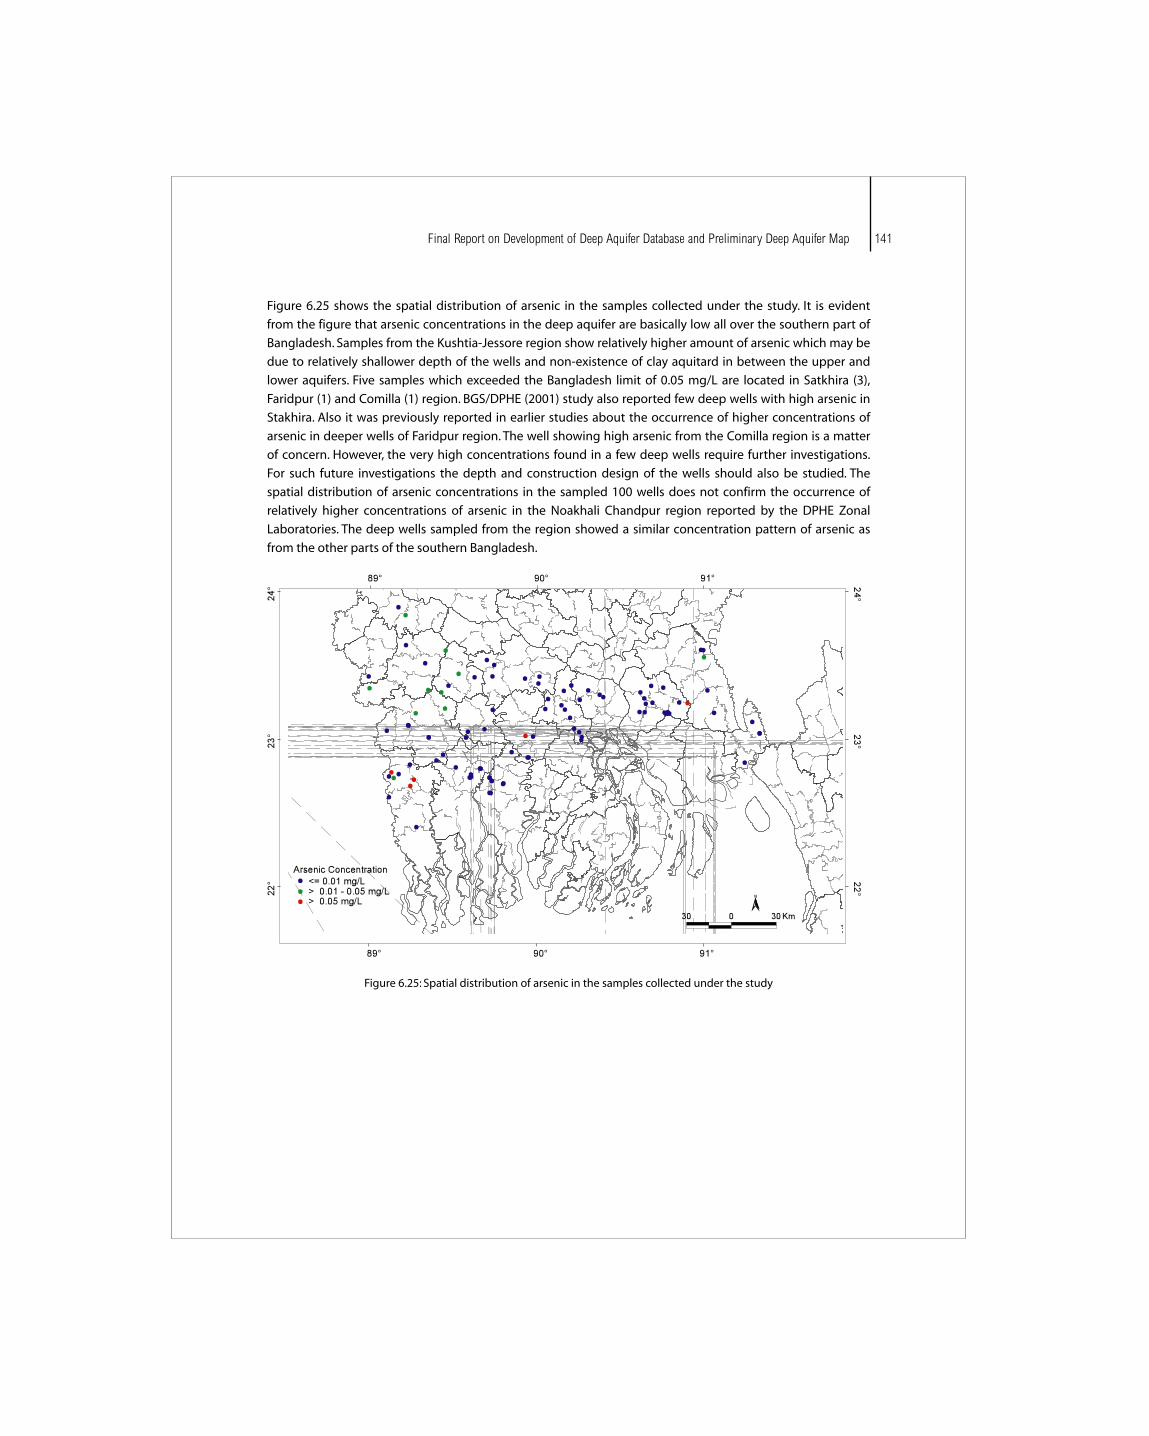
Figure 6.25 shows the spatial distribution of arsenic in the samples collected under the study. It is evident
from the figure that arsenic concentrations in the deep aquifer are basically low all over the southern part of
Bangladesh. Samples from the Kushtia-Jessore region show relatively higher amount of arsenic which may be
due to relatively shallower depth of the wells and non-existence of clay aquitard in between the upper and
lower aquifers. Five samples which exceeded the Bangladesh limit of 0.05 mg/L are located in Satkhira (3),
Faridpur (1) and Comilla (1) region. BGS/DPHE (2001) study also reported few deep wells with high arsenic in
Stakhira. Also it was previously reported in earlier studies about the occurrence of higher concentrations of
arsenic in deeper wells of Faridpur region. The well showing high arsenic from the Comilla region is a matter
of concern. However, the very high concentrations found in a few deep wells require further investigations.
For such future investigations the depth and construction design of the wells should also be studied. The
spatial distribution of arsenic concentrations in the sampled 100 wells does not confirm the occurrence of
relatively higher concentrations of arsenic in the Noakhali Chandpur region reported by the DPHE Zonal
Laboratories. The deep wells sampled from the region showed a similar concentration pattern of arsenic as
from the other parts of the southern Bangladesh.
Figure 6.25: Spatial distribution of arsenic in the samples collected under the study