Embed Size (px)
Citation preview

#2014-091
Diverse we stand: Horizontal inequality and ethno‐communal conflict in Indonesia
Bart Kleine Deters and Zina Nimeh Maastricht Economic and social Research institute on Innovation and Technology (UNU‐MERIT) email: [email protected] | website: http://www.merit.unu.edu Maastricht Graduate School of Governance (MGSoG) email: info‐[email protected] | website: http://mgsog.merit.unu.edu Keizer Karelplein 19, 6211 TC Maastricht, The Netherlands Tel: (31) (43) 388 4400, Fax: (31) (43) 388 4499
UNU‐MERIT Working Paper Series
UNU-MERIT Working Papers
ISSN 1871-9872
Maastricht Economic and social Research Institute on Innovation and Technology, UNU-MERIT
Maastricht Graduate School of Governance
MGSoG
UNU-MERIT Working Papers intend to disseminate preliminary results of research
carried out at UNU-MERIT and MGSoG to stimulate discussion on the issues raised.

Diverse We Stand: Horizontal Inequality and Ethno‐Communal Conflict in Indonesia
Authors: Bart Kleine Deters and Zina Nimeh1
Keywords: Horizontal inequality, ethno‐communal conflict, human security, Indonesia
JEL Classification code: D63
Abstract: This paper aims to shed some light on the drivers of (relatively) small‐scale ethno‐
communal violence within an ethnically diverse state, by quantitatively examining the relationship
between horizontal inequalities and ethno‐communal violence. Specifically it addresses the
complexity in assessing the effect of Horizontal Inequality on ethno‐communal conflict in Indonesia.
The paper examines the case of Indonesia around the time of the downfall of the New Order regime
and the first years of the reformasi (roughly 1997‐2003). Different HI indicators are constructed and a
pooled time series cross‐sectional probit regression is utilised, using deadly ethno‐communal
violence as a binary (dummy) dependent variable. The research measures HI indicators across five
dimensions (health, employment, education, housing and network connectivity), which are further
subdivided into access and achievement variables.
Results show that while horizontal inequalities can be considered a determinant for ethno‐communal
conflict, there are marked differences in the society for different groups, in this case linguistic versus
religious groups. Preliminary results show that a common basis is formed by horizontal inequalities in
malnutrition and water source. A main driver of the ethno‐religious estimations has been adult
educational attainment, pointing out to a narrative where schooling – and the career chances that
come with it – is something for the privileged groups, leading to frustration among the
disadvantaged.
This study adds to the existing literature on horizontal inequalities and conflict by building on
previous studies and looking further at a broad range of horizontal inequality indicators within the
diverse context of Indonesia. We reflect on the notion that there is not a single dimension with a
clearly stronger explanatory strength than another. Rather, it is the combination of different facets of
horizontal inequality that enables us to uncover the variation in the data.
1 Bart Kleine Deters (research assistant at MGSoG) [email protected]; and Zina Nimeh
(assistant professor at UNU‐MERIT/MGSoG) [email protected].

2
TableofContents
List of Tables and Figures (to be updated) .............................................................................................. 3
I. Introduction ..................................................................................................................................... 4
Introduction to the topic ..................................................................................................................... 4
Statement of the Problem ................................................................................................................... 5
Horizontal Inequalities .................................................................................................................... 5
Conflict ............................................................................................................................................ 6
II. Literature Review ............................................................................................................................ 8
Horizontal inequality and conflict ....................................................................................................... 8
Indonesian context ............................................................................................................................ 10
Horizontal inequality and conflict in Indonesia ................................................................................. 11
Discussion .......................................................................................................................................... 14
III. Methodology ............................................................................................................................. 17
Level of analysis ................................................................................................................................. 17
Variables ............................................................................................................................................ 18
Dependent variable ....................................................................................................................... 18
Independent variables ................................................................................................................... 19
Measuring horizontal inequalities ................................................................................................. 20
Control variables ........................................................................................................................... 21
Data ................................................................................................................................................... 21
Regression analysis ............................................................................................................................ 23
Limitations ......................................................................................................................................... 24
IV. Results ....................................................................................................................................... 27
Summary statistics ............................................................................................................................ 27
Results ............................................................................................................................................... 31
Robustness checks ............................................................................................................................. 36
Change in horizontal inequalities over time ..................................................................................... 40
V. Discussion & Conclusion ................................................................................................................ 42
Horizontal Inequalities & Conflict ................................................................................................. 42
Conclusions ........................................................................................................................................ 44
Bibliography ........................................................................................................................................... 47

3
ListofTablesandFigures
Figure #01: Provinces covered by study ……………………………………………………………………………………………22
Table #02: Overview of variables ……………………………………………………………………………………………………..24
Table #03: Sample distribution of linguistic and religious groups……………………………………………………..27
Table #04: Mean and Standard Deviation for survey year 1993………………………………………………………..28
Table #05: Mean and Standard Deviation for survey year 1997………………………………………………………..29
Table #06: Ethno‐lingual estimation results……………………………………………………………………………………...32
Table #07: Ethno‐religious estimation results……………………………………………………………………………………33
Table #08: Pooled time series cross‐sectional estimation of both ethnic classifications……………………34
Table #09: Pooled time series cross sectional analysis using only ethnically diverse districts……………37
Table #10: Pooled time series cross sectional analysis using only districts outside of Jakarta……………38
Table #11: Pooled time series cross sectional analysis using only districts without a history of ethno‐
communal violence…………………………………………………………………………………………………………………………..39
Table #12: Estimation results of change in variables over time…………………………………………………………42

4
I. Introduction
Introductiontothetopic
Over one billion people worldwide are living in ‘fragile’ situation and affected by conflict, crime, and
violence (World Bank, 2011), and while it might be argued that the era of large interstate conflicts as
we have known them is behind us, intrastate conflicts draw a different picture (Eriksson &
Wallensteen, 2004). Intrastate conflict can take many forms, such as intra‐communal violence
(between different groups in society, where the state is not directly involved), secessionist (where a
party tries to break away from the state) or civil war (where one or more groups try to replace the
current state apparatus) (G. K. Brown & Langer, 2010). Within this sub‐set of conflicts, identity has
become more important than ever, with 70 per cent of the conflicts in 2010 being coded as ‘ethnic’
(compared with 15 per cent in 1953) (Marshall, 2012).2
Identity underlies conflicts to distinguish between the “right” and the “wrong” side, between the
“good” and the “bad”, the “us” versus “them”. It serves as a common banner, and features
prominently in the narrative used to justify violence. Based on these narratives, some put forth the
argument that the sheer co‐existence of different ethnic or religious groups is enough to spark
conflict (Huntington, 1993). However, it is often overlooked that the number of peaceful multi‐ethnic
and multi‐religious countries is still larger than those who actually do experience violence; thus
making this inability to coexist a partial rationalisation at best. A more thorough analysis is provided
by the theory of horizontal inequalities, which links ethnicity, conflict and deprivation.
Horizontal inequality is a form of social exclusion where a certain group (be it an ethnic, linguistic,
religious or otherwise distinctly defined group) is structurally disadvantaged vis‐à‐vis another group.
This disadvantage can be political, socio‐economic, cultural or – most of the time ‐ a combination of
those aspects. Where an unequal access to resources runs along ethnic lines, the chances of
successful violent mobilisation are higher than where only one of the two is present. The theory was
introduced by Frances Stewart in the early 2000s, not so much as an alternative, but more as an
addition to the existing discourse on poverty and conflict (Stewart, 2000).
Governments have reacted differently to the existence of horizontal inequalities within their borders.
Some – such as Russia in Chechnya or Iraq under Hussein in Kurdistan – have used military repression
to prevent or suppress the mobilisation of popular unrest where horizontal inequalities existed, while
others – like Northern Ireland and Côte d’Ivoire under Houphouët‐Boigny – tried to attenuate the
2 This research will use the broad definition of ethnicity, which includes religion, ethnicity, nationality or another distinct cultural characteristic.

5
inequalities via inclusive social policies. Although the latter approach intuitively seems to be more
effective, it does not necessarily lead to a peaceful coexistence of different groups. The Holy Grail – if
it exists at all – has not yet been found. No two cases are alike, and therefore there are always
variables lurking in the dark, waiting for the unwary modern Percival. Policies that might work in one
country, can fail to do so in the next. Due to the many observed and unobserved factors at play in
each case, cause and effect gets easily tangled. More formally: differences in populations and
differences in settings are potential threats to external validity (Stock & Watson, 2002). The
population in country X is likely to be different from the population in country Y, for known or
unknown reasons. Even if the population is exactly the same, extrapolating from one country to the
next might not be possible due to different settings, such as different laws, a different zeitgeist, and
different economic situations amongst others. Again, it is especially the factors that the researcher
cannot know that make it hard to extrapolate to other cases.
The best way to address this situation is to study a multi‐ethnic state, with different cases of
horizontal inequalities. This way the undetermined unknowns are likely to be constant, and thus no
threat to the validity. The Republic of Indonesia seems to be the ideal candidate; this archipelago
state has many distinct island groups, with a wide variety of languages, religions and ethnicities. It
has seen a myriad of violent conflict (secessionist violence in Timor‐Leste, Aceh and Papua and
communal violence mainly on the Maluku islands, Sulawesi and Kalimantan), with the latter taken
place mainly surrounding the breakdown of the New Order regime at the end of the nineties.
StatementoftheProblem
The subject of the paper is to investigate how horizontal inequalities can influence conflict. This
subsection will describe both items, discuss the relationship between each and define the main
problems.
HorizontalInequalities
The central subject of the paper is the horizontal inequality, which consists of two parts: inequality
and the group. While examples exist of different groups facing different inequalities, usually a group
faces deprivation in multiple areas. Theory prescribes that political inequality is the mother of all
inequality, since it gives access to distributive decision‐making and all the opportunities for
corruption and nepotism that come with it.
The defining aspect of horizontal inequality is that it is aligned with a certain group – that the
difference between the have and have‐nots is not based on skill, hard work or plain luck, but on the
ethnicity, religion or caste to which one belongs. While the group element gives the horizontal
inequality theory its explanatory strength, it also creates a conceptual problem: how to define a
6
group? People are almost invariably part of multiple groups and can usually change their
membership of groups (e.g. religious affiliation). It is thus impossible to categorise people in an
exhaustive (everybody must fit into a certain group) and exclusive (nobody can be a member of more
than one group) way (G. K. Brown & Langer, 2010).
Nevertheless, many conflicts have been – and are being – based on group affiliation. It seems that
while scientifically ethnic categorisation is at best an artificial method, in the hearts and minds of the
people involved the distinctions are very real. Perceptions – both of the horizontal inequalities and
the groups – play a crucial role in the processes that lead to violence. Leaders can manipulate their
followers to divert attention from intra‐group inequality towards ‘the other’.
Conflict
Despite the widespread existence of horizontal inequalities and ethnic animosity, conflict is much
less common. It thus cannot be explained by referral to group‐bound inequality alone, and there is a
need to look further. Perceptions and how these are played out by so‐called ‘ethnic entrepreneurs’
might be what lights the fuse, but a fuse without an explosive load attached to it will give nothing but
a spark.
Two competing views are often brought into this discussion: the cultural hypothesis and the
instrumental hypothesis. The cultural hypothesis states that an ethnic difference in itself is the root
cause for conflict, and that a peaceful coexistence of ethnic groups is untenable in the long run. Its
main advocates are Huntington (1993) and Kaplan (1994). The instrumental hypothesis sees those
differences as merely instrumental, that the real causes being economic or political factors. The main
scholars defending this strand of thought are Gurr (1970) and Horowitz (1985).
Horizontal inequality theory is related closely to the instrumental theory. The association between
horizontal inequality and conflict has been shown more often (see Stewart (2011) for an overview),
but it remains unclear whether the inequality itself causes the conflict, or if it is the perception of
these inequalities. This difference matters because perceptions need not reflect reality. Take for
example the Third Reich’s depiction of the Jews as the dominant economic and political force in
Weimar’s Germany. While this perception was absolutely fact‐free, it helped create the environment
that justified persecution and in which the Holocaust could develop.
To sum up, while a scientifically sound categorisation of ethnicity is a long shot, identities as
perceived by the individuals themselves and their society matter. If it is indeed only those
perceptions that matter or if there also needs to be an objective socio‐economic, cultural or political
difference is still subject to debate.
7
Arehorizontalinequalitiesadeterminantofethno‐communalconflict?
The primary purpose of this paper is to quantitatively assess whether horizontal inequalities have
been a determining factor in the ethno‐communal violence that took place in Indonesia between
1998‐2003. The rationale for the study is provided by the realisation that the nature of conflict has
changed dramatically over the past twenty‐five years, as is signified by the sharp – relative – increase
in intra‐state ethnic conflicts. Especially intra‐communal violence, in which tensions after years of
simmering suddenly escalate – leaving its mark on communities for years to follow – is hard to
predict and even harder to prevent. While not disregarding the role of community leaders and
perceptions, the horizontal inequality theory states – and has provided evidence – that political,
socio‐economic and cultural inequalities between groups are at the root of ethnic conflict. By
extension, reducing those inequalities will also reduce the propensity of conflict.
It is precisely this extension which policy makers should be interested in. Politicians trying to create a
stable and peaceful society will want to know which horizontal inequalities are most devastating to
the cohesion in their communities. Unfortunately, current research has not been able to provide an
answer to this– although many scholars have delved into the subject matter.3 The reason for this is
that most of this research has used only a few indicators of horizontal inequality, which the author
believes is too little to draw strong conclusions. Horizontal inequalities are often intertwined; lower
educational attainment, for example, negatively affects ones chances on the labour market, leading
to lower household income and worse housing condition. It is thus true that using only a few proxies
a good model can still be created, but such a model does not help policy makers trying to determine
what the root problems are. Therefore this paper will look at a wide variety of horizontal inequalities
– both access and achievement – to try and determine what the most important horizontal
inequalities are, thereby providing an addition to existing literature.
We hypothesise that Horizontal Inequalities are a determinant of conflict, and we view this
hypothesis as an expression of the instrumental theory. Specifically we investigate if a) Ethnic
diversity is a determinant of conflict and/or b) Horizontal Inequalities are a determinant of conflict.
3 See Stewart (2011) for an overview of research involving horizontal inequalities, some of which will be discussed in the literature review.

8
II. LiteratureReview
Horizontalinequalityandconflict
In this section we specifically review two papers that quantitatively test the link between horizontal
inequality and conflict in a cross‐country comparison. Challenging the idea that inequality and
conflict are unrelated, Gudrun Østby conducted a large N‐study to test group influences on conflict
(Østby, 2008). The purpose was to test the effect of vertical inequality, polarisation and horizontal
inequality on the onset of conflict. The main independent variables were vertical economic and social
inequality (measured using the Gini‐coefficient), ethnic, social and economic polarisation and social
and economic horizontal inequalities. The economic variable was based on household assets, and the
social variable on years of education completed. The horizontal inequalities were defined as where
the social or economic inequalities coincide with ethnic boundaries. Using economic development,
population size and conflict history as control variables, a logistic regression with country‐clustered
standard errors was run.
Both vertical inequality indicators were not significantly related to the outbreak of civil conflict.
Ethnic polarisation as such also did not have a discernible influence on the dependent variable.
Economic and social polarisation were both positive and significant, lending credibility to the theory
that countries with a few clearly‐delineated, internally strongly homogenous groups, and large
intergroup differences, are more probably to experience violent conflict (Esteban & Ray, 1994). As
expected, horizontal social inequality was a significant determinant variable. However, the influence
of horizontal economic inequality failed to reach significance at any conventional level. This was
surprising, since it indicates that the combination of ethnicity and economic polarisation is less
powerful than economic polarisation alone.
Østby theorised that household asset ownership might not be reflective of the ‘real’ ethnic economic
inequalities in a given society, but did not substantiate this claim. It seems more likely that there was
a lurking group variable – other than ethnicity (unfortunately, the author did not define the concept)
– which influenced both the chance of conflict and economic assets. Such a variable could be class
distinctions, which is known to have led to Maoist/communist violent conflict in developing countries
such as Peru and Nepal (Murshed & Gates, 2005). While the paper did suffer from a number of
limitations, including data issues, the author did conclude that neither ethnicity, nor vertical
inequalities alone are sufficient to explain the nascence of conflict but that it seems likely that
horizontal inequality is an important factor.
An even more ambitious attempt to show the link between horizontal inequality and conflict has
been undertaken by Cederman, Weidmann and Gleditsch (2011). Combining a host of different

9
datasets, the authors managed to create a worldwide dataset with inter alia geo‐coded information
on ethnic groups’ settlement areas, spatial wealth measures, economic activity and access to state
power. Their main purpose was to check if the existence of economic and political horizontal
inequalities increased the probability of ethnic‐driven civil war. It was theorised that the path from
group asymmetries to conflict goes via two intermediate steps. The first step is the realisation that
objective horizontal inequalities only become grievances when groups start comparing their
collective assets with other groups. After grievances have become salient, violent collective action is
only triggered through a process of group mobilisation led by group leaders. Although this seems
rather obvious, it indicates that horizontal inequalities as such might be a necessary, but not a
sufficient condition for conflict.
The authors limited themselves to ethnic‐driven civil war. Conflict was considered ethnic‐driven if the
rebel group “expresses its political aims (at least partly) in the name of the group and a significant
number of members of the group were participating in the conflict” (Cederman et al., 2011, p. 384).
This definition was also used as the binary dependent variable. The economic horizontal inequality
was measured as the distance of the group’s GDP per capita to the average for the entire country.
This allowed for both positive and negative distances (both relatively wealthier and poorer), and thus
to check if horizontal inequalities work both ways. Political inequality was captured in a binary
measuring exclusion from country‐level central decision‐making power. Controlling for GDP per
capita (nation‐wide), number of excluded groups in the country and years lived in peace, a logit
regression was run.
The results of the regression were in line with the horizontal inequality theorem. Economic
horizontal inequality had a highly significant and substantial effect on the occurrence of civil war.
This was true for both relatively wealthy and relatively poor ethnic groups. Horowitz (1985)
explained this by pointing out that well‐off groups in society might fear that their privileges will be
taken away, and will consequently rebel. The effect of GDP per capita was negative, indicating that
richer countries are less prone to civil war – although this might have been an endogenous process.
Interestingly, the number of groups excluded from power had a significant negative effect, which
evidences Walter’s theory (2006) that in ethnically rich countries central government is inclined to
act very repressive towards minority claims, to prevent a chain reaction of separation movements.
Lastly, the political horizontal inequality variable was positive and significant (especially in tandem
with the economic inequality), which might indicate a grievance‐based leader‐follower dynamic.
This dynamic, however, need not follow the two‐step theory put forward by the authors. It could
very well be that the process of group comparison is instigated and influenced by community leaders
aiming to enlarge their power base, making the horizontal inequalities largely instrumental. In other

10
words, the two‐step theory is not proven nor rejected, which is the largest limitation of the paper.
Other limitations flow mainly from the large scope of the research.
Indonesiancontext
A former Dutch colony, Indonesia has been ruled by authoritarian leaders for the majority of its
independence, most notably general Suharto, who headed the country from 1967 to 1998. His ‘New
Order’ regime was based on an implicit social contract which promised its citizens “prosperity and
stability in exchange for acceptance of authoritarian government” (Liddle, 1999, p. 37). By opening
up the country for foreign investment prosperity was attained, despite large‐scale nepotism and
corruption. Stability was ensured by a repressive military. As a side‐effect of the rapid economic
growth inequality increased as well (Mancini, 2008). This creation of have and have‐nots might have
contributed to the rise in ethnic tensions during the nineties (Booth, 2000).
The social contract worked as long as economic growth persisted. When the Asia currency crisis
unexpectedly hit Indonesia in the fall of 1997 both inflation and poverty skyrocketed – poverty rates
rose from 15% in the beginning of the crisis to 33% by the end of 1998 (Suryahadi, Sumarto, &
Pritchett, 2003). This sharp increase was mainly caused by rising food prices – rice for example
became on average twice as expensive – and had an uneven impact across Indonesia, both
geographically and socio‐economically. On top came a large draught combined with ravaging forest
fires in Sumatra, Kalimantan and Sulawesi. Suharto could no longer deliver the prosperity he
promised in the social contract and was forced to step down in May 1998 (Liddle, 1999).
The fall of Suharto marked a turning point in Indonesian history. The country had to reinvent itself,
find a new workable social contract and transform from an autocratic centrist state to a
decentralised democracy (Mishra, 2002). This process, which had already started in the dying years
of the New Order regime, was marred by episodes of violence. The violence can roughly be divided in
two groups, secessionist and ethnic violence. Secessionist conflict – mainly in Aceh, Papua and Timor‐
Leste – had been existent for decades and only became more intense during this period. Ethnic
collective violence – where the state was not directly involved ‐ had been largely absent from the
archipelago in the previous decades, however. The violence took a myriad of forms, ranging from
anti‐Chinese pogroms on Java, religious strife between Muslims and Christians in the Maluku’s to
anti‐migrant violence targeting the Madurese in Kalimantan.
In the years preceding the transformation Indonesia had always been described as a country without
searing ethnic tensions; the sudden apex in violence surprised many political scientists (Boo Teik,
2004). It was feared that the country might break up, like the Soviet Union had done the decade
before (Uhlin, 1999). This proved to be untrue. Only Timor‐Leste gained independence, but the
11
Indonesian occupation of the island had always been seen as illegitimate (United Nations Security
Council, 1975). Furthermore, large scale ethnic violence has been virtually absent after 2003 (World
Bank, 2010). It is clear that the violence was able to erupt due to the power vacuum in the chaotic
years of the so‐called reformasi, but it is still unclear what caused these sudden outbursts.
While some authors have a rather simplistic view (such as the alleged violent Indonesian culture
(Colombijn & Lindblad, 2002)), most authors view the violence as a complex interplay of factors,
actors and opportunities. Common discussion points are grievance versus greed and ethnic tensions
as either a cause or an effect. What is typical about the collective violence is its high concentration in
both time and space. It is estimated that only 15 districts (which represented 6,5% of the total
population) accounted for 85,5% of all deaths in episodes of collective violence (Varshney,
Panggabean, & Tadjoeddin, 2004). The incidence of collective violence started to rise at the end of
1996, peaked in 2000 and then dropped sharply afterwards; it started before the Asia crisis fully hit
Indonesia, and continued for a couple of years after the fall of Suharto.
HorizontalinequalityandconflictinIndonesia
Several authors have combined the conflict data with socio‐economic databases to determine the
characteristics that made these particular districts descend into violence while the majority of
Indonesia remained relatively peaceful.
In 2008 Mancini used Indonesia to study the link between horizontal inequality and ethno‐communal
violence (Mancini, 2008). In his opinion, inequality between ethnic groups is an important
determinant of violence in an ethnically diverse environment. The study combined socio‐economic
information from the 1995 Indonesian Intercensal Population Survey with the UNSFIR II conflict
dataset in order to facilitate a district level analysis. To account for the diversity and variation of
ethnic composition in districts, a horizontal inequality indicator was used which is sensitive to group
size, without mixing it with vertical inequality, the so‐called ‘group‐based coefficient of variation
weighted by group size’ (GCOV).
Using a binary as the dependent variable to determine whether deadly ethnic violence occurred
between 1997 and 2003, a logit regression was set up which measured the following socio‐economic
indicators: average years of education, proportion of landless agricultural labourers and poor
farmers, proportion of unemployed young males, income inequality, proportion of civil servants and
child mortality rates. Ethnically homogenous districts were omitted from the regression, since the
author asserted that by definition ethnic conflict is impossible in those districts. According to the
regression, the probability of deadly ethno‐communal violence was higher if the district’s HDI was

12
lower,4 the proportion of the population which consists of migrants was higher,5 the number of
conflicts between 1990 and 1996 was higher and the gap between child mortality rates was higher.
The other factors had no significant impact. The effect of child mortality rates turned out to be the
strongest and most consistent in different configurations. Interestingly, when the change over time
was measured for child mortality – based on the 1990 Indonesian census survey – the rates on
average nearly halved, but inequality had risen on average, and especially so in those districts that
experienced collective violence.
Mancini concluded that child mortality reflects other socio‐economic inequalities, such as housing
quality, healthcare and education levels and can thus be used as some sort of proxy. A possible
reason for the strong link could be the strong emotional and symbolic value of infant mortality,
which can be used instrumentally to fan ethnic hatred. The relation between a low HDI score and
violence was explained by the Asia crisis, which might have exacerbated existing inequalities. The
overall conclusion was that vertical income inequality – which has had no significant effect – is not
sufficient to predict the probability of ethnic violence, where horizontal inequalities might be.
Mancini’s research suffers from the same limitation the other horizontal inequality based papers:
using a dummy as the dependent variable. A binary variable is simply not able to grasp the diversity
of the different conflicts: some lasted only an afternoon, but were extremely violent, causing
hundreds of deaths while others were more protracted, carrying on for weeks but on a much smaller
scale. The author’s choice to exclude Java because of its ethnic homogeneity can be criticised on the
ground that the island saw a number of very violent anti‐Chinese riots. The fact that this violence was
one‐sided and aimed at a demographically marginal group in society does not preclude that it is
ethno‐communal violence, and it should therefore have been included in the analysis. Lastly, since
only one horizontal inequality variable (child mortality) is significant, the conclusion that horizontal
inequalities play an important role in predicting the likeliness of ethnic violence is not particularly
convincing.
Much of the same criticism was also voiced by Mohammad Zulfan Tadjoeddin, in his article on ethnic
violence in Indonesia (Tadjoeddin, 2013). He highlighted two possible explanations: grievance and
greed. The former comes from previously privileged groups, who in the years before the violence
were losing their advantaged position. Citing Gurr’s (1970) concept of relative deprivation – the
discrepancy between what people think they deserve and what they get – Tadjoeddin theorised that
the frustrations that came with this process fuelled the potential for violence. The greed factor was
4 Based on 1996 figures. It is meant as a proxy for the level of economic development. 5 An important feature of New Order politics was transmigrasi, a program in which Javanese families were moved to other provinces in order to ‘Javanise’ Indonesia. For a narrative on how this process influenced the conflict in Aceh, see G. K. Brown (2005).

13
explained by the process of economic and political decentralisation that has taken place at the same
time, inciting inter‐ethnic competition to control state resources at a local level.
The paper also looked at the district level to discover factors influencing the ethnic violence between
1997 and 2002. Conflict data were drawn from the UNSFIR II database, and the Indonesian statistical
office was used for socio‐economic data. The dependant variable was ethnic violence at the district
level, measured by an ordinal scale, running from zero to six, with increasing steps of severity.
Grievance was measured by a so‐called ‘education poverty gap’, which is the distance between the
level of education and the level of poverty. The relative deprivation theory prescribes that educated
but poor people feel that they deserve more than they get and therefore get frustrated. Since greed
was defined as the desire to control state resources at the local level, it has been measured by total
district revenue after decentralisation. Controlling for population, Java,6 magnitude of the recession
and pre‐crisis growth, an ordered logistic regression was used to discover the determinants of ethnic
violence.
The results of the regression showed a positive, highly significant effect of grievance on the severity
of ethnic violence, which was consistent over different configurations. Greed, the magnitude of the
recession and pre‐crisis growth had no significant influence. Tadjoeddin concluded that the data
support Gurr’s theory that education makes people realise that they are not getting their just desert,
making the combination of highly educated and poor a dangerous mix. As to why the violence took
place during this particular period, the author pointed to research showing the vulnerability of
countries to violence during the early stage of democratisation (Hegre, Ellingsen, Gates, & Gleditsch,
2001). After the democracy has consolidated itself, it provides peaceful avenues to channel both
greed and grievances.
Tadjoeddin’s theory of convergence, where a previously privileged group’s frustrations are the main
cause of violence is intriguing, but ultimately unconvincing. The main reason is that he does not test
the theory by looking at the change in educational attainment and poverty for certain ethnic groups
within districts over time, but only at the education‐poverty gap for the entire district at one point in
time. His method thus fails to explain why the violence was ethnic, as opposed to anti‐governmental.
Furthermore, no actual convergence or divergence was measured, since the analysis treated only
one time point. Lastly, Tadjoeddin seems to be of the opinion that violence caused by convergence
disproves Stewart’s theory of horizontal inequality. The author believes this to be a
misunderstanding of horizontal inequalities, which may run both ways – as has been seen above.
6 According to the author, Java is structurally different from other islands, due to it being highly populated, ethnically homogenous and its low levels of ethnic violence.
14
Discussion
In the articles previously discussed, social horizontal inequalities were shown to be a significant
determinant of conflict. Differences in educational attainment and child mortality both have strong
mobilisation potential. One would expect the same for economic horizontal inequalities, but not all
studies find a significant effect. Most authors blame this lack of effect on the selection of variables. It
is true that data often limits the possibilities to check multiple possible causes, but the number of
independent variables (with the exception of Mancini’s research) has been rather limited. Therefore,
it seems expedient to try and use multiple variables for each category of horizontal inequality.
As Stewart (2000) stated, both relatively advantaged and relatively disadvantaged groups may start a
conflict. Tadjoeddin’s theory of divergence and convergence gives a helpful insight in when groups
will start a conflict. To test his hypothesis that disadvantaged groups will become violent when the
gap widens – and advantaged groups when the gap narrows – it is necessary to compare the
development of horizontal inequalities over time. Intuitively, disadvantaged groups might also rebel
when disparities do not change over time, as their position seems hopeless. This seems more unlikely
for advantaged groups, although advantaged regions might feel that they are better off on their own
– regardless of changes in inequality (G. K. Brown & Langer, 2010).
In Østby’s research, ethnic polarisation as such did not have a discernible effect on the probability of
conflict. This outcome discredits the cultural hypothesis, but does not necessarily mean that the
instrumentalist theory is correct. In fact, since she found that economic and social polarisation are
stronger determinants than social horizontal inequality the role of ethnicity might be less decisive
than expected. The nature of polarisation implies that there is still a group factor, but the distinction
between groups might also be based on class or region. By definition, this non‐ethnic type of
polarisation can only be socio‐economic or political.
As has been noted earlier, while horizontal inequalities might be a necessary, they are definitely not
a sufficient condition for conflict. Cederman’s, Weidmann’s and Gleditsch’ two‐step theory where
“objective political and economic asymmetries can be transformed into grievances through a process
of group comparison [and] such grievances trigger violent collective action through a process of
group mobilization” (2011, p. 481) captures this realisation, but fails to explain what triggers the
group comparison. This trigger could be external (e.g. economic or political shock) or internal (stirred
by group leaders). If the latter is true, this theory is more illustrative of a greed‐driven conflict than
the grievance explanation it pretends to be. In the author’s opinion, group comparison is more of an
automatic, continuous process, and a grievance only emerges if the outcome is deemed unfair. The
decisive factor is thus perception.
15
Perceptions are used in each article to help explain the link between inequality and violence. None of
the papers tests their influence, however. While this is not surprising, given that they are so hard to
quantify, it is important to keep in mind that this knowledge gap confounds any causal links that
might be found.
What does this all mean for the case of Indonesia? The high concentration of violence, both in time
and space, is somewhat puzzling. None of the districts where communal violence erupted around the
fall of the New Order regime have relapsed in the years after 2003,7 begging the question of why
conflict erupted at the time that it did. The environment of financial crisis and decay of the central
states is mostly explained as an opportunity for the violence to erupt, and not as a cause in itself. G.
Brown, Tajima, and Hadi (2005) show this opportunity aspect in a case study of Central Sulawesi. The
concurrent processes of decentralisation and decay of central state power made the old power
relations null and void, but did not replace them. This vacuum forced group leaders to ‘defend their
turf’, without being able to rely on previous arrangements or institutionalised processes. This
explanation is more akin to greed‐driven theories than horizontal inequality. Again, the fact that all
bouts of violence took place in a single period makes it hard to test this possible cause. Nevertheless,
it might be helpful to test whether districts that were split during the decentralisation process were
more likely to experience ethno‐communal conflict, as a rough proxy for greed as the explanation of
conflict.
Most articles explain horizontal inequality‐induced violence in an instrumental way: grievances are
uttered in such a manner that it will adjust the discrepancies, e.g. via a rebellion or by rioting against
the central authorities. The Indonesian bloodshed seems to be an expression of frustration or
perhaps ethnic hatred, since none of the violence was aimed at the politically dominant Javanese
population, although Javanese had transmigrated across the entire archipelago during the previous
decades and were often key local economic figures.8 If the violence was indeed solely propelled by a
need to let off steam, greed did not play a role ‐ there was simply nothing to be gained. The change
in ethnic composition of Central Sulawesi districts signals otherwise, however. By trying to remove
other ethnicities from a district, leaders could create a uniform constituency. This greed explanation
seems most likely in the case of split districts, given that such a partition shuffles existing power
relations (see for example the partition of India in 1947 (Brass, 2003)).
In hindsight, the literature review has given rise to more questions than answers. Yes, horizontal
inequalities can be a determinant of conflict, although different studies found different effects – and
7 Although some districts have seen terrorist attacks or incidents of low scale (ethnic) violence. 8 See Brown (2005) for a narrative on the process of transmigrasi and how it altered local economic and power balances in Aceh.

16
even then for only one or two horizontal inequalities. Yes, both diverging and converging inequalities
can be significant determinants of conflict, but is this also the case in Indonesia? Could it be that next
to grievance reasons, greed also played a role – especially in split districts? And lastly, is ethnicity the
right way to capture the relevant groups in a society? Østby found that political and economic
polarisation were a stronger determinant of conflict than horizontal inequalities, pointing to a group
explanation which might be totally outside the ethnicity debate.
A number of these questions will be addressed in the quantitative part of the research. To provide a
more certain answer to the research question the whole spectrum of horizontal inequalities will be
taken into account. This allows us to distinguish between the true determinants of conflict and those
inequalities that are merely proxies. Furthermore, the idea of converging and diverging inequalities
as determinants of conflict will be tested in the Indonesian context. Lastly, the research will
incorporate split districts as a control variable, to proxy a greed explanation of the ethno‐communal
conflict. The multi‐layered nature of perceptions and group categorisation is something that cannot
be measured, but should be kept in mind when interpreting the answers to the previous questions.
17
III. Methodology
Levelofanalysis
Horizontal inequality is by definition a group issue. Aggregation from the individual level is thus
needed to be able to compare different groups. Given that this research focuses on ethno‐communal
violence, the community of interest needs to be defined. Both Indonesia’s extraordinary diversity –
with over a hundred ethnic groups, almost thousand inhabited islands and a wide variety of religions
– and the finding that communal violence in Indonesia has been highly localised call for a comparison
at a low tier (Varshney et al., 2004). A compromise has to be found between a level that is low
enough to allow for sensible aggregation, and high enough to ensure sufficiently large subsamples.
The level of analysis chosen for this research is the district level. Indonesian districts are called
kabupaten (regency) for more rural regions and kota (city) for more urban regions. It is one tier
below the provincial level. The number of districts has grown rather rapidly as a consequence of the
reformasi, from 295 in 1990 to over 500 at the moment. This rationale for this proliferation is Law
22/1999, which assigned all expenditure decision‐making power to the district level, with the
exception of national defence, religious matters, central administration and foreign affairs. Needless
to say, this provided quite an incentive to form new districts. As a result, the variety among them is
considerable, both in size and population.9 Notwithstanding this heterogeneity, districts are a good
level of analysis for three reasons. First, the amount and reliability of data is of a sufficient level to
allow for statistical analysis. At lower levels, data is often missing or non‐existent. Second, the nature
of violence in Indonesia is so that it often crossed lower tier borders (inter‐village brawls, massive
demonstrations), while it (almost) always stayed within district borders. 10 Lastly, after
decentralisation districts became the prime state entity (Ahmad & Mansoor, 2002). The large amount
of decision‐making power made it an important object of contention between rivalling groups and
districts thus seems a logical unit of analysis.
Within districts, ethnic groups are the relevant unit of analysis. If necessary, information in each
indicator is aggregated either from the individual or the family level. Malnutrition, for example, is
measured individually, while flooring material is measured per household. The dataset used allows
for such a distinction.
9 The smallest district has just over 5,000 inhabitants and the biggest almost 5,000,000. The median and average are both around 250,000 (Citypopulation.de, 2012). 10 With the exception of violence in Jakarta, which is more likely to spread throughout the whole city.

18
Variables
Dependentvariable
The first issue is determining how broadly the violence variable will be defined. Collective violence is
defined in the conflict dataset as “violence perpetrated by a group on another group (as in riots), by a
group on an individual (as in lynching), by an individual on a group (as in terrorist acts), by the state
on a group, or by a group on organs or agencies of the state” (Varshney et al., 2004, p. 7). The
authors group violence in four categories: ethno‐communal, state versus society, economic and
other forms of collective violence.
Although intuitively ethno‐communal violence seems to be the category of interest, an argument can
be made to broaden the scope. Theoretically, while the underlying horizontal inequalities might very
well be of an ethnic nature, the violence need not be. It is perfectly imaginable that frustration born
out of horizontal inequalities might be vented via other forms of violence, such as land conflict,
political party rallies or violence against the state (via demonstrations). Given the overrepresentation
of certain ethnic groups (especially Javanese) in the police and armed forces, fear for repercussions
might rule out ethnic violence against these groups, making other violent alternatives more likely.
Focusing solely on ethno‐communal violence runs the risk of losing potentially valuable information.
On the other hand, allowing for a broader scope is likely to turn in a scientific guessing game: of what
forms of collective violence can horizontal inequality be a hypothetical determinant? While it has
been shown that ethnic indicators can be a significant determinant of ethnic conflict (specifically civil
war) (Sambanis, 2001), the relationship between ethnicity and other forms of violence is still hotly
debated. To avoid this slippery slope, a narrow definition of violence is thus adopted:
“violence perpetrated by a group on another group, by a group on an individual, or by an
individual on a group, in which ethnicity is the primordial factor used to identify the persons
involved or to explain the rationale for the violence”
The dependent variable measures whether deadly ethno‐communal violence took place in the
district during the period 1998‐2003. The use of a binary variable is explained by the relative rarity of
ethno‐communal violence (only 13 out of 147 districts experienced it), and the low variance in
frequency and intensity of incidents.11
11 For these districts, the frequency ranges from 1 to 5 incidents (IQR 1‐2) and the intensity ranges from 1 to 1188 [IQR 2‐33] deaths, caused by one outlier: the anti‐Chinese pogroms in May 1998 in Jakarta.
19
Independentvariables
Horizontal inequalities can exist in many different forms in multiple dimensions. The diversity of
Indonesia makes it likely that different ethnic groups face different inequalities. A wide variety of
indicators is needed to account for this heterogeneity. Five dimensions are identified that together
provide an insight in socio‐economic deprivation. These are employment, health, education, housing
and network connectivity. Within each dimension two indicators are chosen, one which signals
equality of access and one which reflects equality of achievement. In this section the dimensions and
their indicators will be discussed.
The function of employment is twofold. It provides access to resources needed to fulfil other aspects
of life and is an achievement in itself, as it adds to a person’s development, identity and self‐worth
(OECD, 2011). Access to employment is measured by the dummy variable under‐ or unemployed,
which is one if last week’s main activity of an adult respondent (15+) was to look for work, or – if the
main activity was work – the hours worked per regular working week are less than half of the
statutory standard working week of 40 hours, and zero otherwise (Puguh , Iftikhar , & Iyanatul 2000).
Achievement is measured by the dummy underpaid, which is one if a person earns less than sixty
percent of the median hourly wage, and zero otherwise. It should be noted that price and wage
levels vary considerably among the Indonesian archipelago, as did the impact of the Asia financial
crisis (Dhanani & Islam, 2002). Therefore, the median is calculated for each province separately.
The function of health is more instrumental, as it is needed to efficiently exercise our human
capabilities (Sen, 2002). Access to health is measured by the variable child‐ and infant mortality, and
is calculated for all women aged 15 to 49 in a subgroup as the sum of stillbirths, miscarriages and life
births but who passed away later, divided by the sum of life births.12 While child mortality can be
used as a proxy for many socio‐economic dimensions, it is primarily an indicator for (access to) pre‐
and postnatal health care and education. Health achievement is measured by the dummy
malnutrition, which is one if an adult is underweight (a body‐mass index of below 18) and zero
otherwise.
Education also has an instrumental function, teaching persons to read, write and count, enabling
them to achieve important life functions. As Tadjoeddin (2013, p. 24) notes, “education raises
people’s expectations about earnings and welfare”. Access to education is measured by the dummy
Children Education, which is one if a child (aged 6‐14) is currently enrolled in school and zero
12 The survey question did not define a time period for ‘passed away later’.
20
otherwise. Educational achievement is measured by the ordinal variable Adult Education, which is
higher if an adult (age 15+) has attended a higher education level.13
The function of housing is twofold. It reflects economic achievement, while at the same time being
instrumental to good health and sleep. Since this precludes the dichotomous distinction between
access and achievement, the indicators are chosen to represent hygiene and durability. Hygiene is
measured by the dummy Water Source, which is one if the household’s main source of drinking
water is from a closed source (pipe, pump, well or bottled) and zero otherwise. Durability is
measured by the dummy Flooring, which is one if the flooring material is not dirt, sand or dung, and
zero if it is.
Network connectivity is less straightforward. It reflects if someone successfully participates in the
public life, and the influence a person can have on society. It can be both political and social. It is also
a proxy of how segregated a society is, and to what extent soft power is concentrated in particular
groups, or shared among ethnicities. The political aspect of network connectivity is proxied by Civil
Servant Distribution, which measures the relative representation of each ethnic subgroup in the civil
service apparatus. The Indonesian civil service is characterised by an informal patronage system,
where jobs can be purchased and nepotism is a serious problem (World Bank, 2003). This makes it an
interesting indicator to study ethnic inequality. The social aspect is proxied by Community
Participation, which measures if a person is actively engaged in a local community initiative, such as a
women’s association, community meetings or voluntary labour program.
Lastly, household consumption will be taken into account. It is calculated based on the OECD‐
modified equivalence scale (OECD, 2012), and is modified by taking the natural logarithm of that
value.
Measuringhorizontalinequalities
When measuring horizontal inequalities, a number of pitfalls need to be avoided. According to
Stewart, Brown and Mancini (2008) a good measure is not influenced by vertical inequality or intra‐
group inequality, is sensitive to group size, and avoids to be too evaluative. One such method is the
group coefficient of variation (GCOV), which measures the variance divided by the mean, weighted
by the size of each subgroup. Formally:
1 1
13 The distribution is 1 for no formal schooling, 2 for primary school, 3 for junior high, 4 for senior high and 5 for college and above.

21
where R is the number of ethnic groups, Y bar is the sample mean of variable Y, ∑ is the
mean value of y for group r and pr is group r population share. For all indicators, the GCOV will be
used to assess horizontal inequality. To test the hypotheses on converging and diverging inequalities,
the change over time of the GCOV for each indicator will be included.14 Lastly, the district mean of
the indicator will be assessed as well.15
Controlvariables
Lastly, a number of control variables were included. These are:
‐ Violence in the period 1990‐1997. A dummy variable which is one if deadly collective violence
took place in the district before the socio‐economic data was collected, and zero otherwise.16
‐ Ethno‐Demographic fragmentation. This measure of the population distribution in a district is
included to account for purely demographic determinants of conflict.
‐ Urban/rural area. Dummy variable which is one if the district is more urban (Kota) and zero if
it is more rural (Kabupaten).
‐ District split. Dummy variable which is one if the district has split between 1998 and 2003,
and zero if otherwise.
Data
The research combines two datasets. Socio‐economic data is derived from the RAND Indonesian
Family Life Survey (Frankenberg & Thomas, 2000), which followed Indonesian households (and their
split‐offs, individual members and new entrants as well) over four ‘waves’: in 1993, 1997, 2000 and
2007. Only the first two waves are used to calculate the variables, and their change over time. The
IFLS survey covers thirteen (of the thirty‐four) Indonesian provinces,17 accounting for approximately
84% of the Indonesian population in 1993. The individual and household data from the survey is
aggregated to the district level before merging it with the United Nations Support Facility for
Indonesian Recovery (UNSFIR) database on collective violence (Varshney et al., 2004).
The UNSFIR II database contains information on collective violence incidents in Indonesia between
1990 and 2003 for fourteen provinces.18 These provinces account for 96.4% of all casualties in the
14 Change over time is calculated based on the 1993 and 1997 waves of the survey. 15 With the exception of Civil Servant Distribution. Since this indicator measures the relative representation of different groups in the civil service, a district mean (including all groups) would be meaningless. 16 It should be noted that this is the broad definition of collective violence, including all four categories, instead of just ethno‐communal. 17 The provinces are: West Java, Jakarta, Central Java, Yogyakarta, East Java, Bali, West Nussa Tengara, North Sumatra, West Sumatra, South Sumatra, Lampung, South Kalimantan and South Sulawesi. 18 The provinces are: West Java, Jakarta, Central Java, East Java, West Nussa Tengara, South Sulawesi, Central Sulawesi, Riau, Banten, Central Kalimantan, West Kalimantan, East Nussa Tengara, Maluku and North Maluku.
22
period of measurement.19 The data is based on national and regional newspaper reports, cross‐
checked with local sources in case of ambiguity. Information on deadly ethno‐communal incidents
for the RAND IFLS provinces that were not included in UNSFIR II is derived from the research article
describing the earlier UNSFIR I database (Tadjoeddin, 2002).
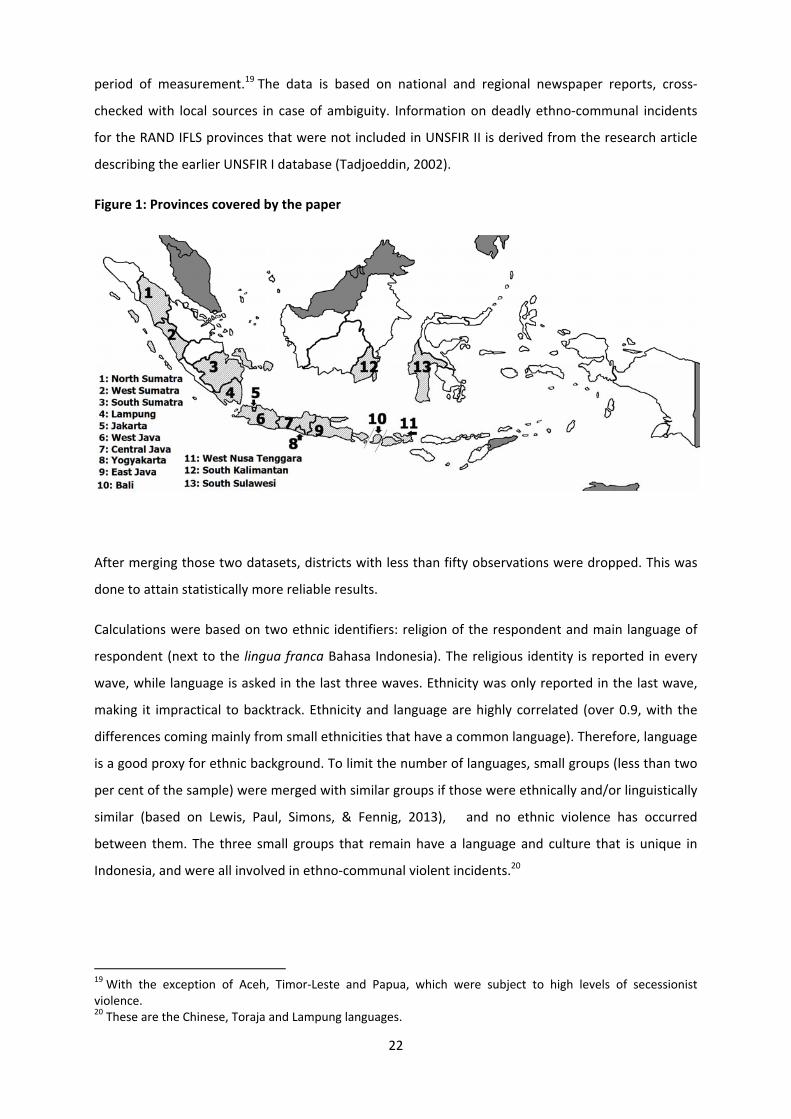
Figure 1: Provinces covered by the paper
After merging those two datasets, districts with less than fifty observations were dropped. This was
done to attain statistically more reliable results.
Calculations were based on two ethnic identifiers: religion of the respondent and main language of
respondent (next to the lingua franca Bahasa Indonesia). The religious identity is reported in every
wave, while language is asked in the last three waves. Ethnicity was only reported in the last wave,
making it impractical to backtrack. Ethnicity and language are highly correlated (over 0.9, with the
differences coming mainly from small ethnicities that have a common language). Therefore, language
is a good proxy for ethnic background. To limit the number of languages, small groups (less than two
per cent of the sample) were merged with similar groups if those were ethnically and/or linguistically
similar (based on Lewis, Paul, Simons, & Fennig, 2013), and no ethnic violence has occurred
between them. The three small groups that remain have a language and culture that is unique in
Indonesia, and were all involved in ethno‐communal violent incidents.20
19 With the exception of Aceh, Timor‐Leste and Papua, which were subject to high levels of secessionist violence. 20 These are the Chinese, Toraja and Lampung languages.

23
Regressionanalysis
A probit regression with heteroskedasticity‐robust standard errors will be used for several reasons.
First, the dependent variable is binary with a low number of successes (only 8.84% of districts).
Second, most independent variables are either integers ranging from zero to one, or also binary.
Lastly, the number of variables is relatively high for the number of observations, which limits the
degrees of freedom. These three factors combined are likely to cause the issue of ‘complete
determination’, where certain covariate patterns perfectly predict a success or failure (Sribney,
2005). This phenomenon makes it possible that the model fit is very good as a whole, while at the
same time most variables fail to reach significance. Although this is not a problem in itself, it is often
accompanied by hidden collinearity between two or more independent variables. To prevent this,
certain variables have to be left out of the estimation. If this is the case, the text will mention it. This
solution is far from ideal, since dropping certain variables prevents the model from calculating the
impact of that variable.
An alternative way of construing the dataset is used to respond to this. While the nature of the
independent variables and the low number of ‘successes’ for the dependent variable cannot be
changed, the low N and corresponding low degrees of freedom can be addressed by a pooled time
series cross‐sectional analysis. Using this method, one creates a dataset consisting of multiple cross
sectional datasets of randomly sampled individuals at different points in time (Zivot, 2012). The
method is generally used to capture time‐dependent effects, but it also enables the researcher to
increase N (and as a corollary the degrees of freedom). An important condition is that coefficients
need to be statistically constant over time. In the current analysis, this is ensured by using a two‐
group mean comparison t‐test for each variable to investigate whether the variable changed
significantly (at the 95% confidence level) between the two years. If this was the case, the variable
was not used in the estimation.21 Again, this prevents using the variable to test its impact on the
probability of conflict. To be able to test each variable at least once, it was decided to use both
approaches. First the probit regressions with the years separated will be run, and afterwards the
pooled time‐series cross sectional probit will be estimated. An overview of all the independent and
control variables can be seen in table 2.
21 Since community participation was only measured in 1997, it could not be tested with this approach.

24
Table 2: Overview of variables
Variable GCOV District Mean Type
Dependent variable
Deadly Ethno‐Communal Conflict Binary
Independent variables
Child‐ & Infant Mortality x x Continuous
Malnutrition x x Continuous
Under‐ or Unemployed x x Continuous
Underpaid x x Continuous
Adult Education x x Continuous
Child Enrolment x x Continuous
Flooring x x Continuous
Water Source x x Continuous
Civil Servant Distribution x Continuous
Community Participation x x Continuous
HH Consumption x x Continuous
Control variables
Urban / Rural Binary
History of Communal Violence Binary
Ethno‐Demographic Fragmentation Continuous
District split between 95 and 05 Binary
Consumption Gini Continuous
Observations per district Continuous
Limitations
The methodology chosen has a number of limitations. The first is that sample selection is not
random. In the first IFLS wave (1993) respondents were selected randomly to represent the
population in the provinces. The 1997 respondents, on the other hand, were chosen because they
either were a respondent in 1993 or lived in the same household as a 1993 respondent. Furthermore,
first wave respondents who moved to a province not covered by the survey were not surveyed in
1997. This led to an individual recontact rate of 91%.
The second limitation is the relatively short period between the two first waves. Horizontal
inequalities are notoriously persistent over time, and especially achievement inequality changes very
slowly (Stewart, 2008). To reliably test the influence of divergence and convergence of inequalities
over time, a longer time span would be recommended.
Next, the dataset does not cover all Indonesian provinces. While the IFLS survey covers the lion’s
share of the Indonesian population, it cannot be extrapolated to represent the entire population. The
two largest islands of the archipelago – Java and Sumatra ‐ are almost completely included, leading
to an overrepresentation of the Javanese and Muslim population. The ethno‐communal conflicts in

25
the covered provinces might therefore not be representative of ethno‐communal conflict in the
whole of Indonesia. Indeed, some excluded provinces – such as the Malukus or North and Central
Sulawesi ‐ are ethnically more diverse and experienced the most intense episodes of ethnic violence
(Colombijn & Lindblad, 2002).
Since no deadly ethno‐communal violence took place in the surveyed provinces before 1998, there is
no simultaneous causality per se. Despite this, other forms of collective violence occurred during
those years. According to the UNSFIR II database, 19.68% of all deadly incidents took place between
1990 and 1997, resulting in 315 casualties. Given the disruptive nature of communal violence, it is
not unthinkable that other variables – especially the socio‐economic indicators – are biased in
districts were such violence took place.
The ethnic identification constitutes two minor limitations. 4 % of the respondents indicated that
they only spoke Bahasa Indonesia, and could thus not be linguistically classified.22 These observations
were dropped when calculating the socio‐economic indicators, possibly introducing a bias. It should
be noted that 77.43% of these observations came from an urban district,23 which might signal a more
cosmopolitan lifestyle where ethnicity plays a less prominent role. Next, the religious indicator does
not take into account movements and sects within a religion. These groups are identified by their
overarching denomination, which makes it impossible to specifically test the main hypothesis for
sectarian violence.
Another limitation is presented by the Indonesian diversity. This diversity can be classified as one
major group combined with many small groups. The main linguistic group is the Javanese, while the
dominant religion is Islam. It is possible that the influence of the large group conceals that of the
small groups. Since the group coefficient of variation measures distances from the mean weighted
by group size, very large groups tend to ‘muffle’ the GCOV value, as they both have a large weight
and pull the sample mean towards theirs. Some of the smallest groups are of particular interest to
the research, since they have been involved in ethno‐communal violence. At the same time, their
small size makes it unlikely that their impact on the different indicators will be statistically significant
in the analysis. It is thus elementary to be cautionary when interpreting the results. To somewhat
account for this phenomenon, more lenient significance levels were used (10%, 5% and 1%).
Lastly, the UNSFIR II database does not cover all IFLS provinces.24 Conflict information for those
provinces is based on the UNSFIR I database. The data collection method for those datasets is
22 This percentage is obtained after language matching with other household members. 23 Urban districts make up 29.54% of the population. 24 The provinces not covered are Yogyakarta, North Sumatra, West Sumatra, South Sumatra, Lampung, Bali and South Kalimantan.

26
different, however. UNSFIR II looked at national and regional newspapers, and cross‐checked with
local sources, while UNSFIR I only researched national newspapers. It is thus likely that UNSFIR I
underreports the number of communal violence incidents. However, underreporting is most likely to
happen with ‘everyday’ small‐scale violence. The rarity of ethno‐communal violence and the fact that
only deadly incidents are taken into account ameliorates this bias to some extent.
27
IV. Results
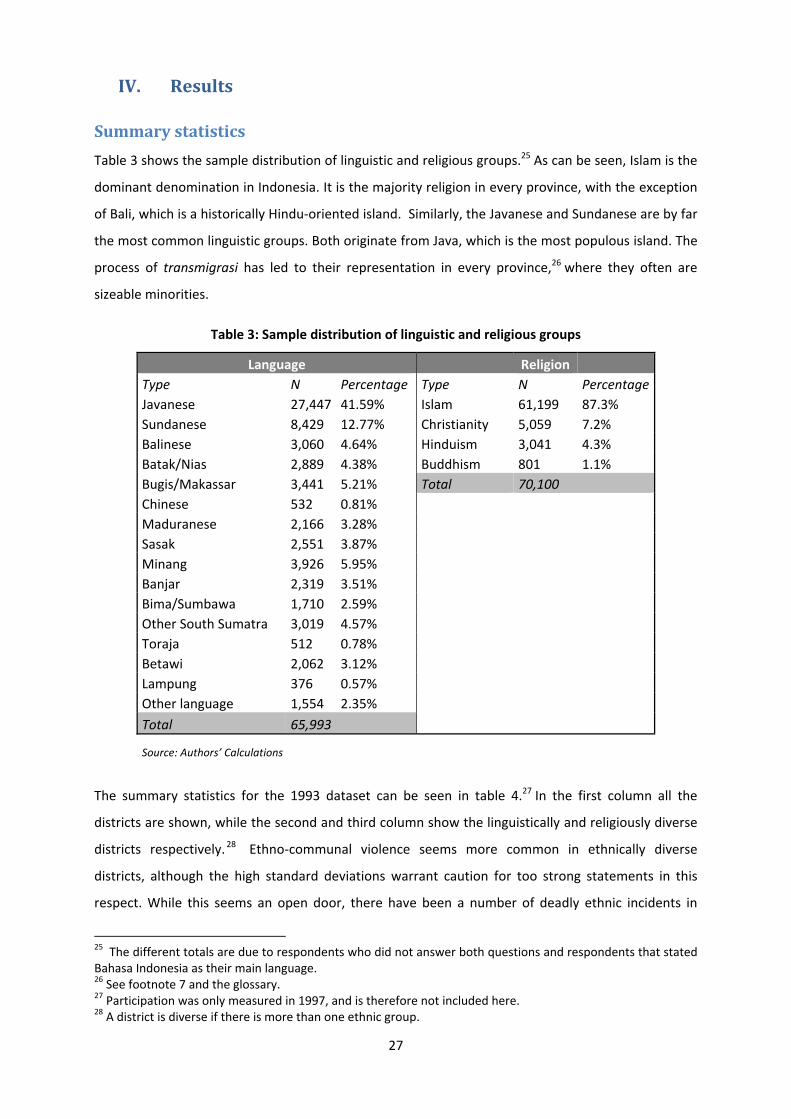
Summarystatistics
Table 3 shows the sample distribution of linguistic and religious groups.25 As can be seen, Islam is the
dominant denomination in Indonesia. It is the majority religion in every province, with the exception
of Bali, which is a historically Hindu‐oriented island. Similarly, the Javanese and Sundanese are by far
the most common linguistic groups. Both originate from Java, which is the most populous island. The
process of transmigrasi has led to their representation in every province,26 where they often are
sizeable minorities.
Table 3: Sample distribution of linguistic and religious groups
Language Religion
Type N Percentage Type N Percentage
Javanese 27,447 41.59% Islam 61,199 87.3%
Sundanese 8,429 12.77% Christianity 5,059 7.2%
Balinese 3,060 4.64% Hinduism 3,041 4.3%
Batak/Nias 2,889 4.38% Buddhism 801 1.1%
Bugis/Makassar 3,441 5.21% Total 70,100
Chinese 532 0.81%
Maduranese 2,166 3.28%
Sasak 2,551 3.87%
Minang 3,926 5.95%
Banjar 2,319 3.51%
Bima/Sumbawa 1,710 2.59%
Other South Sumatra 3,019 4.57%
Toraja 512 0.78%
Betawi 2,062 3.12%
Lampung 376 0.57%
Other language 1,554 2.35%
Total 65,993
Source: Authors’ Calculations
The summary statistics for the 1993 dataset can be seen in table 4.27 In the first column all the
districts are shown, while the second and third column show the linguistically and religiously diverse
districts respectively.28 Ethno‐communal violence seems more common in ethnically diverse
districts, although the high standard deviations warrant caution for too strong statements in this
respect. While this seems an open door, there have been a number of deadly ethnic incidents in
25 The different totals are due to respondents who did not answer both questions and respondents that stated Bahasa Indonesia as their main language. 26 See footnote 7 and the glossary. 27 Participation was only measured in 1997, and is therefore not included here. 28 A district is diverse if there is more than one ethnic group.

28
homogenous districts. There are two possible explanations for this anomaly. The first is the existence
of sectarian violence, which has been discussed in the limitations paragraph. The other is probably
undersampling. As stated before, some numerically rather small groups (mainly the Chinese) are
geographically dispersed. It is possible that these groups – for whatever reason – where not included
in the district sample, while the district has seen ethnic violence involving that particular group.29
Table 4: Mean and Standard Deviation for survey year 1993
All districts Linguistically diverse Religiously diverse
Variable Mean Std. Dev. Mean Std. Dev. Mean Std. Dev.
Deadly Ethno‐Communal Conflict 0.087 0.28 0.124 0.33 0.122 0.33
GCOV Variables
Child‐ & Infant Mortality 0.165 0.31 0.268 0.33 0.239 0.39
Malnutrition 0.213 0.38 0.368 0.46 0.283 0.41
Under‐ or Unemployed 0.183 0.42 0.271 0.36 0.297 0.64
Underpaid 0.138 0.29 0.220 0.35 0.205 0.33
Adult Education 0.036 0.05 0.055 0.06 0.058 0.05
Child Enrolment 0.023 0.05 0.038 0.05 0.032 0.07
Flooring 0.040 0.09 0.074 0.11 0.046 0.10
Water Source 0.154 0.33 0.277 0.38 0.190 0.40
Civil Servant Distribution 0.270 0.53 0.461 0.72 0.365 0.51
Community Participation
HH Consumption 0.007 0.01 0.012 0.01 0.009 0.01
District means
Child‐ & Infant Mortality 0.204 0.09 0.205 0.08 0.201 0.08
Malnutrition 0.054 0.03 0.049 0.03 0.052 0.03
Under‐ or Unemployed 0.114 0.07 0.115 0.06 0.110 0.06
Underpaid 0.321 0.19 0.310 0.20 0.274 0.17
Adult Education 2.342 0.49 2.415 0.49 2.547 0.47
Child Enrolment 0.863 0.12 0.867 0.12 0.897 0.08
Flooring 0.770 0.27 0.798 0.25 0.826 0.24
Water Source 0.356 0.32 0.394 0.32 0.460 0.33
Participation
HH Consumption 9.511 0.40 9.574 0.40 9.673 0.39
Control variables
Urban / Rural 0.235 0.43 0.268 0.45 0.366 0.48
History of Communal Violence 0.372 0.49 0.351 0.48 0.329 0.47
Ethno‐Demographic Fragmentation 0.109 0.17 0.195 0.22 0.138 0.15
District split between 95 and 05 0.195 0.40 0.227 0.42 0.195 0.40
Consumption Gini 0.360 0.08 0.358 0.07 0.372 0.08
Observations per district 218 153 223 151 230 156
Number of districts 139 97 82 Source: Authors’ Calculations
29 Research has shown that due to fears of repression, Chinese‐Indonesians were inclined to hide their descent and/or language when being surveyed for the Indonesian Population Census (Suryadinata, Arifin, & Ananta, 2003). Something similar might have been at play in the IFLS survey.

29
When looking at the horizontal inequality variables (as measured by the group‐weighted coefficient
of variation), it is striking that almost all horizontal inequality averages are higher for linguistically
diverse districts than for religiously diverse regions.30 Based on this, it seems that socio‐economic
differences between ethno‐lingual groups are more pronounced, although it could also be a result of
using the GCOV as the measure for horizontal inequalities, as was discussed in the limitations. It is
quite possible that such a process has happened here, given the demographic dominance of the
Muslim population.31
The most severe horizontal inequality for all three configurations is the civil servant distribution. The
inequalities in household consumption, flooring and the education dimension are relatively low
across the board. The district means averages are fairly similar, with religiously diverse districts
having the best outcome for all variables –malnutrition excepted. The sample statistics for the
control variables show that ethnically diverse districts are more likely to be urban, and less likely to
have experienced communal violence in the years 1990‐1997.
The summary statistics for the 1997 dataset can be seen in table 5. The horizontal inequality
variables largely paint the same picture, with linguistically diverse districts remaining the most
unequal. New is the inclusion of the community participation variable. The district means of
community participation are almost equal, but the GCOV variables vary considerably. This might
point to certain groups being over‐ or underrepresented in the social life of the community.
Interestingly, the gap in district means between linguistically and religiously diverse districts has been
largely closed. Most socio‐economic indicators have improved, with the exception of malnutrition
and under‐ or unemployed. It seems that the high economic growth rate which Indonesia
experienced in the early nineties trickled down to the general population (Booth, 2000).
The impact of the Asia crisis – which hit Indonesia mid 1997 – is unclear. While underemployment
and unemployment worsened, other access variables (such as child enrolment) show a marked
improvement. The most puzzling is malnutrition. This variable does worsen, although it is unclear
whether this is a result of the crisis or a long‐term trend. While theoretically an economic crisis can
negatively affect nutrition, evidence that this happened in Indonesia due to the 1997 crisis is mixed
(Waters, Saadah, & Pradhan, 2003). Given that the data was collected in 1997, it seems unlikely that
the change in this achievement variable is entirely due to the crisis. The increased consumption
seems to be another anomaly. Since skyrocketing inflation was a characteristic of the 1997 crisis, it
seems likely that the real consumption levels decreased (Suryahadi et al., 2003).
30 Only the variables Under‐ or Unemployed and Adult Education are lower. 31 This observation is strengthened by the ethno‐demographic fragmentation indicator, which is lower for religiously diverse districts.

30
Table 5: Mean and Standard Deviation for survey year 1997
All districts Linguistically diverse Religiously diverse
Variable Mean Std. Dev. Mean Std. Dev. Mean Std. Dev.
Deadly Ethno‐Communal Conflict 0.089 0.29 0.157 0.37 0.126 0.33
GCOV Variables
Child‐ & Infant Mortality 0.167 0.29 0.350 0.39 0.229 0.27
Malnutrition 0.166 0.26 0.344 0.32 0.230 0.23
Under‐ or Unemployed 0.145 0.24 0.310 0.33 0.193 0.21
Underpaid 0.133 0.21 0.262 0.22 0.199 0.25
Adult Education 0.040 0.05 0.079 0.06 0.061 0.04
Child Enrolment 0.017 0.05 0.038 0.06 0.020 0.05
Flooring 0.025 0.06 0.053 0.09 0.034 0.06
Water Source 0.136 0.31 0.262 0.34 0.208 0.42
Civil Servant Distribution 0.266 0.50 0.580 0.73 0.339 0.43
Community Participation 0.059 0.09 0.117 0.11 0.088 0.09
HH Consumption 0.008 0.01 0.015 0.01 0.012 0.01
District means
Child‐ & Infant Mortality 0.176 0.16 0.172 0.15 0.141 0.13
Malnutrition 0.066 0.03 0.060 0.03 0.060 0.03
Under‐ or Unemployed 0.204 0.08 0.208 0.07 0.203 0.08
Underpaid 0.308 0.16 0.284 0.16 0.276 0.16
Adult Education 2.503 0.52 2.652 0.50 2.690 0.52
Child Enrolment 0.931 0.09 0.931 0.08 0.946 0.06
Flooring 0.833 0.23 0.903 0.16 0.882 0.19
Water Source 0.466 0.32 0.533 0.32 0.538 0.33
Participation 0.600 0.14 0.608 0.13 0.599 0.14
HH Consumption 10.144 0.39 10.270 0.37 10.258 0.39
Control variables
Urban / Rural 0.256 0.44 0.361 0.48 0.368 0.49
History of Communal Violence 0.362 0.48 0.373 0.49 0.345 0.48
Ethno‐Demographic Fragmentation 0.118 0.18 0.266 0.23 0.143 0.14
District split between 98 and 03 0.201 0.40 0.265 0.44 0.218 0.42
Consumption Gini 0.378 0.09 0.378 0.08 0.387 0.08
Observations per district 218.533 163.17 244.424 189.90 229.994 167.13
Number of districts 147 83 87
Source: Authors’ Calculations

31
Results
The results of the probit regressions for ethno‐linguistic variables can be seen in table 6. A number
of control variables had to be dropped to prevent collinearity with complete determination. For both
the 1993 and 1997 the ethno‐lingual estimation, is history of communal violence. Additionally, the
urban/rural, district split and Gini control variables had to be dropped for the 1997 estimation. At
first sight, the two years seem to be quite distinct from each other. In 1997, only two coefficients are
statistically significant, much less than the 1993 estimation. The pseudo‐R2 for both regressions is
relatively high, though.
The 1993 estimation produces some counterintuitive results: the horizontal inequality variables that
are significant at the 5% level all have a negative sign, implying that a reduction in horizontal
inequality actually increases the probability of conflict. One possible explanation could be that
linguistically homogenous districts (where the GCOV is by definition zero) were more likely to
experience violence. The strong and highly significant positive result for ethno‐demographic
fragmentation (which by definition is zero for homogenous districts) suggests exactly the opposite,
however. This apparent paradox is further addressed in the robustness tests, where a regression
without homogenous districts will be run.
The 1993 estimation seems to be mainly driven by the adult education GCOV and the district mean of
child‐ and infant mortality, while the district mean of participation and consumption inequality seem
to be the main drivers of the 1997 probit.

32
Table 6: Ethno‐lingual estimation results
1993 (1)
1997 (2)
Variable Coeff. St. Dev. Signif. Coeff. St. Dev. Signif.
GCOV Variables
Child‐ & Infant Mortality ‐6.367 [2.89] ** 1.771 [1.26]
Malnutrition ‐2.525 [1.50] * ‐2.964 [2.21]
Under‐ or Unemployed 1.993 [1.20] * ‐1.868 [2.10]
Underpaid ‐8.128 [3.67] ** 0.713 [2.03]
Adult Education 45.620 [26.86] * ‐0.780 [8.42]
Child Enrolment 5.254 [6.34] 2.958 [9.54]
Flooring ‐8.736 [3.78] ** ‐8.471 [6.84]
Water Source 0.068 [1.41] ‐1.450 [2.33]
Civil Servant Distribution ‐2.425 [1.17] ** 1.001 [0.67]
Community Participation 2.968 [5.59]
HH Consumption 18.680 [25.23] 89.140 [47.85] *
District means
Child‐ & Infant Mortality 20.020 [9.33] ** ‐3.440 [3.73]
Malnutrition ‐45.240 [31.74] ‐18.710 [17.69]
Under‐ or Unemployed 5.987 [3.39] * 2.947 [5.49]
Underpaid 3.473 [2.21] ‐4.294 [4.43]
Adult Education ‐0.977 [0.81] ‐0.097 [1.49]
Child Enrolment ‐4.649 [3.54] ‐14.440 [9.51]
Flooring ‐4.185 [2.69] ‐2.237 [3.75]
Water Source 3.661 [1.94] * 1.434 [2.02]
Participation 13.520 [5.23] ***
HH Consumption 1.695 [1.80] 0.716 [1.95]
Control variables
Urban / Rural 3.559 [1.44] **
History of Communal Violence
Ethno‐Demographic Fragmentation 8.014 [2.20] *** 5.283 [3.31]
District split between 98 and 03 0.360 [0.60]
Consumption Gini ‐9.486 [7.41]
Observations per district ‐0.007 [0.00] ** ‐0.001 [0.00]
Constant ‐11.600 [12.78] ‐3.067 [23.31]
pseudo R‐sq 0.643 0.607
N 137 145
Significance levels: * p<0.10, ** p<0.05, *** p<0.01 Source: Authors’ Calculations
The probit estimation for ethno‐religious variables is shown in table 7. Here the two years show more
similar results, as well as higher significance levels, while the general measure of fit is not that
different from the ethno‐linguistic estimation. It can be observed that a) increasing horizontal
inequality in adult education levels has a significant positive effect, b) increasing horizontal inequality

33
in consumption has a significant negative effect, c) a higher consumption district mean is also
positively related to ethno‐communal violence, as well as d) a history of communal violence.
Remarkably, the significant effect of under‐ or unemployed inequality and district average of flooring
is opposite for both years. The other coefficients that reach significant levels do so for only one of the
two years, precluding any substantial conclusion.
Table 7: Ethno‐religious estimation results
1993 (3)
1997 (4)
Variable Coeff. St. Dev. Signif. Coeff. St. Dev. Signif.
GCOV Variables
Child‐ & Infant Mortality ‐3.595 [3.00] 1.199 [1.07]
Malnutrition ‐14.930 [6.12] ** ‐3.692 [2.45]
Under‐ or Unemployed 0.915 [0.51] * ‐5.411 [2.99] *
Underpaid ‐5.698 [2.11] *** 0.947 [1.66]
Adult Education 63.320 [17.32] *** 17.040 [6.59] ***
Child Enrolment 4.136 [6.82] 7.805 [3.21] **
Flooring ‐160.300 [40.45] *** 9.005 [8.59]
Water Source 5.582 [1.56] *** ‐0.740 [1.17]
Civil Servant Distribution ‐0.197 [0.76] 1.584 [0.67] **
Community Participation 0.006 [4.38]
HH Consumption ‐190.400 [53.73] *** ‐111.000 [43.10] **
District means
Child‐ & Infant Mortality 6.637 [3.29] ** ‐0.877 [1.97]
Malnutrition 0.573 [5.49] ‐27.390 [14.09] *
Under‐ or Unemployed 17.260 [5.95] *** 4.629 [2.87]
Underpaid ‐0.106 [2.16] ‐4.464 [2.84]
Adult Education 0.269 [0.96] ‐2.939 [1.27] **
Child Enrolment ‐1.243 [1.85] ‐2.609 [3.97]
Flooring ‐3.371 [1.38] ** 2.901 [1.50] *
Water Source 2.634 [1.63] 0.842 [1.32]
Participation 10.150 [3.46] ***
HH Consumption 2.261 [1.30] * 3.086 [1.49] **
Control variables
Urban / Rural 1.333 [0.87] 2.736 [0.79] ***
History of Communal Violence 2.294 [0.94] ** 1.563 [0.74] **
Ethno‐Demographic Fragmentation 16.710 [4.79] *** ‐2.181 [3.17]
District split between 98 and 03 ‐0.057 [0.94] ‐0.235 [0.95]
Consumption Gini 3.914 [3.13] 2.474 [2.39]
Observations per district ‐0.001 [0.00] 0.002 [0.00] **
Constant ‐28.3 [11.90] ** ‐33.890 [15.93] **
pseudo R‐sq 0.681 0.550
N 140 148
Significance levels: * p<0.10, ** p<0.05, *** p<0.01 Source: Authors’ Calculations

34
When comparing the religious to the linguistic regression, it can be seen that the variables that were
significant in both 1993 estimations all move in the same direction, as does the 1997 district mean of
participation. While significance levels vary, it seems that there is some common basis between the
two types of ethnic classifications. This is not surprising, given that the religious and linguistic fault
lines often overlap.
The results for the pooled time series cross‐sectional probit estimation can be seen in table 8. Most
of the district mean variables were not constant over time and were therefore not included, as well
as the GCOV of flooring in the ethno‐lingual regression. Since participation was only measured in
1997, it is left out as well. A time‐dummy is included to check for time‐dependent effects.
Table 8: Pooled time series cross‐sectional estimation of both ethnic classifications
Ethno‐Linguistic (5)
Ethno‐Religious (6)
Variable Coeff. St. Dev. Signif. Coeff. St. Dev. Signif.
GCOV Variables
Child‐ & Infant Mortality ‐0.376 [0.46] ‐0.085 [0.29]
Malnutrition ‐1.385 [0.59] ** ‐3.637 [1.01] ***
Under‐ or Unemployed ‐0.300 [0.46] 0.259 [0.16] *
Underpaid ‐1.216 [0.77] 0.254 [0.71]
Adult Education 4.851 [3.98] 11.850 [3.22] ***
Child Enrolment 0.967 [3.03] 2.547 [1.68]
Flooring ‐6.511 [3.51] *
Water Source 0.634 [0.48] 0.742 [0.33] **
Civil Servant Distribution 0.117 [0.28] 0.718 [0.38] *
HH Consumption ‐0.369 [18.23] ‐47.290 [18.71] **
District means
Child‐ & Infant Mortality 1.302 [1.23] 1.811 [0.93] *
Underpaid ‐0.708 [1.08] ‐1.192 [0.69] *
Control variables
Urban / Rural 1.010 [0.37] *** 1.311 [0.29] ***
History of Communal Violence 1.548 [0.34] *** 1.116 [0.37] ***
Ethno‐Demographic Fragmentation 4.079 [1.16] *** ‐0.147 [1.07]
District split between 98 and 03 ‐0.291 [0.49] ‐0.161 [0.48]
Consumption Gini 1.800 [1.83] 3.364 [1.55] **
Observations per district ‐0.003 [0.00] *** 0.000 [0.00]
Time‐dummy 1997 ‐0.049 [0.28] 0.010 [0.27]
Constant ‐3.370 [0.93] *** ‐3.865 [0.82] ***
pseudo R‐sq 0.479 0.383
N 282 288
Significance levels: * p<0.10, ** p<0.05, *** p<0.01 Source: Authors’ Calculations
35
The ethno‐linguistic estimation is quite different from the two single‐year regressions. Most of the
indicators fail to reach significance, with the exception of the horizontal inequality of malnutrition. A
higher level of inequality is still negatively related to the probability of ethno‐communal conflict,
although the effect is a lot smaller than in the 1993 regression. The control variables ethno‐
demographic fragmentation and urban/rural are both highly significant, as is the new indicator
history of communal violence. The last variable is the main driver of the model, and it might be
possible that its inclusion has caused some other variables to lose significance. This is indeed the case
for the GCOV of under‐ or unemployed and the district mean of child‐ and infant mortality, although
their coefficients remain small.
The ethno‐religious estimation is more in line with the two single‐year regressions. It is still the case
that a) increasing horizontal inequality in adult education levels has a significant positive effect, b)
increasing horizontal inequality in consumption has a significant negative effect, and d) a history of
communal violence is positively related to the probability of conflict. The horizontal inequality
indicator of under‐ or unemployed, which showed conflicting signs in the previous regression, is now
negative and significant. Interestingly, the district mean of underpaid workers – which failed to
produce a significance result before – is now a significant determinant, as is the control variable
consumption Gini. The model seems to be mainly driven by the horizontal inequality in household
consumption and adult education levels.
In sum, it can be argued that for ethno‐linguistic groups horizontal inequality in malnutrition and the
district mean of participation are determinants of conflict, as well as the control variables
urban/rural, history of communal violence and ethno‐demographic fragmentation. The GCOV of
under‐ or unemployed and the district mean of child‐ and infant mortality might also play a role.
When it comes to ethno‐religious groups, horizontal inequality in adult education, under‐ or
unemployed and consumption are determinants, as are the district mean of participation and the
control variables urban/rural and history of violence. The GCOVs of malnutrition, flooring, water
source and civil servant distribution, and the district means of child‐ & infant mortality, flooring and
consumption might have an influence as well, but their results are somewhat ambiguous.
36
Robustnesschecks
To see if these tentative conclusions hold, a number of alternative specifications have been tested. It
has been noted above that some indicators produce counterintuitive results, namely that a reduction
in horizontal inequality actually increases the probability of conflict. It was suggested that this could
be due to the inclusion of ethnically homogenous districts. To test this suggestion, a regression is run
where all homogenous districts were dropped. Furthermore, a dummy dependent variable was
chosen based on the relatively small range of casualties, with one large outlier. That outlier is the
May 1998 anti‐Chinese riot in multiple districts in Jakarta, leading to a total of 1188 deaths. Given the
extraordinary scale of this violence, as well as the special nature of Jakarta as the largest metropolis
and capital of Indonesia, it could be that its inclusion distorts the results. Therefore, a regression has
been run where all districts of Jakarta have been excluded. Lastly, the potentially detrimental effect
of communal violence on socio‐economic indicators should be considered. It is quite possible that
districts that experienced some form of deadly ethno‐communal violence between 1990 and 1997
evolved differently from those who didn’t. To see if this is indeed the case, a regression has been run
where only districts without deadly communal violence between 1990 and 1997 were included. Since
all these estimations involve dropping a number of observations, the statistical issues described in
the methodology may play a role again. To attenuate this all robustness checks were done with
pooled time series cross‐sectional data. This has the result, however, that the effect of community
participation could not be tested further.
The estimation with only ethnically diverse districts can be seen in table 932. The tentative findings
for the ethno‐lingual groups seem to hold for the large part, with the exception of inequality in
under‐ or unemployed and the district mean of child‐ and infant mortality. Interestingly, some of the
horizontal inequality indicators that were significant for the ’93 sample but not for the pooled
regression become significant again. These are child‐ & infant mortality, malnutrition, underpaid and
flooring, all of which have a negative sign. Lastly, the district split variable is significant, unlike the
previous regressions. This might mean that it is only a determinant of probability of conflict in
linguistically diverse districts, with the negative sign indicating that ethnically diverse districts that
were split actually have a smaller chance of ethno‐communal conflict. The ethno‐religious estimation
also seems in line with the provisional conclusions, with the exception of the GCOV of under‐ or
unemployed and flooring. Horizontal inequality in child school enrolment is strongly positively
related to ethno‐communal conflict, for the first time. In short: the main findings are not very
sensitive to a model which in‐ or excludes homogenous districts, although the model which excludes
homogenous districts produces larger t‐statistics for many variables.
32 As a reminder: missing indicators do not indicate statistical difficulties, but merely that the indicators were not statistically constant between the two surveys.

37
Table 9: Pooled time series cross sectional analysis using only ethnically diverse districts
Ethno‐Linguistic (7)
Ethno‐Religious (8)
Variable Coeff. St. Dev. Signif. Coeff. St. Dev. Signif.
GCOV Variables
Child‐ & Infant Mortality ‐1.348 [0.69] * ‐0.102 [0.34]
Malnutrition ‐2.050 [0.75] *** ‐5.796 [1.70] ***
Under‐ or Unemployed ‐0.633 [0.45] 0.116 [0.19]
Underpaid ‐1.524 [0.75] ** ‐0.038 [1.08]
Adult Education 13.970 [4.66] ***
Child Enrolment 1.065 [2.97] 6.394 [2.40] ***
Flooring ‐7.122 [2.51] *** ‐8.431 [8.86]
Water Source 1.091 [0.47] ** 1.014 [0.48] **
Civil Servant Distribution 0.228 [0.29] 1.469 [0.51] ***
HH Consumption ‐60.250 [30.86] *
District means
Child‐ & Infant Mortality 2.005 [1.50]
Malnutrition ‐2.171 [8.64]
Underpaid ‐0.365 [1.25] ‐1.318 [1.27]
Adult Education 0.105 [0.66]
Flooring ‐0.700 [1.72]
Water Source ‐1.136 [0.95]
Control variables
Urban / Rural 0.738 [0.41] * 2.914 [0.80] ***
History of Communal Violence 1.851 [0.37] *** 2.053 [0.45] ***
Ethno‐Demographic Fragmentation 6.597 [1.37] *** ‐2.278 [2.01]
District split between 98 and 03 ‐1.106 [0.55] ** ‐0.239 [0.80]
Consumption Gini 0.277 [2.37] 5.791 [2.77] **
Observations per district ‐0.004 [0.00] *** 0.001 [0.00]
Time‐dummy 1997 0.181 [0.34] 0.129 [0.37]
Constant ‐2.029 [1.06] * ‐4.715 [2.34] **
pseudo R‐sq 0.515 0.538
N 180 169
Significance levels: * p<0.10, ** p<0.05, *** p<0.01 Source: Authors’ Calculations
The first thing worth observing in the probit regression without the province Jakarta (table 10) is the
low pseudo‐R2 (compared with the other regressions). It seems that the capital (with only ten
observations) explains a large part of the variation of the other models. Nevertheless, the effects
observed in the main pooled estimation remain significant, and their sign does not change.
Exceptions are ethno‐demographic fragmentation for the ethno‐lingual groups, which does not seem
to play a role outside of the capital, and inequality in under‐ or unemployed for ethno‐religious
groups. Conversely, the language GCOV for water source and religious GCOV for child enrolment
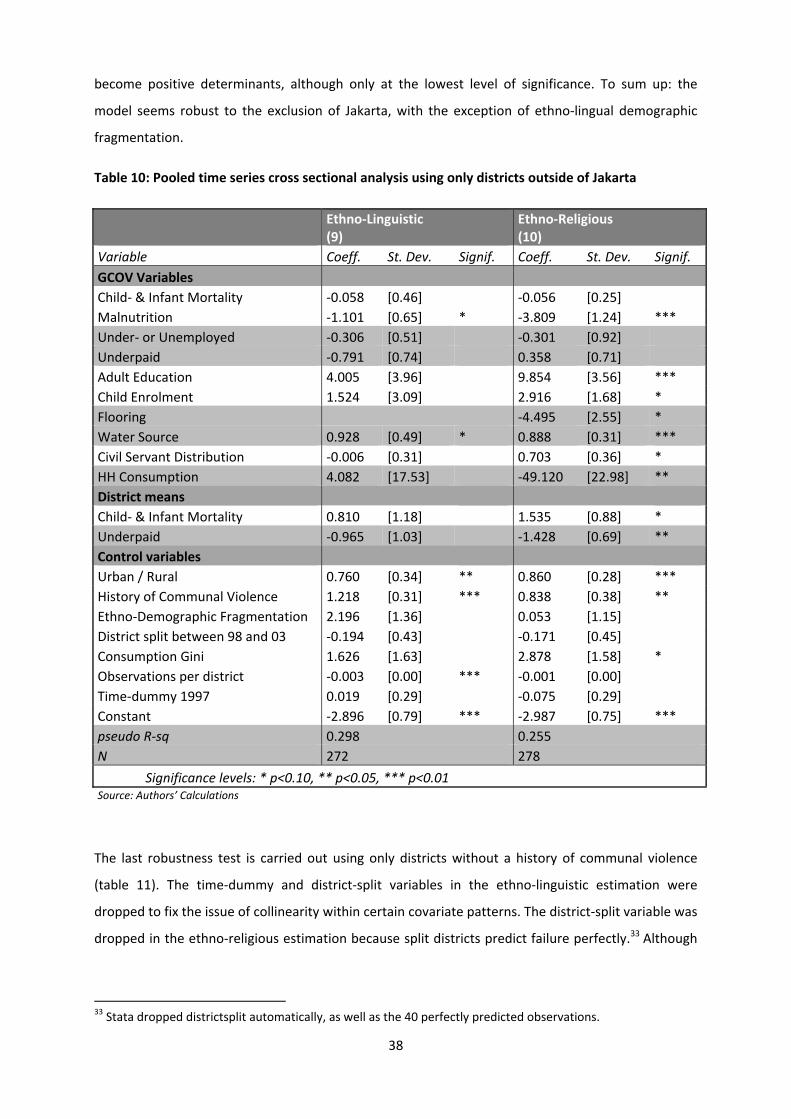
38
become positive determinants, although only at the lowest level of significance. To sum up: the
model seems robust to the exclusion of Jakarta, with the exception of ethno‐lingual demographic
fragmentation.
Table 10: Pooled time series cross sectional analysis using only districts outside of Jakarta
Ethno‐Linguistic (9)
Ethno‐Religious (10)
Variable Coeff. St. Dev. Signif. Coeff. St. Dev. Signif.
GCOV Variables
Child‐ & Infant Mortality ‐0.058 [0.46] ‐0.056 [0.25]
Malnutrition ‐1.101 [0.65] * ‐3.809 [1.24] ***
Under‐ or Unemployed ‐0.306 [0.51] ‐0.301 [0.92]
Underpaid ‐0.791 [0.74] 0.358 [0.71]
Adult Education 4.005 [3.96] 9.854 [3.56] ***
Child Enrolment 1.524 [3.09] 2.916 [1.68] *
Flooring ‐4.495 [2.55] *
Water Source 0.928 [0.49] * 0.888 [0.31] ***
Civil Servant Distribution ‐0.006 [0.31] 0.703 [0.36] *
HH Consumption 4.082 [17.53] ‐49.120 [22.98] **
District means
Child‐ & Infant Mortality 0.810 [1.18] 1.535 [0.88] *
Underpaid ‐0.965 [1.03] ‐1.428 [0.69] **
Control variables
Urban / Rural 0.760 [0.34] ** 0.860 [0.28] ***
History of Communal Violence 1.218 [0.31] *** 0.838 [0.38] **
Ethno‐Demographic Fragmentation 2.196 [1.36] 0.053 [1.15]
District split between 98 and 03 ‐0.194 [0.43] ‐0.171 [0.45]
Consumption Gini 1.626 [1.63] 2.878 [1.58] *
Observations per district ‐0.003 [0.00] *** ‐0.001 [0.00]
Time‐dummy 1997 0.019 [0.29] ‐0.075 [0.29]
Constant ‐2.896 [0.79] *** ‐2.987 [0.75] ***
pseudo R‐sq 0.298 0.255
N 272 278
Significance levels: * p<0.10, ** p<0.05, *** p<0.01 Source: Authors’ Calculations
The last robustness test is carried out using only districts without a history of communal violence
(table 11). The time‐dummy and district‐split variables in the ethno‐linguistic estimation were
dropped to fix the issue of collinearity within certain covariate patterns. The district‐split variable was
dropped in the ethno‐religious estimation because split districts predict failure perfectly.33 Although
33 Stata dropped districtsplit automatically, as well as the 40 perfectly predicted observations.
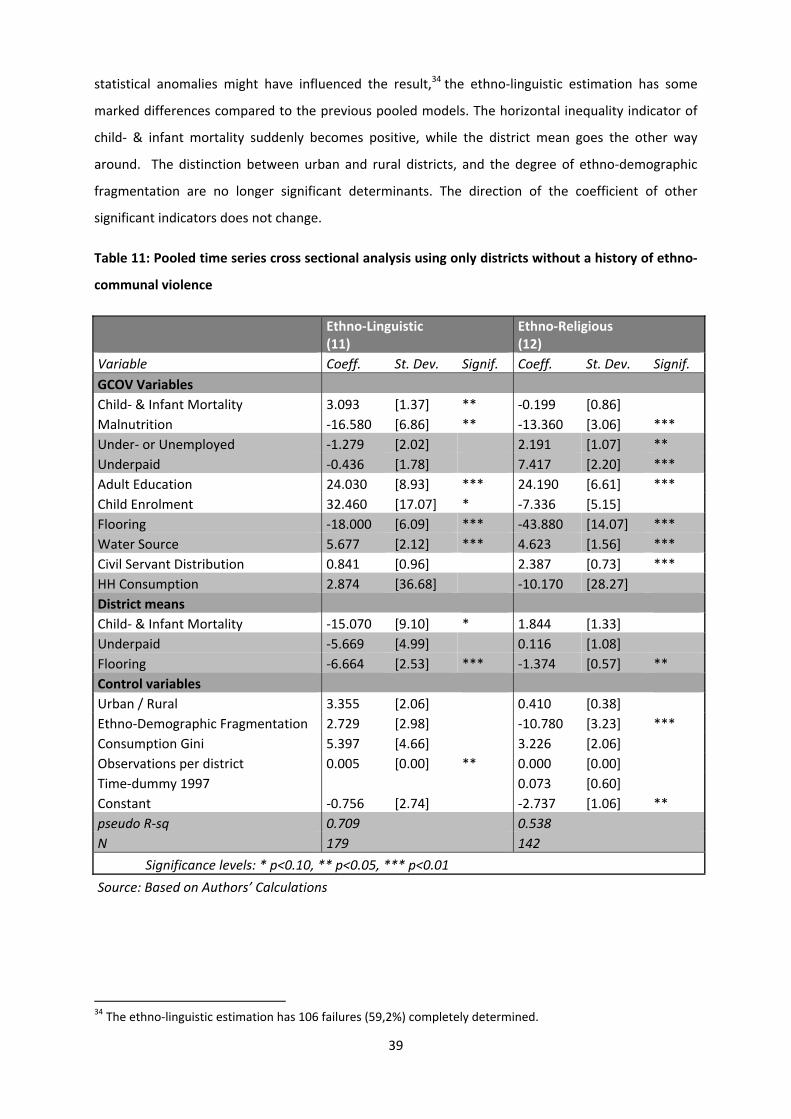
39
statistical anomalies might have influenced the result,34 the ethno‐linguistic estimation has some
marked differences compared to the previous pooled models. The horizontal inequality indicator of
child‐ & infant mortality suddenly becomes positive, while the district mean goes the other way
around. The distinction between urban and rural districts, and the degree of ethno‐demographic
fragmentation are no longer significant determinants. The direction of the coefficient of other
significant indicators does not change.
Table 11: Pooled time series cross sectional analysis using only districts without a history of ethno‐
communal violence
Ethno‐Linguistic (11)
Ethno‐Religious (12)
Variable Coeff. St. Dev. Signif. Coeff. St. Dev. Signif.
GCOV Variables
Child‐ & Infant Mortality 3.093 [1.37] ** ‐0.199 [0.86]
Malnutrition ‐16.580 [6.86] ** ‐13.360 [3.06] ***
Under‐ or Unemployed ‐1.279 [2.02] 2.191 [1.07] **
Underpaid ‐0.436 [1.78] 7.417 [2.20] ***
Adult Education 24.030 [8.93] *** 24.190 [6.61] ***
Child Enrolment 32.460 [17.07] * ‐7.336 [5.15]
Flooring ‐18.000 [6.09] *** ‐43.880 [14.07] ***
Water Source 5.677 [2.12] *** 4.623 [1.56] ***
Civil Servant Distribution 0.841 [0.96] 2.387 [0.73] ***
HH Consumption 2.874 [36.68] ‐10.170 [28.27]
District means
Child‐ & Infant Mortality ‐15.070 [9.10] * 1.844 [1.33]
Underpaid ‐5.669 [4.99] 0.116 [1.08]
Flooring ‐6.664 [2.53] *** ‐1.374 [0.57] **
Control variables
Urban / Rural 3.355 [2.06] 0.410 [0.38]
Ethno‐Demographic Fragmentation 2.729 [2.98] ‐10.780 [3.23] ***
Consumption Gini 5.397 [4.66] 3.226 [2.06]
Observations per district 0.005 [0.00] ** 0.000 [0.00]
Time‐dummy 1997 0.073 [0.60]
Constant ‐0.756 [2.74] ‐2.737 [1.06] **
pseudo R‐sq 0.709 0.538
N 179 142
Significance levels: * p<0.10, ** p<0.05, *** p<0.01
Source: Based on Authors’ Calculations
34 The ethno‐linguistic estimation has 106 failures (59,2%) completely determined.
40
The magnitude and t‐statistic of most of the significant indicators in the original ethno‐religious
regression increase, while the sign remains the same. The exceptions are the consumption GCOV,
Gini and urban/rural‐dummy, which are no longer significant. Conversely, ethno‐demographic
fragmentation becomes a significant negative determinant, while the GCOV of underpaid turns out
to be a significant positive determinant. In short, the model is rather sensitive to the alternative
configuration where districts which experienced collective violence in the recent past were excluded.
Especially the indicators urban/rural‐dummy and ethno‐demographic fragmentation behave rather
differently in this estimation.
Changeinhorizontalinequalitiesovertime
As has been discussed in the literature review, horizontal inequalities in themselves need not
necessarily be a determinant of conflict. Some authors argue that it is rather their change over time
and the corollary change in societal hierarchy that determines ethnic violence. This sub‐hypothesis
will be tested here. Horizontal inequalities are rather persistent over time, and therefore one should
be cautious while trying to draw conclusions from a relatively short time period (1993‐1997).
Nevertheless, such an analysis can provide an insightful addition to the time‐invariant estimations.
The model calculates the difference between the horizontal inequality and district means indicators
of both years. The regular control variables are included, and consumption Gini and ethno‐
demographic fragmentation both show the influence of their change over time as well. The results
are shown in table 12.35 It should be noted that due to collinearity in covariate patterns, the history
of communal violence for ethno‐linguistic groups could not be included. Both ethnic classifications
show fairly different results. The number of significant variables and pseudo‐R2 suggest that change
over time in horizontal inequalities as well as district means plays a much larger role for linguistic
groups than it does for religious groups.
Both converging and diverging horizontal inequalities can be significant determinants of conflict.
Converging horizontal inequalities seem to be positively related when it comes to access indicators,
such as under‐ or unemployed and child enrolment. Conversely, for achievement indicators such as
malnutrition, underpaid and household consumption, it is diverging inequality that is the
determinant. The influence of change in district means on ethno‐communal violence is rather
surprising: an improvement in socio‐economic indicators is a positive determinant of conflict. Only
the coefficients of malnutrition and household consumption move in the expected direction. One
35 In order to clarify: positive values express an increase in the indicator from 1993 to 1997, and vice versa.

41
should note the similarities between the ethno‐linguistic and ethno‐religious groups. The sign of the
coefficient of significant indicators is always the same for the pair. Lastly, it seems that if a district
becomes more ethno‐linguistically diverse the probability of conflict increases as well. This might be
a reflection of the tensions that could arise when migrant groups enter into a society, and
corresponds with Mancini’s finding that the influx of new migrants can be a positive determinant of
conflict.
Table 12: Estimation results of change in variables over time
Ethno‐Linguistic (13)
Ethno‐Religious (14)
Variable Coeff. St. Dev. Signif. Coeff. St. Dev. Signif.
Change in GCOV
Child‐ & Infant Mortality ‐0.183 [0.67] ‐0.385 [0.33]
Malnutrition 0.916 [0.48] * 0.418 [0.64]
Under‐ or Unemployed ‐5.912 [2.71] ** ‐2.979 [1.33] **
Underpaid 14.160 [5.47] *** 0.701 [1.07]
Adult Education 1.628 [9.14] 0.020 [5.03]
Child Enrolment ‐31.190 [12.26] ** 3.875 [4.59]
Flooring 14.750 [10.97] 9.073 [4.52] **
Water Source ‐9.687 [3.83] ** ‐0.567 [0.44]
Civil Servant Distribution 1.180 [0.78] 0.225 [0.73]
Household Consumption 158.000 [67.21] ** 20.160 [15.82]
Change in District Means
Child‐ & Infant Mortality ‐9.352 [5.14] * ‐3.981 [1.75] **
Malnutrition 41.490 [18.05] ** 1.836 [4.98]
Under‐ or Unemployed ‐1.338 [3.64] ‐4.157 [2.35] *
Underpaid ‐19.970 [7.52] *** ‐0.215 [1.27]
Adult Education 12.930 [5.91] ** ‐1.144 [1.94]
Child Enrolment 2.758 [2.89] 0.961 [1.77]
Flooring 25.780 [10.34] ** 3.186 [2.45]
Water Source ‐16.620 [6.40] *** ‐1.339 [1.18]
Household Consumption ‐8.422 [3.35] ** ‐0.974 [1.16]
Control variables
Urban / Rural 7.873 [2.77] *** 1.340 [0.43] ***
District split between 98 and 03 ‐0.901 [0.74] ‐0.477 [0.80]
Δ Ethno‐Demographic Fragmentation 16.710 [6.44] *** ‐8.078 [6.73]
Δ Consumption Gini 8.712 [3.17] *** 0.981 [1.93]
Observations per district ‐0.002 [0.00] 0.001 [0.00]
History of Communal Violence 1.018 [0.56] *
Constant ‐6.377 [2.54] ** ‐2.342 [1.03] **
pseudo R‐sq 0.668 0.436
N 137 139
Significance levels: * p<0.10, ** p<0.05, *** p<0.01
Source: Based on Authors’ Calculations

42
V. Discussion&Conclusion
HorizontalInequalities&Conflict
The summary statistics showed that the thirteen provinces covered by the paper were
demographically dominated by the Muslim and Javanese (both ethnic Javanese and ethnic
Sundanese) part of the population. They are accompanied by a small number of other religions and a
substantial number of nationally small linguistic groups. Historically, the Javanese have been the
main political, military and economic force in the archipelago – notwithstanding intra‐group
inequalities. The Indonesian context can thus be described as a situation in which the
demographically largest group is also the most influential group.
The socio‐economic data was collected in 1993 and 1997, while conflict data runs from 1998 to 2003.
The divide is more or less simultaneous with the downfall of the New Order regime and the peak of
the Asia financial crisis. This is important to keep this in mind while trying to establish any underlying
linkages. The district means show improvement in many dimensions between 1993 and 1997, which
cannot be verified for the later years. Furthermore, the strong concentrations in time and space of
the violence makes establishing some form of a causal link with a time‐persistent phenomenon such
as horizontal inequalities a rather unviable undertaking.
That being said, the summary statistics showed that almost all GCOV indicators were higher for
linguistically diverse districts than for religiously diverse regions. In other words: the inequalities
between linguistic groups were the more pervasive. Furthermore, for most indicators the horizontal
inequality increased more, or decreased less in ethno‐linguistic diverse districts. Of all the different
horizontal inequalities, the civil servant distribution was by far the most severe for both groups in
both years. This is in line with the World Bank report that the civil service is a vehicle to benefit
cronies of the regime, based on a patronage system (2003). Conversely, the inequalities in household
consumption, flooring and the education dimension (adult educational attainment and child
enrolment) were relatively low across the board.
Based on the regression analyses for ethno‐linguistic groups, it can be observed that districts are
more likely to experience ethnic strife if a) inequality in malnutrition is lower, b) inequality in water
source is higher,36 while c) inequality in flooring is lower, and the district d) is a Kota (urban), e) has
experienced communal violence in the recent past, and lastly f) is demographically more fragmented
– although the effect of the fragmentation fails to reach significance outside the capital.
36 While the sign of the effect of horizontal inequality in water source is constant, it is not always significant.
43
When analysing the regression estimates for ethno‐religious groups, it can be observed that districts
are more likely to experience ethnic strife if a) inequality in malnutrition is lower, b) inequality in
water source is higher, c) inequality in adult education attainment is higher, while d) the district is a
Kota (urban), and e) has experienced communal violence in the recent past. A more unequal civil
servant distribution, a less unequal household consumption and a higher Gini‐score are also positive
determinants, although statistically less strong. Outside Jakarta and in religiously diverse districts
higher inequality in child enrolment positively influences the probability of conflict.
It seems that there is some common basis between the two types of ethnic classification, as has been
noted earlier. The sign of the main determinant, inequality in malnutrition levels, is rather puzzling.
No explanation could be found in the model itself or in the literature. Usually, malnutrition indicators
are based on measuring children instead of adults, which might explain the lack of information.
Similarly, the negative sign of the household consumption inequality coefficient (for ethno‐religious
estimations) seems counterintuitive, especially when it is compared to the Gini. The suggestion is
that a higher vertical consumption inequality and a lower horizontal consumption inequality are both
positive determinants of conflict. A possible explanation for this apparent paradox could be found in
the formation of the groups. It might be that in this instance it is not ethnicity, but class differences –
which are only captured by the Gini – that are a determinant of conflict. The negative sign of the
consumption GCOV indicates that this is only the case when the horizontal inequality is low –
otherwise attention is focused on inter‐group inequalities.37 This is yet another example of how
multi‐layered group issues can be, and the relative artificiality of categorising them in a scientific
way.
More straightforward is the positive relationship between inequality in water source and ethnic
strife, which is similar for both ethnic categorisations. When compared to religious inequality in the
other housing coefficient – flooring, the signs seem to be contradictory. A partial explanation could
be that expectations for both indicators are different. Hygienic water sources are usually provided by
the community as a whole, an NGO or the government. People thus expect the government to supply
these, and tensions are likely to rise rapidly if one group is advantaged over another. Flooring – and
in general the house as a whole – is something people build or purchase themselves, and therefore
no expectations are created. While this does explain the positive sign of water source, the rationale
for the negative sign of flooring remains a grey area.
While the influence of community participation could only be measured once, its district mean
turned out to be a highly significant positive determinant for both ethnic classifications. This suggests
37 Why this is only the case for the ethno‐religious estimation remains a subject for further research.

44
that districts where relatively more people are actively engaged in community activities are more
likely to experience conflict. It could be a reaction to simmering ethnic tensions, reasoning that
increased participation in community initiatives would increase cohesion –making it an endogenous
process. There are no sources to support this though, and the ban on discussing ethnic issues (and
the consequent prohibition for local governments to design policies based on them) during the
Suharto reign makes this explanation fairly unlikely.
One of the alternative hypotheses was that ethno‐communal violence was a consequence of the
process of decentralisation. The theory was that power distribution and group hierarchy needed to
be redefined in newly formed districts, and that violence was a result of group leaders defending
existing interests or trying to increase their power. In short, if districts that were split shortly after
the decentralisation began were more likely to descend into ethnic conflict, then a greed‐based
explanation would become feasible. As can be seen from the results, the only time that the control
variable district split is significant, is for the estimation using only linguistically diverse districts. The
effect is reversed, however, suggesting that ethnically diverse districts that were split actually have a
smaller chance of ethno‐communal conflict. This is in line with the argument of Stewart et al, namely
that diffusing power through decentralisation can be a good way to attenuate ethnic tensions (2008).
Lastly, the question was asked whether it was not just horizontal inequalities that could be a
determinant of conflict, but also the direction in which they developed from 1993 to 1997. This was
researched separately, with some interesting results. First, it seems that change over time in
horizontal inequalities as well as district means plays a much larger role for linguistic groups than it
does for religious groups. Second, both converging and diverging horizontal inequalities can be
significant determinants of conflict, with converging indicators being mostly access indicators, and
diverging indicators being mostly achievement indicators. This does not necessarily confirm
Tadjoeddin’s theory that in case of converging inequalities the previously privileged group is more
likely to resort to violence, while for diverging inequalities the reverse is the case. To be able to say
so, more research needs to be done into the narratives of each incident, and the long‐term socio‐
economic development of the districts in which the incidents took place.
Conclusions
This research quantitatively investigated the relation between horizontal inequalities and ethno‐
communal violence. The analysis took place on the Indonesian district level, for both ethno‐lingual
and ethno‐religious groups using deadly ethno‐communal violence as the dummy dependent
variable. The main research question was tested using two competing hypotheses, the cultural and
the instrumental theories. Two sub‐questions were also tested, namely if the decentralisation
45
process in itself was a driver of conflict, and if the convergence and divergence of horizontal
inequalities over time could also be determinant of conflict.
The purpose of the paper was to provide insight into the drivers of (relatively) small‐scale ethno‐
communal violence within an ethnically diverse state. Realising that these incidents – in which
tensions after years of simmering suddenly escalate – are able to scar communities for many years
afterwards should be a major incentive for policy makers to want to prevent it. Knowing the possible
causes and remedying options gives the opportunity to actually shut the stable door before the horse
has been stolen. The two competing hypotheses were that a) Ethnic diversity is a determinant of
ethno‐communal conflict, and b) that Horizontal inequalities are a determinant of ethno‐communal
conflict.
Ethnic diversity has indeed been a determinant of ethno‐lingual communal violence, but the effect
was only robust for estimations which included districts within Jakarta. Since capitals are usually
ethnic melting pots, a high level of ethnic diversity alone seems insufficient as an explanation. In
other words; although the cultural hypothesis cannot be wholly rejected, the results find little
credence for it as well.
Horizontal inequalities turned out to determine ethno‐communal conflict, although there are marked
differences for linguistic and religious groups. The common basis is formed by horizontal inequalities
in malnutrition and water source, with the coefficient of the former being negative and the latter
positive. The main driver of the ethno‐religious estimations has been adult educational attainment,
which was positively correlated with the dependent variable. This points to a narrative where
schooling ‐ and the career chances that come with it ‐ is something for the privileged groups, leading
to frustration among the disadvantaged.
A puzzling aspect of the horizontal inequalities has been the negative coefficient of malnutrition for
both types, and flooring and household consumption for religious groups, as well as the positive
effect of the community participation district mean. The researcher was unable to adequately clarify
why the coefficients moved counter‐intuitively, leaving a number of questions yet to be answered.
Looking at the results from the angle of dimensions, as well as access and achievement indicators, it
seems that achievement variables are grosso modo more reliable predictors than access variables.
Not only are they more often significant, their confidence levels are higher and the coefficients move
consistently in the same direction. This is not to say that access variables cannot be determinants of
social unrest, but their ‘performance’ is not constant enough to draw strong conclusions.

46
The tentative results for the decentralisation sub‐question seem to preclude a greed‐oriented
explanation of the communal violence, and might actually give evidence to the hypothesis of Stewart
et al that decentralisation is a good way to address tensions resulting from horizontal inequalities.
Furthermore, both converging and diverging horizontal inequalities can be determinants of
communal violence. In the Indonesian context this is more so for ethno‐linguistic groups. This is
remarkable, since the regular horizontal inequality indicators for these groups were just less likely to
be statistically significant. It can thus be said that for ethno‐lingual groups the change in horizontal
inequalities is more likely to determine the probability of conflict, while the actual level of the
horizontal inequality itself is more important for ethno‐religious groups.
In conclusion, this paper adds to the existing knowledge on horizontal inequalities and conflict by
looking at a broad range of horizontal inequality indicators. The diversity of Indonesia is reflected in
the fact that there is not a single dimension with clearly the most explanatory strength. Rather, it is
the combination of different facets of horizontal inequality that is able to cover the variation in the
data. Instead of a strong concluding remark, it shows the complexities of ethnic conflict, involving
many multi‐layered groups, fluid perceptions and intricate leader‐follower relations. This research
should be regarded as a starting point for further research. Especially regional and group
decomposition which are likely to present new insights in the particularities of different Indonesian
islands and ethnic groups.

47
Bibliography
Aditjondro, G. (1998, August 14). Indonesia: The Myth of Chinese Domination, Jakarta Post, p. 3.
Ahmad, E., & Mansoor, A. M. (2002). Indonesia: Managing Decentralization IMF Working Papers (Vol. 136). New York: International Monetary Fund.
Boo Teik, K. (2004). Managing Ethnic Relations in Post‐Crisis Malaysia and Indonesia: Lessons from the New Economy Policy. In United Nations Research Institute for Social Development (Ed.), Identities, Conflict and Cohesion Program Paper (Vol. 6): UNRISD ‐ United Nations Research Institute for Social Development.
Booth, A. (2000). Poverty and Inequality in the Soeharto Era: An assessment. Bulletin of Indonesian Economic Studies, 36(1), 73‐104.
Brass, P. R. (2003). The Partition of India and Retributive Genocide in the Punjuab, 1946‐47: means, methods, and purposes. Journal of Genocide Research, 5(1), 71‐101.
Brown, G., Tajima, Y., & Hadi, S. (2005). Peace and Development Analysis in Central Sulawesi. In UNDP (Ed.), Overcoming Violent Conflict (Vol. 3, pp. 82). Jakarta: UNDP.
Brown, G. K. (2005). Horizontal Inequalities, Ethnic Separatism, and Violent Conflict: The Case of Aceh, Indonesia Human Development Report (Vol. 28): Human Development Report Office (HDRO), United Nations Development Programme (UNDP).
Brown, G. K., & Langer, A. (2010). Horizontal Inequalities and Conflict: a Critical Review and Research Agenda. Conflict, Security & Development, 10(1), 27‐55.
Cederman, L.‐E., Weidmann, N. B., & Gleditsch, K. S. (2011). Horizontal Inequalities and Ethno‐Nationalist Civil War: A Global Comparison. American political science review, 105(03), 478‐495.
Citypopulation.de. (2012). Indonesia: Administrative Division. Retrieved 23 October, 2013, from http://www.citypopulation.de/php/indonesia‐admin.php
Colombijn, F., & Lindblad, J. T. (Eds.). (2002). Roots of violence in Indonesia: Contemporary Violence in Historical Perspective. Leiden: KITLV Press.
Dhanani, S., & Islam, I. (2002). Poverty, Vulnerability and Social Protection in a Period of Crisis: the Case of Indonesia. World Development, 30(7), 1211‐1231.
Eriksson, M., & Wallensteen, P. (2004). Armed Conflict, 1989–2003. Journal of Peace Research, 41(5), 625‐636.
Esteban, J.‐M., & Ray, D. (1994). On the Measurement of Polarization. Econometrica, 62(4), 819‐851. Frankenberg, E., & Thomas, D. (2000). The Indonesia Family Life Survey (IFLS): Study Design and
Results from Waves 1 and 2. Gurr, T. R. (1970). Why Men Rebel. Princeton, NJ: Princeton University Press. Hegre, H., Ellingsen, T., Gates, S., & Gleditsch, N. P. (2001). Toward a Democratic Civil Peace?
Democracy, Political Change, and Civil War, 1816‐1992. American political science review, 95(1), 33‐48.
Horowitz, D. L. (1985). Ethnic Groups in Conflict. Berkely, CA: University of California. Huntington, S. P. (1993). The Clash of Civilizations? Foreign affairs, 72(3), 22‐49. Kaplan, D. R. (1994). The Coming Anarchy. The Atlantic Monthly, 273(2), 44‐76. Lewis, Paul, M., Simons, G. F., & Fennig, C. D. (2013). Ethnologue: Languages of the World,
Seventeenth Edition. Retrieved January 2, 2014, from http://www.ethnologue.com/ Liddle, R. W. (1999). Indonesia’s Unexpected Failure of Leadership. Mancini, L. (2008). Horizontal Inequality and Communal Violence: Evidence from Indonesian Districts.
In F. Stewart (Ed.), Horizontal Inequalities and Conflict: Understanding Group Violence in Multiethnic Societies. (pp. 106‐135). Oxford: Palgrave Macmillan.
Mancini, L., Stewart, F., & Brown, G. K. (2008). Approaches to the Measurement of Horizontal inequalities. In F. Stewart (Ed.), Horizontal Inequalities and Conflict: Understanding Group Violence in Multiethnic Societies. (pp. 85‐105). Oxford: Palgrave Macmillan.

48
Marshall, M. G. (2012, June 12, 2013). Major Episodes of Political Violence 1946‐2012. Retrieved July 9th, 2013, from http://www.systemicpeace.org/warlist.htm
Mishra, S. (2002). History in the Making: a Systemic Transition in Indonesia. Journal of the Asia Pacific Economy, 7(1), 1‐19.
Murshed, S. M., & Gates, S. (2005). Spatial–Horizontal Inequality and the Maoist Insurgency in Nepal. Review of Development Economics, 9(1), 121‐134.
OECD. (2011). How's life? Measuring well‐being. In OECD Publishing (Ed.): OECD. OECD. (2012). What are Equivalence Scales? OECD Project on Income Distribution and Poverty, 2.
http://www.oecd.org/eco/growth/OECD‐Note‐EquivalenceScales.pdf Østby, G. (2008). Polarization, Horizontal Inequalities and Violent Civil Conflict. Journal of Peace
Research, 45(2), 143‐162. doi: 10.1177/0022343307087169 Puguh , I. B., Iftikhar , A., & Iyanatul , I. (2000). Labour Market Dynamics in Indonesia ‐ Analysis of 18
Key Indicators of the Labour Market 1986‐1999. Jakarta: International Labour Organisation. Sambanis, N. (2001). Do Ethnic and Non‐Ethnic Civil Wars Have the Same Causes?: A Theoretical and
Empirical Inquiry. The Journal of Conflict Resolution, 45(3), 259‐282. Sen, A. (2002). Why Health Equity? Health Economics, 11, 659‐666. doi: 10.1002/hec.762 Sribney, W. (2005). Interpreting “...Completely Determined” when Running Logistic. STATA FAQ.
Retrieved January 10, 2014, from http://www.stata.com/support/faqs/statistics/completely‐determined‐in‐logistic‐regression/
Stewart, F. (2000). Crisis Prevention: Tackling Horizontal Inequalities. Oxford Development Studies, 28(3), 245‐262. doi: http://dx.doi.org/10.1080/713688319
Stewart, F. (2008). Horizontal Inequalities and Conflict: An Introduction and some Hypotheses. In S. Frances (Ed.), Horizontal Inequalities and Conflict: Understanding Group Violence in Multiethnic Societies. (pp. 3‐24). Oxford: Palgrave MacMillan.
Stewart, F. (2011). Horizontal Inequalities as a Cause of Conflict: a Review of CRISE Findings. In World Bank (Ed.), Word Development Report: World Bank.
Stewart, F., Brown, G. K., & Langer, A. (2008). Policies towards Horizontal Inequalities. In F. Stewart (Ed.), Horizontal Inequality and Conflict (pp. 301‐325). Oxford: Palgrave MacMillan.
Stock, J. H., & Watson, M. M. (2002). Introduction to Econometrics (3rd Edition ed.). Harlow, Egnland: Pearson Education Limited.
Suryadinata, L., Arifin, E. N., & Ananta, A. (2003). Indonesia’s Population: Ethnicity and Religion in a Changing Political Landscape. Singapore: Institute of South East Asia Studies.
Suryahadi, A., Sumarto, S., & Pritchett, L. (2003). Evolution of Poverty during the Crisis in Indonesia. Asian Economic Journal, 17(3), 221‐241.
Tadjoeddin, M. Z. (2002). Anatomy of Social Violence in the Context of Transition: the Case of Indonesia 1990‐2001 UNSFIR Working Papers. Jakarta: United Nations Support Facility for Indonesian Recovery.
Tadjoeddin, M. Z. (2013). Educated but Poor: Explaining Localized Ethnic Violence during Indonesia's Democratic Transition. International Area Studies Review, 16, 24‐49. doi: 10.1177/2233865913475434
Uhlin, A. (1999). The Russian Road. Inside Indonesia, 59, 7‐8. United Nations Security Council. (1975). Resolution 384. New York. Varshney, A., Panggabean, R., & Tadjoeddin, M. Z. (2004). Patterns of Collective Violence in Indonesia
(1990‐2003) UNSFIR Working Papers. Jakarta: United Nations Support Facility for Indonesian Recovery.
Walter, B. F. (2006). Building Reputation: Why Governments Fight Some Separatists but not Others. American Journal of Political Science, 50(2), 313‐330.
Waters, H., Saadah, F., & Pradhan, M. (2003). The Impact of the 1997–98 East Asian Economic Crisis on Health and Health Care in Indonesia. Health Policy and Planning, 18(2), 172‐181.
World Bank. (2003). Combating Corruption in Indonesia ‐ Enhancing Accountability for Development. Jakarta: World Bank Poverty Reducation and Economic Management Unit.
World Bank. (2010). New Patterns of Violence in Indonesia: Preliminary Evidence from Six 'High Conflict' Provinces. In World Bank Indonesia Conflict and Development Program (Ed.), Policy

49
Brief ‐ Understanding Conflict Dynamics and Impacts in Indonesia (Vol. 3). Jakarta: Word Bank Indonesia Office.
World Bank. (2011). World Development Report: Conflict, Security, and Development. In W. Bank (Ed.). Washington D.C.
Zivot, E. (2012). Econ 582: Introduction to Pooled Cross Section and Panel Data. Seattle, WA: University of Washington.

The UNU‐MERIT WORKING Paper Series 2014-01 The medium‐term effect of R&D on firm growth by Marco Capasso, Tania Treibich
and Bart Verspagen 2014-02 Diverse and uneven pathways towards transition to low carbon development: The
case of diffusion of solar PV technology in ChinaMichiko Iizuka 2014-03 User innovators and their influence on innovation activities of firms in Finland by
JariKuusisto, MerviNiemi and Fred Gault 2014-04 Migration, remittances and household welfare in Ethiopia by Lisa Andersson 2014-05 Path‐breaking directions of nanotechnology‐based chemotherapy and molecular
cancer therapy by Mario Coccia and Lili Wang 2014-06 Poor trends ‐ The pace of poverty reduction after the Millennium Development
AgendaRichard Bluhm, Denis de Crombrugghe, Adam Szirmai 2014-07 Firms' adoption of international standards: Evidence from the Ethiopian floriculture
sector by MuluGebreeyesu 2014-08 School choice, segregation, and forced school closureby Cheng Boon Ong
andKristof De Witte 2014-09 Gender difference in support for democracy in Sub‐Saharan Africa: Do social
institutions matter?by MatyKonte 2014-10 Why are women less democratic than men? Evidence from Sub‐Saharan African
countries by Cecilia García‐Peñalosa and MatyKonte 2014-11 Tipping points? Ethnic composition change in Dutch big city neighbourhoods by
Cheng Boon Ong 2014-12 Technology life cycle and specialization patterns of latecomer countries. The case
of the semiconductor industry by Giorgio Triulzi 2014-13 Patents as quality signals? The implications for financing constraints on R&D by
Dirk Czarnitzki, Bronwyn H. Hall and Hanna Hottenrott 2014-14 Assessment of effectiveness of Chinese aid in competence building and financing
development in Sudan by SamiaSatti Osman Mohamed Nour 2014-15 Education, training and skill development policies in Arab Gulf countries: Macro‐
micro overview by SamiaSatti Osman Mohamed Nour 2014-16 Structure of labour market and unemployment in Sudan by SamiaSatti Osman
Mohamed Nour 2014-17 Overview of knowledge transfer in MENA countries ‐ The case of Egypt by
SamiaSatti Osman Mohamed Nour 2014-18 The impact of ICT in public and private universities in Sudanby SamiaSatti Osman
Mohamed Nour 2014-19 End‐user collaboration for process innovation in services: The role of internal
resources by Mona Ashok, Rajneesh Narula and Andrea Martinez‐Noya 2014-20 Public investment and regional politics: The case of Turkey by Mehmet Guney
Celbis, Denis de Crombrugghe and Joan Muysken 2014-21 Infrastructure and the international export performance of Turkish regions by
Mehmet Guney Celbis, Peter Nijkamp and Jacques Poot 2014-22 Discovering and explaining work‐family strategies of parents in Luxembourg by
Nevena Zhelyazkova 2014-23 Parental leave take up and return to work of mothers in Luxembourg: An
application of the model of nested dichotomies by Nevena Zhelyazkova

2014-24 Millennium Development Goals: Tool or token of global social governance? by Mueid Al Raee, Elvis Amoateng, Elvis Korku Avenyo, Youssef Beshay, Mira Bierbaum, Charlotte Keijser and Rashmi Sinha
2014-25 One Europe or several? Causes and consequences of the European stagnation by Jan Fagerberg and Bart Verspagen
2014-26 The harmony of programs package: Quasi‐experimental evidence on deworming and canteen interventions in rural Senegal by Théophile Azomahou, Fatoumata Diallo and Wladimir Raymond
2014-27 Country Terms of Trade 1960‐2012: Trends, unit roots, over‐differencing, endogeneity, time dummies, and heterogeneity by Thomas Ziesemer
2014-28 The structure and comparative advantages of China's scientific research ‐ Quantitative and qualitative perspectives by Lili Wang
2014-29 Transition to knowledge‐based economy in Saudi Arabia by Samia Satti Osman Mohamed Nour
2014-30 Challenges and opportunities for transition to knowledge‐based economy in Arab Gulf countries by Samia Satti Osman Mohamed Nour
2014-31 Migration of international students and mobilizing skills in the MENA Region by Samia Satti Osman Mohamed Nour
2014-32 Beyond product innovation; improving innovation policy support for SMEs in traditional industries by René Wintjes, David Douglas, Jon Fairburn, Hugo Hollanders and Geoffrey Pugh
2014-33 The impact of innovation support programmes on SME innovation in traditional manufacturing industries: an evaluation for seven EU regions by Dragana Radicic, Geoffrey Pugh, Hugo Hollanders and René Wintjes
2014-34 Beliefs dynamics in communication networks by Théophile T. Azomahou and Daniel C. Opolot
2014-35 Stability and strategic diffusion in networks by Théophile T. Azomahou and Daniel C. Opolot
2014-36 Epsilon‐stability and the speed of learning in network games by Théophile T. Azomahou and Daniel C. Opolot
2014-37 Afghan unaccompanied minors in the Netherlands: Far away from home and protected? by Carla Buil and Melissa Siegel
2014-38 Multinational production and trade in an endogenous growth model with heterogeneous firms by Hibret B. Maemir and Thomas Ziesemer
2014-39 The political economy of research and innovation in organic photovoltaics (OPV) in different world regions by Serdar Türkeli and René Kemp
2014-40 Towards the societal system of innovation: The case of metropolitan areas in Europe by Serdar Türkeli and René Wintjes
2014-41 To return permanently or to return temporarily? Explaining migrants' intentions by Özge Bilgili and Melissa Siegel
2014-42 Catching up and lagging behind in a balance‐of‐payments‐constrained dual economy by Alejandro Lavopa
2014-43 An introduction to the economics of rare earths by Eva Bartekova 2014-44 The unequal effect of India's industrial liberalization on firms' decision to innovate:
Do business conditions matter? By Maria Bas and Caroline Paunov 2014-45 Insurgents in motion: Counterinsurgency and insurgency relocation in Iraq by Pui‐
hang Wong

2014-46 Successive leadership changes in the regional jet industry by Daniel Vertesy 2014-47 Demand, credit and macroeconomic dynamics: A microsimulation model by Huub
Meijers, Önder Nomaler and Bart Verspagen 2014-48 Accessibility analysis as an urban planning tool: Gas station location by D.A.
Escobar , C. Cadena‐Gaitán, F.J. Garcia 2014-49 China's economic embrace of Africa ‐ An international comparative perspective by
Tobias Broich and Adam Szirmai 2014-50 Mapping regional social enterprise ecosystems in India: Framework and indicators
by Lina Sonne 2014-51 Does shelter assistance reduce poverty in Afghanistan? By Craig Loschmann,
Christopher R. Parsons and Melissa Siegel 2014-52 How important is innovation? A Bayesian factor‐augmented productivity model on
panel data by Georges Bresson, Jean‐Michel Etienne and Pierre Mohnen 2014-53 Does too much work hamper innovation? Evidence for diminishing returns of work
hours for patent grants by Mehmet Güney Celbi¸ Serdar Türkeli 2014-54 Globalization, the rise of biotechnology and catching up in agricultural innovation:
The case of Bt technology in India Michiko Iizuka and Ajay Thutupalli 2014-55 Where are innovation indicators, and their applications, going? by Fred Gault 2014-56 Productivity in services in Latin America and the Caribbean by Elena Arias‐Ortiz,
Gustavo Crespi, Alejandro Rasteletti and Fernando Vargas 2014-57 Optimal public investment, growth, and consumption: Fresh evidence from African
countries by Augustin Kwasi Fosu, Yoseph Yilma Getachew and Thomas H.W. Ziesemer
2014-58 International R&D alliances by firms: Origins and development by Rajneesh Narula and Andrea Martínez‐Noya
2014-59 Appropriability mechanisms, innovation and productivity: Evidence from the UK by Bronwyn H. Hall and Vania Sena
2014-60 The size of patent categories: USPTO 1976‐2006 by François Lafond 2014-61 Asset recombination in international partnerships as a source of improved
innovation capabilities in China by Simon C. Collinson and Rajneesh Narula 2014-62 The viability of sustained growth by India's MNEs: India's dual economy and
constraints from location assets by Rajneesh Narula 2014-63 The effect of unconditional cash transfers on adult labour supply: A unitary discrete
choice model for the case of Ecuador by Andrés Mideros and Cathal O'Donoghue 2014-64 Giving in South Africa: Determining the influence of altruism, inequality aversion
and social capital by Nyasha Tirivayi 2014-65 The impact of food transfers for people living with HIV/AIDS: Evidence from Zambia
by Nyasha Tirivayi and Wim Groot 2014-66 Size and economies of scale in higher education and the implications for mergers by
Nyasha Tirivayi, Henriette Maasen van den Brink and Wim Groot 2014-67 Widowhood and barriers to seeking health care in Uganda by Nyasha Tirivayi 2014-68 An individual‐centered approach to multidimensional poverty: The cases of Chile,
Colombia, Ecuador and Peru by Andrea Franco Correa 2014-69 Innovation and productivity in services: Empirical evidence from Latin America by
Gustavo Crespi, Ezequiel Tacsir and Fernando Vargas 2014-70 Analysing global value chains using input‐output economics: Proceed with care by
Önder Nomaler and Bart Verspagen
2014-71 The deposit financing gap: Another Dutch disease by Huub Meijers, Joan Muysken and Olaf Sleijpen
2014-72 Do remittances and social assistance have different impacts on expenditure patterns of recipient households? The Moldovan case by Jennifer Waidler, Jessica Hagen‐Zanker, Franziska Gassmann and Melissa Siegel
2014-73 The role of industry and economic context in open innovation: Evidence from Nigeria by Abiodun Egbetokun, Omolayo Oluwatope, David Adeyeye and Maruf Sanni
2014-74 Means to improve access to justice and legally empower victims of domestic violence: An empirical legal study on legislation and legal offices in Buenos Aires, Argentina by Julieta Marotta
2014-75 Do remittances not promote growth? A bias‐adjusted three‐step mixture‐of‐regressions by Maty Konte
2014-76 Structural modernization and development traps: An empirical approach by Alejandro Lavopa and Adam Szirmai
2014-77 Democratizing intellectual property systems: How corruption hinders equal opportunities for firms by Caroline Paunov
2014-78 Can internet infrastructure help reduce regional disparities? Evidence from Turkey by Mehmet Guney Celbis and Denis de Crombrugghe
2014-79 Obesity of women in Jordan ‐ Prevalence and associated factors: Making a case for a comprehensive obesity policy by Sebastian Göllner and Zina Nimeh
2014-80 International R&D spillovers and business service innovation by Neil Foster‐McGregor, Johannes Pöschl and Robert Stehrer
2014-81 Tax incentives and firm size: effects on private R&D investment in Spain by José M. Labeaga, Ester Martínez‐Ros and Pierre Mohnen
2014-82 The Republic of Open Science: The institution’s historical origins and prospects for continued vitality by Paul A. David
2014-83 How can political trust be built after civil wars? Lessons from post‐conflict Sierra Leone by Pui‐Hang Wong
2014-84 Has the internet fostered inclusive innovation in the developing world? by Caroline Paunov and Valentina Rollo
2014-85 Multi‐level determinants of inward FDI ownership by Samyukta Bhupatiraju 2014-86 The geographic dimensions of institutions by Samyukta Bhupatiraju 2014-87 Leadership‐driven innovation & evolution of societies by Mario Coccia 2014-88 Temperate climate ‐ Innovative outputs nexus by Mario Coccia 2014-89 Technology & environment: Some possible damaging effects of technological
change in advanced and opulent societies by Mario Coccia 2014-90 Lab‐oriented radical innovations as drivers of paradigm shifts in science by Mario
Coccia 2014-91 Diverse we stand: Horizontal inequality and ethno‐communal conflict in Indonesia
by Bart Kleine Deters and Zina Nimeh