Embed Size (px)
Citation preview
832019 Unuftp Resaerch Paper 2007
httpslidepdfcomreaderfullunuftp-resaerch-paper-2007 130
PO Box 1390 Skulagata 4120 Reykjavik Iceland Final Project 2007
THE EFFECTS OF DISSOLVED OXYGEN ON FISH GROWTH
IN AQUACULTURE
Yovita John MallyaKingolwira National Fish Farming Centre Fisheries Division
Ministry of Natural Resources and TourismTanzania
mankay999yahoocom
SupervisorProf Helgi ThorarensenHolar University College
helgiholaris
ABSTRACT
Commercial aquaculture is growing worldwide except in Africa where production is
still low With fisheries reaching a stagnating phase the world and more so Africawill have to look to aquaculture in the future to provide fish products that will likelybe needed In view of this a study on water quality management was done whichspecifically looked at the effects of dissolved oxygen saturation on fish growth Thestudy was done through a review of literature and a case study using Atlantic halibutIn the case study halibut of 20-50 g in weight were reared in replicate at 60 80100 120 and 140 oxygen saturation levels in a tank recirculation system Thesubsequent effect of oxygen saturation levels on growth and feed conversion ratioswere taken after two weeks The results showed that oxygen saturation level had apositive effect on the growth and feed conversion ratio when it was set at 80-120saturation At 140 the growth was slightly lower and the feed conversion ratio was
higher at 60 and 140 compared to the other groups The conclusion was thatoxygen saturation level has an effect on growth and feed conversion ratios of fish andin the case of Atlantic halibut the growth rate is higher when the oxygen level isbetween 80 and 120 The feed conversion ratio for halibut was lower at 120oxygen saturation
832019 Unuftp Resaerch Paper 2007
httpslidepdfcomreaderfullunuftp-resaerch-paper-2007 230
Mallya
UNU-Fisheries Training Programme 2
TABLE OF CONTENTS
1 INTRODUCTION 6
11 State of world aquaculture 6
12 Status of aquaculture in Africa 6
13 Status of aquaculture in Tanzania 6
14 Motivation 10
15 Objective of the study 10
16 Goals of the study 10
17 Research questions 10
2 LITERATURE REVIEW 11
21 Water quality in aquaculture 11
22 Gas exchange and oxygen concentration in water 11
23 Oxygen uptake in and carbon dioxide release from the fish 11
231 Function of fish gills 12
24 Effects of oxygen levels on oxygen uptake by fish 13
241 Fish response to hypoxia 14242 Fish response to hyperoxia 15
25 Effects of oxygen level on growth and food conversion ratios of fish 15
251 Effect of oxygen on fish growth 16
252 Effect of oxygen on the food conversion ratio in fish 17
2521 Tilapia (Oreochromis niloticus) 18
2522 Cat fish culture (Clarias gariepinus) water quality requirements 20
2523 Oxygen deficiency 20
3 MATERIALS AND METHODS 21
31 Study area 21
32 Experimental fish 21
33 Experimental design 21
331 Oxygen levels in the system 22
34 Sampling and measurements 24
832019 Unuftp Resaerch Paper 2007
httpslidepdfcomreaderfullunuftp-resaerch-paper-2007 330
Mallya
UNU-Fisheries Training Programme 3
341 Specific growth rate 24
342 Feeding and the collection of leftover feed 24
343 Feed conversion ratio (FCR) 24
4 RESULTS 25
41 Growth 25
42 Feed conversion ratio (FCR) 25
5 DISCUSSION 26
6 CONCLUSIONS 26
ACKNOWLEDGEMENTS 27
LIST OF REFERENCES 28
832019 Unuftp Resaerch Paper 2007
httpslidepdfcomreaderfullunuftp-resaerch-paper-2007 430
Mallya
UNU-Fisheries Training Programme 4
LIST OF FIGURES
Figure 1 The graph below shows total aquaculture production in Tanzania according
to FAO statistics 2006b (redrawn with data from FAO Fishery Statistics Aquaculture
Production) 9
Figure 2 Diagram showing the structure for respiration (gas exchange) in fish
(Source Microsoft Encarta1993-2002 wwwkwiccom 2008-02-08) 12
Figure 3 The effect of oxygen level on growth and food conversion ratios (Source
wwwlinde-gascom 2007) 16
Figure 4 Weight increase of O niloticus grown under high ambient oxygen (near air
saturation) and under simulated conditions of diel flux in oxygen Data from 2
separate sets of experiments (A and B) are indicated Curves drawn through mean
values (plusmn SD n = 8) indicated (see test) (Source Tsadik and Kutty 1987) 19
Figure 5 Increase in weight of O niloticus grown under high (near air saturation)
medium and low ambient oxygen Mean values (plusmn SD n = 8) are indicated (Source
Tsadik and Kutty 1987) 19
Figure 6 The arrangement of the tank system used in the experiment showing the
oxygen saturation levels inlet and outlet pipes water pumps food collector plates and
aerators 23
Figure 7 The graph showing the specific growth rate (SGR) of Atlantic halibut reared
at different oxygen saturation levels 25
Figure 8 The feed conversion ratios (FCR) of Atlantic halibut reared at different
oxygen saturation levels 26
832019 Unuftp Resaerch Paper 2007
httpslidepdfcomreaderfullunuftp-resaerch-paper-2007 530
Mallya
UNU-Fisheries Training Programme 5
LIST OF TABLES
Table 2 Water quality requirements of African catfish 20
832019 Unuftp Resaerch Paper 2007
httpslidepdfcomreaderfullunuftp-resaerch-paper-2007 630
Mallya
UNU-Fisheries Training Programme 6
1 INTRODUCTION
11 State of world aquaculture
The contribution of aquaculture to global supplies of fish crustaceans molluscs andother aquatic animals was growing at a rate of 324 in 2004 Aquaculture continuesto grow more rapidly than all other animal food-producing sectors Production fromaquaculture has greatly outpaced population growth with a per capita supply fromaquaculture increasing from 07 kg in 1970 to 71 kg in 2004 representing an averageannual growth rate of 71 (FAO 2006a)
According to (FAO 2006a) production in capture fisheries is stagnating andaquaculture output is expanding faster than any other animal-based food sectorworldwide
Aquaculture is the fastest growing animal based food-producing sector particularly indeveloping countries though it is not so fast growing in Africa as will be reviewed
below This sector alone contributes nearly a third of the worldrsquos supply of fishproducts China and other Asian countries are by far the largest producers Unliketerrestrial farming where the bulk of the production is based on a limited number of species aquaculture produces more than 220 species Of these species carps tilapiaand related fish form the largest group in terms of quantity Other groups includeaquatic plants and mollusc (FAO 2006 a)
12 Status of aquaculture in Africa
The Sub-Saharan Africa region continues to be a minor player in aquaculture despiteits natural potential Even aquaculture of tilapia which is native to the continent hasnot developed to a large degree Nigeria leads in the region with the production of 44000 tonnes of catfish tilapia and other freshwater fishes reported There are someisolated bright spots in the continent black tiger shrimp (Penaeus monodon) inMadagascar and Eucheuma seaweed in The United Republic of Tanzania are thrivingand production of niche species like abalone ( Halitosis spp) in South Africa isincreasing In North Africa and the Near East Egypt is by far the dominant producingcountry (92 of the total for the region) and in fact it is now the second biggesttilapia producer after China and the worldrsquos top producer of mullets (FAO 2006a)
13 Status of aquaculture in Tanzania
The history of fish culture in the United Republic of Tanzania is not well documentedAccording to Balarin (1985) in documents at faoorgfisherycountrysectornaso_tanzania it started in 1949 with experimental work on the culture of tilapia at Korogwe (in Tanga Region) and Malya (in Mwanza Region) during whichmany ponds were constructed
These ponds ended up being largely non-productive due to lack of propermanagement and use of incorrect technology coupled with physical problems such as
drought and poor infrastructure According to reports from FAO 8000 fishponds hadbeen constructed in the United Republic of Tanzania by 1968 However some of the
832019 Unuftp Resaerch Paper 2007
httpslidepdfcomreaderfullunuftp-resaerch-paper-2007 730
Mallya
UNU-Fisheries Training Programme 7
ponds were too small in size (at times as small as 20 m2) and with very lowproduction resulting from poor management (FAO 2006b)
Water reservoirs constructed for use in homes or for livestock irrigation and factoriesor for flood-control were stocked with tilapia This practice started in 1950 and by
1966 50 of the reservoirs in the country had been stocked by the Fisheries DivisionIn 1967 the government launched a national campaign on fish farming which wasunsuccessful again due to improper management In 1972 aquaculture was for thefirst time given some importance in the fisheries policy After that aquaculture wasincluded in the Fisheries Policy although always as a low priority sector (TanzaniaFisheries Division 2006)
Aquaculture in the United Republic of Tanzania has a vast but as yet untappedpotential The industry is dominated by freshwater fish farming in which small-scalefarmers practice both extensive and semi-intensive fish farming Small fish ponds of an average size of 10 m x 15 m (150 m2) are integrated with other agricultural
activities such as gardening and animal and bird production on small pieces of landThe United Republic of Tanzania is currently estimated to have a total of 14100freshwater fishponds scattered across the mainland In addition there is a largerainbow trout (Oncorhynchus mykiss) farm with an area of 25 m x 25 m situated inArusha (Tanzania Fisheries Division 2006)
The distribution of fish ponds in the country is determined by several factors such asavailability and quality of water suitable land for fish farming awareness andmotivation within the community on the economic potential of fish farming
Although very profitable internationally shrimp farming is still in the experimentalphase in the United Republic of Tanzania a number of private companies haveacquired plots and permits for the culture of shrimp Shrimp farming has the potentialto be a profitable activity in the United Republic of Tanzania but there are widespreadconcerns about its potential environmental and socio-economic impacts based onobservation of the global industry (FAO 2006b)
In recent years seaweed farming has become popular in some coastal areas as ameans of income generation Small-scale seaweed farms on suitably selected sitessome of which are run by groups of women and youths are scattered along the entirecoastline of the country from Tanga in the north to Mtwara in the south and in the
islands of Mafia and Zanzibar Seaweed cultivation has rapidly emerged as one of themajor cash crops in Tanga and Zanzibar producing enough income to coverhousehold costs The species farmed are Kappaphycus cottonii and Eucheuma
spinosum Kappaphycus cottonii is believed to be indigenous while Eucheuma
spinosum and E striatum were originally imported from the Philippines There is alsopotential for the farming of other seaweed species such as Glacilaria (FAO statistics2006b)
The United Republic of Tanzania has good potential for the development of mariculture In 1996 a survey was conducted along the entire coastline for theselection of a preliminary shrimp culture site with support from the United Nations
Economic Commission for Africa (UNECA)The findings indicated that the countryhas big potential for shrimp culture which can be developed from the northernmost
832019 Unuftp Resaerch Paper 2007
httpslidepdfcomreaderfullunuftp-resaerch-paper-2007 830
Mallya
UNU-Fisheries Training Programme 8
region of Tanga to the southernmost region of Mtwara The total area identified assuitable for shrimp farming was 3000 ha from which potential production wasestimated at 11350 tonnes (FAO statistics 2006b)
Seaweed farming is so far the only form of mariculture which can be considered an
established success in the United Republic of Tanzania However there are a total of 14100 fish ponds scattered all over the country with differing potential from one areato another Most farmers own small ponds of an average size of 150 msup2 covering anestimated 2215 ha However there are four regions which have more than 1000 fishponds each These are Ruvuma (4942) Iringa (3137) Mbeya (1176) and Kilimanjaro(1660) (FAO statistics 2006b)
Use of land for fish farming is restricted to some specific areas Where water isavailable its use is not a problem as it is managed by water rights stipulated under thewater policy Fish farmers use animal manure as the main source of fertilizer for theirponds Most farmers use feeds such as domestic leftovers maize bran wheat bran
vegetables and wild grass Production has been low due to small pond sizes coupledwith poor management Fish ponds are the predominant production system with onlyone farm using raceways for the culture of rainbow trout (Oncorhynchus mykiss)
Several species both indigenous and introduced are used in the Tanzania Althoughthere are many similarities in fish farming in both regions in Tanzania fish farming isdominated by the tilapias and Oreochromis niloticus has become the predominantcultured species Other species with potential for use in aquaculture include other finfish and shellfish in the brackish and marine waters such as milk fish (Chanos
chanos) and the flathead grey mullet ( Mugil cephalus) The fresh water areas includethe northern African catfish (Clarias gariepinus) The cultivable shellfish includeshrimp of the family Penaeidae molluscs crabs oysters and mussels Trials haverecently been conducted for the farming of the milk fish strain (Kuyui in Swahili) inmarine waters (FAO 2006b)
Culture practices in Tanzania include ponds small tanks and the single raceway Theaverage size of the ponds is 150 m2 covering a total of 2115 ha The total productionestimated from extrapolation of these figures is 152280 tonnes There is only onecommercial fish farm that produces the rainbow trout (Oncorhynchus mykiss) situatedin Arusha This farm is 25 m by 25 m in size The production from this farm was 5tonnes in 2002 6 tonnes in 2003 and 7 tonnes in 2004 It is expected that production
will increase to 15 tonnes by 2006 and 30 tonnes by 2007
Tilapia and catfish are usually farmed in ponds and tanks Rainbow trout wasintroduced in the rivers of the northern and southern highlands in the pre-colonialperiod The main purpose was to stock the rivers for fishing for sport In seaweedfarming farmers practice the fixed off-bottom method The raft method has also beentried on an experimental basis in the Tanga region
According to the Fisheries Division production of fresh water fish is estimated at152280 tonnes for tilapia valued at US$ 132763730 while the actual productionof rainbow trout was 7 tonnes in 2004 worth US$ 1830863 The production figure
for cat fish is not known The seaweeds are mainly for export and its production is1500 tonnes which earns US$ 209241 (1 US$ = 1147 TShs ie Tanzanian
832019 Unuftp Resaerch Paper 2007
httpslidepdfcomreaderfullunuftp-resaerch-paper-2007 930
Mallya
UNU-Fisheries Training Programme 9
Shillings) Efforts are also underway for cultivation of shrimp and other marine finfish and non finfish organisms (FAO 2006b)
The fish produced from aquaculture is consumed locally Only one farmer is known toexport farmed fish (rainbow trout) to a neighbouring country Seaweeds are exported
when dry to Denmark and the United States of America The seaweed exporters buydry seaweed from farmers and pack and export the product to the importing countriesThe price per kilogram varies with species and distance from Dar es Salaam and isapproximately between TShs 180 and 220 per dry weight kilogram of K cottonni while that of E spinosum and E striatum varies between TShs 80 and 100
Figure 1 The graph below shows total aquaculture production in Tanzania accordingto FAO statistics 2006b (redrawn with data from FAO Fishery Statistics AquacultureProduction)
The contribution of the aquaculture sector to national food security and economicdevelopment is still insignificant Annual farmed fish production is extrapolated at152280 tonnes This is about 0435 of the average annual fish landings which isaround 350000 tonnes The impact on poverty alleviation is therefore alsoinsignificant However the possibility of an adverse impact on the environment isminimised since it is still at substance level (FAO 2006b)
At present aquaculture is largely a subsistence activity practiced by poor householdsin the coastal and inland areas but the benefits arising from it are several itcontributes to peoplersquos requirements for animal protein particularly in the rural areas
where there are no capture fisheries and it provides employment opportunities and isa source of income However as capture fisheries are stagnating the future for theUnited Republic of Tanzania lies in aquaculture and it should be commercialised innature which calls for well researched information of better management practices of which water quality for any cultured species should be made available for success inaquaculture Among the most important water quality parameters oxygen plays a vital
role in affecting growth of any cultured species ie too little or too much of it may bedetrimental to the life of any cultured fish (Tanzania Fisheries Division 2006)
832019 Unuftp Resaerch Paper 2007
httpslidepdfcomreaderfullunuftp-resaerch-paper-2007 1030
Mallya
UNU-Fisheries Training Programme 10
14 Motivation
Currently Tanzania has one major hatchery located within the Fisheries Divisionwhich is responsible for all the production of fry and fingerlings of tilapia to supply
the farmers country-wide However trials are on going for the production of catfishfry and fingerlings and the Division is still registering high mortality rates of juvenilesbefore they are supplied out to the farmers The farmers are also facing fish stuntnessin their ponds caused by poor water quality management Water quality may be amajor factor in the high mortality rates and therefore hopefully the knowledgeobtained here can be used to monitor the water quality parameters to possibly solvethis problem (Tanzania Fisheries Division 2006)
15 Objective of the study
The main objective of the study was to gain knowledge of water quality management
for commercialised aquaculture
16 Goals of the study
To review the effects of oxygen on the growth and feed conversion of fish
To measure the effects of oxygen on the growth and feed conversion of AtlanticHalibut ( Hippoglossus hippoglossus)
17 Research questions
The main research questions to be answered were
Does oxygen saturation have any effect on the growth rate of fishAt which levels is the growth affected positivelyWhat is the effect of the oxygen saturation on the feed conversion ratio in fishAt which saturation level is the feed conversion ratio best
832019 Unuftp Resaerch Paper 2007
httpslidepdfcomreaderfullunuftp-resaerch-paper-2007 1130
Mallya
UNU-Fisheries Training Programme 11
2 LITERATURE REVIEW
21 Water quality in aquaculture
Water quality is the totality of physical biological and chemical parameters that affect
the growth and welfare of cultured organisms The success of a commercialaquaculture enterprise depends on providing the optimum environment for rapidgrowth at the minimum cost of resources and capital Water quality affects the generalcondition of cultured organism as it determines the health and growth conditions of cultured organism Quality of water is therefore an essential factor to be consideredwhen planning for high aquaculture production
Although the environment of aquaculture fish is a complex system consisting of several water quality variables only few of them play decisive role The criticalparameters are temperature suspended solids and concentrations of dissolved oxygenammonia nitrite carbon dioxide and alkalinity However dissolved oxygen is the
most important and critical parameter requiring continuous monitoring in aquacultureproduction systems This is due to fact that fish aerobic metabolism requires dissolvedoxygen (Timmons et al 2001)
22 Gas exchange and oxygen concentration in water
Oxygen as a gas has a low solubility in water In addition the amount of oxygencontained in water varies with temperature and salinity in a predictable manner Lessoxygen can be held in fully air-saturated warm sea water than fully air-saturated coldfreshwater While the oxygen content of the water sets the absolute availability of oxygen in the water it is the oxygen partial pressure gradient that determines howrapidly oxygen can move from the water into the fishrsquos blood to support its metabolic
rate This is because oxygen moves by diffusion across the gills of fish
According to Fickrsquos law of diffusion the rate of diffusion of oxygen across the gills is
determined by the gill area the diffusion distance across the gill epithelia thediffusion constant and the difference in partial pressure of oxygen across the gills(Crampton et al 2003) Consequently partial pressure of oxygen is the mostappropriate term for expressing oxygen levels in aquaculture water However oxygenconcentration is the more commonly used term and for a given temperature andsalinity the partial pressure of oxygen and oxygen content in water are linearly
related Another suitable method for expressing oxygen levels in aquaculture is airsaturation (often reduced to just saturation) which is directly proportional to thepartial pressure and is reported on most oxygen probes that have built in algorithmsfor temperature and salinity (Bergheim et al 2006) In this study saturation wasused
23 Oxygen uptake in and carbon dioxide release from the fish
During respiration fish like other animals take in oxygen and give out carbondioxide The process is done by using gills in almost all fish although some can alsouse the skin and some have lung like structures used in addition to gills When a fish
respires a pressurised gulp of water flows from the mouth into a gill chamber on eachside of the head Gills themselves located in gill clefts within the gill chambers
832019 Unuftp Resaerch Paper 2007
httpslidepdfcomreaderfullunuftp-resaerch-paper-2007 1230
Mallya
UNU-Fisheries Training Programme 12
consist of fleshy sheet like filaments transected by extensions called lamellae Aswater flows across the gills the oxygen within them diffuses into blood circulatingthrough vessels in the filaments and lamellae Simultaneously carbon dioxide in thefishrsquos bloodstream diffuses into the water and is carried out of the body (see Figure
1 below)
Figure 2 Diagram showing the structure for respiration (gas exchange) in fish(Source Microsoft Encarta1993-2002 wwwkwiccom 2008-02-08)
231 Function of fish gills
For most fish species gills work by a unidirectional flow of water over the epithelial
surface of the gill where the transfer of gases occurs (O2 in CO2 out) The reason forthis unidirectional flow of water is the energetic nature of the system The energy thatwould be required to move water into and out of a respiratory organ would be muchmore than that used to move air because water holds low oxygen due to its lowsolubility (Groot et al 1995)
The blood flowing just under the epithelial gill tissue usually moves in a countercurrent flow to that of the water moving over it This allows for most of the O 2 to betaken in by the blood because the diffusion gradient is kept high by the blood pickingup oxygen as it moves along but always coming into contact with water that has ahigher O2 content The blood receiving the O2 continues to pick up O2 as it moves
along because fresh water is being washed over the epithelial lining of the gills(Jobling 1995) By doing so the fish ventilate the gills while also taking in oxygenand releasing carbon dioxide (Groot et al 1995)
However there are two ways fish ventilate their gills buccalopercula pumping (activeventilation) and ram ventilation (passive ventilation) In buccalopercula ventilationthe fish pull in water through the mouth (buccal chamber) and push it over the gillsand out of the opercula chamber (where the gills are housed) At this time the pressurein the buccal chamber is kept higher than the pressure in the opercula chamber so asto allow the fresh water to be constantly flushed over the gills
In ram ventilation a fish swims with its mouth open allowing water to wash over thegills This method of ventilation is common to fast moving fish and it enables tuna to
832019 Unuftp Resaerch Paper 2007
httpslidepdfcomreaderfullunuftp-resaerch-paper-2007 1330
Mallya
UNU-Fisheries Training Programme 13
keep enough oxygen going to the gill surface while swimming at high speed (Boydand Tucker 1998) During this time the oxygen is absorbed into the blood whilecarbon dioxide diffuses out of the blood to the water
Groot et al (1995) have described the pathway taken by carbon dioxide and explain
that in the blood CO2 is transported in the form of bicarbonate The bicarbonatemoves from the blood by passing through the erythrocytes in which O2 binds toHaemoglobin (Hb) at the respiratory surface causing hydrogen ions (H+) to bereleased The increase in H+ ions combines with HCO3
- to form CO2 and OH- Thusmore CO2 is formed and can leave the blood across the respiratory surface Excess H+ binds to OH- forming water and allowing the pH to increase enough to promote thebinding of oxygen to Hb The release of O2 from Hb in the tissues makes the Hbavailable to bind to H+ promoting the conversion of CO2 to HCO3
- which helps drawCO2 from the tissues Therefore CO2 that is being transported into and out of the redblood cells minimises changes in pH in other parts of the body because of protonbinding and proton release from haemoglobin as it is deoxygenated and oxygenated
respectively However carbon dioxide is rarely a problem in when dissolved oxygenconcentrations are well above saturation levels Due to these processes oxygen levelshould be kept at or a little bit higher during the entire culture period
24 Effects of oxygen levels on oxygen uptake by fish
It is commonly thought that if there is not enough oxygen in the water then the fishwill be seen gasping at the surface but this is a last resort means to breathe The firstindication there may be a dissolved oxygen problem in the water is when the fishbecome unusually lethargic and stop feeding As oxygen levels decrease the fish donot have enough energy to swim and feeding utilises yet more oxygen Often it isrecognised the fish have a problem at this stage but frequently some form of medication is added to the water and this can actually cause the oxygen level to dropeven lower leading to a number of mortalities This can lead to the mistakenconclusion that the fish were suffering from some form of disease In terms of managing any aquatic system it is always advisable to increase the aeration when anyfish start to behave abnormally before adding any form of medication to the waterIncreasing the aeration will certainly make the environment more comfortable for thefish even if the dissolved oxygen level was already satisfactory With respect toimproving the aeration before adding medication this will allow for any depletion of the oxygen level caused through a chemical reaction with the medication
The recommended minimum dissolved oxygen requirements are as followsCold water fish - 6 mg per litre (70 saturation)Tropical freshwater fish- 5 mg per litre (80 saturation)Tropical marine fish- 5 mg per litre (75 saturation)
It is worth bearing in mind that these values are minimum requirements for healthygrowth tissue repair and reproduction (Svobodova et al 1993) Most fish species willtolerate a drop below these minimum values for a short period of time probably thecold water species are likely to tolerate a lower level than tropical fish However theperiod of time during which the oxygen level drops below the required minimum
level will cause the fish to become stressed It is this stress which causes fish death Itmay take the fish several days to recover from short term oxygen depletion but where
832019 Unuftp Resaerch Paper 2007
httpslidepdfcomreaderfullunuftp-resaerch-paper-2007 1430
Mallya
UNU-Fisheries Training Programme 14
the levels are persistently low an assortment of stress related diseases such as fin rotand white spot may occur
241 Fish response to hypoxia
Hypoxia or oxygen depletion is a phenomenon that occurs in aquatic environments asdissolved oxygen (DO molecular oxygen dissolved in water) becomes reduced inconcentration to a point detrimental to aquatic organisms living in the systemDissolved oxygen is typically expressed as a percentage of the oxygen that woulddissolve in the water at the prevailing temperature and salinity (both of which affectthe solubility of oxygen in water) An aquatic system lacking dissolved oxygen (0saturation) is termed anaerobic Reducing or anoxic is a system with a low DOconcentration in the range between 1 and 30 DO saturation is called hypoxic Mostfish cannot live below 30 DO saturation A ldquohealthyrdquo aquatic environment should
seldom experience DO of less than 80 In response to a low concentration of dissolved oxygen in the water the fish can respond in two ways the blood flow can
be increased by opening up further secondary lamellae to increase the effectiverespiratory area (it may be difficult to increase significantly the blood flow ratethrough the capillaries themselves) and the concentration of red blood corpuscles canbe increased to raise the oxygen carrying capacity of the blood per unit volume Thelatter can be achieved by reducing the blood plasma volume (eg by increasing theurine flow rate) in the short term and by releasing extra blood corpuscles from thespleen in the longer term (Svobodova et al 1993)
At the same time the ventilation rate is increased to bring more water into contactwith the gills within a unit of time There are however limits to the increased flowattainable the space between the secondary lamellae is narrow (in trout it is about 20μm) and water will tend to be forced past the tips of the primary lamellae when the
respiratory water flow is high thus by-passing the respiratory surfaces
These reactions are quite adequate to compensate for the normal fluctuations of energy demands of the fish and of dissolved oxygen concentrations in the water Oneof the consequences however of an increased ventilation rate is that there will be anincrease in the amount of toxic substances in the water reaching the gill surface wherethey can be absorbed (Boyd and Tucker 1998)
However oxygen deficiency causes asphyxiation and fish will die depending on the
oxygen requirements of the species and to a lesser extent on their rate of adaptationFish exposed to oxygen deficient water do not take food collect near the watersurface gasp for air (cyprinids) gather at the inflow to ponds where the oxygen levelsare higher become torpid fail to react to irritation lose their ability to escape captureand ultimately die The major pathological-anatomic changes include a very pale skincolour congestion of the cyanotic blood in the gills adherence of the gill lamellaeand small haemorrhages in the front of the ocular cavity and in the skin of the gillcovers In the majority of predatory fish the mouth gapes spasmodically and theoperculum over the gills remains loosely open (Svobodova et al 1993)
More than that fish reduce food intake leading to a reduction in growth
Reproduction is inhibited and both fertilisation success and larval survival arecompromised Energy utilisation is decreased associated with a shift from aerobic to
832019 Unuftp Resaerch Paper 2007
httpslidepdfcomreaderfullunuftp-resaerch-paper-2007 1530
Mallya
UNU-Fisheries Training Programme 15
anaerobic metabolism To reduce energy expenditure under this situation fish moveto water at lower temperature and reduce activity reproduction feeding and proteinsynthesis Transcription is reduced mediated by increased levels of hypoxia-inducingfactor 1 (HIF-1) which also up-regulates genes involved in erythropoiesis capillarygrowth and glucose transport All these responses are directed at maintaining cellular
oxygen homeostasis and reducing energy expenditure thereby augmenting survival of the animal during hypoxia In general the actions of toxicants are exacerbated duringhypoxia through a variety of mechanisms Some species are much more tolerant of hypoxia than others leading to differential survival during extended periods of hypoxia (Poon et al 2002) To avoid this aquaculture systems have to be suppliedwith enough oxygen saturation However too much oxygen is also harmful to fish
242 Fish response to hyperoxia
Hyperoxia is the state of water when it holds a very high amount of oxygen At thisstate water is described as having a dissolved oxygen saturation of greater than 100
This percent can be 140-300
At this water condition oxygen molecules will begin to move around within the watercolumn looking for a little elbowroom If there is non available it will return to theatmosphere or attach to the organisms around (Florida Lake Watch 2004)
If fish are exposed (at a lower atmospheric pressure) to such water their bloodequilibrates with the excess pressure in the water Bubbles form in the blood and thesecan block the capillaries in sub-acute cases the dorsal and caudal fin can be affectedand bubbles may be visible between the fin rays The epidermal tissue distal to theocclusions then becomes necrotic and cases are known where the dorsal fins of trouthave become completely eroded In severe cases death occurs rapidly as a result of blockage of the major arteries and large bubbles are clearly seen between the rays of all the fins The remedy is either to remove the fish to normally equilibrated water orto provide vigorous aeration to strip out the excess gas (Svobodova et al 1993) Insome species such as salmons and fast swimming fishes the swim bladder acts like anoxygen store to be used during the hypoxia When the gads level in the blood is highgases will diffuse from the blood to the bladder When the water is supersaturated(hyperoxia) the bladder becomes over-inflated and this leads to buoyancy problemsespecially in small fishes (Groot et al 1995)
25
Effects of oxygen level on growth and food conversion ratios of fish
Successful fish production depends on good oxygen management Oxygen is essentialto the survival (respiration) of fish to sustain healthy fish and bacteria whichdecompose the waste produced by the fish and to meet the biological oxygen demand(BOD) within culture system Dissolved oxygen levels can affect fish respiration aswell as ammonia and nitrite toxicity When the oxygen level is maintained nearsaturation or even at slightly super saturation at all times it will increase growth ratesreduce the food conversion ratio and increase overall fish production
832019 Unuftp Resaerch Paper 2007
httpslidepdfcomreaderfullunuftp-resaerch-paper-2007 1630
Mallya
UNU-Fisheries Training Programme 16
Figure 3 The effect of oxygen level on growth and food conversion ratios (Linde-gas2007)
251 Effect of oxygen on fish growth
Oxygen is important in respiration and metabolism processes in any animal In fishthe metabolic rate is highly affected by the concentration of oxygen in the rearingenvironment As the dissolved oxygen concentration decreases respiration andfeeding activities also decrease As a result the growth rate is reduced and the
possibility of a disease attack is increased However fish is not able to assimilate thefood consumed when DO is low (Tom 1998)
Overall health and physiological conditions are best if the dissolved oxygen is keptcloser to saturation When the levels are lower than those mentioned above thegrowth of the fish can be highly affected by an increase in stress tissue hypoxia and adecrease in swimming activities and reduction in immunity to diseases
However there is a need to maintain the level of dissolved oxygen at the saturationlevel which will not affect its physiological or metabolic activities so as to have highproduction in any culture system (Wedemeyer 1996) More than that one has to keep
in mind that the oxygen level requirement depends on the species but also on fish sizeand activity of the fish
According to Tom (1998) oxygen requirements per unit weight of fish significantlydecline with increasing individual weight In carp this reduction may be expressed bythe following ratios yearling = 1 two-year-old carp = 05 ndash 07 marketable carp = 03 ndash
04 Significant differences in oxygen demand are also found for different speciesUsing a coefficient of 1 to express the oxygen requirement of common carp thecomparative values for some other species are as follows trout 283 peled 220 pikeperch 176 roach 151 sturgeon 150 perch 146 bream 141 pike 110 eel 083 andtench 083
832019 Unuftp Resaerch Paper 2007
httpslidepdfcomreaderfullunuftp-resaerch-paper-2007 1730
Mallya
UNU-Fisheries Training Programme 17
Several studies have investigated the relationship between oxygen saturation and fishfood intake Randolph and Clemens (1976) found that feeding patterns of channelcatfish varied with temperature and oxygen availability When the oxygen contentdrops below 59 fish starts to lose its appetite Rainbow trout ( Oncorhynchus mykiss)reduced its appetite when oxygen saturation fell below approximately 60 (Jobling
1995) Similar results have been obtained from European sea bass ( Dicentrarchuslabrax L) (Thetmeyer et al 1999) blue tilapia (Oreochromis aureus) (Papoutsoglouand Tziha 1996) channel catfish ( Ictalurus punctatus ) (Buentello et al 2000) juvenileturbot (Pichavant et al 2001) and common carp (Cyprinus carpio L) showedreduced growth when exposed to low oxygen levels
252 Effect of oxygen on the food conversion ratio in fish
Tolerance for low oxygen may relate in part to the metabolic rate of a fish (Verheyen
and Decleir 1994) Fishes will regulate their metabolic rate over a range of dissolvedoxygen concentrations however at some point a further reduction in oxygen tensionwill produce a shift from a metabolic rate that is independent of oxygen concentrationto one that is dependent on oxygen level The point is referred to as the critical oxygentension (Ultsch et al 1978)
Decreased oxygen availability is also considered a major factor in determining foodintake Low dissolved oxygen is a type of stress frequently found in fish farmscharacterised by high fish densities and polluted fresh or marine waters The foodconversion ratio (FCR) is the amount of fish food consumed to generate a givenweight gain It is the ratio between the weights gained in a given period to the totalfeed intake by the fish in the same period It is the inverse of the feed intake The food
conversion ratio is improved (lowered) at higher growth rates (Markore and Rorvik 2001 Crampton et al 2003 Norgarden et al 2003)
The average FCR from several recent studies of fish growth is 097 In most cases theFCR appears to be slightly lower for tank studies (mean 093) than for net-penstudies (mean 102) The industrial average FCR values in Scotland and Chile were128 and 126 respectively (Neuman et al 2004) The best FCR in Scotland was 099while Chilersquos best came in at 11 Kreiberg and Brenton-Davie (1998) report an FCRof 099 for Atlantic salmon in a Sea Systems floating bag An experiment done ontilapia (Oreochromis niloticus) showed that FCR was inversely proportional to thedissolved oxygen level (145 at higher dissolved oxygen level and 675 at lower
dissolved oxygen level) (Tsadik and Kutty 1987)
Bromage et al (2000) showed that halibut are capable of achieving a 11 foodconversion ratio (FCR)
832019 Unuftp Resaerch Paper 2007
httpslidepdfcomreaderfullunuftp-resaerch-paper-2007 1830
Mallya
UNU-Fisheries Training Programme 18
2521 Tilapia (Oreochromis niloticus)
It is well known that tilapia can tolerate hypoxic and even anoxic conditions for shortperiods and are thus better suited than other species to hypereutectic conditions thatmay exist in static water aquaculture systems (Chorn et al 2006) It is also known that
fish found both in the tropics and temperate waters have incipient limiting oxygenlevels which may occur as in hypoxia Incipient limiting levels generally average at
73 mmHg (229 gl at 28 C for warm water fish and 90 mmgl at 617 mgl for coldwater fish such as the salmonids)
In reference to Oreochromis niloticus studies have shown that the incipient oxygenrequirements are between 139 mgl -292mgl
Studies done by Tsadik and Kutty (1987) on the influence of ambient oxygen onfeeding and growth in O niloticus showed that experiments under the various oxygenregimes varied as shown in Figures 3 and 4 below
The increase in mean weight of individual fish during the course of the growth testsfor the high medium and low levels of DO is shown in Figure 3 The fastest rate of growth was at high DO and the slowest growth in the low DO
Figure 4 shows the changes in mean weight of fish under the two tests at high DO andthe two tests at fluctuating DO It is obvious that the difference in the conditions of the two tests at high DO (demand feeder and manual feeding) or at low DO (fish fedwith demand feeder and no supplementary feed) has not made any serious differencein the growth within the sets but the difference in growth of high DO tests andfluctuating DO tests were marked
832019 Unuftp Resaerch Paper 2007
httpslidepdfcomreaderfullunuftp-resaerch-paper-2007 1930
Mallya
UNU-Fisheries Training Programme 19
Figure 4 Weight increase of O niloticus grown under high ambient oxygen (near airsaturation) and under simulated conditions of diel flux in oxygen Data from 2separate sets of experiments (A and B) are indicated Curves drawn through meanvalues (plusmn SD n = 8) indicated (see test) (Source Tsadik and Kutty 1987)
Figure 5 Increase in weight of O niloticus grown under high (near air saturation)medium and low ambient oxygen Mean values (plusmn SD n = 8) are indicated (SourceTsadik and Kutty 1987)
832019 Unuftp Resaerch Paper 2007
httpslidepdfcomreaderfullunuftp-resaerch-paper-2007 2030
Mallya
UNU-Fisheries Training Programme 20
2522 Cat fish culture (Clarias gariepinus) water quality requirements
More than 100 species of the genus Clarias have been described all over the world InTanzania the family Clariidae has only one native species the African catfish Clarias
gariepinus (Burchell 1822) (Synonyms Clarias lazera and Clarias mossambicus)
have recently been introduced in this country
Table 1 Water quality requirements of African catfish
Eggs larvaeearly fry
Advanced fry(Tolerance)
Fingerlingsadults
O280 ndash 100saturation
3 ndash 5 ppm gt3 ppm
Temperature opt 30degC opt 30degC opt 26 ndash 28degC
NH3-N 01 ppm (10 ppm)
NO2-N 05 ppm
NO3-N 100 ppm
Ph 6 ndash 9
CO2-C 6 ppm (10 ndash 15 ppm)
Salinity
10 ppt (15 ndash 16 ppt)
(Source FAO repository paper 2006b)
2523 Oxygen deficiency
African catfish has lung like structures that enable them to breathe air This made itpossible to survive very low oxygen levels in the pond However when Africancatfish is under mixed or polyculture oxygen level is important for the species mixedwith in the pond
832019 Unuftp Resaerch Paper 2007
httpslidepdfcomreaderfullunuftp-resaerch-paper-2007 2130
Mallya
UNU-Fisheries Training Programme 21
3 MATERIALS AND METHODS
31 Study area
The study was conducted at Verid the Holar University College research centre in
Saudarkrokur in January and February 2008
32 Experimental fish
Juvenile halibut was obtained from Frisky hatchery in Akureyri Iceland The fish weretransported from Akureyri to Verid in a tank while oxygen saturation was maintainedat 400 and temperature at 5ordmC The fish were then acclimatised for two weeks under995-106 oxygen saturation and 18pp salinity and 85-10ordmC temperature
At the start of the third week the fish were starved for two days before they wereindividually measured to obtain the initial weight During the measurement the fish
were anasethised using Tricaine methane sulfonate (TMS) used in the ratio of 40-50mg per litre of water 150 fish were individually tagged intraperitoneally with TrovanPassive Transponder tags In total 300 fish were individually tagged The fish werethen distributed into 12 tanks (Figure 2) each with 25 tagged and 25 not tagged fish
33 Experimental design
The fish were exposed to five different levels of oxygen saturation The targetsaturation value in each group was 60 80 100 120 and 140
The system consists of 12 culture tanks three reservoir tanks three aerators which arecombined with low head oxygenator (LHO) and three pumps (Figure 6)
The fish were reared in 7 m3 fibre glass tanks Water was delivered to the tank through PVC pipe and water flow can be adjusted by the valve (See Appendix 1) Thewater level in the tanks was adjusted by varying the height of external stand pipesThe culture tank has a central drainage system at the bottom through which waterflows out to the reservoir tank The water flows from the central drainage passesthrough the wire mesh where the remaining feed pellets were collected and then thewater goes through the PVC pipe back to the reservoir tank
The reservoir tanks are about 460 litres and are made of high density polyethylene(HDPE) From the reservoir tank water from the culture tank mixes with the freshwater from the inlet and is then pumped to the aerator which is combined with a low-head oxygenator (LHO) A pinnacle 75 pump with 055 kWh is plumbed one to eachreservoir tank The pump delivers the water to the aerator from the reservoir tank (Figure 6) The aerator and low head oxygenator (LHO) is a single unit The aeratoradds oxygen to the water and removes carbon dioxide while the LHO adds moreoxygen to the water inside the aerator A fan draws air through the aerator countercurrent to the direction of the water flow in the proportions of 1 volume water to 10volumes air Then the water flows through the LHO column where oxygen gaselevates the oxygen saturation of the water The system can elevate the oxygen
saturation to over 120 air saturation
832019 Unuftp Resaerch Paper 2007
httpslidepdfcomreaderfullunuftp-resaerch-paper-2007 2230
Mallya
UNU-Fisheries Training Programme 22
331 Oxygen levels in the system
In total there were 12 tanks in the system used The target oxygen saturation was60 80 100 120 and 140 (Figure 6) The oxygen saturation in the tanks wasregulated as follows
The system consisted of three tank rows each with four fish tanks (Figure 6) Thefirst row had 60 and 80 oxygen saturation The saturation levels were obtained byinjecting nitrogen gas to the LHO which supplies water to the four tanks to reduce thesaturation from 100 to 60 saturation The nitrogen gas was added from a gas tank through a hose connected to the LHO The amount of the gas injected was regulatedfrom the nitrogen gas tank However in addition to the nitrogen gas oxygen gas wasadded directly to two of the fish tanks in the row to raise the saturation level to 80
The oxygen saturation in the fish tanks in the second row was set at 100-106saturation by injecting oxygen into the LHO
In the third row the oxygen saturation of water from the LHO was increased to 120through injection of oxygen Furthermore oxygen gas was added directly to two tanksto raise the saturation level to 140
The oxygen gas was added through a hose from the oxygen tanks the tail of the hosewas connected to the gas tank while the head was connected to the rectangular wooddiffuser The piece of wood was used to make very small fine air bubbles of oxygengas The small air bubbles are known to increase oxygen transfer by increasing thesurface area for oxygen diffusion Oxygen saturation was measured using (YSI 550)probe while salinity was measured using PAL made in Japan pocket refract meter
832019 Unuftp Resaerch Paper 2007
httpslidepdfcomreaderfullunuftp-resaerch-paper-2007 2330
Mallya
UNU-Fisheries Training Programme 23
Figure 6 The arrangement of the tank system used in the experiment showing theoxygen saturation levels inlet and outlet pipes water pumps food collector plates andaerators
Legend
A= Aerator and Low-head oxygenator
= Reservoir tanks
= Outlets
=Inlets
=Water pump
=Pellet collector plate
=Direction of water
832019 Unuftp Resaerch Paper 2007
httpslidepdfcomreaderfullunuftp-resaerch-paper-2007 2430
Mallya
UNU-Fisheries Training Programme 24
34 Sampling and measurements
The body mass and growth performance were measured every two weeks whileoxygen saturation temperature and salinity were recorded daily
341 Specific growth rate
Weight measurements were taken every two weeks to obtain the specific growth rate(SGR) Prior to measuring the fish were starved for two days Both the individualtagged and untagged fish were weighed Both the initial weight and final weight of the fish were used to calculate the growth performance in terms of SGR
The SGR of individually tagged fish was calculated as follows
SGR = [(ln w 2-ln w 1) (t 2-t 1)] 100
Where w1 and w2 are the initial and final weights of the fish at times t 1 and t 2 respectively
342 Feeding and the collection of leftover feed
The fish were fed manually commercial (Laxa Feed Mill Akureyri) feed pellets (25mm) four times each day Following feeding the remaining pellets were collectedfrom a feed trap on the outflow from each tank and counted The average weight of asample of 100 fresh pellets was 00148 g and based on that it was possible to calculatethe original weight of the remaining pellets (Fr) before they were soaked in water
343 Feed conversion ratio (FCR)
The total amount of feed consumed (CT) was calculated as
CT = Amount of feed fed ndash (number of uneaten pellets x mean weight of pellet)
Feed conversion rate (FCR) indicates how much feed is required for each unit gain inweight
FCR = CT increase in body mass during the same time
832019 Unuftp Resaerch Paper 2007
httpslidepdfcomreaderfullunuftp-resaerch-paper-2007 2530
Mallya
UNU-Fisheries Training Programme 25
4 RESULTS
41 Growth
There was no significant difference in growth rate of the Atlantic halibut reared at
different oxygen saturation levels (Figure 7) during the first period (SGR1) Howeverthere was a significant difference (plt002) in the growth rate of the fish during thesecond period (SGR2) Then the SGR of fish reared at 100 saturation wassignificantly higher than that of fish reared at either 60 or 140 saturation
Figure 7 The graph showing the specific growth rate (SGR) of Atlantic halibut rearedat different oxygen saturation levels
42 Feed conversion ratio (FCR)
There was no significant difference in FCR of fish reared at different oxygen
saturation levels (Figure 8) However the FCR was lowest at 100 and 120saturation
832019 Unuftp Resaerch Paper 2007
httpslidepdfcomreaderfullunuftp-resaerch-paper-2007 2630
Mallya
UNU-Fisheries Training Programme 26
Figure 8 The feed conversion ratios (FCR) of Atlantic halibut reared at differentoxygen saturation levels
5 DISCUSSION
The results of the experiment under different oxygen levels clearly showed thatgrowth is affected by the level of oxygen saturation During the second period theSGR was highest at 100 saturation The best FCR was obtained in the groups withthe highest growth rate although there was no significant difference in FCR of fish
reared at different oxygen saturation levels The growth of other species of fish is alsoaffected by oxygen saturation such as tilapia (Tsadik and Kutty 1987) and Atlanticsalmon (Crampton et al 2003 Seymour et al 1992 Forsberg and Bergheim 1996)The growth of Atlantic halibut and Atlantic salmon increases with increasingsaturation up to 100 saturation However these species appear to be more sensitiveto oxygen saturation than tilapia
6 CONCLUSIONS
The results suggest that oxygen saturation levels affect both growth performance andfeed conversion ratios of Atlantic halibut The maximum growth rate and lowest feedconversion ratio in Atlantic halibut can be attended at higher oxygen saturation levelsbetween 90 and 120 However more research is needed in order to know at whichsaturation point the growth is maximised
Regarding future experimental work the results of this trial should be reconfirmed andgiven more time so that more observations can be made The actual oxygen saturationpoint at which Atlantic halibut has maximum growth should be identified hence moreexperimentation is needed
832019 Unuftp Resaerch Paper 2007
httpslidepdfcomreaderfullunuftp-resaerch-paper-2007 2730
Mallya
UNU-Fisheries Training Programme 27
ACKNOWLEDGEMENTS
I would like to express my gratitude to all the people who were involved and havemade the culmination of this project possible for their kind help
To my supervisor Prof Helgi Thorarensen from Holar University College for hisvaluable guidance and advice I would also like to thank the technical staff atSaudarkrokur Holar University College for giving me the opportunity to use theirinstallations and equipments also for their assistance during the experimental periodI am also grateful to Arnthor Gustavsson and Ingolfur Arnarson from HolarUniversity for their help in the experimental design and weighing the fish which Icould not have managed alone
I am indebted to Dr Tumi Tomasson Director of the UNU-FTP and Mr ThorAsgeirsson Deputy Director and Sigridur Kr Ingvarsdottir for their valuable
assistance care and guidance before and during the project
I would also like to thank my UNU fellows in the aquaculture speciality whoseencouragement enabled me to do the work even when I felt like giving up
I would like to thank my Director Mr Geoffrey Nanyaro at the Tanzanian FisheriesDivision for having given me leave which made it possible to accomplish this study
Last but not least to my family for their great concern and love all the time that Ispent here in Iceland Special thanks are given to my lovely husband for his loveencouragement and concern during the time I was away from home
832019 Unuftp Resaerch Paper 2007
httpslidepdfcomreaderfullunuftp-resaerch-paper-2007 2830
Mallya
UNU-Fisheries Training Programme 28
LIST OF REFERENCES
Balarin JD 1985 National reviews for aquaculture development in Africa 10Uganda FAO FishCirc (77010)109p
Bergheim A Martin G Anders N Per M Holland Per Krogedal and Viv Crampton2005 A newly developed oxygen injection system for cage farms AquaculturalEngineering 34(2006) 40-46
Bjornsson B and Tryggvadottir SV 1996 Effects of size on optimal temperature forgrowth and growth efficiency of immature Atlantic halibut (Hippoglossushippoglossus L) Aquaculture 142 33-42
Boyd CE and Tucker CS 1998 Pond Aquaculture Water Quality Management Kluwer Academic Publishers Boston MA (1998) 700 pp
Bromage N Mazorra C Bruce M Brown N and Shields R 2000 Halibutculture In Stickney RR Editor 2000 Encyclopedia of Aquaculture Wiley NewYork pp 425 ndash 432
Buentello JA Gatlin III DM Neill WH 2000 Effects of water temperature anddissolved oxygen on daily feed consumption feed utilization and growth of channelcatfish (Ictalurus punctatus) Aquaculture 182 339 ndash 352
Chorn E Lim et al 2006 Feeding Practices The Hawthorn Press 547-559
Crampton V A Bergheim M Gausen A Naeligss and P M Hoslashlland (2003) Effect of
low Oxygen on fish performance (wwwewoscom)
FAO 2006a State of world fisheries and Aquaculture FAO report 2006
FAO 2006b Aquaculture Production in Tanzania FAO Fishery StatisticsAquaculture production 2006)
Fisheries Division Tanzania 2007Status of Aquaculture in Tanzania
Florida Lake watch 2004The beginners guide for water management oxygen andtemperature Department of Fisheries and Aquatic Sciences Institute of Food andAgricultural sciences University of Florida Fist edition
Forsberg OI and Bergheim A 1996 The impact of constant and fluctuating oxygenconcentrations and two water consumption rates on post-smolt Atlantic salmonproduction parameters Aquacult Eng 15 (1996) pp 327 ndash 347
Groot C Margolis L and WC Clarke 1995 Physiology Ecology of pacific salmonDepartment of Fisheries and oceans Biological sciences Branch Pacific biologicalstation Nanaimo British Columbia Canada
832019 Unuftp Resaerch Paper 2007
httpslidepdfcomreaderfullunuftp-resaerch-paper-2007 2930
Mallya
UNU-Fisheries Training Programme 29
Groot C Margolis L and Clarke1995 Physiological Ecology of Pacific Salmon Department of Fisheries and oceans Biological sciences Branch Pacific biologicalstation Nanaimo British Columbia Canada
Jobling M 1995 Environmental biology of fishes Chapman and Hall Fish and
fisheries series 16
Kreiberg H Brenton-Davie V 1998 Seawater growth of Atlantic salmon in SEASystemsTM floating bag Aquaculture Update 81 1-2
Linde ndash gas 2007 httpwwwlindegascom [Dec 2006]
Microsoft Encarta1993-2002 wwwkwiccom Respiration in fishes Microsoft incartacopyright 1993-2002 Microsoft Corporation
Morkore T and Rorvik K-A 2001 Seasonal variations in growth feed utilisation
and product quality of farmed Atlantic salmon (Salmo salar L) transferred to seawater as 0+ smolts or 1+ smolts Aquaculture 199 145 ndash 158
Moyle B P and Cech JJJr 2000 Fishes an introduction to Ichthyology Fourth
edition Upper Saddle River NJ 07458
Neuman J Weir M Beattie C 2004 Skretting in the UK and Chile An
opportunity for comparison Skretting Outlook 21 8-11
Nordgarden U Oppedal F Taranger GL Hemre G-I and Hansen T 2003Seasonally changing metabolism in Atlantic salmon (Salmo salar L) Aquac Nutr 9287-289
Papoutsoglou SE and Tziha G 1996 Blue tilapia (Oreochromis aureus) growth ratein relation to dissolved oxygen concentration under recirculated water conditionsAquacultural Engineering 15 181-192
Poon WL CY Hung and DJ Randall 2002 The effect of aquatic hypoxia on fish
Department of Biology and Chemistry City University of Hong Kong KowloonHong Kong SAR China EPA600R-02097
Pichavant K Person-Le-Ruyet J Le Bayou N Severe A Le Roux A andBcouf G 2001 Comparative effects of long-term hypoxia on growth feeding andoxygen consumption in juvenile turbot and European sea bass J Fish Biol 59 875-883 doi10 1111j1095-86492001tb00158x
Randolph KN and HP Clemens 1976 Some factors influencing the feedingbehaviour of channel catfish in culture ponds Transactions of American FisheriesSociety 105 718724
Seymour et al 1992 EA Seymour OI Forsberg and JP Aabel The effect of arious stocking densities low water use and two oxygen levels on production
parameters of adult Atlantic salmon (Salmo salar L) in land-based tanks Report fromRogaland Research RF-19392 (1992) p 36
832019 Unuftp Resaerch Paper 2007
httpslidepdfcomreaderfullunuftp-resaerch-paper-2007 3030
Mallya
Svobodova Z Richard L Jana M and Blanka V 1993 Water quality and fish health EIFAC Technical paper 54
Tanzania Fisheries Division aquaculture section 2006 Aquaculture in Tanzania
Ministry of Natural resources and Tourism Fisheries Division
Timmons MB James ME Fred WW Sreven TS and Brian J V Recirculating
Aquaculture Systems NRAC publication No01-002
Thetmeyer H Waller UBlack KD Inselmann S Rosenthal H 1999 Growth of European sea bass (Dicentrarchus labrax L) under hypoxic and oscillating oxygenconditions Aquaculture 174 355-367
Tom L1998 Nutritional and feeding of fish Kluwer Academic Publishers Secondedition
Tsadik Gagma MN Kutty 1987 Influence of ambient oxygen on feeding and growth
of tilapia Oreochromis niloticus ARAC87WP10United Nation DevelopmentProgramme Food and Agriculture Organization of the United Nations Nigerianinstitute for oceanography and marine research project RAF87009
Ultsch GR H Boschung and MJRoss 1978 Metabolism critical oxygen tensionand habitat selection in darters (Etheostoma) Ecology 5999-107
Verheyen ER Bluse and W Decleir 1994 Metabolic rate hypoxia tolereance andaquatic surface respiration of some lacustrine and riverine African cichlid fishes(Pisces Cichlidae) Comp Biochem Physiol 107A403-411
Wedemeyer GA 1996 Interactions with Water Quality Conditions in Physiology of Fish in Intensive Culture Systems Chapman and Hall New York New York 1996
832019 Unuftp Resaerch Paper 2007
httpslidepdfcomreaderfullunuftp-resaerch-paper-2007 730
Mallya
UNU-Fisheries Training Programme 7
ponds were too small in size (at times as small as 20 m2) and with very lowproduction resulting from poor management (FAO 2006b)
Water reservoirs constructed for use in homes or for livestock irrigation and factoriesor for flood-control were stocked with tilapia This practice started in 1950 and by
1966 50 of the reservoirs in the country had been stocked by the Fisheries DivisionIn 1967 the government launched a national campaign on fish farming which wasunsuccessful again due to improper management In 1972 aquaculture was for thefirst time given some importance in the fisheries policy After that aquaculture wasincluded in the Fisheries Policy although always as a low priority sector (TanzaniaFisheries Division 2006)
Aquaculture in the United Republic of Tanzania has a vast but as yet untappedpotential The industry is dominated by freshwater fish farming in which small-scalefarmers practice both extensive and semi-intensive fish farming Small fish ponds of an average size of 10 m x 15 m (150 m2) are integrated with other agricultural
activities such as gardening and animal and bird production on small pieces of landThe United Republic of Tanzania is currently estimated to have a total of 14100freshwater fishponds scattered across the mainland In addition there is a largerainbow trout (Oncorhynchus mykiss) farm with an area of 25 m x 25 m situated inArusha (Tanzania Fisheries Division 2006)
The distribution of fish ponds in the country is determined by several factors such asavailability and quality of water suitable land for fish farming awareness andmotivation within the community on the economic potential of fish farming
Although very profitable internationally shrimp farming is still in the experimentalphase in the United Republic of Tanzania a number of private companies haveacquired plots and permits for the culture of shrimp Shrimp farming has the potentialto be a profitable activity in the United Republic of Tanzania but there are widespreadconcerns about its potential environmental and socio-economic impacts based onobservation of the global industry (FAO 2006b)
In recent years seaweed farming has become popular in some coastal areas as ameans of income generation Small-scale seaweed farms on suitably selected sitessome of which are run by groups of women and youths are scattered along the entirecoastline of the country from Tanga in the north to Mtwara in the south and in the
islands of Mafia and Zanzibar Seaweed cultivation has rapidly emerged as one of themajor cash crops in Tanga and Zanzibar producing enough income to coverhousehold costs The species farmed are Kappaphycus cottonii and Eucheuma
spinosum Kappaphycus cottonii is believed to be indigenous while Eucheuma
spinosum and E striatum were originally imported from the Philippines There is alsopotential for the farming of other seaweed species such as Glacilaria (FAO statistics2006b)
The United Republic of Tanzania has good potential for the development of mariculture In 1996 a survey was conducted along the entire coastline for theselection of a preliminary shrimp culture site with support from the United Nations
Economic Commission for Africa (UNECA)The findings indicated that the countryhas big potential for shrimp culture which can be developed from the northernmost
832019 Unuftp Resaerch Paper 2007
httpslidepdfcomreaderfullunuftp-resaerch-paper-2007 830
Mallya
UNU-Fisheries Training Programme 8
region of Tanga to the southernmost region of Mtwara The total area identified assuitable for shrimp farming was 3000 ha from which potential production wasestimated at 11350 tonnes (FAO statistics 2006b)
Seaweed farming is so far the only form of mariculture which can be considered an
established success in the United Republic of Tanzania However there are a total of 14100 fish ponds scattered all over the country with differing potential from one areato another Most farmers own small ponds of an average size of 150 msup2 covering anestimated 2215 ha However there are four regions which have more than 1000 fishponds each These are Ruvuma (4942) Iringa (3137) Mbeya (1176) and Kilimanjaro(1660) (FAO statistics 2006b)
Use of land for fish farming is restricted to some specific areas Where water isavailable its use is not a problem as it is managed by water rights stipulated under thewater policy Fish farmers use animal manure as the main source of fertilizer for theirponds Most farmers use feeds such as domestic leftovers maize bran wheat bran
vegetables and wild grass Production has been low due to small pond sizes coupledwith poor management Fish ponds are the predominant production system with onlyone farm using raceways for the culture of rainbow trout (Oncorhynchus mykiss)
Several species both indigenous and introduced are used in the Tanzania Althoughthere are many similarities in fish farming in both regions in Tanzania fish farming isdominated by the tilapias and Oreochromis niloticus has become the predominantcultured species Other species with potential for use in aquaculture include other finfish and shellfish in the brackish and marine waters such as milk fish (Chanos
chanos) and the flathead grey mullet ( Mugil cephalus) The fresh water areas includethe northern African catfish (Clarias gariepinus) The cultivable shellfish includeshrimp of the family Penaeidae molluscs crabs oysters and mussels Trials haverecently been conducted for the farming of the milk fish strain (Kuyui in Swahili) inmarine waters (FAO 2006b)
Culture practices in Tanzania include ponds small tanks and the single raceway Theaverage size of the ponds is 150 m2 covering a total of 2115 ha The total productionestimated from extrapolation of these figures is 152280 tonnes There is only onecommercial fish farm that produces the rainbow trout (Oncorhynchus mykiss) situatedin Arusha This farm is 25 m by 25 m in size The production from this farm was 5tonnes in 2002 6 tonnes in 2003 and 7 tonnes in 2004 It is expected that production
will increase to 15 tonnes by 2006 and 30 tonnes by 2007
Tilapia and catfish are usually farmed in ponds and tanks Rainbow trout wasintroduced in the rivers of the northern and southern highlands in the pre-colonialperiod The main purpose was to stock the rivers for fishing for sport In seaweedfarming farmers practice the fixed off-bottom method The raft method has also beentried on an experimental basis in the Tanga region
According to the Fisheries Division production of fresh water fish is estimated at152280 tonnes for tilapia valued at US$ 132763730 while the actual productionof rainbow trout was 7 tonnes in 2004 worth US$ 1830863 The production figure
for cat fish is not known The seaweeds are mainly for export and its production is1500 tonnes which earns US$ 209241 (1 US$ = 1147 TShs ie Tanzanian
832019 Unuftp Resaerch Paper 2007
httpslidepdfcomreaderfullunuftp-resaerch-paper-2007 930
Mallya
UNU-Fisheries Training Programme 9
Shillings) Efforts are also underway for cultivation of shrimp and other marine finfish and non finfish organisms (FAO 2006b)
The fish produced from aquaculture is consumed locally Only one farmer is known toexport farmed fish (rainbow trout) to a neighbouring country Seaweeds are exported
when dry to Denmark and the United States of America The seaweed exporters buydry seaweed from farmers and pack and export the product to the importing countriesThe price per kilogram varies with species and distance from Dar es Salaam and isapproximately between TShs 180 and 220 per dry weight kilogram of K cottonni while that of E spinosum and E striatum varies between TShs 80 and 100
Figure 1 The graph below shows total aquaculture production in Tanzania accordingto FAO statistics 2006b (redrawn with data from FAO Fishery Statistics AquacultureProduction)
The contribution of the aquaculture sector to national food security and economicdevelopment is still insignificant Annual farmed fish production is extrapolated at152280 tonnes This is about 0435 of the average annual fish landings which isaround 350000 tonnes The impact on poverty alleviation is therefore alsoinsignificant However the possibility of an adverse impact on the environment isminimised since it is still at substance level (FAO 2006b)
At present aquaculture is largely a subsistence activity practiced by poor householdsin the coastal and inland areas but the benefits arising from it are several itcontributes to peoplersquos requirements for animal protein particularly in the rural areas
where there are no capture fisheries and it provides employment opportunities and isa source of income However as capture fisheries are stagnating the future for theUnited Republic of Tanzania lies in aquaculture and it should be commercialised innature which calls for well researched information of better management practices of which water quality for any cultured species should be made available for success inaquaculture Among the most important water quality parameters oxygen plays a vital
role in affecting growth of any cultured species ie too little or too much of it may bedetrimental to the life of any cultured fish (Tanzania Fisheries Division 2006)
832019 Unuftp Resaerch Paper 2007
httpslidepdfcomreaderfullunuftp-resaerch-paper-2007 1030
Mallya
UNU-Fisheries Training Programme 10
14 Motivation
Currently Tanzania has one major hatchery located within the Fisheries Divisionwhich is responsible for all the production of fry and fingerlings of tilapia to supply
the farmers country-wide However trials are on going for the production of catfishfry and fingerlings and the Division is still registering high mortality rates of juvenilesbefore they are supplied out to the farmers The farmers are also facing fish stuntnessin their ponds caused by poor water quality management Water quality may be amajor factor in the high mortality rates and therefore hopefully the knowledgeobtained here can be used to monitor the water quality parameters to possibly solvethis problem (Tanzania Fisheries Division 2006)
15 Objective of the study
The main objective of the study was to gain knowledge of water quality management
for commercialised aquaculture
16 Goals of the study
To review the effects of oxygen on the growth and feed conversion of fish
To measure the effects of oxygen on the growth and feed conversion of AtlanticHalibut ( Hippoglossus hippoglossus)
17 Research questions
The main research questions to be answered were
Does oxygen saturation have any effect on the growth rate of fishAt which levels is the growth affected positivelyWhat is the effect of the oxygen saturation on the feed conversion ratio in fishAt which saturation level is the feed conversion ratio best
832019 Unuftp Resaerch Paper 2007
httpslidepdfcomreaderfullunuftp-resaerch-paper-2007 1130
Mallya
UNU-Fisheries Training Programme 11
2 LITERATURE REVIEW
21 Water quality in aquaculture
Water quality is the totality of physical biological and chemical parameters that affect
the growth and welfare of cultured organisms The success of a commercialaquaculture enterprise depends on providing the optimum environment for rapidgrowth at the minimum cost of resources and capital Water quality affects the generalcondition of cultured organism as it determines the health and growth conditions of cultured organism Quality of water is therefore an essential factor to be consideredwhen planning for high aquaculture production
Although the environment of aquaculture fish is a complex system consisting of several water quality variables only few of them play decisive role The criticalparameters are temperature suspended solids and concentrations of dissolved oxygenammonia nitrite carbon dioxide and alkalinity However dissolved oxygen is the
most important and critical parameter requiring continuous monitoring in aquacultureproduction systems This is due to fact that fish aerobic metabolism requires dissolvedoxygen (Timmons et al 2001)
22 Gas exchange and oxygen concentration in water
Oxygen as a gas has a low solubility in water In addition the amount of oxygencontained in water varies with temperature and salinity in a predictable manner Lessoxygen can be held in fully air-saturated warm sea water than fully air-saturated coldfreshwater While the oxygen content of the water sets the absolute availability of oxygen in the water it is the oxygen partial pressure gradient that determines howrapidly oxygen can move from the water into the fishrsquos blood to support its metabolic
rate This is because oxygen moves by diffusion across the gills of fish
According to Fickrsquos law of diffusion the rate of diffusion of oxygen across the gills is
determined by the gill area the diffusion distance across the gill epithelia thediffusion constant and the difference in partial pressure of oxygen across the gills(Crampton et al 2003) Consequently partial pressure of oxygen is the mostappropriate term for expressing oxygen levels in aquaculture water However oxygenconcentration is the more commonly used term and for a given temperature andsalinity the partial pressure of oxygen and oxygen content in water are linearly
related Another suitable method for expressing oxygen levels in aquaculture is airsaturation (often reduced to just saturation) which is directly proportional to thepartial pressure and is reported on most oxygen probes that have built in algorithmsfor temperature and salinity (Bergheim et al 2006) In this study saturation wasused
23 Oxygen uptake in and carbon dioxide release from the fish
During respiration fish like other animals take in oxygen and give out carbondioxide The process is done by using gills in almost all fish although some can alsouse the skin and some have lung like structures used in addition to gills When a fish
respires a pressurised gulp of water flows from the mouth into a gill chamber on eachside of the head Gills themselves located in gill clefts within the gill chambers
832019 Unuftp Resaerch Paper 2007
httpslidepdfcomreaderfullunuftp-resaerch-paper-2007 1230
Mallya
UNU-Fisheries Training Programme 12
consist of fleshy sheet like filaments transected by extensions called lamellae Aswater flows across the gills the oxygen within them diffuses into blood circulatingthrough vessels in the filaments and lamellae Simultaneously carbon dioxide in thefishrsquos bloodstream diffuses into the water and is carried out of the body (see Figure
1 below)
Figure 2 Diagram showing the structure for respiration (gas exchange) in fish(Source Microsoft Encarta1993-2002 wwwkwiccom 2008-02-08)
231 Function of fish gills
For most fish species gills work by a unidirectional flow of water over the epithelial
surface of the gill where the transfer of gases occurs (O2 in CO2 out) The reason forthis unidirectional flow of water is the energetic nature of the system The energy thatwould be required to move water into and out of a respiratory organ would be muchmore than that used to move air because water holds low oxygen due to its lowsolubility (Groot et al 1995)
The blood flowing just under the epithelial gill tissue usually moves in a countercurrent flow to that of the water moving over it This allows for most of the O 2 to betaken in by the blood because the diffusion gradient is kept high by the blood pickingup oxygen as it moves along but always coming into contact with water that has ahigher O2 content The blood receiving the O2 continues to pick up O2 as it moves
along because fresh water is being washed over the epithelial lining of the gills(Jobling 1995) By doing so the fish ventilate the gills while also taking in oxygenand releasing carbon dioxide (Groot et al 1995)
However there are two ways fish ventilate their gills buccalopercula pumping (activeventilation) and ram ventilation (passive ventilation) In buccalopercula ventilationthe fish pull in water through the mouth (buccal chamber) and push it over the gillsand out of the opercula chamber (where the gills are housed) At this time the pressurein the buccal chamber is kept higher than the pressure in the opercula chamber so asto allow the fresh water to be constantly flushed over the gills
In ram ventilation a fish swims with its mouth open allowing water to wash over thegills This method of ventilation is common to fast moving fish and it enables tuna to
832019 Unuftp Resaerch Paper 2007
httpslidepdfcomreaderfullunuftp-resaerch-paper-2007 1330
Mallya
UNU-Fisheries Training Programme 13
keep enough oxygen going to the gill surface while swimming at high speed (Boydand Tucker 1998) During this time the oxygen is absorbed into the blood whilecarbon dioxide diffuses out of the blood to the water
Groot et al (1995) have described the pathway taken by carbon dioxide and explain
that in the blood CO2 is transported in the form of bicarbonate The bicarbonatemoves from the blood by passing through the erythrocytes in which O2 binds toHaemoglobin (Hb) at the respiratory surface causing hydrogen ions (H+) to bereleased The increase in H+ ions combines with HCO3
- to form CO2 and OH- Thusmore CO2 is formed and can leave the blood across the respiratory surface Excess H+ binds to OH- forming water and allowing the pH to increase enough to promote thebinding of oxygen to Hb The release of O2 from Hb in the tissues makes the Hbavailable to bind to H+ promoting the conversion of CO2 to HCO3
- which helps drawCO2 from the tissues Therefore CO2 that is being transported into and out of the redblood cells minimises changes in pH in other parts of the body because of protonbinding and proton release from haemoglobin as it is deoxygenated and oxygenated
respectively However carbon dioxide is rarely a problem in when dissolved oxygenconcentrations are well above saturation levels Due to these processes oxygen levelshould be kept at or a little bit higher during the entire culture period
24 Effects of oxygen levels on oxygen uptake by fish
It is commonly thought that if there is not enough oxygen in the water then the fishwill be seen gasping at the surface but this is a last resort means to breathe The firstindication there may be a dissolved oxygen problem in the water is when the fishbecome unusually lethargic and stop feeding As oxygen levels decrease the fish donot have enough energy to swim and feeding utilises yet more oxygen Often it isrecognised the fish have a problem at this stage but frequently some form of medication is added to the water and this can actually cause the oxygen level to dropeven lower leading to a number of mortalities This can lead to the mistakenconclusion that the fish were suffering from some form of disease In terms of managing any aquatic system it is always advisable to increase the aeration when anyfish start to behave abnormally before adding any form of medication to the waterIncreasing the aeration will certainly make the environment more comfortable for thefish even if the dissolved oxygen level was already satisfactory With respect toimproving the aeration before adding medication this will allow for any depletion of the oxygen level caused through a chemical reaction with the medication
The recommended minimum dissolved oxygen requirements are as followsCold water fish - 6 mg per litre (70 saturation)Tropical freshwater fish- 5 mg per litre (80 saturation)Tropical marine fish- 5 mg per litre (75 saturation)
It is worth bearing in mind that these values are minimum requirements for healthygrowth tissue repair and reproduction (Svobodova et al 1993) Most fish species willtolerate a drop below these minimum values for a short period of time probably thecold water species are likely to tolerate a lower level than tropical fish However theperiod of time during which the oxygen level drops below the required minimum
level will cause the fish to become stressed It is this stress which causes fish death Itmay take the fish several days to recover from short term oxygen depletion but where
832019 Unuftp Resaerch Paper 2007
httpslidepdfcomreaderfullunuftp-resaerch-paper-2007 1430
Mallya
UNU-Fisheries Training Programme 14
the levels are persistently low an assortment of stress related diseases such as fin rotand white spot may occur
241 Fish response to hypoxia
Hypoxia or oxygen depletion is a phenomenon that occurs in aquatic environments asdissolved oxygen (DO molecular oxygen dissolved in water) becomes reduced inconcentration to a point detrimental to aquatic organisms living in the systemDissolved oxygen is typically expressed as a percentage of the oxygen that woulddissolve in the water at the prevailing temperature and salinity (both of which affectthe solubility of oxygen in water) An aquatic system lacking dissolved oxygen (0saturation) is termed anaerobic Reducing or anoxic is a system with a low DOconcentration in the range between 1 and 30 DO saturation is called hypoxic Mostfish cannot live below 30 DO saturation A ldquohealthyrdquo aquatic environment should
seldom experience DO of less than 80 In response to a low concentration of dissolved oxygen in the water the fish can respond in two ways the blood flow can
be increased by opening up further secondary lamellae to increase the effectiverespiratory area (it may be difficult to increase significantly the blood flow ratethrough the capillaries themselves) and the concentration of red blood corpuscles canbe increased to raise the oxygen carrying capacity of the blood per unit volume Thelatter can be achieved by reducing the blood plasma volume (eg by increasing theurine flow rate) in the short term and by releasing extra blood corpuscles from thespleen in the longer term (Svobodova et al 1993)
At the same time the ventilation rate is increased to bring more water into contactwith the gills within a unit of time There are however limits to the increased flowattainable the space between the secondary lamellae is narrow (in trout it is about 20μm) and water will tend to be forced past the tips of the primary lamellae when the
respiratory water flow is high thus by-passing the respiratory surfaces
These reactions are quite adequate to compensate for the normal fluctuations of energy demands of the fish and of dissolved oxygen concentrations in the water Oneof the consequences however of an increased ventilation rate is that there will be anincrease in the amount of toxic substances in the water reaching the gill surface wherethey can be absorbed (Boyd and Tucker 1998)
However oxygen deficiency causes asphyxiation and fish will die depending on the
oxygen requirements of the species and to a lesser extent on their rate of adaptationFish exposed to oxygen deficient water do not take food collect near the watersurface gasp for air (cyprinids) gather at the inflow to ponds where the oxygen levelsare higher become torpid fail to react to irritation lose their ability to escape captureand ultimately die The major pathological-anatomic changes include a very pale skincolour congestion of the cyanotic blood in the gills adherence of the gill lamellaeand small haemorrhages in the front of the ocular cavity and in the skin of the gillcovers In the majority of predatory fish the mouth gapes spasmodically and theoperculum over the gills remains loosely open (Svobodova et al 1993)
More than that fish reduce food intake leading to a reduction in growth
Reproduction is inhibited and both fertilisation success and larval survival arecompromised Energy utilisation is decreased associated with a shift from aerobic to
832019 Unuftp Resaerch Paper 2007
httpslidepdfcomreaderfullunuftp-resaerch-paper-2007 1530
Mallya
UNU-Fisheries Training Programme 15
anaerobic metabolism To reduce energy expenditure under this situation fish moveto water at lower temperature and reduce activity reproduction feeding and proteinsynthesis Transcription is reduced mediated by increased levels of hypoxia-inducingfactor 1 (HIF-1) which also up-regulates genes involved in erythropoiesis capillarygrowth and glucose transport All these responses are directed at maintaining cellular
oxygen homeostasis and reducing energy expenditure thereby augmenting survival of the animal during hypoxia In general the actions of toxicants are exacerbated duringhypoxia through a variety of mechanisms Some species are much more tolerant of hypoxia than others leading to differential survival during extended periods of hypoxia (Poon et al 2002) To avoid this aquaculture systems have to be suppliedwith enough oxygen saturation However too much oxygen is also harmful to fish
242 Fish response to hyperoxia
Hyperoxia is the state of water when it holds a very high amount of oxygen At thisstate water is described as having a dissolved oxygen saturation of greater than 100
This percent can be 140-300
At this water condition oxygen molecules will begin to move around within the watercolumn looking for a little elbowroom If there is non available it will return to theatmosphere or attach to the organisms around (Florida Lake Watch 2004)
If fish are exposed (at a lower atmospheric pressure) to such water their bloodequilibrates with the excess pressure in the water Bubbles form in the blood and thesecan block the capillaries in sub-acute cases the dorsal and caudal fin can be affectedand bubbles may be visible between the fin rays The epidermal tissue distal to theocclusions then becomes necrotic and cases are known where the dorsal fins of trouthave become completely eroded In severe cases death occurs rapidly as a result of blockage of the major arteries and large bubbles are clearly seen between the rays of all the fins The remedy is either to remove the fish to normally equilibrated water orto provide vigorous aeration to strip out the excess gas (Svobodova et al 1993) Insome species such as salmons and fast swimming fishes the swim bladder acts like anoxygen store to be used during the hypoxia When the gads level in the blood is highgases will diffuse from the blood to the bladder When the water is supersaturated(hyperoxia) the bladder becomes over-inflated and this leads to buoyancy problemsespecially in small fishes (Groot et al 1995)
25
Effects of oxygen level on growth and food conversion ratios of fish
Successful fish production depends on good oxygen management Oxygen is essentialto the survival (respiration) of fish to sustain healthy fish and bacteria whichdecompose the waste produced by the fish and to meet the biological oxygen demand(BOD) within culture system Dissolved oxygen levels can affect fish respiration aswell as ammonia and nitrite toxicity When the oxygen level is maintained nearsaturation or even at slightly super saturation at all times it will increase growth ratesreduce the food conversion ratio and increase overall fish production
832019 Unuftp Resaerch Paper 2007
httpslidepdfcomreaderfullunuftp-resaerch-paper-2007 1630
Mallya
UNU-Fisheries Training Programme 16
Figure 3 The effect of oxygen level on growth and food conversion ratios (Linde-gas2007)
251 Effect of oxygen on fish growth
Oxygen is important in respiration and metabolism processes in any animal In fishthe metabolic rate is highly affected by the concentration of oxygen in the rearingenvironment As the dissolved oxygen concentration decreases respiration andfeeding activities also decrease As a result the growth rate is reduced and the
possibility of a disease attack is increased However fish is not able to assimilate thefood consumed when DO is low (Tom 1998)
Overall health and physiological conditions are best if the dissolved oxygen is keptcloser to saturation When the levels are lower than those mentioned above thegrowth of the fish can be highly affected by an increase in stress tissue hypoxia and adecrease in swimming activities and reduction in immunity to diseases
However there is a need to maintain the level of dissolved oxygen at the saturationlevel which will not affect its physiological or metabolic activities so as to have highproduction in any culture system (Wedemeyer 1996) More than that one has to keep
in mind that the oxygen level requirement depends on the species but also on fish sizeand activity of the fish
According to Tom (1998) oxygen requirements per unit weight of fish significantlydecline with increasing individual weight In carp this reduction may be expressed bythe following ratios yearling = 1 two-year-old carp = 05 ndash 07 marketable carp = 03 ndash
04 Significant differences in oxygen demand are also found for different speciesUsing a coefficient of 1 to express the oxygen requirement of common carp thecomparative values for some other species are as follows trout 283 peled 220 pikeperch 176 roach 151 sturgeon 150 perch 146 bream 141 pike 110 eel 083 andtench 083
832019 Unuftp Resaerch Paper 2007
httpslidepdfcomreaderfullunuftp-resaerch-paper-2007 1730
Mallya
UNU-Fisheries Training Programme 17
Several studies have investigated the relationship between oxygen saturation and fishfood intake Randolph and Clemens (1976) found that feeding patterns of channelcatfish varied with temperature and oxygen availability When the oxygen contentdrops below 59 fish starts to lose its appetite Rainbow trout ( Oncorhynchus mykiss)reduced its appetite when oxygen saturation fell below approximately 60 (Jobling
1995) Similar results have been obtained from European sea bass ( Dicentrarchuslabrax L) (Thetmeyer et al 1999) blue tilapia (Oreochromis aureus) (Papoutsoglouand Tziha 1996) channel catfish ( Ictalurus punctatus ) (Buentello et al 2000) juvenileturbot (Pichavant et al 2001) and common carp (Cyprinus carpio L) showedreduced growth when exposed to low oxygen levels
252 Effect of oxygen on the food conversion ratio in fish
Tolerance for low oxygen may relate in part to the metabolic rate of a fish (Verheyen
and Decleir 1994) Fishes will regulate their metabolic rate over a range of dissolvedoxygen concentrations however at some point a further reduction in oxygen tensionwill produce a shift from a metabolic rate that is independent of oxygen concentrationto one that is dependent on oxygen level The point is referred to as the critical oxygentension (Ultsch et al 1978)
Decreased oxygen availability is also considered a major factor in determining foodintake Low dissolved oxygen is a type of stress frequently found in fish farmscharacterised by high fish densities and polluted fresh or marine waters The foodconversion ratio (FCR) is the amount of fish food consumed to generate a givenweight gain It is the ratio between the weights gained in a given period to the totalfeed intake by the fish in the same period It is the inverse of the feed intake The food
conversion ratio is improved (lowered) at higher growth rates (Markore and Rorvik 2001 Crampton et al 2003 Norgarden et al 2003)
The average FCR from several recent studies of fish growth is 097 In most cases theFCR appears to be slightly lower for tank studies (mean 093) than for net-penstudies (mean 102) The industrial average FCR values in Scotland and Chile were128 and 126 respectively (Neuman et al 2004) The best FCR in Scotland was 099while Chilersquos best came in at 11 Kreiberg and Brenton-Davie (1998) report an FCRof 099 for Atlantic salmon in a Sea Systems floating bag An experiment done ontilapia (Oreochromis niloticus) showed that FCR was inversely proportional to thedissolved oxygen level (145 at higher dissolved oxygen level and 675 at lower
dissolved oxygen level) (Tsadik and Kutty 1987)
Bromage et al (2000) showed that halibut are capable of achieving a 11 foodconversion ratio (FCR)
832019 Unuftp Resaerch Paper 2007
httpslidepdfcomreaderfullunuftp-resaerch-paper-2007 1830
Mallya
UNU-Fisheries Training Programme 18
2521 Tilapia (Oreochromis niloticus)
It is well known that tilapia can tolerate hypoxic and even anoxic conditions for shortperiods and are thus better suited than other species to hypereutectic conditions thatmay exist in static water aquaculture systems (Chorn et al 2006) It is also known that
fish found both in the tropics and temperate waters have incipient limiting oxygenlevels which may occur as in hypoxia Incipient limiting levels generally average at
73 mmHg (229 gl at 28 C for warm water fish and 90 mmgl at 617 mgl for coldwater fish such as the salmonids)
In reference to Oreochromis niloticus studies have shown that the incipient oxygenrequirements are between 139 mgl -292mgl
Studies done by Tsadik and Kutty (1987) on the influence of ambient oxygen onfeeding and growth in O niloticus showed that experiments under the various oxygenregimes varied as shown in Figures 3 and 4 below
The increase in mean weight of individual fish during the course of the growth testsfor the high medium and low levels of DO is shown in Figure 3 The fastest rate of growth was at high DO and the slowest growth in the low DO
Figure 4 shows the changes in mean weight of fish under the two tests at high DO andthe two tests at fluctuating DO It is obvious that the difference in the conditions of the two tests at high DO (demand feeder and manual feeding) or at low DO (fish fedwith demand feeder and no supplementary feed) has not made any serious differencein the growth within the sets but the difference in growth of high DO tests andfluctuating DO tests were marked
832019 Unuftp Resaerch Paper 2007
httpslidepdfcomreaderfullunuftp-resaerch-paper-2007 1930
Mallya
UNU-Fisheries Training Programme 19
Figure 4 Weight increase of O niloticus grown under high ambient oxygen (near airsaturation) and under simulated conditions of diel flux in oxygen Data from 2separate sets of experiments (A and B) are indicated Curves drawn through meanvalues (plusmn SD n = 8) indicated (see test) (Source Tsadik and Kutty 1987)
Figure 5 Increase in weight of O niloticus grown under high (near air saturation)medium and low ambient oxygen Mean values (plusmn SD n = 8) are indicated (SourceTsadik and Kutty 1987)
832019 Unuftp Resaerch Paper 2007
httpslidepdfcomreaderfullunuftp-resaerch-paper-2007 2030
Mallya
UNU-Fisheries Training Programme 20
2522 Cat fish culture (Clarias gariepinus) water quality requirements
More than 100 species of the genus Clarias have been described all over the world InTanzania the family Clariidae has only one native species the African catfish Clarias
gariepinus (Burchell 1822) (Synonyms Clarias lazera and Clarias mossambicus)
have recently been introduced in this country
Table 1 Water quality requirements of African catfish
Eggs larvaeearly fry
Advanced fry(Tolerance)
Fingerlingsadults
O280 ndash 100saturation
3 ndash 5 ppm gt3 ppm
Temperature opt 30degC opt 30degC opt 26 ndash 28degC
NH3-N 01 ppm (10 ppm)
NO2-N 05 ppm
NO3-N 100 ppm
Ph 6 ndash 9
CO2-C 6 ppm (10 ndash 15 ppm)
Salinity
10 ppt (15 ndash 16 ppt)
(Source FAO repository paper 2006b)
2523 Oxygen deficiency
African catfish has lung like structures that enable them to breathe air This made itpossible to survive very low oxygen levels in the pond However when Africancatfish is under mixed or polyculture oxygen level is important for the species mixedwith in the pond
832019 Unuftp Resaerch Paper 2007
httpslidepdfcomreaderfullunuftp-resaerch-paper-2007 2130
Mallya
UNU-Fisheries Training Programme 21
3 MATERIALS AND METHODS
31 Study area
The study was conducted at Verid the Holar University College research centre in
Saudarkrokur in January and February 2008
32 Experimental fish
Juvenile halibut was obtained from Frisky hatchery in Akureyri Iceland The fish weretransported from Akureyri to Verid in a tank while oxygen saturation was maintainedat 400 and temperature at 5ordmC The fish were then acclimatised for two weeks under995-106 oxygen saturation and 18pp salinity and 85-10ordmC temperature
At the start of the third week the fish were starved for two days before they wereindividually measured to obtain the initial weight During the measurement the fish
were anasethised using Tricaine methane sulfonate (TMS) used in the ratio of 40-50mg per litre of water 150 fish were individually tagged intraperitoneally with TrovanPassive Transponder tags In total 300 fish were individually tagged The fish werethen distributed into 12 tanks (Figure 2) each with 25 tagged and 25 not tagged fish
33 Experimental design
The fish were exposed to five different levels of oxygen saturation The targetsaturation value in each group was 60 80 100 120 and 140
The system consists of 12 culture tanks three reservoir tanks three aerators which arecombined with low head oxygenator (LHO) and three pumps (Figure 6)
The fish were reared in 7 m3 fibre glass tanks Water was delivered to the tank through PVC pipe and water flow can be adjusted by the valve (See Appendix 1) Thewater level in the tanks was adjusted by varying the height of external stand pipesThe culture tank has a central drainage system at the bottom through which waterflows out to the reservoir tank The water flows from the central drainage passesthrough the wire mesh where the remaining feed pellets were collected and then thewater goes through the PVC pipe back to the reservoir tank
The reservoir tanks are about 460 litres and are made of high density polyethylene(HDPE) From the reservoir tank water from the culture tank mixes with the freshwater from the inlet and is then pumped to the aerator which is combined with a low-head oxygenator (LHO) A pinnacle 75 pump with 055 kWh is plumbed one to eachreservoir tank The pump delivers the water to the aerator from the reservoir tank (Figure 6) The aerator and low head oxygenator (LHO) is a single unit The aeratoradds oxygen to the water and removes carbon dioxide while the LHO adds moreoxygen to the water inside the aerator A fan draws air through the aerator countercurrent to the direction of the water flow in the proportions of 1 volume water to 10volumes air Then the water flows through the LHO column where oxygen gaselevates the oxygen saturation of the water The system can elevate the oxygen
saturation to over 120 air saturation
832019 Unuftp Resaerch Paper 2007
httpslidepdfcomreaderfullunuftp-resaerch-paper-2007 2230
Mallya
UNU-Fisheries Training Programme 22
331 Oxygen levels in the system
In total there were 12 tanks in the system used The target oxygen saturation was60 80 100 120 and 140 (Figure 6) The oxygen saturation in the tanks wasregulated as follows
The system consisted of three tank rows each with four fish tanks (Figure 6) Thefirst row had 60 and 80 oxygen saturation The saturation levels were obtained byinjecting nitrogen gas to the LHO which supplies water to the four tanks to reduce thesaturation from 100 to 60 saturation The nitrogen gas was added from a gas tank through a hose connected to the LHO The amount of the gas injected was regulatedfrom the nitrogen gas tank However in addition to the nitrogen gas oxygen gas wasadded directly to two of the fish tanks in the row to raise the saturation level to 80
The oxygen saturation in the fish tanks in the second row was set at 100-106saturation by injecting oxygen into the LHO
In the third row the oxygen saturation of water from the LHO was increased to 120through injection of oxygen Furthermore oxygen gas was added directly to two tanksto raise the saturation level to 140
The oxygen gas was added through a hose from the oxygen tanks the tail of the hosewas connected to the gas tank while the head was connected to the rectangular wooddiffuser The piece of wood was used to make very small fine air bubbles of oxygengas The small air bubbles are known to increase oxygen transfer by increasing thesurface area for oxygen diffusion Oxygen saturation was measured using (YSI 550)probe while salinity was measured using PAL made in Japan pocket refract meter
832019 Unuftp Resaerch Paper 2007
httpslidepdfcomreaderfullunuftp-resaerch-paper-2007 2330
Mallya
UNU-Fisheries Training Programme 23
Figure 6 The arrangement of the tank system used in the experiment showing theoxygen saturation levels inlet and outlet pipes water pumps food collector plates andaerators
Legend
A= Aerator and Low-head oxygenator
= Reservoir tanks
= Outlets
=Inlets
=Water pump
=Pellet collector plate
=Direction of water
832019 Unuftp Resaerch Paper 2007
httpslidepdfcomreaderfullunuftp-resaerch-paper-2007 2430
Mallya
UNU-Fisheries Training Programme 24
34 Sampling and measurements
The body mass and growth performance were measured every two weeks whileoxygen saturation temperature and salinity were recorded daily
341 Specific growth rate
Weight measurements were taken every two weeks to obtain the specific growth rate(SGR) Prior to measuring the fish were starved for two days Both the individualtagged and untagged fish were weighed Both the initial weight and final weight of the fish were used to calculate the growth performance in terms of SGR
The SGR of individually tagged fish was calculated as follows
SGR = [(ln w 2-ln w 1) (t 2-t 1)] 100
Where w1 and w2 are the initial and final weights of the fish at times t 1 and t 2 respectively
342 Feeding and the collection of leftover feed
The fish were fed manually commercial (Laxa Feed Mill Akureyri) feed pellets (25mm) four times each day Following feeding the remaining pellets were collectedfrom a feed trap on the outflow from each tank and counted The average weight of asample of 100 fresh pellets was 00148 g and based on that it was possible to calculatethe original weight of the remaining pellets (Fr) before they were soaked in water
343 Feed conversion ratio (FCR)
The total amount of feed consumed (CT) was calculated as
CT = Amount of feed fed ndash (number of uneaten pellets x mean weight of pellet)
Feed conversion rate (FCR) indicates how much feed is required for each unit gain inweight
FCR = CT increase in body mass during the same time
832019 Unuftp Resaerch Paper 2007
httpslidepdfcomreaderfullunuftp-resaerch-paper-2007 2530
Mallya
UNU-Fisheries Training Programme 25
4 RESULTS
41 Growth
There was no significant difference in growth rate of the Atlantic halibut reared at
different oxygen saturation levels (Figure 7) during the first period (SGR1) Howeverthere was a significant difference (plt002) in the growth rate of the fish during thesecond period (SGR2) Then the SGR of fish reared at 100 saturation wassignificantly higher than that of fish reared at either 60 or 140 saturation
Figure 7 The graph showing the specific growth rate (SGR) of Atlantic halibut rearedat different oxygen saturation levels
42 Feed conversion ratio (FCR)
There was no significant difference in FCR of fish reared at different oxygen
saturation levels (Figure 8) However the FCR was lowest at 100 and 120saturation
832019 Unuftp Resaerch Paper 2007
httpslidepdfcomreaderfullunuftp-resaerch-paper-2007 2630
Mallya
UNU-Fisheries Training Programme 26
Figure 8 The feed conversion ratios (FCR) of Atlantic halibut reared at differentoxygen saturation levels
5 DISCUSSION
The results of the experiment under different oxygen levels clearly showed thatgrowth is affected by the level of oxygen saturation During the second period theSGR was highest at 100 saturation The best FCR was obtained in the groups withthe highest growth rate although there was no significant difference in FCR of fish
reared at different oxygen saturation levels The growth of other species of fish is alsoaffected by oxygen saturation such as tilapia (Tsadik and Kutty 1987) and Atlanticsalmon (Crampton et al 2003 Seymour et al 1992 Forsberg and Bergheim 1996)The growth of Atlantic halibut and Atlantic salmon increases with increasingsaturation up to 100 saturation However these species appear to be more sensitiveto oxygen saturation than tilapia
6 CONCLUSIONS
The results suggest that oxygen saturation levels affect both growth performance andfeed conversion ratios of Atlantic halibut The maximum growth rate and lowest feedconversion ratio in Atlantic halibut can be attended at higher oxygen saturation levelsbetween 90 and 120 However more research is needed in order to know at whichsaturation point the growth is maximised
Regarding future experimental work the results of this trial should be reconfirmed andgiven more time so that more observations can be made The actual oxygen saturationpoint at which Atlantic halibut has maximum growth should be identified hence moreexperimentation is needed
832019 Unuftp Resaerch Paper 2007
httpslidepdfcomreaderfullunuftp-resaerch-paper-2007 2730
Mallya
UNU-Fisheries Training Programme 27
ACKNOWLEDGEMENTS
I would like to express my gratitude to all the people who were involved and havemade the culmination of this project possible for their kind help
To my supervisor Prof Helgi Thorarensen from Holar University College for hisvaluable guidance and advice I would also like to thank the technical staff atSaudarkrokur Holar University College for giving me the opportunity to use theirinstallations and equipments also for their assistance during the experimental periodI am also grateful to Arnthor Gustavsson and Ingolfur Arnarson from HolarUniversity for their help in the experimental design and weighing the fish which Icould not have managed alone
I am indebted to Dr Tumi Tomasson Director of the UNU-FTP and Mr ThorAsgeirsson Deputy Director and Sigridur Kr Ingvarsdottir for their valuable
assistance care and guidance before and during the project
I would also like to thank my UNU fellows in the aquaculture speciality whoseencouragement enabled me to do the work even when I felt like giving up
I would like to thank my Director Mr Geoffrey Nanyaro at the Tanzanian FisheriesDivision for having given me leave which made it possible to accomplish this study
Last but not least to my family for their great concern and love all the time that Ispent here in Iceland Special thanks are given to my lovely husband for his loveencouragement and concern during the time I was away from home
832019 Unuftp Resaerch Paper 2007
httpslidepdfcomreaderfullunuftp-resaerch-paper-2007 2830
Mallya
UNU-Fisheries Training Programme 28
LIST OF REFERENCES
Balarin JD 1985 National reviews for aquaculture development in Africa 10Uganda FAO FishCirc (77010)109p
Bergheim A Martin G Anders N Per M Holland Per Krogedal and Viv Crampton2005 A newly developed oxygen injection system for cage farms AquaculturalEngineering 34(2006) 40-46
Bjornsson B and Tryggvadottir SV 1996 Effects of size on optimal temperature forgrowth and growth efficiency of immature Atlantic halibut (Hippoglossushippoglossus L) Aquaculture 142 33-42
Boyd CE and Tucker CS 1998 Pond Aquaculture Water Quality Management Kluwer Academic Publishers Boston MA (1998) 700 pp
Bromage N Mazorra C Bruce M Brown N and Shields R 2000 Halibutculture In Stickney RR Editor 2000 Encyclopedia of Aquaculture Wiley NewYork pp 425 ndash 432
Buentello JA Gatlin III DM Neill WH 2000 Effects of water temperature anddissolved oxygen on daily feed consumption feed utilization and growth of channelcatfish (Ictalurus punctatus) Aquaculture 182 339 ndash 352
Chorn E Lim et al 2006 Feeding Practices The Hawthorn Press 547-559
Crampton V A Bergheim M Gausen A Naeligss and P M Hoslashlland (2003) Effect of
low Oxygen on fish performance (wwwewoscom)
FAO 2006a State of world fisheries and Aquaculture FAO report 2006
FAO 2006b Aquaculture Production in Tanzania FAO Fishery StatisticsAquaculture production 2006)
Fisheries Division Tanzania 2007Status of Aquaculture in Tanzania
Florida Lake watch 2004The beginners guide for water management oxygen andtemperature Department of Fisheries and Aquatic Sciences Institute of Food andAgricultural sciences University of Florida Fist edition
Forsberg OI and Bergheim A 1996 The impact of constant and fluctuating oxygenconcentrations and two water consumption rates on post-smolt Atlantic salmonproduction parameters Aquacult Eng 15 (1996) pp 327 ndash 347
Groot C Margolis L and WC Clarke 1995 Physiology Ecology of pacific salmonDepartment of Fisheries and oceans Biological sciences Branch Pacific biologicalstation Nanaimo British Columbia Canada
832019 Unuftp Resaerch Paper 2007
httpslidepdfcomreaderfullunuftp-resaerch-paper-2007 2930
Mallya
UNU-Fisheries Training Programme 29
Groot C Margolis L and Clarke1995 Physiological Ecology of Pacific Salmon Department of Fisheries and oceans Biological sciences Branch Pacific biologicalstation Nanaimo British Columbia Canada
Jobling M 1995 Environmental biology of fishes Chapman and Hall Fish and
fisheries series 16
Kreiberg H Brenton-Davie V 1998 Seawater growth of Atlantic salmon in SEASystemsTM floating bag Aquaculture Update 81 1-2
Linde ndash gas 2007 httpwwwlindegascom [Dec 2006]
Microsoft Encarta1993-2002 wwwkwiccom Respiration in fishes Microsoft incartacopyright 1993-2002 Microsoft Corporation
Morkore T and Rorvik K-A 2001 Seasonal variations in growth feed utilisation
and product quality of farmed Atlantic salmon (Salmo salar L) transferred to seawater as 0+ smolts or 1+ smolts Aquaculture 199 145 ndash 158
Moyle B P and Cech JJJr 2000 Fishes an introduction to Ichthyology Fourth
edition Upper Saddle River NJ 07458
Neuman J Weir M Beattie C 2004 Skretting in the UK and Chile An
opportunity for comparison Skretting Outlook 21 8-11
Nordgarden U Oppedal F Taranger GL Hemre G-I and Hansen T 2003Seasonally changing metabolism in Atlantic salmon (Salmo salar L) Aquac Nutr 9287-289
Papoutsoglou SE and Tziha G 1996 Blue tilapia (Oreochromis aureus) growth ratein relation to dissolved oxygen concentration under recirculated water conditionsAquacultural Engineering 15 181-192
Poon WL CY Hung and DJ Randall 2002 The effect of aquatic hypoxia on fish
Department of Biology and Chemistry City University of Hong Kong KowloonHong Kong SAR China EPA600R-02097
Pichavant K Person-Le-Ruyet J Le Bayou N Severe A Le Roux A andBcouf G 2001 Comparative effects of long-term hypoxia on growth feeding andoxygen consumption in juvenile turbot and European sea bass J Fish Biol 59 875-883 doi10 1111j1095-86492001tb00158x
Randolph KN and HP Clemens 1976 Some factors influencing the feedingbehaviour of channel catfish in culture ponds Transactions of American FisheriesSociety 105 718724
Seymour et al 1992 EA Seymour OI Forsberg and JP Aabel The effect of arious stocking densities low water use and two oxygen levels on production
parameters of adult Atlantic salmon (Salmo salar L) in land-based tanks Report fromRogaland Research RF-19392 (1992) p 36
832019 Unuftp Resaerch Paper 2007
httpslidepdfcomreaderfullunuftp-resaerch-paper-2007 3030
Mallya
Svobodova Z Richard L Jana M and Blanka V 1993 Water quality and fish health EIFAC Technical paper 54
Tanzania Fisheries Division aquaculture section 2006 Aquaculture in Tanzania
Ministry of Natural resources and Tourism Fisheries Division
Timmons MB James ME Fred WW Sreven TS and Brian J V Recirculating
Aquaculture Systems NRAC publication No01-002
Thetmeyer H Waller UBlack KD Inselmann S Rosenthal H 1999 Growth of European sea bass (Dicentrarchus labrax L) under hypoxic and oscillating oxygenconditions Aquaculture 174 355-367
Tom L1998 Nutritional and feeding of fish Kluwer Academic Publishers Secondedition
Tsadik Gagma MN Kutty 1987 Influence of ambient oxygen on feeding and growth
of tilapia Oreochromis niloticus ARAC87WP10United Nation DevelopmentProgramme Food and Agriculture Organization of the United Nations Nigerianinstitute for oceanography and marine research project RAF87009
Ultsch GR H Boschung and MJRoss 1978 Metabolism critical oxygen tensionand habitat selection in darters (Etheostoma) Ecology 5999-107
Verheyen ER Bluse and W Decleir 1994 Metabolic rate hypoxia tolereance andaquatic surface respiration of some lacustrine and riverine African cichlid fishes(Pisces Cichlidae) Comp Biochem Physiol 107A403-411
Wedemeyer GA 1996 Interactions with Water Quality Conditions in Physiology of Fish in Intensive Culture Systems Chapman and Hall New York New York 1996
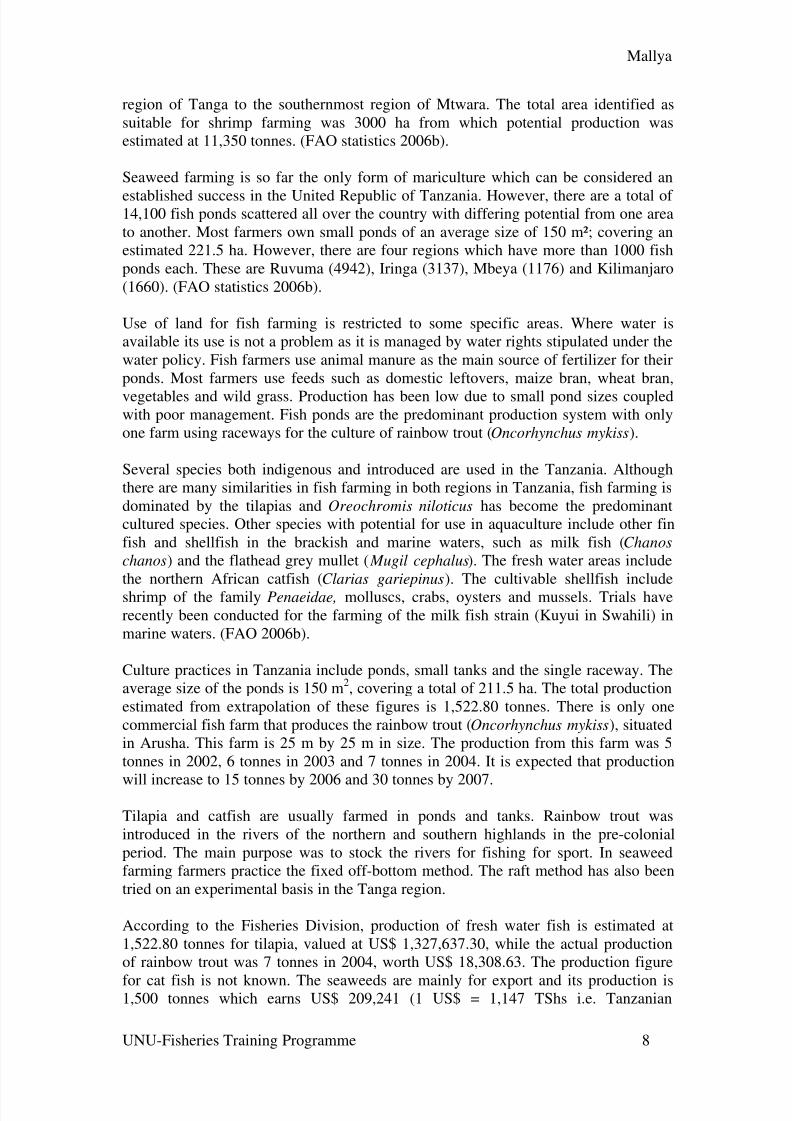
832019 Unuftp Resaerch Paper 2007
httpslidepdfcomreaderfullunuftp-resaerch-paper-2007 830
Mallya
UNU-Fisheries Training Programme 8
region of Tanga to the southernmost region of Mtwara The total area identified assuitable for shrimp farming was 3000 ha from which potential production wasestimated at 11350 tonnes (FAO statistics 2006b)
Seaweed farming is so far the only form of mariculture which can be considered an
established success in the United Republic of Tanzania However there are a total of 14100 fish ponds scattered all over the country with differing potential from one areato another Most farmers own small ponds of an average size of 150 msup2 covering anestimated 2215 ha However there are four regions which have more than 1000 fishponds each These are Ruvuma (4942) Iringa (3137) Mbeya (1176) and Kilimanjaro(1660) (FAO statistics 2006b)
Use of land for fish farming is restricted to some specific areas Where water isavailable its use is not a problem as it is managed by water rights stipulated under thewater policy Fish farmers use animal manure as the main source of fertilizer for theirponds Most farmers use feeds such as domestic leftovers maize bran wheat bran
vegetables and wild grass Production has been low due to small pond sizes coupledwith poor management Fish ponds are the predominant production system with onlyone farm using raceways for the culture of rainbow trout (Oncorhynchus mykiss)
Several species both indigenous and introduced are used in the Tanzania Althoughthere are many similarities in fish farming in both regions in Tanzania fish farming isdominated by the tilapias and Oreochromis niloticus has become the predominantcultured species Other species with potential for use in aquaculture include other finfish and shellfish in the brackish and marine waters such as milk fish (Chanos
chanos) and the flathead grey mullet ( Mugil cephalus) The fresh water areas includethe northern African catfish (Clarias gariepinus) The cultivable shellfish includeshrimp of the family Penaeidae molluscs crabs oysters and mussels Trials haverecently been conducted for the farming of the milk fish strain (Kuyui in Swahili) inmarine waters (FAO 2006b)
Culture practices in Tanzania include ponds small tanks and the single raceway Theaverage size of the ponds is 150 m2 covering a total of 2115 ha The total productionestimated from extrapolation of these figures is 152280 tonnes There is only onecommercial fish farm that produces the rainbow trout (Oncorhynchus mykiss) situatedin Arusha This farm is 25 m by 25 m in size The production from this farm was 5tonnes in 2002 6 tonnes in 2003 and 7 tonnes in 2004 It is expected that production
will increase to 15 tonnes by 2006 and 30 tonnes by 2007
Tilapia and catfish are usually farmed in ponds and tanks Rainbow trout wasintroduced in the rivers of the northern and southern highlands in the pre-colonialperiod The main purpose was to stock the rivers for fishing for sport In seaweedfarming farmers practice the fixed off-bottom method The raft method has also beentried on an experimental basis in the Tanga region
According to the Fisheries Division production of fresh water fish is estimated at152280 tonnes for tilapia valued at US$ 132763730 while the actual productionof rainbow trout was 7 tonnes in 2004 worth US$ 1830863 The production figure
for cat fish is not known The seaweeds are mainly for export and its production is1500 tonnes which earns US$ 209241 (1 US$ = 1147 TShs ie Tanzanian
832019 Unuftp Resaerch Paper 2007
httpslidepdfcomreaderfullunuftp-resaerch-paper-2007 930
Mallya
UNU-Fisheries Training Programme 9
Shillings) Efforts are also underway for cultivation of shrimp and other marine finfish and non finfish organisms (FAO 2006b)
The fish produced from aquaculture is consumed locally Only one farmer is known toexport farmed fish (rainbow trout) to a neighbouring country Seaweeds are exported
when dry to Denmark and the United States of America The seaweed exporters buydry seaweed from farmers and pack and export the product to the importing countriesThe price per kilogram varies with species and distance from Dar es Salaam and isapproximately between TShs 180 and 220 per dry weight kilogram of K cottonni while that of E spinosum and E striatum varies between TShs 80 and 100
Figure 1 The graph below shows total aquaculture production in Tanzania accordingto FAO statistics 2006b (redrawn with data from FAO Fishery Statistics AquacultureProduction)
The contribution of the aquaculture sector to national food security and economicdevelopment is still insignificant Annual farmed fish production is extrapolated at152280 tonnes This is about 0435 of the average annual fish landings which isaround 350000 tonnes The impact on poverty alleviation is therefore alsoinsignificant However the possibility of an adverse impact on the environment isminimised since it is still at substance level (FAO 2006b)
At present aquaculture is largely a subsistence activity practiced by poor householdsin the coastal and inland areas but the benefits arising from it are several itcontributes to peoplersquos requirements for animal protein particularly in the rural areas
where there are no capture fisheries and it provides employment opportunities and isa source of income However as capture fisheries are stagnating the future for theUnited Republic of Tanzania lies in aquaculture and it should be commercialised innature which calls for well researched information of better management practices of which water quality for any cultured species should be made available for success inaquaculture Among the most important water quality parameters oxygen plays a vital
role in affecting growth of any cultured species ie too little or too much of it may bedetrimental to the life of any cultured fish (Tanzania Fisheries Division 2006)
832019 Unuftp Resaerch Paper 2007
httpslidepdfcomreaderfullunuftp-resaerch-paper-2007 1030
Mallya
UNU-Fisheries Training Programme 10
14 Motivation
Currently Tanzania has one major hatchery located within the Fisheries Divisionwhich is responsible for all the production of fry and fingerlings of tilapia to supply
the farmers country-wide However trials are on going for the production of catfishfry and fingerlings and the Division is still registering high mortality rates of juvenilesbefore they are supplied out to the farmers The farmers are also facing fish stuntnessin their ponds caused by poor water quality management Water quality may be amajor factor in the high mortality rates and therefore hopefully the knowledgeobtained here can be used to monitor the water quality parameters to possibly solvethis problem (Tanzania Fisheries Division 2006)
15 Objective of the study
The main objective of the study was to gain knowledge of water quality management
for commercialised aquaculture
16 Goals of the study
To review the effects of oxygen on the growth and feed conversion of fish
To measure the effects of oxygen on the growth and feed conversion of AtlanticHalibut ( Hippoglossus hippoglossus)
17 Research questions
The main research questions to be answered were
Does oxygen saturation have any effect on the growth rate of fishAt which levels is the growth affected positivelyWhat is the effect of the oxygen saturation on the feed conversion ratio in fishAt which saturation level is the feed conversion ratio best
832019 Unuftp Resaerch Paper 2007
httpslidepdfcomreaderfullunuftp-resaerch-paper-2007 1130
Mallya
UNU-Fisheries Training Programme 11
2 LITERATURE REVIEW
21 Water quality in aquaculture
Water quality is the totality of physical biological and chemical parameters that affect
the growth and welfare of cultured organisms The success of a commercialaquaculture enterprise depends on providing the optimum environment for rapidgrowth at the minimum cost of resources and capital Water quality affects the generalcondition of cultured organism as it determines the health and growth conditions of cultured organism Quality of water is therefore an essential factor to be consideredwhen planning for high aquaculture production
Although the environment of aquaculture fish is a complex system consisting of several water quality variables only few of them play decisive role The criticalparameters are temperature suspended solids and concentrations of dissolved oxygenammonia nitrite carbon dioxide and alkalinity However dissolved oxygen is the
most important and critical parameter requiring continuous monitoring in aquacultureproduction systems This is due to fact that fish aerobic metabolism requires dissolvedoxygen (Timmons et al 2001)
22 Gas exchange and oxygen concentration in water
Oxygen as a gas has a low solubility in water In addition the amount of oxygencontained in water varies with temperature and salinity in a predictable manner Lessoxygen can be held in fully air-saturated warm sea water than fully air-saturated coldfreshwater While the oxygen content of the water sets the absolute availability of oxygen in the water it is the oxygen partial pressure gradient that determines howrapidly oxygen can move from the water into the fishrsquos blood to support its metabolic
rate This is because oxygen moves by diffusion across the gills of fish
According to Fickrsquos law of diffusion the rate of diffusion of oxygen across the gills is
determined by the gill area the diffusion distance across the gill epithelia thediffusion constant and the difference in partial pressure of oxygen across the gills(Crampton et al 2003) Consequently partial pressure of oxygen is the mostappropriate term for expressing oxygen levels in aquaculture water However oxygenconcentration is the more commonly used term and for a given temperature andsalinity the partial pressure of oxygen and oxygen content in water are linearly
related Another suitable method for expressing oxygen levels in aquaculture is airsaturation (often reduced to just saturation) which is directly proportional to thepartial pressure and is reported on most oxygen probes that have built in algorithmsfor temperature and salinity (Bergheim et al 2006) In this study saturation wasused
23 Oxygen uptake in and carbon dioxide release from the fish
During respiration fish like other animals take in oxygen and give out carbondioxide The process is done by using gills in almost all fish although some can alsouse the skin and some have lung like structures used in addition to gills When a fish
respires a pressurised gulp of water flows from the mouth into a gill chamber on eachside of the head Gills themselves located in gill clefts within the gill chambers
832019 Unuftp Resaerch Paper 2007
httpslidepdfcomreaderfullunuftp-resaerch-paper-2007 1230
Mallya
UNU-Fisheries Training Programme 12
consist of fleshy sheet like filaments transected by extensions called lamellae Aswater flows across the gills the oxygen within them diffuses into blood circulatingthrough vessels in the filaments and lamellae Simultaneously carbon dioxide in thefishrsquos bloodstream diffuses into the water and is carried out of the body (see Figure
1 below)
Figure 2 Diagram showing the structure for respiration (gas exchange) in fish(Source Microsoft Encarta1993-2002 wwwkwiccom 2008-02-08)
231 Function of fish gills
For most fish species gills work by a unidirectional flow of water over the epithelial
surface of the gill where the transfer of gases occurs (O2 in CO2 out) The reason forthis unidirectional flow of water is the energetic nature of the system The energy thatwould be required to move water into and out of a respiratory organ would be muchmore than that used to move air because water holds low oxygen due to its lowsolubility (Groot et al 1995)
The blood flowing just under the epithelial gill tissue usually moves in a countercurrent flow to that of the water moving over it This allows for most of the O 2 to betaken in by the blood because the diffusion gradient is kept high by the blood pickingup oxygen as it moves along but always coming into contact with water that has ahigher O2 content The blood receiving the O2 continues to pick up O2 as it moves
along because fresh water is being washed over the epithelial lining of the gills(Jobling 1995) By doing so the fish ventilate the gills while also taking in oxygenand releasing carbon dioxide (Groot et al 1995)
However there are two ways fish ventilate their gills buccalopercula pumping (activeventilation) and ram ventilation (passive ventilation) In buccalopercula ventilationthe fish pull in water through the mouth (buccal chamber) and push it over the gillsand out of the opercula chamber (where the gills are housed) At this time the pressurein the buccal chamber is kept higher than the pressure in the opercula chamber so asto allow the fresh water to be constantly flushed over the gills
In ram ventilation a fish swims with its mouth open allowing water to wash over thegills This method of ventilation is common to fast moving fish and it enables tuna to
832019 Unuftp Resaerch Paper 2007
httpslidepdfcomreaderfullunuftp-resaerch-paper-2007 1330
Mallya
UNU-Fisheries Training Programme 13
keep enough oxygen going to the gill surface while swimming at high speed (Boydand Tucker 1998) During this time the oxygen is absorbed into the blood whilecarbon dioxide diffuses out of the blood to the water
Groot et al (1995) have described the pathway taken by carbon dioxide and explain
that in the blood CO2 is transported in the form of bicarbonate The bicarbonatemoves from the blood by passing through the erythrocytes in which O2 binds toHaemoglobin (Hb) at the respiratory surface causing hydrogen ions (H+) to bereleased The increase in H+ ions combines with HCO3
- to form CO2 and OH- Thusmore CO2 is formed and can leave the blood across the respiratory surface Excess H+ binds to OH- forming water and allowing the pH to increase enough to promote thebinding of oxygen to Hb The release of O2 from Hb in the tissues makes the Hbavailable to bind to H+ promoting the conversion of CO2 to HCO3
- which helps drawCO2 from the tissues Therefore CO2 that is being transported into and out of the redblood cells minimises changes in pH in other parts of the body because of protonbinding and proton release from haemoglobin as it is deoxygenated and oxygenated
respectively However carbon dioxide is rarely a problem in when dissolved oxygenconcentrations are well above saturation levels Due to these processes oxygen levelshould be kept at or a little bit higher during the entire culture period
24 Effects of oxygen levels on oxygen uptake by fish
It is commonly thought that if there is not enough oxygen in the water then the fishwill be seen gasping at the surface but this is a last resort means to breathe The firstindication there may be a dissolved oxygen problem in the water is when the fishbecome unusually lethargic and stop feeding As oxygen levels decrease the fish donot have enough energy to swim and feeding utilises yet more oxygen Often it isrecognised the fish have a problem at this stage but frequently some form of medication is added to the water and this can actually cause the oxygen level to dropeven lower leading to a number of mortalities This can lead to the mistakenconclusion that the fish were suffering from some form of disease In terms of managing any aquatic system it is always advisable to increase the aeration when anyfish start to behave abnormally before adding any form of medication to the waterIncreasing the aeration will certainly make the environment more comfortable for thefish even if the dissolved oxygen level was already satisfactory With respect toimproving the aeration before adding medication this will allow for any depletion of the oxygen level caused through a chemical reaction with the medication
The recommended minimum dissolved oxygen requirements are as followsCold water fish - 6 mg per litre (70 saturation)Tropical freshwater fish- 5 mg per litre (80 saturation)Tropical marine fish- 5 mg per litre (75 saturation)
It is worth bearing in mind that these values are minimum requirements for healthygrowth tissue repair and reproduction (Svobodova et al 1993) Most fish species willtolerate a drop below these minimum values for a short period of time probably thecold water species are likely to tolerate a lower level than tropical fish However theperiod of time during which the oxygen level drops below the required minimum
level will cause the fish to become stressed It is this stress which causes fish death Itmay take the fish several days to recover from short term oxygen depletion but where
832019 Unuftp Resaerch Paper 2007
httpslidepdfcomreaderfullunuftp-resaerch-paper-2007 1430
Mallya
UNU-Fisheries Training Programme 14
the levels are persistently low an assortment of stress related diseases such as fin rotand white spot may occur
241 Fish response to hypoxia
Hypoxia or oxygen depletion is a phenomenon that occurs in aquatic environments asdissolved oxygen (DO molecular oxygen dissolved in water) becomes reduced inconcentration to a point detrimental to aquatic organisms living in the systemDissolved oxygen is typically expressed as a percentage of the oxygen that woulddissolve in the water at the prevailing temperature and salinity (both of which affectthe solubility of oxygen in water) An aquatic system lacking dissolved oxygen (0saturation) is termed anaerobic Reducing or anoxic is a system with a low DOconcentration in the range between 1 and 30 DO saturation is called hypoxic Mostfish cannot live below 30 DO saturation A ldquohealthyrdquo aquatic environment should
seldom experience DO of less than 80 In response to a low concentration of dissolved oxygen in the water the fish can respond in two ways the blood flow can
be increased by opening up further secondary lamellae to increase the effectiverespiratory area (it may be difficult to increase significantly the blood flow ratethrough the capillaries themselves) and the concentration of red blood corpuscles canbe increased to raise the oxygen carrying capacity of the blood per unit volume Thelatter can be achieved by reducing the blood plasma volume (eg by increasing theurine flow rate) in the short term and by releasing extra blood corpuscles from thespleen in the longer term (Svobodova et al 1993)
At the same time the ventilation rate is increased to bring more water into contactwith the gills within a unit of time There are however limits to the increased flowattainable the space between the secondary lamellae is narrow (in trout it is about 20μm) and water will tend to be forced past the tips of the primary lamellae when the
respiratory water flow is high thus by-passing the respiratory surfaces
These reactions are quite adequate to compensate for the normal fluctuations of energy demands of the fish and of dissolved oxygen concentrations in the water Oneof the consequences however of an increased ventilation rate is that there will be anincrease in the amount of toxic substances in the water reaching the gill surface wherethey can be absorbed (Boyd and Tucker 1998)
However oxygen deficiency causes asphyxiation and fish will die depending on the
oxygen requirements of the species and to a lesser extent on their rate of adaptationFish exposed to oxygen deficient water do not take food collect near the watersurface gasp for air (cyprinids) gather at the inflow to ponds where the oxygen levelsare higher become torpid fail to react to irritation lose their ability to escape captureand ultimately die The major pathological-anatomic changes include a very pale skincolour congestion of the cyanotic blood in the gills adherence of the gill lamellaeand small haemorrhages in the front of the ocular cavity and in the skin of the gillcovers In the majority of predatory fish the mouth gapes spasmodically and theoperculum over the gills remains loosely open (Svobodova et al 1993)
More than that fish reduce food intake leading to a reduction in growth
Reproduction is inhibited and both fertilisation success and larval survival arecompromised Energy utilisation is decreased associated with a shift from aerobic to
832019 Unuftp Resaerch Paper 2007
httpslidepdfcomreaderfullunuftp-resaerch-paper-2007 1530
Mallya
UNU-Fisheries Training Programme 15
anaerobic metabolism To reduce energy expenditure under this situation fish moveto water at lower temperature and reduce activity reproduction feeding and proteinsynthesis Transcription is reduced mediated by increased levels of hypoxia-inducingfactor 1 (HIF-1) which also up-regulates genes involved in erythropoiesis capillarygrowth and glucose transport All these responses are directed at maintaining cellular
oxygen homeostasis and reducing energy expenditure thereby augmenting survival of the animal during hypoxia In general the actions of toxicants are exacerbated duringhypoxia through a variety of mechanisms Some species are much more tolerant of hypoxia than others leading to differential survival during extended periods of hypoxia (Poon et al 2002) To avoid this aquaculture systems have to be suppliedwith enough oxygen saturation However too much oxygen is also harmful to fish
242 Fish response to hyperoxia
Hyperoxia is the state of water when it holds a very high amount of oxygen At thisstate water is described as having a dissolved oxygen saturation of greater than 100
This percent can be 140-300
At this water condition oxygen molecules will begin to move around within the watercolumn looking for a little elbowroom If there is non available it will return to theatmosphere or attach to the organisms around (Florida Lake Watch 2004)
If fish are exposed (at a lower atmospheric pressure) to such water their bloodequilibrates with the excess pressure in the water Bubbles form in the blood and thesecan block the capillaries in sub-acute cases the dorsal and caudal fin can be affectedand bubbles may be visible between the fin rays The epidermal tissue distal to theocclusions then becomes necrotic and cases are known where the dorsal fins of trouthave become completely eroded In severe cases death occurs rapidly as a result of blockage of the major arteries and large bubbles are clearly seen between the rays of all the fins The remedy is either to remove the fish to normally equilibrated water orto provide vigorous aeration to strip out the excess gas (Svobodova et al 1993) Insome species such as salmons and fast swimming fishes the swim bladder acts like anoxygen store to be used during the hypoxia When the gads level in the blood is highgases will diffuse from the blood to the bladder When the water is supersaturated(hyperoxia) the bladder becomes over-inflated and this leads to buoyancy problemsespecially in small fishes (Groot et al 1995)
25
Effects of oxygen level on growth and food conversion ratios of fish
Successful fish production depends on good oxygen management Oxygen is essentialto the survival (respiration) of fish to sustain healthy fish and bacteria whichdecompose the waste produced by the fish and to meet the biological oxygen demand(BOD) within culture system Dissolved oxygen levels can affect fish respiration aswell as ammonia and nitrite toxicity When the oxygen level is maintained nearsaturation or even at slightly super saturation at all times it will increase growth ratesreduce the food conversion ratio and increase overall fish production
832019 Unuftp Resaerch Paper 2007
httpslidepdfcomreaderfullunuftp-resaerch-paper-2007 1630
Mallya
UNU-Fisheries Training Programme 16
Figure 3 The effect of oxygen level on growth and food conversion ratios (Linde-gas2007)
251 Effect of oxygen on fish growth
Oxygen is important in respiration and metabolism processes in any animal In fishthe metabolic rate is highly affected by the concentration of oxygen in the rearingenvironment As the dissolved oxygen concentration decreases respiration andfeeding activities also decrease As a result the growth rate is reduced and the
possibility of a disease attack is increased However fish is not able to assimilate thefood consumed when DO is low (Tom 1998)
Overall health and physiological conditions are best if the dissolved oxygen is keptcloser to saturation When the levels are lower than those mentioned above thegrowth of the fish can be highly affected by an increase in stress tissue hypoxia and adecrease in swimming activities and reduction in immunity to diseases
However there is a need to maintain the level of dissolved oxygen at the saturationlevel which will not affect its physiological or metabolic activities so as to have highproduction in any culture system (Wedemeyer 1996) More than that one has to keep
in mind that the oxygen level requirement depends on the species but also on fish sizeand activity of the fish
According to Tom (1998) oxygen requirements per unit weight of fish significantlydecline with increasing individual weight In carp this reduction may be expressed bythe following ratios yearling = 1 two-year-old carp = 05 ndash 07 marketable carp = 03 ndash
04 Significant differences in oxygen demand are also found for different speciesUsing a coefficient of 1 to express the oxygen requirement of common carp thecomparative values for some other species are as follows trout 283 peled 220 pikeperch 176 roach 151 sturgeon 150 perch 146 bream 141 pike 110 eel 083 andtench 083
832019 Unuftp Resaerch Paper 2007
httpslidepdfcomreaderfullunuftp-resaerch-paper-2007 1730
Mallya
UNU-Fisheries Training Programme 17
Several studies have investigated the relationship between oxygen saturation and fishfood intake Randolph and Clemens (1976) found that feeding patterns of channelcatfish varied with temperature and oxygen availability When the oxygen contentdrops below 59 fish starts to lose its appetite Rainbow trout ( Oncorhynchus mykiss)reduced its appetite when oxygen saturation fell below approximately 60 (Jobling
1995) Similar results have been obtained from European sea bass ( Dicentrarchuslabrax L) (Thetmeyer et al 1999) blue tilapia (Oreochromis aureus) (Papoutsoglouand Tziha 1996) channel catfish ( Ictalurus punctatus ) (Buentello et al 2000) juvenileturbot (Pichavant et al 2001) and common carp (Cyprinus carpio L) showedreduced growth when exposed to low oxygen levels
252 Effect of oxygen on the food conversion ratio in fish
Tolerance for low oxygen may relate in part to the metabolic rate of a fish (Verheyen
and Decleir 1994) Fishes will regulate their metabolic rate over a range of dissolvedoxygen concentrations however at some point a further reduction in oxygen tensionwill produce a shift from a metabolic rate that is independent of oxygen concentrationto one that is dependent on oxygen level The point is referred to as the critical oxygentension (Ultsch et al 1978)
Decreased oxygen availability is also considered a major factor in determining foodintake Low dissolved oxygen is a type of stress frequently found in fish farmscharacterised by high fish densities and polluted fresh or marine waters The foodconversion ratio (FCR) is the amount of fish food consumed to generate a givenweight gain It is the ratio between the weights gained in a given period to the totalfeed intake by the fish in the same period It is the inverse of the feed intake The food
conversion ratio is improved (lowered) at higher growth rates (Markore and Rorvik 2001 Crampton et al 2003 Norgarden et al 2003)
The average FCR from several recent studies of fish growth is 097 In most cases theFCR appears to be slightly lower for tank studies (mean 093) than for net-penstudies (mean 102) The industrial average FCR values in Scotland and Chile were128 and 126 respectively (Neuman et al 2004) The best FCR in Scotland was 099while Chilersquos best came in at 11 Kreiberg and Brenton-Davie (1998) report an FCRof 099 for Atlantic salmon in a Sea Systems floating bag An experiment done ontilapia (Oreochromis niloticus) showed that FCR was inversely proportional to thedissolved oxygen level (145 at higher dissolved oxygen level and 675 at lower
dissolved oxygen level) (Tsadik and Kutty 1987)
Bromage et al (2000) showed that halibut are capable of achieving a 11 foodconversion ratio (FCR)
832019 Unuftp Resaerch Paper 2007
httpslidepdfcomreaderfullunuftp-resaerch-paper-2007 1830
Mallya
UNU-Fisheries Training Programme 18
2521 Tilapia (Oreochromis niloticus)
It is well known that tilapia can tolerate hypoxic and even anoxic conditions for shortperiods and are thus better suited than other species to hypereutectic conditions thatmay exist in static water aquaculture systems (Chorn et al 2006) It is also known that
fish found both in the tropics and temperate waters have incipient limiting oxygenlevels which may occur as in hypoxia Incipient limiting levels generally average at
73 mmHg (229 gl at 28 C for warm water fish and 90 mmgl at 617 mgl for coldwater fish such as the salmonids)
In reference to Oreochromis niloticus studies have shown that the incipient oxygenrequirements are between 139 mgl -292mgl
Studies done by Tsadik and Kutty (1987) on the influence of ambient oxygen onfeeding and growth in O niloticus showed that experiments under the various oxygenregimes varied as shown in Figures 3 and 4 below
The increase in mean weight of individual fish during the course of the growth testsfor the high medium and low levels of DO is shown in Figure 3 The fastest rate of growth was at high DO and the slowest growth in the low DO
Figure 4 shows the changes in mean weight of fish under the two tests at high DO andthe two tests at fluctuating DO It is obvious that the difference in the conditions of the two tests at high DO (demand feeder and manual feeding) or at low DO (fish fedwith demand feeder and no supplementary feed) has not made any serious differencein the growth within the sets but the difference in growth of high DO tests andfluctuating DO tests were marked
832019 Unuftp Resaerch Paper 2007
httpslidepdfcomreaderfullunuftp-resaerch-paper-2007 1930
Mallya
UNU-Fisheries Training Programme 19
Figure 4 Weight increase of O niloticus grown under high ambient oxygen (near airsaturation) and under simulated conditions of diel flux in oxygen Data from 2separate sets of experiments (A and B) are indicated Curves drawn through meanvalues (plusmn SD n = 8) indicated (see test) (Source Tsadik and Kutty 1987)
Figure 5 Increase in weight of O niloticus grown under high (near air saturation)medium and low ambient oxygen Mean values (plusmn SD n = 8) are indicated (SourceTsadik and Kutty 1987)
832019 Unuftp Resaerch Paper 2007
httpslidepdfcomreaderfullunuftp-resaerch-paper-2007 2030
Mallya
UNU-Fisheries Training Programme 20
2522 Cat fish culture (Clarias gariepinus) water quality requirements
More than 100 species of the genus Clarias have been described all over the world InTanzania the family Clariidae has only one native species the African catfish Clarias
gariepinus (Burchell 1822) (Synonyms Clarias lazera and Clarias mossambicus)
have recently been introduced in this country
Table 1 Water quality requirements of African catfish
Eggs larvaeearly fry
Advanced fry(Tolerance)
Fingerlingsadults
O280 ndash 100saturation
3 ndash 5 ppm gt3 ppm
Temperature opt 30degC opt 30degC opt 26 ndash 28degC
NH3-N 01 ppm (10 ppm)
NO2-N 05 ppm
NO3-N 100 ppm
Ph 6 ndash 9
CO2-C 6 ppm (10 ndash 15 ppm)
Salinity
10 ppt (15 ndash 16 ppt)
(Source FAO repository paper 2006b)
2523 Oxygen deficiency
African catfish has lung like structures that enable them to breathe air This made itpossible to survive very low oxygen levels in the pond However when Africancatfish is under mixed or polyculture oxygen level is important for the species mixedwith in the pond
832019 Unuftp Resaerch Paper 2007
httpslidepdfcomreaderfullunuftp-resaerch-paper-2007 2130
Mallya
UNU-Fisheries Training Programme 21
3 MATERIALS AND METHODS
31 Study area
The study was conducted at Verid the Holar University College research centre in
Saudarkrokur in January and February 2008
32 Experimental fish
Juvenile halibut was obtained from Frisky hatchery in Akureyri Iceland The fish weretransported from Akureyri to Verid in a tank while oxygen saturation was maintainedat 400 and temperature at 5ordmC The fish were then acclimatised for two weeks under995-106 oxygen saturation and 18pp salinity and 85-10ordmC temperature
At the start of the third week the fish were starved for two days before they wereindividually measured to obtain the initial weight During the measurement the fish
were anasethised using Tricaine methane sulfonate (TMS) used in the ratio of 40-50mg per litre of water 150 fish were individually tagged intraperitoneally with TrovanPassive Transponder tags In total 300 fish were individually tagged The fish werethen distributed into 12 tanks (Figure 2) each with 25 tagged and 25 not tagged fish
33 Experimental design
The fish were exposed to five different levels of oxygen saturation The targetsaturation value in each group was 60 80 100 120 and 140
The system consists of 12 culture tanks three reservoir tanks three aerators which arecombined with low head oxygenator (LHO) and three pumps (Figure 6)
The fish were reared in 7 m3 fibre glass tanks Water was delivered to the tank through PVC pipe and water flow can be adjusted by the valve (See Appendix 1) Thewater level in the tanks was adjusted by varying the height of external stand pipesThe culture tank has a central drainage system at the bottom through which waterflows out to the reservoir tank The water flows from the central drainage passesthrough the wire mesh where the remaining feed pellets were collected and then thewater goes through the PVC pipe back to the reservoir tank
The reservoir tanks are about 460 litres and are made of high density polyethylene(HDPE) From the reservoir tank water from the culture tank mixes with the freshwater from the inlet and is then pumped to the aerator which is combined with a low-head oxygenator (LHO) A pinnacle 75 pump with 055 kWh is plumbed one to eachreservoir tank The pump delivers the water to the aerator from the reservoir tank (Figure 6) The aerator and low head oxygenator (LHO) is a single unit The aeratoradds oxygen to the water and removes carbon dioxide while the LHO adds moreoxygen to the water inside the aerator A fan draws air through the aerator countercurrent to the direction of the water flow in the proportions of 1 volume water to 10volumes air Then the water flows through the LHO column where oxygen gaselevates the oxygen saturation of the water The system can elevate the oxygen
saturation to over 120 air saturation
832019 Unuftp Resaerch Paper 2007
httpslidepdfcomreaderfullunuftp-resaerch-paper-2007 2230
Mallya
UNU-Fisheries Training Programme 22
331 Oxygen levels in the system
In total there were 12 tanks in the system used The target oxygen saturation was60 80 100 120 and 140 (Figure 6) The oxygen saturation in the tanks wasregulated as follows
The system consisted of three tank rows each with four fish tanks (Figure 6) Thefirst row had 60 and 80 oxygen saturation The saturation levels were obtained byinjecting nitrogen gas to the LHO which supplies water to the four tanks to reduce thesaturation from 100 to 60 saturation The nitrogen gas was added from a gas tank through a hose connected to the LHO The amount of the gas injected was regulatedfrom the nitrogen gas tank However in addition to the nitrogen gas oxygen gas wasadded directly to two of the fish tanks in the row to raise the saturation level to 80
The oxygen saturation in the fish tanks in the second row was set at 100-106saturation by injecting oxygen into the LHO
In the third row the oxygen saturation of water from the LHO was increased to 120through injection of oxygen Furthermore oxygen gas was added directly to two tanksto raise the saturation level to 140
The oxygen gas was added through a hose from the oxygen tanks the tail of the hosewas connected to the gas tank while the head was connected to the rectangular wooddiffuser The piece of wood was used to make very small fine air bubbles of oxygengas The small air bubbles are known to increase oxygen transfer by increasing thesurface area for oxygen diffusion Oxygen saturation was measured using (YSI 550)probe while salinity was measured using PAL made in Japan pocket refract meter
832019 Unuftp Resaerch Paper 2007
httpslidepdfcomreaderfullunuftp-resaerch-paper-2007 2330
Mallya
UNU-Fisheries Training Programme 23
Figure 6 The arrangement of the tank system used in the experiment showing theoxygen saturation levels inlet and outlet pipes water pumps food collector plates andaerators
Legend
A= Aerator and Low-head oxygenator
= Reservoir tanks
= Outlets
=Inlets
=Water pump
=Pellet collector plate
=Direction of water
832019 Unuftp Resaerch Paper 2007
httpslidepdfcomreaderfullunuftp-resaerch-paper-2007 2430
Mallya
UNU-Fisheries Training Programme 24
34 Sampling and measurements
The body mass and growth performance were measured every two weeks whileoxygen saturation temperature and salinity were recorded daily
341 Specific growth rate
Weight measurements were taken every two weeks to obtain the specific growth rate(SGR) Prior to measuring the fish were starved for two days Both the individualtagged and untagged fish were weighed Both the initial weight and final weight of the fish were used to calculate the growth performance in terms of SGR
The SGR of individually tagged fish was calculated as follows
SGR = [(ln w 2-ln w 1) (t 2-t 1)] 100
Where w1 and w2 are the initial and final weights of the fish at times t 1 and t 2 respectively
342 Feeding and the collection of leftover feed
The fish were fed manually commercial (Laxa Feed Mill Akureyri) feed pellets (25mm) four times each day Following feeding the remaining pellets were collectedfrom a feed trap on the outflow from each tank and counted The average weight of asample of 100 fresh pellets was 00148 g and based on that it was possible to calculatethe original weight of the remaining pellets (Fr) before they were soaked in water
343 Feed conversion ratio (FCR)
The total amount of feed consumed (CT) was calculated as
CT = Amount of feed fed ndash (number of uneaten pellets x mean weight of pellet)
Feed conversion rate (FCR) indicates how much feed is required for each unit gain inweight
FCR = CT increase in body mass during the same time
832019 Unuftp Resaerch Paper 2007
httpslidepdfcomreaderfullunuftp-resaerch-paper-2007 2530
Mallya
UNU-Fisheries Training Programme 25
4 RESULTS
41 Growth
There was no significant difference in growth rate of the Atlantic halibut reared at
different oxygen saturation levels (Figure 7) during the first period (SGR1) Howeverthere was a significant difference (plt002) in the growth rate of the fish during thesecond period (SGR2) Then the SGR of fish reared at 100 saturation wassignificantly higher than that of fish reared at either 60 or 140 saturation
Figure 7 The graph showing the specific growth rate (SGR) of Atlantic halibut rearedat different oxygen saturation levels
42 Feed conversion ratio (FCR)
There was no significant difference in FCR of fish reared at different oxygen
saturation levels (Figure 8) However the FCR was lowest at 100 and 120saturation
832019 Unuftp Resaerch Paper 2007
httpslidepdfcomreaderfullunuftp-resaerch-paper-2007 2630
Mallya
UNU-Fisheries Training Programme 26
Figure 8 The feed conversion ratios (FCR) of Atlantic halibut reared at differentoxygen saturation levels
5 DISCUSSION
The results of the experiment under different oxygen levels clearly showed thatgrowth is affected by the level of oxygen saturation During the second period theSGR was highest at 100 saturation The best FCR was obtained in the groups withthe highest growth rate although there was no significant difference in FCR of fish
reared at different oxygen saturation levels The growth of other species of fish is alsoaffected by oxygen saturation such as tilapia (Tsadik and Kutty 1987) and Atlanticsalmon (Crampton et al 2003 Seymour et al 1992 Forsberg and Bergheim 1996)The growth of Atlantic halibut and Atlantic salmon increases with increasingsaturation up to 100 saturation However these species appear to be more sensitiveto oxygen saturation than tilapia
6 CONCLUSIONS
The results suggest that oxygen saturation levels affect both growth performance andfeed conversion ratios of Atlantic halibut The maximum growth rate and lowest feedconversion ratio in Atlantic halibut can be attended at higher oxygen saturation levelsbetween 90 and 120 However more research is needed in order to know at whichsaturation point the growth is maximised
Regarding future experimental work the results of this trial should be reconfirmed andgiven more time so that more observations can be made The actual oxygen saturationpoint at which Atlantic halibut has maximum growth should be identified hence moreexperimentation is needed
832019 Unuftp Resaerch Paper 2007
httpslidepdfcomreaderfullunuftp-resaerch-paper-2007 2730
Mallya
UNU-Fisheries Training Programme 27
ACKNOWLEDGEMENTS
I would like to express my gratitude to all the people who were involved and havemade the culmination of this project possible for their kind help
To my supervisor Prof Helgi Thorarensen from Holar University College for hisvaluable guidance and advice I would also like to thank the technical staff atSaudarkrokur Holar University College for giving me the opportunity to use theirinstallations and equipments also for their assistance during the experimental periodI am also grateful to Arnthor Gustavsson and Ingolfur Arnarson from HolarUniversity for their help in the experimental design and weighing the fish which Icould not have managed alone
I am indebted to Dr Tumi Tomasson Director of the UNU-FTP and Mr ThorAsgeirsson Deputy Director and Sigridur Kr Ingvarsdottir for their valuable
assistance care and guidance before and during the project
I would also like to thank my UNU fellows in the aquaculture speciality whoseencouragement enabled me to do the work even when I felt like giving up
I would like to thank my Director Mr Geoffrey Nanyaro at the Tanzanian FisheriesDivision for having given me leave which made it possible to accomplish this study
Last but not least to my family for their great concern and love all the time that Ispent here in Iceland Special thanks are given to my lovely husband for his loveencouragement and concern during the time I was away from home
832019 Unuftp Resaerch Paper 2007
httpslidepdfcomreaderfullunuftp-resaerch-paper-2007 2830
Mallya
UNU-Fisheries Training Programme 28
LIST OF REFERENCES
Balarin JD 1985 National reviews for aquaculture development in Africa 10Uganda FAO FishCirc (77010)109p
Bergheim A Martin G Anders N Per M Holland Per Krogedal and Viv Crampton2005 A newly developed oxygen injection system for cage farms AquaculturalEngineering 34(2006) 40-46
Bjornsson B and Tryggvadottir SV 1996 Effects of size on optimal temperature forgrowth and growth efficiency of immature Atlantic halibut (Hippoglossushippoglossus L) Aquaculture 142 33-42
Boyd CE and Tucker CS 1998 Pond Aquaculture Water Quality Management Kluwer Academic Publishers Boston MA (1998) 700 pp
Bromage N Mazorra C Bruce M Brown N and Shields R 2000 Halibutculture In Stickney RR Editor 2000 Encyclopedia of Aquaculture Wiley NewYork pp 425 ndash 432
Buentello JA Gatlin III DM Neill WH 2000 Effects of water temperature anddissolved oxygen on daily feed consumption feed utilization and growth of channelcatfish (Ictalurus punctatus) Aquaculture 182 339 ndash 352
Chorn E Lim et al 2006 Feeding Practices The Hawthorn Press 547-559
Crampton V A Bergheim M Gausen A Naeligss and P M Hoslashlland (2003) Effect of
low Oxygen on fish performance (wwwewoscom)
FAO 2006a State of world fisheries and Aquaculture FAO report 2006
FAO 2006b Aquaculture Production in Tanzania FAO Fishery StatisticsAquaculture production 2006)
Fisheries Division Tanzania 2007Status of Aquaculture in Tanzania
Florida Lake watch 2004The beginners guide for water management oxygen andtemperature Department of Fisheries and Aquatic Sciences Institute of Food andAgricultural sciences University of Florida Fist edition
Forsberg OI and Bergheim A 1996 The impact of constant and fluctuating oxygenconcentrations and two water consumption rates on post-smolt Atlantic salmonproduction parameters Aquacult Eng 15 (1996) pp 327 ndash 347
Groot C Margolis L and WC Clarke 1995 Physiology Ecology of pacific salmonDepartment of Fisheries and oceans Biological sciences Branch Pacific biologicalstation Nanaimo British Columbia Canada
832019 Unuftp Resaerch Paper 2007
httpslidepdfcomreaderfullunuftp-resaerch-paper-2007 2930
Mallya
UNU-Fisheries Training Programme 29
Groot C Margolis L and Clarke1995 Physiological Ecology of Pacific Salmon Department of Fisheries and oceans Biological sciences Branch Pacific biologicalstation Nanaimo British Columbia Canada
Jobling M 1995 Environmental biology of fishes Chapman and Hall Fish and
fisheries series 16
Kreiberg H Brenton-Davie V 1998 Seawater growth of Atlantic salmon in SEASystemsTM floating bag Aquaculture Update 81 1-2
Linde ndash gas 2007 httpwwwlindegascom [Dec 2006]
Microsoft Encarta1993-2002 wwwkwiccom Respiration in fishes Microsoft incartacopyright 1993-2002 Microsoft Corporation
Morkore T and Rorvik K-A 2001 Seasonal variations in growth feed utilisation
and product quality of farmed Atlantic salmon (Salmo salar L) transferred to seawater as 0+ smolts or 1+ smolts Aquaculture 199 145 ndash 158
Moyle B P and Cech JJJr 2000 Fishes an introduction to Ichthyology Fourth
edition Upper Saddle River NJ 07458
Neuman J Weir M Beattie C 2004 Skretting in the UK and Chile An
opportunity for comparison Skretting Outlook 21 8-11
Nordgarden U Oppedal F Taranger GL Hemre G-I and Hansen T 2003Seasonally changing metabolism in Atlantic salmon (Salmo salar L) Aquac Nutr 9287-289
Papoutsoglou SE and Tziha G 1996 Blue tilapia (Oreochromis aureus) growth ratein relation to dissolved oxygen concentration under recirculated water conditionsAquacultural Engineering 15 181-192
Poon WL CY Hung and DJ Randall 2002 The effect of aquatic hypoxia on fish
Department of Biology and Chemistry City University of Hong Kong KowloonHong Kong SAR China EPA600R-02097
Pichavant K Person-Le-Ruyet J Le Bayou N Severe A Le Roux A andBcouf G 2001 Comparative effects of long-term hypoxia on growth feeding andoxygen consumption in juvenile turbot and European sea bass J Fish Biol 59 875-883 doi10 1111j1095-86492001tb00158x
Randolph KN and HP Clemens 1976 Some factors influencing the feedingbehaviour of channel catfish in culture ponds Transactions of American FisheriesSociety 105 718724
Seymour et al 1992 EA Seymour OI Forsberg and JP Aabel The effect of arious stocking densities low water use and two oxygen levels on production
parameters of adult Atlantic salmon (Salmo salar L) in land-based tanks Report fromRogaland Research RF-19392 (1992) p 36
832019 Unuftp Resaerch Paper 2007
httpslidepdfcomreaderfullunuftp-resaerch-paper-2007 3030
Mallya
Svobodova Z Richard L Jana M and Blanka V 1993 Water quality and fish health EIFAC Technical paper 54
Tanzania Fisheries Division aquaculture section 2006 Aquaculture in Tanzania
Ministry of Natural resources and Tourism Fisheries Division
Timmons MB James ME Fred WW Sreven TS and Brian J V Recirculating
Aquaculture Systems NRAC publication No01-002
Thetmeyer H Waller UBlack KD Inselmann S Rosenthal H 1999 Growth of European sea bass (Dicentrarchus labrax L) under hypoxic and oscillating oxygenconditions Aquaculture 174 355-367
Tom L1998 Nutritional and feeding of fish Kluwer Academic Publishers Secondedition
Tsadik Gagma MN Kutty 1987 Influence of ambient oxygen on feeding and growth
of tilapia Oreochromis niloticus ARAC87WP10United Nation DevelopmentProgramme Food and Agriculture Organization of the United Nations Nigerianinstitute for oceanography and marine research project RAF87009
Ultsch GR H Boschung and MJRoss 1978 Metabolism critical oxygen tensionand habitat selection in darters (Etheostoma) Ecology 5999-107
Verheyen ER Bluse and W Decleir 1994 Metabolic rate hypoxia tolereance andaquatic surface respiration of some lacustrine and riverine African cichlid fishes(Pisces Cichlidae) Comp Biochem Physiol 107A403-411
Wedemeyer GA 1996 Interactions with Water Quality Conditions in Physiology of Fish in Intensive Culture Systems Chapman and Hall New York New York 1996
832019 Unuftp Resaerch Paper 2007
httpslidepdfcomreaderfullunuftp-resaerch-paper-2007 1130
Mallya
UNU-Fisheries Training Programme 11
2 LITERATURE REVIEW
21 Water quality in aquaculture
Water quality is the totality of physical biological and chemical parameters that affect
the growth and welfare of cultured organisms The success of a commercialaquaculture enterprise depends on providing the optimum environment for rapidgrowth at the minimum cost of resources and capital Water quality affects the generalcondition of cultured organism as it determines the health and growth conditions of cultured organism Quality of water is therefore an essential factor to be consideredwhen planning for high aquaculture production
Although the environment of aquaculture fish is a complex system consisting of several water quality variables only few of them play decisive role The criticalparameters are temperature suspended solids and concentrations of dissolved oxygenammonia nitrite carbon dioxide and alkalinity However dissolved oxygen is the
most important and critical parameter requiring continuous monitoring in aquacultureproduction systems This is due to fact that fish aerobic metabolism requires dissolvedoxygen (Timmons et al 2001)
22 Gas exchange and oxygen concentration in water
Oxygen as a gas has a low solubility in water In addition the amount of oxygencontained in water varies with temperature and salinity in a predictable manner Lessoxygen can be held in fully air-saturated warm sea water than fully air-saturated coldfreshwater While the oxygen content of the water sets the absolute availability of oxygen in the water it is the oxygen partial pressure gradient that determines howrapidly oxygen can move from the water into the fishrsquos blood to support its metabolic
rate This is because oxygen moves by diffusion across the gills of fish
According to Fickrsquos law of diffusion the rate of diffusion of oxygen across the gills is
determined by the gill area the diffusion distance across the gill epithelia thediffusion constant and the difference in partial pressure of oxygen across the gills(Crampton et al 2003) Consequently partial pressure of oxygen is the mostappropriate term for expressing oxygen levels in aquaculture water However oxygenconcentration is the more commonly used term and for a given temperature andsalinity the partial pressure of oxygen and oxygen content in water are linearly
related Another suitable method for expressing oxygen levels in aquaculture is airsaturation (often reduced to just saturation) which is directly proportional to thepartial pressure and is reported on most oxygen probes that have built in algorithmsfor temperature and salinity (Bergheim et al 2006) In this study saturation wasused
23 Oxygen uptake in and carbon dioxide release from the fish
During respiration fish like other animals take in oxygen and give out carbondioxide The process is done by using gills in almost all fish although some can alsouse the skin and some have lung like structures used in addition to gills When a fish
respires a pressurised gulp of water flows from the mouth into a gill chamber on eachside of the head Gills themselves located in gill clefts within the gill chambers
832019 Unuftp Resaerch Paper 2007
httpslidepdfcomreaderfullunuftp-resaerch-paper-2007 1230
Mallya
UNU-Fisheries Training Programme 12
consist of fleshy sheet like filaments transected by extensions called lamellae Aswater flows across the gills the oxygen within them diffuses into blood circulatingthrough vessels in the filaments and lamellae Simultaneously carbon dioxide in thefishrsquos bloodstream diffuses into the water and is carried out of the body (see Figure
1 below)
Figure 2 Diagram showing the structure for respiration (gas exchange) in fish(Source Microsoft Encarta1993-2002 wwwkwiccom 2008-02-08)
231 Function of fish gills
For most fish species gills work by a unidirectional flow of water over the epithelial
surface of the gill where the transfer of gases occurs (O2 in CO2 out) The reason forthis unidirectional flow of water is the energetic nature of the system The energy thatwould be required to move water into and out of a respiratory organ would be muchmore than that used to move air because water holds low oxygen due to its lowsolubility (Groot et al 1995)
The blood flowing just under the epithelial gill tissue usually moves in a countercurrent flow to that of the water moving over it This allows for most of the O 2 to betaken in by the blood because the diffusion gradient is kept high by the blood pickingup oxygen as it moves along but always coming into contact with water that has ahigher O2 content The blood receiving the O2 continues to pick up O2 as it moves
along because fresh water is being washed over the epithelial lining of the gills(Jobling 1995) By doing so the fish ventilate the gills while also taking in oxygenand releasing carbon dioxide (Groot et al 1995)
However there are two ways fish ventilate their gills buccalopercula pumping (activeventilation) and ram ventilation (passive ventilation) In buccalopercula ventilationthe fish pull in water through the mouth (buccal chamber) and push it over the gillsand out of the opercula chamber (where the gills are housed) At this time the pressurein the buccal chamber is kept higher than the pressure in the opercula chamber so asto allow the fresh water to be constantly flushed over the gills
In ram ventilation a fish swims with its mouth open allowing water to wash over thegills This method of ventilation is common to fast moving fish and it enables tuna to
832019 Unuftp Resaerch Paper 2007
httpslidepdfcomreaderfullunuftp-resaerch-paper-2007 1330
Mallya
UNU-Fisheries Training Programme 13
keep enough oxygen going to the gill surface while swimming at high speed (Boydand Tucker 1998) During this time the oxygen is absorbed into the blood whilecarbon dioxide diffuses out of the blood to the water
Groot et al (1995) have described the pathway taken by carbon dioxide and explain
that in the blood CO2 is transported in the form of bicarbonate The bicarbonatemoves from the blood by passing through the erythrocytes in which O2 binds toHaemoglobin (Hb) at the respiratory surface causing hydrogen ions (H+) to bereleased The increase in H+ ions combines with HCO3
- to form CO2 and OH- Thusmore CO2 is formed and can leave the blood across the respiratory surface Excess H+ binds to OH- forming water and allowing the pH to increase enough to promote thebinding of oxygen to Hb The release of O2 from Hb in the tissues makes the Hbavailable to bind to H+ promoting the conversion of CO2 to HCO3
- which helps drawCO2 from the tissues Therefore CO2 that is being transported into and out of the redblood cells minimises changes in pH in other parts of the body because of protonbinding and proton release from haemoglobin as it is deoxygenated and oxygenated
respectively However carbon dioxide is rarely a problem in when dissolved oxygenconcentrations are well above saturation levels Due to these processes oxygen levelshould be kept at or a little bit higher during the entire culture period
24 Effects of oxygen levels on oxygen uptake by fish
It is commonly thought that if there is not enough oxygen in the water then the fishwill be seen gasping at the surface but this is a last resort means to breathe The firstindication there may be a dissolved oxygen problem in the water is when the fishbecome unusually lethargic and stop feeding As oxygen levels decrease the fish donot have enough energy to swim and feeding utilises yet more oxygen Often it isrecognised the fish have a problem at this stage but frequently some form of medication is added to the water and this can actually cause the oxygen level to dropeven lower leading to a number of mortalities This can lead to the mistakenconclusion that the fish were suffering from some form of disease In terms of managing any aquatic system it is always advisable to increase the aeration when anyfish start to behave abnormally before adding any form of medication to the waterIncreasing the aeration will certainly make the environment more comfortable for thefish even if the dissolved oxygen level was already satisfactory With respect toimproving the aeration before adding medication this will allow for any depletion of the oxygen level caused through a chemical reaction with the medication
The recommended minimum dissolved oxygen requirements are as followsCold water fish - 6 mg per litre (70 saturation)Tropical freshwater fish- 5 mg per litre (80 saturation)Tropical marine fish- 5 mg per litre (75 saturation)
It is worth bearing in mind that these values are minimum requirements for healthygrowth tissue repair and reproduction (Svobodova et al 1993) Most fish species willtolerate a drop below these minimum values for a short period of time probably thecold water species are likely to tolerate a lower level than tropical fish However theperiod of time during which the oxygen level drops below the required minimum
level will cause the fish to become stressed It is this stress which causes fish death Itmay take the fish several days to recover from short term oxygen depletion but where
832019 Unuftp Resaerch Paper 2007
httpslidepdfcomreaderfullunuftp-resaerch-paper-2007 1430
Mallya
UNU-Fisheries Training Programme 14
the levels are persistently low an assortment of stress related diseases such as fin rotand white spot may occur
241 Fish response to hypoxia
Hypoxia or oxygen depletion is a phenomenon that occurs in aquatic environments asdissolved oxygen (DO molecular oxygen dissolved in water) becomes reduced inconcentration to a point detrimental to aquatic organisms living in the systemDissolved oxygen is typically expressed as a percentage of the oxygen that woulddissolve in the water at the prevailing temperature and salinity (both of which affectthe solubility of oxygen in water) An aquatic system lacking dissolved oxygen (0saturation) is termed anaerobic Reducing or anoxic is a system with a low DOconcentration in the range between 1 and 30 DO saturation is called hypoxic Mostfish cannot live below 30 DO saturation A ldquohealthyrdquo aquatic environment should
seldom experience DO of less than 80 In response to a low concentration of dissolved oxygen in the water the fish can respond in two ways the blood flow can
be increased by opening up further secondary lamellae to increase the effectiverespiratory area (it may be difficult to increase significantly the blood flow ratethrough the capillaries themselves) and the concentration of red blood corpuscles canbe increased to raise the oxygen carrying capacity of the blood per unit volume Thelatter can be achieved by reducing the blood plasma volume (eg by increasing theurine flow rate) in the short term and by releasing extra blood corpuscles from thespleen in the longer term (Svobodova et al 1993)
At the same time the ventilation rate is increased to bring more water into contactwith the gills within a unit of time There are however limits to the increased flowattainable the space between the secondary lamellae is narrow (in trout it is about 20μm) and water will tend to be forced past the tips of the primary lamellae when the
respiratory water flow is high thus by-passing the respiratory surfaces
These reactions are quite adequate to compensate for the normal fluctuations of energy demands of the fish and of dissolved oxygen concentrations in the water Oneof the consequences however of an increased ventilation rate is that there will be anincrease in the amount of toxic substances in the water reaching the gill surface wherethey can be absorbed (Boyd and Tucker 1998)
However oxygen deficiency causes asphyxiation and fish will die depending on the
oxygen requirements of the species and to a lesser extent on their rate of adaptationFish exposed to oxygen deficient water do not take food collect near the watersurface gasp for air (cyprinids) gather at the inflow to ponds where the oxygen levelsare higher become torpid fail to react to irritation lose their ability to escape captureand ultimately die The major pathological-anatomic changes include a very pale skincolour congestion of the cyanotic blood in the gills adherence of the gill lamellaeand small haemorrhages in the front of the ocular cavity and in the skin of the gillcovers In the majority of predatory fish the mouth gapes spasmodically and theoperculum over the gills remains loosely open (Svobodova et al 1993)
More than that fish reduce food intake leading to a reduction in growth
Reproduction is inhibited and both fertilisation success and larval survival arecompromised Energy utilisation is decreased associated with a shift from aerobic to
832019 Unuftp Resaerch Paper 2007
httpslidepdfcomreaderfullunuftp-resaerch-paper-2007 1530
Mallya
UNU-Fisheries Training Programme 15
anaerobic metabolism To reduce energy expenditure under this situation fish moveto water at lower temperature and reduce activity reproduction feeding and proteinsynthesis Transcription is reduced mediated by increased levels of hypoxia-inducingfactor 1 (HIF-1) which also up-regulates genes involved in erythropoiesis capillarygrowth and glucose transport All these responses are directed at maintaining cellular
oxygen homeostasis and reducing energy expenditure thereby augmenting survival of the animal during hypoxia In general the actions of toxicants are exacerbated duringhypoxia through a variety of mechanisms Some species are much more tolerant of hypoxia than others leading to differential survival during extended periods of hypoxia (Poon et al 2002) To avoid this aquaculture systems have to be suppliedwith enough oxygen saturation However too much oxygen is also harmful to fish
242 Fish response to hyperoxia
Hyperoxia is the state of water when it holds a very high amount of oxygen At thisstate water is described as having a dissolved oxygen saturation of greater than 100
This percent can be 140-300
At this water condition oxygen molecules will begin to move around within the watercolumn looking for a little elbowroom If there is non available it will return to theatmosphere or attach to the organisms around (Florida Lake Watch 2004)
If fish are exposed (at a lower atmospheric pressure) to such water their bloodequilibrates with the excess pressure in the water Bubbles form in the blood and thesecan block the capillaries in sub-acute cases the dorsal and caudal fin can be affectedand bubbles may be visible between the fin rays The epidermal tissue distal to theocclusions then becomes necrotic and cases are known where the dorsal fins of trouthave become completely eroded In severe cases death occurs rapidly as a result of blockage of the major arteries and large bubbles are clearly seen between the rays of all the fins The remedy is either to remove the fish to normally equilibrated water orto provide vigorous aeration to strip out the excess gas (Svobodova et al 1993) Insome species such as salmons and fast swimming fishes the swim bladder acts like anoxygen store to be used during the hypoxia When the gads level in the blood is highgases will diffuse from the blood to the bladder When the water is supersaturated(hyperoxia) the bladder becomes over-inflated and this leads to buoyancy problemsespecially in small fishes (Groot et al 1995)
25
Effects of oxygen level on growth and food conversion ratios of fish
Successful fish production depends on good oxygen management Oxygen is essentialto the survival (respiration) of fish to sustain healthy fish and bacteria whichdecompose the waste produced by the fish and to meet the biological oxygen demand(BOD) within culture system Dissolved oxygen levels can affect fish respiration aswell as ammonia and nitrite toxicity When the oxygen level is maintained nearsaturation or even at slightly super saturation at all times it will increase growth ratesreduce the food conversion ratio and increase overall fish production
832019 Unuftp Resaerch Paper 2007
httpslidepdfcomreaderfullunuftp-resaerch-paper-2007 1630
Mallya
UNU-Fisheries Training Programme 16
Figure 3 The effect of oxygen level on growth and food conversion ratios (Linde-gas2007)
251 Effect of oxygen on fish growth
Oxygen is important in respiration and metabolism processes in any animal In fishthe metabolic rate is highly affected by the concentration of oxygen in the rearingenvironment As the dissolved oxygen concentration decreases respiration andfeeding activities also decrease As a result the growth rate is reduced and the
possibility of a disease attack is increased However fish is not able to assimilate thefood consumed when DO is low (Tom 1998)
Overall health and physiological conditions are best if the dissolved oxygen is keptcloser to saturation When the levels are lower than those mentioned above thegrowth of the fish can be highly affected by an increase in stress tissue hypoxia and adecrease in swimming activities and reduction in immunity to diseases
However there is a need to maintain the level of dissolved oxygen at the saturationlevel which will not affect its physiological or metabolic activities so as to have highproduction in any culture system (Wedemeyer 1996) More than that one has to keep
in mind that the oxygen level requirement depends on the species but also on fish sizeand activity of the fish
According to Tom (1998) oxygen requirements per unit weight of fish significantlydecline with increasing individual weight In carp this reduction may be expressed bythe following ratios yearling = 1 two-year-old carp = 05 ndash 07 marketable carp = 03 ndash
04 Significant differences in oxygen demand are also found for different speciesUsing a coefficient of 1 to express the oxygen requirement of common carp thecomparative values for some other species are as follows trout 283 peled 220 pikeperch 176 roach 151 sturgeon 150 perch 146 bream 141 pike 110 eel 083 andtench 083
832019 Unuftp Resaerch Paper 2007
httpslidepdfcomreaderfullunuftp-resaerch-paper-2007 1730
Mallya
UNU-Fisheries Training Programme 17
Several studies have investigated the relationship between oxygen saturation and fishfood intake Randolph and Clemens (1976) found that feeding patterns of channelcatfish varied with temperature and oxygen availability When the oxygen contentdrops below 59 fish starts to lose its appetite Rainbow trout ( Oncorhynchus mykiss)reduced its appetite when oxygen saturation fell below approximately 60 (Jobling
1995) Similar results have been obtained from European sea bass ( Dicentrarchuslabrax L) (Thetmeyer et al 1999) blue tilapia (Oreochromis aureus) (Papoutsoglouand Tziha 1996) channel catfish ( Ictalurus punctatus ) (Buentello et al 2000) juvenileturbot (Pichavant et al 2001) and common carp (Cyprinus carpio L) showedreduced growth when exposed to low oxygen levels
252 Effect of oxygen on the food conversion ratio in fish
Tolerance for low oxygen may relate in part to the metabolic rate of a fish (Verheyen
and Decleir 1994) Fishes will regulate their metabolic rate over a range of dissolvedoxygen concentrations however at some point a further reduction in oxygen tensionwill produce a shift from a metabolic rate that is independent of oxygen concentrationto one that is dependent on oxygen level The point is referred to as the critical oxygentension (Ultsch et al 1978)
Decreased oxygen availability is also considered a major factor in determining foodintake Low dissolved oxygen is a type of stress frequently found in fish farmscharacterised by high fish densities and polluted fresh or marine waters The foodconversion ratio (FCR) is the amount of fish food consumed to generate a givenweight gain It is the ratio between the weights gained in a given period to the totalfeed intake by the fish in the same period It is the inverse of the feed intake The food
conversion ratio is improved (lowered) at higher growth rates (Markore and Rorvik 2001 Crampton et al 2003 Norgarden et al 2003)
The average FCR from several recent studies of fish growth is 097 In most cases theFCR appears to be slightly lower for tank studies (mean 093) than for net-penstudies (mean 102) The industrial average FCR values in Scotland and Chile were128 and 126 respectively (Neuman et al 2004) The best FCR in Scotland was 099while Chilersquos best came in at 11 Kreiberg and Brenton-Davie (1998) report an FCRof 099 for Atlantic salmon in a Sea Systems floating bag An experiment done ontilapia (Oreochromis niloticus) showed that FCR was inversely proportional to thedissolved oxygen level (145 at higher dissolved oxygen level and 675 at lower
dissolved oxygen level) (Tsadik and Kutty 1987)
Bromage et al (2000) showed that halibut are capable of achieving a 11 foodconversion ratio (FCR)
832019 Unuftp Resaerch Paper 2007
httpslidepdfcomreaderfullunuftp-resaerch-paper-2007 1830
Mallya
UNU-Fisheries Training Programme 18
2521 Tilapia (Oreochromis niloticus)
It is well known that tilapia can tolerate hypoxic and even anoxic conditions for shortperiods and are thus better suited than other species to hypereutectic conditions thatmay exist in static water aquaculture systems (Chorn et al 2006) It is also known that
fish found both in the tropics and temperate waters have incipient limiting oxygenlevels which may occur as in hypoxia Incipient limiting levels generally average at
73 mmHg (229 gl at 28 C for warm water fish and 90 mmgl at 617 mgl for coldwater fish such as the salmonids)
In reference to Oreochromis niloticus studies have shown that the incipient oxygenrequirements are between 139 mgl -292mgl
Studies done by Tsadik and Kutty (1987) on the influence of ambient oxygen onfeeding and growth in O niloticus showed that experiments under the various oxygenregimes varied as shown in Figures 3 and 4 below
The increase in mean weight of individual fish during the course of the growth testsfor the high medium and low levels of DO is shown in Figure 3 The fastest rate of growth was at high DO and the slowest growth in the low DO
Figure 4 shows the changes in mean weight of fish under the two tests at high DO andthe two tests at fluctuating DO It is obvious that the difference in the conditions of the two tests at high DO (demand feeder and manual feeding) or at low DO (fish fedwith demand feeder and no supplementary feed) has not made any serious differencein the growth within the sets but the difference in growth of high DO tests andfluctuating DO tests were marked
832019 Unuftp Resaerch Paper 2007
httpslidepdfcomreaderfullunuftp-resaerch-paper-2007 1930
Mallya
UNU-Fisheries Training Programme 19
Figure 4 Weight increase of O niloticus grown under high ambient oxygen (near airsaturation) and under simulated conditions of diel flux in oxygen Data from 2separate sets of experiments (A and B) are indicated Curves drawn through meanvalues (plusmn SD n = 8) indicated (see test) (Source Tsadik and Kutty 1987)
Figure 5 Increase in weight of O niloticus grown under high (near air saturation)medium and low ambient oxygen Mean values (plusmn SD n = 8) are indicated (SourceTsadik and Kutty 1987)
832019 Unuftp Resaerch Paper 2007
httpslidepdfcomreaderfullunuftp-resaerch-paper-2007 2030
Mallya
UNU-Fisheries Training Programme 20
2522 Cat fish culture (Clarias gariepinus) water quality requirements
More than 100 species of the genus Clarias have been described all over the world InTanzania the family Clariidae has only one native species the African catfish Clarias
gariepinus (Burchell 1822) (Synonyms Clarias lazera and Clarias mossambicus)
have recently been introduced in this country
Table 1 Water quality requirements of African catfish
Eggs larvaeearly fry
Advanced fry(Tolerance)
Fingerlingsadults
O280 ndash 100saturation
3 ndash 5 ppm gt3 ppm
Temperature opt 30degC opt 30degC opt 26 ndash 28degC
NH3-N 01 ppm (10 ppm)
NO2-N 05 ppm
NO3-N 100 ppm
Ph 6 ndash 9
CO2-C 6 ppm (10 ndash 15 ppm)
Salinity
10 ppt (15 ndash 16 ppt)
(Source FAO repository paper 2006b)
2523 Oxygen deficiency
African catfish has lung like structures that enable them to breathe air This made itpossible to survive very low oxygen levels in the pond However when Africancatfish is under mixed or polyculture oxygen level is important for the species mixedwith in the pond
832019 Unuftp Resaerch Paper 2007
httpslidepdfcomreaderfullunuftp-resaerch-paper-2007 2130
Mallya
UNU-Fisheries Training Programme 21
3 MATERIALS AND METHODS
31 Study area
The study was conducted at Verid the Holar University College research centre in
Saudarkrokur in January and February 2008
32 Experimental fish
Juvenile halibut was obtained from Frisky hatchery in Akureyri Iceland The fish weretransported from Akureyri to Verid in a tank while oxygen saturation was maintainedat 400 and temperature at 5ordmC The fish were then acclimatised for two weeks under995-106 oxygen saturation and 18pp salinity and 85-10ordmC temperature
At the start of the third week the fish were starved for two days before they wereindividually measured to obtain the initial weight During the measurement the fish
were anasethised using Tricaine methane sulfonate (TMS) used in the ratio of 40-50mg per litre of water 150 fish were individually tagged intraperitoneally with TrovanPassive Transponder tags In total 300 fish were individually tagged The fish werethen distributed into 12 tanks (Figure 2) each with 25 tagged and 25 not tagged fish
33 Experimental design
The fish were exposed to five different levels of oxygen saturation The targetsaturation value in each group was 60 80 100 120 and 140
The system consists of 12 culture tanks three reservoir tanks three aerators which arecombined with low head oxygenator (LHO) and three pumps (Figure 6)
The fish were reared in 7 m3 fibre glass tanks Water was delivered to the tank through PVC pipe and water flow can be adjusted by the valve (See Appendix 1) Thewater level in the tanks was adjusted by varying the height of external stand pipesThe culture tank has a central drainage system at the bottom through which waterflows out to the reservoir tank The water flows from the central drainage passesthrough the wire mesh where the remaining feed pellets were collected and then thewater goes through the PVC pipe back to the reservoir tank
The reservoir tanks are about 460 litres and are made of high density polyethylene(HDPE) From the reservoir tank water from the culture tank mixes with the freshwater from the inlet and is then pumped to the aerator which is combined with a low-head oxygenator (LHO) A pinnacle 75 pump with 055 kWh is plumbed one to eachreservoir tank The pump delivers the water to the aerator from the reservoir tank (Figure 6) The aerator and low head oxygenator (LHO) is a single unit The aeratoradds oxygen to the water and removes carbon dioxide while the LHO adds moreoxygen to the water inside the aerator A fan draws air through the aerator countercurrent to the direction of the water flow in the proportions of 1 volume water to 10volumes air Then the water flows through the LHO column where oxygen gaselevates the oxygen saturation of the water The system can elevate the oxygen
saturation to over 120 air saturation
832019 Unuftp Resaerch Paper 2007
httpslidepdfcomreaderfullunuftp-resaerch-paper-2007 2230
Mallya
UNU-Fisheries Training Programme 22
331 Oxygen levels in the system
In total there were 12 tanks in the system used The target oxygen saturation was60 80 100 120 and 140 (Figure 6) The oxygen saturation in the tanks wasregulated as follows
The system consisted of three tank rows each with four fish tanks (Figure 6) Thefirst row had 60 and 80 oxygen saturation The saturation levels were obtained byinjecting nitrogen gas to the LHO which supplies water to the four tanks to reduce thesaturation from 100 to 60 saturation The nitrogen gas was added from a gas tank through a hose connected to the LHO The amount of the gas injected was regulatedfrom the nitrogen gas tank However in addition to the nitrogen gas oxygen gas wasadded directly to two of the fish tanks in the row to raise the saturation level to 80
The oxygen saturation in the fish tanks in the second row was set at 100-106saturation by injecting oxygen into the LHO
In the third row the oxygen saturation of water from the LHO was increased to 120through injection of oxygen Furthermore oxygen gas was added directly to two tanksto raise the saturation level to 140
The oxygen gas was added through a hose from the oxygen tanks the tail of the hosewas connected to the gas tank while the head was connected to the rectangular wooddiffuser The piece of wood was used to make very small fine air bubbles of oxygengas The small air bubbles are known to increase oxygen transfer by increasing thesurface area for oxygen diffusion Oxygen saturation was measured using (YSI 550)probe while salinity was measured using PAL made in Japan pocket refract meter
832019 Unuftp Resaerch Paper 2007
httpslidepdfcomreaderfullunuftp-resaerch-paper-2007 2330
Mallya
UNU-Fisheries Training Programme 23
Figure 6 The arrangement of the tank system used in the experiment showing theoxygen saturation levels inlet and outlet pipes water pumps food collector plates andaerators
Legend
A= Aerator and Low-head oxygenator
= Reservoir tanks
= Outlets
=Inlets
=Water pump
=Pellet collector plate
=Direction of water
832019 Unuftp Resaerch Paper 2007
httpslidepdfcomreaderfullunuftp-resaerch-paper-2007 2430
Mallya
UNU-Fisheries Training Programme 24
34 Sampling and measurements
The body mass and growth performance were measured every two weeks whileoxygen saturation temperature and salinity were recorded daily
341 Specific growth rate
Weight measurements were taken every two weeks to obtain the specific growth rate(SGR) Prior to measuring the fish were starved for two days Both the individualtagged and untagged fish were weighed Both the initial weight and final weight of the fish were used to calculate the growth performance in terms of SGR
The SGR of individually tagged fish was calculated as follows
SGR = [(ln w 2-ln w 1) (t 2-t 1)] 100
Where w1 and w2 are the initial and final weights of the fish at times t 1 and t 2 respectively
342 Feeding and the collection of leftover feed
The fish were fed manually commercial (Laxa Feed Mill Akureyri) feed pellets (25mm) four times each day Following feeding the remaining pellets were collectedfrom a feed trap on the outflow from each tank and counted The average weight of asample of 100 fresh pellets was 00148 g and based on that it was possible to calculatethe original weight of the remaining pellets (Fr) before they were soaked in water
343 Feed conversion ratio (FCR)
The total amount of feed consumed (CT) was calculated as
CT = Amount of feed fed ndash (number of uneaten pellets x mean weight of pellet)
Feed conversion rate (FCR) indicates how much feed is required for each unit gain inweight
FCR = CT increase in body mass during the same time
832019 Unuftp Resaerch Paper 2007
httpslidepdfcomreaderfullunuftp-resaerch-paper-2007 2530
Mallya
UNU-Fisheries Training Programme 25
4 RESULTS
41 Growth
There was no significant difference in growth rate of the Atlantic halibut reared at
different oxygen saturation levels (Figure 7) during the first period (SGR1) Howeverthere was a significant difference (plt002) in the growth rate of the fish during thesecond period (SGR2) Then the SGR of fish reared at 100 saturation wassignificantly higher than that of fish reared at either 60 or 140 saturation
Figure 7 The graph showing the specific growth rate (SGR) of Atlantic halibut rearedat different oxygen saturation levels
42 Feed conversion ratio (FCR)
There was no significant difference in FCR of fish reared at different oxygen
saturation levels (Figure 8) However the FCR was lowest at 100 and 120saturation
832019 Unuftp Resaerch Paper 2007
httpslidepdfcomreaderfullunuftp-resaerch-paper-2007 2630
Mallya
UNU-Fisheries Training Programme 26
Figure 8 The feed conversion ratios (FCR) of Atlantic halibut reared at differentoxygen saturation levels
5 DISCUSSION
The results of the experiment under different oxygen levels clearly showed thatgrowth is affected by the level of oxygen saturation During the second period theSGR was highest at 100 saturation The best FCR was obtained in the groups withthe highest growth rate although there was no significant difference in FCR of fish
reared at different oxygen saturation levels The growth of other species of fish is alsoaffected by oxygen saturation such as tilapia (Tsadik and Kutty 1987) and Atlanticsalmon (Crampton et al 2003 Seymour et al 1992 Forsberg and Bergheim 1996)The growth of Atlantic halibut and Atlantic salmon increases with increasingsaturation up to 100 saturation However these species appear to be more sensitiveto oxygen saturation than tilapia
6 CONCLUSIONS
The results suggest that oxygen saturation levels affect both growth performance andfeed conversion ratios of Atlantic halibut The maximum growth rate and lowest feedconversion ratio in Atlantic halibut can be attended at higher oxygen saturation levelsbetween 90 and 120 However more research is needed in order to know at whichsaturation point the growth is maximised
Regarding future experimental work the results of this trial should be reconfirmed andgiven more time so that more observations can be made The actual oxygen saturationpoint at which Atlantic halibut has maximum growth should be identified hence moreexperimentation is needed
832019 Unuftp Resaerch Paper 2007
httpslidepdfcomreaderfullunuftp-resaerch-paper-2007 2730
Mallya
UNU-Fisheries Training Programme 27
ACKNOWLEDGEMENTS
I would like to express my gratitude to all the people who were involved and havemade the culmination of this project possible for their kind help
To my supervisor Prof Helgi Thorarensen from Holar University College for hisvaluable guidance and advice I would also like to thank the technical staff atSaudarkrokur Holar University College for giving me the opportunity to use theirinstallations and equipments also for their assistance during the experimental periodI am also grateful to Arnthor Gustavsson and Ingolfur Arnarson from HolarUniversity for their help in the experimental design and weighing the fish which Icould not have managed alone
I am indebted to Dr Tumi Tomasson Director of the UNU-FTP and Mr ThorAsgeirsson Deputy Director and Sigridur Kr Ingvarsdottir for their valuable
assistance care and guidance before and during the project
I would also like to thank my UNU fellows in the aquaculture speciality whoseencouragement enabled me to do the work even when I felt like giving up
I would like to thank my Director Mr Geoffrey Nanyaro at the Tanzanian FisheriesDivision for having given me leave which made it possible to accomplish this study
Last but not least to my family for their great concern and love all the time that Ispent here in Iceland Special thanks are given to my lovely husband for his loveencouragement and concern during the time I was away from home
832019 Unuftp Resaerch Paper 2007
httpslidepdfcomreaderfullunuftp-resaerch-paper-2007 2830
Mallya
UNU-Fisheries Training Programme 28
LIST OF REFERENCES
Balarin JD 1985 National reviews for aquaculture development in Africa 10Uganda FAO FishCirc (77010)109p
Bergheim A Martin G Anders N Per M Holland Per Krogedal and Viv Crampton2005 A newly developed oxygen injection system for cage farms AquaculturalEngineering 34(2006) 40-46
Bjornsson B and Tryggvadottir SV 1996 Effects of size on optimal temperature forgrowth and growth efficiency of immature Atlantic halibut (Hippoglossushippoglossus L) Aquaculture 142 33-42
Boyd CE and Tucker CS 1998 Pond Aquaculture Water Quality Management Kluwer Academic Publishers Boston MA (1998) 700 pp
Bromage N Mazorra C Bruce M Brown N and Shields R 2000 Halibutculture In Stickney RR Editor 2000 Encyclopedia of Aquaculture Wiley NewYork pp 425 ndash 432
Buentello JA Gatlin III DM Neill WH 2000 Effects of water temperature anddissolved oxygen on daily feed consumption feed utilization and growth of channelcatfish (Ictalurus punctatus) Aquaculture 182 339 ndash 352
Chorn E Lim et al 2006 Feeding Practices The Hawthorn Press 547-559
Crampton V A Bergheim M Gausen A Naeligss and P M Hoslashlland (2003) Effect of
low Oxygen on fish performance (wwwewoscom)
FAO 2006a State of world fisheries and Aquaculture FAO report 2006
FAO 2006b Aquaculture Production in Tanzania FAO Fishery StatisticsAquaculture production 2006)
Fisheries Division Tanzania 2007Status of Aquaculture in Tanzania
Florida Lake watch 2004The beginners guide for water management oxygen andtemperature Department of Fisheries and Aquatic Sciences Institute of Food andAgricultural sciences University of Florida Fist edition
Forsberg OI and Bergheim A 1996 The impact of constant and fluctuating oxygenconcentrations and two water consumption rates on post-smolt Atlantic salmonproduction parameters Aquacult Eng 15 (1996) pp 327 ndash 347
Groot C Margolis L and WC Clarke 1995 Physiology Ecology of pacific salmonDepartment of Fisheries and oceans Biological sciences Branch Pacific biologicalstation Nanaimo British Columbia Canada
832019 Unuftp Resaerch Paper 2007
httpslidepdfcomreaderfullunuftp-resaerch-paper-2007 2930
Mallya
UNU-Fisheries Training Programme 29
Groot C Margolis L and Clarke1995 Physiological Ecology of Pacific Salmon Department of Fisheries and oceans Biological sciences Branch Pacific biologicalstation Nanaimo British Columbia Canada
Jobling M 1995 Environmental biology of fishes Chapman and Hall Fish and
fisheries series 16
Kreiberg H Brenton-Davie V 1998 Seawater growth of Atlantic salmon in SEASystemsTM floating bag Aquaculture Update 81 1-2
Linde ndash gas 2007 httpwwwlindegascom [Dec 2006]
Microsoft Encarta1993-2002 wwwkwiccom Respiration in fishes Microsoft incartacopyright 1993-2002 Microsoft Corporation
Morkore T and Rorvik K-A 2001 Seasonal variations in growth feed utilisation
and product quality of farmed Atlantic salmon (Salmo salar L) transferred to seawater as 0+ smolts or 1+ smolts Aquaculture 199 145 ndash 158
Moyle B P and Cech JJJr 2000 Fishes an introduction to Ichthyology Fourth
edition Upper Saddle River NJ 07458
Neuman J Weir M Beattie C 2004 Skretting in the UK and Chile An
opportunity for comparison Skretting Outlook 21 8-11
Nordgarden U Oppedal F Taranger GL Hemre G-I and Hansen T 2003Seasonally changing metabolism in Atlantic salmon (Salmo salar L) Aquac Nutr 9287-289
Papoutsoglou SE and Tziha G 1996 Blue tilapia (Oreochromis aureus) growth ratein relation to dissolved oxygen concentration under recirculated water conditionsAquacultural Engineering 15 181-192
Poon WL CY Hung and DJ Randall 2002 The effect of aquatic hypoxia on fish
Department of Biology and Chemistry City University of Hong Kong KowloonHong Kong SAR China EPA600R-02097
Pichavant K Person-Le-Ruyet J Le Bayou N Severe A Le Roux A andBcouf G 2001 Comparative effects of long-term hypoxia on growth feeding andoxygen consumption in juvenile turbot and European sea bass J Fish Biol 59 875-883 doi10 1111j1095-86492001tb00158x
Randolph KN and HP Clemens 1976 Some factors influencing the feedingbehaviour of channel catfish in culture ponds Transactions of American FisheriesSociety 105 718724
Seymour et al 1992 EA Seymour OI Forsberg and JP Aabel The effect of arious stocking densities low water use and two oxygen levels on production
parameters of adult Atlantic salmon (Salmo salar L) in land-based tanks Report fromRogaland Research RF-19392 (1992) p 36
832019 Unuftp Resaerch Paper 2007
httpslidepdfcomreaderfullunuftp-resaerch-paper-2007 3030
Mallya
Svobodova Z Richard L Jana M and Blanka V 1993 Water quality and fish health EIFAC Technical paper 54
Tanzania Fisheries Division aquaculture section 2006 Aquaculture in Tanzania
Ministry of Natural resources and Tourism Fisheries Division
Timmons MB James ME Fred WW Sreven TS and Brian J V Recirculating
Aquaculture Systems NRAC publication No01-002
Thetmeyer H Waller UBlack KD Inselmann S Rosenthal H 1999 Growth of European sea bass (Dicentrarchus labrax L) under hypoxic and oscillating oxygenconditions Aquaculture 174 355-367
Tom L1998 Nutritional and feeding of fish Kluwer Academic Publishers Secondedition
Tsadik Gagma MN Kutty 1987 Influence of ambient oxygen on feeding and growth
of tilapia Oreochromis niloticus ARAC87WP10United Nation DevelopmentProgramme Food and Agriculture Organization of the United Nations Nigerianinstitute for oceanography and marine research project RAF87009
Ultsch GR H Boschung and MJRoss 1978 Metabolism critical oxygen tensionand habitat selection in darters (Etheostoma) Ecology 5999-107
Verheyen ER Bluse and W Decleir 1994 Metabolic rate hypoxia tolereance andaquatic surface respiration of some lacustrine and riverine African cichlid fishes(Pisces Cichlidae) Comp Biochem Physiol 107A403-411
Wedemeyer GA 1996 Interactions with Water Quality Conditions in Physiology of Fish in Intensive Culture Systems Chapman and Hall New York New York 1996
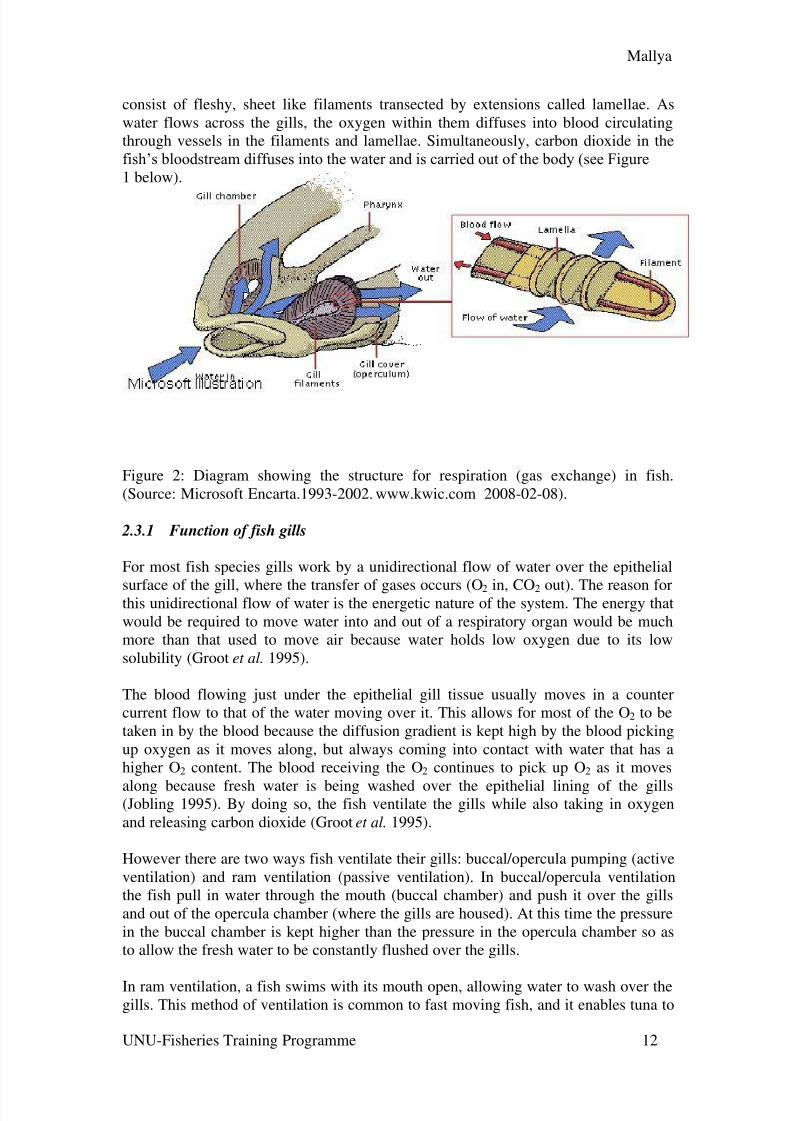
832019 Unuftp Resaerch Paper 2007
httpslidepdfcomreaderfullunuftp-resaerch-paper-2007 1230
Mallya
UNU-Fisheries Training Programme 12
consist of fleshy sheet like filaments transected by extensions called lamellae Aswater flows across the gills the oxygen within them diffuses into blood circulatingthrough vessels in the filaments and lamellae Simultaneously carbon dioxide in thefishrsquos bloodstream diffuses into the water and is carried out of the body (see Figure
1 below)
Figure 2 Diagram showing the structure for respiration (gas exchange) in fish(Source Microsoft Encarta1993-2002 wwwkwiccom 2008-02-08)
231 Function of fish gills
For most fish species gills work by a unidirectional flow of water over the epithelial
surface of the gill where the transfer of gases occurs (O2 in CO2 out) The reason forthis unidirectional flow of water is the energetic nature of the system The energy thatwould be required to move water into and out of a respiratory organ would be muchmore than that used to move air because water holds low oxygen due to its lowsolubility (Groot et al 1995)
The blood flowing just under the epithelial gill tissue usually moves in a countercurrent flow to that of the water moving over it This allows for most of the O 2 to betaken in by the blood because the diffusion gradient is kept high by the blood pickingup oxygen as it moves along but always coming into contact with water that has ahigher O2 content The blood receiving the O2 continues to pick up O2 as it moves
along because fresh water is being washed over the epithelial lining of the gills(Jobling 1995) By doing so the fish ventilate the gills while also taking in oxygenand releasing carbon dioxide (Groot et al 1995)
However there are two ways fish ventilate their gills buccalopercula pumping (activeventilation) and ram ventilation (passive ventilation) In buccalopercula ventilationthe fish pull in water through the mouth (buccal chamber) and push it over the gillsand out of the opercula chamber (where the gills are housed) At this time the pressurein the buccal chamber is kept higher than the pressure in the opercula chamber so asto allow the fresh water to be constantly flushed over the gills
In ram ventilation a fish swims with its mouth open allowing water to wash over thegills This method of ventilation is common to fast moving fish and it enables tuna to
832019 Unuftp Resaerch Paper 2007
httpslidepdfcomreaderfullunuftp-resaerch-paper-2007 1330
Mallya
UNU-Fisheries Training Programme 13
keep enough oxygen going to the gill surface while swimming at high speed (Boydand Tucker 1998) During this time the oxygen is absorbed into the blood whilecarbon dioxide diffuses out of the blood to the water
Groot et al (1995) have described the pathway taken by carbon dioxide and explain
that in the blood CO2 is transported in the form of bicarbonate The bicarbonatemoves from the blood by passing through the erythrocytes in which O2 binds toHaemoglobin (Hb) at the respiratory surface causing hydrogen ions (H+) to bereleased The increase in H+ ions combines with HCO3
- to form CO2 and OH- Thusmore CO2 is formed and can leave the blood across the respiratory surface Excess H+ binds to OH- forming water and allowing the pH to increase enough to promote thebinding of oxygen to Hb The release of O2 from Hb in the tissues makes the Hbavailable to bind to H+ promoting the conversion of CO2 to HCO3
- which helps drawCO2 from the tissues Therefore CO2 that is being transported into and out of the redblood cells minimises changes in pH in other parts of the body because of protonbinding and proton release from haemoglobin as it is deoxygenated and oxygenated
respectively However carbon dioxide is rarely a problem in when dissolved oxygenconcentrations are well above saturation levels Due to these processes oxygen levelshould be kept at or a little bit higher during the entire culture period
24 Effects of oxygen levels on oxygen uptake by fish
It is commonly thought that if there is not enough oxygen in the water then the fishwill be seen gasping at the surface but this is a last resort means to breathe The firstindication there may be a dissolved oxygen problem in the water is when the fishbecome unusually lethargic and stop feeding As oxygen levels decrease the fish donot have enough energy to swim and feeding utilises yet more oxygen Often it isrecognised the fish have a problem at this stage but frequently some form of medication is added to the water and this can actually cause the oxygen level to dropeven lower leading to a number of mortalities This can lead to the mistakenconclusion that the fish were suffering from some form of disease In terms of managing any aquatic system it is always advisable to increase the aeration when anyfish start to behave abnormally before adding any form of medication to the waterIncreasing the aeration will certainly make the environment more comfortable for thefish even if the dissolved oxygen level was already satisfactory With respect toimproving the aeration before adding medication this will allow for any depletion of the oxygen level caused through a chemical reaction with the medication
The recommended minimum dissolved oxygen requirements are as followsCold water fish - 6 mg per litre (70 saturation)Tropical freshwater fish- 5 mg per litre (80 saturation)Tropical marine fish- 5 mg per litre (75 saturation)
It is worth bearing in mind that these values are minimum requirements for healthygrowth tissue repair and reproduction (Svobodova et al 1993) Most fish species willtolerate a drop below these minimum values for a short period of time probably thecold water species are likely to tolerate a lower level than tropical fish However theperiod of time during which the oxygen level drops below the required minimum
level will cause the fish to become stressed It is this stress which causes fish death Itmay take the fish several days to recover from short term oxygen depletion but where
832019 Unuftp Resaerch Paper 2007
httpslidepdfcomreaderfullunuftp-resaerch-paper-2007 1430
Mallya
UNU-Fisheries Training Programme 14
the levels are persistently low an assortment of stress related diseases such as fin rotand white spot may occur
241 Fish response to hypoxia
Hypoxia or oxygen depletion is a phenomenon that occurs in aquatic environments asdissolved oxygen (DO molecular oxygen dissolved in water) becomes reduced inconcentration to a point detrimental to aquatic organisms living in the systemDissolved oxygen is typically expressed as a percentage of the oxygen that woulddissolve in the water at the prevailing temperature and salinity (both of which affectthe solubility of oxygen in water) An aquatic system lacking dissolved oxygen (0saturation) is termed anaerobic Reducing or anoxic is a system with a low DOconcentration in the range between 1 and 30 DO saturation is called hypoxic Mostfish cannot live below 30 DO saturation A ldquohealthyrdquo aquatic environment should
seldom experience DO of less than 80 In response to a low concentration of dissolved oxygen in the water the fish can respond in two ways the blood flow can
be increased by opening up further secondary lamellae to increase the effectiverespiratory area (it may be difficult to increase significantly the blood flow ratethrough the capillaries themselves) and the concentration of red blood corpuscles canbe increased to raise the oxygen carrying capacity of the blood per unit volume Thelatter can be achieved by reducing the blood plasma volume (eg by increasing theurine flow rate) in the short term and by releasing extra blood corpuscles from thespleen in the longer term (Svobodova et al 1993)
At the same time the ventilation rate is increased to bring more water into contactwith the gills within a unit of time There are however limits to the increased flowattainable the space between the secondary lamellae is narrow (in trout it is about 20μm) and water will tend to be forced past the tips of the primary lamellae when the
respiratory water flow is high thus by-passing the respiratory surfaces
These reactions are quite adequate to compensate for the normal fluctuations of energy demands of the fish and of dissolved oxygen concentrations in the water Oneof the consequences however of an increased ventilation rate is that there will be anincrease in the amount of toxic substances in the water reaching the gill surface wherethey can be absorbed (Boyd and Tucker 1998)
However oxygen deficiency causes asphyxiation and fish will die depending on the
oxygen requirements of the species and to a lesser extent on their rate of adaptationFish exposed to oxygen deficient water do not take food collect near the watersurface gasp for air (cyprinids) gather at the inflow to ponds where the oxygen levelsare higher become torpid fail to react to irritation lose their ability to escape captureand ultimately die The major pathological-anatomic changes include a very pale skincolour congestion of the cyanotic blood in the gills adherence of the gill lamellaeand small haemorrhages in the front of the ocular cavity and in the skin of the gillcovers In the majority of predatory fish the mouth gapes spasmodically and theoperculum over the gills remains loosely open (Svobodova et al 1993)
More than that fish reduce food intake leading to a reduction in growth
Reproduction is inhibited and both fertilisation success and larval survival arecompromised Energy utilisation is decreased associated with a shift from aerobic to
832019 Unuftp Resaerch Paper 2007
httpslidepdfcomreaderfullunuftp-resaerch-paper-2007 1530
Mallya
UNU-Fisheries Training Programme 15
anaerobic metabolism To reduce energy expenditure under this situation fish moveto water at lower temperature and reduce activity reproduction feeding and proteinsynthesis Transcription is reduced mediated by increased levels of hypoxia-inducingfactor 1 (HIF-1) which also up-regulates genes involved in erythropoiesis capillarygrowth and glucose transport All these responses are directed at maintaining cellular
oxygen homeostasis and reducing energy expenditure thereby augmenting survival of the animal during hypoxia In general the actions of toxicants are exacerbated duringhypoxia through a variety of mechanisms Some species are much more tolerant of hypoxia than others leading to differential survival during extended periods of hypoxia (Poon et al 2002) To avoid this aquaculture systems have to be suppliedwith enough oxygen saturation However too much oxygen is also harmful to fish
242 Fish response to hyperoxia
Hyperoxia is the state of water when it holds a very high amount of oxygen At thisstate water is described as having a dissolved oxygen saturation of greater than 100
This percent can be 140-300
At this water condition oxygen molecules will begin to move around within the watercolumn looking for a little elbowroom If there is non available it will return to theatmosphere or attach to the organisms around (Florida Lake Watch 2004)
If fish are exposed (at a lower atmospheric pressure) to such water their bloodequilibrates with the excess pressure in the water Bubbles form in the blood and thesecan block the capillaries in sub-acute cases the dorsal and caudal fin can be affectedand bubbles may be visible between the fin rays The epidermal tissue distal to theocclusions then becomes necrotic and cases are known where the dorsal fins of trouthave become completely eroded In severe cases death occurs rapidly as a result of blockage of the major arteries and large bubbles are clearly seen between the rays of all the fins The remedy is either to remove the fish to normally equilibrated water orto provide vigorous aeration to strip out the excess gas (Svobodova et al 1993) Insome species such as salmons and fast swimming fishes the swim bladder acts like anoxygen store to be used during the hypoxia When the gads level in the blood is highgases will diffuse from the blood to the bladder When the water is supersaturated(hyperoxia) the bladder becomes over-inflated and this leads to buoyancy problemsespecially in small fishes (Groot et al 1995)
25
Effects of oxygen level on growth and food conversion ratios of fish
Successful fish production depends on good oxygen management Oxygen is essentialto the survival (respiration) of fish to sustain healthy fish and bacteria whichdecompose the waste produced by the fish and to meet the biological oxygen demand(BOD) within culture system Dissolved oxygen levels can affect fish respiration aswell as ammonia and nitrite toxicity When the oxygen level is maintained nearsaturation or even at slightly super saturation at all times it will increase growth ratesreduce the food conversion ratio and increase overall fish production
832019 Unuftp Resaerch Paper 2007
httpslidepdfcomreaderfullunuftp-resaerch-paper-2007 1630
Mallya
UNU-Fisheries Training Programme 16
Figure 3 The effect of oxygen level on growth and food conversion ratios (Linde-gas2007)
251 Effect of oxygen on fish growth
Oxygen is important in respiration and metabolism processes in any animal In fishthe metabolic rate is highly affected by the concentration of oxygen in the rearingenvironment As the dissolved oxygen concentration decreases respiration andfeeding activities also decrease As a result the growth rate is reduced and the
possibility of a disease attack is increased However fish is not able to assimilate thefood consumed when DO is low (Tom 1998)
Overall health and physiological conditions are best if the dissolved oxygen is keptcloser to saturation When the levels are lower than those mentioned above thegrowth of the fish can be highly affected by an increase in stress tissue hypoxia and adecrease in swimming activities and reduction in immunity to diseases
However there is a need to maintain the level of dissolved oxygen at the saturationlevel which will not affect its physiological or metabolic activities so as to have highproduction in any culture system (Wedemeyer 1996) More than that one has to keep
in mind that the oxygen level requirement depends on the species but also on fish sizeand activity of the fish
According to Tom (1998) oxygen requirements per unit weight of fish significantlydecline with increasing individual weight In carp this reduction may be expressed bythe following ratios yearling = 1 two-year-old carp = 05 ndash 07 marketable carp = 03 ndash
04 Significant differences in oxygen demand are also found for different speciesUsing a coefficient of 1 to express the oxygen requirement of common carp thecomparative values for some other species are as follows trout 283 peled 220 pikeperch 176 roach 151 sturgeon 150 perch 146 bream 141 pike 110 eel 083 andtench 083
832019 Unuftp Resaerch Paper 2007
httpslidepdfcomreaderfullunuftp-resaerch-paper-2007 1730
Mallya
UNU-Fisheries Training Programme 17
Several studies have investigated the relationship between oxygen saturation and fishfood intake Randolph and Clemens (1976) found that feeding patterns of channelcatfish varied with temperature and oxygen availability When the oxygen contentdrops below 59 fish starts to lose its appetite Rainbow trout ( Oncorhynchus mykiss)reduced its appetite when oxygen saturation fell below approximately 60 (Jobling
1995) Similar results have been obtained from European sea bass ( Dicentrarchuslabrax L) (Thetmeyer et al 1999) blue tilapia (Oreochromis aureus) (Papoutsoglouand Tziha 1996) channel catfish ( Ictalurus punctatus ) (Buentello et al 2000) juvenileturbot (Pichavant et al 2001) and common carp (Cyprinus carpio L) showedreduced growth when exposed to low oxygen levels
252 Effect of oxygen on the food conversion ratio in fish
Tolerance for low oxygen may relate in part to the metabolic rate of a fish (Verheyen
and Decleir 1994) Fishes will regulate their metabolic rate over a range of dissolvedoxygen concentrations however at some point a further reduction in oxygen tensionwill produce a shift from a metabolic rate that is independent of oxygen concentrationto one that is dependent on oxygen level The point is referred to as the critical oxygentension (Ultsch et al 1978)
Decreased oxygen availability is also considered a major factor in determining foodintake Low dissolved oxygen is a type of stress frequently found in fish farmscharacterised by high fish densities and polluted fresh or marine waters The foodconversion ratio (FCR) is the amount of fish food consumed to generate a givenweight gain It is the ratio between the weights gained in a given period to the totalfeed intake by the fish in the same period It is the inverse of the feed intake The food
conversion ratio is improved (lowered) at higher growth rates (Markore and Rorvik 2001 Crampton et al 2003 Norgarden et al 2003)
The average FCR from several recent studies of fish growth is 097 In most cases theFCR appears to be slightly lower for tank studies (mean 093) than for net-penstudies (mean 102) The industrial average FCR values in Scotland and Chile were128 and 126 respectively (Neuman et al 2004) The best FCR in Scotland was 099while Chilersquos best came in at 11 Kreiberg and Brenton-Davie (1998) report an FCRof 099 for Atlantic salmon in a Sea Systems floating bag An experiment done ontilapia (Oreochromis niloticus) showed that FCR was inversely proportional to thedissolved oxygen level (145 at higher dissolved oxygen level and 675 at lower
dissolved oxygen level) (Tsadik and Kutty 1987)
Bromage et al (2000) showed that halibut are capable of achieving a 11 foodconversion ratio (FCR)
832019 Unuftp Resaerch Paper 2007
httpslidepdfcomreaderfullunuftp-resaerch-paper-2007 1830
Mallya
UNU-Fisheries Training Programme 18
2521 Tilapia (Oreochromis niloticus)
It is well known that tilapia can tolerate hypoxic and even anoxic conditions for shortperiods and are thus better suited than other species to hypereutectic conditions thatmay exist in static water aquaculture systems (Chorn et al 2006) It is also known that
fish found both in the tropics and temperate waters have incipient limiting oxygenlevels which may occur as in hypoxia Incipient limiting levels generally average at
73 mmHg (229 gl at 28 C for warm water fish and 90 mmgl at 617 mgl for coldwater fish such as the salmonids)
In reference to Oreochromis niloticus studies have shown that the incipient oxygenrequirements are between 139 mgl -292mgl
Studies done by Tsadik and Kutty (1987) on the influence of ambient oxygen onfeeding and growth in O niloticus showed that experiments under the various oxygenregimes varied as shown in Figures 3 and 4 below
The increase in mean weight of individual fish during the course of the growth testsfor the high medium and low levels of DO is shown in Figure 3 The fastest rate of growth was at high DO and the slowest growth in the low DO
Figure 4 shows the changes in mean weight of fish under the two tests at high DO andthe two tests at fluctuating DO It is obvious that the difference in the conditions of the two tests at high DO (demand feeder and manual feeding) or at low DO (fish fedwith demand feeder and no supplementary feed) has not made any serious differencein the growth within the sets but the difference in growth of high DO tests andfluctuating DO tests were marked
832019 Unuftp Resaerch Paper 2007
httpslidepdfcomreaderfullunuftp-resaerch-paper-2007 1930
Mallya
UNU-Fisheries Training Programme 19
Figure 4 Weight increase of O niloticus grown under high ambient oxygen (near airsaturation) and under simulated conditions of diel flux in oxygen Data from 2separate sets of experiments (A and B) are indicated Curves drawn through meanvalues (plusmn SD n = 8) indicated (see test) (Source Tsadik and Kutty 1987)
Figure 5 Increase in weight of O niloticus grown under high (near air saturation)medium and low ambient oxygen Mean values (plusmn SD n = 8) are indicated (SourceTsadik and Kutty 1987)
832019 Unuftp Resaerch Paper 2007
httpslidepdfcomreaderfullunuftp-resaerch-paper-2007 2030
Mallya
UNU-Fisheries Training Programme 20
2522 Cat fish culture (Clarias gariepinus) water quality requirements
More than 100 species of the genus Clarias have been described all over the world InTanzania the family Clariidae has only one native species the African catfish Clarias
gariepinus (Burchell 1822) (Synonyms Clarias lazera and Clarias mossambicus)
have recently been introduced in this country
Table 1 Water quality requirements of African catfish
Eggs larvaeearly fry
Advanced fry(Tolerance)
Fingerlingsadults
O280 ndash 100saturation
3 ndash 5 ppm gt3 ppm
Temperature opt 30degC opt 30degC opt 26 ndash 28degC
NH3-N 01 ppm (10 ppm)
NO2-N 05 ppm
NO3-N 100 ppm
Ph 6 ndash 9
CO2-C 6 ppm (10 ndash 15 ppm)
Salinity
10 ppt (15 ndash 16 ppt)
(Source FAO repository paper 2006b)
2523 Oxygen deficiency
African catfish has lung like structures that enable them to breathe air This made itpossible to survive very low oxygen levels in the pond However when Africancatfish is under mixed or polyculture oxygen level is important for the species mixedwith in the pond
832019 Unuftp Resaerch Paper 2007
httpslidepdfcomreaderfullunuftp-resaerch-paper-2007 2130
Mallya
UNU-Fisheries Training Programme 21
3 MATERIALS AND METHODS
31 Study area
The study was conducted at Verid the Holar University College research centre in
Saudarkrokur in January and February 2008
32 Experimental fish
Juvenile halibut was obtained from Frisky hatchery in Akureyri Iceland The fish weretransported from Akureyri to Verid in a tank while oxygen saturation was maintainedat 400 and temperature at 5ordmC The fish were then acclimatised for two weeks under995-106 oxygen saturation and 18pp salinity and 85-10ordmC temperature
At the start of the third week the fish were starved for two days before they wereindividually measured to obtain the initial weight During the measurement the fish
were anasethised using Tricaine methane sulfonate (TMS) used in the ratio of 40-50mg per litre of water 150 fish were individually tagged intraperitoneally with TrovanPassive Transponder tags In total 300 fish were individually tagged The fish werethen distributed into 12 tanks (Figure 2) each with 25 tagged and 25 not tagged fish
33 Experimental design
The fish were exposed to five different levels of oxygen saturation The targetsaturation value in each group was 60 80 100 120 and 140
The system consists of 12 culture tanks three reservoir tanks three aerators which arecombined with low head oxygenator (LHO) and three pumps (Figure 6)
The fish were reared in 7 m3 fibre glass tanks Water was delivered to the tank through PVC pipe and water flow can be adjusted by the valve (See Appendix 1) Thewater level in the tanks was adjusted by varying the height of external stand pipesThe culture tank has a central drainage system at the bottom through which waterflows out to the reservoir tank The water flows from the central drainage passesthrough the wire mesh where the remaining feed pellets were collected and then thewater goes through the PVC pipe back to the reservoir tank
The reservoir tanks are about 460 litres and are made of high density polyethylene(HDPE) From the reservoir tank water from the culture tank mixes with the freshwater from the inlet and is then pumped to the aerator which is combined with a low-head oxygenator (LHO) A pinnacle 75 pump with 055 kWh is plumbed one to eachreservoir tank The pump delivers the water to the aerator from the reservoir tank (Figure 6) The aerator and low head oxygenator (LHO) is a single unit The aeratoradds oxygen to the water and removes carbon dioxide while the LHO adds moreoxygen to the water inside the aerator A fan draws air through the aerator countercurrent to the direction of the water flow in the proportions of 1 volume water to 10volumes air Then the water flows through the LHO column where oxygen gaselevates the oxygen saturation of the water The system can elevate the oxygen
saturation to over 120 air saturation
832019 Unuftp Resaerch Paper 2007
httpslidepdfcomreaderfullunuftp-resaerch-paper-2007 2230
Mallya
UNU-Fisheries Training Programme 22
331 Oxygen levels in the system
In total there were 12 tanks in the system used The target oxygen saturation was60 80 100 120 and 140 (Figure 6) The oxygen saturation in the tanks wasregulated as follows
The system consisted of three tank rows each with four fish tanks (Figure 6) Thefirst row had 60 and 80 oxygen saturation The saturation levels were obtained byinjecting nitrogen gas to the LHO which supplies water to the four tanks to reduce thesaturation from 100 to 60 saturation The nitrogen gas was added from a gas tank through a hose connected to the LHO The amount of the gas injected was regulatedfrom the nitrogen gas tank However in addition to the nitrogen gas oxygen gas wasadded directly to two of the fish tanks in the row to raise the saturation level to 80
The oxygen saturation in the fish tanks in the second row was set at 100-106saturation by injecting oxygen into the LHO
In the third row the oxygen saturation of water from the LHO was increased to 120through injection of oxygen Furthermore oxygen gas was added directly to two tanksto raise the saturation level to 140
The oxygen gas was added through a hose from the oxygen tanks the tail of the hosewas connected to the gas tank while the head was connected to the rectangular wooddiffuser The piece of wood was used to make very small fine air bubbles of oxygengas The small air bubbles are known to increase oxygen transfer by increasing thesurface area for oxygen diffusion Oxygen saturation was measured using (YSI 550)probe while salinity was measured using PAL made in Japan pocket refract meter
832019 Unuftp Resaerch Paper 2007
httpslidepdfcomreaderfullunuftp-resaerch-paper-2007 2330
Mallya
UNU-Fisheries Training Programme 23
Figure 6 The arrangement of the tank system used in the experiment showing theoxygen saturation levels inlet and outlet pipes water pumps food collector plates andaerators
Legend
A= Aerator and Low-head oxygenator
= Reservoir tanks
= Outlets
=Inlets
=Water pump
=Pellet collector plate
=Direction of water
832019 Unuftp Resaerch Paper 2007
httpslidepdfcomreaderfullunuftp-resaerch-paper-2007 2430
Mallya
UNU-Fisheries Training Programme 24
34 Sampling and measurements
The body mass and growth performance were measured every two weeks whileoxygen saturation temperature and salinity were recorded daily
341 Specific growth rate
Weight measurements were taken every two weeks to obtain the specific growth rate(SGR) Prior to measuring the fish were starved for two days Both the individualtagged and untagged fish were weighed Both the initial weight and final weight of the fish were used to calculate the growth performance in terms of SGR
The SGR of individually tagged fish was calculated as follows
SGR = [(ln w 2-ln w 1) (t 2-t 1)] 100
Where w1 and w2 are the initial and final weights of the fish at times t 1 and t 2 respectively
342 Feeding and the collection of leftover feed
The fish were fed manually commercial (Laxa Feed Mill Akureyri) feed pellets (25mm) four times each day Following feeding the remaining pellets were collectedfrom a feed trap on the outflow from each tank and counted The average weight of asample of 100 fresh pellets was 00148 g and based on that it was possible to calculatethe original weight of the remaining pellets (Fr) before they were soaked in water
343 Feed conversion ratio (FCR)
The total amount of feed consumed (CT) was calculated as
CT = Amount of feed fed ndash (number of uneaten pellets x mean weight of pellet)
Feed conversion rate (FCR) indicates how much feed is required for each unit gain inweight
FCR = CT increase in body mass during the same time
832019 Unuftp Resaerch Paper 2007
httpslidepdfcomreaderfullunuftp-resaerch-paper-2007 2530
Mallya
UNU-Fisheries Training Programme 25
4 RESULTS
41 Growth
There was no significant difference in growth rate of the Atlantic halibut reared at
different oxygen saturation levels (Figure 7) during the first period (SGR1) Howeverthere was a significant difference (plt002) in the growth rate of the fish during thesecond period (SGR2) Then the SGR of fish reared at 100 saturation wassignificantly higher than that of fish reared at either 60 or 140 saturation
Figure 7 The graph showing the specific growth rate (SGR) of Atlantic halibut rearedat different oxygen saturation levels
42 Feed conversion ratio (FCR)
There was no significant difference in FCR of fish reared at different oxygen
saturation levels (Figure 8) However the FCR was lowest at 100 and 120saturation
832019 Unuftp Resaerch Paper 2007
httpslidepdfcomreaderfullunuftp-resaerch-paper-2007 2630
Mallya
UNU-Fisheries Training Programme 26
Figure 8 The feed conversion ratios (FCR) of Atlantic halibut reared at differentoxygen saturation levels
5 DISCUSSION
The results of the experiment under different oxygen levels clearly showed thatgrowth is affected by the level of oxygen saturation During the second period theSGR was highest at 100 saturation The best FCR was obtained in the groups withthe highest growth rate although there was no significant difference in FCR of fish
reared at different oxygen saturation levels The growth of other species of fish is alsoaffected by oxygen saturation such as tilapia (Tsadik and Kutty 1987) and Atlanticsalmon (Crampton et al 2003 Seymour et al 1992 Forsberg and Bergheim 1996)The growth of Atlantic halibut and Atlantic salmon increases with increasingsaturation up to 100 saturation However these species appear to be more sensitiveto oxygen saturation than tilapia
6 CONCLUSIONS
The results suggest that oxygen saturation levels affect both growth performance andfeed conversion ratios of Atlantic halibut The maximum growth rate and lowest feedconversion ratio in Atlantic halibut can be attended at higher oxygen saturation levelsbetween 90 and 120 However more research is needed in order to know at whichsaturation point the growth is maximised
Regarding future experimental work the results of this trial should be reconfirmed andgiven more time so that more observations can be made The actual oxygen saturationpoint at which Atlantic halibut has maximum growth should be identified hence moreexperimentation is needed
832019 Unuftp Resaerch Paper 2007
httpslidepdfcomreaderfullunuftp-resaerch-paper-2007 2730
Mallya
UNU-Fisheries Training Programme 27
ACKNOWLEDGEMENTS
I would like to express my gratitude to all the people who were involved and havemade the culmination of this project possible for their kind help
To my supervisor Prof Helgi Thorarensen from Holar University College for hisvaluable guidance and advice I would also like to thank the technical staff atSaudarkrokur Holar University College for giving me the opportunity to use theirinstallations and equipments also for their assistance during the experimental periodI am also grateful to Arnthor Gustavsson and Ingolfur Arnarson from HolarUniversity for their help in the experimental design and weighing the fish which Icould not have managed alone
I am indebted to Dr Tumi Tomasson Director of the UNU-FTP and Mr ThorAsgeirsson Deputy Director and Sigridur Kr Ingvarsdottir for their valuable
assistance care and guidance before and during the project
I would also like to thank my UNU fellows in the aquaculture speciality whoseencouragement enabled me to do the work even when I felt like giving up
I would like to thank my Director Mr Geoffrey Nanyaro at the Tanzanian FisheriesDivision for having given me leave which made it possible to accomplish this study
Last but not least to my family for their great concern and love all the time that Ispent here in Iceland Special thanks are given to my lovely husband for his loveencouragement and concern during the time I was away from home
832019 Unuftp Resaerch Paper 2007
httpslidepdfcomreaderfullunuftp-resaerch-paper-2007 2830
Mallya
UNU-Fisheries Training Programme 28
LIST OF REFERENCES
Balarin JD 1985 National reviews for aquaculture development in Africa 10Uganda FAO FishCirc (77010)109p
Bergheim A Martin G Anders N Per M Holland Per Krogedal and Viv Crampton2005 A newly developed oxygen injection system for cage farms AquaculturalEngineering 34(2006) 40-46
Bjornsson B and Tryggvadottir SV 1996 Effects of size on optimal temperature forgrowth and growth efficiency of immature Atlantic halibut (Hippoglossushippoglossus L) Aquaculture 142 33-42
Boyd CE and Tucker CS 1998 Pond Aquaculture Water Quality Management Kluwer Academic Publishers Boston MA (1998) 700 pp
Bromage N Mazorra C Bruce M Brown N and Shields R 2000 Halibutculture In Stickney RR Editor 2000 Encyclopedia of Aquaculture Wiley NewYork pp 425 ndash 432
Buentello JA Gatlin III DM Neill WH 2000 Effects of water temperature anddissolved oxygen on daily feed consumption feed utilization and growth of channelcatfish (Ictalurus punctatus) Aquaculture 182 339 ndash 352
Chorn E Lim et al 2006 Feeding Practices The Hawthorn Press 547-559
Crampton V A Bergheim M Gausen A Naeligss and P M Hoslashlland (2003) Effect of
low Oxygen on fish performance (wwwewoscom)
FAO 2006a State of world fisheries and Aquaculture FAO report 2006
FAO 2006b Aquaculture Production in Tanzania FAO Fishery StatisticsAquaculture production 2006)
Fisheries Division Tanzania 2007Status of Aquaculture in Tanzania
Florida Lake watch 2004The beginners guide for water management oxygen andtemperature Department of Fisheries and Aquatic Sciences Institute of Food andAgricultural sciences University of Florida Fist edition
Forsberg OI and Bergheim A 1996 The impact of constant and fluctuating oxygenconcentrations and two water consumption rates on post-smolt Atlantic salmonproduction parameters Aquacult Eng 15 (1996) pp 327 ndash 347
Groot C Margolis L and WC Clarke 1995 Physiology Ecology of pacific salmonDepartment of Fisheries and oceans Biological sciences Branch Pacific biologicalstation Nanaimo British Columbia Canada
832019 Unuftp Resaerch Paper 2007
httpslidepdfcomreaderfullunuftp-resaerch-paper-2007 2930
Mallya
UNU-Fisheries Training Programme 29
Groot C Margolis L and Clarke1995 Physiological Ecology of Pacific Salmon Department of Fisheries and oceans Biological sciences Branch Pacific biologicalstation Nanaimo British Columbia Canada
Jobling M 1995 Environmental biology of fishes Chapman and Hall Fish and
fisheries series 16
Kreiberg H Brenton-Davie V 1998 Seawater growth of Atlantic salmon in SEASystemsTM floating bag Aquaculture Update 81 1-2
Linde ndash gas 2007 httpwwwlindegascom [Dec 2006]
Microsoft Encarta1993-2002 wwwkwiccom Respiration in fishes Microsoft incartacopyright 1993-2002 Microsoft Corporation
Morkore T and Rorvik K-A 2001 Seasonal variations in growth feed utilisation
and product quality of farmed Atlantic salmon (Salmo salar L) transferred to seawater as 0+ smolts or 1+ smolts Aquaculture 199 145 ndash 158
Moyle B P and Cech JJJr 2000 Fishes an introduction to Ichthyology Fourth
edition Upper Saddle River NJ 07458
Neuman J Weir M Beattie C 2004 Skretting in the UK and Chile An
opportunity for comparison Skretting Outlook 21 8-11
Nordgarden U Oppedal F Taranger GL Hemre G-I and Hansen T 2003Seasonally changing metabolism in Atlantic salmon (Salmo salar L) Aquac Nutr 9287-289
Papoutsoglou SE and Tziha G 1996 Blue tilapia (Oreochromis aureus) growth ratein relation to dissolved oxygen concentration under recirculated water conditionsAquacultural Engineering 15 181-192
Poon WL CY Hung and DJ Randall 2002 The effect of aquatic hypoxia on fish
Department of Biology and Chemistry City University of Hong Kong KowloonHong Kong SAR China EPA600R-02097
Pichavant K Person-Le-Ruyet J Le Bayou N Severe A Le Roux A andBcouf G 2001 Comparative effects of long-term hypoxia on growth feeding andoxygen consumption in juvenile turbot and European sea bass J Fish Biol 59 875-883 doi10 1111j1095-86492001tb00158x
Randolph KN and HP Clemens 1976 Some factors influencing the feedingbehaviour of channel catfish in culture ponds Transactions of American FisheriesSociety 105 718724
Seymour et al 1992 EA Seymour OI Forsberg and JP Aabel The effect of arious stocking densities low water use and two oxygen levels on production
parameters of adult Atlantic salmon (Salmo salar L) in land-based tanks Report fromRogaland Research RF-19392 (1992) p 36
832019 Unuftp Resaerch Paper 2007
httpslidepdfcomreaderfullunuftp-resaerch-paper-2007 3030
Mallya
Svobodova Z Richard L Jana M and Blanka V 1993 Water quality and fish health EIFAC Technical paper 54
Tanzania Fisheries Division aquaculture section 2006 Aquaculture in Tanzania
Ministry of Natural resources and Tourism Fisheries Division
Timmons MB James ME Fred WW Sreven TS and Brian J V Recirculating
Aquaculture Systems NRAC publication No01-002
Thetmeyer H Waller UBlack KD Inselmann S Rosenthal H 1999 Growth of European sea bass (Dicentrarchus labrax L) under hypoxic and oscillating oxygenconditions Aquaculture 174 355-367
Tom L1998 Nutritional and feeding of fish Kluwer Academic Publishers Secondedition
Tsadik Gagma MN Kutty 1987 Influence of ambient oxygen on feeding and growth
of tilapia Oreochromis niloticus ARAC87WP10United Nation DevelopmentProgramme Food and Agriculture Organization of the United Nations Nigerianinstitute for oceanography and marine research project RAF87009
Ultsch GR H Boschung and MJRoss 1978 Metabolism critical oxygen tensionand habitat selection in darters (Etheostoma) Ecology 5999-107
Verheyen ER Bluse and W Decleir 1994 Metabolic rate hypoxia tolereance andaquatic surface respiration of some lacustrine and riverine African cichlid fishes(Pisces Cichlidae) Comp Biochem Physiol 107A403-411
Wedemeyer GA 1996 Interactions with Water Quality Conditions in Physiology of Fish in Intensive Culture Systems Chapman and Hall New York New York 1996
832019 Unuftp Resaerch Paper 2007
httpslidepdfcomreaderfullunuftp-resaerch-paper-2007 1530
Mallya
UNU-Fisheries Training Programme 15
anaerobic metabolism To reduce energy expenditure under this situation fish moveto water at lower temperature and reduce activity reproduction feeding and proteinsynthesis Transcription is reduced mediated by increased levels of hypoxia-inducingfactor 1 (HIF-1) which also up-regulates genes involved in erythropoiesis capillarygrowth and glucose transport All these responses are directed at maintaining cellular
oxygen homeostasis and reducing energy expenditure thereby augmenting survival of the animal during hypoxia In general the actions of toxicants are exacerbated duringhypoxia through a variety of mechanisms Some species are much more tolerant of hypoxia than others leading to differential survival during extended periods of hypoxia (Poon et al 2002) To avoid this aquaculture systems have to be suppliedwith enough oxygen saturation However too much oxygen is also harmful to fish
242 Fish response to hyperoxia
Hyperoxia is the state of water when it holds a very high amount of oxygen At thisstate water is described as having a dissolved oxygen saturation of greater than 100
This percent can be 140-300
At this water condition oxygen molecules will begin to move around within the watercolumn looking for a little elbowroom If there is non available it will return to theatmosphere or attach to the organisms around (Florida Lake Watch 2004)
If fish are exposed (at a lower atmospheric pressure) to such water their bloodequilibrates with the excess pressure in the water Bubbles form in the blood and thesecan block the capillaries in sub-acute cases the dorsal and caudal fin can be affectedand bubbles may be visible between the fin rays The epidermal tissue distal to theocclusions then becomes necrotic and cases are known where the dorsal fins of trouthave become completely eroded In severe cases death occurs rapidly as a result of blockage of the major arteries and large bubbles are clearly seen between the rays of all the fins The remedy is either to remove the fish to normally equilibrated water orto provide vigorous aeration to strip out the excess gas (Svobodova et al 1993) Insome species such as salmons and fast swimming fishes the swim bladder acts like anoxygen store to be used during the hypoxia When the gads level in the blood is highgases will diffuse from the blood to the bladder When the water is supersaturated(hyperoxia) the bladder becomes over-inflated and this leads to buoyancy problemsespecially in small fishes (Groot et al 1995)
25
Effects of oxygen level on growth and food conversion ratios of fish
Successful fish production depends on good oxygen management Oxygen is essentialto the survival (respiration) of fish to sustain healthy fish and bacteria whichdecompose the waste produced by the fish and to meet the biological oxygen demand(BOD) within culture system Dissolved oxygen levels can affect fish respiration aswell as ammonia and nitrite toxicity When the oxygen level is maintained nearsaturation or even at slightly super saturation at all times it will increase growth ratesreduce the food conversion ratio and increase overall fish production
832019 Unuftp Resaerch Paper 2007
httpslidepdfcomreaderfullunuftp-resaerch-paper-2007 1630
Mallya
UNU-Fisheries Training Programme 16
Figure 3 The effect of oxygen level on growth and food conversion ratios (Linde-gas2007)
251 Effect of oxygen on fish growth
Oxygen is important in respiration and metabolism processes in any animal In fishthe metabolic rate is highly affected by the concentration of oxygen in the rearingenvironment As the dissolved oxygen concentration decreases respiration andfeeding activities also decrease As a result the growth rate is reduced and the
possibility of a disease attack is increased However fish is not able to assimilate thefood consumed when DO is low (Tom 1998)
Overall health and physiological conditions are best if the dissolved oxygen is keptcloser to saturation When the levels are lower than those mentioned above thegrowth of the fish can be highly affected by an increase in stress tissue hypoxia and adecrease in swimming activities and reduction in immunity to diseases
However there is a need to maintain the level of dissolved oxygen at the saturationlevel which will not affect its physiological or metabolic activities so as to have highproduction in any culture system (Wedemeyer 1996) More than that one has to keep
in mind that the oxygen level requirement depends on the species but also on fish sizeand activity of the fish
According to Tom (1998) oxygen requirements per unit weight of fish significantlydecline with increasing individual weight In carp this reduction may be expressed bythe following ratios yearling = 1 two-year-old carp = 05 ndash 07 marketable carp = 03 ndash
04 Significant differences in oxygen demand are also found for different speciesUsing a coefficient of 1 to express the oxygen requirement of common carp thecomparative values for some other species are as follows trout 283 peled 220 pikeperch 176 roach 151 sturgeon 150 perch 146 bream 141 pike 110 eel 083 andtench 083
832019 Unuftp Resaerch Paper 2007
httpslidepdfcomreaderfullunuftp-resaerch-paper-2007 1730
Mallya
UNU-Fisheries Training Programme 17
Several studies have investigated the relationship between oxygen saturation and fishfood intake Randolph and Clemens (1976) found that feeding patterns of channelcatfish varied with temperature and oxygen availability When the oxygen contentdrops below 59 fish starts to lose its appetite Rainbow trout ( Oncorhynchus mykiss)reduced its appetite when oxygen saturation fell below approximately 60 (Jobling
1995) Similar results have been obtained from European sea bass ( Dicentrarchuslabrax L) (Thetmeyer et al 1999) blue tilapia (Oreochromis aureus) (Papoutsoglouand Tziha 1996) channel catfish ( Ictalurus punctatus ) (Buentello et al 2000) juvenileturbot (Pichavant et al 2001) and common carp (Cyprinus carpio L) showedreduced growth when exposed to low oxygen levels
252 Effect of oxygen on the food conversion ratio in fish
Tolerance for low oxygen may relate in part to the metabolic rate of a fish (Verheyen
and Decleir 1994) Fishes will regulate their metabolic rate over a range of dissolvedoxygen concentrations however at some point a further reduction in oxygen tensionwill produce a shift from a metabolic rate that is independent of oxygen concentrationto one that is dependent on oxygen level The point is referred to as the critical oxygentension (Ultsch et al 1978)
Decreased oxygen availability is also considered a major factor in determining foodintake Low dissolved oxygen is a type of stress frequently found in fish farmscharacterised by high fish densities and polluted fresh or marine waters The foodconversion ratio (FCR) is the amount of fish food consumed to generate a givenweight gain It is the ratio between the weights gained in a given period to the totalfeed intake by the fish in the same period It is the inverse of the feed intake The food
conversion ratio is improved (lowered) at higher growth rates (Markore and Rorvik 2001 Crampton et al 2003 Norgarden et al 2003)
The average FCR from several recent studies of fish growth is 097 In most cases theFCR appears to be slightly lower for tank studies (mean 093) than for net-penstudies (mean 102) The industrial average FCR values in Scotland and Chile were128 and 126 respectively (Neuman et al 2004) The best FCR in Scotland was 099while Chilersquos best came in at 11 Kreiberg and Brenton-Davie (1998) report an FCRof 099 for Atlantic salmon in a Sea Systems floating bag An experiment done ontilapia (Oreochromis niloticus) showed that FCR was inversely proportional to thedissolved oxygen level (145 at higher dissolved oxygen level and 675 at lower
dissolved oxygen level) (Tsadik and Kutty 1987)
Bromage et al (2000) showed that halibut are capable of achieving a 11 foodconversion ratio (FCR)
832019 Unuftp Resaerch Paper 2007
httpslidepdfcomreaderfullunuftp-resaerch-paper-2007 1830
Mallya
UNU-Fisheries Training Programme 18
2521 Tilapia (Oreochromis niloticus)
It is well known that tilapia can tolerate hypoxic and even anoxic conditions for shortperiods and are thus better suited than other species to hypereutectic conditions thatmay exist in static water aquaculture systems (Chorn et al 2006) It is also known that
fish found both in the tropics and temperate waters have incipient limiting oxygenlevels which may occur as in hypoxia Incipient limiting levels generally average at
73 mmHg (229 gl at 28 C for warm water fish and 90 mmgl at 617 mgl for coldwater fish such as the salmonids)
In reference to Oreochromis niloticus studies have shown that the incipient oxygenrequirements are between 139 mgl -292mgl
Studies done by Tsadik and Kutty (1987) on the influence of ambient oxygen onfeeding and growth in O niloticus showed that experiments under the various oxygenregimes varied as shown in Figures 3 and 4 below
The increase in mean weight of individual fish during the course of the growth testsfor the high medium and low levels of DO is shown in Figure 3 The fastest rate of growth was at high DO and the slowest growth in the low DO
Figure 4 shows the changes in mean weight of fish under the two tests at high DO andthe two tests at fluctuating DO It is obvious that the difference in the conditions of the two tests at high DO (demand feeder and manual feeding) or at low DO (fish fedwith demand feeder and no supplementary feed) has not made any serious differencein the growth within the sets but the difference in growth of high DO tests andfluctuating DO tests were marked
832019 Unuftp Resaerch Paper 2007
httpslidepdfcomreaderfullunuftp-resaerch-paper-2007 1930
Mallya
UNU-Fisheries Training Programme 19
Figure 4 Weight increase of O niloticus grown under high ambient oxygen (near airsaturation) and under simulated conditions of diel flux in oxygen Data from 2separate sets of experiments (A and B) are indicated Curves drawn through meanvalues (plusmn SD n = 8) indicated (see test) (Source Tsadik and Kutty 1987)
Figure 5 Increase in weight of O niloticus grown under high (near air saturation)medium and low ambient oxygen Mean values (plusmn SD n = 8) are indicated (SourceTsadik and Kutty 1987)
832019 Unuftp Resaerch Paper 2007
httpslidepdfcomreaderfullunuftp-resaerch-paper-2007 2030
Mallya
UNU-Fisheries Training Programme 20
2522 Cat fish culture (Clarias gariepinus) water quality requirements
More than 100 species of the genus Clarias have been described all over the world InTanzania the family Clariidae has only one native species the African catfish Clarias
gariepinus (Burchell 1822) (Synonyms Clarias lazera and Clarias mossambicus)
have recently been introduced in this country
Table 1 Water quality requirements of African catfish
Eggs larvaeearly fry
Advanced fry(Tolerance)
Fingerlingsadults
O280 ndash 100saturation
3 ndash 5 ppm gt3 ppm
Temperature opt 30degC opt 30degC opt 26 ndash 28degC
NH3-N 01 ppm (10 ppm)
NO2-N 05 ppm
NO3-N 100 ppm
Ph 6 ndash 9
CO2-C 6 ppm (10 ndash 15 ppm)
Salinity
10 ppt (15 ndash 16 ppt)
(Source FAO repository paper 2006b)
2523 Oxygen deficiency
African catfish has lung like structures that enable them to breathe air This made itpossible to survive very low oxygen levels in the pond However when Africancatfish is under mixed or polyculture oxygen level is important for the species mixedwith in the pond
832019 Unuftp Resaerch Paper 2007
httpslidepdfcomreaderfullunuftp-resaerch-paper-2007 2130
Mallya
UNU-Fisheries Training Programme 21
3 MATERIALS AND METHODS
31 Study area
The study was conducted at Verid the Holar University College research centre in
Saudarkrokur in January and February 2008
32 Experimental fish
Juvenile halibut was obtained from Frisky hatchery in Akureyri Iceland The fish weretransported from Akureyri to Verid in a tank while oxygen saturation was maintainedat 400 and temperature at 5ordmC The fish were then acclimatised for two weeks under995-106 oxygen saturation and 18pp salinity and 85-10ordmC temperature
At the start of the third week the fish were starved for two days before they wereindividually measured to obtain the initial weight During the measurement the fish
were anasethised using Tricaine methane sulfonate (TMS) used in the ratio of 40-50mg per litre of water 150 fish were individually tagged intraperitoneally with TrovanPassive Transponder tags In total 300 fish were individually tagged The fish werethen distributed into 12 tanks (Figure 2) each with 25 tagged and 25 not tagged fish
33 Experimental design
The fish were exposed to five different levels of oxygen saturation The targetsaturation value in each group was 60 80 100 120 and 140
The system consists of 12 culture tanks three reservoir tanks three aerators which arecombined with low head oxygenator (LHO) and three pumps (Figure 6)
The fish were reared in 7 m3 fibre glass tanks Water was delivered to the tank through PVC pipe and water flow can be adjusted by the valve (See Appendix 1) Thewater level in the tanks was adjusted by varying the height of external stand pipesThe culture tank has a central drainage system at the bottom through which waterflows out to the reservoir tank The water flows from the central drainage passesthrough the wire mesh where the remaining feed pellets were collected and then thewater goes through the PVC pipe back to the reservoir tank
The reservoir tanks are about 460 litres and are made of high density polyethylene(HDPE) From the reservoir tank water from the culture tank mixes with the freshwater from the inlet and is then pumped to the aerator which is combined with a low-head oxygenator (LHO) A pinnacle 75 pump with 055 kWh is plumbed one to eachreservoir tank The pump delivers the water to the aerator from the reservoir tank (Figure 6) The aerator and low head oxygenator (LHO) is a single unit The aeratoradds oxygen to the water and removes carbon dioxide while the LHO adds moreoxygen to the water inside the aerator A fan draws air through the aerator countercurrent to the direction of the water flow in the proportions of 1 volume water to 10volumes air Then the water flows through the LHO column where oxygen gaselevates the oxygen saturation of the water The system can elevate the oxygen
saturation to over 120 air saturation
832019 Unuftp Resaerch Paper 2007
httpslidepdfcomreaderfullunuftp-resaerch-paper-2007 2230
Mallya
UNU-Fisheries Training Programme 22
331 Oxygen levels in the system
In total there were 12 tanks in the system used The target oxygen saturation was60 80 100 120 and 140 (Figure 6) The oxygen saturation in the tanks wasregulated as follows
The system consisted of three tank rows each with four fish tanks (Figure 6) Thefirst row had 60 and 80 oxygen saturation The saturation levels were obtained byinjecting nitrogen gas to the LHO which supplies water to the four tanks to reduce thesaturation from 100 to 60 saturation The nitrogen gas was added from a gas tank through a hose connected to the LHO The amount of the gas injected was regulatedfrom the nitrogen gas tank However in addition to the nitrogen gas oxygen gas wasadded directly to two of the fish tanks in the row to raise the saturation level to 80
The oxygen saturation in the fish tanks in the second row was set at 100-106saturation by injecting oxygen into the LHO
In the third row the oxygen saturation of water from the LHO was increased to 120through injection of oxygen Furthermore oxygen gas was added directly to two tanksto raise the saturation level to 140
The oxygen gas was added through a hose from the oxygen tanks the tail of the hosewas connected to the gas tank while the head was connected to the rectangular wooddiffuser The piece of wood was used to make very small fine air bubbles of oxygengas The small air bubbles are known to increase oxygen transfer by increasing thesurface area for oxygen diffusion Oxygen saturation was measured using (YSI 550)probe while salinity was measured using PAL made in Japan pocket refract meter
832019 Unuftp Resaerch Paper 2007
httpslidepdfcomreaderfullunuftp-resaerch-paper-2007 2330
Mallya
UNU-Fisheries Training Programme 23
Figure 6 The arrangement of the tank system used in the experiment showing theoxygen saturation levels inlet and outlet pipes water pumps food collector plates andaerators
Legend
A= Aerator and Low-head oxygenator
= Reservoir tanks
= Outlets
=Inlets
=Water pump
=Pellet collector plate
=Direction of water
832019 Unuftp Resaerch Paper 2007
httpslidepdfcomreaderfullunuftp-resaerch-paper-2007 2430
Mallya
UNU-Fisheries Training Programme 24
34 Sampling and measurements
The body mass and growth performance were measured every two weeks whileoxygen saturation temperature and salinity were recorded daily
341 Specific growth rate
Weight measurements were taken every two weeks to obtain the specific growth rate(SGR) Prior to measuring the fish were starved for two days Both the individualtagged and untagged fish were weighed Both the initial weight and final weight of the fish were used to calculate the growth performance in terms of SGR
The SGR of individually tagged fish was calculated as follows
SGR = [(ln w 2-ln w 1) (t 2-t 1)] 100
Where w1 and w2 are the initial and final weights of the fish at times t 1 and t 2 respectively
342 Feeding and the collection of leftover feed
The fish were fed manually commercial (Laxa Feed Mill Akureyri) feed pellets (25mm) four times each day Following feeding the remaining pellets were collectedfrom a feed trap on the outflow from each tank and counted The average weight of asample of 100 fresh pellets was 00148 g and based on that it was possible to calculatethe original weight of the remaining pellets (Fr) before they were soaked in water
343 Feed conversion ratio (FCR)
The total amount of feed consumed (CT) was calculated as
CT = Amount of feed fed ndash (number of uneaten pellets x mean weight of pellet)
Feed conversion rate (FCR) indicates how much feed is required for each unit gain inweight
FCR = CT increase in body mass during the same time
832019 Unuftp Resaerch Paper 2007
httpslidepdfcomreaderfullunuftp-resaerch-paper-2007 2530
Mallya
UNU-Fisheries Training Programme 25
4 RESULTS
41 Growth
There was no significant difference in growth rate of the Atlantic halibut reared at
different oxygen saturation levels (Figure 7) during the first period (SGR1) Howeverthere was a significant difference (plt002) in the growth rate of the fish during thesecond period (SGR2) Then the SGR of fish reared at 100 saturation wassignificantly higher than that of fish reared at either 60 or 140 saturation
Figure 7 The graph showing the specific growth rate (SGR) of Atlantic halibut rearedat different oxygen saturation levels
42 Feed conversion ratio (FCR)
There was no significant difference in FCR of fish reared at different oxygen
saturation levels (Figure 8) However the FCR was lowest at 100 and 120saturation
832019 Unuftp Resaerch Paper 2007
httpslidepdfcomreaderfullunuftp-resaerch-paper-2007 2630
Mallya
UNU-Fisheries Training Programme 26
Figure 8 The feed conversion ratios (FCR) of Atlantic halibut reared at differentoxygen saturation levels
5 DISCUSSION
The results of the experiment under different oxygen levels clearly showed thatgrowth is affected by the level of oxygen saturation During the second period theSGR was highest at 100 saturation The best FCR was obtained in the groups withthe highest growth rate although there was no significant difference in FCR of fish
reared at different oxygen saturation levels The growth of other species of fish is alsoaffected by oxygen saturation such as tilapia (Tsadik and Kutty 1987) and Atlanticsalmon (Crampton et al 2003 Seymour et al 1992 Forsberg and Bergheim 1996)The growth of Atlantic halibut and Atlantic salmon increases with increasingsaturation up to 100 saturation However these species appear to be more sensitiveto oxygen saturation than tilapia
6 CONCLUSIONS
The results suggest that oxygen saturation levels affect both growth performance andfeed conversion ratios of Atlantic halibut The maximum growth rate and lowest feedconversion ratio in Atlantic halibut can be attended at higher oxygen saturation levelsbetween 90 and 120 However more research is needed in order to know at whichsaturation point the growth is maximised
Regarding future experimental work the results of this trial should be reconfirmed andgiven more time so that more observations can be made The actual oxygen saturationpoint at which Atlantic halibut has maximum growth should be identified hence moreexperimentation is needed
832019 Unuftp Resaerch Paper 2007
httpslidepdfcomreaderfullunuftp-resaerch-paper-2007 2730
Mallya
UNU-Fisheries Training Programme 27
ACKNOWLEDGEMENTS
I would like to express my gratitude to all the people who were involved and havemade the culmination of this project possible for their kind help
To my supervisor Prof Helgi Thorarensen from Holar University College for hisvaluable guidance and advice I would also like to thank the technical staff atSaudarkrokur Holar University College for giving me the opportunity to use theirinstallations and equipments also for their assistance during the experimental periodI am also grateful to Arnthor Gustavsson and Ingolfur Arnarson from HolarUniversity for their help in the experimental design and weighing the fish which Icould not have managed alone
I am indebted to Dr Tumi Tomasson Director of the UNU-FTP and Mr ThorAsgeirsson Deputy Director and Sigridur Kr Ingvarsdottir for their valuable
assistance care and guidance before and during the project
I would also like to thank my UNU fellows in the aquaculture speciality whoseencouragement enabled me to do the work even when I felt like giving up
I would like to thank my Director Mr Geoffrey Nanyaro at the Tanzanian FisheriesDivision for having given me leave which made it possible to accomplish this study
Last but not least to my family for their great concern and love all the time that Ispent here in Iceland Special thanks are given to my lovely husband for his loveencouragement and concern during the time I was away from home
832019 Unuftp Resaerch Paper 2007
httpslidepdfcomreaderfullunuftp-resaerch-paper-2007 2830
Mallya
UNU-Fisheries Training Programme 28
LIST OF REFERENCES
Balarin JD 1985 National reviews for aquaculture development in Africa 10Uganda FAO FishCirc (77010)109p
Bergheim A Martin G Anders N Per M Holland Per Krogedal and Viv Crampton2005 A newly developed oxygen injection system for cage farms AquaculturalEngineering 34(2006) 40-46
Bjornsson B and Tryggvadottir SV 1996 Effects of size on optimal temperature forgrowth and growth efficiency of immature Atlantic halibut (Hippoglossushippoglossus L) Aquaculture 142 33-42
Boyd CE and Tucker CS 1998 Pond Aquaculture Water Quality Management Kluwer Academic Publishers Boston MA (1998) 700 pp
Bromage N Mazorra C Bruce M Brown N and Shields R 2000 Halibutculture In Stickney RR Editor 2000 Encyclopedia of Aquaculture Wiley NewYork pp 425 ndash 432
Buentello JA Gatlin III DM Neill WH 2000 Effects of water temperature anddissolved oxygen on daily feed consumption feed utilization and growth of channelcatfish (Ictalurus punctatus) Aquaculture 182 339 ndash 352
Chorn E Lim et al 2006 Feeding Practices The Hawthorn Press 547-559
Crampton V A Bergheim M Gausen A Naeligss and P M Hoslashlland (2003) Effect of
low Oxygen on fish performance (wwwewoscom)
FAO 2006a State of world fisheries and Aquaculture FAO report 2006
FAO 2006b Aquaculture Production in Tanzania FAO Fishery StatisticsAquaculture production 2006)
Fisheries Division Tanzania 2007Status of Aquaculture in Tanzania
Florida Lake watch 2004The beginners guide for water management oxygen andtemperature Department of Fisheries and Aquatic Sciences Institute of Food andAgricultural sciences University of Florida Fist edition
Forsberg OI and Bergheim A 1996 The impact of constant and fluctuating oxygenconcentrations and two water consumption rates on post-smolt Atlantic salmonproduction parameters Aquacult Eng 15 (1996) pp 327 ndash 347
Groot C Margolis L and WC Clarke 1995 Physiology Ecology of pacific salmonDepartment of Fisheries and oceans Biological sciences Branch Pacific biologicalstation Nanaimo British Columbia Canada
832019 Unuftp Resaerch Paper 2007
httpslidepdfcomreaderfullunuftp-resaerch-paper-2007 2930
Mallya
UNU-Fisheries Training Programme 29
Groot C Margolis L and Clarke1995 Physiological Ecology of Pacific Salmon Department of Fisheries and oceans Biological sciences Branch Pacific biologicalstation Nanaimo British Columbia Canada
Jobling M 1995 Environmental biology of fishes Chapman and Hall Fish and
fisheries series 16
Kreiberg H Brenton-Davie V 1998 Seawater growth of Atlantic salmon in SEASystemsTM floating bag Aquaculture Update 81 1-2
Linde ndash gas 2007 httpwwwlindegascom [Dec 2006]
Microsoft Encarta1993-2002 wwwkwiccom Respiration in fishes Microsoft incartacopyright 1993-2002 Microsoft Corporation
Morkore T and Rorvik K-A 2001 Seasonal variations in growth feed utilisation
and product quality of farmed Atlantic salmon (Salmo salar L) transferred to seawater as 0+ smolts or 1+ smolts Aquaculture 199 145 ndash 158
Moyle B P and Cech JJJr 2000 Fishes an introduction to Ichthyology Fourth
edition Upper Saddle River NJ 07458
Neuman J Weir M Beattie C 2004 Skretting in the UK and Chile An
opportunity for comparison Skretting Outlook 21 8-11
Nordgarden U Oppedal F Taranger GL Hemre G-I and Hansen T 2003Seasonally changing metabolism in Atlantic salmon (Salmo salar L) Aquac Nutr 9287-289
Papoutsoglou SE and Tziha G 1996 Blue tilapia (Oreochromis aureus) growth ratein relation to dissolved oxygen concentration under recirculated water conditionsAquacultural Engineering 15 181-192
Poon WL CY Hung and DJ Randall 2002 The effect of aquatic hypoxia on fish
Department of Biology and Chemistry City University of Hong Kong KowloonHong Kong SAR China EPA600R-02097
Pichavant K Person-Le-Ruyet J Le Bayou N Severe A Le Roux A andBcouf G 2001 Comparative effects of long-term hypoxia on growth feeding andoxygen consumption in juvenile turbot and European sea bass J Fish Biol 59 875-883 doi10 1111j1095-86492001tb00158x
Randolph KN and HP Clemens 1976 Some factors influencing the feedingbehaviour of channel catfish in culture ponds Transactions of American FisheriesSociety 105 718724
Seymour et al 1992 EA Seymour OI Forsberg and JP Aabel The effect of arious stocking densities low water use and two oxygen levels on production
parameters of adult Atlantic salmon (Salmo salar L) in land-based tanks Report fromRogaland Research RF-19392 (1992) p 36
832019 Unuftp Resaerch Paper 2007
httpslidepdfcomreaderfullunuftp-resaerch-paper-2007 3030
Mallya
Svobodova Z Richard L Jana M and Blanka V 1993 Water quality and fish health EIFAC Technical paper 54
Tanzania Fisheries Division aquaculture section 2006 Aquaculture in Tanzania
Ministry of Natural resources and Tourism Fisheries Division
Timmons MB James ME Fred WW Sreven TS and Brian J V Recirculating
Aquaculture Systems NRAC publication No01-002
Thetmeyer H Waller UBlack KD Inselmann S Rosenthal H 1999 Growth of European sea bass (Dicentrarchus labrax L) under hypoxic and oscillating oxygenconditions Aquaculture 174 355-367
Tom L1998 Nutritional and feeding of fish Kluwer Academic Publishers Secondedition
Tsadik Gagma MN Kutty 1987 Influence of ambient oxygen on feeding and growth
of tilapia Oreochromis niloticus ARAC87WP10United Nation DevelopmentProgramme Food and Agriculture Organization of the United Nations Nigerianinstitute for oceanography and marine research project RAF87009
Ultsch GR H Boschung and MJRoss 1978 Metabolism critical oxygen tensionand habitat selection in darters (Etheostoma) Ecology 5999-107
Verheyen ER Bluse and W Decleir 1994 Metabolic rate hypoxia tolereance andaquatic surface respiration of some lacustrine and riverine African cichlid fishes(Pisces Cichlidae) Comp Biochem Physiol 107A403-411
Wedemeyer GA 1996 Interactions with Water Quality Conditions in Physiology of Fish in Intensive Culture Systems Chapman and Hall New York New York 1996
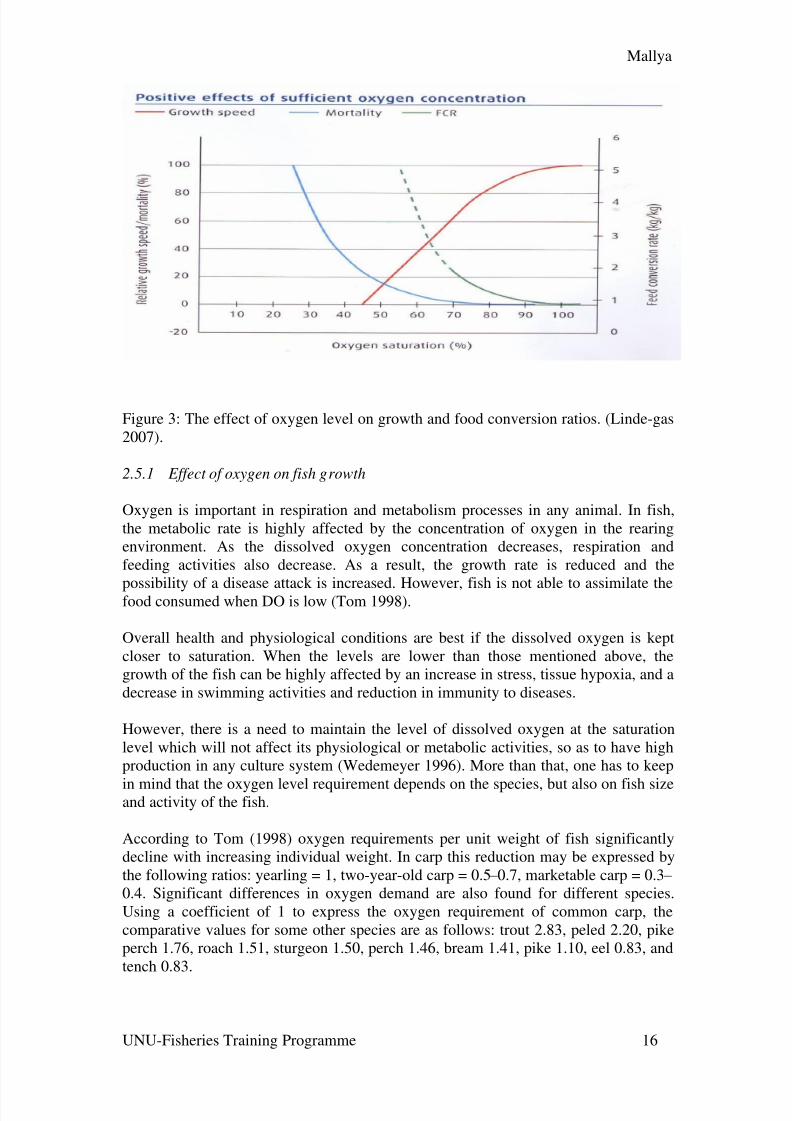
832019 Unuftp Resaerch Paper 2007
httpslidepdfcomreaderfullunuftp-resaerch-paper-2007 1630
Mallya
UNU-Fisheries Training Programme 16
Figure 3 The effect of oxygen level on growth and food conversion ratios (Linde-gas2007)
251 Effect of oxygen on fish growth
Oxygen is important in respiration and metabolism processes in any animal In fishthe metabolic rate is highly affected by the concentration of oxygen in the rearingenvironment As the dissolved oxygen concentration decreases respiration andfeeding activities also decrease As a result the growth rate is reduced and the
possibility of a disease attack is increased However fish is not able to assimilate thefood consumed when DO is low (Tom 1998)
Overall health and physiological conditions are best if the dissolved oxygen is keptcloser to saturation When the levels are lower than those mentioned above thegrowth of the fish can be highly affected by an increase in stress tissue hypoxia and adecrease in swimming activities and reduction in immunity to diseases
However there is a need to maintain the level of dissolved oxygen at the saturationlevel which will not affect its physiological or metabolic activities so as to have highproduction in any culture system (Wedemeyer 1996) More than that one has to keep
in mind that the oxygen level requirement depends on the species but also on fish sizeand activity of the fish
According to Tom (1998) oxygen requirements per unit weight of fish significantlydecline with increasing individual weight In carp this reduction may be expressed bythe following ratios yearling = 1 two-year-old carp = 05 ndash 07 marketable carp = 03 ndash
04 Significant differences in oxygen demand are also found for different speciesUsing a coefficient of 1 to express the oxygen requirement of common carp thecomparative values for some other species are as follows trout 283 peled 220 pikeperch 176 roach 151 sturgeon 150 perch 146 bream 141 pike 110 eel 083 andtench 083
832019 Unuftp Resaerch Paper 2007
httpslidepdfcomreaderfullunuftp-resaerch-paper-2007 1730
Mallya
UNU-Fisheries Training Programme 17
Several studies have investigated the relationship between oxygen saturation and fishfood intake Randolph and Clemens (1976) found that feeding patterns of channelcatfish varied with temperature and oxygen availability When the oxygen contentdrops below 59 fish starts to lose its appetite Rainbow trout ( Oncorhynchus mykiss)reduced its appetite when oxygen saturation fell below approximately 60 (Jobling
1995) Similar results have been obtained from European sea bass ( Dicentrarchuslabrax L) (Thetmeyer et al 1999) blue tilapia (Oreochromis aureus) (Papoutsoglouand Tziha 1996) channel catfish ( Ictalurus punctatus ) (Buentello et al 2000) juvenileturbot (Pichavant et al 2001) and common carp (Cyprinus carpio L) showedreduced growth when exposed to low oxygen levels
252 Effect of oxygen on the food conversion ratio in fish
Tolerance for low oxygen may relate in part to the metabolic rate of a fish (Verheyen
and Decleir 1994) Fishes will regulate their metabolic rate over a range of dissolvedoxygen concentrations however at some point a further reduction in oxygen tensionwill produce a shift from a metabolic rate that is independent of oxygen concentrationto one that is dependent on oxygen level The point is referred to as the critical oxygentension (Ultsch et al 1978)
Decreased oxygen availability is also considered a major factor in determining foodintake Low dissolved oxygen is a type of stress frequently found in fish farmscharacterised by high fish densities and polluted fresh or marine waters The foodconversion ratio (FCR) is the amount of fish food consumed to generate a givenweight gain It is the ratio between the weights gained in a given period to the totalfeed intake by the fish in the same period It is the inverse of the feed intake The food
conversion ratio is improved (lowered) at higher growth rates (Markore and Rorvik 2001 Crampton et al 2003 Norgarden et al 2003)
The average FCR from several recent studies of fish growth is 097 In most cases theFCR appears to be slightly lower for tank studies (mean 093) than for net-penstudies (mean 102) The industrial average FCR values in Scotland and Chile were128 and 126 respectively (Neuman et al 2004) The best FCR in Scotland was 099while Chilersquos best came in at 11 Kreiberg and Brenton-Davie (1998) report an FCRof 099 for Atlantic salmon in a Sea Systems floating bag An experiment done ontilapia (Oreochromis niloticus) showed that FCR was inversely proportional to thedissolved oxygen level (145 at higher dissolved oxygen level and 675 at lower
dissolved oxygen level) (Tsadik and Kutty 1987)
Bromage et al (2000) showed that halibut are capable of achieving a 11 foodconversion ratio (FCR)
832019 Unuftp Resaerch Paper 2007
httpslidepdfcomreaderfullunuftp-resaerch-paper-2007 1830
Mallya
UNU-Fisheries Training Programme 18
2521 Tilapia (Oreochromis niloticus)
It is well known that tilapia can tolerate hypoxic and even anoxic conditions for shortperiods and are thus better suited than other species to hypereutectic conditions thatmay exist in static water aquaculture systems (Chorn et al 2006) It is also known that
fish found both in the tropics and temperate waters have incipient limiting oxygenlevels which may occur as in hypoxia Incipient limiting levels generally average at
73 mmHg (229 gl at 28 C for warm water fish and 90 mmgl at 617 mgl for coldwater fish such as the salmonids)
In reference to Oreochromis niloticus studies have shown that the incipient oxygenrequirements are between 139 mgl -292mgl
Studies done by Tsadik and Kutty (1987) on the influence of ambient oxygen onfeeding and growth in O niloticus showed that experiments under the various oxygenregimes varied as shown in Figures 3 and 4 below
The increase in mean weight of individual fish during the course of the growth testsfor the high medium and low levels of DO is shown in Figure 3 The fastest rate of growth was at high DO and the slowest growth in the low DO
Figure 4 shows the changes in mean weight of fish under the two tests at high DO andthe two tests at fluctuating DO It is obvious that the difference in the conditions of the two tests at high DO (demand feeder and manual feeding) or at low DO (fish fedwith demand feeder and no supplementary feed) has not made any serious differencein the growth within the sets but the difference in growth of high DO tests andfluctuating DO tests were marked
832019 Unuftp Resaerch Paper 2007
httpslidepdfcomreaderfullunuftp-resaerch-paper-2007 1930
Mallya
UNU-Fisheries Training Programme 19
Figure 4 Weight increase of O niloticus grown under high ambient oxygen (near airsaturation) and under simulated conditions of diel flux in oxygen Data from 2separate sets of experiments (A and B) are indicated Curves drawn through meanvalues (plusmn SD n = 8) indicated (see test) (Source Tsadik and Kutty 1987)
Figure 5 Increase in weight of O niloticus grown under high (near air saturation)medium and low ambient oxygen Mean values (plusmn SD n = 8) are indicated (SourceTsadik and Kutty 1987)
832019 Unuftp Resaerch Paper 2007
httpslidepdfcomreaderfullunuftp-resaerch-paper-2007 2030
Mallya
UNU-Fisheries Training Programme 20
2522 Cat fish culture (Clarias gariepinus) water quality requirements
More than 100 species of the genus Clarias have been described all over the world InTanzania the family Clariidae has only one native species the African catfish Clarias
gariepinus (Burchell 1822) (Synonyms Clarias lazera and Clarias mossambicus)
have recently been introduced in this country
Table 1 Water quality requirements of African catfish
Eggs larvaeearly fry
Advanced fry(Tolerance)
Fingerlingsadults
O280 ndash 100saturation
3 ndash 5 ppm gt3 ppm
Temperature opt 30degC opt 30degC opt 26 ndash 28degC
NH3-N 01 ppm (10 ppm)
NO2-N 05 ppm
NO3-N 100 ppm
Ph 6 ndash 9
CO2-C 6 ppm (10 ndash 15 ppm)
Salinity
10 ppt (15 ndash 16 ppt)
(Source FAO repository paper 2006b)
2523 Oxygen deficiency
African catfish has lung like structures that enable them to breathe air This made itpossible to survive very low oxygen levels in the pond However when Africancatfish is under mixed or polyculture oxygen level is important for the species mixedwith in the pond
832019 Unuftp Resaerch Paper 2007
httpslidepdfcomreaderfullunuftp-resaerch-paper-2007 2130
Mallya
UNU-Fisheries Training Programme 21
3 MATERIALS AND METHODS
31 Study area
The study was conducted at Verid the Holar University College research centre in
Saudarkrokur in January and February 2008
32 Experimental fish
Juvenile halibut was obtained from Frisky hatchery in Akureyri Iceland The fish weretransported from Akureyri to Verid in a tank while oxygen saturation was maintainedat 400 and temperature at 5ordmC The fish were then acclimatised for two weeks under995-106 oxygen saturation and 18pp salinity and 85-10ordmC temperature
At the start of the third week the fish were starved for two days before they wereindividually measured to obtain the initial weight During the measurement the fish
were anasethised using Tricaine methane sulfonate (TMS) used in the ratio of 40-50mg per litre of water 150 fish were individually tagged intraperitoneally with TrovanPassive Transponder tags In total 300 fish were individually tagged The fish werethen distributed into 12 tanks (Figure 2) each with 25 tagged and 25 not tagged fish
33 Experimental design
The fish were exposed to five different levels of oxygen saturation The targetsaturation value in each group was 60 80 100 120 and 140
The system consists of 12 culture tanks three reservoir tanks three aerators which arecombined with low head oxygenator (LHO) and three pumps (Figure 6)
The fish were reared in 7 m3 fibre glass tanks Water was delivered to the tank through PVC pipe and water flow can be adjusted by the valve (See Appendix 1) Thewater level in the tanks was adjusted by varying the height of external stand pipesThe culture tank has a central drainage system at the bottom through which waterflows out to the reservoir tank The water flows from the central drainage passesthrough the wire mesh where the remaining feed pellets were collected and then thewater goes through the PVC pipe back to the reservoir tank
The reservoir tanks are about 460 litres and are made of high density polyethylene(HDPE) From the reservoir tank water from the culture tank mixes with the freshwater from the inlet and is then pumped to the aerator which is combined with a low-head oxygenator (LHO) A pinnacle 75 pump with 055 kWh is plumbed one to eachreservoir tank The pump delivers the water to the aerator from the reservoir tank (Figure 6) The aerator and low head oxygenator (LHO) is a single unit The aeratoradds oxygen to the water and removes carbon dioxide while the LHO adds moreoxygen to the water inside the aerator A fan draws air through the aerator countercurrent to the direction of the water flow in the proportions of 1 volume water to 10volumes air Then the water flows through the LHO column where oxygen gaselevates the oxygen saturation of the water The system can elevate the oxygen
saturation to over 120 air saturation
832019 Unuftp Resaerch Paper 2007
httpslidepdfcomreaderfullunuftp-resaerch-paper-2007 2230
Mallya
UNU-Fisheries Training Programme 22
331 Oxygen levels in the system
In total there were 12 tanks in the system used The target oxygen saturation was60 80 100 120 and 140 (Figure 6) The oxygen saturation in the tanks wasregulated as follows
The system consisted of three tank rows each with four fish tanks (Figure 6) Thefirst row had 60 and 80 oxygen saturation The saturation levels were obtained byinjecting nitrogen gas to the LHO which supplies water to the four tanks to reduce thesaturation from 100 to 60 saturation The nitrogen gas was added from a gas tank through a hose connected to the LHO The amount of the gas injected was regulatedfrom the nitrogen gas tank However in addition to the nitrogen gas oxygen gas wasadded directly to two of the fish tanks in the row to raise the saturation level to 80
The oxygen saturation in the fish tanks in the second row was set at 100-106saturation by injecting oxygen into the LHO
In the third row the oxygen saturation of water from the LHO was increased to 120through injection of oxygen Furthermore oxygen gas was added directly to two tanksto raise the saturation level to 140
The oxygen gas was added through a hose from the oxygen tanks the tail of the hosewas connected to the gas tank while the head was connected to the rectangular wooddiffuser The piece of wood was used to make very small fine air bubbles of oxygengas The small air bubbles are known to increase oxygen transfer by increasing thesurface area for oxygen diffusion Oxygen saturation was measured using (YSI 550)probe while salinity was measured using PAL made in Japan pocket refract meter
832019 Unuftp Resaerch Paper 2007
httpslidepdfcomreaderfullunuftp-resaerch-paper-2007 2330
Mallya
UNU-Fisheries Training Programme 23
Figure 6 The arrangement of the tank system used in the experiment showing theoxygen saturation levels inlet and outlet pipes water pumps food collector plates andaerators
Legend
A= Aerator and Low-head oxygenator
= Reservoir tanks
= Outlets
=Inlets
=Water pump
=Pellet collector plate
=Direction of water
832019 Unuftp Resaerch Paper 2007
httpslidepdfcomreaderfullunuftp-resaerch-paper-2007 2430
Mallya
UNU-Fisheries Training Programme 24
34 Sampling and measurements
The body mass and growth performance were measured every two weeks whileoxygen saturation temperature and salinity were recorded daily
341 Specific growth rate
Weight measurements were taken every two weeks to obtain the specific growth rate(SGR) Prior to measuring the fish were starved for two days Both the individualtagged and untagged fish were weighed Both the initial weight and final weight of the fish were used to calculate the growth performance in terms of SGR
The SGR of individually tagged fish was calculated as follows
SGR = [(ln w 2-ln w 1) (t 2-t 1)] 100
Where w1 and w2 are the initial and final weights of the fish at times t 1 and t 2 respectively
342 Feeding and the collection of leftover feed
The fish were fed manually commercial (Laxa Feed Mill Akureyri) feed pellets (25mm) four times each day Following feeding the remaining pellets were collectedfrom a feed trap on the outflow from each tank and counted The average weight of asample of 100 fresh pellets was 00148 g and based on that it was possible to calculatethe original weight of the remaining pellets (Fr) before they were soaked in water
343 Feed conversion ratio (FCR)
The total amount of feed consumed (CT) was calculated as
CT = Amount of feed fed ndash (number of uneaten pellets x mean weight of pellet)
Feed conversion rate (FCR) indicates how much feed is required for each unit gain inweight
FCR = CT increase in body mass during the same time
832019 Unuftp Resaerch Paper 2007
httpslidepdfcomreaderfullunuftp-resaerch-paper-2007 2530
Mallya
UNU-Fisheries Training Programme 25
4 RESULTS
41 Growth
There was no significant difference in growth rate of the Atlantic halibut reared at
different oxygen saturation levels (Figure 7) during the first period (SGR1) Howeverthere was a significant difference (plt002) in the growth rate of the fish during thesecond period (SGR2) Then the SGR of fish reared at 100 saturation wassignificantly higher than that of fish reared at either 60 or 140 saturation
Figure 7 The graph showing the specific growth rate (SGR) of Atlantic halibut rearedat different oxygen saturation levels
42 Feed conversion ratio (FCR)
There was no significant difference in FCR of fish reared at different oxygen
saturation levels (Figure 8) However the FCR was lowest at 100 and 120saturation
832019 Unuftp Resaerch Paper 2007
httpslidepdfcomreaderfullunuftp-resaerch-paper-2007 2630
Mallya
UNU-Fisheries Training Programme 26
Figure 8 The feed conversion ratios (FCR) of Atlantic halibut reared at differentoxygen saturation levels
5 DISCUSSION
The results of the experiment under different oxygen levels clearly showed thatgrowth is affected by the level of oxygen saturation During the second period theSGR was highest at 100 saturation The best FCR was obtained in the groups withthe highest growth rate although there was no significant difference in FCR of fish
reared at different oxygen saturation levels The growth of other species of fish is alsoaffected by oxygen saturation such as tilapia (Tsadik and Kutty 1987) and Atlanticsalmon (Crampton et al 2003 Seymour et al 1992 Forsberg and Bergheim 1996)The growth of Atlantic halibut and Atlantic salmon increases with increasingsaturation up to 100 saturation However these species appear to be more sensitiveto oxygen saturation than tilapia
6 CONCLUSIONS
The results suggest that oxygen saturation levels affect both growth performance andfeed conversion ratios of Atlantic halibut The maximum growth rate and lowest feedconversion ratio in Atlantic halibut can be attended at higher oxygen saturation levelsbetween 90 and 120 However more research is needed in order to know at whichsaturation point the growth is maximised
Regarding future experimental work the results of this trial should be reconfirmed andgiven more time so that more observations can be made The actual oxygen saturationpoint at which Atlantic halibut has maximum growth should be identified hence moreexperimentation is needed
832019 Unuftp Resaerch Paper 2007
httpslidepdfcomreaderfullunuftp-resaerch-paper-2007 2730
Mallya
UNU-Fisheries Training Programme 27
ACKNOWLEDGEMENTS
I would like to express my gratitude to all the people who were involved and havemade the culmination of this project possible for their kind help
To my supervisor Prof Helgi Thorarensen from Holar University College for hisvaluable guidance and advice I would also like to thank the technical staff atSaudarkrokur Holar University College for giving me the opportunity to use theirinstallations and equipments also for their assistance during the experimental periodI am also grateful to Arnthor Gustavsson and Ingolfur Arnarson from HolarUniversity for their help in the experimental design and weighing the fish which Icould not have managed alone
I am indebted to Dr Tumi Tomasson Director of the UNU-FTP and Mr ThorAsgeirsson Deputy Director and Sigridur Kr Ingvarsdottir for their valuable
assistance care and guidance before and during the project
I would also like to thank my UNU fellows in the aquaculture speciality whoseencouragement enabled me to do the work even when I felt like giving up
I would like to thank my Director Mr Geoffrey Nanyaro at the Tanzanian FisheriesDivision for having given me leave which made it possible to accomplish this study
Last but not least to my family for their great concern and love all the time that Ispent here in Iceland Special thanks are given to my lovely husband for his loveencouragement and concern during the time I was away from home
832019 Unuftp Resaerch Paper 2007
httpslidepdfcomreaderfullunuftp-resaerch-paper-2007 2830
Mallya
UNU-Fisheries Training Programme 28
LIST OF REFERENCES
Balarin JD 1985 National reviews for aquaculture development in Africa 10Uganda FAO FishCirc (77010)109p
Bergheim A Martin G Anders N Per M Holland Per Krogedal and Viv Crampton2005 A newly developed oxygen injection system for cage farms AquaculturalEngineering 34(2006) 40-46
Bjornsson B and Tryggvadottir SV 1996 Effects of size on optimal temperature forgrowth and growth efficiency of immature Atlantic halibut (Hippoglossushippoglossus L) Aquaculture 142 33-42
Boyd CE and Tucker CS 1998 Pond Aquaculture Water Quality Management Kluwer Academic Publishers Boston MA (1998) 700 pp
Bromage N Mazorra C Bruce M Brown N and Shields R 2000 Halibutculture In Stickney RR Editor 2000 Encyclopedia of Aquaculture Wiley NewYork pp 425 ndash 432
Buentello JA Gatlin III DM Neill WH 2000 Effects of water temperature anddissolved oxygen on daily feed consumption feed utilization and growth of channelcatfish (Ictalurus punctatus) Aquaculture 182 339 ndash 352
Chorn E Lim et al 2006 Feeding Practices The Hawthorn Press 547-559
Crampton V A Bergheim M Gausen A Naeligss and P M Hoslashlland (2003) Effect of
low Oxygen on fish performance (wwwewoscom)
FAO 2006a State of world fisheries and Aquaculture FAO report 2006
FAO 2006b Aquaculture Production in Tanzania FAO Fishery StatisticsAquaculture production 2006)
Fisheries Division Tanzania 2007Status of Aquaculture in Tanzania
Florida Lake watch 2004The beginners guide for water management oxygen andtemperature Department of Fisheries and Aquatic Sciences Institute of Food andAgricultural sciences University of Florida Fist edition
Forsberg OI and Bergheim A 1996 The impact of constant and fluctuating oxygenconcentrations and two water consumption rates on post-smolt Atlantic salmonproduction parameters Aquacult Eng 15 (1996) pp 327 ndash 347
Groot C Margolis L and WC Clarke 1995 Physiology Ecology of pacific salmonDepartment of Fisheries and oceans Biological sciences Branch Pacific biologicalstation Nanaimo British Columbia Canada
832019 Unuftp Resaerch Paper 2007
httpslidepdfcomreaderfullunuftp-resaerch-paper-2007 2930
Mallya
UNU-Fisheries Training Programme 29
Groot C Margolis L and Clarke1995 Physiological Ecology of Pacific Salmon Department of Fisheries and oceans Biological sciences Branch Pacific biologicalstation Nanaimo British Columbia Canada
Jobling M 1995 Environmental biology of fishes Chapman and Hall Fish and
fisheries series 16
Kreiberg H Brenton-Davie V 1998 Seawater growth of Atlantic salmon in SEASystemsTM floating bag Aquaculture Update 81 1-2
Linde ndash gas 2007 httpwwwlindegascom [Dec 2006]
Microsoft Encarta1993-2002 wwwkwiccom Respiration in fishes Microsoft incartacopyright 1993-2002 Microsoft Corporation
Morkore T and Rorvik K-A 2001 Seasonal variations in growth feed utilisation
and product quality of farmed Atlantic salmon (Salmo salar L) transferred to seawater as 0+ smolts or 1+ smolts Aquaculture 199 145 ndash 158
Moyle B P and Cech JJJr 2000 Fishes an introduction to Ichthyology Fourth
edition Upper Saddle River NJ 07458
Neuman J Weir M Beattie C 2004 Skretting in the UK and Chile An
opportunity for comparison Skretting Outlook 21 8-11
Nordgarden U Oppedal F Taranger GL Hemre G-I and Hansen T 2003Seasonally changing metabolism in Atlantic salmon (Salmo salar L) Aquac Nutr 9287-289
Papoutsoglou SE and Tziha G 1996 Blue tilapia (Oreochromis aureus) growth ratein relation to dissolved oxygen concentration under recirculated water conditionsAquacultural Engineering 15 181-192
Poon WL CY Hung and DJ Randall 2002 The effect of aquatic hypoxia on fish
Department of Biology and Chemistry City University of Hong Kong KowloonHong Kong SAR China EPA600R-02097
Pichavant K Person-Le-Ruyet J Le Bayou N Severe A Le Roux A andBcouf G 2001 Comparative effects of long-term hypoxia on growth feeding andoxygen consumption in juvenile turbot and European sea bass J Fish Biol 59 875-883 doi10 1111j1095-86492001tb00158x
Randolph KN and HP Clemens 1976 Some factors influencing the feedingbehaviour of channel catfish in culture ponds Transactions of American FisheriesSociety 105 718724
Seymour et al 1992 EA Seymour OI Forsberg and JP Aabel The effect of arious stocking densities low water use and two oxygen levels on production
parameters of adult Atlantic salmon (Salmo salar L) in land-based tanks Report fromRogaland Research RF-19392 (1992) p 36
832019 Unuftp Resaerch Paper 2007
httpslidepdfcomreaderfullunuftp-resaerch-paper-2007 3030
Mallya
Svobodova Z Richard L Jana M and Blanka V 1993 Water quality and fish health EIFAC Technical paper 54
Tanzania Fisheries Division aquaculture section 2006 Aquaculture in Tanzania
Ministry of Natural resources and Tourism Fisheries Division
Timmons MB James ME Fred WW Sreven TS and Brian J V Recirculating
Aquaculture Systems NRAC publication No01-002
Thetmeyer H Waller UBlack KD Inselmann S Rosenthal H 1999 Growth of European sea bass (Dicentrarchus labrax L) under hypoxic and oscillating oxygenconditions Aquaculture 174 355-367
Tom L1998 Nutritional and feeding of fish Kluwer Academic Publishers Secondedition
Tsadik Gagma MN Kutty 1987 Influence of ambient oxygen on feeding and growth
of tilapia Oreochromis niloticus ARAC87WP10United Nation DevelopmentProgramme Food and Agriculture Organization of the United Nations Nigerianinstitute for oceanography and marine research project RAF87009
Ultsch GR H Boschung and MJRoss 1978 Metabolism critical oxygen tensionand habitat selection in darters (Etheostoma) Ecology 5999-107
Verheyen ER Bluse and W Decleir 1994 Metabolic rate hypoxia tolereance andaquatic surface respiration of some lacustrine and riverine African cichlid fishes(Pisces Cichlidae) Comp Biochem Physiol 107A403-411
Wedemeyer GA 1996 Interactions with Water Quality Conditions in Physiology of Fish in Intensive Culture Systems Chapman and Hall New York New York 1996
832019 Unuftp Resaerch Paper 2007
httpslidepdfcomreaderfullunuftp-resaerch-paper-2007 1830
Mallya
UNU-Fisheries Training Programme 18
2521 Tilapia (Oreochromis niloticus)
It is well known that tilapia can tolerate hypoxic and even anoxic conditions for shortperiods and are thus better suited than other species to hypereutectic conditions thatmay exist in static water aquaculture systems (Chorn et al 2006) It is also known that
fish found both in the tropics and temperate waters have incipient limiting oxygenlevels which may occur as in hypoxia Incipient limiting levels generally average at
73 mmHg (229 gl at 28 C for warm water fish and 90 mmgl at 617 mgl for coldwater fish such as the salmonids)
In reference to Oreochromis niloticus studies have shown that the incipient oxygenrequirements are between 139 mgl -292mgl
Studies done by Tsadik and Kutty (1987) on the influence of ambient oxygen onfeeding and growth in O niloticus showed that experiments under the various oxygenregimes varied as shown in Figures 3 and 4 below
The increase in mean weight of individual fish during the course of the growth testsfor the high medium and low levels of DO is shown in Figure 3 The fastest rate of growth was at high DO and the slowest growth in the low DO
Figure 4 shows the changes in mean weight of fish under the two tests at high DO andthe two tests at fluctuating DO It is obvious that the difference in the conditions of the two tests at high DO (demand feeder and manual feeding) or at low DO (fish fedwith demand feeder and no supplementary feed) has not made any serious differencein the growth within the sets but the difference in growth of high DO tests andfluctuating DO tests were marked
832019 Unuftp Resaerch Paper 2007
httpslidepdfcomreaderfullunuftp-resaerch-paper-2007 1930
Mallya
UNU-Fisheries Training Programme 19
Figure 4 Weight increase of O niloticus grown under high ambient oxygen (near airsaturation) and under simulated conditions of diel flux in oxygen Data from 2separate sets of experiments (A and B) are indicated Curves drawn through meanvalues (plusmn SD n = 8) indicated (see test) (Source Tsadik and Kutty 1987)
Figure 5 Increase in weight of O niloticus grown under high (near air saturation)medium and low ambient oxygen Mean values (plusmn SD n = 8) are indicated (SourceTsadik and Kutty 1987)
832019 Unuftp Resaerch Paper 2007
httpslidepdfcomreaderfullunuftp-resaerch-paper-2007 2030
Mallya
UNU-Fisheries Training Programme 20
2522 Cat fish culture (Clarias gariepinus) water quality requirements
More than 100 species of the genus Clarias have been described all over the world InTanzania the family Clariidae has only one native species the African catfish Clarias
gariepinus (Burchell 1822) (Synonyms Clarias lazera and Clarias mossambicus)
have recently been introduced in this country
Table 1 Water quality requirements of African catfish
Eggs larvaeearly fry
Advanced fry(Tolerance)
Fingerlingsadults
O280 ndash 100saturation
3 ndash 5 ppm gt3 ppm
Temperature opt 30degC opt 30degC opt 26 ndash 28degC
NH3-N 01 ppm (10 ppm)
NO2-N 05 ppm
NO3-N 100 ppm
Ph 6 ndash 9
CO2-C 6 ppm (10 ndash 15 ppm)
Salinity
10 ppt (15 ndash 16 ppt)
(Source FAO repository paper 2006b)
2523 Oxygen deficiency
African catfish has lung like structures that enable them to breathe air This made itpossible to survive very low oxygen levels in the pond However when Africancatfish is under mixed or polyculture oxygen level is important for the species mixedwith in the pond
832019 Unuftp Resaerch Paper 2007
httpslidepdfcomreaderfullunuftp-resaerch-paper-2007 2130
Mallya
UNU-Fisheries Training Programme 21
3 MATERIALS AND METHODS
31 Study area
The study was conducted at Verid the Holar University College research centre in
Saudarkrokur in January and February 2008
32 Experimental fish
Juvenile halibut was obtained from Frisky hatchery in Akureyri Iceland The fish weretransported from Akureyri to Verid in a tank while oxygen saturation was maintainedat 400 and temperature at 5ordmC The fish were then acclimatised for two weeks under995-106 oxygen saturation and 18pp salinity and 85-10ordmC temperature
At the start of the third week the fish were starved for two days before they wereindividually measured to obtain the initial weight During the measurement the fish
were anasethised using Tricaine methane sulfonate (TMS) used in the ratio of 40-50mg per litre of water 150 fish were individually tagged intraperitoneally with TrovanPassive Transponder tags In total 300 fish were individually tagged The fish werethen distributed into 12 tanks (Figure 2) each with 25 tagged and 25 not tagged fish
33 Experimental design
The fish were exposed to five different levels of oxygen saturation The targetsaturation value in each group was 60 80 100 120 and 140
The system consists of 12 culture tanks three reservoir tanks three aerators which arecombined with low head oxygenator (LHO) and three pumps (Figure 6)
The fish were reared in 7 m3 fibre glass tanks Water was delivered to the tank through PVC pipe and water flow can be adjusted by the valve (See Appendix 1) Thewater level in the tanks was adjusted by varying the height of external stand pipesThe culture tank has a central drainage system at the bottom through which waterflows out to the reservoir tank The water flows from the central drainage passesthrough the wire mesh where the remaining feed pellets were collected and then thewater goes through the PVC pipe back to the reservoir tank
The reservoir tanks are about 460 litres and are made of high density polyethylene(HDPE) From the reservoir tank water from the culture tank mixes with the freshwater from the inlet and is then pumped to the aerator which is combined with a low-head oxygenator (LHO) A pinnacle 75 pump with 055 kWh is plumbed one to eachreservoir tank The pump delivers the water to the aerator from the reservoir tank (Figure 6) The aerator and low head oxygenator (LHO) is a single unit The aeratoradds oxygen to the water and removes carbon dioxide while the LHO adds moreoxygen to the water inside the aerator A fan draws air through the aerator countercurrent to the direction of the water flow in the proportions of 1 volume water to 10volumes air Then the water flows through the LHO column where oxygen gaselevates the oxygen saturation of the water The system can elevate the oxygen
saturation to over 120 air saturation
832019 Unuftp Resaerch Paper 2007
httpslidepdfcomreaderfullunuftp-resaerch-paper-2007 2230
Mallya
UNU-Fisheries Training Programme 22
331 Oxygen levels in the system
In total there were 12 tanks in the system used The target oxygen saturation was60 80 100 120 and 140 (Figure 6) The oxygen saturation in the tanks wasregulated as follows
The system consisted of three tank rows each with four fish tanks (Figure 6) Thefirst row had 60 and 80 oxygen saturation The saturation levels were obtained byinjecting nitrogen gas to the LHO which supplies water to the four tanks to reduce thesaturation from 100 to 60 saturation The nitrogen gas was added from a gas tank through a hose connected to the LHO The amount of the gas injected was regulatedfrom the nitrogen gas tank However in addition to the nitrogen gas oxygen gas wasadded directly to two of the fish tanks in the row to raise the saturation level to 80
The oxygen saturation in the fish tanks in the second row was set at 100-106saturation by injecting oxygen into the LHO
In the third row the oxygen saturation of water from the LHO was increased to 120through injection of oxygen Furthermore oxygen gas was added directly to two tanksto raise the saturation level to 140
The oxygen gas was added through a hose from the oxygen tanks the tail of the hosewas connected to the gas tank while the head was connected to the rectangular wooddiffuser The piece of wood was used to make very small fine air bubbles of oxygengas The small air bubbles are known to increase oxygen transfer by increasing thesurface area for oxygen diffusion Oxygen saturation was measured using (YSI 550)probe while salinity was measured using PAL made in Japan pocket refract meter
832019 Unuftp Resaerch Paper 2007
httpslidepdfcomreaderfullunuftp-resaerch-paper-2007 2330
Mallya
UNU-Fisheries Training Programme 23
Figure 6 The arrangement of the tank system used in the experiment showing theoxygen saturation levels inlet and outlet pipes water pumps food collector plates andaerators
Legend
A= Aerator and Low-head oxygenator
= Reservoir tanks
= Outlets
=Inlets
=Water pump
=Pellet collector plate
=Direction of water
832019 Unuftp Resaerch Paper 2007
httpslidepdfcomreaderfullunuftp-resaerch-paper-2007 2430
Mallya
UNU-Fisheries Training Programme 24
34 Sampling and measurements
The body mass and growth performance were measured every two weeks whileoxygen saturation temperature and salinity were recorded daily
341 Specific growth rate
Weight measurements were taken every two weeks to obtain the specific growth rate(SGR) Prior to measuring the fish were starved for two days Both the individualtagged and untagged fish were weighed Both the initial weight and final weight of the fish were used to calculate the growth performance in terms of SGR
The SGR of individually tagged fish was calculated as follows
SGR = [(ln w 2-ln w 1) (t 2-t 1)] 100
Where w1 and w2 are the initial and final weights of the fish at times t 1 and t 2 respectively
342 Feeding and the collection of leftover feed
The fish were fed manually commercial (Laxa Feed Mill Akureyri) feed pellets (25mm) four times each day Following feeding the remaining pellets were collectedfrom a feed trap on the outflow from each tank and counted The average weight of asample of 100 fresh pellets was 00148 g and based on that it was possible to calculatethe original weight of the remaining pellets (Fr) before they were soaked in water
343 Feed conversion ratio (FCR)
The total amount of feed consumed (CT) was calculated as
CT = Amount of feed fed ndash (number of uneaten pellets x mean weight of pellet)
Feed conversion rate (FCR) indicates how much feed is required for each unit gain inweight
FCR = CT increase in body mass during the same time
832019 Unuftp Resaerch Paper 2007
httpslidepdfcomreaderfullunuftp-resaerch-paper-2007 2530
Mallya
UNU-Fisheries Training Programme 25
4 RESULTS
41 Growth
There was no significant difference in growth rate of the Atlantic halibut reared at
different oxygen saturation levels (Figure 7) during the first period (SGR1) Howeverthere was a significant difference (plt002) in the growth rate of the fish during thesecond period (SGR2) Then the SGR of fish reared at 100 saturation wassignificantly higher than that of fish reared at either 60 or 140 saturation
Figure 7 The graph showing the specific growth rate (SGR) of Atlantic halibut rearedat different oxygen saturation levels
42 Feed conversion ratio (FCR)
There was no significant difference in FCR of fish reared at different oxygen
saturation levels (Figure 8) However the FCR was lowest at 100 and 120saturation
832019 Unuftp Resaerch Paper 2007
httpslidepdfcomreaderfullunuftp-resaerch-paper-2007 2630
Mallya
UNU-Fisheries Training Programme 26
Figure 8 The feed conversion ratios (FCR) of Atlantic halibut reared at differentoxygen saturation levels
5 DISCUSSION
The results of the experiment under different oxygen levels clearly showed thatgrowth is affected by the level of oxygen saturation During the second period theSGR was highest at 100 saturation The best FCR was obtained in the groups withthe highest growth rate although there was no significant difference in FCR of fish
reared at different oxygen saturation levels The growth of other species of fish is alsoaffected by oxygen saturation such as tilapia (Tsadik and Kutty 1987) and Atlanticsalmon (Crampton et al 2003 Seymour et al 1992 Forsberg and Bergheim 1996)The growth of Atlantic halibut and Atlantic salmon increases with increasingsaturation up to 100 saturation However these species appear to be more sensitiveto oxygen saturation than tilapia
6 CONCLUSIONS
The results suggest that oxygen saturation levels affect both growth performance andfeed conversion ratios of Atlantic halibut The maximum growth rate and lowest feedconversion ratio in Atlantic halibut can be attended at higher oxygen saturation levelsbetween 90 and 120 However more research is needed in order to know at whichsaturation point the growth is maximised
Regarding future experimental work the results of this trial should be reconfirmed andgiven more time so that more observations can be made The actual oxygen saturationpoint at which Atlantic halibut has maximum growth should be identified hence moreexperimentation is needed
832019 Unuftp Resaerch Paper 2007
httpslidepdfcomreaderfullunuftp-resaerch-paper-2007 2730
Mallya
UNU-Fisheries Training Programme 27
ACKNOWLEDGEMENTS
I would like to express my gratitude to all the people who were involved and havemade the culmination of this project possible for their kind help
To my supervisor Prof Helgi Thorarensen from Holar University College for hisvaluable guidance and advice I would also like to thank the technical staff atSaudarkrokur Holar University College for giving me the opportunity to use theirinstallations and equipments also for their assistance during the experimental periodI am also grateful to Arnthor Gustavsson and Ingolfur Arnarson from HolarUniversity for their help in the experimental design and weighing the fish which Icould not have managed alone
I am indebted to Dr Tumi Tomasson Director of the UNU-FTP and Mr ThorAsgeirsson Deputy Director and Sigridur Kr Ingvarsdottir for their valuable
assistance care and guidance before and during the project
I would also like to thank my UNU fellows in the aquaculture speciality whoseencouragement enabled me to do the work even when I felt like giving up
I would like to thank my Director Mr Geoffrey Nanyaro at the Tanzanian FisheriesDivision for having given me leave which made it possible to accomplish this study
Last but not least to my family for their great concern and love all the time that Ispent here in Iceland Special thanks are given to my lovely husband for his loveencouragement and concern during the time I was away from home
832019 Unuftp Resaerch Paper 2007
httpslidepdfcomreaderfullunuftp-resaerch-paper-2007 2830
Mallya
UNU-Fisheries Training Programme 28
LIST OF REFERENCES
Balarin JD 1985 National reviews for aquaculture development in Africa 10Uganda FAO FishCirc (77010)109p
Bergheim A Martin G Anders N Per M Holland Per Krogedal and Viv Crampton2005 A newly developed oxygen injection system for cage farms AquaculturalEngineering 34(2006) 40-46
Bjornsson B and Tryggvadottir SV 1996 Effects of size on optimal temperature forgrowth and growth efficiency of immature Atlantic halibut (Hippoglossushippoglossus L) Aquaculture 142 33-42
Boyd CE and Tucker CS 1998 Pond Aquaculture Water Quality Management Kluwer Academic Publishers Boston MA (1998) 700 pp
Bromage N Mazorra C Bruce M Brown N and Shields R 2000 Halibutculture In Stickney RR Editor 2000 Encyclopedia of Aquaculture Wiley NewYork pp 425 ndash 432
Buentello JA Gatlin III DM Neill WH 2000 Effects of water temperature anddissolved oxygen on daily feed consumption feed utilization and growth of channelcatfish (Ictalurus punctatus) Aquaculture 182 339 ndash 352
Chorn E Lim et al 2006 Feeding Practices The Hawthorn Press 547-559
Crampton V A Bergheim M Gausen A Naeligss and P M Hoslashlland (2003) Effect of
low Oxygen on fish performance (wwwewoscom)
FAO 2006a State of world fisheries and Aquaculture FAO report 2006
FAO 2006b Aquaculture Production in Tanzania FAO Fishery StatisticsAquaculture production 2006)
Fisheries Division Tanzania 2007Status of Aquaculture in Tanzania
Florida Lake watch 2004The beginners guide for water management oxygen andtemperature Department of Fisheries and Aquatic Sciences Institute of Food andAgricultural sciences University of Florida Fist edition
Forsberg OI and Bergheim A 1996 The impact of constant and fluctuating oxygenconcentrations and two water consumption rates on post-smolt Atlantic salmonproduction parameters Aquacult Eng 15 (1996) pp 327 ndash 347
Groot C Margolis L and WC Clarke 1995 Physiology Ecology of pacific salmonDepartment of Fisheries and oceans Biological sciences Branch Pacific biologicalstation Nanaimo British Columbia Canada
832019 Unuftp Resaerch Paper 2007
httpslidepdfcomreaderfullunuftp-resaerch-paper-2007 2930
Mallya
UNU-Fisheries Training Programme 29
Groot C Margolis L and Clarke1995 Physiological Ecology of Pacific Salmon Department of Fisheries and oceans Biological sciences Branch Pacific biologicalstation Nanaimo British Columbia Canada
Jobling M 1995 Environmental biology of fishes Chapman and Hall Fish and
fisheries series 16
Kreiberg H Brenton-Davie V 1998 Seawater growth of Atlantic salmon in SEASystemsTM floating bag Aquaculture Update 81 1-2
Linde ndash gas 2007 httpwwwlindegascom [Dec 2006]
Microsoft Encarta1993-2002 wwwkwiccom Respiration in fishes Microsoft incartacopyright 1993-2002 Microsoft Corporation
Morkore T and Rorvik K-A 2001 Seasonal variations in growth feed utilisation
and product quality of farmed Atlantic salmon (Salmo salar L) transferred to seawater as 0+ smolts or 1+ smolts Aquaculture 199 145 ndash 158
Moyle B P and Cech JJJr 2000 Fishes an introduction to Ichthyology Fourth
edition Upper Saddle River NJ 07458
Neuman J Weir M Beattie C 2004 Skretting in the UK and Chile An
opportunity for comparison Skretting Outlook 21 8-11
Nordgarden U Oppedal F Taranger GL Hemre G-I and Hansen T 2003Seasonally changing metabolism in Atlantic salmon (Salmo salar L) Aquac Nutr 9287-289
Papoutsoglou SE and Tziha G 1996 Blue tilapia (Oreochromis aureus) growth ratein relation to dissolved oxygen concentration under recirculated water conditionsAquacultural Engineering 15 181-192
Poon WL CY Hung and DJ Randall 2002 The effect of aquatic hypoxia on fish
Department of Biology and Chemistry City University of Hong Kong KowloonHong Kong SAR China EPA600R-02097
Pichavant K Person-Le-Ruyet J Le Bayou N Severe A Le Roux A andBcouf G 2001 Comparative effects of long-term hypoxia on growth feeding andoxygen consumption in juvenile turbot and European sea bass J Fish Biol 59 875-883 doi10 1111j1095-86492001tb00158x
Randolph KN and HP Clemens 1976 Some factors influencing the feedingbehaviour of channel catfish in culture ponds Transactions of American FisheriesSociety 105 718724
Seymour et al 1992 EA Seymour OI Forsberg and JP Aabel The effect of arious stocking densities low water use and two oxygen levels on production
parameters of adult Atlantic salmon (Salmo salar L) in land-based tanks Report fromRogaland Research RF-19392 (1992) p 36
832019 Unuftp Resaerch Paper 2007
httpslidepdfcomreaderfullunuftp-resaerch-paper-2007 3030
Mallya
Svobodova Z Richard L Jana M and Blanka V 1993 Water quality and fish health EIFAC Technical paper 54
Tanzania Fisheries Division aquaculture section 2006 Aquaculture in Tanzania
Ministry of Natural resources and Tourism Fisheries Division
Timmons MB James ME Fred WW Sreven TS and Brian J V Recirculating
Aquaculture Systems NRAC publication No01-002
Thetmeyer H Waller UBlack KD Inselmann S Rosenthal H 1999 Growth of European sea bass (Dicentrarchus labrax L) under hypoxic and oscillating oxygenconditions Aquaculture 174 355-367
Tom L1998 Nutritional and feeding of fish Kluwer Academic Publishers Secondedition
Tsadik Gagma MN Kutty 1987 Influence of ambient oxygen on feeding and growth
of tilapia Oreochromis niloticus ARAC87WP10United Nation DevelopmentProgramme Food and Agriculture Organization of the United Nations Nigerianinstitute for oceanography and marine research project RAF87009
Ultsch GR H Boschung and MJRoss 1978 Metabolism critical oxygen tensionand habitat selection in darters (Etheostoma) Ecology 5999-107
Verheyen ER Bluse and W Decleir 1994 Metabolic rate hypoxia tolereance andaquatic surface respiration of some lacustrine and riverine African cichlid fishes(Pisces Cichlidae) Comp Biochem Physiol 107A403-411
Wedemeyer GA 1996 Interactions with Water Quality Conditions in Physiology of Fish in Intensive Culture Systems Chapman and Hall New York New York 1996
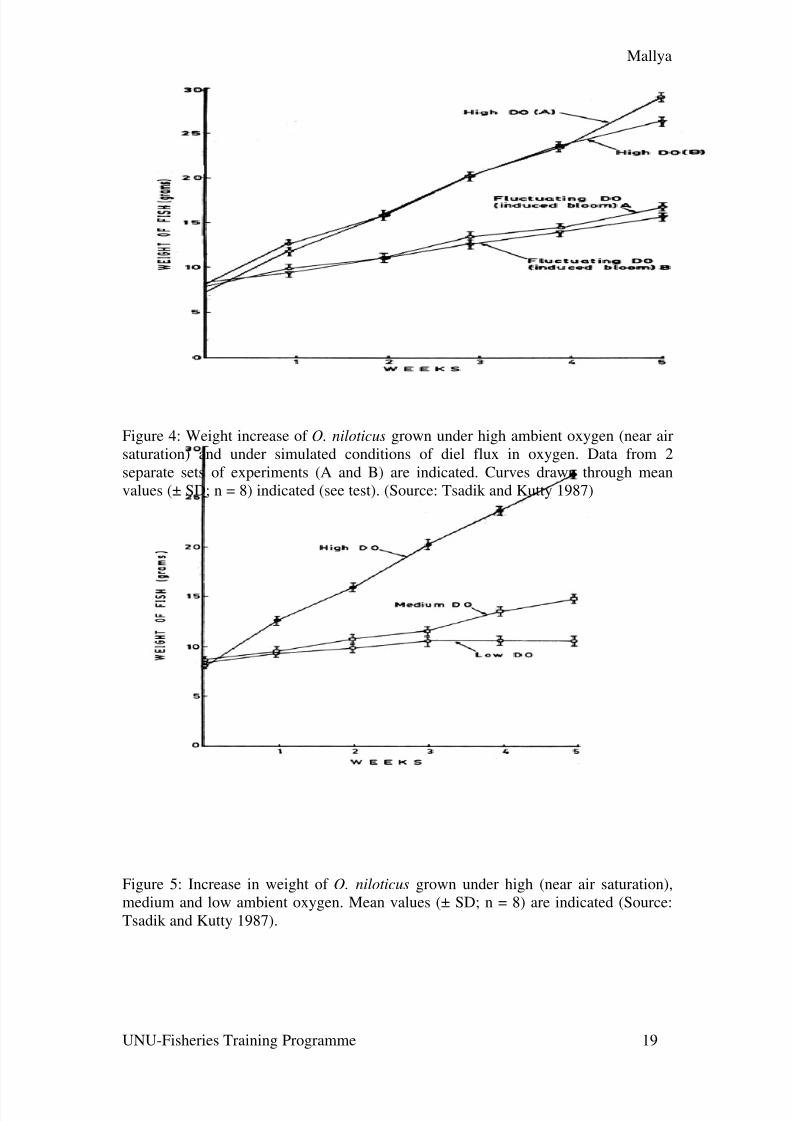
832019 Unuftp Resaerch Paper 2007
httpslidepdfcomreaderfullunuftp-resaerch-paper-2007 1930
Mallya
UNU-Fisheries Training Programme 19
Figure 4 Weight increase of O niloticus grown under high ambient oxygen (near airsaturation) and under simulated conditions of diel flux in oxygen Data from 2separate sets of experiments (A and B) are indicated Curves drawn through meanvalues (plusmn SD n = 8) indicated (see test) (Source Tsadik and Kutty 1987)
Figure 5 Increase in weight of O niloticus grown under high (near air saturation)medium and low ambient oxygen Mean values (plusmn SD n = 8) are indicated (SourceTsadik and Kutty 1987)
832019 Unuftp Resaerch Paper 2007
httpslidepdfcomreaderfullunuftp-resaerch-paper-2007 2030
Mallya
UNU-Fisheries Training Programme 20
2522 Cat fish culture (Clarias gariepinus) water quality requirements
More than 100 species of the genus Clarias have been described all over the world InTanzania the family Clariidae has only one native species the African catfish Clarias
gariepinus (Burchell 1822) (Synonyms Clarias lazera and Clarias mossambicus)
have recently been introduced in this country
Table 1 Water quality requirements of African catfish
Eggs larvaeearly fry
Advanced fry(Tolerance)
Fingerlingsadults
O280 ndash 100saturation
3 ndash 5 ppm gt3 ppm
Temperature opt 30degC opt 30degC opt 26 ndash 28degC
NH3-N 01 ppm (10 ppm)
NO2-N 05 ppm
NO3-N 100 ppm
Ph 6 ndash 9
CO2-C 6 ppm (10 ndash 15 ppm)
Salinity
10 ppt (15 ndash 16 ppt)
(Source FAO repository paper 2006b)
2523 Oxygen deficiency
African catfish has lung like structures that enable them to breathe air This made itpossible to survive very low oxygen levels in the pond However when Africancatfish is under mixed or polyculture oxygen level is important for the species mixedwith in the pond
832019 Unuftp Resaerch Paper 2007
httpslidepdfcomreaderfullunuftp-resaerch-paper-2007 2130
Mallya
UNU-Fisheries Training Programme 21
3 MATERIALS AND METHODS
31 Study area
The study was conducted at Verid the Holar University College research centre in
Saudarkrokur in January and February 2008
32 Experimental fish
Juvenile halibut was obtained from Frisky hatchery in Akureyri Iceland The fish weretransported from Akureyri to Verid in a tank while oxygen saturation was maintainedat 400 and temperature at 5ordmC The fish were then acclimatised for two weeks under995-106 oxygen saturation and 18pp salinity and 85-10ordmC temperature
At the start of the third week the fish were starved for two days before they wereindividually measured to obtain the initial weight During the measurement the fish
were anasethised using Tricaine methane sulfonate (TMS) used in the ratio of 40-50mg per litre of water 150 fish were individually tagged intraperitoneally with TrovanPassive Transponder tags In total 300 fish were individually tagged The fish werethen distributed into 12 tanks (Figure 2) each with 25 tagged and 25 not tagged fish
33 Experimental design
The fish were exposed to five different levels of oxygen saturation The targetsaturation value in each group was 60 80 100 120 and 140
The system consists of 12 culture tanks three reservoir tanks three aerators which arecombined with low head oxygenator (LHO) and three pumps (Figure 6)
The fish were reared in 7 m3 fibre glass tanks Water was delivered to the tank through PVC pipe and water flow can be adjusted by the valve (See Appendix 1) Thewater level in the tanks was adjusted by varying the height of external stand pipesThe culture tank has a central drainage system at the bottom through which waterflows out to the reservoir tank The water flows from the central drainage passesthrough the wire mesh where the remaining feed pellets were collected and then thewater goes through the PVC pipe back to the reservoir tank
The reservoir tanks are about 460 litres and are made of high density polyethylene(HDPE) From the reservoir tank water from the culture tank mixes with the freshwater from the inlet and is then pumped to the aerator which is combined with a low-head oxygenator (LHO) A pinnacle 75 pump with 055 kWh is plumbed one to eachreservoir tank The pump delivers the water to the aerator from the reservoir tank (Figure 6) The aerator and low head oxygenator (LHO) is a single unit The aeratoradds oxygen to the water and removes carbon dioxide while the LHO adds moreoxygen to the water inside the aerator A fan draws air through the aerator countercurrent to the direction of the water flow in the proportions of 1 volume water to 10volumes air Then the water flows through the LHO column where oxygen gaselevates the oxygen saturation of the water The system can elevate the oxygen
saturation to over 120 air saturation
832019 Unuftp Resaerch Paper 2007
httpslidepdfcomreaderfullunuftp-resaerch-paper-2007 2230
Mallya
UNU-Fisheries Training Programme 22
331 Oxygen levels in the system
In total there were 12 tanks in the system used The target oxygen saturation was60 80 100 120 and 140 (Figure 6) The oxygen saturation in the tanks wasregulated as follows
The system consisted of three tank rows each with four fish tanks (Figure 6) Thefirst row had 60 and 80 oxygen saturation The saturation levels were obtained byinjecting nitrogen gas to the LHO which supplies water to the four tanks to reduce thesaturation from 100 to 60 saturation The nitrogen gas was added from a gas tank through a hose connected to the LHO The amount of the gas injected was regulatedfrom the nitrogen gas tank However in addition to the nitrogen gas oxygen gas wasadded directly to two of the fish tanks in the row to raise the saturation level to 80
The oxygen saturation in the fish tanks in the second row was set at 100-106saturation by injecting oxygen into the LHO
In the third row the oxygen saturation of water from the LHO was increased to 120through injection of oxygen Furthermore oxygen gas was added directly to two tanksto raise the saturation level to 140
The oxygen gas was added through a hose from the oxygen tanks the tail of the hosewas connected to the gas tank while the head was connected to the rectangular wooddiffuser The piece of wood was used to make very small fine air bubbles of oxygengas The small air bubbles are known to increase oxygen transfer by increasing thesurface area for oxygen diffusion Oxygen saturation was measured using (YSI 550)probe while salinity was measured using PAL made in Japan pocket refract meter
832019 Unuftp Resaerch Paper 2007
httpslidepdfcomreaderfullunuftp-resaerch-paper-2007 2330
Mallya
UNU-Fisheries Training Programme 23
Figure 6 The arrangement of the tank system used in the experiment showing theoxygen saturation levels inlet and outlet pipes water pumps food collector plates andaerators
Legend
A= Aerator and Low-head oxygenator
= Reservoir tanks
= Outlets
=Inlets
=Water pump
=Pellet collector plate
=Direction of water
832019 Unuftp Resaerch Paper 2007
httpslidepdfcomreaderfullunuftp-resaerch-paper-2007 2430
Mallya
UNU-Fisheries Training Programme 24
34 Sampling and measurements
The body mass and growth performance were measured every two weeks whileoxygen saturation temperature and salinity were recorded daily
341 Specific growth rate
Weight measurements were taken every two weeks to obtain the specific growth rate(SGR) Prior to measuring the fish were starved for two days Both the individualtagged and untagged fish were weighed Both the initial weight and final weight of the fish were used to calculate the growth performance in terms of SGR
The SGR of individually tagged fish was calculated as follows
SGR = [(ln w 2-ln w 1) (t 2-t 1)] 100
Where w1 and w2 are the initial and final weights of the fish at times t 1 and t 2 respectively
342 Feeding and the collection of leftover feed
The fish were fed manually commercial (Laxa Feed Mill Akureyri) feed pellets (25mm) four times each day Following feeding the remaining pellets were collectedfrom a feed trap on the outflow from each tank and counted The average weight of asample of 100 fresh pellets was 00148 g and based on that it was possible to calculatethe original weight of the remaining pellets (Fr) before they were soaked in water
343 Feed conversion ratio (FCR)
The total amount of feed consumed (CT) was calculated as
CT = Amount of feed fed ndash (number of uneaten pellets x mean weight of pellet)
Feed conversion rate (FCR) indicates how much feed is required for each unit gain inweight
FCR = CT increase in body mass during the same time
832019 Unuftp Resaerch Paper 2007
httpslidepdfcomreaderfullunuftp-resaerch-paper-2007 2530
Mallya
UNU-Fisheries Training Programme 25
4 RESULTS
41 Growth
There was no significant difference in growth rate of the Atlantic halibut reared at
different oxygen saturation levels (Figure 7) during the first period (SGR1) Howeverthere was a significant difference (plt002) in the growth rate of the fish during thesecond period (SGR2) Then the SGR of fish reared at 100 saturation wassignificantly higher than that of fish reared at either 60 or 140 saturation
Figure 7 The graph showing the specific growth rate (SGR) of Atlantic halibut rearedat different oxygen saturation levels
42 Feed conversion ratio (FCR)
There was no significant difference in FCR of fish reared at different oxygen
saturation levels (Figure 8) However the FCR was lowest at 100 and 120saturation
832019 Unuftp Resaerch Paper 2007
httpslidepdfcomreaderfullunuftp-resaerch-paper-2007 2630
Mallya
UNU-Fisheries Training Programme 26
Figure 8 The feed conversion ratios (FCR) of Atlantic halibut reared at differentoxygen saturation levels
5 DISCUSSION
The results of the experiment under different oxygen levels clearly showed thatgrowth is affected by the level of oxygen saturation During the second period theSGR was highest at 100 saturation The best FCR was obtained in the groups withthe highest growth rate although there was no significant difference in FCR of fish
reared at different oxygen saturation levels The growth of other species of fish is alsoaffected by oxygen saturation such as tilapia (Tsadik and Kutty 1987) and Atlanticsalmon (Crampton et al 2003 Seymour et al 1992 Forsberg and Bergheim 1996)The growth of Atlantic halibut and Atlantic salmon increases with increasingsaturation up to 100 saturation However these species appear to be more sensitiveto oxygen saturation than tilapia
6 CONCLUSIONS
The results suggest that oxygen saturation levels affect both growth performance andfeed conversion ratios of Atlantic halibut The maximum growth rate and lowest feedconversion ratio in Atlantic halibut can be attended at higher oxygen saturation levelsbetween 90 and 120 However more research is needed in order to know at whichsaturation point the growth is maximised
Regarding future experimental work the results of this trial should be reconfirmed andgiven more time so that more observations can be made The actual oxygen saturationpoint at which Atlantic halibut has maximum growth should be identified hence moreexperimentation is needed
832019 Unuftp Resaerch Paper 2007
httpslidepdfcomreaderfullunuftp-resaerch-paper-2007 2730
Mallya
UNU-Fisheries Training Programme 27
ACKNOWLEDGEMENTS
I would like to express my gratitude to all the people who were involved and havemade the culmination of this project possible for their kind help
To my supervisor Prof Helgi Thorarensen from Holar University College for hisvaluable guidance and advice I would also like to thank the technical staff atSaudarkrokur Holar University College for giving me the opportunity to use theirinstallations and equipments also for their assistance during the experimental periodI am also grateful to Arnthor Gustavsson and Ingolfur Arnarson from HolarUniversity for their help in the experimental design and weighing the fish which Icould not have managed alone
I am indebted to Dr Tumi Tomasson Director of the UNU-FTP and Mr ThorAsgeirsson Deputy Director and Sigridur Kr Ingvarsdottir for their valuable
assistance care and guidance before and during the project
I would also like to thank my UNU fellows in the aquaculture speciality whoseencouragement enabled me to do the work even when I felt like giving up
I would like to thank my Director Mr Geoffrey Nanyaro at the Tanzanian FisheriesDivision for having given me leave which made it possible to accomplish this study
Last but not least to my family for their great concern and love all the time that Ispent here in Iceland Special thanks are given to my lovely husband for his loveencouragement and concern during the time I was away from home
832019 Unuftp Resaerch Paper 2007
httpslidepdfcomreaderfullunuftp-resaerch-paper-2007 2830
Mallya
UNU-Fisheries Training Programme 28
LIST OF REFERENCES
Balarin JD 1985 National reviews for aquaculture development in Africa 10Uganda FAO FishCirc (77010)109p
Bergheim A Martin G Anders N Per M Holland Per Krogedal and Viv Crampton2005 A newly developed oxygen injection system for cage farms AquaculturalEngineering 34(2006) 40-46
Bjornsson B and Tryggvadottir SV 1996 Effects of size on optimal temperature forgrowth and growth efficiency of immature Atlantic halibut (Hippoglossushippoglossus L) Aquaculture 142 33-42
Boyd CE and Tucker CS 1998 Pond Aquaculture Water Quality Management Kluwer Academic Publishers Boston MA (1998) 700 pp
Bromage N Mazorra C Bruce M Brown N and Shields R 2000 Halibutculture In Stickney RR Editor 2000 Encyclopedia of Aquaculture Wiley NewYork pp 425 ndash 432
Buentello JA Gatlin III DM Neill WH 2000 Effects of water temperature anddissolved oxygen on daily feed consumption feed utilization and growth of channelcatfish (Ictalurus punctatus) Aquaculture 182 339 ndash 352
Chorn E Lim et al 2006 Feeding Practices The Hawthorn Press 547-559
Crampton V A Bergheim M Gausen A Naeligss and P M Hoslashlland (2003) Effect of
low Oxygen on fish performance (wwwewoscom)
FAO 2006a State of world fisheries and Aquaculture FAO report 2006
FAO 2006b Aquaculture Production in Tanzania FAO Fishery StatisticsAquaculture production 2006)
Fisheries Division Tanzania 2007Status of Aquaculture in Tanzania
Florida Lake watch 2004The beginners guide for water management oxygen andtemperature Department of Fisheries and Aquatic Sciences Institute of Food andAgricultural sciences University of Florida Fist edition
Forsberg OI and Bergheim A 1996 The impact of constant and fluctuating oxygenconcentrations and two water consumption rates on post-smolt Atlantic salmonproduction parameters Aquacult Eng 15 (1996) pp 327 ndash 347
Groot C Margolis L and WC Clarke 1995 Physiology Ecology of pacific salmonDepartment of Fisheries and oceans Biological sciences Branch Pacific biologicalstation Nanaimo British Columbia Canada
832019 Unuftp Resaerch Paper 2007
httpslidepdfcomreaderfullunuftp-resaerch-paper-2007 2930
Mallya
UNU-Fisheries Training Programme 29
Groot C Margolis L and Clarke1995 Physiological Ecology of Pacific Salmon Department of Fisheries and oceans Biological sciences Branch Pacific biologicalstation Nanaimo British Columbia Canada
Jobling M 1995 Environmental biology of fishes Chapman and Hall Fish and
fisheries series 16
Kreiberg H Brenton-Davie V 1998 Seawater growth of Atlantic salmon in SEASystemsTM floating bag Aquaculture Update 81 1-2
Linde ndash gas 2007 httpwwwlindegascom [Dec 2006]
Microsoft Encarta1993-2002 wwwkwiccom Respiration in fishes Microsoft incartacopyright 1993-2002 Microsoft Corporation
Morkore T and Rorvik K-A 2001 Seasonal variations in growth feed utilisation
and product quality of farmed Atlantic salmon (Salmo salar L) transferred to seawater as 0+ smolts or 1+ smolts Aquaculture 199 145 ndash 158
Moyle B P and Cech JJJr 2000 Fishes an introduction to Ichthyology Fourth
edition Upper Saddle River NJ 07458
Neuman J Weir M Beattie C 2004 Skretting in the UK and Chile An
opportunity for comparison Skretting Outlook 21 8-11
Nordgarden U Oppedal F Taranger GL Hemre G-I and Hansen T 2003Seasonally changing metabolism in Atlantic salmon (Salmo salar L) Aquac Nutr 9287-289
Papoutsoglou SE and Tziha G 1996 Blue tilapia (Oreochromis aureus) growth ratein relation to dissolved oxygen concentration under recirculated water conditionsAquacultural Engineering 15 181-192
Poon WL CY Hung and DJ Randall 2002 The effect of aquatic hypoxia on fish
Department of Biology and Chemistry City University of Hong Kong KowloonHong Kong SAR China EPA600R-02097
Pichavant K Person-Le-Ruyet J Le Bayou N Severe A Le Roux A andBcouf G 2001 Comparative effects of long-term hypoxia on growth feeding andoxygen consumption in juvenile turbot and European sea bass J Fish Biol 59 875-883 doi10 1111j1095-86492001tb00158x
Randolph KN and HP Clemens 1976 Some factors influencing the feedingbehaviour of channel catfish in culture ponds Transactions of American FisheriesSociety 105 718724
Seymour et al 1992 EA Seymour OI Forsberg and JP Aabel The effect of arious stocking densities low water use and two oxygen levels on production
parameters of adult Atlantic salmon (Salmo salar L) in land-based tanks Report fromRogaland Research RF-19392 (1992) p 36
832019 Unuftp Resaerch Paper 2007
httpslidepdfcomreaderfullunuftp-resaerch-paper-2007 3030
Mallya
Svobodova Z Richard L Jana M and Blanka V 1993 Water quality and fish health EIFAC Technical paper 54
Tanzania Fisheries Division aquaculture section 2006 Aquaculture in Tanzania
Ministry of Natural resources and Tourism Fisheries Division
Timmons MB James ME Fred WW Sreven TS and Brian J V Recirculating
Aquaculture Systems NRAC publication No01-002
Thetmeyer H Waller UBlack KD Inselmann S Rosenthal H 1999 Growth of European sea bass (Dicentrarchus labrax L) under hypoxic and oscillating oxygenconditions Aquaculture 174 355-367
Tom L1998 Nutritional and feeding of fish Kluwer Academic Publishers Secondedition
Tsadik Gagma MN Kutty 1987 Influence of ambient oxygen on feeding and growth
of tilapia Oreochromis niloticus ARAC87WP10United Nation DevelopmentProgramme Food and Agriculture Organization of the United Nations Nigerianinstitute for oceanography and marine research project RAF87009
Ultsch GR H Boschung and MJRoss 1978 Metabolism critical oxygen tensionand habitat selection in darters (Etheostoma) Ecology 5999-107
Verheyen ER Bluse and W Decleir 1994 Metabolic rate hypoxia tolereance andaquatic surface respiration of some lacustrine and riverine African cichlid fishes(Pisces Cichlidae) Comp Biochem Physiol 107A403-411
Wedemeyer GA 1996 Interactions with Water Quality Conditions in Physiology of Fish in Intensive Culture Systems Chapman and Hall New York New York 1996
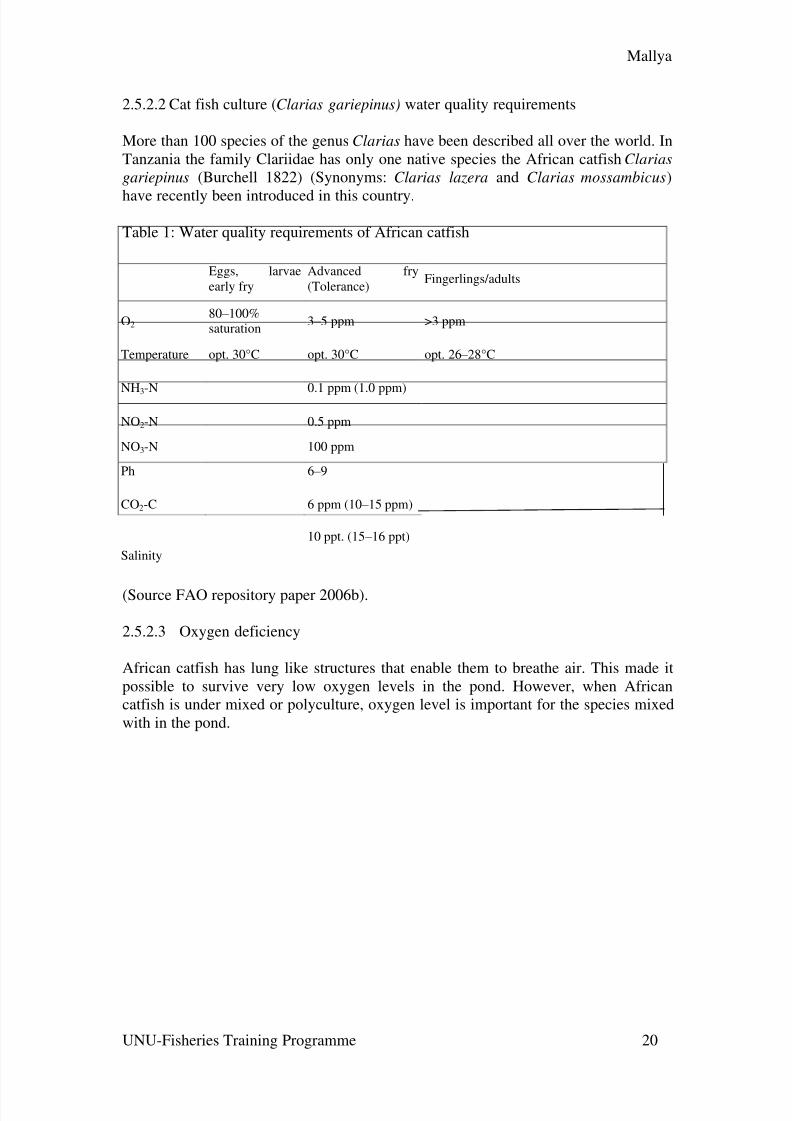
832019 Unuftp Resaerch Paper 2007
httpslidepdfcomreaderfullunuftp-resaerch-paper-2007 2030
Mallya
UNU-Fisheries Training Programme 20
2522 Cat fish culture (Clarias gariepinus) water quality requirements
More than 100 species of the genus Clarias have been described all over the world InTanzania the family Clariidae has only one native species the African catfish Clarias
gariepinus (Burchell 1822) (Synonyms Clarias lazera and Clarias mossambicus)
have recently been introduced in this country
Table 1 Water quality requirements of African catfish
Eggs larvaeearly fry
Advanced fry(Tolerance)
Fingerlingsadults
O280 ndash 100saturation
3 ndash 5 ppm gt3 ppm
Temperature opt 30degC opt 30degC opt 26 ndash 28degC
NH3-N 01 ppm (10 ppm)
NO2-N 05 ppm
NO3-N 100 ppm
Ph 6 ndash 9
CO2-C 6 ppm (10 ndash 15 ppm)
Salinity
10 ppt (15 ndash 16 ppt)
(Source FAO repository paper 2006b)
2523 Oxygen deficiency
African catfish has lung like structures that enable them to breathe air This made itpossible to survive very low oxygen levels in the pond However when Africancatfish is under mixed or polyculture oxygen level is important for the species mixedwith in the pond
832019 Unuftp Resaerch Paper 2007
httpslidepdfcomreaderfullunuftp-resaerch-paper-2007 2130
Mallya
UNU-Fisheries Training Programme 21
3 MATERIALS AND METHODS
31 Study area
The study was conducted at Verid the Holar University College research centre in
Saudarkrokur in January and February 2008
32 Experimental fish
Juvenile halibut was obtained from Frisky hatchery in Akureyri Iceland The fish weretransported from Akureyri to Verid in a tank while oxygen saturation was maintainedat 400 and temperature at 5ordmC The fish were then acclimatised for two weeks under995-106 oxygen saturation and 18pp salinity and 85-10ordmC temperature
At the start of the third week the fish were starved for two days before they wereindividually measured to obtain the initial weight During the measurement the fish
were anasethised using Tricaine methane sulfonate (TMS) used in the ratio of 40-50mg per litre of water 150 fish were individually tagged intraperitoneally with TrovanPassive Transponder tags In total 300 fish were individually tagged The fish werethen distributed into 12 tanks (Figure 2) each with 25 tagged and 25 not tagged fish
33 Experimental design
The fish were exposed to five different levels of oxygen saturation The targetsaturation value in each group was 60 80 100 120 and 140
The system consists of 12 culture tanks three reservoir tanks three aerators which arecombined with low head oxygenator (LHO) and three pumps (Figure 6)
The fish were reared in 7 m3 fibre glass tanks Water was delivered to the tank through PVC pipe and water flow can be adjusted by the valve (See Appendix 1) Thewater level in the tanks was adjusted by varying the height of external stand pipesThe culture tank has a central drainage system at the bottom through which waterflows out to the reservoir tank The water flows from the central drainage passesthrough the wire mesh where the remaining feed pellets were collected and then thewater goes through the PVC pipe back to the reservoir tank
The reservoir tanks are about 460 litres and are made of high density polyethylene(HDPE) From the reservoir tank water from the culture tank mixes with the freshwater from the inlet and is then pumped to the aerator which is combined with a low-head oxygenator (LHO) A pinnacle 75 pump with 055 kWh is plumbed one to eachreservoir tank The pump delivers the water to the aerator from the reservoir tank (Figure 6) The aerator and low head oxygenator (LHO) is a single unit The aeratoradds oxygen to the water and removes carbon dioxide while the LHO adds moreoxygen to the water inside the aerator A fan draws air through the aerator countercurrent to the direction of the water flow in the proportions of 1 volume water to 10volumes air Then the water flows through the LHO column where oxygen gaselevates the oxygen saturation of the water The system can elevate the oxygen
saturation to over 120 air saturation
832019 Unuftp Resaerch Paper 2007
httpslidepdfcomreaderfullunuftp-resaerch-paper-2007 2230
Mallya
UNU-Fisheries Training Programme 22
331 Oxygen levels in the system
In total there were 12 tanks in the system used The target oxygen saturation was60 80 100 120 and 140 (Figure 6) The oxygen saturation in the tanks wasregulated as follows
The system consisted of three tank rows each with four fish tanks (Figure 6) Thefirst row had 60 and 80 oxygen saturation The saturation levels were obtained byinjecting nitrogen gas to the LHO which supplies water to the four tanks to reduce thesaturation from 100 to 60 saturation The nitrogen gas was added from a gas tank through a hose connected to the LHO The amount of the gas injected was regulatedfrom the nitrogen gas tank However in addition to the nitrogen gas oxygen gas wasadded directly to two of the fish tanks in the row to raise the saturation level to 80
The oxygen saturation in the fish tanks in the second row was set at 100-106saturation by injecting oxygen into the LHO
In the third row the oxygen saturation of water from the LHO was increased to 120through injection of oxygen Furthermore oxygen gas was added directly to two tanksto raise the saturation level to 140
The oxygen gas was added through a hose from the oxygen tanks the tail of the hosewas connected to the gas tank while the head was connected to the rectangular wooddiffuser The piece of wood was used to make very small fine air bubbles of oxygengas The small air bubbles are known to increase oxygen transfer by increasing thesurface area for oxygen diffusion Oxygen saturation was measured using (YSI 550)probe while salinity was measured using PAL made in Japan pocket refract meter
832019 Unuftp Resaerch Paper 2007
httpslidepdfcomreaderfullunuftp-resaerch-paper-2007 2330
Mallya
UNU-Fisheries Training Programme 23
Figure 6 The arrangement of the tank system used in the experiment showing theoxygen saturation levels inlet and outlet pipes water pumps food collector plates andaerators
Legend
A= Aerator and Low-head oxygenator
= Reservoir tanks
= Outlets
=Inlets
=Water pump
=Pellet collector plate
=Direction of water
832019 Unuftp Resaerch Paper 2007
httpslidepdfcomreaderfullunuftp-resaerch-paper-2007 2430
Mallya
UNU-Fisheries Training Programme 24
34 Sampling and measurements
The body mass and growth performance were measured every two weeks whileoxygen saturation temperature and salinity were recorded daily
341 Specific growth rate
Weight measurements were taken every two weeks to obtain the specific growth rate(SGR) Prior to measuring the fish were starved for two days Both the individualtagged and untagged fish were weighed Both the initial weight and final weight of the fish were used to calculate the growth performance in terms of SGR
The SGR of individually tagged fish was calculated as follows
SGR = [(ln w 2-ln w 1) (t 2-t 1)] 100
Where w1 and w2 are the initial and final weights of the fish at times t 1 and t 2 respectively
342 Feeding and the collection of leftover feed
The fish were fed manually commercial (Laxa Feed Mill Akureyri) feed pellets (25mm) four times each day Following feeding the remaining pellets were collectedfrom a feed trap on the outflow from each tank and counted The average weight of asample of 100 fresh pellets was 00148 g and based on that it was possible to calculatethe original weight of the remaining pellets (Fr) before they were soaked in water
343 Feed conversion ratio (FCR)
The total amount of feed consumed (CT) was calculated as
CT = Amount of feed fed ndash (number of uneaten pellets x mean weight of pellet)
Feed conversion rate (FCR) indicates how much feed is required for each unit gain inweight
FCR = CT increase in body mass during the same time
832019 Unuftp Resaerch Paper 2007
httpslidepdfcomreaderfullunuftp-resaerch-paper-2007 2530
Mallya
UNU-Fisheries Training Programme 25
4 RESULTS
41 Growth
There was no significant difference in growth rate of the Atlantic halibut reared at
different oxygen saturation levels (Figure 7) during the first period (SGR1) Howeverthere was a significant difference (plt002) in the growth rate of the fish during thesecond period (SGR2) Then the SGR of fish reared at 100 saturation wassignificantly higher than that of fish reared at either 60 or 140 saturation
Figure 7 The graph showing the specific growth rate (SGR) of Atlantic halibut rearedat different oxygen saturation levels
42 Feed conversion ratio (FCR)
There was no significant difference in FCR of fish reared at different oxygen
saturation levels (Figure 8) However the FCR was lowest at 100 and 120saturation
832019 Unuftp Resaerch Paper 2007
httpslidepdfcomreaderfullunuftp-resaerch-paper-2007 2630
Mallya
UNU-Fisheries Training Programme 26
Figure 8 The feed conversion ratios (FCR) of Atlantic halibut reared at differentoxygen saturation levels
5 DISCUSSION
The results of the experiment under different oxygen levels clearly showed thatgrowth is affected by the level of oxygen saturation During the second period theSGR was highest at 100 saturation The best FCR was obtained in the groups withthe highest growth rate although there was no significant difference in FCR of fish
reared at different oxygen saturation levels The growth of other species of fish is alsoaffected by oxygen saturation such as tilapia (Tsadik and Kutty 1987) and Atlanticsalmon (Crampton et al 2003 Seymour et al 1992 Forsberg and Bergheim 1996)The growth of Atlantic halibut and Atlantic salmon increases with increasingsaturation up to 100 saturation However these species appear to be more sensitiveto oxygen saturation than tilapia
6 CONCLUSIONS
The results suggest that oxygen saturation levels affect both growth performance andfeed conversion ratios of Atlantic halibut The maximum growth rate and lowest feedconversion ratio in Atlantic halibut can be attended at higher oxygen saturation levelsbetween 90 and 120 However more research is needed in order to know at whichsaturation point the growth is maximised
Regarding future experimental work the results of this trial should be reconfirmed andgiven more time so that more observations can be made The actual oxygen saturationpoint at which Atlantic halibut has maximum growth should be identified hence moreexperimentation is needed
832019 Unuftp Resaerch Paper 2007
httpslidepdfcomreaderfullunuftp-resaerch-paper-2007 2730
Mallya
UNU-Fisheries Training Programme 27
ACKNOWLEDGEMENTS
I would like to express my gratitude to all the people who were involved and havemade the culmination of this project possible for their kind help
To my supervisor Prof Helgi Thorarensen from Holar University College for hisvaluable guidance and advice I would also like to thank the technical staff atSaudarkrokur Holar University College for giving me the opportunity to use theirinstallations and equipments also for their assistance during the experimental periodI am also grateful to Arnthor Gustavsson and Ingolfur Arnarson from HolarUniversity for their help in the experimental design and weighing the fish which Icould not have managed alone
I am indebted to Dr Tumi Tomasson Director of the UNU-FTP and Mr ThorAsgeirsson Deputy Director and Sigridur Kr Ingvarsdottir for their valuable
assistance care and guidance before and during the project
I would also like to thank my UNU fellows in the aquaculture speciality whoseencouragement enabled me to do the work even when I felt like giving up
I would like to thank my Director Mr Geoffrey Nanyaro at the Tanzanian FisheriesDivision for having given me leave which made it possible to accomplish this study
Last but not least to my family for their great concern and love all the time that Ispent here in Iceland Special thanks are given to my lovely husband for his loveencouragement and concern during the time I was away from home
832019 Unuftp Resaerch Paper 2007
httpslidepdfcomreaderfullunuftp-resaerch-paper-2007 2830
Mallya
UNU-Fisheries Training Programme 28
LIST OF REFERENCES
Balarin JD 1985 National reviews for aquaculture development in Africa 10Uganda FAO FishCirc (77010)109p
Bergheim A Martin G Anders N Per M Holland Per Krogedal and Viv Crampton2005 A newly developed oxygen injection system for cage farms AquaculturalEngineering 34(2006) 40-46
Bjornsson B and Tryggvadottir SV 1996 Effects of size on optimal temperature forgrowth and growth efficiency of immature Atlantic halibut (Hippoglossushippoglossus L) Aquaculture 142 33-42
Boyd CE and Tucker CS 1998 Pond Aquaculture Water Quality Management Kluwer Academic Publishers Boston MA (1998) 700 pp
Bromage N Mazorra C Bruce M Brown N and Shields R 2000 Halibutculture In Stickney RR Editor 2000 Encyclopedia of Aquaculture Wiley NewYork pp 425 ndash 432
Buentello JA Gatlin III DM Neill WH 2000 Effects of water temperature anddissolved oxygen on daily feed consumption feed utilization and growth of channelcatfish (Ictalurus punctatus) Aquaculture 182 339 ndash 352
Chorn E Lim et al 2006 Feeding Practices The Hawthorn Press 547-559
Crampton V A Bergheim M Gausen A Naeligss and P M Hoslashlland (2003) Effect of
low Oxygen on fish performance (wwwewoscom)
FAO 2006a State of world fisheries and Aquaculture FAO report 2006
FAO 2006b Aquaculture Production in Tanzania FAO Fishery StatisticsAquaculture production 2006)
Fisheries Division Tanzania 2007Status of Aquaculture in Tanzania
Florida Lake watch 2004The beginners guide for water management oxygen andtemperature Department of Fisheries and Aquatic Sciences Institute of Food andAgricultural sciences University of Florida Fist edition
Forsberg OI and Bergheim A 1996 The impact of constant and fluctuating oxygenconcentrations and two water consumption rates on post-smolt Atlantic salmonproduction parameters Aquacult Eng 15 (1996) pp 327 ndash 347
Groot C Margolis L and WC Clarke 1995 Physiology Ecology of pacific salmonDepartment of Fisheries and oceans Biological sciences Branch Pacific biologicalstation Nanaimo British Columbia Canada
832019 Unuftp Resaerch Paper 2007
httpslidepdfcomreaderfullunuftp-resaerch-paper-2007 2930
Mallya
UNU-Fisheries Training Programme 29
Groot C Margolis L and Clarke1995 Physiological Ecology of Pacific Salmon Department of Fisheries and oceans Biological sciences Branch Pacific biologicalstation Nanaimo British Columbia Canada
Jobling M 1995 Environmental biology of fishes Chapman and Hall Fish and
fisheries series 16
Kreiberg H Brenton-Davie V 1998 Seawater growth of Atlantic salmon in SEASystemsTM floating bag Aquaculture Update 81 1-2
Linde ndash gas 2007 httpwwwlindegascom [Dec 2006]
Microsoft Encarta1993-2002 wwwkwiccom Respiration in fishes Microsoft incartacopyright 1993-2002 Microsoft Corporation
Morkore T and Rorvik K-A 2001 Seasonal variations in growth feed utilisation
and product quality of farmed Atlantic salmon (Salmo salar L) transferred to seawater as 0+ smolts or 1+ smolts Aquaculture 199 145 ndash 158
Moyle B P and Cech JJJr 2000 Fishes an introduction to Ichthyology Fourth
edition Upper Saddle River NJ 07458
Neuman J Weir M Beattie C 2004 Skretting in the UK and Chile An
opportunity for comparison Skretting Outlook 21 8-11
Nordgarden U Oppedal F Taranger GL Hemre G-I and Hansen T 2003Seasonally changing metabolism in Atlantic salmon (Salmo salar L) Aquac Nutr 9287-289
Papoutsoglou SE and Tziha G 1996 Blue tilapia (Oreochromis aureus) growth ratein relation to dissolved oxygen concentration under recirculated water conditionsAquacultural Engineering 15 181-192
Poon WL CY Hung and DJ Randall 2002 The effect of aquatic hypoxia on fish
Department of Biology and Chemistry City University of Hong Kong KowloonHong Kong SAR China EPA600R-02097
Pichavant K Person-Le-Ruyet J Le Bayou N Severe A Le Roux A andBcouf G 2001 Comparative effects of long-term hypoxia on growth feeding andoxygen consumption in juvenile turbot and European sea bass J Fish Biol 59 875-883 doi10 1111j1095-86492001tb00158x
Randolph KN and HP Clemens 1976 Some factors influencing the feedingbehaviour of channel catfish in culture ponds Transactions of American FisheriesSociety 105 718724
Seymour et al 1992 EA Seymour OI Forsberg and JP Aabel The effect of arious stocking densities low water use and two oxygen levels on production
parameters of adult Atlantic salmon (Salmo salar L) in land-based tanks Report fromRogaland Research RF-19392 (1992) p 36
832019 Unuftp Resaerch Paper 2007
httpslidepdfcomreaderfullunuftp-resaerch-paper-2007 3030
Mallya
Svobodova Z Richard L Jana M and Blanka V 1993 Water quality and fish health EIFAC Technical paper 54
Tanzania Fisheries Division aquaculture section 2006 Aquaculture in Tanzania
Ministry of Natural resources and Tourism Fisheries Division
Timmons MB James ME Fred WW Sreven TS and Brian J V Recirculating
Aquaculture Systems NRAC publication No01-002
Thetmeyer H Waller UBlack KD Inselmann S Rosenthal H 1999 Growth of European sea bass (Dicentrarchus labrax L) under hypoxic and oscillating oxygenconditions Aquaculture 174 355-367
Tom L1998 Nutritional and feeding of fish Kluwer Academic Publishers Secondedition
Tsadik Gagma MN Kutty 1987 Influence of ambient oxygen on feeding and growth
of tilapia Oreochromis niloticus ARAC87WP10United Nation DevelopmentProgramme Food and Agriculture Organization of the United Nations Nigerianinstitute for oceanography and marine research project RAF87009
Ultsch GR H Boschung and MJRoss 1978 Metabolism critical oxygen tensionand habitat selection in darters (Etheostoma) Ecology 5999-107
Verheyen ER Bluse and W Decleir 1994 Metabolic rate hypoxia tolereance andaquatic surface respiration of some lacustrine and riverine African cichlid fishes(Pisces Cichlidae) Comp Biochem Physiol 107A403-411
Wedemeyer GA 1996 Interactions with Water Quality Conditions in Physiology of Fish in Intensive Culture Systems Chapman and Hall New York New York 1996
832019 Unuftp Resaerch Paper 2007
httpslidepdfcomreaderfullunuftp-resaerch-paper-2007 2230
Mallya
UNU-Fisheries Training Programme 22
331 Oxygen levels in the system
In total there were 12 tanks in the system used The target oxygen saturation was60 80 100 120 and 140 (Figure 6) The oxygen saturation in the tanks wasregulated as follows
The system consisted of three tank rows each with four fish tanks (Figure 6) Thefirst row had 60 and 80 oxygen saturation The saturation levels were obtained byinjecting nitrogen gas to the LHO which supplies water to the four tanks to reduce thesaturation from 100 to 60 saturation The nitrogen gas was added from a gas tank through a hose connected to the LHO The amount of the gas injected was regulatedfrom the nitrogen gas tank However in addition to the nitrogen gas oxygen gas wasadded directly to two of the fish tanks in the row to raise the saturation level to 80
The oxygen saturation in the fish tanks in the second row was set at 100-106saturation by injecting oxygen into the LHO
In the third row the oxygen saturation of water from the LHO was increased to 120through injection of oxygen Furthermore oxygen gas was added directly to two tanksto raise the saturation level to 140
The oxygen gas was added through a hose from the oxygen tanks the tail of the hosewas connected to the gas tank while the head was connected to the rectangular wooddiffuser The piece of wood was used to make very small fine air bubbles of oxygengas The small air bubbles are known to increase oxygen transfer by increasing thesurface area for oxygen diffusion Oxygen saturation was measured using (YSI 550)probe while salinity was measured using PAL made in Japan pocket refract meter
832019 Unuftp Resaerch Paper 2007
httpslidepdfcomreaderfullunuftp-resaerch-paper-2007 2330
Mallya
UNU-Fisheries Training Programme 23
Figure 6 The arrangement of the tank system used in the experiment showing theoxygen saturation levels inlet and outlet pipes water pumps food collector plates andaerators
Legend
A= Aerator and Low-head oxygenator
= Reservoir tanks
= Outlets
=Inlets
=Water pump
=Pellet collector plate
=Direction of water
832019 Unuftp Resaerch Paper 2007
httpslidepdfcomreaderfullunuftp-resaerch-paper-2007 2430
Mallya
UNU-Fisheries Training Programme 24
34 Sampling and measurements
The body mass and growth performance were measured every two weeks whileoxygen saturation temperature and salinity were recorded daily
341 Specific growth rate
Weight measurements were taken every two weeks to obtain the specific growth rate(SGR) Prior to measuring the fish were starved for two days Both the individualtagged and untagged fish were weighed Both the initial weight and final weight of the fish were used to calculate the growth performance in terms of SGR
The SGR of individually tagged fish was calculated as follows
SGR = [(ln w 2-ln w 1) (t 2-t 1)] 100
Where w1 and w2 are the initial and final weights of the fish at times t 1 and t 2 respectively
342 Feeding and the collection of leftover feed
The fish were fed manually commercial (Laxa Feed Mill Akureyri) feed pellets (25mm) four times each day Following feeding the remaining pellets were collectedfrom a feed trap on the outflow from each tank and counted The average weight of asample of 100 fresh pellets was 00148 g and based on that it was possible to calculatethe original weight of the remaining pellets (Fr) before they were soaked in water
343 Feed conversion ratio (FCR)
The total amount of feed consumed (CT) was calculated as
CT = Amount of feed fed ndash (number of uneaten pellets x mean weight of pellet)
Feed conversion rate (FCR) indicates how much feed is required for each unit gain inweight
FCR = CT increase in body mass during the same time
832019 Unuftp Resaerch Paper 2007
httpslidepdfcomreaderfullunuftp-resaerch-paper-2007 2530
Mallya
UNU-Fisheries Training Programme 25
4 RESULTS
41 Growth
There was no significant difference in growth rate of the Atlantic halibut reared at
different oxygen saturation levels (Figure 7) during the first period (SGR1) Howeverthere was a significant difference (plt002) in the growth rate of the fish during thesecond period (SGR2) Then the SGR of fish reared at 100 saturation wassignificantly higher than that of fish reared at either 60 or 140 saturation
Figure 7 The graph showing the specific growth rate (SGR) of Atlantic halibut rearedat different oxygen saturation levels
42 Feed conversion ratio (FCR)
There was no significant difference in FCR of fish reared at different oxygen
saturation levels (Figure 8) However the FCR was lowest at 100 and 120saturation
832019 Unuftp Resaerch Paper 2007
httpslidepdfcomreaderfullunuftp-resaerch-paper-2007 2630
Mallya
UNU-Fisheries Training Programme 26
Figure 8 The feed conversion ratios (FCR) of Atlantic halibut reared at differentoxygen saturation levels
5 DISCUSSION
The results of the experiment under different oxygen levels clearly showed thatgrowth is affected by the level of oxygen saturation During the second period theSGR was highest at 100 saturation The best FCR was obtained in the groups withthe highest growth rate although there was no significant difference in FCR of fish
reared at different oxygen saturation levels The growth of other species of fish is alsoaffected by oxygen saturation such as tilapia (Tsadik and Kutty 1987) and Atlanticsalmon (Crampton et al 2003 Seymour et al 1992 Forsberg and Bergheim 1996)The growth of Atlantic halibut and Atlantic salmon increases with increasingsaturation up to 100 saturation However these species appear to be more sensitiveto oxygen saturation than tilapia
6 CONCLUSIONS
The results suggest that oxygen saturation levels affect both growth performance andfeed conversion ratios of Atlantic halibut The maximum growth rate and lowest feedconversion ratio in Atlantic halibut can be attended at higher oxygen saturation levelsbetween 90 and 120 However more research is needed in order to know at whichsaturation point the growth is maximised
Regarding future experimental work the results of this trial should be reconfirmed andgiven more time so that more observations can be made The actual oxygen saturationpoint at which Atlantic halibut has maximum growth should be identified hence moreexperimentation is needed
832019 Unuftp Resaerch Paper 2007
httpslidepdfcomreaderfullunuftp-resaerch-paper-2007 2730
Mallya
UNU-Fisheries Training Programme 27
ACKNOWLEDGEMENTS
I would like to express my gratitude to all the people who were involved and havemade the culmination of this project possible for their kind help
To my supervisor Prof Helgi Thorarensen from Holar University College for hisvaluable guidance and advice I would also like to thank the technical staff atSaudarkrokur Holar University College for giving me the opportunity to use theirinstallations and equipments also for their assistance during the experimental periodI am also grateful to Arnthor Gustavsson and Ingolfur Arnarson from HolarUniversity for their help in the experimental design and weighing the fish which Icould not have managed alone
I am indebted to Dr Tumi Tomasson Director of the UNU-FTP and Mr ThorAsgeirsson Deputy Director and Sigridur Kr Ingvarsdottir for their valuable
assistance care and guidance before and during the project
I would also like to thank my UNU fellows in the aquaculture speciality whoseencouragement enabled me to do the work even when I felt like giving up
I would like to thank my Director Mr Geoffrey Nanyaro at the Tanzanian FisheriesDivision for having given me leave which made it possible to accomplish this study
Last but not least to my family for their great concern and love all the time that Ispent here in Iceland Special thanks are given to my lovely husband for his loveencouragement and concern during the time I was away from home
832019 Unuftp Resaerch Paper 2007
httpslidepdfcomreaderfullunuftp-resaerch-paper-2007 2830
Mallya
UNU-Fisheries Training Programme 28
LIST OF REFERENCES
Balarin JD 1985 National reviews for aquaculture development in Africa 10Uganda FAO FishCirc (77010)109p
Bergheim A Martin G Anders N Per M Holland Per Krogedal and Viv Crampton2005 A newly developed oxygen injection system for cage farms AquaculturalEngineering 34(2006) 40-46
Bjornsson B and Tryggvadottir SV 1996 Effects of size on optimal temperature forgrowth and growth efficiency of immature Atlantic halibut (Hippoglossushippoglossus L) Aquaculture 142 33-42
Boyd CE and Tucker CS 1998 Pond Aquaculture Water Quality Management Kluwer Academic Publishers Boston MA (1998) 700 pp
Bromage N Mazorra C Bruce M Brown N and Shields R 2000 Halibutculture In Stickney RR Editor 2000 Encyclopedia of Aquaculture Wiley NewYork pp 425 ndash 432
Buentello JA Gatlin III DM Neill WH 2000 Effects of water temperature anddissolved oxygen on daily feed consumption feed utilization and growth of channelcatfish (Ictalurus punctatus) Aquaculture 182 339 ndash 352
Chorn E Lim et al 2006 Feeding Practices The Hawthorn Press 547-559
Crampton V A Bergheim M Gausen A Naeligss and P M Hoslashlland (2003) Effect of
low Oxygen on fish performance (wwwewoscom)
FAO 2006a State of world fisheries and Aquaculture FAO report 2006
FAO 2006b Aquaculture Production in Tanzania FAO Fishery StatisticsAquaculture production 2006)
Fisheries Division Tanzania 2007Status of Aquaculture in Tanzania
Florida Lake watch 2004The beginners guide for water management oxygen andtemperature Department of Fisheries and Aquatic Sciences Institute of Food andAgricultural sciences University of Florida Fist edition
Forsberg OI and Bergheim A 1996 The impact of constant and fluctuating oxygenconcentrations and two water consumption rates on post-smolt Atlantic salmonproduction parameters Aquacult Eng 15 (1996) pp 327 ndash 347
Groot C Margolis L and WC Clarke 1995 Physiology Ecology of pacific salmonDepartment of Fisheries and oceans Biological sciences Branch Pacific biologicalstation Nanaimo British Columbia Canada
832019 Unuftp Resaerch Paper 2007
httpslidepdfcomreaderfullunuftp-resaerch-paper-2007 2930
Mallya
UNU-Fisheries Training Programme 29
Groot C Margolis L and Clarke1995 Physiological Ecology of Pacific Salmon Department of Fisheries and oceans Biological sciences Branch Pacific biologicalstation Nanaimo British Columbia Canada
Jobling M 1995 Environmental biology of fishes Chapman and Hall Fish and
fisheries series 16
Kreiberg H Brenton-Davie V 1998 Seawater growth of Atlantic salmon in SEASystemsTM floating bag Aquaculture Update 81 1-2
Linde ndash gas 2007 httpwwwlindegascom [Dec 2006]
Microsoft Encarta1993-2002 wwwkwiccom Respiration in fishes Microsoft incartacopyright 1993-2002 Microsoft Corporation
Morkore T and Rorvik K-A 2001 Seasonal variations in growth feed utilisation
and product quality of farmed Atlantic salmon (Salmo salar L) transferred to seawater as 0+ smolts or 1+ smolts Aquaculture 199 145 ndash 158
Moyle B P and Cech JJJr 2000 Fishes an introduction to Ichthyology Fourth
edition Upper Saddle River NJ 07458
Neuman J Weir M Beattie C 2004 Skretting in the UK and Chile An
opportunity for comparison Skretting Outlook 21 8-11
Nordgarden U Oppedal F Taranger GL Hemre G-I and Hansen T 2003Seasonally changing metabolism in Atlantic salmon (Salmo salar L) Aquac Nutr 9287-289
Papoutsoglou SE and Tziha G 1996 Blue tilapia (Oreochromis aureus) growth ratein relation to dissolved oxygen concentration under recirculated water conditionsAquacultural Engineering 15 181-192
Poon WL CY Hung and DJ Randall 2002 The effect of aquatic hypoxia on fish
Department of Biology and Chemistry City University of Hong Kong KowloonHong Kong SAR China EPA600R-02097
Pichavant K Person-Le-Ruyet J Le Bayou N Severe A Le Roux A andBcouf G 2001 Comparative effects of long-term hypoxia on growth feeding andoxygen consumption in juvenile turbot and European sea bass J Fish Biol 59 875-883 doi10 1111j1095-86492001tb00158x
Randolph KN and HP Clemens 1976 Some factors influencing the feedingbehaviour of channel catfish in culture ponds Transactions of American FisheriesSociety 105 718724
Seymour et al 1992 EA Seymour OI Forsberg and JP Aabel The effect of arious stocking densities low water use and two oxygen levels on production
parameters of adult Atlantic salmon (Salmo salar L) in land-based tanks Report fromRogaland Research RF-19392 (1992) p 36
832019 Unuftp Resaerch Paper 2007
httpslidepdfcomreaderfullunuftp-resaerch-paper-2007 3030
Mallya
Svobodova Z Richard L Jana M and Blanka V 1993 Water quality and fish health EIFAC Technical paper 54
Tanzania Fisheries Division aquaculture section 2006 Aquaculture in Tanzania
Ministry of Natural resources and Tourism Fisheries Division
Timmons MB James ME Fred WW Sreven TS and Brian J V Recirculating
Aquaculture Systems NRAC publication No01-002
Thetmeyer H Waller UBlack KD Inselmann S Rosenthal H 1999 Growth of European sea bass (Dicentrarchus labrax L) under hypoxic and oscillating oxygenconditions Aquaculture 174 355-367
Tom L1998 Nutritional and feeding of fish Kluwer Academic Publishers Secondedition
Tsadik Gagma MN Kutty 1987 Influence of ambient oxygen on feeding and growth
of tilapia Oreochromis niloticus ARAC87WP10United Nation DevelopmentProgramme Food and Agriculture Organization of the United Nations Nigerianinstitute for oceanography and marine research project RAF87009
Ultsch GR H Boschung and MJRoss 1978 Metabolism critical oxygen tensionand habitat selection in darters (Etheostoma) Ecology 5999-107
Verheyen ER Bluse and W Decleir 1994 Metabolic rate hypoxia tolereance andaquatic surface respiration of some lacustrine and riverine African cichlid fishes(Pisces Cichlidae) Comp Biochem Physiol 107A403-411
Wedemeyer GA 1996 Interactions with Water Quality Conditions in Physiology of Fish in Intensive Culture Systems Chapman and Hall New York New York 1996
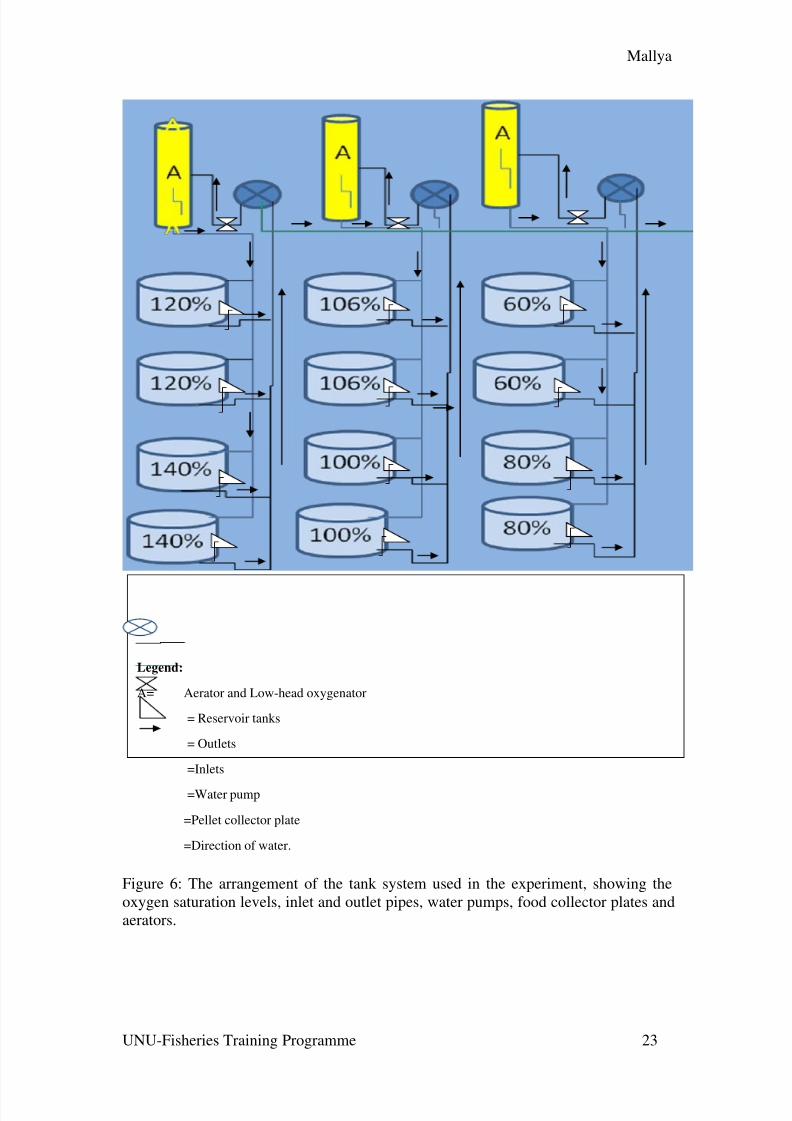
832019 Unuftp Resaerch Paper 2007
httpslidepdfcomreaderfullunuftp-resaerch-paper-2007 2330
Mallya
UNU-Fisheries Training Programme 23
Figure 6 The arrangement of the tank system used in the experiment showing theoxygen saturation levels inlet and outlet pipes water pumps food collector plates andaerators
Legend
A= Aerator and Low-head oxygenator
= Reservoir tanks
= Outlets
=Inlets
=Water pump
=Pellet collector plate
=Direction of water
832019 Unuftp Resaerch Paper 2007
httpslidepdfcomreaderfullunuftp-resaerch-paper-2007 2430
Mallya
UNU-Fisheries Training Programme 24
34 Sampling and measurements
The body mass and growth performance were measured every two weeks whileoxygen saturation temperature and salinity were recorded daily
341 Specific growth rate
Weight measurements were taken every two weeks to obtain the specific growth rate(SGR) Prior to measuring the fish were starved for two days Both the individualtagged and untagged fish were weighed Both the initial weight and final weight of the fish were used to calculate the growth performance in terms of SGR
The SGR of individually tagged fish was calculated as follows
SGR = [(ln w 2-ln w 1) (t 2-t 1)] 100
Where w1 and w2 are the initial and final weights of the fish at times t 1 and t 2 respectively
342 Feeding and the collection of leftover feed
The fish were fed manually commercial (Laxa Feed Mill Akureyri) feed pellets (25mm) four times each day Following feeding the remaining pellets were collectedfrom a feed trap on the outflow from each tank and counted The average weight of asample of 100 fresh pellets was 00148 g and based on that it was possible to calculatethe original weight of the remaining pellets (Fr) before they were soaked in water
343 Feed conversion ratio (FCR)
The total amount of feed consumed (CT) was calculated as
CT = Amount of feed fed ndash (number of uneaten pellets x mean weight of pellet)
Feed conversion rate (FCR) indicates how much feed is required for each unit gain inweight
FCR = CT increase in body mass during the same time
832019 Unuftp Resaerch Paper 2007
httpslidepdfcomreaderfullunuftp-resaerch-paper-2007 2530
Mallya
UNU-Fisheries Training Programme 25
4 RESULTS
41 Growth
There was no significant difference in growth rate of the Atlantic halibut reared at
different oxygen saturation levels (Figure 7) during the first period (SGR1) Howeverthere was a significant difference (plt002) in the growth rate of the fish during thesecond period (SGR2) Then the SGR of fish reared at 100 saturation wassignificantly higher than that of fish reared at either 60 or 140 saturation
Figure 7 The graph showing the specific growth rate (SGR) of Atlantic halibut rearedat different oxygen saturation levels
42 Feed conversion ratio (FCR)
There was no significant difference in FCR of fish reared at different oxygen
saturation levels (Figure 8) However the FCR was lowest at 100 and 120saturation
832019 Unuftp Resaerch Paper 2007
httpslidepdfcomreaderfullunuftp-resaerch-paper-2007 2630
Mallya
UNU-Fisheries Training Programme 26
Figure 8 The feed conversion ratios (FCR) of Atlantic halibut reared at differentoxygen saturation levels
5 DISCUSSION
The results of the experiment under different oxygen levels clearly showed thatgrowth is affected by the level of oxygen saturation During the second period theSGR was highest at 100 saturation The best FCR was obtained in the groups withthe highest growth rate although there was no significant difference in FCR of fish
reared at different oxygen saturation levels The growth of other species of fish is alsoaffected by oxygen saturation such as tilapia (Tsadik and Kutty 1987) and Atlanticsalmon (Crampton et al 2003 Seymour et al 1992 Forsberg and Bergheim 1996)The growth of Atlantic halibut and Atlantic salmon increases with increasingsaturation up to 100 saturation However these species appear to be more sensitiveto oxygen saturation than tilapia
6 CONCLUSIONS
The results suggest that oxygen saturation levels affect both growth performance andfeed conversion ratios of Atlantic halibut The maximum growth rate and lowest feedconversion ratio in Atlantic halibut can be attended at higher oxygen saturation levelsbetween 90 and 120 However more research is needed in order to know at whichsaturation point the growth is maximised
Regarding future experimental work the results of this trial should be reconfirmed andgiven more time so that more observations can be made The actual oxygen saturationpoint at which Atlantic halibut has maximum growth should be identified hence moreexperimentation is needed
832019 Unuftp Resaerch Paper 2007
httpslidepdfcomreaderfullunuftp-resaerch-paper-2007 2730
Mallya
UNU-Fisheries Training Programme 27
ACKNOWLEDGEMENTS
I would like to express my gratitude to all the people who were involved and havemade the culmination of this project possible for their kind help
To my supervisor Prof Helgi Thorarensen from Holar University College for hisvaluable guidance and advice I would also like to thank the technical staff atSaudarkrokur Holar University College for giving me the opportunity to use theirinstallations and equipments also for their assistance during the experimental periodI am also grateful to Arnthor Gustavsson and Ingolfur Arnarson from HolarUniversity for their help in the experimental design and weighing the fish which Icould not have managed alone
I am indebted to Dr Tumi Tomasson Director of the UNU-FTP and Mr ThorAsgeirsson Deputy Director and Sigridur Kr Ingvarsdottir for their valuable
assistance care and guidance before and during the project
I would also like to thank my UNU fellows in the aquaculture speciality whoseencouragement enabled me to do the work even when I felt like giving up
I would like to thank my Director Mr Geoffrey Nanyaro at the Tanzanian FisheriesDivision for having given me leave which made it possible to accomplish this study
Last but not least to my family for their great concern and love all the time that Ispent here in Iceland Special thanks are given to my lovely husband for his loveencouragement and concern during the time I was away from home
832019 Unuftp Resaerch Paper 2007
httpslidepdfcomreaderfullunuftp-resaerch-paper-2007 2830
Mallya
UNU-Fisheries Training Programme 28
LIST OF REFERENCES
Balarin JD 1985 National reviews for aquaculture development in Africa 10Uganda FAO FishCirc (77010)109p
Bergheim A Martin G Anders N Per M Holland Per Krogedal and Viv Crampton2005 A newly developed oxygen injection system for cage farms AquaculturalEngineering 34(2006) 40-46
Bjornsson B and Tryggvadottir SV 1996 Effects of size on optimal temperature forgrowth and growth efficiency of immature Atlantic halibut (Hippoglossushippoglossus L) Aquaculture 142 33-42
Boyd CE and Tucker CS 1998 Pond Aquaculture Water Quality Management Kluwer Academic Publishers Boston MA (1998) 700 pp
Bromage N Mazorra C Bruce M Brown N and Shields R 2000 Halibutculture In Stickney RR Editor 2000 Encyclopedia of Aquaculture Wiley NewYork pp 425 ndash 432
Buentello JA Gatlin III DM Neill WH 2000 Effects of water temperature anddissolved oxygen on daily feed consumption feed utilization and growth of channelcatfish (Ictalurus punctatus) Aquaculture 182 339 ndash 352
Chorn E Lim et al 2006 Feeding Practices The Hawthorn Press 547-559
Crampton V A Bergheim M Gausen A Naeligss and P M Hoslashlland (2003) Effect of
low Oxygen on fish performance (wwwewoscom)
FAO 2006a State of world fisheries and Aquaculture FAO report 2006
FAO 2006b Aquaculture Production in Tanzania FAO Fishery StatisticsAquaculture production 2006)
Fisheries Division Tanzania 2007Status of Aquaculture in Tanzania
Florida Lake watch 2004The beginners guide for water management oxygen andtemperature Department of Fisheries and Aquatic Sciences Institute of Food andAgricultural sciences University of Florida Fist edition
Forsberg OI and Bergheim A 1996 The impact of constant and fluctuating oxygenconcentrations and two water consumption rates on post-smolt Atlantic salmonproduction parameters Aquacult Eng 15 (1996) pp 327 ndash 347
Groot C Margolis L and WC Clarke 1995 Physiology Ecology of pacific salmonDepartment of Fisheries and oceans Biological sciences Branch Pacific biologicalstation Nanaimo British Columbia Canada
832019 Unuftp Resaerch Paper 2007
httpslidepdfcomreaderfullunuftp-resaerch-paper-2007 2930
Mallya
UNU-Fisheries Training Programme 29
Groot C Margolis L and Clarke1995 Physiological Ecology of Pacific Salmon Department of Fisheries and oceans Biological sciences Branch Pacific biologicalstation Nanaimo British Columbia Canada
Jobling M 1995 Environmental biology of fishes Chapman and Hall Fish and
fisheries series 16
Kreiberg H Brenton-Davie V 1998 Seawater growth of Atlantic salmon in SEASystemsTM floating bag Aquaculture Update 81 1-2
Linde ndash gas 2007 httpwwwlindegascom [Dec 2006]
Microsoft Encarta1993-2002 wwwkwiccom Respiration in fishes Microsoft incartacopyright 1993-2002 Microsoft Corporation
Morkore T and Rorvik K-A 2001 Seasonal variations in growth feed utilisation
and product quality of farmed Atlantic salmon (Salmo salar L) transferred to seawater as 0+ smolts or 1+ smolts Aquaculture 199 145 ndash 158
Moyle B P and Cech JJJr 2000 Fishes an introduction to Ichthyology Fourth
edition Upper Saddle River NJ 07458
Neuman J Weir M Beattie C 2004 Skretting in the UK and Chile An
opportunity for comparison Skretting Outlook 21 8-11
Nordgarden U Oppedal F Taranger GL Hemre G-I and Hansen T 2003Seasonally changing metabolism in Atlantic salmon (Salmo salar L) Aquac Nutr 9287-289
Papoutsoglou SE and Tziha G 1996 Blue tilapia (Oreochromis aureus) growth ratein relation to dissolved oxygen concentration under recirculated water conditionsAquacultural Engineering 15 181-192
Poon WL CY Hung and DJ Randall 2002 The effect of aquatic hypoxia on fish
Department of Biology and Chemistry City University of Hong Kong KowloonHong Kong SAR China EPA600R-02097
Pichavant K Person-Le-Ruyet J Le Bayou N Severe A Le Roux A andBcouf G 2001 Comparative effects of long-term hypoxia on growth feeding andoxygen consumption in juvenile turbot and European sea bass J Fish Biol 59 875-883 doi10 1111j1095-86492001tb00158x
Randolph KN and HP Clemens 1976 Some factors influencing the feedingbehaviour of channel catfish in culture ponds Transactions of American FisheriesSociety 105 718724
Seymour et al 1992 EA Seymour OI Forsberg and JP Aabel The effect of arious stocking densities low water use and two oxygen levels on production
parameters of adult Atlantic salmon (Salmo salar L) in land-based tanks Report fromRogaland Research RF-19392 (1992) p 36
832019 Unuftp Resaerch Paper 2007
httpslidepdfcomreaderfullunuftp-resaerch-paper-2007 3030
Mallya
Svobodova Z Richard L Jana M and Blanka V 1993 Water quality and fish health EIFAC Technical paper 54
Tanzania Fisheries Division aquaculture section 2006 Aquaculture in Tanzania
Ministry of Natural resources and Tourism Fisheries Division
Timmons MB James ME Fred WW Sreven TS and Brian J V Recirculating
Aquaculture Systems NRAC publication No01-002
Thetmeyer H Waller UBlack KD Inselmann S Rosenthal H 1999 Growth of European sea bass (Dicentrarchus labrax L) under hypoxic and oscillating oxygenconditions Aquaculture 174 355-367
Tom L1998 Nutritional and feeding of fish Kluwer Academic Publishers Secondedition
Tsadik Gagma MN Kutty 1987 Influence of ambient oxygen on feeding and growth
of tilapia Oreochromis niloticus ARAC87WP10United Nation DevelopmentProgramme Food and Agriculture Organization of the United Nations Nigerianinstitute for oceanography and marine research project RAF87009
Ultsch GR H Boschung and MJRoss 1978 Metabolism critical oxygen tensionand habitat selection in darters (Etheostoma) Ecology 5999-107
Verheyen ER Bluse and W Decleir 1994 Metabolic rate hypoxia tolereance andaquatic surface respiration of some lacustrine and riverine African cichlid fishes(Pisces Cichlidae) Comp Biochem Physiol 107A403-411
Wedemeyer GA 1996 Interactions with Water Quality Conditions in Physiology of Fish in Intensive Culture Systems Chapman and Hall New York New York 1996
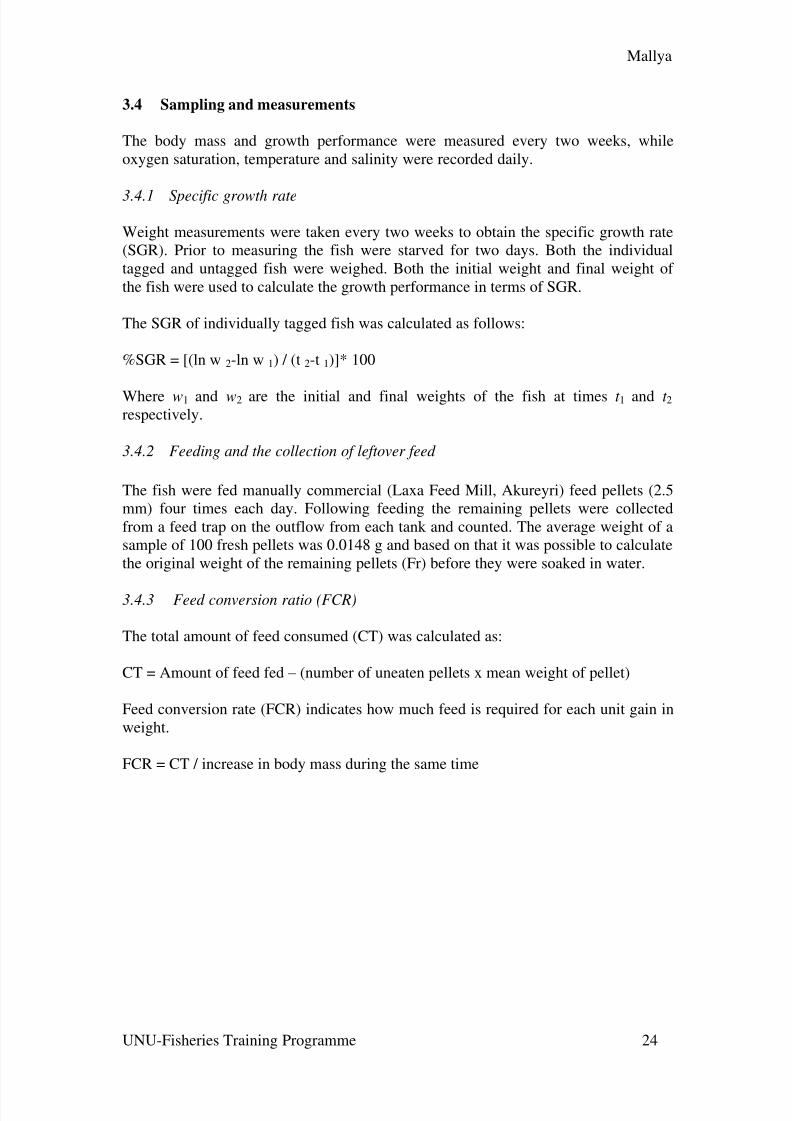
832019 Unuftp Resaerch Paper 2007
httpslidepdfcomreaderfullunuftp-resaerch-paper-2007 2430
Mallya
UNU-Fisheries Training Programme 24
34 Sampling and measurements
The body mass and growth performance were measured every two weeks whileoxygen saturation temperature and salinity were recorded daily
341 Specific growth rate
Weight measurements were taken every two weeks to obtain the specific growth rate(SGR) Prior to measuring the fish were starved for two days Both the individualtagged and untagged fish were weighed Both the initial weight and final weight of the fish were used to calculate the growth performance in terms of SGR
The SGR of individually tagged fish was calculated as follows
SGR = [(ln w 2-ln w 1) (t 2-t 1)] 100
Where w1 and w2 are the initial and final weights of the fish at times t 1 and t 2 respectively
342 Feeding and the collection of leftover feed
The fish were fed manually commercial (Laxa Feed Mill Akureyri) feed pellets (25mm) four times each day Following feeding the remaining pellets were collectedfrom a feed trap on the outflow from each tank and counted The average weight of asample of 100 fresh pellets was 00148 g and based on that it was possible to calculatethe original weight of the remaining pellets (Fr) before they were soaked in water
343 Feed conversion ratio (FCR)
The total amount of feed consumed (CT) was calculated as
CT = Amount of feed fed ndash (number of uneaten pellets x mean weight of pellet)
Feed conversion rate (FCR) indicates how much feed is required for each unit gain inweight
FCR = CT increase in body mass during the same time
832019 Unuftp Resaerch Paper 2007
httpslidepdfcomreaderfullunuftp-resaerch-paper-2007 2530
Mallya
UNU-Fisheries Training Programme 25
4 RESULTS
41 Growth
There was no significant difference in growth rate of the Atlantic halibut reared at
different oxygen saturation levels (Figure 7) during the first period (SGR1) Howeverthere was a significant difference (plt002) in the growth rate of the fish during thesecond period (SGR2) Then the SGR of fish reared at 100 saturation wassignificantly higher than that of fish reared at either 60 or 140 saturation
Figure 7 The graph showing the specific growth rate (SGR) of Atlantic halibut rearedat different oxygen saturation levels
42 Feed conversion ratio (FCR)
There was no significant difference in FCR of fish reared at different oxygen
saturation levels (Figure 8) However the FCR was lowest at 100 and 120saturation
832019 Unuftp Resaerch Paper 2007
httpslidepdfcomreaderfullunuftp-resaerch-paper-2007 2630
Mallya
UNU-Fisheries Training Programme 26
Figure 8 The feed conversion ratios (FCR) of Atlantic halibut reared at differentoxygen saturation levels
5 DISCUSSION
The results of the experiment under different oxygen levels clearly showed thatgrowth is affected by the level of oxygen saturation During the second period theSGR was highest at 100 saturation The best FCR was obtained in the groups withthe highest growth rate although there was no significant difference in FCR of fish
reared at different oxygen saturation levels The growth of other species of fish is alsoaffected by oxygen saturation such as tilapia (Tsadik and Kutty 1987) and Atlanticsalmon (Crampton et al 2003 Seymour et al 1992 Forsberg and Bergheim 1996)The growth of Atlantic halibut and Atlantic salmon increases with increasingsaturation up to 100 saturation However these species appear to be more sensitiveto oxygen saturation than tilapia
6 CONCLUSIONS
The results suggest that oxygen saturation levels affect both growth performance andfeed conversion ratios of Atlantic halibut The maximum growth rate and lowest feedconversion ratio in Atlantic halibut can be attended at higher oxygen saturation levelsbetween 90 and 120 However more research is needed in order to know at whichsaturation point the growth is maximised
Regarding future experimental work the results of this trial should be reconfirmed andgiven more time so that more observations can be made The actual oxygen saturationpoint at which Atlantic halibut has maximum growth should be identified hence moreexperimentation is needed
832019 Unuftp Resaerch Paper 2007
httpslidepdfcomreaderfullunuftp-resaerch-paper-2007 2730
Mallya
UNU-Fisheries Training Programme 27
ACKNOWLEDGEMENTS
I would like to express my gratitude to all the people who were involved and havemade the culmination of this project possible for their kind help
To my supervisor Prof Helgi Thorarensen from Holar University College for hisvaluable guidance and advice I would also like to thank the technical staff atSaudarkrokur Holar University College for giving me the opportunity to use theirinstallations and equipments also for their assistance during the experimental periodI am also grateful to Arnthor Gustavsson and Ingolfur Arnarson from HolarUniversity for their help in the experimental design and weighing the fish which Icould not have managed alone
I am indebted to Dr Tumi Tomasson Director of the UNU-FTP and Mr ThorAsgeirsson Deputy Director and Sigridur Kr Ingvarsdottir for their valuable
assistance care and guidance before and during the project
I would also like to thank my UNU fellows in the aquaculture speciality whoseencouragement enabled me to do the work even when I felt like giving up
I would like to thank my Director Mr Geoffrey Nanyaro at the Tanzanian FisheriesDivision for having given me leave which made it possible to accomplish this study
Last but not least to my family for their great concern and love all the time that Ispent here in Iceland Special thanks are given to my lovely husband for his loveencouragement and concern during the time I was away from home
832019 Unuftp Resaerch Paper 2007
httpslidepdfcomreaderfullunuftp-resaerch-paper-2007 2830
Mallya
UNU-Fisheries Training Programme 28
LIST OF REFERENCES
Balarin JD 1985 National reviews for aquaculture development in Africa 10Uganda FAO FishCirc (77010)109p
Bergheim A Martin G Anders N Per M Holland Per Krogedal and Viv Crampton2005 A newly developed oxygen injection system for cage farms AquaculturalEngineering 34(2006) 40-46
Bjornsson B and Tryggvadottir SV 1996 Effects of size on optimal temperature forgrowth and growth efficiency of immature Atlantic halibut (Hippoglossushippoglossus L) Aquaculture 142 33-42
Boyd CE and Tucker CS 1998 Pond Aquaculture Water Quality Management Kluwer Academic Publishers Boston MA (1998) 700 pp
Bromage N Mazorra C Bruce M Brown N and Shields R 2000 Halibutculture In Stickney RR Editor 2000 Encyclopedia of Aquaculture Wiley NewYork pp 425 ndash 432
Buentello JA Gatlin III DM Neill WH 2000 Effects of water temperature anddissolved oxygen on daily feed consumption feed utilization and growth of channelcatfish (Ictalurus punctatus) Aquaculture 182 339 ndash 352
Chorn E Lim et al 2006 Feeding Practices The Hawthorn Press 547-559
Crampton V A Bergheim M Gausen A Naeligss and P M Hoslashlland (2003) Effect of
low Oxygen on fish performance (wwwewoscom)
FAO 2006a State of world fisheries and Aquaculture FAO report 2006
FAO 2006b Aquaculture Production in Tanzania FAO Fishery StatisticsAquaculture production 2006)
Fisheries Division Tanzania 2007Status of Aquaculture in Tanzania
Florida Lake watch 2004The beginners guide for water management oxygen andtemperature Department of Fisheries and Aquatic Sciences Institute of Food andAgricultural sciences University of Florida Fist edition
Forsberg OI and Bergheim A 1996 The impact of constant and fluctuating oxygenconcentrations and two water consumption rates on post-smolt Atlantic salmonproduction parameters Aquacult Eng 15 (1996) pp 327 ndash 347
Groot C Margolis L and WC Clarke 1995 Physiology Ecology of pacific salmonDepartment of Fisheries and oceans Biological sciences Branch Pacific biologicalstation Nanaimo British Columbia Canada
832019 Unuftp Resaerch Paper 2007
httpslidepdfcomreaderfullunuftp-resaerch-paper-2007 2930
Mallya
UNU-Fisheries Training Programme 29
Groot C Margolis L and Clarke1995 Physiological Ecology of Pacific Salmon Department of Fisheries and oceans Biological sciences Branch Pacific biologicalstation Nanaimo British Columbia Canada
Jobling M 1995 Environmental biology of fishes Chapman and Hall Fish and
fisheries series 16
Kreiberg H Brenton-Davie V 1998 Seawater growth of Atlantic salmon in SEASystemsTM floating bag Aquaculture Update 81 1-2
Linde ndash gas 2007 httpwwwlindegascom [Dec 2006]
Microsoft Encarta1993-2002 wwwkwiccom Respiration in fishes Microsoft incartacopyright 1993-2002 Microsoft Corporation
Morkore T and Rorvik K-A 2001 Seasonal variations in growth feed utilisation
and product quality of farmed Atlantic salmon (Salmo salar L) transferred to seawater as 0+ smolts or 1+ smolts Aquaculture 199 145 ndash 158
Moyle B P and Cech JJJr 2000 Fishes an introduction to Ichthyology Fourth
edition Upper Saddle River NJ 07458
Neuman J Weir M Beattie C 2004 Skretting in the UK and Chile An
opportunity for comparison Skretting Outlook 21 8-11
Nordgarden U Oppedal F Taranger GL Hemre G-I and Hansen T 2003Seasonally changing metabolism in Atlantic salmon (Salmo salar L) Aquac Nutr 9287-289
Papoutsoglou SE and Tziha G 1996 Blue tilapia (Oreochromis aureus) growth ratein relation to dissolved oxygen concentration under recirculated water conditionsAquacultural Engineering 15 181-192
Poon WL CY Hung and DJ Randall 2002 The effect of aquatic hypoxia on fish
Department of Biology and Chemistry City University of Hong Kong KowloonHong Kong SAR China EPA600R-02097
Pichavant K Person-Le-Ruyet J Le Bayou N Severe A Le Roux A andBcouf G 2001 Comparative effects of long-term hypoxia on growth feeding andoxygen consumption in juvenile turbot and European sea bass J Fish Biol 59 875-883 doi10 1111j1095-86492001tb00158x
Randolph KN and HP Clemens 1976 Some factors influencing the feedingbehaviour of channel catfish in culture ponds Transactions of American FisheriesSociety 105 718724
Seymour et al 1992 EA Seymour OI Forsberg and JP Aabel The effect of arious stocking densities low water use and two oxygen levels on production
parameters of adult Atlantic salmon (Salmo salar L) in land-based tanks Report fromRogaland Research RF-19392 (1992) p 36
832019 Unuftp Resaerch Paper 2007
httpslidepdfcomreaderfullunuftp-resaerch-paper-2007 3030
Mallya
Svobodova Z Richard L Jana M and Blanka V 1993 Water quality and fish health EIFAC Technical paper 54
Tanzania Fisheries Division aquaculture section 2006 Aquaculture in Tanzania
Ministry of Natural resources and Tourism Fisheries Division
Timmons MB James ME Fred WW Sreven TS and Brian J V Recirculating
Aquaculture Systems NRAC publication No01-002
Thetmeyer H Waller UBlack KD Inselmann S Rosenthal H 1999 Growth of European sea bass (Dicentrarchus labrax L) under hypoxic and oscillating oxygenconditions Aquaculture 174 355-367
Tom L1998 Nutritional and feeding of fish Kluwer Academic Publishers Secondedition
Tsadik Gagma MN Kutty 1987 Influence of ambient oxygen on feeding and growth
of tilapia Oreochromis niloticus ARAC87WP10United Nation DevelopmentProgramme Food and Agriculture Organization of the United Nations Nigerianinstitute for oceanography and marine research project RAF87009
Ultsch GR H Boschung and MJRoss 1978 Metabolism critical oxygen tensionand habitat selection in darters (Etheostoma) Ecology 5999-107
Verheyen ER Bluse and W Decleir 1994 Metabolic rate hypoxia tolereance andaquatic surface respiration of some lacustrine and riverine African cichlid fishes(Pisces Cichlidae) Comp Biochem Physiol 107A403-411
Wedemeyer GA 1996 Interactions with Water Quality Conditions in Physiology of Fish in Intensive Culture Systems Chapman and Hall New York New York 1996
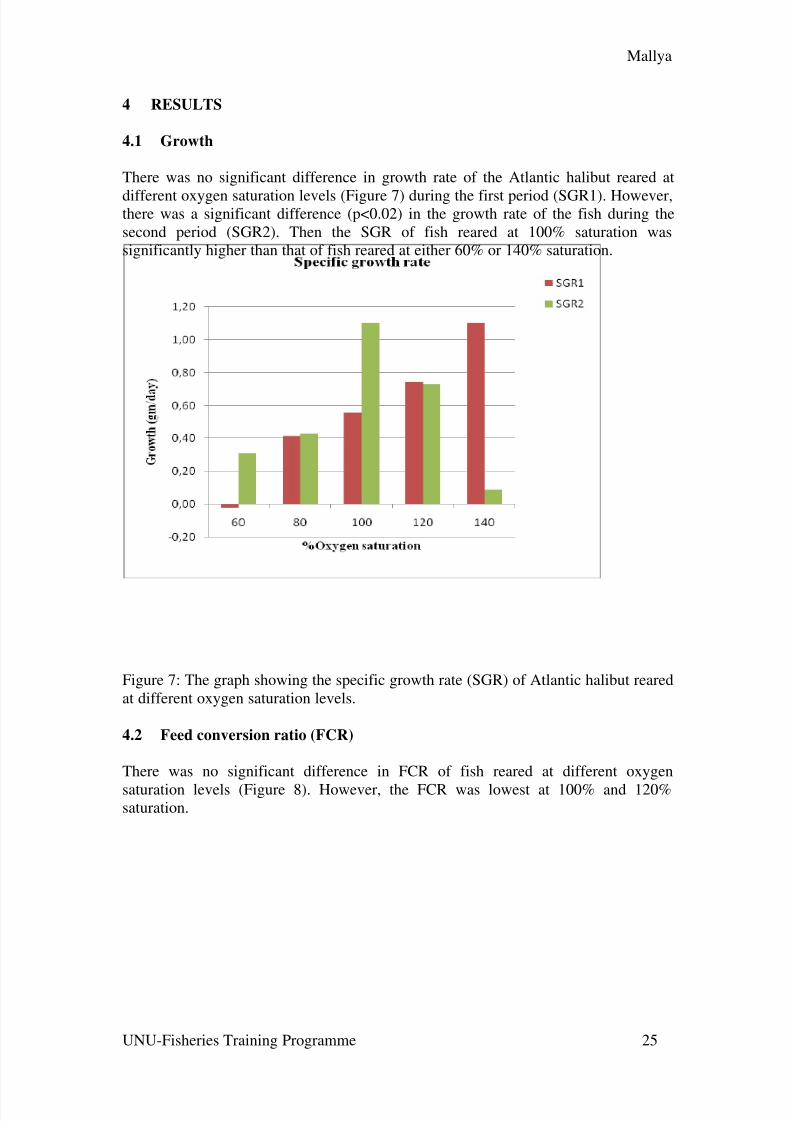
832019 Unuftp Resaerch Paper 2007
httpslidepdfcomreaderfullunuftp-resaerch-paper-2007 2530
Mallya
UNU-Fisheries Training Programme 25
4 RESULTS
41 Growth
There was no significant difference in growth rate of the Atlantic halibut reared at
different oxygen saturation levels (Figure 7) during the first period (SGR1) Howeverthere was a significant difference (plt002) in the growth rate of the fish during thesecond period (SGR2) Then the SGR of fish reared at 100 saturation wassignificantly higher than that of fish reared at either 60 or 140 saturation
Figure 7 The graph showing the specific growth rate (SGR) of Atlantic halibut rearedat different oxygen saturation levels
42 Feed conversion ratio (FCR)
There was no significant difference in FCR of fish reared at different oxygen
saturation levels (Figure 8) However the FCR was lowest at 100 and 120saturation
832019 Unuftp Resaerch Paper 2007
httpslidepdfcomreaderfullunuftp-resaerch-paper-2007 2630
Mallya
UNU-Fisheries Training Programme 26
Figure 8 The feed conversion ratios (FCR) of Atlantic halibut reared at differentoxygen saturation levels
5 DISCUSSION
The results of the experiment under different oxygen levels clearly showed thatgrowth is affected by the level of oxygen saturation During the second period theSGR was highest at 100 saturation The best FCR was obtained in the groups withthe highest growth rate although there was no significant difference in FCR of fish
reared at different oxygen saturation levels The growth of other species of fish is alsoaffected by oxygen saturation such as tilapia (Tsadik and Kutty 1987) and Atlanticsalmon (Crampton et al 2003 Seymour et al 1992 Forsberg and Bergheim 1996)The growth of Atlantic halibut and Atlantic salmon increases with increasingsaturation up to 100 saturation However these species appear to be more sensitiveto oxygen saturation than tilapia
6 CONCLUSIONS
The results suggest that oxygen saturation levels affect both growth performance andfeed conversion ratios of Atlantic halibut The maximum growth rate and lowest feedconversion ratio in Atlantic halibut can be attended at higher oxygen saturation levelsbetween 90 and 120 However more research is needed in order to know at whichsaturation point the growth is maximised
Regarding future experimental work the results of this trial should be reconfirmed andgiven more time so that more observations can be made The actual oxygen saturationpoint at which Atlantic halibut has maximum growth should be identified hence moreexperimentation is needed
832019 Unuftp Resaerch Paper 2007
httpslidepdfcomreaderfullunuftp-resaerch-paper-2007 2730
Mallya
UNU-Fisheries Training Programme 27
ACKNOWLEDGEMENTS
I would like to express my gratitude to all the people who were involved and havemade the culmination of this project possible for their kind help
To my supervisor Prof Helgi Thorarensen from Holar University College for hisvaluable guidance and advice I would also like to thank the technical staff atSaudarkrokur Holar University College for giving me the opportunity to use theirinstallations and equipments also for their assistance during the experimental periodI am also grateful to Arnthor Gustavsson and Ingolfur Arnarson from HolarUniversity for their help in the experimental design and weighing the fish which Icould not have managed alone
I am indebted to Dr Tumi Tomasson Director of the UNU-FTP and Mr ThorAsgeirsson Deputy Director and Sigridur Kr Ingvarsdottir for their valuable
assistance care and guidance before and during the project
I would also like to thank my UNU fellows in the aquaculture speciality whoseencouragement enabled me to do the work even when I felt like giving up
I would like to thank my Director Mr Geoffrey Nanyaro at the Tanzanian FisheriesDivision for having given me leave which made it possible to accomplish this study
Last but not least to my family for their great concern and love all the time that Ispent here in Iceland Special thanks are given to my lovely husband for his loveencouragement and concern during the time I was away from home
832019 Unuftp Resaerch Paper 2007
httpslidepdfcomreaderfullunuftp-resaerch-paper-2007 2830
Mallya
UNU-Fisheries Training Programme 28
LIST OF REFERENCES
Balarin JD 1985 National reviews for aquaculture development in Africa 10Uganda FAO FishCirc (77010)109p
Bergheim A Martin G Anders N Per M Holland Per Krogedal and Viv Crampton2005 A newly developed oxygen injection system for cage farms AquaculturalEngineering 34(2006) 40-46
Bjornsson B and Tryggvadottir SV 1996 Effects of size on optimal temperature forgrowth and growth efficiency of immature Atlantic halibut (Hippoglossushippoglossus L) Aquaculture 142 33-42
Boyd CE and Tucker CS 1998 Pond Aquaculture Water Quality Management Kluwer Academic Publishers Boston MA (1998) 700 pp
Bromage N Mazorra C Bruce M Brown N and Shields R 2000 Halibutculture In Stickney RR Editor 2000 Encyclopedia of Aquaculture Wiley NewYork pp 425 ndash 432
Buentello JA Gatlin III DM Neill WH 2000 Effects of water temperature anddissolved oxygen on daily feed consumption feed utilization and growth of channelcatfish (Ictalurus punctatus) Aquaculture 182 339 ndash 352
Chorn E Lim et al 2006 Feeding Practices The Hawthorn Press 547-559
Crampton V A Bergheim M Gausen A Naeligss and P M Hoslashlland (2003) Effect of
low Oxygen on fish performance (wwwewoscom)
FAO 2006a State of world fisheries and Aquaculture FAO report 2006
FAO 2006b Aquaculture Production in Tanzania FAO Fishery StatisticsAquaculture production 2006)
Fisheries Division Tanzania 2007Status of Aquaculture in Tanzania
Florida Lake watch 2004The beginners guide for water management oxygen andtemperature Department of Fisheries and Aquatic Sciences Institute of Food andAgricultural sciences University of Florida Fist edition
Forsberg OI and Bergheim A 1996 The impact of constant and fluctuating oxygenconcentrations and two water consumption rates on post-smolt Atlantic salmonproduction parameters Aquacult Eng 15 (1996) pp 327 ndash 347
Groot C Margolis L and WC Clarke 1995 Physiology Ecology of pacific salmonDepartment of Fisheries and oceans Biological sciences Branch Pacific biologicalstation Nanaimo British Columbia Canada
832019 Unuftp Resaerch Paper 2007
httpslidepdfcomreaderfullunuftp-resaerch-paper-2007 2930
Mallya
UNU-Fisheries Training Programme 29
Groot C Margolis L and Clarke1995 Physiological Ecology of Pacific Salmon Department of Fisheries and oceans Biological sciences Branch Pacific biologicalstation Nanaimo British Columbia Canada
Jobling M 1995 Environmental biology of fishes Chapman and Hall Fish and
fisheries series 16
Kreiberg H Brenton-Davie V 1998 Seawater growth of Atlantic salmon in SEASystemsTM floating bag Aquaculture Update 81 1-2
Linde ndash gas 2007 httpwwwlindegascom [Dec 2006]
Microsoft Encarta1993-2002 wwwkwiccom Respiration in fishes Microsoft incartacopyright 1993-2002 Microsoft Corporation
Morkore T and Rorvik K-A 2001 Seasonal variations in growth feed utilisation
and product quality of farmed Atlantic salmon (Salmo salar L) transferred to seawater as 0+ smolts or 1+ smolts Aquaculture 199 145 ndash 158
Moyle B P and Cech JJJr 2000 Fishes an introduction to Ichthyology Fourth
edition Upper Saddle River NJ 07458
Neuman J Weir M Beattie C 2004 Skretting in the UK and Chile An
opportunity for comparison Skretting Outlook 21 8-11
Nordgarden U Oppedal F Taranger GL Hemre G-I and Hansen T 2003Seasonally changing metabolism in Atlantic salmon (Salmo salar L) Aquac Nutr 9287-289
Papoutsoglou SE and Tziha G 1996 Blue tilapia (Oreochromis aureus) growth ratein relation to dissolved oxygen concentration under recirculated water conditionsAquacultural Engineering 15 181-192
Poon WL CY Hung and DJ Randall 2002 The effect of aquatic hypoxia on fish
Department of Biology and Chemistry City University of Hong Kong KowloonHong Kong SAR China EPA600R-02097
Pichavant K Person-Le-Ruyet J Le Bayou N Severe A Le Roux A andBcouf G 2001 Comparative effects of long-term hypoxia on growth feeding andoxygen consumption in juvenile turbot and European sea bass J Fish Biol 59 875-883 doi10 1111j1095-86492001tb00158x
Randolph KN and HP Clemens 1976 Some factors influencing the feedingbehaviour of channel catfish in culture ponds Transactions of American FisheriesSociety 105 718724
Seymour et al 1992 EA Seymour OI Forsberg and JP Aabel The effect of arious stocking densities low water use and two oxygen levels on production
parameters of adult Atlantic salmon (Salmo salar L) in land-based tanks Report fromRogaland Research RF-19392 (1992) p 36
832019 Unuftp Resaerch Paper 2007
httpslidepdfcomreaderfullunuftp-resaerch-paper-2007 3030
Mallya
Svobodova Z Richard L Jana M and Blanka V 1993 Water quality and fish health EIFAC Technical paper 54
Tanzania Fisheries Division aquaculture section 2006 Aquaculture in Tanzania
Ministry of Natural resources and Tourism Fisheries Division
Timmons MB James ME Fred WW Sreven TS and Brian J V Recirculating
Aquaculture Systems NRAC publication No01-002
Thetmeyer H Waller UBlack KD Inselmann S Rosenthal H 1999 Growth of European sea bass (Dicentrarchus labrax L) under hypoxic and oscillating oxygenconditions Aquaculture 174 355-367
Tom L1998 Nutritional and feeding of fish Kluwer Academic Publishers Secondedition
Tsadik Gagma MN Kutty 1987 Influence of ambient oxygen on feeding and growth
of tilapia Oreochromis niloticus ARAC87WP10United Nation DevelopmentProgramme Food and Agriculture Organization of the United Nations Nigerianinstitute for oceanography and marine research project RAF87009
Ultsch GR H Boschung and MJRoss 1978 Metabolism critical oxygen tensionand habitat selection in darters (Etheostoma) Ecology 5999-107
Verheyen ER Bluse and W Decleir 1994 Metabolic rate hypoxia tolereance andaquatic surface respiration of some lacustrine and riverine African cichlid fishes(Pisces Cichlidae) Comp Biochem Physiol 107A403-411
Wedemeyer GA 1996 Interactions with Water Quality Conditions in Physiology of Fish in Intensive Culture Systems Chapman and Hall New York New York 1996
832019 Unuftp Resaerch Paper 2007
httpslidepdfcomreaderfullunuftp-resaerch-paper-2007 3030
Mallya
Svobodova Z Richard L Jana M and Blanka V 1993 Water quality and fish health EIFAC Technical paper 54
Tanzania Fisheries Division aquaculture section 2006 Aquaculture in Tanzania
Ministry of Natural resources and Tourism Fisheries Division
Timmons MB James ME Fred WW Sreven TS and Brian J V Recirculating
Aquaculture Systems NRAC publication No01-002
Thetmeyer H Waller UBlack KD Inselmann S Rosenthal H 1999 Growth of European sea bass (Dicentrarchus labrax L) under hypoxic and oscillating oxygenconditions Aquaculture 174 355-367
Tom L1998 Nutritional and feeding of fish Kluwer Academic Publishers Secondedition
Tsadik Gagma MN Kutty 1987 Influence of ambient oxygen on feeding and growth
of tilapia Oreochromis niloticus ARAC87WP10United Nation DevelopmentProgramme Food and Agriculture Organization of the United Nations Nigerianinstitute for oceanography and marine research project RAF87009
Ultsch GR H Boschung and MJRoss 1978 Metabolism critical oxygen tensionand habitat selection in darters (Etheostoma) Ecology 5999-107
Verheyen ER Bluse and W Decleir 1994 Metabolic rate hypoxia tolereance andaquatic surface respiration of some lacustrine and riverine African cichlid fishes(Pisces Cichlidae) Comp Biochem Physiol 107A403-411
Wedemeyer GA 1996 Interactions with Water Quality Conditions in Physiology of Fish in Intensive Culture Systems Chapman and Hall New York New York 1996