Embed Size (px)
Citation preview
Research and Development Technical Report fECOM-'7043 •
i'.__1'=• =•NIGHT VISION LABORATORY STATIC PERFORMANCE MODEL 1
S1=• : FOR THERMAL VIEWING SYSTEMS0
S*
S_ April 1975
• Approved for- public releasne. distribution unlimiteik.
0M
~~ NIGHT VISNAIONALABRTR STATHICAL ROMNC OE'I ~~IFORMATHERMALRVICEWNSYTM
S•0
U..O(ACN F ONEM
"" S
P•RINGFIELD, '-'A. 2216!
MM
S.*0.. ,-:•,. lrR

DISCLAIMER NOTICE
THIS DOCUMENT IS BEST QUALITYPRACTICABLE. THE COPY FURNISHEDTO DTIC CONTAINED A SIGNIFICANTNUMBER OF PAGES WHICH DO NOTREPRODUCE LEGIBLY.

U NCLASSIFIED)SECURITY CLASSIFICATION OF THIS PACE (1Who, DateaEnteovo-_
REPORT DOCUMENTATION PAGE BEFORE COMPLETING PO*14
ECOM-7043 A/-1 14. TITI.E (and Subtitle) S. TYPE OF REPORT A PERIOD COVERErD
NAiAiT VISION LABORATORY STATIC PERFORMANCE Technical Report
4ELFOR THERMAL VIEWING SYSTEMS IMOIGOR.aptTNBE
1. h'r.4R(.)S. -CC TRACT ON 13RANT NUMIOER(s)
FoJ Beldir Vigi. 22060e Richard___J.___________
I. ,0EPPTRMLING ORGNIAICE NAME A14D ADDRESS 10. PRPOGRTM OAMET.S RJC.TSU.$, Army Electronic-, Command ARA__WRKUNT___ IR
Night Vision L~aboratory (TN ME.VV)-For'i Ielvoir, Virginia 22060I. CONITRORIO OFGIENC NAME AN ADDRESSO 12.et., REPoR DATElng011c
U.SI~a Army ElectronisTCommandAprilD197
It. DISTRIUUTION STATEMENT (at th.'s Report)
Ii Approvcd for public release; distribut ion unlimited.
17. DISTRMIOUT ION ST ATEMEN 9?(of the abstract entered In Block 20. It different fhoew ROPO'V)
tIS. SUPPLEMENTARY NOTES RPOCDO
Ui. 4. 0FPART1E';Er OF COMMEHCUSPRINGfIELIL, 'A. 22161
1.KEY WORDS (Continue on reverse side- If ,ecosery, and Identify by block number)'Thermal performance! model Minimum resolvable temperatureInfrared imaging Minimum detectable temperature1.Detection and recognition performance Night visi,-)nNoise equivalent temperatureModulation transfer fulnction
a0. ABSTRACT (Continue an reverse side Itf neceasay and ids""* O 0bih Stelumhr
*The NYL thermal model predicts system Ni, ATj MTF, MRT, and MDT for any infrared- imaging system. It also predicts detection and recognition as a function of range for a given
atmosphere and tar get signature. This model is documented, and the validation from laboratorymeasurements and field experiments is also nresented. The computer program and an in-depthuser's manual are given in the appendices. This model can be and has been used in military sys-
4 ~tems analyses to direct component researcii. e .'aluate contractor proposals, and aid projectmanager decisions.
DD 1473 ?IIGHON Ir NOV III I OBSOLETE UCASFE
SE4C RITY CLASSIFICATION O* Tý4111 PACE ont~ Fate Entered)
i4
41x
i. I .
I . . .
K CONTENTS
Sectioni Title Page
ILLUSTRATIONS iv
TABLES iv
I ~INTRODUCTION
II TARGET, BACKGROUND, AND ATMOSPHERE 2
II DEVICE AND EYEBALL 7
A. MTF 7
B. NEAT 10
C. MRT 12
D. MDT 14
IV RECOGNITION 16
V DETECTION 19
VI VALIDATION 21
Vii CONCLUSIONS 34
APPENDIXES
A. NEAT, MRT, AND MDT DERIVATIONS 3513. VERTICAL MRT 58
C, COMPUTER PROGRAM 61
V . USER'S GUIDE 116
PraesiKI pigs blank HA
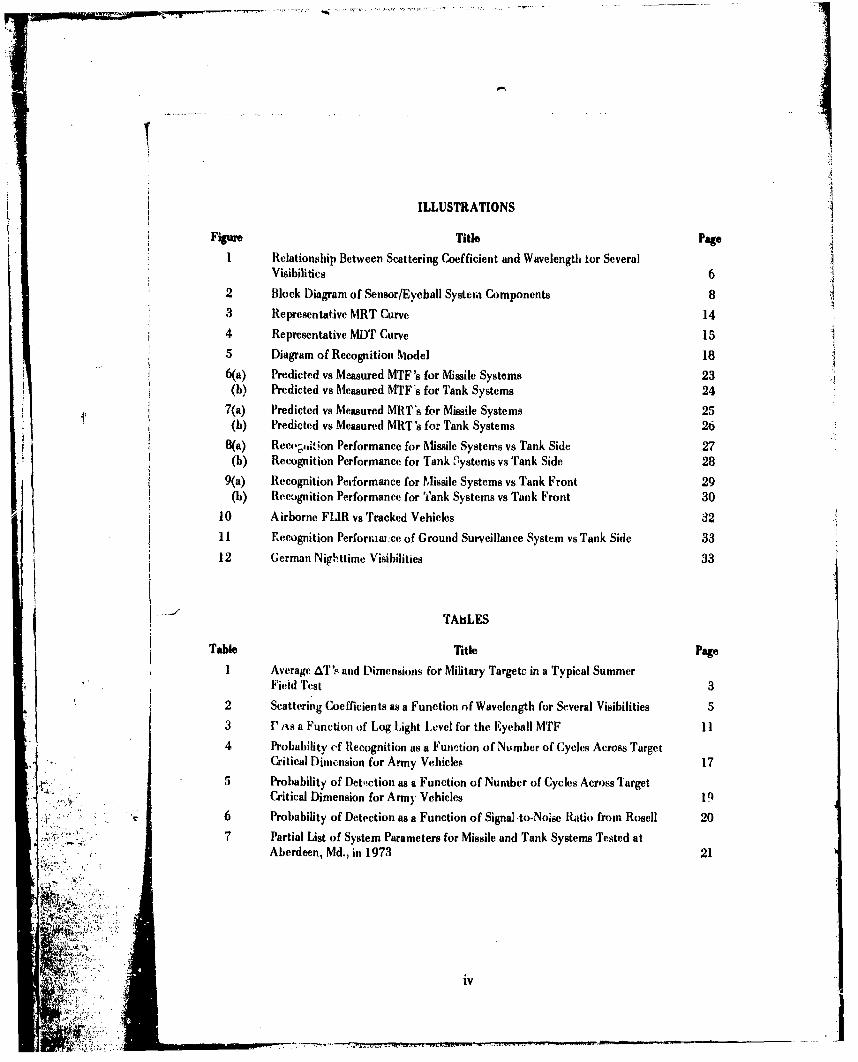
ILLUSTRATIONS
Figure Title pa1 Relationship Between Scattering Coefficient and Wavelength for Several
Visibilitics 62 Block Diagram of Sensor/Eyeball System Components 83 Representative MRT Curve 144 Representative MDT Curve 155 Diagram of Recognition Model 186(a) Predicted vs Measured MTF's for Missile Systems 23(b) Predicted vs Measured MTF-s for Tank Systems 24
7 (a) Predicted vs Measured MRT's for Missile Systems 25(b) Predicted vs Measured MRT's for Tank Systems 26
8(a) Reco;aition Performance for Missile Systems vs Tank Side 27(b) Recognition Performance for Tank Systems vs Tank Side 28
9 (a) Recognition Performance for Missile Systems vs Tank Front 29(b) Recignition Performance for Tank Systems vs Tank Front 30
10 Airborne FLIR vs Tracked Vehicles 32
11 Recognition Perforra-ce of Ground Surveillance System vs Tank Side 3312 German Nigttime Visibilities 33
TAtLES
Table Title Page1 Average ATs and Dimensions for Military Targetc in a Typical Summer
Ficid Test 32 Scattering Coefficients as a Function of Wavelength for Several Visibilities 53 l" its a Function of Log Light Level for the Eyeball MTF 11
4 Probability ,f Recognition as a Function of Number of Cycles Across TargetCritical Dimension for Army Vehicles 17
5 Probability of Dettction as a Function of Number of Cycles Across 'largetCritical Dimension for Arm) Vehicles 19
6 Probability of Detection as a Function of Signal .to-Nodie Ratio from Rosell 207 Partial List of System Parameters for Missile and Tank Systems Tested at
Aberdeen, Md., in 1973 21
iv
FORTHEM:,L IEWNGSYSTEMS
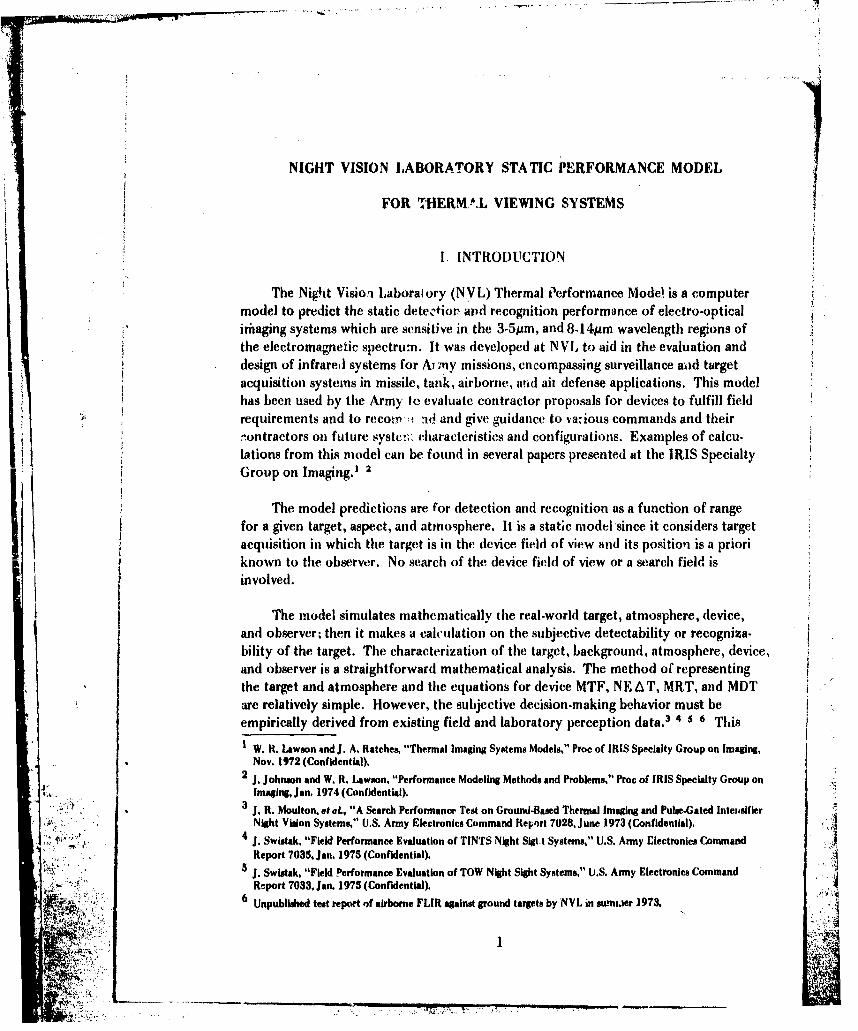
I. INTRODUCTION
The Night Visioil Laboratory (N.VL) Thermal iPerformance Model. is a computermodel to predict the static detectior an~d recognition performance of electro-opticalixiiaging systems which are sensitive in the 3.5pm, and 8.14p•m wavelength regions ofthe electromagnetic spectrun. It was developed at N VL to aid in the evaluation anddesign of infrared systems for Ai mny missions, encompassing surveillance aad targetacquisition systems in missile, tank, airborne, ar, d air defense applications. This model
I'hasbeen used by the Army' Ic evaluate contractor proposals for devices to fulfill field'•' ~requirements and to recot n• d and give guidance to va,,ious commands and their
•ontractors on future systec;. characteristics and configurations. Examples of calcu-i lations from this model can be found in several papers presented at the IRIS Specialty
1)1 Group on Imaging.' 2
S~The model predictions are for detection and recognition as a function of rangefor a given target, aspect, and atmosphere. It is a static model •since it considers targetacquisition in which the target is in the device field of view and its position is a priori
I ~known to the observer. No search of the device field of view or a searchl field isinvolved.
The model simulates mathematically the real-world target, atmosphere, device,and observer; then it makes a calculation on the subjective detectability or recogniza.bility of the target. The characterization of the target, background, atmosphere, device,and observer is a straightforward mathematical analysis. The method of representing
• , ~~~~~~the target and atmosphere and the equations for device MTF, NE AT, MRT, and MDTaerltilysm e. owvtesujcvediio- kngehirmstb
empirically derived from existing field and laboratory perception data. 3 4; s 6 This
IW. R. Lawson and . A. Ratches, "Thermal Imaging Systems Models," Proc of IRIS Specialty Group on Imaging,
Nov. 1972 (Confidential).2 j. Johnson and W. R. Lawson, "Performance Modeling Methods and Problems," Proc of IRIS Specialty Group on
•,. Imaging, Jan. 1974 (Confidential).S •.:i• 3J. R. Moulton, et aL, "A Search Performance Test on Ground.Based Thermal Imaging and Pulse-Gated Inten~sifier
o,•'.: •Night Vision Systems." U.S. Army Electronics Command Rerort 7028, June 1973 (Confidential).,•..!..,, •;,,,,/,•:Y 4J. Swistak. "Field Performance Evaluation of TINTS Night Sigt~t Systems," U.S. Army Electronics Command
" ,,. Report 7035. Jan. 1975 (Confidential).•.='., 53. Swistak, "Field Performance Evaluation of TOW Night Sight Systems," U.S. Army Electronics Command
Report 7033, Jan. 1975 (Confidential).S~6 Unpublished test report of airborne FLIR against ground targets by NVL in su-,nh~er 1973,.
• 1
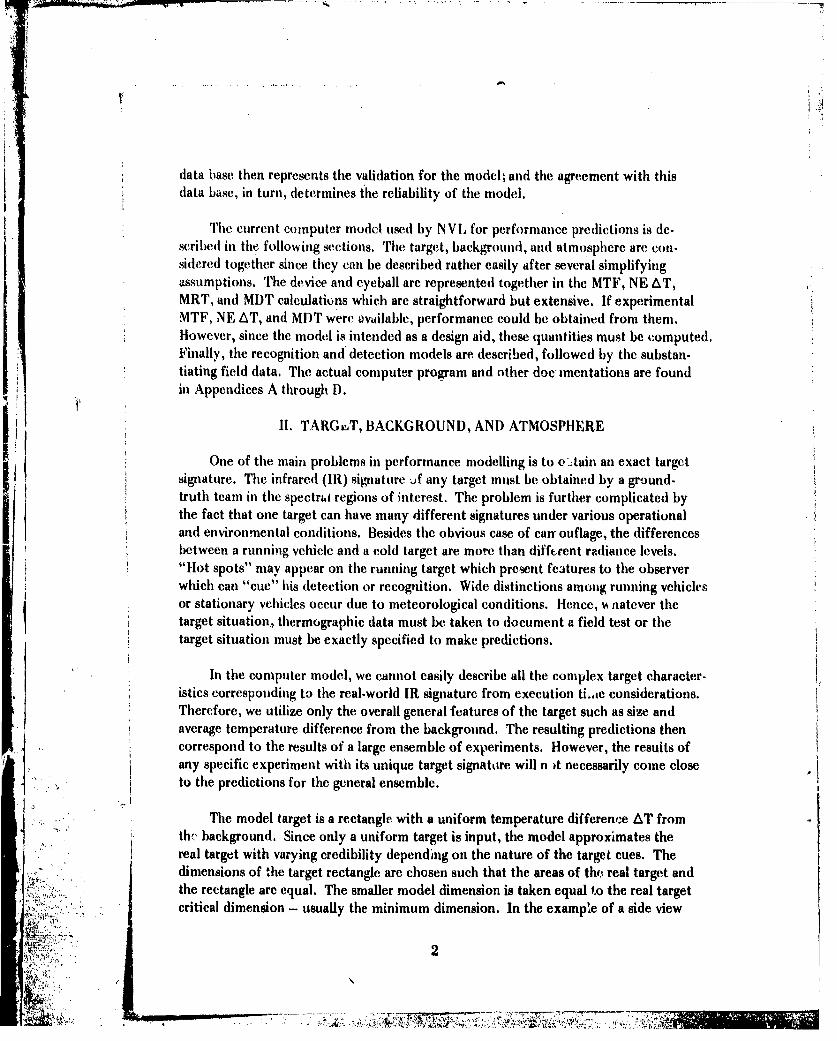
data base then represents the validation for the model; and the agreement with thisdata base, in turn, determines the reliability of the model.
The current computer model used by NVI, for performance predictions is dc-scribed in the" following sections. The target, background, and atmosphere are con-sidered together since they can be described rather easily after several simplifyingassumptions. The device and eyeball are represented together in the MTF, NE AT,MRT, and MDT calculations which are straightforward but extensive. If experimentalMTF, NE AT, and MDT were available, performance could be obtained from themn.However, since the model is intended as a design aid, these quantities must be computed.Finally, the recognition and detection models are described, followed by the substan-tiating field data. The actual computer program and other dc imentations are foundin Appendices A through D.
II. TARGJJT, BACKGROUND, AND ATMOSPHERE
One of tie main problems in performance modelling is to o3tain an exact target
signature. The infrared (11) sigrnature Jf any target must be obtained by a ground-truth team in the spectrut regions of interest. The problem is further complicated bythe fact that one target can have many different signatures under various operationaland environmental conditions. Besides the obvious case of can- ouflage, the differencesbetween a running vehicle and a cold target are more tihan difftrent radiance levels.
"Hot spots" may appear on the running target which present features to the observerwhich can "cue" his detection or recognition. Wide distinctions among running vehiclesor stationary vehicles occur due to meteorological conditions. Hence, M natever thetarget situation, thermographic data must be taken to document a field test or thetarget situation must be exactly specified to make predictions.
In the computer model, we cannot easily describe all the complex target character-istics corresponding to the real-world IR signature from execution tile considerations.Therefore, we utilize only the overall general features of the target such as size andaverage temperature difference from the background. The resulting predictions thencorrespond to the results of a large ensemble of experiments. However, the results ofany specific experiment with its unique target signatore will n )t necessarily come closeto the predictions for the general ensemble.
The model target is a rectangle with a uniform temperature differenee AT fromth", background. Since only a uniform target is input, the model approximates thereal target with varying credibility depending on the nature of the target cues. Thedimensions of the target rectangle are chosen such that the areas of the real target and
- .: ,. the rectangle are equal. The smaller model dimension is taken equal to the real targetcritical dimension - usually the minimum dimension. In the example of a side view
2

of an America:, tank, its minimum dirmiension is 2.7 m and that is chosen as the rec.tangle height. The rectangle length is then whatever length gives an area equal to thereal-world object.
The temperature difference AT associated with the target is an area-weightedaverage temperature difference across tie entire signature. If an object's thermographis divided into areas A, of average constant temperature Tp, then the average targettemperature is defined as
• A T1
TAVG (1)
The average temperature difference ATAvG is then the difference 'ietween TAvG andaverage background temperature T BAC i.e.,
ATAVG = TAVG -T Ac . (2)
A list of A T 's and target dime,,sions from a typical field test is shown in Table 1.
Table 1. Average AT's and Dimensions for Military Targetsin a Typical Summer Field Test
Target AT AVG (-C) Area (mx m)
Tank/Side 5.25 2.7 x 5.25Tank/Front 6.34 2.7 x 3.452½-Ton/Side 10.40 0.83 x 4.22
2½-Ton/Front 8.25 2.03 x 1.67APC/Side 4.67 i.8 x 4.8APC/Front 5.65 1.8 x 2.09Man 8.0 0.5 x 1.5
The background temperature was specified by one temperature T BAC This is"obviously a simplification for all scenarios except that of an aircraft against a uniform
S1sky background. Hence, the predictions will predict field behavior only when back-ground clutter does not have an effect on the performance.
Power difference is a more fundamental quantity than temperiture difference.Therefore, A TArG is converted to a power sw.gnal by using he Planck Radiation Law.
• *'• : ": "For a given temperature T, Nx watts/em2 /sr/p are emitted according to
3
...... •. ... •.., '-- .

_ _ _- -h_ _- )-(I
_ _ ( 3 )
Xs exp (hc/XkT)- -
at wavelength X. Terms c, k, and h are the usual constants and e (X) is the emissivity.The target model, therefore, gives approximately the same total emitted power asfrom the real target.
Atmospheric transmission is an3ther major problem for modellers. In order tospecify an atmosphere completely, the aerosol must be uniquely defined which impliesknowledge of particle size and distribution. These last atmospheric parameters aredifficult to measure and, consequently, seldom carried out. In addition, a model based
Ln the exact Mie scattering theory would be too cumbersome and time consuming touse in performance model applications. Therefore, several simplifying assumptionsmust be made for a viable engineering model.
The atmosphere is assumed to be specified by three easily measurable parameterswhich are readily understood bv field commanders. They are air temperature, relativehumidity, and visibility. Although these parameters do not uniquely characteri!Je themeteorological environment, it is assumed that the atmosphere can be iproken up intoan absorption component, which is determined by the air temperature and relativehumidity, and a scattering component which is determined by the visibility. Trans-mission is calculated separately for each component, and total transmission is theproduct of the components.
One method to calculate the transmission through an absorbing atmosphere ofwater vapor and carbon dioxide is given by
TA .57 [a (X)- LOG1 0 (RW) 2
S1+ [.5 a (X)- LOG10 (RW) 2) (4)
where a (X) is a spectrally dependent constant for water vapor or carbon dioxide, R isthe range in kilometers, and
S 4.6 x 10" + 2.1 x 10" (TAI + 5)2 R.I. for 1 520 (5):"i "• : I1.0 for C02.
A list of ot (Q)'s is given in the computer model in Appendix C TAR , the air tempera-ture in degrues Cen tigrade and R.H. is the relative humidity in percent, •quation (4)is a Lorentzian line shape fit to transmission data in the Geophysical Ha,,adb')ok.'
7 J. N. Howard, "Atmospheric Absoption," S. L, Valley, Ed,, Air Force Cambridr. Res. Lab., Cambridge, Mase,1965, See. 10.2.
4S i-. .... ._:•
-• "i " : • . .L: :- " q '. .. . 'r' "Z ' •£ ..• ,•.s' '.• . " .• ,'..• .. "
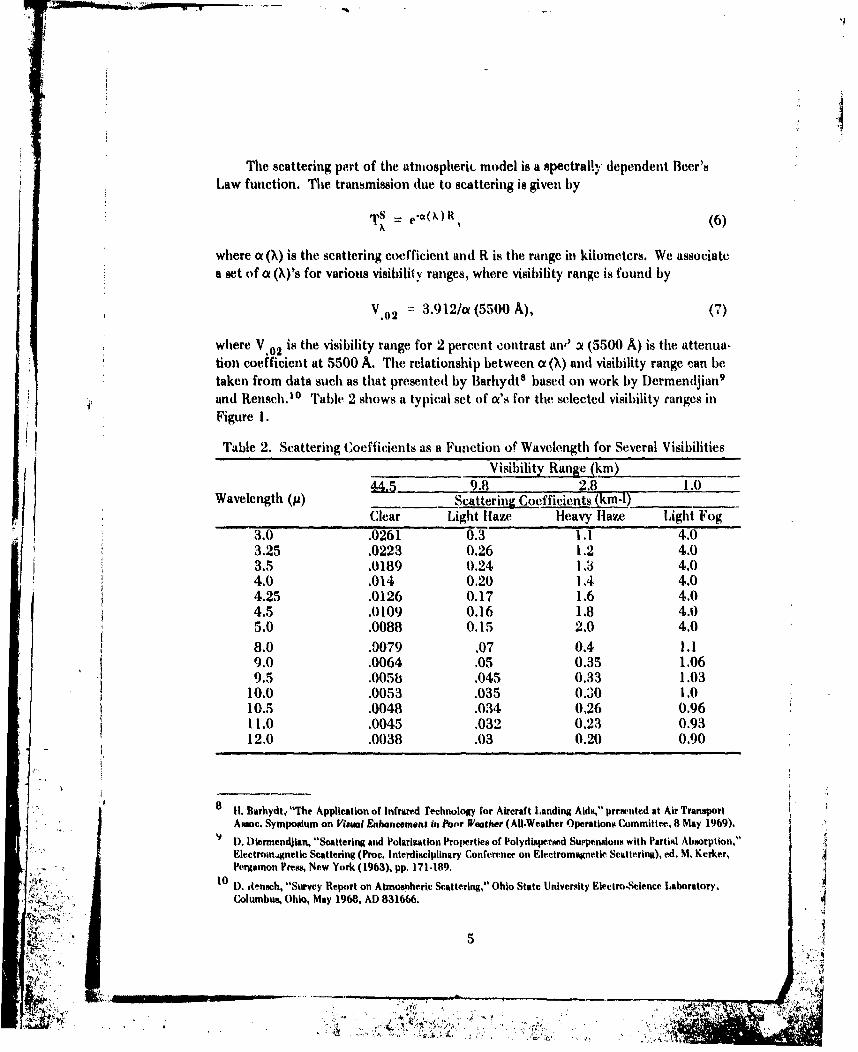
The scattering pert of the atmospheric model is a spectrally dependent Beer'sLaw function. The transmission due to scattering is given by
TS (6)
where a (X) is the scattering coefficient and R is the range in kilometers. We associatea set of i (X)'s for various visibility ranges, where visibility range is found by
.02 3.912/c (5500 A), (7)
where V02 is the visibility range for 2 percent contrast an,' 31 (5500 A) is the attenua-
tion coefficient at 5500 A. The relationship between u (X) and visibility range can be
taken from data such as that presented by Barhydt8 based on work by Dermendjian 9
and Rensch. 10 Table 2 shows a typical set of ot's for the selected visibility ranges inFigure 1.
Table 2. Scattering Coefficients as a Function of Wavelength for Several Visibilities
Visibility Range (km)9.8 2.8 1.0
Wavelength (p) Scattering Coefficients (km'l)Clear Light Haze Heavy Haze Light Fog
3.0 .0261 0.3 1.1 4.03.25 .0223 0.26 1.2 4.03.5 .0189 0.24 1.3 4.0
S4.0 .014 0.20 1.4 4.04.25 .0126 0.17 1.6 4.04.5 .0109 0.16 1.8 4.05.0 .0088 0.15 2.0 4.08.0 .9079 .07 0.4 1.19.0 .0064 .05 0.35 1.069.5 .005ts .045 0.33 1.03
10.0 .0053 .035 0.30 1.010.5 .0048 .034 0.26 0.9611.0 .0045 .032 0.23 0.9312.0 .0038 .03 0.20 0.90
8 11. Barhydt,, "The Application of Infrared technology for Aircraft Landing Aids," presented at Air Transport
Assoc. Symposium on Visual Enhancement in Poor Weather (All.Weather Operations Committee, 8 May 1969).
I). Diermendjian, "Scattering and Polarifatlon Properties of Polydispersed Surpensions with Partisl Absorption,"Electrogn4netlic Scattering (Proc. Interdisciplinary Conference on Electromagnetic Scattering), ed. M. Kerker,Pergamon Press, New York (1963), pp. 171-189.
10 D. ,A.-nsch, "Survey Report on Atmosnheric Scattering," Ohio State University Electro-Science Laboratory,
Columbus, Ohio, May 1968, AD 831666.
5:'

4,0
L~IGT FOG
- CLEAH TO
Li-3HT HAZE
0.01 -
VERYLL I CLEAR
0.5 1.0 2 34 63810 20X~ (microns)
Figure 1. Relationship between scattering coefficient andwavelength for several visibilities (taken from D. Rensch).
The total atmospheric transmission is then
trTOTAL =T's x T~ (8
where TS and TA are given by equations (6) and (4). LFor mnost calculations when the visibility ranges are not too severe, a modified
version of the Aic Force Cambridge Resea-ch Laboratory (AFCRL) n'odel LOWTRAN11 is used to call.W~ate tr:3nsmission.11 It has been modified to increase its executionspeed by removing the slant-range calculation zAd doing the transmission calculations
onyover the infrared sp ctral birnd of interest. The only reservation in universal
R.A. McClatchey. et 4L, "Optical Properties of the Atmtosphere," D.D.C. No. AD 726-116, Air F irceCambridige Ries. Lib., Csmbritdp, Maw. (1971).
6
i
,1pplication of iL)WTRAN 11 is that it does not htandle vet- v low visibilities correspondingtt thick fogs. Work is presently being done at AF(CRL to extend the range of appli-cability of this model. Simple models for smoke, rain, and fog have been added tothe IOWTRAN subroutine in the moth(N. These, along with further explanations of theatmospheric models, will be found in a forthcoming report by Bergemann of N V L,2
111. IDEVICE, AND EYEBALL,
The performance model described in this report predicts probability of recogni.tion and detection basd upon the predicted system nminimum resolvable temperatitre(MRT) and minimum detectable temperature (MDT). It is tile basic assumption ofthis model that these quantities directly determine field performance. These quantitiesare defined and derived in later sections and in Appendix A from the same signal-to-noise ratio expression.
In order to calic. ,te MRT and MDT, we need to first predict the signal-transfer
characteristics and noise characteristics of the device and eyeball. The signal transferis represented by the transfer function or approximately by the modulation transferfunction (MTF). The noise charactcristics are specified by the noise equivalent temper-ature difference (NE AT), The next sections describe the MTF and NE AT calculation.
A. MTF. The signal otit of a linear e'lectronic processor is the convolution ofthe spread function of the processor with the input signal. If the processor is made tipof several components, then each spread function must be convolved. This can be aedious process. lowever, the output signal in frequency space is just the multiplica-
tion of the transform of the input signal and the transfer functions of the components.The transfer functions are the fourier transforms of the component spread functions,and the magnitude of the transfer function is the MTF.
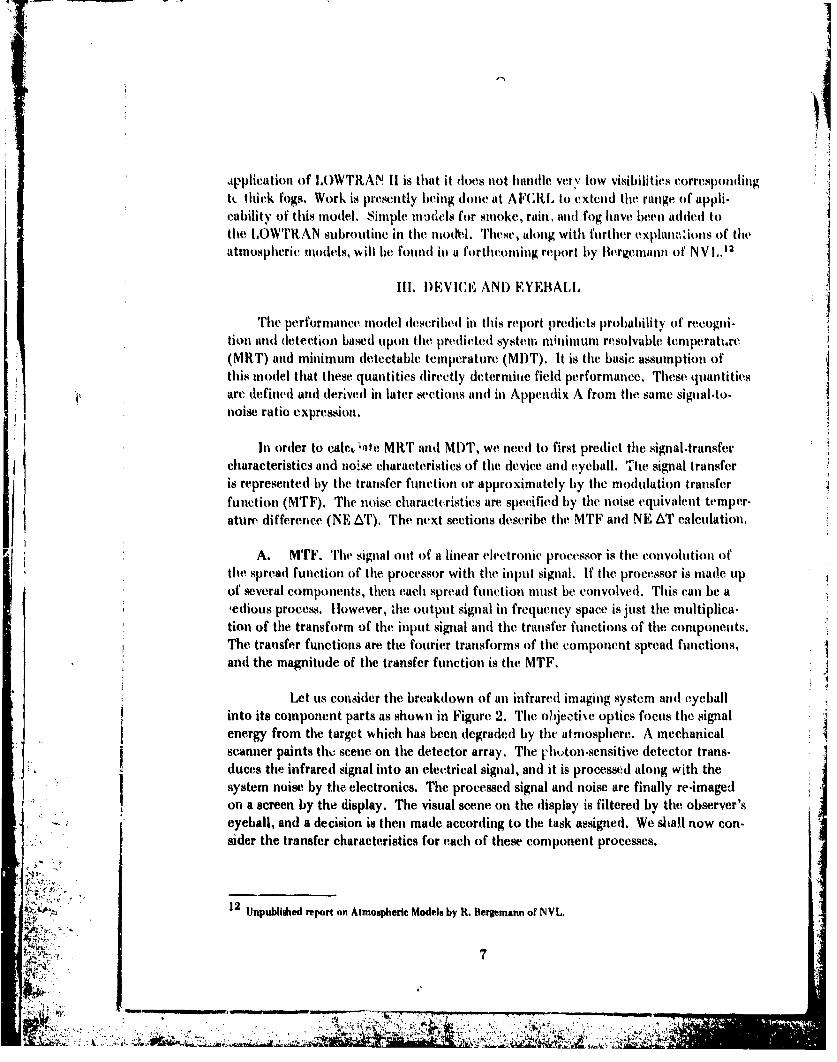
Let us consider the breakdown of an infrared imaging system and eyeballinto its component parts as shown in Figure 2. The ohjectihe optics focus tile signalenergy from the target which has been degraded by thie atmosphere. A mechanicalscanner paints th,. scene on the detector array. The phlton-sensitive detector trans-
,duces tie infrared signal into an electrical signal, and it is processed along with the
system noise by the electronics. The processed signal and noise are finally re-imagedon a screen by the display. The visual scene on the display is filtered by tile observer'seyeball, and a decision is then made according to tile task assigned. We shall now con-sider the transfer characteristics for each of these component processes.
, 12 Unpublished report on Atmospheric Models by R. Berpmann of NVL.
7
'INN

7
ATMOSPHEIiR DISPLAYSCANNER [
ELECTRONICS EYETARGF.T
OPTICS rrr :~]])DETECTOR
COOLER
Figure 2. Block diagram of sensor/eyeball system components.
1. Optics. As in most calculations by this model, there are options to themethod of MTF geikeration. If an exact MTF as a fiiction of frequency is known, itmay be read into the model direcly; if not, ar. or Weal MTF is calculated from theproduct of a diffraction-limited transfer func..'r-n ,wd a geometric-blur transfer func-tion. The diffraction-limited MTF 13 as a fur.ction of spatial frequency 1x (cycles/mr)for optics with F-number F# and focal length Q in micrometers and at wavelength Xin micrometers is given by
wHOP 2 [cos' (A)_A(IA2)J, (9)
i where
A= F# x/. (10)
Cylindrical symmetry is assumed and equation (9) is used for the vertical directiontransfer characteristic also. A gaussian geometric blur is assumed of the form
HBLUR= exp(-bfx). (11)
The resultant optical MTF is then the product of the diffraction and geometriccomponents.
2. Detector. The detector has two effects which contribute to the system-transfer characteristics. First, it acts as a spatial filter because of its finite size. Second,it acts as a temporal filter because of its finite response time. The spatial and temporalfrequencies are related through the scan velocity v, by
13 E. L. O'Neill, Introduction to Statistical Optics, Addison-.•'eiy (1963), p. 84.
8

f(Hz) = v (MR/SEC) f, (CY/MR). (12)
The detector spatial filtering in the horizontal or vertical direction is given by
HDET (f) = sin (urf1 X) / (ir fxX), (13)
where X is the instantaneous field of view (IFOV) of the detector in that direction.
The IFOV is the angular subtense of the detector in the objective focal plane. Thedetector temporal response contributes significantly to the horizontal spatial responsewhen the detector dwell time is very short as in serial processors. In this case, thecharge carri, 3 in the detector material do not have enough time to fully react to thescene changes irradiating an IFOV. The temporal transfer function for this phenomenonis approximated by an RC roll-off:
* DH' (f) 1/[1 + (f/f*)2 ] , (14)i ~DET'
where f* is the 3.dB point in hertz of the detector response. Equation (14) becomes
H' (fx) 1/1+(vfx/f*)2 ]•DE1
using equation (12) to transform to spatial frequency space.
3. Electronics. Usually, the passband associated with the amplifiers isvery broadband compared to other system component filters. However, if there is anon-negligible bandwidth in the electronics, it may be read as a model input or cal-culated using an RC-circuit roll-off again in temporal frequency space,
H•gTf)=/1 + (f/fo)2 ],(15)
where fo is the 3-dB point on the RC filter. In the case where an electronic boost ispresent in the system, such as an aperture correction, the boost MTF may be read asan input; or a standard form"4 for the boost transfer function can be used given by
HB (f) =1 + (K-1)/2 [1 cos (fffMAX)], (16)
where K and fMAX determine the amplitude and frequency of the boost. Equations(15) and (16) can be transformed to spatial frequency space through use of equation(12).
14 Discussions with various engineers at Hughes Aircraft Co.
9
I-, AX ..
,•,,•i...
•?r .• -, . ...

In a parallel scanning system which is electro-optically multiplexed, the
LED emitters and TV vidicon must be included in the system-transfer characteristics.The LED filter function is
HLED (fx) = sin (1rfX)/(rf•xX) (17)
in the two spatial directions, where x is the diode angular subtense in object space.The vidicon MTF is read in as a system input, including any boosting in the camera.
4. Display. The display transfer function is the fourier transforr _ of thedisplay spot size. In the case of an LED display, we use an MTF in both spatial di-mensions similar to equation (17). For a CRT display, we assume a gaussian spot shapeand, consequently, a gaussian transfer function. The exact form used is
CRT2). (18)
5. Stabilization. Airborne FLIRI's are operated on a stabilized platformto damp out aircraft vibration. The vibration cannot, however, be entirely removed,and it does degrade the image to the observer. We represent this vibration with anMTF "destroyer," or simply another MTF. This line of sight (LOS) stabilization MTFcan either be read as a model input or assumed to be gaussian and have the form
HLOS (f.) exp ( - pf.2), (19)
where P is calculated from the variance of the vibration stabilization.
6. Eyeball. The last system component is the observer's eye. The formused for the eyeball transfer function is a simplified version of the for;n found in work
done by Kornfeld and Lawson." The MTF has the form
HEYE (fx) = e (20)
for the two spatial directions, where r is a light-level.dependent parameter and M is the* system magnification. Table 3 shows the dependence of r on the logarithm of the
light level. The light level is determined by the average' display brightness from tilescene.
B, NE AT. The noise equivalent temperature difference (NE AT) of a system is
a measure of detector sensitivity. The NE AT used in this model is the peak signal-to-rms noise NE AT for an electronic noise bandpass of
/ -G. Kornfeld and W. R. Lau.on "Visual Perception Model,"J. Opt. Soc. Am. 61.811 (1971).
~ I ,**~ 10•,7 _,-7 '. P,,7

Table 3. 1' as a Function of Log Light Level for the Eyeball MTF
r Log (Light Level in fL).81333 3.9598 2
1.0980 11.4650 01.8300 -12.2773 -22.7653 -33.3347 -43.9040 -5
Af S H(LEcT (f) HB2 (f) HM2 (f) df, (21
n1 f ELfT) MD''(10
where the detector noise power spectrum S(f) is a normalized noise power spectrumfrom the detector (i.e., S(f) equals 1.0 at some measuring frequency fo) and HELECT(f)and HB(f) are defined in equations (15) and (16). HM D(f) is the measuring deviceMTF. In an NE AT measurement, an electronic filter with 3.dB cut.off at V2 7 hertz
is u-,ed, where r is the detector dwell time. Under these conditions 11LE:T and HBare usually 1.0 and the HMD filter is just equation (15) with f. equal to 12r. If S(f) isknown, then equation (21) is carried out exactly. However, if S(f) is white 'henequation (21) reduces to
Afn -- Af (22)2 \2 f
where A fe is the electronic bandwidth. The inverse of the dwell time T is given by thenumber of resolution elements per second, or
i1 _ IFa rovsc (23)Sr nAx Ay iisc
where a and are the horizontal and vertical fields of view (FOV), FR is the frame::'.. •,,:;rate, 77ovsc is the overscan ratio, n is the number of detectors in parallel, Ax and Ay
are the IFOV's in x and y, and %C is the scan efficiency.
' ,". The NE AT for a detector-noise-limited system is given by
"P- -

4F 2 (A f.? )Y,NE AT= 4F (Af*)' (24)
irAd To _" N D i, dX
where F is the objective F-number, Ad is the detector area in square centimeters, 'ais atmospheric transmission over the pa,'l, the NE AT is measured, To is the optical
transmission, AX is the spectral bandpasb, D* is the detector specific detectivity, N isthe number of detectors in series, and i?' is the temperature derivative of the PlanckX@
radiation (equation (3)). The N series detectors are assumed to have uniform D,. Aderivation is given in Appendix A. A shot-noise-limited system NE AT is given by
NET4F 2 (A fn)Y sin (0/2)S~~NE AT = (257 Ad Ta ro On D dX
where 0 is the cold shield angle of the detector geometry and DX is the ,jhot-noiselimited specific detectivity which is independent of detector field of view.
C. MRT. The minimum resolvable temperature difference (MRT) in the scanning
(direction is defined as the minimum temperature difference needed to resolve a stand-ard iour-bar pattern with 7:1 aspect ratio orien;ed vertical to the scan. MRT will be afunction of bar frequency. The MWT can be calculated once the NE AT and componentMTF's hl've been computed, and its form is derived in Appendix A. In the scanningdirection, i.e., the bars oriented vertically, MRT is given by
MRT(f). NEAT __Y__fQ __ ½, (26)MS 4-i MTFTOT(fX) Afn FR tE •7OVSC
where
SNR = signal-to-noise ratio necessary to recognize the four-bar pattern.
MTFTOT (fx) = HOPT HDET " HELECT " HB HDISPLAY HEYE HOS = H1(fx)"
Ay = vertical IFOV in mr.
v"= detector scan velocity in mr per second.
•f= target frequency in cycles per mr.
K ;•.. .1...
12 : :. i . . .
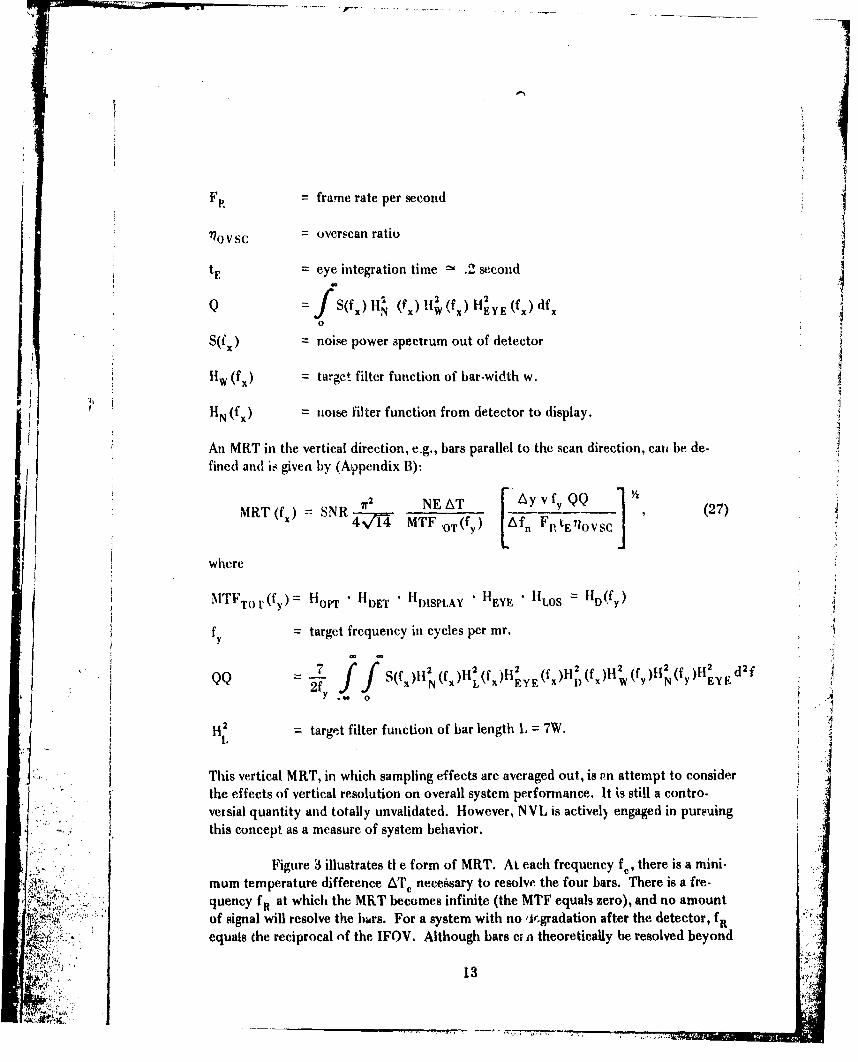
F= frame rate per second
0 VSC = overscan ratio
tF, eye integration time .2 second
Q = (f) (f) it If) EYE (f.) df,0
Sy')= noise power spectrum out of detector
"11w (fx) target filter function of bar-width w.
HN (fX) = noise filter function from detector to display.
An MRT in the vertical direction, e.g., bars parallel to the scan direction, can be de-fined and is given by (Appendix B):
t 2 NETAy vfyQQ Y2
MRT (f,) =SNR N MTF (oT(f7) M FtETOVSC)
where
j *TFTo r(fy Hon NET 'DISPLAY HEYE "HLOS = HD(fY)
f= target frequency in cycles per mr. 2
2S(ff) XL(fx)HEYEX 2 D(fx fy (fy) Y d2
QQ 2f N.Y
H= target filter function of bar length L. = 7W.L
This vertical MRT, in which sampling effects are averaged out, is Pn attempt to considerthe effects of vertical resolution on overall system performance. It is still a contro.veisial quantity and totally unvalidated. However, NVL is activel) engaged in pursuingthis concept as a measure of system behavior.
Figure 3 illustrates tt e form of MRT. At each frequency f, there is a mini-mum temperature difference ATC necessary to resolve the four bars. There is a fre-quency fR at which the MKT becomes infinite (the MTF equals zero), and no amountof signal will resolve the burs. For a system with no ,Ir.gradation after the detector, f
. equals the reciprocal nf the IFOV, Although bars era theoretically be resolved beyond
.•13 ,,. • ,.., .,1,

this ;requency because of the wings of the sinc funct'on, practically it is a limit to sys-tem resolution. Real systems attsin only 60 to 90 percent of this theoretical cutoff fR
Ka-
Aic
II
fC fR FREQUENCY
Figure 3. Representative MRT curve.
D. MDT. The minimum detectable tenperature (MDT) of a thermal device isdefined as the minimum temperature difference between a square (or circuli~r) targetand the background necessary for an observer to perceive the source through the device.MDT is then a function of target size and represents the threshold detection capabilityof the system. It cain be deuived from the same signal-to-noise. expression as that usedto derive MRT. The result from Appendix A is
NEATS' Ayv ]M2T 2S2 FR tEA f (28)AT H Hd f [?VC
L _
Figure DISLA Rp Eset YiE RT cuDe
D.MD.Th mnmu dtctbe emeatre(DT f tema dv1ei
7 eie stemnmmtmeauedfeenebtenasur o icl~)tre

where
AT = target area in square mriiradians
S' = threshold signal-to-noise ratio
HT = target transform =- HL x Hw
HD = total device and eyeball MTF = MTFTOT.
Figure 4 illustrates the form of MDT as a functiutni of reciprocal target size.For any target size a in milliradians, there is a ATD which is the minimum temperaturedifference necessary for the target to be detected. There is no asymptote fot MDT asthere is for MRT since any size source can be detected if hot enough. An arbitrarilysmall target .;an b- detected if its signal strength is large enough to excite one IFOV,i.e., a thermal device is capable of "star detection."
Laii
W M
a (SIZE)"
Figure 4. Representative MDT cunre.
15
0 .'
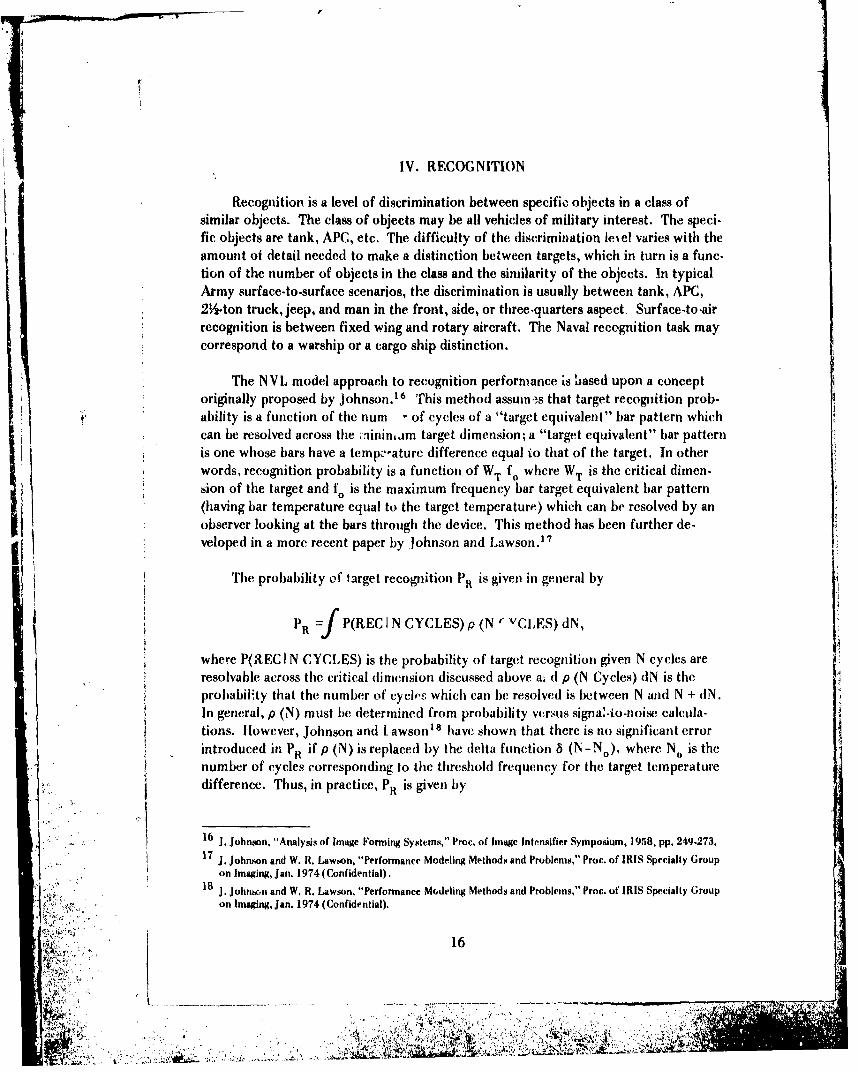
IV. RECOGNITION
Recognition is a level of discrimination between specific objects in a class ofsimilar objects. The class of objects may be all vehicles of military interest. The speci-fic objects are tank, APC, etc. The difficulty of the discrimination iclel varies with theamount of detail needed to make a distinction between targets, which in turn is a func-tion of the number of objects in the class and the similarity of the objects. In typicalArmy surface-to-surface scenarios, the discrimination is usually between tank, APC,2.i-ton truck, jeep, and man in the front, side, or three-quarters aspect, Surface-to-airrecognition is between fixed wing and rotary aircraft. The Naval recognition task maycorrespond to a warship or a cargo ship distinction.
The N V L model approach to recognition performance is based upon a conceptoriginally proposed by Johnson.' 6 This method assumes that target recognition prob-ability is a function of the num - of cycles of a "target equivalent" bar pattern whichcan be resolved across the ;.aininjm target dimension; a "target equivalent" bar patternis one whose bars have a tempz".ature difference equal io that of the target. In otherwords, recognition probability is a function of WT fo where WT is the critical dimen-sion of the target and f0 is the maximum frequency bar target equivalent bar pattern(having bar temperature equal to the target temperature) which can be resolved by anobserver looking at the bars through the device. This method has been further de-veloped in a more recent paper by ,johnson and Lawson.'
The probability of target recognition Pa is given in general by
PR =f P(REC I N CYCLES) p (N" VCLES) dN,
where P(REC I N CYCLES) is the probability of target recognition given N cycles areresolvable across the critical dimension discussed above al d p (N Cycles) dN is the
* . "probability that the number of cycles which can be resolved is between N and N + (IN.In general, p (N) must be determined from probability versus signa.-io-noise calcula-tions. However, Johnson and Lawson18 have shown that there is no significant errorintroduced in P if p (N) is replaced by the delta function 8 (N-No), where No is thenumber of cycles corresponding to the threshold frequency for the target temperaturedifference. Thus, in practice, P is given by
,16 ..Johnson, "Analysis of Image Forming Systems," Proc. of Image Intensifier Symposium, 1958, pp. 249-273.
*1 17 J. Johnson and W. R. Lawson, "Performance Modeling Methods and Problems," Proc. of IRIS Specialty Groupon Imaging, J an. 1974 (Confidential).
18 j. Johnson and W. R. Lawson, "Performance Modeling Methods and Problems," Proc. of IRIS Specialty Group
on Imaging, Jan. 1974 (Confidential).
16
4i ý7. . ::,::: .,.
•1•• ,•.•.,., t. .. ".;.•,.:-' •t"• ': •' ,. . ,•,I,•..,• ... ...... .oi • ,•,. "• ;•'•,,e•ED i.. .z• •--r•...... . .. • 7"W

Pt, P(RECI IN cycles).
The relationship between probability of recognition P(RECI N.) and number ofresolution cycles across a target is a fundamental relationship which must be determinedon the basis of existing field data. Investigation of experimental results shows that thisrelationship is also depcn(dent on the azimuth angle of the target. For example, whereasit might take three cycles across the, side view of a vehicle for 50% probability of recog-nition, it takes four cycles across tle front view to recognize with the same level ofcertainty. This variation with aspect is especially pronounced in tasks involving shipand aircraft targets. The resolution needed to recognize the bow aspect of a ship is inmost cases many times greater than that nceded for the beam aspect. Table 4 showsthe several relationships which are prime candidates for this fundamental functionaldependence of recognition on resolvable cycles for Army terrestrial targets and mostside-view military targeis. The most correct relationship is probably somewhere be.i' ~tween these two extremes.
Table 4. Probability of Recognition as a Function of Number of Cycles AcrossTarget Critical Dimension for Army Vehicles
Prob o, Recog # of Cycles # of Cycles
1.0 12 9.95 8 6.80 6 4.5.50 4 3.30 3 2.25.10 2 1.5.02 1 .75
0 0 0
" T11 ethd of determining resolution across a iarget to establish P(RECINo>) hs
been hiorically to use the horizontal or scanning direction resolution capabilityagrainst the target minimtum dimension which is usually vertical. This does not take
into account vertical resolation or the. sampling effects in Jhat direction. Frequently,Svertical rcsoiution is noticeably, orse tIhat the resolution in the scanning direction,Sand some account shouhl be t akcn of it. ý'crk is presently being cor:,'ucted to consider
J ' if some s•ort of av.-+ragin- m".thod betwer, the two directions is desirable (gocs betterresults). Considcrati,,,s like these alon,,g withdifferences between field and laboratoryresults and uncertainty in th.+ true critical dimension create uncertainty in the exactrelationship between i.,,cognition probability and iimber of resolvable cycles.
Tihe number of cycl:s acros' the targt is oi)bained from the MRT curve. Thet(temperature difference AT'I' uvilable -it tkc sensor after attenuation by the atmosphere
17
+,+,, '"',7:: . ....
4.
~a
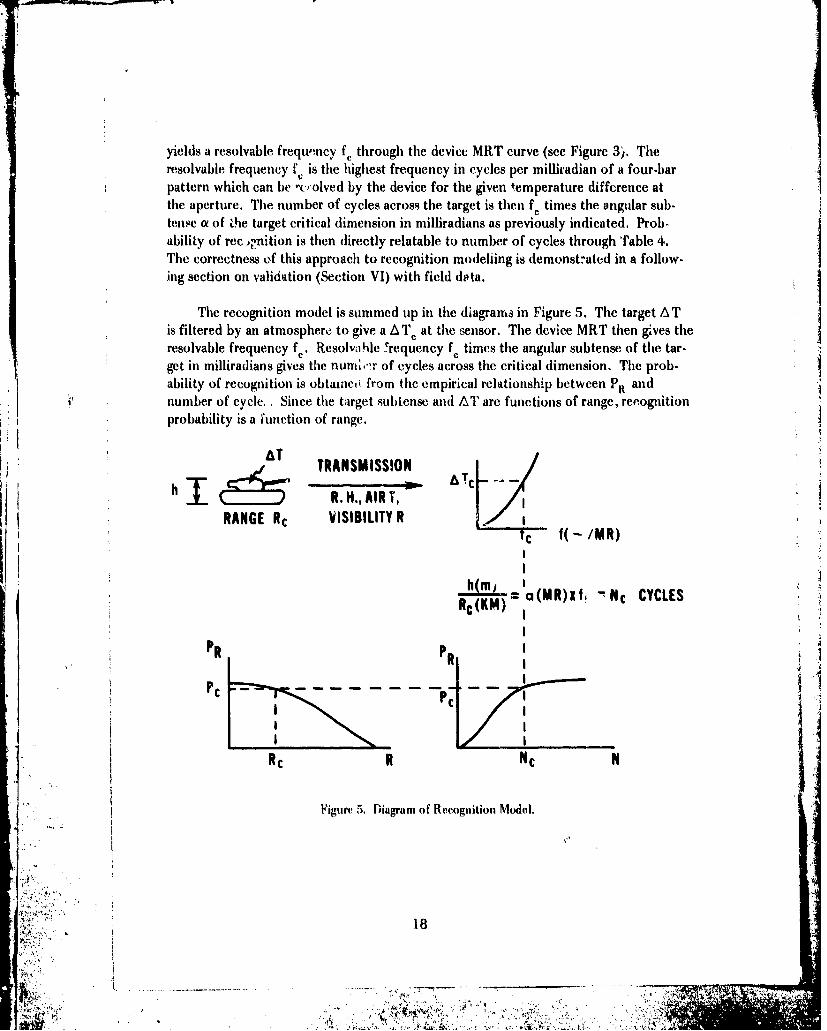
yields a resolvable frequency f through the device MRT curve (see Figure 3). Theresolvable frequency f., is tile highest frequency in cycles per milliradian of a four-bar
pattern which can be -c..olved by the device for the given temperature difference atthe aperture. The number of cycles across the target is then f times the angular sub-tense a of Vhe target critical dimension in milliradians as previously indicated. Prob-ability of rec ,•,nition is then directly relatable to number of cycles through fable 4.The correctness of this approach to recognition modeliing is demonstrated in a follow-ing section oil validation (Section VI) with field data.
The recognition model is summed up in the diagrams in Figure 5. The target ATis filtered by an atmosphere to give a ATe at the sensor. The device MRT then gives theresolvable frequency f " Resolvdhle 'requency fe times the angular subtense of the tar-get in milliradians gives the nundo,'- of cycles across the critical dimension. The prob-ability of recognition is obtaine, from the empirical relationship between PR andnumber of cycle. Since the target subtense and AT are functions of range, recognitionprobability is a function of range.
KIATAT TRANSMISSION
h j:Z R.H.,AIRT, T .TcRANGE RC VISIBILITY R
c f(-/MR)
h(m, a(MR)xf, --Nc CYCLESRc(KM)
p IPR PR
PC --- I
Rc R Nc N
Figure 5. Diagram of Recognition Model.
18
,I. . .. . .. .,- . . ._ . . .. . . . . ..__, -K",
V. I)ETECTIOrN
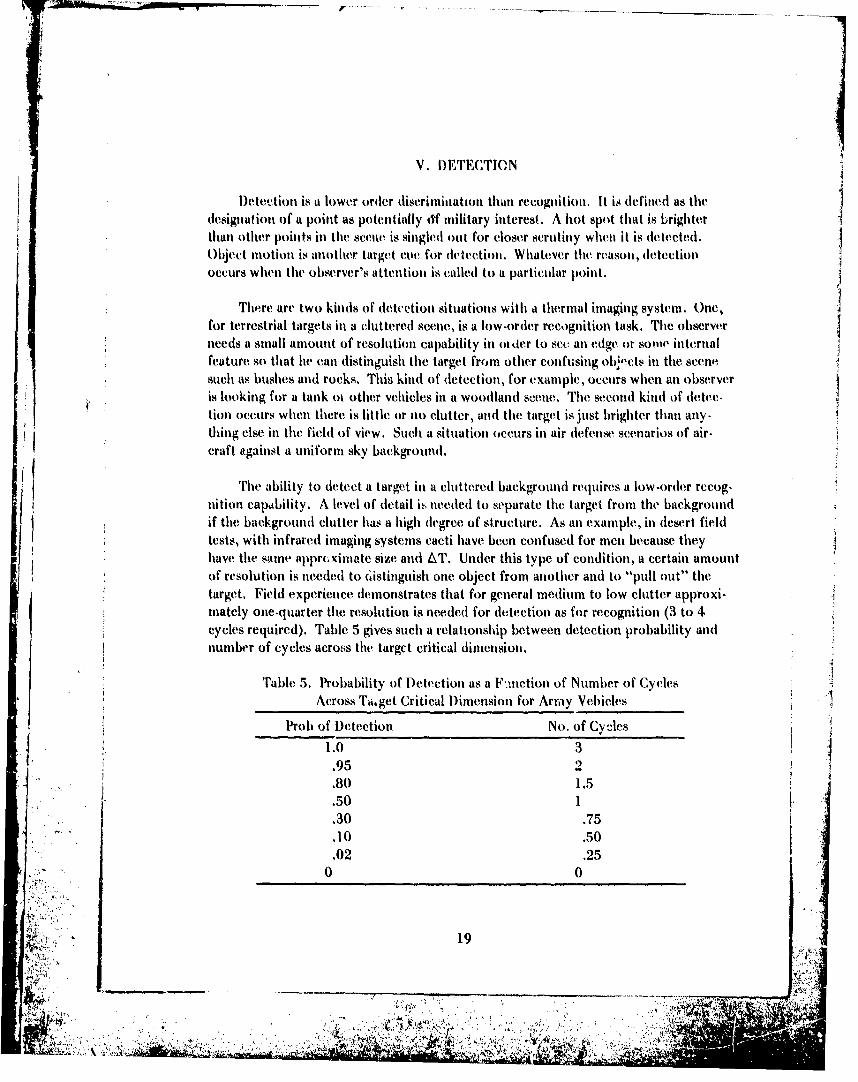
IDetection is a lower order discriminuation than recognitiou. It is defined as thledesignationi of a Point as potentially df military interest. A [hot spot that is brighterthan other points in the icerie is singled out1 for closer scrutiny whent it is detected.object motion is another target eve for delectiott. Whatever the reason, detectionoccurs when thle observer's attention is called to a particular pioint.
There are two kinds of detcetion situations with a thermal imaging system. One,for terrestrial targets in a cluttered scene, is a low-order recognition task. Thle observerneeds a small amount of resolution capability in oi tier to see anl edge or som'e' internalfeature so that lie canl distinguish thle target from other confusinig ohb;cts in the scensesuch ats bushes and rocks, This kind of detection, for example, occurs when anl observeris looking for a tank oi other vehicles in a woodland scene. Thle second kind of detec-tion occurs when there is little or no clutter, and thle target is iust brighter than any-
thing else in thle field of view. Such a situation occurs in air defense scenarios of air-
nition capdbility. A level of detail it, needed to separate thle target from the background
if the background clutter has a high (degree of structure. As anl example, in (desert fieldtests, with infrared imaging systems cacti have been confused for mnii because theyhave the same apprcximate size and AT. Under this type of condition, a certain amountof resolution is needed to (listinguish one object from another and to "pull out" thletarget. Field experience dIemonstrates that for general medium to low clutter approxi-
cyces eqire).Tabe giessuch a eainhpbetween detection probability and
Across Ta.get Critical D~imension for Array Vehicles
Prob of Detection No. of Cycles
1.0 3
80 1.0
19
~.

As already mentioned, there arc Army missions ti wltich true "hot spot" or"star" detection occurs with thermal devices. Aii inoraiug aircrt'ft avijist a uniformsky background onl an air defense perimeter is su:.; a case. If the target is hot enoughto activate olie IFOV, although i' subtends an ang;,. much smaller, it stands out as abright blur from the background. Under these condi'iovts dot',-iou is: function ofsignal-to-noise ratio and not cycles across the target..
The signal-to-noise ratio used for this "star" detection is calculated using the MDTequation. Equation (2%) can be turned around to calculate the signal-to-noise ratio Sof a target of size given by H1T and signal strength AT. Then
S - E T III Hi•, d 2f A. ( 9NE AT() AD1 f T1 1I7 dVSf [ FR tE Ac ]i (29)
x s(f,) 1 2 11 2g 1- 2 '11 d 2ffiiELECT IDISPLAY HEYETD
[ ." 0 fS then varies with range R to the target.
The relationship between S and probability of detection must be empircallydetermined as in ith case ol' recognition and subjective resolution. There is not a largedata base of field data to determine this rerl'ionship. However, for the present, afunction such as that determined by Rosel! ot al. from laboratory experiments can beused."9 This relationship is shown in Table 6.
Table 6. Probability of Detection as a Function of Signal-to-Noise Ratio from Rosell
Probability of Detection Signal-to-Noise Ratio
1.0 5.5.9 4.1.8 3.7.7 3.3.6 3.1.5 2.8
.4 2.5
.3 2.3.2 2.0.1 1.5
0 0
19 F. A. Rosell r.nd R. H. Wilson, "Performance Synthesis of Electro-Optical Sensors," AFAL.TR.74.104, Air
Force Avionics Laboratory, WPAFB, Ohio, April 1974, p. 17.
20
?. ;:47...... 7 7 - 7
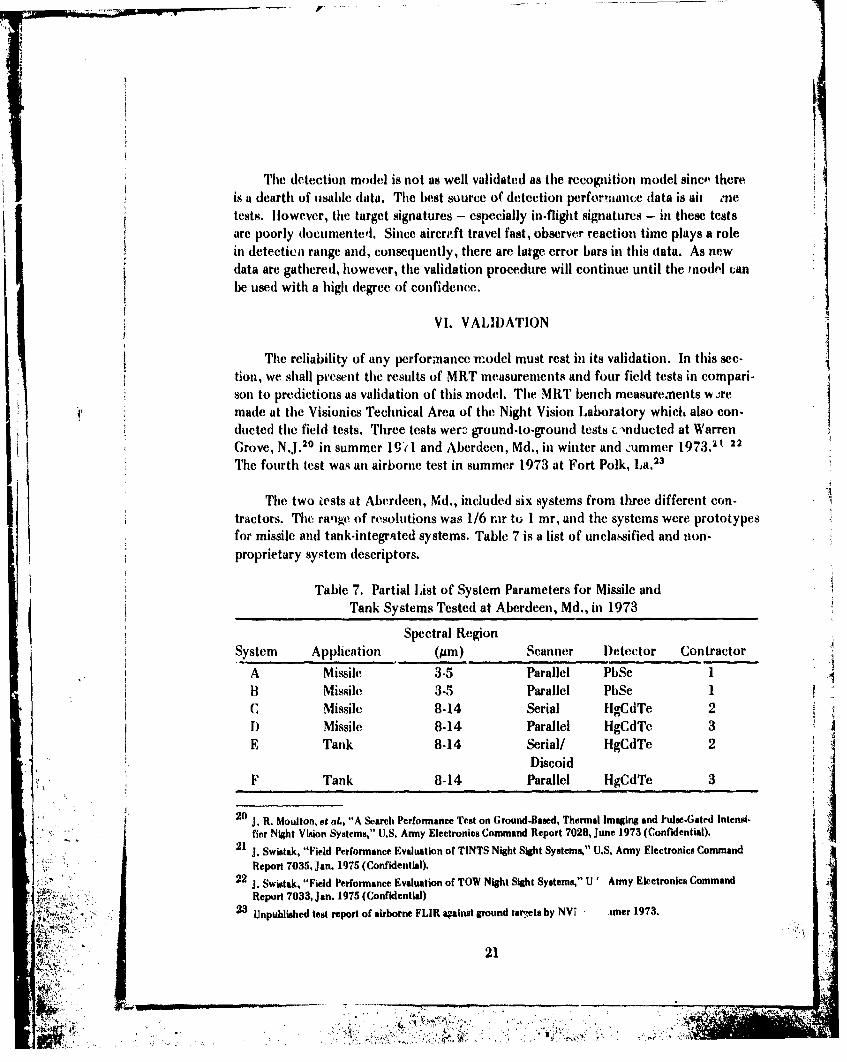
Tie detection model is not as well validated as the recognition model since, thereis a dearth of usable data. The best source of detection perfor-,mance data is aii metests. However, the target signatures - especially in-flight signatures - in these testsare poorly documented. Since aircraft travel fast, observer reaction time plays a rolein detectica range and, consequently, there are large error bars in this data. As newdata are gathered, however, the validation procedure will continue until tlte inodel canbe used with a high degree of confidence.
VI. VALIDATION
The reliability of any performance model must rest in its validation. In this sec-tion, we shall pr'esent the results of MRT measurements and four field tests in compari.son to predictions as validation of this model. The MRT bench measurements w- remade at the Visionics Technical Area of the Night Vision Laboratory which also con-ducted tite field tests. Three tests werz, ground-to-ground tests c'nducted at WarrenGrove, N.J.20 in summer l9g'l and Aberdeen, Md., in winter and :ummer 1973.21 22
The fourth test was an airborne test in summer 1973 at Fort Polk, La, 2.
The two jests at Aberdeen, Md., included six systems from three different con-tractors. The range( of resolutions was 1/6 rar to 1 mr, and the systems were prototypesfor missile and tank-integrated systems. Table 7 is a list of unclassified and non-proprietary system descriptors.
Table 7. Partial List of System Parameters for Missile andTank Systems Tested at Aberdeen, Md., in 1973
Spectral RegionSystem Application (pm) Scanner Detector Contractor A
,.A Missile 3-5 Parallel PbSe 1I
1B Missile 3-5 Parallel PbSe 1C Missile 8-14 Serial HgCdTe 2D Missile 8-14 Parallel HgCdTe 3E Tank 8-14 Serial/ HgCdTe 2Dj
DiscoidF Tank 8-14 Parallel HgCdTe 3
20 j. R. Moulton, et aL., "A Search Performance Test on Ground-Based, Thermal Imaging and Pulse-Gated Intensi-fier Night Vision Systems," U.S. Army Electronics Command Report 7028, June 1973 (Confidential).
21 J. Swistak, "Field Performance Evaluation of TINTS Night Sight Systems," U.S. Army Electronics Command
"Report 7035, Jan. 1975 (Confidential).
.22 Swistak, "Field Performance Evaluation of TOW Night Sight Systems," U' Army Electronics Command
Report 7033, Jan. 1975 (Confidential)23 Unpublished test report of airborne FLIR against ground tar',ets by NVI ner 1973.,
,- 21
3.1
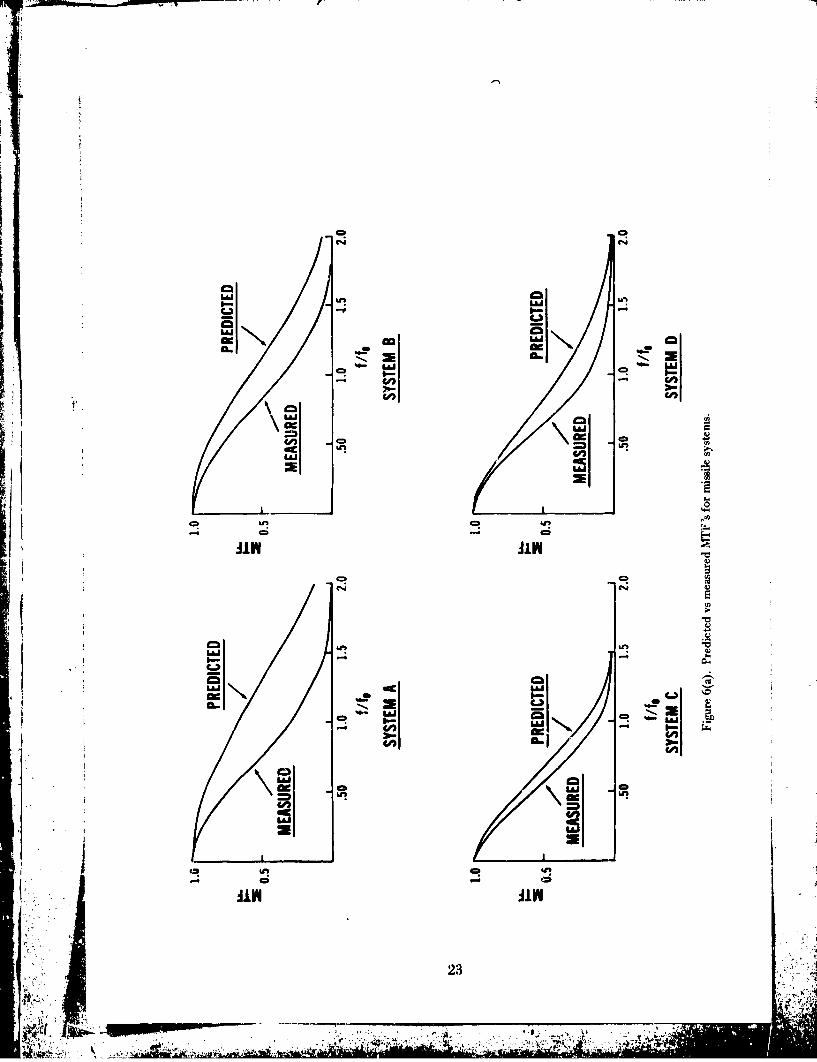
The comparison of measured and predicted MTF's for the four missile devices isshown in Fig-are 6(a). The MTF predictions for systems A and B underline one of themain problems in performance modelling of prototype systems. The MTF and MRTpredictions must be made on the basis of numerous systems engineering inputs all ofwhich are seldom known by contractor or government engineers. Especially in proto-type systems, components are in a constant state of change or may not even be con-
structed at the time of the analysis. Consequently, sometimes obsoletL inputs are usedwhich have no relationship to the actual or real.time components or they have to befabricated on a best-estimate basis. This establishing of system parameters turns outto be tile most difficult task for the systems modeller. Systems A and B are deviceswhich are not accurately specified.
Sys! -ins C and D in Figure 6(a) plus E and F in Figure 6(b) show reasonable agree-ment between predicted and measured MTF. Of these, system 1) shows the worst agree-ment; since the measured performance is noticeably less than predicted for such astraightforward quantity as MTF, the implication is that some system component isnot performing up to specification and is causing a degradation.
The MRT calculations for these systems are found in Figures 7(a) and 7(b).They were all calculated using the SNR in equation (26) equal to 2.25. This value forSNR appears to give the best overall agreement between predicted and laboratoryresults.
Systems A and B in Figure 7(a) show some discrepancy in the resolution-limiledregion due to the difference in predicted and measured MTF already mentioned. Thedifference in the noise-limited region for System E in Figure 7(b) possibly implies someunaccounted for noise source or processing which is being neglected in the analysis.
Recognition performance against the side view of tanks is shown in Figures 8(a)_ and 8(b). All calculations were done with the 4 cycles equals 50 percent curve shownin Table 4. The data points are shown by circles, and the tank systems field test haserror bars associated with each point. The tank was a hot-running signature underhighly transmissive atmospheres (clear, low rolative humidity night). The agreementin the tank test is excellent while predictions appear to be short in the missile test -especially for Systms A and B in Figure 8(a). This was due to ctues t!,at were presentin this test. Tank drivers had comfort heaters on during this winter 'est causing obvioushot spots on the targets. The trained observers were quick to pick , p this cue and useit as a recognition cue. This kind of field behavior underlines 10k, need for a !ued-target recognition model.
Performance of these six sysiems against front views of tanks is sl,'oNv n in Figures9(a) and 9(b). The tank test again shows excellent agreement. Th misil test results
22
,I
"MMI
aLa
Lai-
'L&J
C= =A r.,
La.
AIN AINC).)
C4-
CA.
a.- C-Dcc CD LA
wUU) a- l
uU)c;I
23
:v", "N.
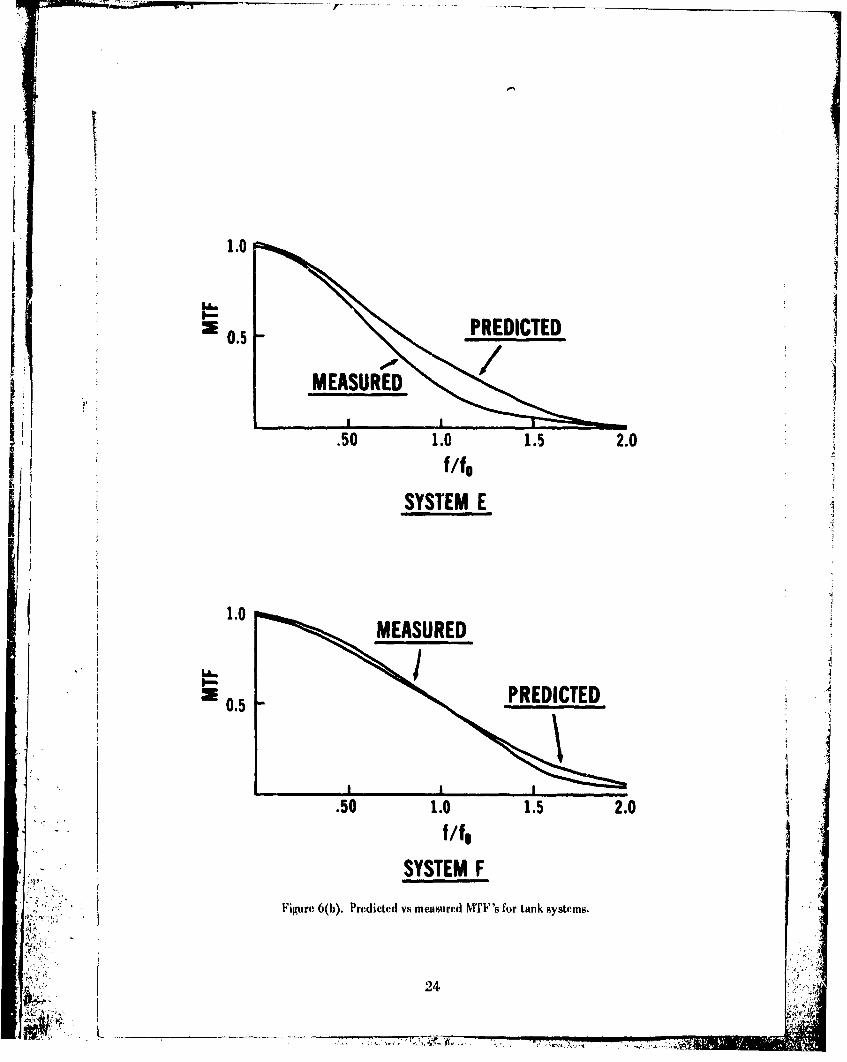
1.0
1dm
E 0.5 PREDICTED
MEASURED
.50 1.0 1.5 2.0
0.5 PREDICTED
f/fe
SYSTEM FFigure 6(b). Predicted vs meamired MT'F'8 for tank systems.
24
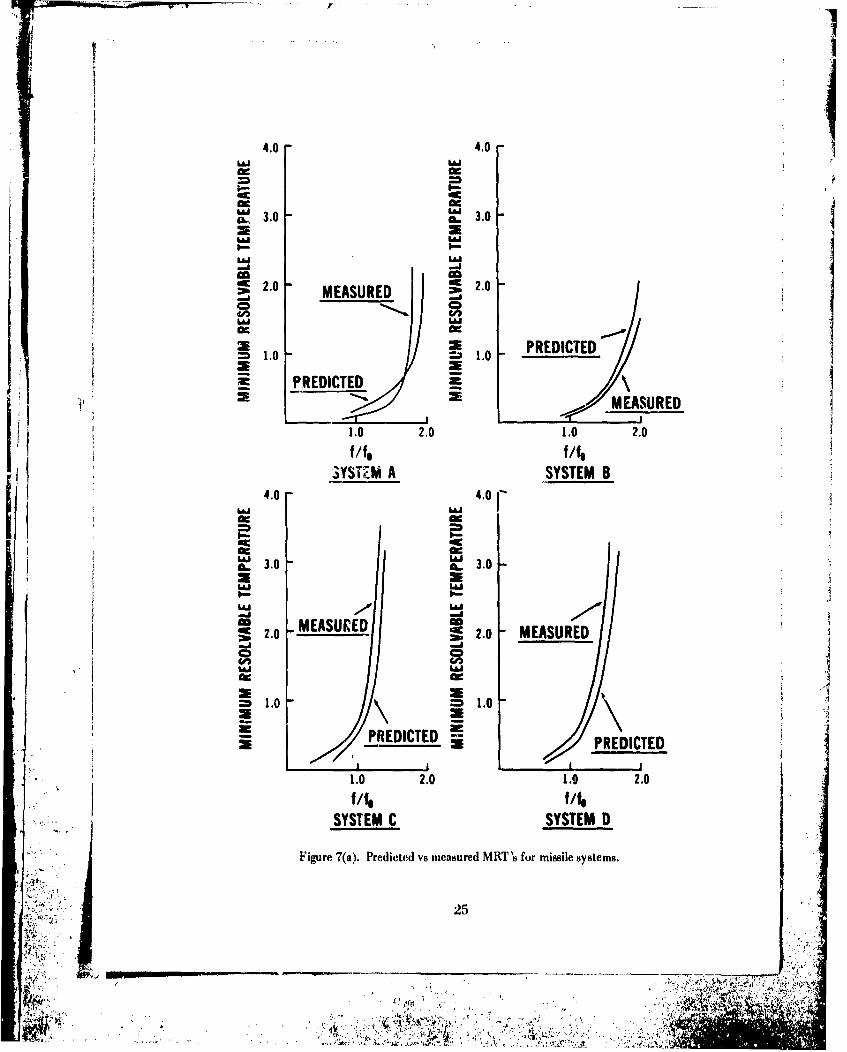
4.0 4.0LaJ L".
I1.
ccS3.0 3.0
LU W
~ 2.0 MEASURED ~ 2
ZESME1.0
1.0 PRD)TD)PREDICTED
2 MMEASURED
1.0 2.0 1.0 2.0
f /f. f/fl.3YST'O-M A SYSTEM B
4.0 4.0ILU mii ~~3.0 3.0 ___
2. MEASURED c
1.0 20 2.0 20SUEf/f f/f
SYSTE C YTE6Fiur 7() rdst smasue R' oisl ytm
25
-. ,~.-..A
ME ~i
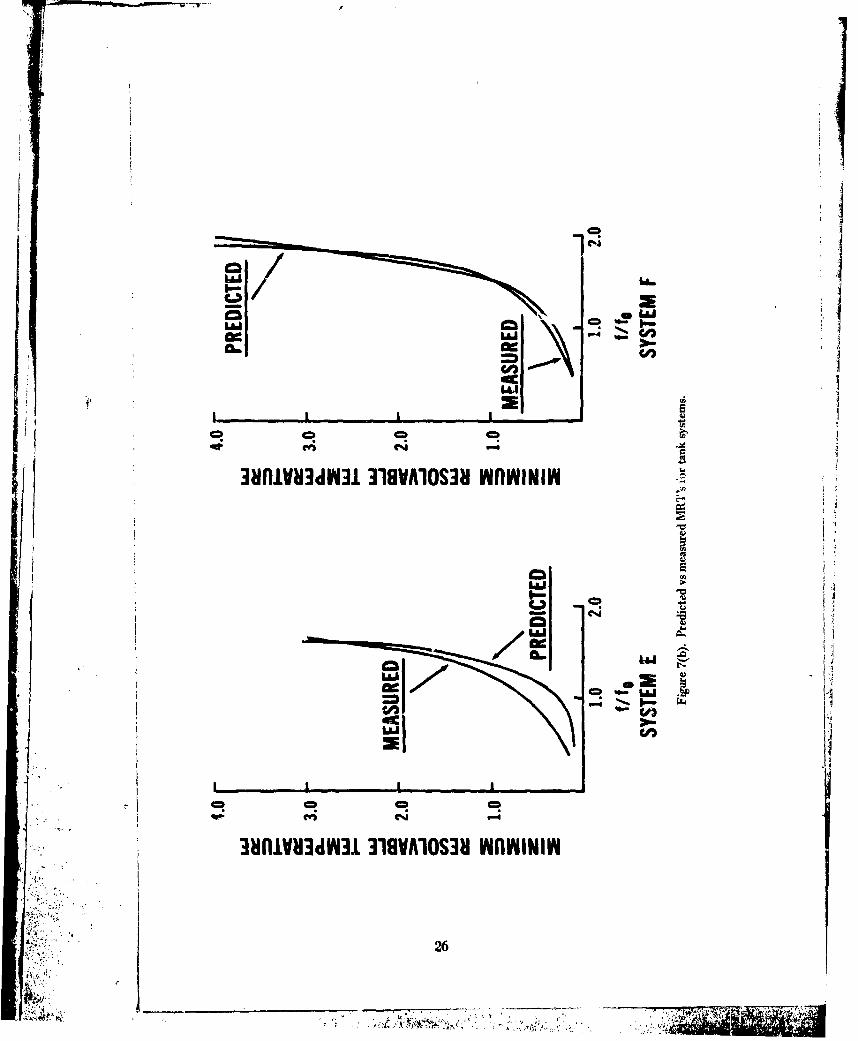
C41
LAAU
ILZEE
__Al
MniffliV dffl1 318VAlOS38I WOWYINIYW
26
V4*

- ~ - -
L n C4
caa
00
C4)
C In!
h- -lve u
274.
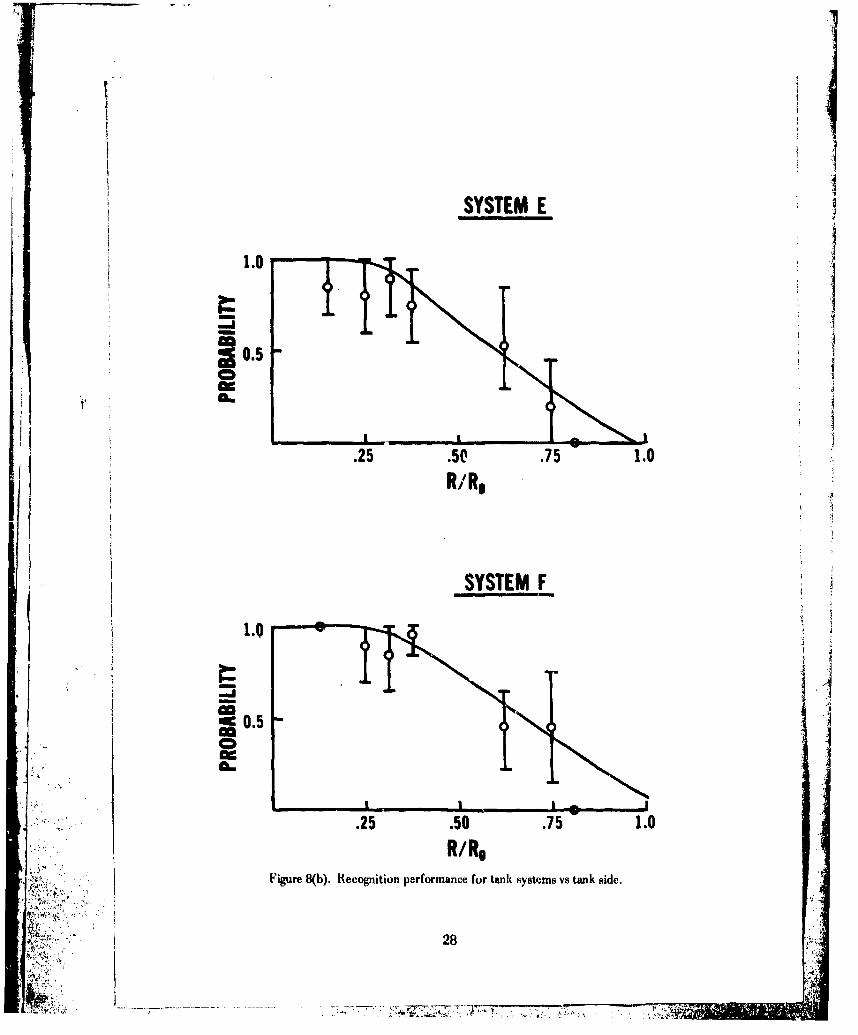
SYSTEM E
1.0
I0.5CD
.25 .50 .75 1.0RAO,
SYSTEM F
1.0
IN 0. ccA
.25 .50 .75 1.0R/R,
Figure 8(b). Recognition performance for tank systems vs tank side.
28
0
00
0000
Woo Cb0
00
000In
cc 0hIn
cinI
CC
0 100 0
00/00
%nn
AI~lIUVU~0 04 cc1IVU
0 0
0 2900

SYSTEM E
1.0
10.5CDI
.25 .50 .75 1.0R/Ro
1.00
show a steeper slope than tile predicted slope for Systems C and 1) in Figure 9(a).
Thil: was possibly caused by two different reasons. First, this was a metlhod.of-limitstest. Tie target vehicle,; started at a constant range and moved slowly toward tleobservai:on point until recognition was'recorded. Hence, the performance as a function
of range must go to zero at the starting range, causing tle slope to be steeper thanusual. Second, tile targets approached the observers across a muddy field which tendedto degrade tile IR signature due to splattered mud and water on the vehicles.
The only airborne test with results applicable to the NVL model validation wasconducted at Fort Polk, La., in 1973. Previous tests have tended to be operational testsnot designed to acquire model validation data. A notable exception is the MAFLIRtest conducted at Patuxent River by tlc Air FDorce." Te level of discrimination intifs test, however, was not high enough to be of use for our purposes.
Detection and recognition performances are sclwn in Figure 10 for tie Fort Polktest. The targets were operatiolal vehicles in a clear atmosphere. The results plottedby circles and X's are empirical recognition and detection data of tracked vehicles.The predictions indicated by curves cnsidered only a side-view tank with the four-cycle criterion for recognition at 50 percent and the Table 5 criterion for detection.Since the FUIR was mounted on a stabilized airframe platform, an LOS transfer fune-tion based on the stabilization of the gimbals was used. The agreement shown here isconsidered very good,
The graph shown in Figure 11 is for a ground surveillance thermal system thatwas tested at Warren Grove, N.J., in 1971. The target is an operational tank in theside aspect. Tile circles representing tile data points give good agreement with the
predhictedl curve.
The validation results shown in the figures represent an approximate accuracy oft 20% in range which is considered state-of-the-art for modelling. Hlowever, all theseresults have been for optimum target and atmosphere. Degraded performance underSadverse target and atmospheric conditions has not been validated because of the lackof field data for these conditions. Field performance against degraded targets andatmospheres has been attempted by this laboratory; however, such targets and atmo-spheres do not remain constant sufficiently long enough to obtain sufficient statisticaldata on them. A target's tracks can change temperature and a fog can roll in beforetwo observations through a device have been made.
Recognition and detection performance can be seriously impacted by adversetarget and atmospheric conditions. A passive target, a mud caked signature, a haze24 D. C. Winter, "Infrared Image Test Prograrm - Variable Analysis," AFAL-TR-72.384, Air Force Avionics
Laboratory, WPAFB, Ohio, March 1973 (Confidential).
31
•...+

144
ac
.- 0
aam
x~ 40
I- ~- C3
ccx
Alillveol
x 32

1.0
1.5 j.25 .50 .75 110
Figuie 11. Recognition performance of ground surveillance system vs tank side.
with particle size that scatters IR radiation, or high relative humidity can cause signifi.cant performance range reduction. These conditions can have a high probability of
occrrig n schenvironments as those found iii West Germany. An example of anatmsphricdistribution is shown in F'igure 1 2 .'s
1.0
5 GERMAN0.8 CITIES
0n.6
4 8 !2 16
VISIBILITY (KM)Figure 12. G rma ighttime visibilities.
JI4~ 25Unpublished report on environmental analysis by R. Bergeinann of Viajonice Technical Area, NVL.
I,'
VII. CONCLUSIONS
The present NVL and AMC static performance model for detection and recogni.tion has been documented in the preceding text. The actual computer program isfound in Appendix C along with its operational use. The model is in a constant stateof evolution and refinement as new field data is incorporated into the validation databank and new systems concepts must be analyzed. The present approach to detectionuses a signal-to-noise ratio calculation based on MDT, and recognition utilizes the MRTwhich is derivable from the same signal-to-noise ratio. This approach gives a unifiedtheory upon which detection and recognition are based. The relationships betweendetection and signal-to-noise ratio and recognition and resolution are fundamentaland empirically derived functions. The accuracy of the present model is assumed to be± 20% in range for recognition under favorable target and atmospheric conditions.
Work is presently being dooic on several areas of improvement needed in the model.The detection model must be validated as must the degraded conditions for recogni-tion. These depend entirely on the acquisition of new field results with statisticallyvalid data under these conditions as well as sufficient documentation of the target and
atmospheric parameters. In addition, a complex target model can be deve!oped tohandle the more intricate target cues, and a low-transmission atmospheric capabilityfor fogs, smoke, and dust can be added.
In the area of improved recognition models, we must include vertical resolutionand possibly sampling effects. This is presently in the conceptual stage only since itis not yet fully understood how a vertical MRT should be measured and no data existwith respect to vertical resolution. Coupled with a vertical-resolution capacity, a more
scientific method must be developed to choose the critical target dimension instead ofminimum dimension. Further, the probability of recognition as a function of resolv-able cycles must be amended with the variation of this function with target aspect.
While these limitations are being addressed and solved to an acceptable d-gree,the AMC static model must be incorporated into a general search model in order thatall Army target acquisition problems concerning thermal imaging can be analyzed.
34
tu. *1 I. :,A E

APPENDIX 4
NE AT, MRT, AND MDT DERIVATIONS
In thils Appendix, dlerivationls are given of the noise equivalent temperature(NE,!ý'l), the inininiurai resolvable temperature (INRT), and thle minimum dutectabletemperature (MDT). Complete and simplified expressions are given for each quantity;the complete expressions provide a basis for rigorous analyses while thle simplifiedexpressions provide a ineanis for obtai- ing reasonable estimates thin use of handckCalculations.
Neither diheconcepts nor the finial relationships containedI herein are nlew. TheNE AT (lcrivaiiont is similar to anl analysis in jamiieson. Al The MRTr andi MD)T deriva-tions arc slightly different fromn others of which thle autltor is aware. Tho techniquesemployed to derive MRT and NI)T are equally applicable to the (lerivatioii of subjec.tive resolution relationships for intensifier arid LLLTV viewers.
Terminology:
NE AT - Noise. equivalent temperature
MRTr - Minimium resolvable temperature
MDT - Minimum detectable tem pera tutre
t - titte
l() (t) - anl out put signal
ii~t) anl input signal
ht 1) -temporal response function
f -frequency
'0 (f) - imi~rier Iravislorin of j (t)- fourier transform. of i((t)
U~ -I ia<~'I~m w~on(fourier transformn of h(t))
owF - pIt' transfer f'mnction
Al k* a.Jeumka,e~t al., Inafrare~d HMysicsaouI ItWignaering. M( r~aw Itil New YorL, 1963.
35
~'h
MTF - modulation transfer function
R~r) - auto-correlation function
S(f) - power spectrum
< ) -. ensemble average
7 - time difference
a - RMS value of a random process
r - detector response function
vS(t) - a (voltage) signal
- watts/micron on the detector
D* (X) - detector detectivtyo
D•Q() - detector detectivity (no cold shielding)
j 0I- focal length
17,k - optical transmission
T -temperatureI. - radiance from source (target)
IIFOV - horizontai field of view
VFOV - vertical field of viewtE - eye integration time
r ovsC - overscan ratio
FR - frame rate
n - number of detectors in series
n, - number of detectors in parallel
r/cs - cold shield efficiency
rD - picture element delay time
17sC - scan efficiency
"" 0 - cold shield angle
W - an integral (equation 24)
i (x,y) - spatial signal
A - area (signal)
k - a constant
M - watts/area from display
Ayj - distance between scan lines
36
4: _T
v - scan velocity
- frequency of MRT bar patterv
! - bar lcength in MRT liar pattern
h - noise function along a line of thie display
fx - spatial frequency (x or horizontal direction)
fy - spatial frequency (y or vertical direction)
& - a threshold signal.'o-noise ratio
,qy - an integral (defined below equation (A45))
P, - an integral (defined below equation (A45))
Py - an integral (defined below equation (A45))qA -- an integral (defined below equation (A51))
Pr A -- an integrai (defined below equation (A51))
PYA - an integral (defined below equation (A51))
S~Preliminaries:
Throughout this sect~oni, elementary concepts and analysis techniques employed
in electrical communication theory are used ['he necessary relationships are presentedbelow; the reader unfamiliar with these relationships could profitably read the firstthree or four chapters of Wozencraft and Jacobs.A 2 (It is possible to derive NE AT,MRT, etc. without employing these concepts; however, as with any process, employ-ment of inproper tools to perform a task leads to clumsiness and inefficiency.)
An output signal from a linear system (circuit, optical device) is equal to the inputsignal convolved with the respons(; function of that system, i.e.,
io(t) = ii(t) * h1(t) = ii(t')h(t-t')dt' (AI)
where io(t), ii(t), and li(t) equal the output signal, the input signal, and the system
response function, respectively. The response function h(t) is simply the system out-
put for an input pulse approximating a Dirac delta function. If both sides of equation(Al) are fourier transformed, the expression
.o(f) = Ij(f)H(f) (A2)
is obtained. Here Io(f), 1i(f), and H(f) are the fourier transforms of io(t), i1(t), and h(t),
A2 j, W. Wozencraft and I. M. JacobA, Principles of Communication Engineering, Wiley, New York, 1965.
-- AS.... = ' . t-: .'..•. ,• • .. ..... .. t•.•. •.. •.. -~.,,C.•'
respectively. The quantity 1i(f) is referred to as the transfer function of the system.The one-dimensional (spatial) version of H(f) (i.e., the fourier transform of the linespread function) for an optical system corresponds to the system's optical transferfunction (OTF) whose absolute value equals the modulation transfer function (MTF)of the systems. In equation (A2), the quantity 11(f) is said to "filter" the signal 1I(f).Note that if a signal is passed thru two systems in series the output from the firstsystem equals the input to the second; therefore, if ii(t) is the input signal and hI (t)and 12 (t) are the response functions of the two systems, the output is given by
io(t) = ii(t) * h1 (t) * 112 (t). (A3)
Correspondingly, the transform of io(t) is given by
10(f) = 1i(f)H1 (f)H2 (f). (A4)
Thus, the "two-system" response and transfer functions equal hI (t) * h2(t) andfII (f)H.2 (f), respectively; e.g., the OTF of a complex optical system equals the productof the component OTF's (ignoring component interactions).
A wide-sense stationary random process (e.g., noise in most clectro-optical view-
crs) can be characterized (in general, not fully) by its auto-correlation function
Ri") = R(t, t + r) < n(t)n(t + r)> (A5)
where n(t) designates the random process and r represents a time difference. Thefourier transform of this function, called the power spectrum of the process, in; given by
S(f) R(r) e - 2nifr dr. (A6)
The brackets in equation (A5) ir," :_t, an average over an ensemble of n(t) functions.The output power spectrum oil noise processes passed thru (filtered by) a linear systemis given by
S0 (f) = S1(f)H 2 (f) (A7)
where S0 and S are the output and input power spectra, respectively. An extremelyimportant relationship between the power spectrum and the variance (At a point) ofthe random process is
Q2 = S(f)df. (AM)
' 38
7 ". -
Since engineers are reluctant to employ negative frequencies and since S(f) is an evenfunction of frequency, it is common practice to redefine the power spectrum such that
a2= r S(f)df (A9)ýO
This latter power spectrum is just twice the one used in equation (A8); this powerspectrum is used for the temporal voltage noise and the corresponding (horizontal)spatial noise since it is the one commonly employed by thermal viewer engineers. Inthe vertical direction, however, the power spectrum in equation (A8) is used.
A matched filter is a filter whose response function is a delayed (shifted), time-reversed (spatially reversed) version of the signal. Thus, if i(t) is the signal function,the response function of the matched filter is proportional to i(t I- t). (In discussingtime functions, casualty becomes a problem; however, the discussion here will not becomplicated by this.) The matched filter is the filter which maximizes the signal-to-noise ratio (signal being the magnitude of the output from the matched filter and noisebeing the standard deviation of the noise fluctuations) at a time ti for the case thatthe noise is additive (independent of the signal) and white (the power spectrum equalsa constant at all frequencies). Note that for the case of a symmetrical signal and fort, equal to zero the matched filter has precisely the same shape as the signal. (Ingeneral, the matched filter is the mirror image of the signal.) Also note that if
I(f) = i(t)e" 2ift di (A10)
then the frequency response of the matched filter is proportional to I*(f), i.e.,
Hm (f) i(- t)e 2w'ft dt = I*(f). (All)
NE AT Derivation:S] The noise equivalent temperature is defined as that input temperature difference
"for a "large" target (a large target being one whose size is large relative to the systemresponse function) which is required to generate a signal (voltage amplitude) just prier
to the display (or after the detector preamplifier) which is just equal to the RMS noisc(voltage) at that point, assuming that the filtering action of the electronics prior to themeasurement point corresponds to that of a "standard" filter. The ambiguities inthis NE AT definition provide at least part of the reason NE AT is viewed with dis-1favor in some ci.rcles; the precise point of measurement and the "standard" filter arenot necessarily identical from one measurement to the next. A second reason NE ATis viewed with disfavor is that it does not relate directly to the signal-to-noise ratioswhich are fundamental for perception of targets on the device display; it is not a
39
~ 7.1- TT

=!1
display signal-to-noise ratio and it is a point signal-to-noise rather than one "averaged"over the target. Ne ertheless, NEAT can be a useful indication of system sensitivity,and (although not necessary) it can be used to simplify the MRT and MDT relations;therefore, its derivation follows.
The detector plus its associated preamplifier is assumed to be a linear system witha response function r(X,t) *hlswtan (t) where r(X,t) is the response function of thedetector in volts/watt and hELECT is the amplifier (and other circuitry) response functtion. Therefore, if the signal onto the detector equals AO (X) i(t) watts/micron, wherei(t) is a normalized time function, the response of (i.e., the signal from) the detector-amplifier system is given by
v(t) A¢ (X) i(t) r(X,t)* h ELET (t)d X
- 2hilt I(f) I IELECT (f) AO r(X,f)dX df (A12)
0
wliere 1(f), 11ELECT (f), and r(X,f) are the fourier transforms of i(t), h ELECT (t), andr(X,t), respectively. Assume that r(X,f) (or r(X,t)) is separable into a frequency and awavelength dependent part; then
r(X,f) = r(Xifo) r_.(kf) (A13)r(X,f 0 )
where r(X,fo) 0 function of f since f, equals a constant and ) = furction of Xo r(X,fo)
since r(X,f) is assunmed to be separable (i.e., r(X,f) = g(X) R (f)).
Equation (Al 2' giving the signal vs can now be simplified to
v r(X 20) dfj A (X) r (Xf o ) dXVs~~~ ~ E-eri! lEfIl;~,C,•(f r(X,fo) f
- 0)/ (AI14). . = i '( t A O r ( X ,I ,, d X
j where i'(t) is defined in an obvious manner.
Th~e RNIS noise voltage corresponding to v,(t) must now be determined. Let 2j(f)equal the power spectrum of the uioist! from the detc•tor. Then the, power spectrumlbeyond the preamplifier (i.e., system withl trans!'er finction il ElE,'(f)) equals
S(f)ll.LcT(f and therefore the desired RNMS noise is given by
40
~2=fS(f)H'Lc (f)df. (A 15).0
Combining equations (A 14) and (A 15), thle. signal-to-noise beyond the preamplifieris given by
S/-v ( f) W (f)df) A6
Equation (A 16) yields the NE AT once thle various v'ariables are recast into more* useful forms, the S/N is set equal to 1 (note that tile NE AT definition can be recast to
"that temperature difference such that S/N = 1"), and i'(t) is set equal to 1. The quantityi'(t) can be set equal to 1 because the signdl is measured (determined) at approximatelythle midpoint of an extended (large) signal; if i(t) 1 at its midpoint then i'(t) will alsoequal one since thle signal is of much greater duration than the response function of thedetector -amplifier system as assumed.
To recast the variables, first note that the detector detectivity D* is given iby
D X (fo~ &d A rQ, 0 ) (A 17)(S(f 0 ))'/'
where A d equals the area of the detector.S (Those familiar with the expression
D=(A d A f n0
NEP
* where A f,. is the bandlwidth andl NEI' is noise-equivalent power, should note thle fllow -ing heuristic derivation:
D~etector sigval-to-noise ratio (Sf1N), 1 = )* (J S(f)df)
A 0r(f)For a small bandwidth around fo, (S/N)f)
(S(f o) A )2
Now, NEP =AO for (S/N),) 1; therc;fore, NEP (Sf)AC)'2
A3 . A. Iaimica Ion aJ.,. Infrare'd Iliysies and IEngineering, McGraw-Hill, New York, 196:m.
*. ~41
"4.1 _14 Z21

A r(fo))
and, therefore, D* - Qd r.E.D.(S(fo)
Solving equation (AI7) for r and inserting into equation (A16), the signal-to-noise ratiois given by
A i), D (X)dXS/N - - (A18)
Ad -fH2 df)AAd S(f) ELECT
where i'(t) has been set equal to 1. Next, note that for a simple imaging systemIi'Ad L
7r Ad2 LL() AT (49
where 77o(X) = the optical efficiency of the viewer
F = the f/number
T - temperature
Ik watts/cm 2/steradian/micron from the source.
Finally, using equation (A 19) for AO, and defining A f, by
A f S=f ) YL12 df, (A20)A f JoS~fo) lFL"ECT
equation (A 18) becomes
wAd AT NS/N = (A21)
4F 2 (Af, )/'
The AT in equation (A21) is the desired NE AT provided the S/N is set equal to 1 and.1~ provided the bandwidth equals the appropriate reference bandwidth.
Te•TI bandwidth to which N E AT is commonly referenced is given by
A fn r/2f,,
•,"[ (HFOV) (V FOV) Fit 17ovsc;: 5 a -i(A22)
. 42
.. ...-... U........................ ....... .. . :.
where HFOV = device horizontal field of view (mr)
VFOV = device vertical field of view (mr)
, Fit' = frame race
7 oVs(C = overscan ratio for the device
11 = nunber of detectors in parallelp
Ax = horizontal detector size (mr)
Ay vertical detector size (mr)
I ?Sc s= s,'i efficiency (fraction of time spent in actually scanning the field).
The initial form for A fn in equation (A22) is obtained from equatior. (A20), first, by
setting the power spectrum ratio equal to I (i.e.. ignoring iny low frequency 1/f compo.n e n t a n d h i g h f r e u e n c r o l o f ) a d , s c o n , b y e q u t in g 1 T t o 1 / ( 1 + ( f / f o . ) 2 )
corresponding to an exponential respon,,:e function for the electronic circuitry. Theexpression for f, is simply derived by setting f equal to / T. where 7l) is the delaytime for a picture element of size A x A y (essentially .he time the detector elementspends on each p)icturc element). The 2 r) corresponds to
(SIN (rf [r d
which is the bandwidth associated with a rect function of duration r
The us( of the "standard" bandwidth given in equation (A22) in place of thebandwidtlt -iven in equation (A20) yields the NE AT values coinmonl) used. Recoug
* nize, however, that the bandwidth given by equation (A20) is the true system noisebandwV,: % 'ý. iod, tlOw- re, a measurement of tho S/N will yield the value given by
% , (.\2i) ua-; .nis bandwidth (assuming H ELECT includes any filtering by themeasb. (device); the SIN calculated using the "standard" bandwidth of equation-, (A22) w,-ould be measured only if H ILECT in equation (A20) were so adjusted (e.g., by
the measuring device) so as to make the true bandwidth of equation (A20) equal tothe "standard" bandwidth of equation (A22).
The S/N (and the NE AT) obtained from equation (A21) is that for a single de-*i• j'< .•tector; this S/N is appropriate for parallel scanning thermal viewers; however, for dis-
coid systems, the S/N obtained ' ,i summing the signals and noises from the number ofdetectors in se.-;, ki ii.nre uv -: In this latter case, a reasonable approximation tothe S/N is the SIN given in equation (A21) divided by (na)½ where n, equals the numberof detectors in series (assuming uniform D 's). In general, blind application of equa-tion (A21) (as well as the MRT and MDT equations) to unconventional systems can
434
p
lead to difficultihs and incorrect conclusions; this problem is usually easily circumventedby simple adjustments to the equation which can be made by anyone having a decentunderstanding of the material presented herein. (More often than not, one only needsto recognize the fact that the noise variances add directly.)
Prior to summarizing the results, several additional expressions and definitions areuseful. First, D* is given by
kDD*- _i__/2 - ?q cs Dx (2F) (A23)
h' sinO/2 q D
where D** is D* for no cold shielding and 100% quantum efficiencyX X17q =quantum efficiency
7s = the cold shield efficiency
0 = the cold shield angle.
econd, the quantity W is defined by
W D°(p) aT dX (A24)=1Twhere X the wavelength for maximum D (X) For hand calculations, Hudson
4.8 31, aLnotes that J d u1 w dX equals 527.4 x 10⁻⁵ theseobv.:ioul ueulT WU( d- euas7.-T"~;4 hs
quantities are obviously useful approximations to W.
To summarize, then, the NE AT u,,ng equation (A24) is given by
4F 2 (Af n 0Y
NE AT = (A25)7wAd 71 (X ) D (Xp) W
where equations (A22), (A23), and (A24) provide useful expressions for Afn, D* (Q),and W. Also, note that Ad can be expressed in terms of focal length and nominal systemresolution in milliradians, i.e.,
A = (focal length) (resolution in mr)/(1000). (A26)
A4 R. D. Hudson, Jr., l~ftred System Engineering, Wiley, New York, 1969.
44

(If we included atmospheric trani nission over the short ith length in the NE 6T labo-ratory experiment, then (A24) becomes
o N o( (x) D ro (N)f % rt(X ) Qt.(Xp)1)(*o' a T
and (A25) becomes
NEST = 6T 7r A 7 (7, (X) Do (xp) W
MRT and MDT Derivations:
Basic Concepts: The minimum resolvable temperature (MRT) of a system is de-fined as the temperature difference relative to a background which the bars of a barpattern must possess in order for a human obberver to detect the individual bars whenviewing the pattern thru the system. The minimum detectable temperature (MDT) isthe temperature difference a square object must possess in order to be detectable.Obviously, the MRT is a function of 1he bar pattern spatial frequency while the MDT
! is a function of the object size.
Historically, the MRT bar pattern has been a 4-bar pattern whose bars had lengths
equal to 7 times their width; also, the pattern has been oriented such that the bars areperpendicular to the detector scan direction. The derivation presented here assumesthat both the pattern and the orientation coý respond to these historical precedents.The derivation also assumes that there is no sampling in the direction (horizontal) alongwhich the detectors are scanned. This latter assumption is not valid for all systems;specifically, the signals from the detectors of a parallel scahning system are sometimesmultiplexed in a manner which provides a sampling effect in the scan direction. Thissampling can introduce noise fold-over and signal aliasing effects; however, if the systemis well designed these effects will not be severe and the equations derived herein can beapplied to these systems.
oldsThe basic hypothesis underlying the theory of MRT and MDT is that visual thresh-Olds correspond to a critical value of "matched filter" signal-to-noise ratios; i.e., theratio formed from the maximum amplitude of the target and the RMS value of thenoise obtained by passing the signal (target) and noise which are actually observed byan individual thru a filter matched to the observed signal. (Note that the sig'-l andnoise are not actually pity sically filtered by a matched filter; it is just hypothesized Ithat the relevant signal-to-noise ratio for perceptual purposes is tne signal-to-noise ratioobtained assuming that the signal and noise are filtered by the matched filter.) Thus,
45
_7,i
LA %;
if the viewed object is characterized by the spatiol function i(x,y), the signal will bcproportional to i(x,y) * i(-x,.y) for x and y equal to zero which equals
I.j1 2 (~f Xf)d 2 f
where I(fX ,fy) is the transform of i(x,y). Correspoadingly, the noise will be proportion-al to
S(fXI f. 12 (f, fy ) d2 f
where S(fX, fy) is the power spectrum of the observed noise. (Throughout this section,the quantity io(x,y) representing the undegraded target will be normalized such thatits maximum value is I while the (matched) filter corresponding to this quantity,Hi (f, fy ) will be normalized such that Hi (0,0) = 1. Thus, for a uniform target,
To(fxfy) = AT 1i (fXfY
¶ where AT equals the area of the target.)
Although the determination of MDT is straightforward using the above hypothesis,an extension is required to determine MRT, i.e., the perception threshold for a periodicpattern. Specifically, the nature of the matched filter (and the signal) must be estab-lished for the (potentially) infinite periodic pattern. The assumption is made that thefilter in the periodic direction is a rect function whose width is equal to the width ofthe bar while in the ot!her direction the filter is simply the device degraded rect functioncorresponding to the length of the Lar. (Note that a dtgraded periodic pattern retainsits poriodicity with unchanged spatial frequency.) Furthermore, the "signal" is assumedto be the difference between the "signal energy" coming thru the filter centered overthe bar and a filter centered over the neighboring trough. (Note that in some sensethis corresponds to taking the signal for an aperiodic pattern as the difference betweenthe "signal energy" passed thru the matched filter centered over the target and the"energy" passed thru a filter centered over the background.) With these assumptions,calculation of the MRT becomes very straightforward.
In the above, the implication is made that the object and noise observed a'e theobject and noise existing on the device display. More fundamentally, they are the"object and noise projected on the reit .a of the eye or, still better, the object and noiseinterpreted by the observer, i.e., aftei degradation by the retina and nervous system.Given a transfer function for the eye, an effective power sp'ctrum for the internalnoise in the eye, and a knowledge of the actual extent of eye signal (and noise) summa.tion, it is possible to extend the calculations to the retina and beyond. This extension
46
"-4J
will not be pursued here; rather, the assumption will be made that the eye transferfunction and noise do not significantly alter the signal-to-noise ratio calculated usingthe displayed quantities. (In actual calculations, however, an eyeball term is included.)
A few comments concerning the (matched) filter formulation are possibly useful.The, matched filter can be thought of as a window over which the signal and noise"energies" are summed to formulate a. signal-to-noise ratio. This summation is similarto that performed by Rose in formulating S/N ratios which, correlate with Blackwell'svisual thresholds;As in Rose's case, MTF type degradations were not considered and,consequently, the matched filter was just the target itself. Thus, a matched filter signaland noise are just slightly sophisticated versions of a signal and noise summed over thetarget; the matched filter procedure merely provides a consistent technique for handlingdegraded (blurred) targets. An equivalent (but, to this author's thinking, more cumber-some) formulation uses the total signal energy as the signal (i.e., sums all the signalenergy) and then sums the noise over a equivalent target area which is larger than theoriginal target as a result of MTF degradations.
The Derivations: The MRT and MDT equations can now be formulated rathereasily, the only complication being that introduced by sampling.
In order to perform a reasonably rigorous derivation, a condistent set of units mustbe used. Let k be defined such that k AT equals the watts emitted by a display element(spot, etc.) for a large target with a temperature difference AT. Then, the signal energyper unit area from the display for a single frame will be equal to
M(x,y) - k AT i(x,y) (A27)Ayi v
where Ayi . the distance between scan lines = Ay/7 ovsc
v = the scan velocity of the display element
i(x,y) the spatial distribution function of the degraded target.
The quantity i(xy) will equal (ignoring sampling effects, a procedure completely legiti-mate only if Ayi is very small) the convolution of the original target with the systemresponse function, i.e.,
•. :0 ~,y) =iT(xly) 111) (xly) (A28)
A5 Albert Rose, "The Sensitivity Performance of the Human Eye en an Absolute Scale," J. Opt. Soc. Am. 35, 196
(1948).
47
" -.,• -'4... t .

or, taking transforms,
I(fxfy) = ITyfxf) HD(fx,fy),
where iT is the target distribution and hD is the system response function. (Note thatfor constant i(x,y) the formulation above will yield a uniform display brightness; thus,this formulation uses an average display radiance across scan lines.)
The aperiodic matched filter signal, uming equation (A27), is given by
Signal = MAX [kI T i(xy)*b] (A29)Lo AT f
k/AT f l(ff,) Un d2 f,
where It, trod 1 1m are, respectively, the real space and the frequency space representa.tions of the matched filter. (Note that "MAX" refers to the maximum value of conv'olu-tion over x and y.) As indicated previously, Im is simply the normalized version ofI(fx, fy) (the degraded target); therefore, the signal for the aperiodic target is
(SIGNAL) 4 kAT ATfH2 (fx d2f, (A30)
where AT is the area and 1-T is the transfer function corresponding to the undegradedtarget.
The periodic matched ilter signal, using equation (A27) is given by
rkAT A )SIGNAL -MAX i(x,y) - (Am]
M kAT i(x,y) * h]p,- I
"where i(x,y) is the degraded bar pattern and hU w the undegraded Peet function hori.zontally and the degraded rect function vertically. The quantity i (x,y) is approximated(horizontally) by the first harmonic of the square wave; therefore, since the amplitudeof this harmonic is 4/7r times the amplitude of the square wave,
48
• •,•;;"?(
L . .. .. . .. .. .. . .. . .. . -- . .

i~x~) = [ (square wave with .]*li(xyL~~y amplit-ade .5 / .5j D XY
a5 NTF(f,) 1 (.5) sin (2ir fx) i ~,(y) + .5
where fQ is the frequency of the bar pattern and i(y) is the degraded vertical rectfunction corresponding to the length of the bar. (The fact that i(x,y) will be negativewhre MTF (f.) equals approximately unity is an unimportant consequence of usingthe first harmonic approximation.) Substitution of i(x,y) from equation (A32) intoequation (A31) yields (evaluating the horizontal integrals in real space and the verticalintegrals in frequency space):
V.2fo(SIGNAL)p k MTF(f 0) AT f si(2fx)2f d
Ii (A33)
In equation (A33), the factor 2f( in the first integral comes about becatise the horizontalfilter (etfnio)of width W½f s napltd of 2f. under the normalization
convntin tat 1(fx = forf. - 0 Sine te frstintegral ineqain(3)qul
the y direction and L is the length of the biars, equation (A33) can be simplified to
(SIGAL~ k NTF -.) A T]J If H df~ (A34)
-- - UNDEGRADED
DEGRADED-. 00- BAR PATTERN
± MATCHED FILTERSIGNAL-DEGRADED BAR
~PATTERNHORIZONTAL FILTERING *
~ ,~'.49
The noise expressions for NIRT and MDT must now be determined; this requiresestablishing the power spectrum of the noise displayed to the observer. The functiondescribing the noise on the display is given by
n (x,y) = bI(x) 6 (y-yi) *hd(Y) =
i (A35)Sbi(x)hld (Y - Yd
where hd(y) is the impulse response of the display in the y direction and bi(x) is the
fun.tion describing the horizontal noise function along the ith scan line. The form ,fequation (A34) arises as an obvious result of the sampled nature of the thermal imagewhich consists of independent scan lines; the convolution is merely a manifestation ofthe fact that each line is "spread out" by the display element. The autocorrelation ofthe ncise is given by
< n(x,y) n1x, y') >t =• . bbi(x) b. (x') hd(y -yi) hd~'y (A36)
, j
i Assuinir, gthat < bi(x) equals zero, note that < bi(x) b.(x') > will equal zero unlessi =jsince b, and bi are, otherwise, independent random processes. Thus
R(xx'yy') _A < n(x,y) n(x ,y p >=S~(A37)
" • < bi1)(x) bi(x') > hd (Y i d (-Y'-Y)i=
Now < bi(x) bi(x') > is independent of i since all lines are (supposedly) the same and,i therefore,
. R(xx'yy') =< b(x) b(x') > f hd(y -y i) hd (Y'-Y) (A37)
Approximating the summation by an integral, we have
R(xx'yy') "<b(x) b(x') > hd( -y,) hd (Y'-Yi) dYi
< b(x) bAx ' Id(P) hd(Y + p) d , A R(XY)
. .. ,j.o
!1 •.= ,50
4X1
where Y y - y' and X x - x'. (((b(x) b(x')) is assumed to be a function only ofx - x' which is true if the random process is wide-sense stationary.)
The power spectrum of the noise is just the fourier transform of R(X,Y), i.e.,
2 1 iS(fx,f) < b(x) b(x')> e2ffifX dX H Hd(fY)*H (fy). (A40)
Now b(x) corresponds to the "voltage" noise function which is transformed from a"voltage" to a one-dimensional radiant energy function by the display elements; there-fore, the fourier transform of < b(x) b(x') > equals the "voltage" noise power spectrum
S I' provided the units are properly transformed from "voltage" and "voltage" space toradiant energy and display space. (This conversion, itemized below, is based upon theimplicit asstumption that voltage is linearly related to radiant energy.) As discussed priorto equation (A15), the "voltage" noise power spectrum equals
S() HELECT (f)
or
(constant) S_ H )S(fo) ELECT (f)'
In the second expression above, the constant obviously equals S(fo) if the units of thisexpression are the same as those of the first expression (e.g., (volts) (second)); since theL signal is giva in terms of temperature units, the noise must also be and, therefore,the value of the constant is desired which references the power spectrum to temperatureunits, i.e., (temperature difference) (second). To establish the value of this constant,note that the NE AT equals the temperature difference such that the S/N ratio (voltageS/N ratio prior to the display) equals 1; therefore, if the signal, referenced to tempera.fare units, is simply AT, then NE AT equals the AT such that AT/a = 1 where a is theRMS noise in appropriate units. Thus, the NE AT equals a, and since
a: 2 (constant) S(f§0 f ELECT df = (constant) A fn
whee equation (A20) has been used, the constant is given by
NE AT2 ,.-• ~constant-
A fn
i' "' I I i ~ u.!"'plumt
(The quantity NE AT2 /A f. can be expressed in terms of detector sensitivity and deviceparameters using equation (A25). Note that although the above discussion uses the trueNE AT and A fn , i.e., not the standardized ones, the last equation is valid regardless ofwhich A f is used provided the A f in the denominator is the same as the A f usedto calculate the NE AT.) Consequently, the voltage noise power spectrum referencedto temperature units equals
NE AT2 S I f
A f S(fo) ELECTn!
Now, converting from temperature to radiant energy thru use of :.-he correspondence(see reasoning prior to equation (A27),
NEAT < k NEAT (energy/cm),
using the relation (valid since f v f )
S~f) H:S(fx X• 112HS(f) HLECT (f) v !f) (fx)
S(f 0 ) F S(fox) ELECT
where S(fx) = S(v fx), etc., and, using the fact that the fourier transf'rrm of K b(x) b(x') >
* •corresponds to the voltage power spectrum, the relation
, _ k~2 NE A T2 1 v S(f ) o
< b(x) b(x') > c"2fffX dX = N AT I S(fo) HE (f.) (A41)f .1v 2 s-vS(f0O) ELECT
is obtained (assuming that the display transfer function equals 1). A careful examina-tion of equation (A40) shows that the units are (energy)2 /cm which are those desiredof the one.dimensional "display" power spectrum. Combining equations (A41) and(A40) and including the display transfer function, H1 d(fx)' the desired (two-dimensional)noise power spectrum is given by
k2 NEAT 2 S(f') 2S(ft AYivAfn lEIECT 11 (f If (A42)
tr (The critical step in the derivation of S(f , f ) is cluation (A39) where the sampling" characteristic of the display is in a sense approximated away. Stricty speaking, the
"sampled noise process cannot be characterized by a power spectrum.)
52
S • ', •,,.* :. I'

Given the power spectrum S(fx, fr), the (matched, filtered) noises required toestablish MRT and MDT are easily determined. As previously indicated, the matchedfilter for the MRT calculation is
Hw (fx) HL (fr) HD (fy)
where Hw, IIL, and HD are the.transfer functions corresponding to the width of thebar, the length of the bar, and the system impulse function in the y direction, respec-tively. Therefore, the MRT noise is given by
(Noise)p =fNEAT S(f,) 2 2 (f )2 2 (f 2,(f, I2(fdd
AyiAfn v S(fox) ELECT X d Y W •YlD Y xd
(A43)
The filter for the MDT is
IT (ffy) 1tD (fxfy)
where HT and HD are the target and device transfer functions; therefore, the MI)T noiseis
(Noisc)a
/kNE AT2 S(f,) 11 fdf Y(A44)L Y i A fn vS(fvo) ELECTId HD x
The ratio of the signal given in equation (A34) and the noise given in equation (A43)
yields the. fuaidamental signal-to-noise ratio for periodic patterns for a single frame.The MRT is simply the AT found by summing the signal and noise over the frames inan eye integration time and setting the signal-to-noise ratio equal to a threshold value &. jThus, the MRT is given by (from equation. (A34) and (A43)):
"MTF V (S)flN ff 2 E 2C 2 12tdf df.MRT = !EL o") H H ( dY;,.•2 Ay AT;7 f/ -i V! f •i S(fox) HELECT id HHL D x.
I • _r 2 - NEAT Adf (A45)IFitt MTF(f) L 112 dfy IFL d tAfn 0
4... .A ý .,..•5 -, . ...
where FR is the frame rate of the system and tE is the eye integration time. Similarly,the MDT is given by (using equations (A30) and A44)):
MDT= NEATS! AYiV Syf ) 2 222 d (A46)T Dd
The somewhat formidable equation (A45) can be expressed in a much more useful
form thru use of the following definitions and relations:
IIqA 2 1 df2
P1 A 2 W ) HL2 H 2 (f H2df,
pAL f ||f L H D Hd (fY)dfy
L1, 7 (assuming bar length equals 7 times its width)2f,
W-2f
Employing these last relations, the MRT reduces to
T if 2 S NEAT ( Ayi v 2 p2 'A (
8 MTF(f,,) qy FRt Ar 7(
This expression is further simplified by noting that q,, and pY will equal approximatelyI for essentially all applications since the bar length will almost always be large com-pared to the system response function (for any reasonable fQ) in the y direction; there.fore, the MRT is finally given by
""72 S-NEAT fyi v 'A___ (A48)
,., 4( MTF(f) Ft AfRpx I
Awhich is the recommended equation for calculating MRT. (This last approximate expres-
sion can be arrived at by a somewhat simpler argument which is perhaps useful. Calcu-late the one-dimensional mnatched filter signal and noise for a single scan line assumingthat the bar length is greater than the height of a scan line. This calculation, as easily A
54• i !.7

seen from the above analysis, yields a signal
(Signal)p = A T ~ f.) A T energy/cmand a n(fi)se
=Nis~ ( NE AT2 S(fY,) IILj cTQfx)H 2(fx)Hw(fx,)df,(
Since the "matched" filtering in the y direction corresponds to summing the signal andnoise 6ver the length of a bar, sine,! sigrwls add directly and noises add quadradically,and since the bar exten~s over (L,/Ayi) independent lines, the desired MRT signal-to.noise ratio is given by
AL k AT MFf) A
(SIN) (k N T 2 *df
which directly yields the MRT given in equation (A48).)III Unfortunatelr, each individual concerned with MRT has his own favorite formfor the MRT equation derived by using different definitions and different approxima-tions than those used above. For example, a quantity Gis used by some individualswhere
Q " f.
others approximate the integrals such as
fH 2 H2 dHL Hi D d
ierf +. f~l
55D
where
f~ H 2 -
L f L
To the author's knowledge, however, all the expressions follow directly from equation(A45) using the appropriate definitions and approximations. (In one instance, an equa-tin is used which is derived on the assumption that the "matched filter" for the barpattern is a square whose side is equal to the width of the bar. Even in this case, thefinal equation reduces to equation (A48) except for a different constant.)
The use of equation (A48) requires establishing the values of S-and tE ;again, un-fortunately, universal values for these constants do not exist. The values recommendedat this time are
S- = 2.25,
tE .2. (A49)
Several appro ximations and facts are useful for using equation (A48) to makequick calculations. First, from equation (A22) (and the material following (A22))
v 2 2vr D 4 AxAf IF IT
D 7r
where A x is the detector width. Also Ay1 is given by
Ay Ayl/ovsc
Ayi
where Ay is the detector height andqovsc is the overscan ratio. Finally, px will equalapproximately 1 for small fo while for any fo a respectable approximation, assumingS(f.)/S(fox) equals 1, is
1 "11" (A50) •~
(4fo (Ax)2 + 1)%4 AO
Therefore, a useful form of equation (A48) for hand calculations is
NEATf0 / 4 AxAy /2"MRT .6 6 SMTF(f) o F 44f (Ax)2 + 1 (A51)
where the last factor can be set equal to a 1 for many values of fo.
56- Wa ",
The MDT given in equation (A46) can be simplified to
_ ___AT (Ayjv 1MDTS F t Af 2W ~I xA IyA (A52)
q AR E n,
thru use of the definitions
qA ~ TA f IHDf
p -2Wf S!f1 H lIH2 2
xA - : Sf) ELECT d W~ D xf
PyA = H HH 2H2 dfW Wd D Y
where HW is the transfer fu- ation curresponding to the side of the test square. Approxi-mations to q A' PxA' and Py A can be formulated similar to those used to simplify the
MRT; these wili not be pursued here.
57 *i.
-771. -77T '-1jý
APPENDIX B
VERTICAL MRT
If sampling effects are assumd to be negligible, then a vertical MTF and MRTcan be defined and an expression for them derived. A system's, performance can thenbe a funtion of some combination of horizontal and vertical MRT. As an example,the MRT's in the two directions can be assumed to form an average MRT whose value is
MRTv = [MRT 2 (fx) + MRT 2 (fy)YN/V2.
Then, this MRT will directly give performance from an experimental relationship suchas shown in T'ble 4 in the main section.
A vertical MRT (f,) similar to the horizontal MRT (f,) can be derived in the samemanner utilized in Appendix A. The only difference is that the target bar pattern isnow oriented with the long dimension parallel to the scan direction. Then returning toequation (A32) of Appendix A, we get
i(xy) MTF(f.Y) 4 (5) sin (21rfoyy) ix (x) + .5, (BI)
where i, (x) is the degraded rect function in the x direction. Equation (A33) becomes!,2 fy
(SIGNAL)p- k MTF(fo ) 4 ATf sin (27rfoy y)(2foy)dy (B2)Ayjv r fY o
x I X 1. f X, df,,
where now Ix = i f1 L(fx) '1 o (fx) " Hence, the signal for the case of horizontal bars is
(SIGNAL)p- k MTF(f) AT 1, H (f) ilf(f,) df(. (g3)Ayjv ,.
In deriving the noise power spectrum, we still get the result2 ,f
NE AT 2 S5(f 2S~X I ,yvf ) L H '2 (f,) H2~ (' f,,) (134)A
Y S(ff y)-. AyfAT S(fo0 ) ELEcr d)
since the target plays no roll in the noise at this point. The matched filter for the
58
777-
horizontal case is
11W (f y)HL (f )HlV (f X)"
Hence, the noise isA. Il
(NOISE)p A T S(fo) H TH (fx'f ) )H[AyjvAf. J S(fox) LETd y YI DL .. 0
x dif]. (B5)
Taking the ratio of equation (B3) to (B5), integrating over .ames, arid solving forMRT yields
MR'r(f) - -8 NE AT 2
MTF(f1) H2 122 (Ifv FRftEH1, 1 D fx
U (136)/sf) S(fo•) ELCT j6)p,,,S( ) | 1,2 (t'x) 1 2 (f., fy) 112 (fy) t1
fX S(f OX) ELECT d 1. L (f
pX 112 (fx) dfx d Y
I.
gx-- L f it H2; ,IIf.
) f" = 2 2 2 2f
R;(C -- l S(fo NELECT [d 1, D
where 1, = f''7and W - flthen equation (B6) becomes ," i
8 MTF(f) gv . FRtE Afn 7 0 J
59
7,3 . -


APPENDIX C
COMPUTER PROGRAM
PROGRAM FLOW CHART
DATA
1REA
if
M'I'
NO-
61IC
CALCULATIONS.......................... .
"".ERE.~.- .~4

SUBROUTINE FLOW CHART
MAINPG
I)ATTA
INtT
NEW NP-EXIT
YES I READF
MRTINP -3Z
NO Cos
YSDEVCE- -OPTIC- ALI NEY
XNETO GEPLIIR-EXPALINEY--CNOISE' 0 DETEC - ALINEY
EXP-DWP ALINEY ?NO ALINEY-DiSI
QTFE SIN ALOG10-BUWT CS CAMRA-ALINEY
ALINEY--BDWT Cos XRZNG - ANINi EMIT'--SIN SI~N
ALOG10 QTFE ALNY ALINEY DSPLY - EXP
COS EP -PLANK ALOG STABLE - JNE
QTFE QTFE ALCZG EIA-AIE EXP
ALINEY-XRING -M4DT J4AN All~ ALOIGIO
AUXG ALINEY-AThCRL E)!P
.1ALOG10 ALOG QTFE QF
ATAN ALOG10 SINC -SIN
EXP E)UW MDTSNR--ALINEY AMAXI 1
QFE XRING-ALINEY
SIN-SINC DFAULT ALOG
7ALOGIO iATAN
EXP
QTFE
SIN.. SIN
62
X 7

REAL. IUTAUREAL IRTRANDiftNMQON AF'CKt( 164&.) ________
DIMENSION FURD(201DIMENSION OOT(SO).XDR(50J.KP8(50)tXFRM(50I ..
DiMtENSION YrDR(50)*YPH(50) .YFRW(50)DIMENSION XMTF( 20).sYMTF(201 oFFFFt20)DIMENSIUN XXMHTI 20) .VYMRT(20) ,FFT(20)
DIMENSION PkO( 10) XNUM( 10)UIMENSIUN QQU(20).OQQQO(20)DIMENSION S0ME(50)9DRTX(50)*DRTY(50)U14ENSIJN ELANX(.20)stLANY(20)U)IMENSIUN SIGMA(9J9WAVE(9)#IRTRAN(I6I)U iMfNS ION TR TRAN(E)______
DIMENSION OL~rPur(1o)*XINPUT(I0)4DIMENSION HANOC 1611DIMEýNSIUN U0STAR(I0).,XLM8A(I0)UIMENSION RSPX( 161)UIMENSIUN XMXM(20) oYtYM(20)DLMENSIIJN Ht 13).0 TA10
DIMENSION FQQB(.O),F(0
D14ENSIUN AD(10)vYD(I0)*XE(I0)sXU(I0)ULMENSIUN XO(10),YOII0),XTV(10).YTV(1O).KML(1Q).YML(IO)0IMENSI!JN XXXRT(201 aYYYRTCaJ~.. --.-. ________-
DIMENSION WFOVI20bMT4S(20)*ELAN45(20)DIMENSION X45r3I50)9XA5P3I5OoX.45t4(50)RXSPC5O)DIMENSION rSt(b0)9SSE(50?
'r# .^p4/NAMES/vIKOUNT*XMAG*FSTAR*FELFCT*FMAXF
COMMON/NAAEdoEXXMRT*ZJZACOMMUN /OPLUROVAt3LURCOMMUN/NAML6#'DXDRtbO).DUDT(50oIDoRrX(50)CALL INLT(LAPLOi)IKUUNT-0
0400 CO01NUEIK3UNr I KOUN 1*1CALL NEWINPIF~oX0,YO.AO.VD.XB.KEETV ,YTV .XMLF~Q0RUTOFF*IrF0.ODSTA~,XLMU3A.RNIAIRTMP.RVI SeTBAC% PROPXNUM*BETA*YML.ý9AVU * WAVE29 I.$14Tga *ttA~R.*-Pt-ji.)(NN~j4JVE14)*AVNE r=XNE TIF(Z3*EQ*I.Q.A'4D.Z4*EQ#I@01 CALL MRTINP(RVIS,
IkA'4(.jE9AIRTIAP. Ht49.AVEI. UAVE2.IPRINT.Z JK.-2ISTATE,*AFCRL.PRO.ANUM*raAC*XNMBPeETA.IlKK)I-(L3aEQ*I*O.AND*ZA.Eu*I*O1 GO TO 8025IF( IKCQUNT*41~ 9 _______
C MH~T CALCULA .ION
CA
63
XW=d AVE 1-0.1 ------pWzIFIX( (WAVE2 1A )f/09 I).1
XZ=SNi*3.14159/2.0o(14*.**O.5)*3.l4159/2.0
CUTLIFF=0.999*RUrOFP .
1OTAI.J=HFOV*VFOV*(17.5**2)*pR/Vg/O.'ELTAX/OELTAY/XNSC*OVERSCVEL=)LLTAX*l JTAU - --R ST AR=FST AR/VEL
RELECTmFELEC TILVE-L --.-- -.-
RMAXF=Ft4AXF/VEL
101 It4KLK)=10*0**F(KLK)/VE-L
CALL 0EV ICE( XMT9 * YMTF .KXMTF .YYMTF.W.FFFF KMXM.4YMYM.FURDe.EAXD.&Y-D.fL.
8fl). B. XE*.XT V*,YT V.XML ,YWL FQQ)
XKNET=XNET
CALL dDWT(FO,,DELTAF *CUTOFF e.Xa.FGQo) -
XL= I ./DtzLTAX/20.
4 KXCTVV=C&JTCFF/VLL
Do 102 KK=1*20
F~T=FT*XL .. . . -
TARF=FT
GRUNT= t. o /2." TARFRUNT . *GRUN T
.-.CALL-IRING1 XCIFF *X)Uf- &Afl.XZ DZDLsaLB*fiHtINT I flS2-A-
CALL XR ING( XCTFF 9 XM TPF FURD 120 PH 8 9RUNT 91 9 ANR 92 v a0)
CALL XRING( O.OoYYMTF @FURD,20 oM.8.GRUNT@2 PANT *2st.0)Q=ANS/2*0QQ=ANR*ANT/2 .0*RUNT
IF( XXX*KEQ*O.0) XMRT=1.0E406IF(KXXXXEQ*0.0) GO TO0 46066
I F C X M KTa L Le wQ,@0- KM T- K * 1a. Q-0k---. -- ___-_________
IF(V*LT.1*O) XMRT=XtRT*V**O.S4615b CONT INUE -
IF(YYYY.EO.O0*0 YMRT=I.OE+0b
IF(YYYYeEQO*O.) GO TO 466?
XXMRT (KK)=XARTYY,4RT(KK)=YMRT
FF~T(K)=FNT/XX(ETYVLF*/ETFF/YT/VSC.5
102 LaLT I64
IFJRN*QOG TO.00
IF~ (IG*Q*IWIL(*0

YVMftT(KK)=YYMRT(KK*(3.5FFT(KK).'7.O#FFTC201)**0.9)RT4jElKll LZAMR IL.KKiJ.12* YYMtRr(&K).~#a1 *#.
600 CONTINUE -l F(JPI4INTsEQo0)GO TO 8009tF(tAFLG *EQ. L)WRITEC6a700O)4
IfRITE(6*322)
322 FO.A4AT(IHI940IPREOICTED MINIM4UM RESULWAt3LL TEMPEWATUkE)
6=1,20 I.323 FORMAT( 4Xa4HFREQ.?X*5h1X ARTt?hi,5.Y MRTvX95ivXLMRT*7X@5HYLMRr
* 7K. 54$'.MR T. i/ ( IX ,64 PE9.4 ,JX)ý8009 CONTINUE
C C0NVERT DELTA T ON 0/0 TO f)ELTA POwEk
C
C COVRIRTT ~LC
XL AM-Xkvr 0DO 601.3 IJ=.*Lvp
nCAL ALINEV(ZZgXLAMOOSTARXMA*0IF( ZZZZ .LT .0.0) ZZZZO0.0
BUiAR=OUVPUT( I1I
DO 6003 1=1.10URvX=XINPUT( 1)
IF(ORYXoEQ*0901 BURR.OUTPUTII)6003 CONTINUE
6005 RAND(IKK)=1.0
DO 6007 KKI.IC1
T3m27.0 + XaNPUT(K.K)
KAP= 0.0£ IF4XLNPUT(KK).E4*0*0) GO TO 6007
.trOO7 RINPUT(Ki()=XXPFREE 27. OtXNE-CALL PLANK(FREE. g7. OXPOX.RAND.Rspx)
DO 800 LON=1920
T4=27.04XKMR T(LON)
XTUL=0.0
£F(XJ(ART(LON)*EQo0s0) 6O TO 60L 11CALL PLANK(T~v2?*0O, XTOL.RANi).RSPX)
801 ELANX(LONI=XTOLYTOL=0.0
~ .IFA .~Ti.~NI.OiQQ)GO TO 8Q00
CALL PLANKC T~sZ?.0O.VTUL*RANU*HSPK) .D0 8888 JKJ=IP20
6888 ELAN45(JKJ)-FLANX~.o..J**2+ELANY(JI(J)**.fl**3.5
CALL MOT(XMXM.YMyMoF~FFF*XCTFP.N.SNR.O)ELTA(C/C WFOV SCALED MkTC
00 7119 Jul.207119 wFOVIJ)=FPTCJ)/FAC-Tj. 18007 CONTINUE
65
~N z
XkH=0.01.1
C
c RANGE D0 LOUP FOR RECOGNITION
C
DO 1066b IJK=1.LUPU
A.Km 0
)U0 500 11=14MIN.IRMAXtIOELTRKK=KK+ I
RU~ANGE=It/0O0 -
00 2 JJ=IeLw
2 IR1THANtJJ)=1.0 __
CALL ATMCkL (RVIS #RANGE 9A RTMPs XRH@ WAVEI 9WAVE2 *IPA INT9 IJK IST AT~o
lAFCALoIAFLG) -
DO 5300 l~lSS~I.LkV
5300 lRrRAN1MIbSI=AFcNL(MISS)*;RTRAN(N~lSS)
CALL 0TFE(0o.IRTRAN9TRTRANpLV0TRA'4S=THTkAN(LW I/t W9A.ME2-MAVf.I __________________
CALL U-LANK T FAR, TBAC *SUPErs.RTRAH9RSPX)
VDT(KKV.) TA AN SDETFEDL.-TEMP* TRANS
C TLEN 6=. 0 X TA~RA/RANGC TLENGA.0*XTAkR.IANG E
UETE=QETE,'P TLE~rx/7".OFET2II2*UQ#..5U3Ek=&UPEk*( rLFNG,'?a0*FF T( 20) ) 0*0*05XDR ( K9.) RAiN(E
C X-APT "Jk DE~LIA T AND0 DELTA PCALL ALINEY(FI4W9DE1t@FFVT*XMRT*20) -.
CALL ALLNEViHOGERSUPER.FFT.ELANX.2O)
XN0M=XTAR*f1RU(RAHNfi. . -- ___________I, ~XXNIM=XH11AR*Wt3GER/RANGECALL. ALINEY(PR~.~A.NUM.PRO.KNUt4.i0)
~~1 CALL AL LiLY( IJWPRCO* XXNIMePRO.XNUM.10)lF(PR~d.LT*0.0) Pk08=0.00 .
IF (ROUPROoLT .0.0) POWPROC0.00
U'QT X 1KV) =PCJPRU
DOL)TX(KKV.)DRTX(VK) .
SUM'E 1KK.)=POU8
X. P-R a ( KKV ) =POw PHU
C Y-W'4T F3R UELTA T AND) OtLTA PCA-L ALlNEY(FRo9UETEoFFToYYMRTvZ0)CALL ALlNr-Y([email protected])AA4Mf4XHTAR*F$4.W/14AN." __________
XXN2M=X1tAReAUY/MANC1L
CALL ALlNEYIPMOdqXXVNUM*PHO.V.NVJ4s10) ----.-
CALL ALINCY(VCOWPR0.EXN2M.PRO.XNUM.I0)lF(iýOWPWdt.LT.0*0) POWPRU20904)IF(PHOL~.LToO.0) PR08=0.00IF(SUWPRU.LT.090) 5OWPRtO0,0 ________
YPR ( KK ) PW Ud
DR T Y(KK )=SO MPRUCALL ALINEYIPRUd.XV.NUM,9PP0.NMfi.IO)CALL ALINEY(PUiWPPOXXN2M.PROXNM8,I0O)
66 r
k
1F(P~UuPiR0LT .0.0) POWPRUx0.CO0
YFRWIKK ):PUWPROC '45-JEGRLE M-4T F-'3k DELTA T AND DELTA P
* CALL ALINEY(FRw.DETE*FFT*RT45*20)
CALL AL LNEY( ROFjhkSUPER oIPFT ELAN41392OXXNUMaXHTAR~t;-Hm/RANGL
CAL AL LNF.( PiRO8, (NVM Pf4Q. NVe4,10)CAL.. ALINEY(POWPPRO.EXN1M.PR0,%CNUM*p 0)1111'HUJeLT .0.01 F'RUBO.00IFCPUwI'iR0.Lro.oi0 POWPROO.0*0
X45'I(KK()=P0.O ICALL AL1Nt;Y(PR(1),KXNUMPR0,KN~t,1Q)
CALL AL INEYI'30WPrc0,XXNIM.PRO.ENMUI0)
IF(OIPNJI.LT.090) P~OI8RO0.00
[I OX0IR (KK )=X04(KK)UDOT(i(K )=LUT( KK)
IF ( IAFLG otQ. 1 )WH ITL( be7000)iWkI TF( b. 325)DE T!4P
WRITEC 6,820)
427 FH)IUAT(IH 933HTEPERATR EPE N UPERFORMANCE)RA~ý
IF (IAFL. eNE. t)GO TO 2000WRITE(697000)
WR irE( b@327)O I4
wRITE6. 820)
C DETECTION00
C
II11=0
RANGE=JIr',I CUO.0XR=R~ANGE* 1000.0uO *0b6 KLM=I*Lw
67
Vi____iw

CALL ATMCRL(RVISRANGEAIRTMPXRH.4WAVEIWAVE2.IPRINTIJK,!STATE.
00 5790 MISS-19LO
CALL QIPE(0*I.IATRAN9TRTRAN9LW)
- TRAM4S=TRTRAN(Lu)/(WgAVE2-imAVELIDDT( Ii Ib-TRANS
DETENOETEMP* TRANSDTLENGMXTE*(TLNGE'.*FI0)*.DE~DT*TLEN G=KL TAR20)RA*0GE-POmE.RnPOMER*( TLENG7.eO*FF TI201))*00.SXORIII)=RANGE
CALL AL INEYC PRW9DETEvFFT, XXMRT920)CALL AL tNEit ROGER. POWER vFF T ELANX 920)
KEJ4UMOXHTAR*FRWj'RANGEKilN I HmsXHTAR* RO.ER /RANGE
CALL ALINEY(PROB9XXNUMvPRO 9BETA910)
IFIPROS*LT*O.0) PROB=0.00[I IFtPQMPROsLT.0e0) PQNUPjO=0.00
DRTXI II -PD WPROC Y-DIRT FOR DELTA T AND DELTA P
CALL ALINEYi:OY9PO:ER*F:T9ELANV920:
CALL. ALINEV(SOWPRO9XXN2MvPRO 98ETA910)
IF(SOWPRO.LT*0*O) SOWPROU0*00VPR(11)-PROBORTYI 11I -SOUPRO
C 45-DIRT FOR DEL.TA T AND DEL3TA PCALL AL IhEY( FAW.DETE9FFTvRT4S920)
CALLF ALINV(XKNUDIX KTAR*PRW/RANGEXXN ltmXHITAR* ROGER/RANGECALL ALINEVIPRO)B. XNUDI.PRO *BETA910t
* ~CAL6. ALINEY(POVPRO.KKNtM*PRO *BETA*IO)IF(P6108.LTeO0)0 PHOB-0.00
X45T4411II PROBK45RM 11 bUPOWPRO
C WFOV X-DIRT FOR DELTA T AND DELTA PCALL ALINEYIFRW*DETE*WFOV@XEDIRT*20)CALL AL INL Y(ROGER *POWER &IFOV *ELANX*20)XK4UMmXHTAR*tFRW/R~fg.------
KEN IM=XHTAR*ROGER4 RANGECALL ALINEY(PROB*XXNUDI.PRO *SETA91O)
IF(PROII:LT*00.) PROdUO0e0 0 it.0
IF(POWPROeLT&0oG) POUPMOO0.00
XPRW( II)-POWPROC,~. WFQV V-DIRT FON DELTA T AND DELTA P
CALL ALINEY(FRWOETEtkwFOVoYYDRT .20).-CALL_ ALZNLFYCROY.LPOWERoWFOVELANYZ0)XXNUD-M=XHTAR*FRWj9HANGE
68
, R ,, X.'.
CALL ALINEV(PR08,KKNUM9PRO sdETA. 10)Nr PH sBET A, 0)
IF(PROB*LT*0*0) PROB-0.0O_LF(SOWPRO9LT*090) SOWPKO=O0eO
YFRW(II)=SOWPR0
C WFOV1 WITH 45-DEGREE 14RT FOR DELTA T ANU L16LTA PCALL ALINF-VIE.PWtJL.T~-7QVSH.T45,2QICALL ALINEY(ROGER.POWERowFOV.ELAN4b,20)
* XNU4LIXHTAR*fRW /RANGEXXNIMU4XHTA:*btOGER**RAN:E QQALL ALINEV(PI4OB.sX)NUM*PRO olJETAI0)I ~CALL AL INEYIPOWPROXXNIMoPRO .BETA*10)I
IF(POWPRO*.LTe0o0) POWPRO=0*00X45TM II 1-PRODX45P3( II)-POWPRO
.CALL MDTSNRtXMXYMYM.FFFFKXCT,:FHOL4.T~kpRANFTiiANSeSPRot~,X~NET
OSN(I I)=!)S1> C- DETECTION WITH SIGNAL-TO-NOISEii ATT-XLTAR*XJ4TAr4TOzDETEMP*TRANSARCn(ATT 1 'DELTA1X'DELTAY/k2,I.)**O.5T ARC ( AT T#'EL TAX/DEL TA VlR2#F ACT /FAC T+1. I0.5A~kC-0ELUTAX*DE.LTkY*R2/ATT.I.TEB3ARC-OELTAX*OELTAY*FACT*FACT4'R2/ATTieTRFRUEIEB. T ..
IF(TEFR*LT*1.O) TEFR=1.O-TSE( RI )=TD,')r.NMEBARC *ARC *TEFR**Q.*5SSE( II)uTDKFXNET/TEBARC*TARC*TEFR**0.5
0065 CQMTZPItUEIF(JPkINTeEQeO1GO TO 8012LF ( LAFLQ 40Q. 1 hWRI TEUAm1U1......
OR I TE( 6.99020 JOE TE MP_1022 YRMAT(1Ht.1*2.kDETECTION BASED ON MDT.V1H ,27HTARGET DELTA TEMPERATU
IRE IS*FIO*2,&II DEGREES Cof/)
9021 FORMAT(6XoSNAANGEs6X*9HATM TRANS,5X.3HSiNSXIaIHPROUsAbiLiTY,'.
IF I IAFLG 9EQ. I)WRITE(697001))____ KRL.T~tG 9-199 JDE IE MP9999 FORM AT(I1H.Z 1HOETECTION PERFORMANCE/
1201H TARGET DELTA TEMPERATURE IStFIO*2913H DEGRELS C)
WRITE(6*9900)
99410 FORW4ATtIN &I1iINFOV PE RFCJRMANU Tk4j AAT Rr; DEPfN)N PIFURMAN
IF 4 IAFLG oNE.e I )GO TO Z002
9909 POR06AT(IIN ,61INFOV PERFORMANCE I_Xaft RITITEL.98991 (XDR(I),DoT(I)sDRTX(I).LIRTY(l),X45P4(1).I~1.Ig)
IF (IAFLG *Ego I$WRITE(6.'7000)AWITZ(Go 9999 IDE.TIEMPMAE TE( 6.97971
69
:4,
44

9979 r-hb4AT(1h *IabHEFOV PERFuNMAN4CE.'JA TEMPERATURE ()EPENDLNT $ItNEUNMANI CL)u'IITLCB.9898) I*DR I 13,DDT( I) *SJIML1I) ,YDR(1).ItX4DT3( 1) *12l *1II)
I F ( I AFlL. *NE . I1I G TO 2 ý03
UI IT El ot 70VIEo9999)UE TEMPw* WRTE( 6.vo9O2aI
9902 FURM AT( IN H*16H-wFOV PE-RFORMANCE I2003 wRI TL to.98'9) IXURC IhDoT() I. XFRE( I)IYI-ReCiI)I ,K4.WJJ(IjI 1=1jIjI
9u~8 FLJR%4AT( Il-H ,511ANGE,6X,9HATm rNANS,6X,?MX Oi-T TtOX,7HY VET r*oX*Brw15 UrT 1//(IlX*Fb.2oFIS.2s3F14.2))
id99 Ffld4AT(IM *2?l-0UWER DLPe-NDENT PEklPONMANCL/
L IN abIIRANGt9bX99HATm FrANSoK.THX L)L Ps6~m.?MY DET PebA~bHO
15 ULl' P//(IlXF5.2,F1S.2s3F13*2))
DEF Tt= MR 0 )E TL MN P40U0
1086 CUJNT INUC80 25t CONTINUL
* XNET=SAVNET* GU TO 8400
601? CONTINUE
* END
* BLOCK DoATADIMENSIUN XINFUT(IO) 9QUTPUTIIOI
IIRDAXIV4DINI0MAX.LRMIN.PLUPOe0UTPUT.XNTAROXINPUT*NL#r&*@IM'LG
CUjMMoN/NAME5/ZKOUNT*XMAGeF&TARjFEJW'FX-Difl-* COMP4UN/NAME4/DXW.OLU.FI I0).S(I0).KNET.DELTAEDELTAV.EVETN4fOMPR*VS
IVF:)V.RMAG*XNoXNSCe flVER aJRcnLrESit r1,JIDIzC.T-*T&.Ak4LfiasnfýnZXLAkI43.FNUMBFOC.XKFMAXF .XY0C1L.FMAX.ESIGLSYSIGLS.EA.YAKKK.tLUTAU.VEL. HBL -LrCOMMON/BLUR,"ABLURj
* DATA HFV60/VO/f. 4/0?/FNMe"Z4*O* DATA ANGLE/60.O/.SRTAD/.O3096/.DISC.#*/1OX/6N//ODELTAM/*86'4'
I DLL T A Yt/O. 86 0N0/.MO/0/F S TAR/ I flOD-flD.&OZaO PEAK46hast-.------DATA F R /15 *0/ 9 KNSC/O.e 7b/.O00VE RSC1 /. *00/DATA FELkai.Du.0a /-&. Wkj &AtfMHA XiFlaQ 0DATA AKKK/0/, DR I TE/509O' 0 9XY.'O.00/VXYLt,0.O0/.MXA/O.* I6BD/. A10e 16a90FDATA F AC T / 2e0 /.sEYE TMt/0 *2/ta XSJICL5/f0 s.0/aflLSGLStDA)s(dZ
* DATA XMAG/4*80/PXNET/'0.O/DATA XL TAR/ 5.*2 5/.*XI1T A,14,2 a?/&DE TE MP/ .1,fi4&URGZ l/SDDno I *---
DATA IRIMINi'500/, IRMAX/SOO0t',JRDIN/I000tIPDAX/I0000/D&TA ~S. .0ftl.l
j END OUTPUT/42*O.I .1.O.2.0.3.0.A.0,9.O.3*6.Ot'
70
*l-POP
&Tw,'
SULSAUUT INE LNI T IAFLtp)
C.S TH1IS $UURUUTtLN~ INITIATES THL 1/0*. IT L)ETLfRMIrILS IPCo THt: JOd IS TO ULE RUN IN AN INTERACTIVt- Jk C)ATCH MUDLCS ANI) PRINTS A UANNER WHICH IDENTIEKIES THL PROGRAMCo USI4(j APPRltO~NATF SC.RELiI.CAHRIAGE CONTROL.C#CS THE. VALUE. OF IAtýLt IS CHANGED T13 RFFLLCT THe'C* .RESUL.T UF TH-L INTE.RACTIVE/t3ATCH ULCISIUN AS FULLU*WSCsC* IA1 _.pzz INTERACTIVE JU~3.
CS IAFL(ý1 BATCH JOt!.CSCS THIS 5UBRJUTINF IS NLCLSSAkILY SYSTF~4 UEPENDF-.NT.CS THERE- ARE TWO VERSIONS - ONE 1-014 TH-L COC(f.000
CS ANDI) NE FUR TH-L ItiM3b0/'44.
CS THIS IS TH-Q C.)C6600 VEWRjitUN. IT *4tLILS ON TH-LCS SETTING OF SENSE SWITCH 1 TO M4AIL TH-L O3ATCt-i/
CS IN1TERACTIVt4 OLCISLON AS FULL3WS:
CSCS SSW I =J) INTERACTIVE. JOti.(IC* 54WI=OFF BATCH JOBc
Col SE'4.-E SWITCH I MAY UE SET UY USE OF THE SCOPE 4s2
CS CUM'IANDC* SwITCHsICS CARL SHOULU LIE TAK(EN TO USE. THIS CCH4MANU UNLY
CS ONCE PER SIGNON AS REPLATLU USL RLSETS5 SWITLH I*CS THE CURVýEL`T STATUS OF SWIlTCH I MAY ALWAYS liEC$ FOUND) VIA THE CUI4MANDCS A'SLtTSCS THIS WILL RETUkN THL STATUS Of' ALL SoITCHh) wi-ITCHCS ARE CURH6NTLY SUNS'4.CSCS CA..L SSOTCH( I IAFL(J)C IF( IAFLG *EO.I)GO) TO 10
CS BATCH. SKIP TO NEW PAGE- PRINT HANNER, ANI) RLTURN.ft CSeATV.CJNL NU AN2/ S:STPMUL)LL,-km. PAGL f'JLL
CS WAIT. CLEAR SCRN-EN, PRINT 'JANNE.R9 AND RETURN.
CSIO CALL CUJNNEC(.5LIN1-UTs0)CS CALL CUNNLCCbL0UTPUTa0)C *RITE(6*1010h
CIOIQ FONI4AT(IHU)C WRITE(b9I020)
C1020 FCIN4AT(51I Oil ,,13K925HNVL THURMAL SYSTfM MOULL ,
C 122H(INTERACTIVE) 12/05/749/)
E NO
~2 * 71
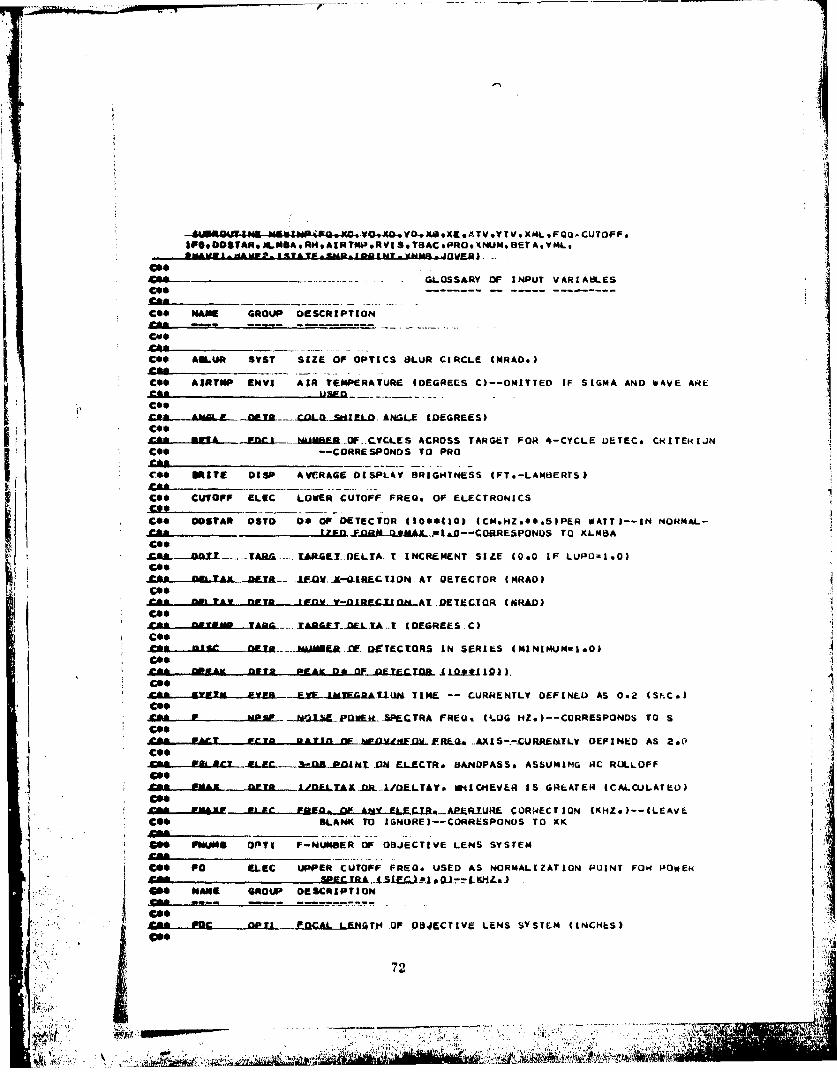
~~~O~T0&4W XG ~QIOV.D.Y.8x.TV 9YTVs ML*FQo- CUTOFF*[email protected]. XLNBA.RsAM AtRT"bPRV I So TBAC oPRO sXNUM, BETA*,YMLs
D~5C~jPII~4 GLOSSARY OF INPUT VARIAWLES .C4.
C.. AGb.A SYST SIZE OF OPTICS SLUR CIRCLE (MRAOo)
coo AIATolp ENVI AIR TEMPERATURE 4DEGREES C)--OMITTEO IF SIGMA AND WAVE AkE
C..
*q~AEflCJNMEA .OF.. CYCLES ACROSS TARGET FOR 4-CYCLE DETEC, CkITEHIJNC*C �-CORRESPONDS TO PRO
Co* BSITE OISP AVERAGE DISPLAY BRIGHTNESS (FTo-LAM8IERtS)
C** CUTOFF ELEC LOWER CUTOFF FREG. OF ELECTRONICS
Co DgN0T,0 FDTCO 1040 C*Z*,tE AT-I NORMAL-
C~ hlAVflfg ~ly V-FQR--nfe'ia.AlLitM-CTOR IREAONU OJLBcoo
~~& ~ .~.Ia.. QVMAJEaR L ECIOR5 IN DEECTOS (MINIUMU.O
III gbr as?, AS 0.R, SF.CD)
cooLg._a~ PeiUMS
AlT -USR FOJCIE ESSS
."IN PU.'
CAMA___ DEFINE DESCR2TI0
t*B P--Ed OarI Fn.J,"Oll-TAILk QROF ~ECT&YaIC4EVE IE S SYSEATE (CALCULATED)
C"erglL__J~f~x G~mAPRTRE ORECIO fH~)-(72V
coo BLN TO AGUE-CREPN) OAMAa
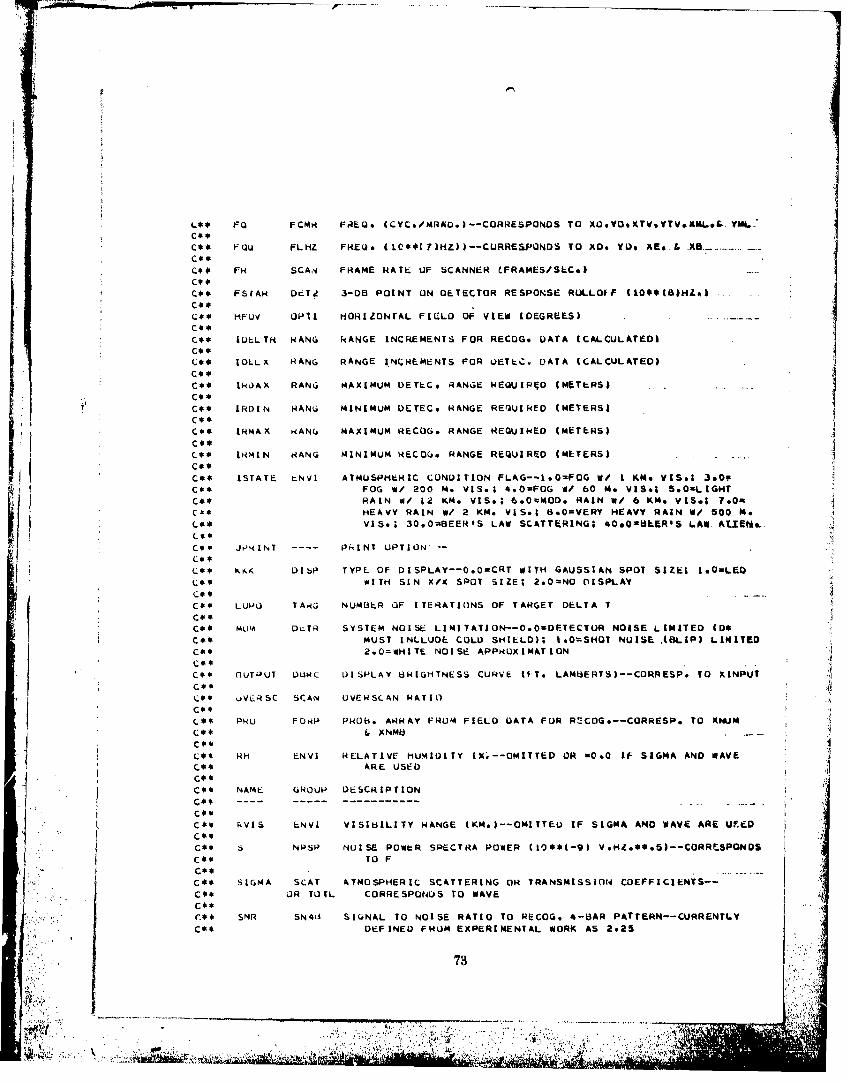
L** PG FCMN FRiEQ. (CYC..'MRAO. )--CORRESPONDS TO X~oYOsXTVsYTVoXKL..&-. VOL-"
C*$ I-OU FLI-HZ FKEQ. (lC*#(?lHl))--CURRE&POQNDS TO XD. YD, X.E*.L XB___
C*#* FR SCANa FRAME RATE OF SCANNER (FRAMES/SECel
fC** FSfAk D ET,4 3-U POINT ON DETECTOR RESPONSE RULLOfF (II0*(a)HL.)
C*4. HFUV OPIL HORIZONTAL FILUL OF VIEW iDEGREES) . .
C** IULL TR RANG kANGE INCREMENTS FOR RECOG. UATA (CALCULATED)C* *C** I DLLx X RANG RANGE INCREMENTS FOR L#ETLC. DATA (CALCULATED)CW**C** Ik0A X RANG. MAXIMUM I)ETLC9 RANGE REQVIR4D (MeTERS)
C** IRDIN KANQ, MINIMUM UETEC. RANGE REQUIHED (METERS)
C** IRMAX kAN4j MAXIMUM RECOG. RANGE REQUINED (METERS)
C** IN4I N RANG MINIMUM RECOG.* RANGE REQUIRED (METERS)
C** ISTATE LNVI ATMUSPHERIC CONDITION FLAG--I*O-FOG WoI I KM. VISo. 3o0wC** ~FOG W/ 200 M. VIS.; 4.O=FOG WI 60 Me VISo. 5.OmLIGHTC** RAIN W1 12 KM. VIS*; 6.0wMO~o RAIN W/ 8 KM. VIS.3 ?.0nC a* HEAVY RAIN W/ 2 KM. WIS., 8.O=VERY HEAVY RAIN W/ 500 Me
VIS** 3090=BEER*S LAW SCATTkRINGs 40*02ULERIS LAW. AtEtti...
C*4' J,'NINI -- PtINT OPTIONC* *
L** KK 1 iSp TYPL OF DISPLAY--0.0=CRT WITH GAUSSIAN SPOT SIZE& I.0aLE.D
cs* wITH SIN X/X SPOT SIZE. 2.0=NO OISPLAY
C** LUPO T A.G NUMB3ER OF ITERATIONS OF TARGET DELTA TIC**A MUM OLTR SYSTEM NOISE LIMITATION--0.0=DF.TECTUR NOISE LIMITED (D*MUST INL.LUDE COLD SHIELD); I*0=SHQT NOISE (eLIP) LIMI1TED
co: 2.O=WHITE NOISE APPROXIMATION
C** nUrT)UT LL3R c DISPLAY UkIGH-TNESS CURVE (FT. LAMBERTS)--CORRESP. TO XINPUT
Q** 1 .VERSC SCAN OVCNSCAiN RATIO
** PRO FOMP PHOII. ARRAY FROM FIELD DATA FOR R"-COG*--CORRESP* TO KNUMC** G XNMU
CL:: R ENVI RELATIVE- HUMIDITY (X.--OMITTEO OR =0.0 IF SIGMA AND SAVE
C** ARE USED
C** NAML GaROUP DESCRIPTION
C*,# kVIS LNVL VIS18ILITY RANGE (KMo)--OMITTED IF SIGMA AND WAVE ARE Uf'ED
C** b, NPSP NOJISE POWER SPECTRA POWER (10**4-9) V.HL.**o5)--CORRCSPON0S
C~ot TO FC*,C** S IG(MA SCAT ATMOSPHERIC SCATTERING OR TRANSMISSION COEFFICIENTS-�
O~ R TOIL CORRESPONUS TO WAVECo*r.#* SNR SN 4J SIGNAL TO NOISE RATIO TO PECOG. 4 L3AR PATTERN--CURRENTLY
C** DEFINED FROM EXPERIMENTAL WORK AS 2.25
t. 73
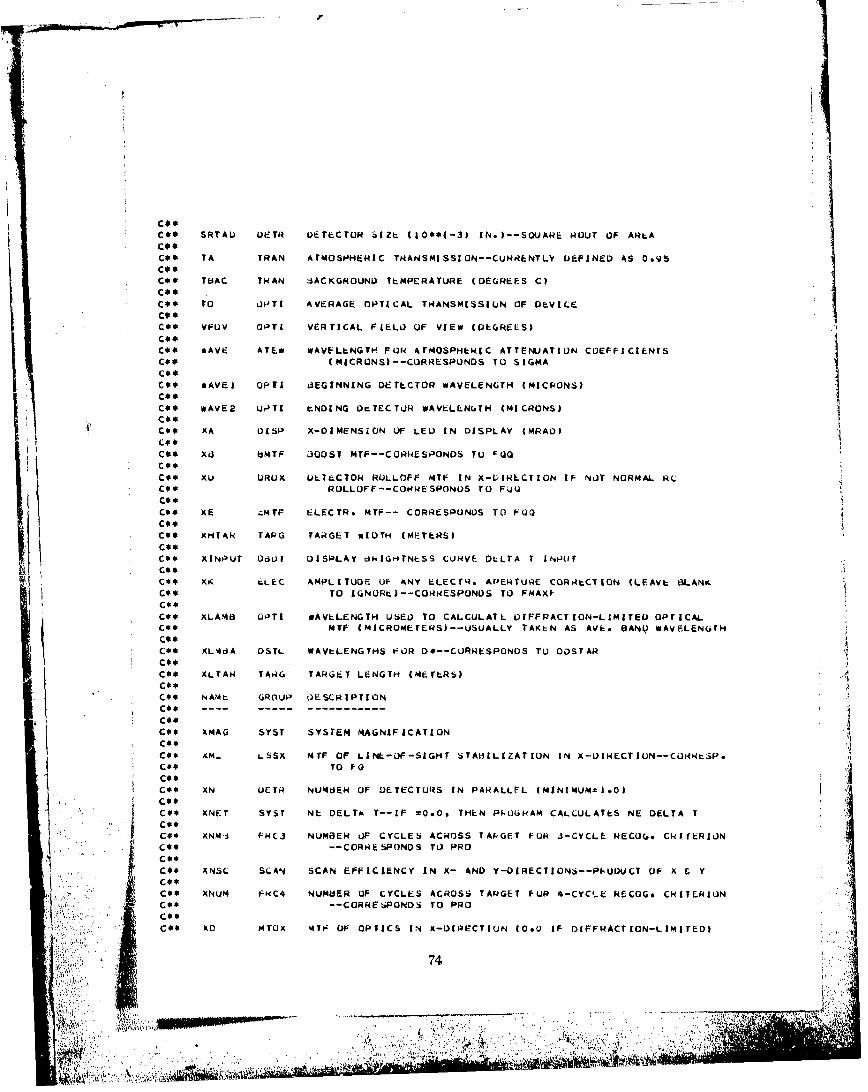
C** SRTAU UETR L)ETECTUR SIZt (1O**(-3) IN.)--SOUARE ROUT OF AREA
C** tA TRAN ATMOSPHERNIC TH4AN SN41SSI ON--CuHAE NT LY DEFINED AS 0*95
C* TBAC THAN 13ACKGROUND TEMPERATURE (DEGREES C)
C.: TO O AVERAGE OPTICAL TRANSMISSILN OF DE-VtLE
Co*C** VFUV W3 TI VERTICAL FIELO UF VIEW (ULGRELS)C**C** *AVE ATE* WAVELENGTH FOR ATMOSPHERIC ATTENUJATION COEFFICIENTSCo* (MICRUNS)--CURRESPUNOS TO SIGMAC..C.. wAVEI oPrI J3EGINNING DETECTOR WAVELENGTH (MICRONS)C*.
* C## wAVE2 U#'T I ENDING Ur.TECTL)R WAVELENOiTH (MICRONS)C*.C** XA OISP X-DIMENSION UF LED IN DISPLAY (MRAD)
CO* u UTF L30051 MTF--CORsoeSiPNDS TU vQQjo DuUO LTIýCTOk RULLC3FF MTF IN X-L'IHECT ION IF NOT NORMAL MC
* C** ROLLUFF--CONWESPONUS TU F4UC*.C** XE .m TF ELECTR. MTF--- CORRESPONDS TO FOGC.: .
* C** xHTAk TARG TARGET WIDTH (METERMS)
* C*: XINPUT Da~l) DISPLAY cikIG.-TNESS CONVE DLLTA T INPUT
C..
C*. XS4A c.LEC AMPLITUDE UF ANY ELECtR. APERTURE CORREC;TION (LEAVE 13LANK
C.. -- O INRLHESPOND SPS TO PROX
C** 4LNa SCAN SCAVLNGT USICENCDI TO CANDA Y-IFRACTIONS--PITEDC OPTIA
C** XNUMk TAC* NME OF YCSACOSTARGET LENGT (METERSCG.CRTEI
C**' UI*~-.--- -.---- ------
-CAL#--CONM~SPUNDS TO FQ
C*.E&L~L CUM $I E)IP& CONSTANT TO GIVE GAUSSIAN FORM TO3 VIBRAT IUN MY,---Coo=2(PI ) **2*4 SIGMA Xh**Z WHERE SIOMA X IS STU. viE.V. uF
Coo*.cI XTV VMTX MYP OF VIUICU14 IN4 X-01RECTION--CONRESPUNiS TO FUCoo£*j XAJMaT ma.U MiASUMLL) ý'ALUES OF MRT . To ae INPUT
CoMRT2 ON 2 CARDS IN VALUES OF MRI*O).(JOIC... MRT3
Co.
coo KY ELLC K-DIMENSION OP LEO IN EU MULTIPLeXLr! (MRAJ)
Coo XYL. ELEC Y-UIMENSION UP LED IN ED MULTIPLEXER (MRAi,)coo*Coo YA DISP Y-DIMENSION OF Lh() IN DISPLAY (MRiAO)
Coo YD DR1OY DETECTOR ROLLOFF MYF IN Y-UIRECTIUN If- NUT NORMAL HCROLL0FiF7-CORIAESPUNUS TO F.40
C..coo I&L. LSSY MYP OF LINE-OP-SIGHT STABILIZATION IN Y-DIkECTIUN--COkRNISt-.
Coo TO PD
itICoo YO MTOY MTP OP OPTICS IN Y-OIR&ECTIUN ("0IF UII-FWALTIUN-LIMITLO)-cko. -- CORRL3PONPS TO PDCooCO0* YSIGL.S STAd EXP. CONSTANT TO GIVE GAUSSIAN FORM TO VIBRATION MTF---H Cos =2(PI)**2*(SIGMA Y)**2 wHERE SIGMA Y IS STU. LULV. OFh
c*,* VIBRATION SPECTRUM IN Y-DIRLCTIUN
ChX-.~..tII~KIPP VDICON IN Y-UINECT ION--CURPES PONDS TO PuC..CAL4'Co.
Co.
C..Coo
CoofIMfdfl.SO&M~11IK~~(o
757
coo'
\ Coo
2*DYML I 101OXNM8I 10) ..
DIMENSION X*U4IT(20)CU1OUN/NMtLJ./JFLAsA4PHJNitýD~T~EDnA.~.a*LD
IfkIIRU4AX9,IRDINs. MA A.IftMI N.LUP0 ,OUTPUT , ANTARgAINPUT , LT AR. IAP.GCOMI4N00NAM EAI)AW*OLV*F( 10)vS( 10).1 ZNIlr.*ngfIA~D.A,~E..8.iOIVF3VLMAG.XN.KNSC.0OVERSC,83RITE.SRTAD010!C.TA.TOANGLE.MOM.ZSTAR#2XLA,4JFNUMBsFOCXK.ZM4AXFXYeAYL.FM4AXXSLGLSeL-SGLSAi A*-AXtA..KM.M -..3 IOTAU VhL. ZELEC rC QM414N /$P.CA TMVWAMf. a&li4&..CUF40N/dLU6k4/A8LUP*COMMON/VNAME5#'LKUUNRT9 XMAG&F STAR sFELECTsFfMAXFCOMON/NAME I/XDR *DOT 9TSE 9SSE 9S014E XFMW9ORTX OETEM*FFT 9 XXRT
C OM RUN / NA M .k XXM R T vvZ .4
Z4=0.0
IF(IKOUNT*GT*1J60 TO 1000
C**~***S*;*e******* DATA NOr IN DATA BLOCK JRDAYTA ***o*a*
L)ATA R/4HN1OR1,AhdANDANOPTI ,AMDETR,4NDET2.AHSCAN.*IIELEC.4I4DISP9I4HT1~Aia4H.SNb#,jFC.TT-1fXB,&AIaSsT-4ki .4H4 .4*4 &W424HFJR294H ,AHFLHZ.4MDR0XAH0ROY.9I1EMTF.4H8MTF.4I1PCMR.4HNTOX.34HMTOY.AMVM4TA,4HVMTY.4MLSS~e4HLSSY,41tNPSF,4HNPSP&.AIWSTL.4HDSTDa444D8 OT o4HO3HC s4HF RC 3 s4H'F C4 94HF04RP.4HFOC 1 94H **1 .4H 954H *AN w4t1 *4HENV194HTRAN.4HSCATs*KATLiaHTARGI1PAMGa.-.64HT')3TL .4H 4H ,4HMRiT3.4HMMIT24HMRT1.4HIGNR,4IIDONE.4HENDSo
L** DETE~CTION + R~ECOGNITION PROBADILITLE.S.
DATA UBETA/12.S5.50.3.0,2.0. 1.5.1 .0.a75,.5..2ýLQ.O1..
DATA DPiRO/&.0,1.0, 1.O.95..80..50.-30,.10..02.0.0/P ~DATA
DATA DXNMB/37.5.15.O.960,b.094.5,3.0.2.25.1.5..?5.O0,'/
C** DEFAULT INPUTS FO)R *UNIVERSAL* SYSTEMS
DATA S3/b4.0..32.7,16.0.7.12.k4.0.3*l.O.*2.OODATA F 311 & *0.&1 .e A&2. 0.a.&2A-..a0- ODAs kZD..l.DATA DS3i'.23..38.. S,.58..73..78..88.2*1 .0..25i4OATA XLM83A3/'.0Al.Olo2.0.2.5.3.0,3.5.4.0,4.-5.S.0.5&/DATA WAVE.Sj'J0. 3.25.3.50.4.0.4.25.4.50.5.0/
DATA UPEAK3/3*0/vXLAM8J/4s0/'-DATA S8/32.0. 16.0,4.O,2.25.4* * 0.2*0.0oIDAT A F 0/. v0 9iq-Q ~Q... 0. 5. 0.6. 0 2 0, OleDATA 0SS80.ib,0.84, Q.$8.0.olt9Z..014.I.0.0.9.0.74.0.24/'DATA XLMBA B/ 7 o5 s08.0@So5 o9e 0 v9# 5.a1I 0o vI0o 5 aII o 0 912 a0 aLftiDATA WAVEB/b.0.9.0. l0.0.11.0.*12.O.IS.0,14.0.'
DATA DYD#'L0*1.O.#DATA [)XE 4 10*1*0/ .
DA AB / 810* 1.0/
DATA DFQ1/0.10.1.O2O303b40A~5O~0?
DAO/I*I.0"76

L)ATA UYL)/10*1*0/IDATA UXrV/1o*1*0,-UATA. OT)*/1r)*190/
UATA L)Y4L#"10*1.0/
XNMVJ( I )=UXNQt( I)
XNU I )=DF(UM(I)UE1 A I )= )Bd (1
Vo( I a)YOX( I)
YDV( I )=UTV( I )XEt( I )=DU4L( 1)LiYM( I ) =)YLQ( k)
TYO( I )=~o 1)
95 PCN TINT=O
ITATE=.9
UPhA =UPEAK3
X I1. A 4 B= XL AM B.3
LUu 401 J~ls 10
UDb FApi J D S 3( J)XL M dA ( J XL 4tiA3 J I
96 0 10000 .0j
wAFCIA RLG 5N.1)GTO0
2511 WAt(JNTLNfACTVtLY.
)LA) V E. I~j =t4 J. 0FLG IN
* J) PROGRAM PEAOS I0NP4AT INPUf CANI)
G0CLON TO IN40
10 10 JNAT4*,bX,1):) . 140LF'AL)( 5* 1 03I)) NM1 C TFLAG JPRCNT
IF('JAMI F Q R I18) )GO TU 300C
778

C*CALCULATED INPUTS *DI AM=FOC,'FNUM6
FA4AX= I .iEL rAXF(OLITAX*GT.DELTAY)FMAX=I.O/DELTAY
IDIELTR=t IRMAX-IR141N)/9IDELX=t £R'AX-IROIN)/9
5910 FORKT(Itv;75f1KR HAS 3ELN MAUE ON INPUT CARD-DOES NOT CONFjRM TOIPROPER CONVENTION//)CALL_ EXIT
C*.
ý" 1 INPUT* WITH F10*3 FORMAT LFORI)
2000 C024TINUEWIFIAFLC..EQ. I lRI TEl 65922)
5922 F0RMAT(12H&NEXr INPUT:)R EA U( 5 a o I0) r1 T 2o T (I )* .1=7)
20 10 _FDRý4A1. AA _.2 K -A 4 s7F 10 a 31IF([OAFLG*NE.I)6LJ TO 2002IF(TA.EQ@RI62))(6o TO 1000DO 2004 1=2910
IF(TI*EQ.R(I)fGO TO 20142004 CONfINVE
lF(TI.E~oR(13)GU TO 20142006 CONITINUE
DO 2008 1=48.54IFITolk *R(I))GO TU 2014
2008 CONTINUE
IF(rl.EJ*Rtz))GO TO 2014
202WRITE(6*5920)
GO TO 2000
2014 WRITE(6.5921)59 ~2 1 f na EAlLt 2i ;), .
~LL READF(T)200.Z .ý(TIoEQ.V4i3W)O TU 2025
IFlT1.EJ.R( 21).O TC 20.20IF(TI.EQ.R( 4)160 TO 2030IF(TI.EQ.R( 5))60 TO 2040
~i-~iiARA)iG T I 2 QfQIF( I.&*EQ.Rt( 71))0 TO 2060IF(TIoEQ.R( 8)IGU TO 2070IF(TI.EQ*R( 91))6 TO 2080IF(TI.EQ.R( IO))GO TO 2090
IF(Tl.E~J.Rt 2))GO TO 2110~~A1X~~9Rt1 _iO T.2 12 QIF(T I*EQ.R(48) )GO Ta 4030IF(TI9EQeR(49))GO TO 4040IF(TI.EQ.R(50))GO TO 4050ZF(Tl.iE0.R(5I))GO TO~ 4C609F(TIoEQ*R(52l)GO TO 4070
if~i~Q~53I) )O TO 4080IF(TI.EQ*R(54))GO TO 4050IN'TI.EQ.14(59)) GO TO 3240IFTA.E~oR(58)) 6O TO $250IF(Tk.EO.R(571) GO TO 3260( IF1TldF6.R(b2)iGO TO 1000
ii 78
k I rEC 6o 5920).. v 5920 FORP4AT(IX954HAN INPUT SYSTEMS CARO FOR FORI HAS NOT BEEN RECOGNIZE
CALL EXIT
C** OPTICS INPUTS
NOT TO 2000.
IFNXLMB= LE.1) .. N.LM.E80G o20
DLTAXT(3) .-
OISCUR=T( 4)
F0LAI00.0T( 7)
'IF(LU *E1..N*LMo~~OG TO 2000
C*.
2030 FSLTAR=T(l)*0. .-
MOMS IFI T (2))
ANGL=TII)
GO TZ) 2000
C.**
C**
2040 FSTART(3)*10
XNSC=TFI(T2)
GO TO 2000C* *.-- . LTOIS NUT
SCANE INUTFELECTT( 2)OVERSCT(3)
G0 TO 2000
C*. DISPLAYqTlfj INPUT S
C*79
206 . .OFF-.11
FELCT=(2
XY=-T. .'.XYLtT(4
2070 KKK=1FIX((ra)1
8R IT E=T 2)* XA=T(3)
YA= T ( 4)GU TO 2000
*C**
A 1L Z T J N NP TC* *
2080 XSIGL5=T( 1)YSIGLSýT( 2)GU TO 2000
C * CONSTANTS (UVERRIOE)
C** SN48, FCTR. EYt~i2090 SNW= T( IGO ru 20002110 EYErm=rc ii
GO To 2000
C*.C** ~SYSTEMIPT
2120 HFOV=rc NPUTVFJV=T( 2)
XMAG=T (3)FACT=T( 4)
GU to 2000
C* *C*.
C* NVfI RQNmE ITAL INPUTs4030 A IR TMP1( 1
kVIS=rc 31I StAT *= IF IM T(4))
IF(RI~VS.&.O.0.)RV, S.23.0
GO To !ooo0
C**
4040 WAVE.(l)
4WEAVEr( 2)=Go TOb J2000
401 AE(.)rJ
-30 40-4-- iS~
-GO -. 1 20 00__
coo_-- TARGE~T INPUTS
C*.-40-70 -XLTARwT(1)
XHTAR-T( 2)DET.EMP-T( 3)TBAC-TI 4IF( TIAC .O OFlQ* 91. .
GO TO 2000Colt -C*C RANGE REQUIREMENTS
4060 1 R 141 Na I FI XtT 41
KNOIN=IF 1M(TI 3))-- IiWAMKU1FI~t Tt 4)
GPO TO 2000
cc. INPUT VALULS FOR MEASURLO MRr
3240 DO 3245 J=197--3243 YIMAT(jJ)TIJ)*Qe001
Z3u 1.0
A25XXMR Tt J) -T(.-)QGOTO 2000
320 An0 3265 .JmI520
3265 XX1MRT(JSmTIJ-I4)*0.001XXMRTI20)KXXJ4RT( 20)* 100000.
~' I Z4u 1.0GO TO 2000
C**0- ~INPUTS WITHl F::i2 1'JkMAT (F*Uk2)
css41000 r-UNTZNue
IMl IAPLGeE0s I )WRITE( 6o,5922)R~AD( S. 3010 )TI.v t2(~,rL"
3010 FORfMAT(A4*A6.10F5*2)1f(IFLQI1I.SGOTO 3002
IF4T1.EQeR(62))G0 TO 1~000........................Q 041-20941IF(TI9EQ*RII))GO TO 3006
WRITEC 6.5940)
____a AJAI 0 .30.0.5006 WRITE( 695921)
CALL READF(T)3002 IF(T1.EQeR(20))GO TO 3020
.JFIT1.EQ@R(2I))G0 TO 30IF(TI.EQ*R(22))G0 TO 3040LEA-~tU.ia.G~Rt3))rpQ To 3050IF(TL.EQ*R124))GO TO 30600
JR ( T I.EQ.eR 4 S1) G ' To 3070If IT I.eEQ*R(42 6) GO TO 3080I- IFfT I *EOsR12 Z IGO TO 30~SIFT l.EQ*R(2s)1GO TO 31001F(T1.EQ*Rl3011GO TO 3120IF I T IeEQ *R ( 30) )GO TO 3120
... ~ 1P(T909R( JI)IGO TO 3130PIFT 1.EQ.R1321)GO TO 3140
fp -h8
IFTIQR(33)GO TO 3150 ... ....
IF(TI.EQ.R(34) 3 GO TO 31601F( T"1.EFQ.RL... 5 2 Dr•:_ 31..Z k...............
IF(TI*E*.R(36)sGO TO 3180IF( T I.EQ.R( 37))GO TO 3190IFI TI EQ.R(IJ))GO TO 3200IF( T I.EQ*R( 39) )GO TO 3210
IFEI I IE.R(40))GO TO 3220
IFT TI.EQ.R(-41.IGM TO..3Z3 __IF( T i.E2.Rt b2) )GO TO 1000
WR1Th(6 .5940)5940 FORMAT( iX*.4HAN INPUT SYSTEMS CARD FOR FOR2 HAS NOT aEEN RECOGNIZE
1D/)CALL EXIT
C CL FREQ. (LOG HZ) FOR ELECTRe
3020 00 3021 J=t.103021 FQO(J)-T(J)
GO TO 3000
C.. MTF DETECTOR RO3LLOFF-X
C.. . -
.'030 DO 3031 J=1910
303A. XD(J):T(J)GO TO 3000
C** - - -*C** MTF DETF%;TOR ROLLOFF-Y
3040 I.O 3041 J=I~kO .
3041 YU(J)1T(J)GO TO 3000
C*. MT.F FRED. FOR YTES
C** ,
C..i
3050 00 3051 J=1O103051 XE(J)=T(J)
GO TO 3000
C:* MTF BOOSTCe4
3060 00 301i J=19103061 XO(J)=T(J)
GO TO 3000
C*€ MTF FREQ* FOR SYSTrEMS
3070 DO 3071 J=1910I 3071 FQ( J)=Tý,J)
-. GO TO 3000
:' C** MTF OPTICS-X
S 3080 LUO 3081 J=t1910
I , ~~3081. KO(J )-T(J) . .. . .t i GO TU 3000
r'I ~ ~~C**.. . . .. ...C* MT.F O,, CS-Y'13090 DO 3091 J=1*L0' i3091 YO(J)=T(J)
GO TO 3000
82
• : "
,.. , . ; • ,•
C** MTF VIDICON-X
C**
3100 DO 3101 J=lI0J101 XI'V(J1=T(J)
GO TO 30•0
C** MTF VIOICON-Y
311000 4111 J=1,103111 YlrV(J)="(J)
GO TO 3000C**
C** MTF STABILIZATION-X
3120 DIO 31l1 J=1910
3121 XML(J)=T(J)GO TO 3000
C** MTF STABILIZATION-Y
31.30 DO 3131 J=1910
3131 YML.(J)=T(J)GO TO 3000
C**- -'-
C* * NOISE POWER SPECTRA FREQ.
3140 DO J141 J=1.10
3141 F(J)=T(J)GO TO 3000
C*- NOISE POWER SPECTR'A POWER
3150 DO 3151 J=i,,3151 S(J)=T(J)
GO TO 3000C**
C** LAMBIAS FOR D*
3160 DO 3161 J=1.10J161 XLMt•iA( J)=T( J ..
GO TO 3000
C*X* NORMALIZEO 0*
3170 00 3171 J=19103171 ODSTAAR(J)=T(JI
GO TO 3000
C** OISP, DELTA T INPUT
3160 DO 3181 J=1.10
3181 X1N43UT 1J)=T(J)
GO TO 3000
C*, DoISP. BRIGHTNESS OUTPUT
3190 DO 3191 J=It10
3191 OUTPUTV J)=T(J)GO TO 3000
C--C** FREO. FOR 3-CYCLE RECOGe
83
__- ..- :.._ilk&

C*.*3200 DOi J201 Jul.10
J 201 xNmdtji=TCJ)
GU TO 3000
C* * FHEu. FOR 4-CYCLE RIECOG.
C**
3210 DOi 3211 3=1*10
32.1 )ANUM(J)=T(J)
322 rO 322100*1
3221 PRLUJ)=T(J)
GO TO 3000I C.* FPPhO FO1k I-CYCLL OtkTEC.
3230 DO 3231 Jz1.13
32-31 tsLT4(J)=TtJ)Go to 3Q000
C** Ut-FAULT INPUTS FOR~ (iFNERAL SYSTEM
C.*C.,
C**PRINrUUJT FORMAT$ F-UR INPUT DATA
C** FORI INPUTS
C**I 503C CJNT tNUL1P1NAA41L. I..ANO.Z.fQ)) SIGMA(I =0.
IF I IAFLG .LQ*. 1)WRIE( 69700C-7GO 10F-UW4lAT (34 (/1,t 9 SH 9 920 X91O.101N.'U f 0A TA //
IV C IAFLc.. *NF. LkI *1TIEIb,#O10)
5010 FUH'4A111M1. ICHINPUT DATA///')I *R~ITE( ot 50 o)aIKULUdT501b FQUH4ArIH , 10NUN NLJ~dEH.IS//)
W4IT~i 6.503I~wA VFI ,WAVE2
5031 FORA4AT(1H *21HYUUR SPE(.TkAL IjANU IS*FIO.3#6H 1U*Flo.3,
lI II MICRONS//)OR IT E( Se504&l1)UIAMs F NUMb 9f- UC 9 T, sXLAMU #Af3LUR 4
5041 FUR'4AT(lI , 6HOPTICS/i/
3 T 69 3OO IAI4E, LR of- too3610H I NCHE.p/4 T 6930IIF -NUI~dER W FI0.3/'
to 6930HFULAL LLNGrH 9FIC*3*10H INCHL.S/ .I Td*JO)HAVG. OPTICAL TRANSMI4SSION 9F1C.3/
9 TG.3OHkAVtiLLGTH FUR 0D-F~ACTIflN *FI-0.3o11H MICRUNS/
J Tb*30Hi.LOMET~iC dJLUk SPOT SILL 9FI0.-3e9H MRADS/)
WRIT %A 095051 )EL TAX*DLLTAY* XN o iC vSkTAL) tJPFiAK*Fýý AN~iLE
5051 F3R14AT( IH e BHDE TEC TOk//~
5 T69.~40HQRUZUNTAL1FCIIV ::I0.;3i9H MHL.
8 Tu.,30NMEAtU'l1NG FHLUULNCY Of- 1)~ *F10.099H Ht [T Z/I T 6s 3HCULJ 514I&:LO ANuLh IFIO.3,I1i1 U DGJ.IL S
IF(C,4uM.EQ*CI)ITt'C69bC53)
84
ag *-3d,'

tF(4"&X4" I) wa laA,5055)IFE MOM .50.2) WRI TE(d8.5057)
Q53s FOR~MAT(CN .f6a3WflLL~jTIN9 NOISE ,Y .0MOLTLCTUR)
5055 FO0RIAT(IH 9T693OHLIMITING NO ISE itt)(.4HS~uT O)
5QTft? ORAr(IN &T6.3OIILIMITING NOISE ,t K ,I)wti*HI TtL A$PPI
981TVAA,50591F STAR
5059 FORMAT(114 *T6930OMDTECTOR NESPUNSE,3-06 PU)INT It 1 .3. 9h He R I'~
IF (IAFLG*EO. I)WRITE(6.TGOO)4WRlTE(6mi5061 )FRsXKNSC9OVERSC
5061 FORMAT(H , VHSCANNERoe.,P
a,- TqbvO0HFRAMrE RATE 91-IC.39Iit-l FkAlit7S/SF-CUNL
.3 T6930MOVERSCAN RATIO F03/
WRITE( 6s5071 )CUTOFF sFELECT@ XYrt XLtXoFMAXF5071 FORMAT(IH , 11 HELEC TRONIC S/
I TO.3OIIPREAMP9LOkf FREQ 3-08 CUT-ON 91-10#39YH- H-iLT Z/
2 T693014APPLIFIERo3-Od PUINT sFIO.399H- rlKTI
7 1`6930HE1' LLD LENGTH .FIO.t',SPH' MRAL)./
4 T6*3ONAPERTURE CORRECTION AMPLITUDE 9 F-IM, /5 T693ONAPERTLJRE CORRLCTIUN FREQUENCY 9FtO.C,'qH tILPTLII)IF. (gAFLC oNko I)WRITE(695010)WRITEf oSOC1I)
50RI FORMA71 I14 7"D 1..rR~L!
IFI(KKK.EQ.1'WRIYE(6,5086)XA.YA,8RIYE
ZP(KKW..EQ*2)WRI TL( 85089)I,5083 FORMAT(I *T~j~l0MTYPE *IIMC-4T L)lbiPLAY/1 T6v3014K SPO'f SIZE IF 10. 3 *JH "RA)./2 X. L630HY s.rlL .SJIL'. .1Oa j 'MH '41AkA./3 T693OHAYERACIE BRIGHTNESS IF10. 3 1 1 H FT. LA\IuLRTS/
5056 FURMAT(114 qTb#3ONTYPE ,11H-LEU) L)ISLAY/I TS.JOHX LEO SIZE IF 10. 3*,PH 14NAL1./2 TO.3014Y LEU SIZE 9F10.30414 PANAd.3 T&3Ajffijk4N.5 t.'1.lb'i fT. LAuLtýTý,/
5l)09.OMTI 06,TYEICHNO ULSOLAY/,f)
IF (IAFLG oEQaI)uRITE(6.?O0O*WRITKI 65092IjlfOVq VF:VXI4AIG *FACT pXNET :I::I ~ J~S
5092 FORMAT( IN 96Hf.YSThM#o
2 T6o3ONVERTICAL FOV3 T6S.3O14AL&GNIF ICA T90N FC3
4 T6*30HWFUY/NFOV OFIO.23.5 T693OHNOI!5E EQUIV. DELTA T *FIO.3,IJH ULtiL..S C//)
IF(MSlrGLS.EQ,.O.0.ANO.YSIGLS.EO.O.O.ANU. XML( I ) I .O1 .ANU. X14L 10~
WRITE( 695091 )XSIGLSoYSIGLS
SA091 F014AT(IM 9 13M$TArIILIZATIUN#//3 T6930HSYSTEM4 STATE 9l!HJN~tTAIILI/LD/
*I T6930NK VIBRATION CUNSTANT orio.3/*12 T6930MYVIBR13ATION CUNSIANT OFIO63//)
5095 URIYE(6e5O9*)*I5096 FORMTIMI H I 13HSTAdILIZATION/'f
3 T6.30HSYN.TEM STATE .10HSTAUILILtUO/I T694ONX VIBRATION CONSTANT O.CC/
2 T6*40141 VIBRATION CONSTANT 0..) o)t 85
5100 uRtT-E(6*5t1O1)EYETM9SNaP5101 FORMATIIH $t5HSTANOARU INPUrS-, j
L. ~106-3HEYE LNrEGRA.TION TIME GFIO.4.10I1 SLCUNL)S/Z: T6930HTHRF-SHOL1) SIGNAL/NOISEIF IIAFLG *NE. I)WRI IE(605010)
540F(RISATE.NI oo 60 TO4M SPEICP10 EER/
IF(9!IEV1S.GT.23.0)iIE(6.0.02) G 60
IF(RVIS.LI)EU10..ANORv)sGOTU 5420)UIt~.4
IF(RVIS*LE*10 6UADR VIlos.G.30 RTo.45IF(RVIS*LE. 3.O.AND.5TIS.GT. l.)WRT~.4IF(RVIS*LE.l1.0.AND@RVIS*GT. be5)uRITIZ(,b940?)
IF(RVIS*LE. 30..AND*RVIS.NE. O.0)SRITE(6.5400)
5*3F(RVAITO.3OHI*0oNO*ITIoN G .1011 CLEAR)40?
5402 FORMAT(T&,3A01-CONITI'3N 910HVR CLR5403 FOR14AT(T693OHCONDITION 910-HIY CLARE)
5407 FORATCT6,JOIICONDITION o9HL[UHT FUG)~A0 Ff~M~t~1i1 i 9NiHEAVY FOG)
WR IT El6. 5401 )R VIS. RI-IAIR TMP54,01 FORMAT(
1 T61,30HVISIBILITY RANGE 9FIC.3*14H KILUMETENHS,2 T6.30HREi-ATIVE HUMIDITY *FI Os 3 11MH PLRCCNT/3 T6930H$AIR TEPEkATURE OF10.3*13H UE~i-k S L/')
5410 CONTINUE
[Fl ISTATE*NE*1.0) GO 10 5412RVISuI2.0WRITE(695411WR ITEl6. 5401 )RVI S.RH*I-I RTMP
-SA.E- FRMAILT 19h1~O..N 21CHL&'V#-j kAIN)
5412 CONTINUEIF( ISTATE.NE*2.0) GO TO 5414RVIS-690VIRI TEl6.5413)uRITEIA.54QL.I JRVJi,.RA1BJ3TM.P
5413 FORMAT( T693OIICONOI IION I 3I4MJVRAT E RAIN)---- GO TO 5450
5414 CONTINUEIF(ISTATE,14E.3*0) GO TO 541bRVISu2.0MftITE16,54151MANITEl6 65401 )RVI S9RIIAIRTMP
&C615 FORMAT(T 6,3ONCOND ITION I OHH-LAVY RAIN)GO TO 5450
5418 CONTINUEIWI(ISTATE*NE*4*0) GU TO 5418I. ~ WRI TEI 69 5401 )R VI S. RH A[ ARTMP
A141? pOIWAT(T 6vJQHCOMNUITION .I5HVLf--Y HEAVY kAIN)
GO TO 685
I Ia
'541*3 CUiNTINUE
ý4'41 F-UHMAT( II *1,H ,*N*9**VUARE M4ISSING THE $CAT CARO*)
IF( ISTATý-L.L* O.VR ITL( u.5442 )5442 FURAAT( 1HIIH .40H*********YUJU ARE MISSING THE TOIL CAR~D*)
wR IT F( 6.,54 19)
5419~ FUkN4AT( THI*IH *40H****4.******YGUR ISTATL 1S NUT RECOGNIZED)
IF I IAIFL(. *tQ. I )GO TO I C00
CALL EXILT5420 CUiNT INUE
IF ( IAFLG eLtle IlNI TL(6*7000)*R IT L( b. 5400)WR ITL( o, t)421
5421 FUI(A4AT( Tbe OHCUNUIT ION
I J4HdLER )Sb LAW ATT1LNUATION CALCULATION /
5424 FJN'4AT CTb. 21HIUITAL TRANSM& SSI UN/K*M. I 0XI 21"w AV LLLNGTri ( M ICRUNS) */*( 113 *F7%J 92?X*F7.31GJ TU 4450)
54J0 CO.'T INLJCIF II AFLG o. Q*Li I ) wRI TL( 6 97C 0)tmk ITEL( 6.5400wRT.b.b3 ).4i RH.AIRTMP*FOlt PECN
!a432 FUW'4GAf(Tbs:l0HCL)NUITIUN 933NI3t~LR*S LAw SCATTERI
54,33 F~)NN4AT(//lH ,rc0.iBHtXArrEFINL, TRANSMISSION PER KiLOMLTER:/*T lC.?.-7
1.3//I6.21H*AVFLFNGTH (MICRONS) /,TIO,?F7.3//)
54:50 LU."TINUEIF C IAFI.G t:Q. I )WRITLC6*7000I
*H ITE( (3.548 )XL TAR. XH TAR .Ut. TLMPsi.T*3AC548 1 FONMATIC N 19H*-TAR(2LT G t3ACKGOUNUN//
I Tbo3OH7A4C.LI LENGTH OFI063,IO0i METERS4/
2 T6*3ONTAQRC.LT kvIUTH 9FIO.J,l0H METERS/'
3 T6*30HTARGET DE.LTA T IF1Q.3*L3ht OE-GaEiS. .C/b T6s401-4UACKGkUUNO, TtMPERATURL #FI0.3913H IJE*6iEES Clo)
WITL~b.3.491IIIIN.IkMAKIUrLTRIRUIN.INDAX.IOELX5491 t'UkMATC IH 11I3HRANGt REQUIRLMENTSf/
I T693ONMIN. REQUIOEU RANGE FOR tRECUG*9110910H M4ETERS/2 r6o3OHt4AAK REQUIRED RANGE FO3R RF:COG.9tIO.IOH METERS/ *
3 TbeJOHRANGE INCREMENTS FUR* RECOGoL *1O1s~i I ET ER-S4 T6:30HMI'I. kLLUIRED RANGE FOR L)ETEC.vII09ION METERS/'
5 TU,3JOHMAK. HEUUI, tEU RANGE FUR OETECesI10*IOH METERS/6 Tb93ONNANGE INCREMENTS F'OR DETEC. *I1usIoH Mt-TERS//I
F f0R2 INPUTS
Ii FCIIAFL(a *NL o I I WRITL I be 5O10IF I IAFLG *EA. I )WkI TL~b,70001
IRT L 6. 52Ii)PGQ. XODYDo*XEv,
WRIT EL 6,5201 IFU, O. YO.tT V.YTV, XML,*YML
62111 FUR14AT( IH *14HTEMPORAL 1MTF*So%'I IH 922HPRLU. (LOG HLRTZ) oIOF5a.,?
I I 922H----------------------------- 910(bH---i
4 IM *22HNOCIECT. ROLtQFF MTF(X) 910F5*2/3 IN *22HL)ETLCT. ROLLOFF MTFLY) 1IOFs.2/,* IN *.22LLECoiRUvIC MTF *IOFD&2/5 IN .22HbUOST Mu'
87
41 4)
5201 FOR14AT(IN *24HSPATIAL COMPONENTS Mff SofI IN 922HFRELi. (CYC.i'MHAO.) OPS.2/
2 IN *22HOPTICS MYF (X)l .IFS. 2.'f
i N .22HOPTICS MTF (Y) 610F56.21t4 IN 922HVIDICON MTF (X) 91OF5*2/'
5 IN *2214V14J1ON MTf (Y) sl - . -#
6 Iii *22MSTAbILIZATION MTF (X) ,10F5*21
I -IN o 22HSTAalLL1ATIflH.lIFtL ~~t IF (IAFLG .b(Q. I)WRITIL(6970OOA
!b,241 F0i.4MAT( IN 9.37HNOISE PL PETU VOLrS/soRT(HZ)),e/
2 IN *IOHPUTEC(TIMO FREG. #4F6*Z96F5*2//2 ITEIt52IUNBEST RECOG. RE. .F..P.
I IN *22HsORST ECOG. FMIRLUN *,4F5*2.6F.
IF (IAFLG *NE. 1160 TO 690100WRITE(6.7005I)EAXM8XUv
*4I 051 FON'4AT( I 43H/l.SN LO ftI('. CLi.-ftP13ki YOr-jf#I51 INTE PI F1tZEdTIO CORECT AN *SL) FNReS OR F G* T SGI
IF (OKFL *NL* NI?)GO TO 9000
213o CUMrIUTAIN.
kETURNPt LN U
SUdRUUTLNL RtAUF(T)
C: THIS SUB5ROUTINE RLEAJS INPUT VAkIA:JLLS IN PkWLL FIELL)
C* FORMAT. It IS SYSTEM DEPENOENT AND MUSTC* HAVt T.WO LIFFERENT VERSIONS - ONE FUR THEI CucbCo0C* ANU LINE FOR rNE IHMJ6O,'44*OATA IS PLAL) INTO THL T ARRAY.
C:C* THIb IS TH-L C,)C6000 VERSiIUN. IT USEs) THF FCRTRANC* FRLL FILLD INPUT :tIICII IS AVAILABLE, UNULNL SCOPE 4.2.C.
UIMENSIC)N TI IC)
~NO
SUSR OUT INE M~R I NP(VIS*l kAN~t.A IRTrMP9 WM. WAVL I**AV Ed,[PRNINT I JK,
IIST ATE. AFCNL ,PRO, ENUM, TOAC , NMM , tIETA .11. (K)
DIMENSION FF T(aO),EXMRT(aO).XXXRV(2O)).WFUV(2Zj)9lRTRAN(!n1l),
I AFCRL( 161),TRTRAN( 161) .UT(oO) .XDR(50) .SOMEý(ta) ,wAvEA9)cýi1uMA(9).o
2XPid 50) PR0( 10) ,UETA( £0) ,XNMfi( 30) .NUMI( 1)DIMENSION XINPUTII0).oDUTPUT( 30)IUIMENSION TSEISO) ,SSE(50.),AFRW(50),DRTX(SOb
.CQMNDN/tAHL~e Xma LU.*F(10).Si(1O).XNE[.OLLTAX.DLLTAY.EY~rM.t~FR.IF0V.I VFOV.NRMAG.XN9 KNSC.OVENSC.SRI TF.9SRTAU.oI scorAoTO,9ANGLE,*MUM,RSTAR.2XLA.4SFNUMU.oFUC.XK.FMAZXF.XY.KYLFMAXXSIGL~iYý,YS1GLS.XA.YAKKP(
I COMMON s'SPCATM/uAVL. aSIGMA
COMMU)NO#NAMES.OIKLUNT,9XMAG.PFSTAR ,FLLECT
CaMM4ONtJNAIEA/XDR,DLUT.TSE.SSL.SUM.L.XFRW.URTA.OLTEM4 *FFT.KKXRTCOMMUN/NAML3.'JFL AG.JPRI NT,9DO T.oDETtMM.aDPFAK9ACT* IbtzLTRl, 1UL)LL
IINOUAX. IbtIN# INMAX, INMIN.LU$UUUTPUTXNTAN.XINPUT.XLT Ak I AFLG
COMMON/NAMI~~LKTCMOtAM6/DMDR( S0)vD,DOT(50) .OORTK(b0)LWrIFIX( ( AVL2-WAVtt 3/0.13+1
. -. APRLMTQOXJ-t I *./OLL TAXfl20.FT=0.0
FT2F T+XL102 FFI(KK)=FV
XAXQT(KK )=XXMRT(eCK)ii KXMRTIKK)aXXMRT(KK)*I3.3/FIF(KK)/7.0*FFT(aO))**o*.o
600 CONTINUECUC wFJV SCALED MRT
fL20 7119 J).20-7119 *FUV( J)=PFT J )/FACT
+ C
00 1066 IJKZ,9LUPO
IC ICrAR=TBAC+OE TEMP
DO 500 1ZliRMIN.IRMAXIDELTH
* I RANGES-11/1000.0XRNHANGiE*1000.0
* 1DOn 2 JJ=I.LW
2 IWRTAN(JJ)1l.OI ~CAL-. ATMCRL(RVZS.RANGEAIPTMP.KRH-4WAvEI.WAVL2,IPNI1NTIJK, ESTATE,
DO 5,300 MIS55*1 Lw5300 II4TIANIMISSV=AFCF4LIMISS)*INTRANCMZSS)I. ~CALL OTFE! C.. I9TRANTNTNANLW)
TRA4S=TNTRAN(LW)/(UAVE2-mAVF-I)
ULT(KK I=TIANS
DETEADETLMP* TRANST LEN GaXLI AU ,RAN GEOLIESOETE*(tLENG/7.Q*FFI(20))**Q.5
C X-MRT FUN DELTA T AND DELTA PCALL ALINLYIFR 'aOETL,#-F (,AMRT,20)f EMNOM=XKITAM*Fb~w/RANGiL
89

CALL AL. NrZY(Pkii8,K.NUh4,PN~o.NJMLOI1F(PRUB.LT .0.0k PIU1eu0*COAPR( KKiPiOBCALL. ALINEY(PNO8,)(XNU#4,PR~o.NMc3,1O)IF(PkUUl.*LTs.Lh.) PROli=0.0O
DL)DU CKK UDDTI K9~)
DXDRCKK()-RANaE
C ULILCTION
C
Di 6oho JKm1NOZNvlkUAX*IL.LLX
RAN4EAiJKi'1O00.0
CR=ALL uTFIO.111~NoRNN,Di NStitTRANMI.LWb'WV-AV&iOb IRRNKM=.
CALLUETE4P TNANLRWSkASAIT4%RoAVs'NVaLR.Ta.K&.AXa
CALL G)ITFEARNAN RN9R7A~LW
C O ( IAR I~) I ET =TRNADLTA
CALL=U AL&EY(FL)LO TTKANT S
C X MT DV U-MNT 7 ANLT T Ut DLTA P
XXNUVM=ATAR*FRI/ANGLCALL ALLNLYC P.-AU,)ANUMsPNO ,t3FLTA.10)IF-(PkID3*LT.O.0) P~fD3=O.0O
CALL AINUEYFWETFVXM*2
lbC N T IUHN
ENU
SUtJROUT1Nt UeVCLC( XMTF.YMTF .XLAMTFP T*RQ*MI*iV4*U~F"ý
IYU, (D. Y~o. KkiXE XT V.YT V9 XML YML 00)I
REAL lUTALUCOMM4ON /UCEV,'4OT,'KNITF(2O)*YNMTF(20)
UIMENSIUN FRD(20)
6 ~UIMENSILIN XX(MTF(20)oYYMTIF(20)DII4ENSION XMrFt20)oYMTF(20) 1
DIM~ENSION FI4EQ(20)
UIMENSIUN KM YJ (2 01sYMY14LQ* 2______
uIMtýNS!ON Fo,)(10 ocUQ10.XEMTF(20oYEMTF20)
uJLPENS1JN X0MTF'(ý0).YUMTF(20).X0(10).Y0U0) -
UIAENSIi)N 'DP4TFI.20),YUPMTF(20)imDýIY(0ULIAENSIUN XDPMTF(20).YUMTF(20).XD(1C).YD(10)- -
DIMLNSIQN )(TVPTF (ZaQJ *YtY.MIF..aQ ,.LyLaIl) YtLV~l'DIMEN51IUN XL)SMTF (20) ,YOSMTF( 20)IL)IMF.NS'rJN KAMrFLS(0).YMTFrLS(20).XML(10).YML(1OI
L)IMENSIL)N XCYMTF (20) vYEVMTF ( 0)
L)IPMNSION XINPUT(10)oUUTPUT(IO)
CCJMN/NAJ/_JFLAJF LAGit PLN.1 D-.T ýffkiL~aflPFAK FACT. IlLQEAu IflPkw.
L ILIRUAXHUIN, INMAXoiRMIN.LUPO.0UTPUT.XHTAR.K1NPUT.XL1ARIAFP.G
LUMMN/NMI-4/ Ws LWef( 0).St1O).KNET.0ELTAX~flELTAV.E-YETM.Fflak1EDo.
1VFJV oXMAGXN; XNSCUVERSC st3R&TE oSRTAO,*DISC srA*TOsANGLEolM0MFSrA~s
?.XLA4 j FNU BoFOCoX ,FMAXF *XY.XYL.,FMA?~,KSLGLS.YSIGLCs)LAsYA.KKiCK&.a-....31UTAU#.VLL*FLLECT
UO 4 0 LL =Io1,040 ;AJj ILL )10,* *FQ J LL)
DUi 41 K=1,10
41 Wla K R QQ (K)/ft L
~'JOil 612 J=1.20
YOJM Ti- ( JI) =CROP'
CALL G~aLUR( XRUP@YftJP*C)
X G634 Ti F )XRUP
YGti,47F( J 3=YHUP
CALL U)ETEC(X .YU.N00,vXDM.YDM.DRUP.0ROPC)
* YXUMTF(J)=YDM
Y UM T F4 J ) =NUYOM
XU04 IF 4 J )=OR UP
YDPMTF(J)=DRUP
CALL LM(XLKH*RQQ0.EHUP*FRUP*C)
LL1 MTF(J)=tRUP
CALL CA.dR&kXTVoYTVIF0.GRUPoGNOPsC)_ _-....
YLVMTF(J)=GUP
CALL_ DPLY(ZUPZOP*C)
YU6ITF( J)=kUP
C~l L STAB3LEI XML.Yo4L.FQNHkUPeliIUPCI
91

vlTFLS( .J ).zI*43PYfrtTFLS( J )=ONUPCALL LYLU$AL(UR'1sORPC;);tE-Y4TFc J)=URPILYP4TFI J )xOP
C. TOTAL SYSTtM PATEC
AMPTrý(J)=XCJMTr(J).A094TF(J)*XOPIMrF(J)*CL,'4TF(J)*UM'TC(J)*JiXTV'4TF(J)*XEMTF(J)*XDSMTP(J)*XM4TLS(J)*XGbiMTF(J)
4YMTFLS(J.) *YGWA4TF (J)A(KN4TF(J)=ELI4TF(Jp*bMTF~JI*XrvM1TF(J)*KEMrF( J)*XMTIýLScJ)*XD)SMTFcJ)YYMTF(J)=YTVMTF(J)*YLMTF(j3*yL)SMiF(J)*YMTFL-S(J)XMAM(JI=XMTF(J)YMY14ItJ)=YMTF(IJ)FUR0OIJ StEREO CJ)XNMTF( J).=XXM TFlJ)YNMTF( J)=YYMTFC J)
63IFCJPRINT 4 EU.J0)GQ TO 8000
IF I IAFLr, RQO k SSRITE(05.7OC0)7000 FOMMAT(3q(/).5H 01'..iOK.IbHOEvICE OUTPUT DATA,//)
UNITEI6.3001)43001 FOA~iAT(IHI9aaXJ1HK MAODULATIUN TRANSFtHk 3UNCTIUNS)
dRI TFl 6.3999).WR.ITFt,(03000)IFRt'II ),XOMIFII ).XGi3PMTF(I),XOM4TF(I)XK)PMrFcI),CLLATF(
j li).BMTF(1).XTVMTFI I),XEMWF(I).KOSMTF(Ih*XNTFLSII),KEYMTFII),L=kodC2)
3999 FORAIAT(IH s 4HFREU.IX,6H OPT1C.1X9.jHGdLUWkxoi*t4DE.ItC,3X,bHNSPN'4ij~t1,XSrk:LLCTIX,5H-ItIOST,1X.SHVIL)CN,2X,3HLLLt).2XSHUSPLY,2.(,JrtLUS,Q&X.JOOO e0QRMA'c1 IA.Fb.2.pI1Fab.92)
iflit I IAFLC, *EO0. 1 )WR ITE ( b.?000)
OR I TE(6(it3002 )3002 FURMAT(IIIJIHY MOUULA7ION TPANSFEN PtJNCTIUNS)
wRLItt(b.s3003)(FkLO( 4 ,9YUMTF (I ),#YGf3MTFjIitYDM TF (1I.YITv FtiI ).sYEMTf! I 1), YOSM4 11- I I YC TFL Sc I YEYMTP I I) 1 =1 9 20)1it 4Q04. FOkMAT(aH4 ,6X.AHFREQ,2XobHOPrIC,1K,6H(iuiLLUR2K,6HOLTEC,2)(,b)HV~IOCN,IAM.3HLEO,2KSHOSPLY,4X,3HLUSAA.3HEY:ý.//Ib)XF5.29,dF?.2))
0000 CONTINUEIF( KXMTFc 20).LT.0.01.AND. VYMTFc(2OS.LT.C0.oI) GO TO 6000
C
c s Y MUST B0TH SL ZEPAC 0.4 NON-ZERO, SAPAL FOR XA9YCC
CICr INL) ZLEN FOR NOISE FI LTER
IF(XY.L-Q.0.0.ANU.XA.GT.0.0S SJLUh,=AMAKIcI.C,/XA.1 .0.YAS
IFo(M.GT.00 0.AND.XA.EO.0.0) d3LUM=AMAXIcI.0/XYI.oXYL)IIF(%Y.YGT.0.0.ANO.KA.GT.O.QS L3LUM=AMAKI(AMAXI~i.0/XAI,0/YA)IAN4AXI(II0/KY.I.0/XYL1)
- sIK~.QQ.0ANQMA.Q,9gS LUMIOOQO0.0OOOMSFURDI 20)4
TACQA.AO~e~UM) GO TO 5000
5100 CONTINUECALL. EM( XE.AB.ROO.ENUP.IIAUPTACOS
92

CALL. CAMRA(XTV*YTVFQ.*.NUP.GRQP. ACO)CALL EMtTlRUP9Rd'4#TAC0)fCAlL-Q&%P-lr LZUP sZO~Ps. -ACO JCALL SrAdLE( XML YML .FONHkUP*0RUPs TACO)FrP4X=ER UP*FRUP#GRUP*RUP*ZUP*I4NtIPFIMY GIOP *RUP *ZUP* OR UPIF(FTtMX.GT&o*o1.oR.FrMY.GT.0.01) TACr,=2. 'fTACUIFCFTA4X.GT.0.01.VR.FTMY.GT.0.01) GL) TO 5100
ODF=TACLI/20. QCC:-DDFD0 5001 KLA41920CC-CC+ODOfFUHO((LM IICCC..ALL.(LkRANPFU&CCALL CAMF!A(AXT.VYTV.FQ.GRUPPGRflp CCb.)CALL E4:'TtRUP9ROP9cCC
CALL OSPLY(ZUPZOP*CC)CALL STABLE( XMLtYM&.*FOQe4RUPiPURUF'CC)XXxMTF(KLM=ERUP*FRUP*GRUP*RUP'AZUP*tRUP
5001 CONTINUE5000 CONTINUE
IF(JPRI14T.EQO0)GO TO 83001IF (IAFLG .EU. 1)WRITL(6.7000)II (¶ WRITEI 6e3010)~01D~.ORM&LU~ a. ~&Z~kPREDIC TU. 5ST E'1 - 141F 9A ý.lb lPRZI)I.,.l.I D NI
113MFILTERING MTF)WRIrE(a.3011)CPMEO(L).XMTF(I).VMTF(I).FURO(1).)XXMTF(1).'CVMTF(I),
t1=t.20)3011 FUR~4AT(U1 .IX. HFRE%2#SX,5HX MTFgBX95HV MTFo5X.4IIFkEQ*IJXa5,X 14TF*
1.0X. SHY MTF//( 1X.F5.2.2FI.3.2.F9.;e,2F13.2))
00 1 tJito20XMTF(lJ)=XMTF( IJ)*XEYI4TF(IJ)V#MTF(IJ)=YMTF(IjI*YEYMTFdIJ#
I CONTINUERETURNEND
93
ýPUtiLUT INL UPTIC( XC)oYUqFkt-.CRJP kJP.1-LAM)
CC OPI-TICAL Mil-
014-Nil XJ( I-,;)YU( 1I Q) I
I V F J V .X 4 A (ip AN 9XN, ( V L 14 VLN( ,rltqI T t- ;,i T A U* ) I ýC T A# 7 WA NG L t ,M J49FS T AN,
31UTAL,.V-Lý.'LLtCCT
11 'LkAIP.(,r.0.o) CALL ALjNIKY(CNUl'gFLAM~,XU,It~r:U,10)~IF(CPA-).(,T.0.01 LALL ALI NL Y(CklP,FLA.%4s,'~sPA.i).J 1.Cý)
IF(Ck~AI-'.LT.0.O) Gi T) TO3
A=XI- :LA:i1tC/2~ 4t;*0. I*F NUM -I
IF(A.~LLI.') CýýJPl2.O/J.14*(APC.JS(A)-A4(l.A*t*.
R t7 JPN
sua~uuI4O Nk GLLkBu( X5UPqYRUP*FLAM)
VICC WITLCMAL GED.TLCL~j
COFMLuN -lfLUR/AtILURXRUiP=ýXP -AdLUR*FLAPM**i)
YNU-ý XR UPRET1Lik4N
4L 0
4994- I. -
'UAHROUTINE UýTLC(Xy*D,FHEQ.XDM.YC',14.D1UPODVPaPFLAM4 - **-**-
C DETECTOR SPATIAL MTF -.. ______
C
C DETECTOR~ TEMP'ORAL RESPONSE
REAL IUTAU -
DIM4ENSION XD(1Q)*YDC1Q1,FtREQLLQI. --. _______
COMI4ON/NAME4/ XW9LW*F( 10) 9S( 10 1 XNET 9DEL AX DELT AN.F~YErM#FR.ifp0V,
3 IOTAU*VEL .FELEC T)(FDE1l L./2s/DELTAXYFUT=1./2./DE! TAY . --
IlF(FLAM*LQ.0.0) GU TO 301
XKOM=SLN(3.14.PLAM/2.0/KFUET)/3.14/FLAM*2.C*XFDET
V0M=SIN(J.14*FLAM/?O/YFUET)/3.14/FLAM*2.0*YFOET
ii DA~KD~l) .. ....IF (ORAO .GT .0 .0) CALL ALI NEY(ORUPFLAM*XDFREQ, 10)
1P(L)kAP*GT*0.0) CALL ALINEY(UOPsFLA4,YDmtRECQ10) 1I'IF(DRAP.GT*.0.) GO TO 400ORUP"IA,/(1.+(FLAM/FSTAR)**2)**0.S
OR U,1 = O)RUP4')0 CONTINUE .. ______
RETUWN4
ENL)
SUb ROU T INE LM X.-X8 9 1- Fi. .U E RUPF R UP FLAM)
c LLCTRUNIC AND BOUOST MTF .-..- _______
REAL LUTAU
DIMENSLUN XLI 10).XHi I 1) F RE. )( 10)C UMM UN / NAM F- X 6 LW sF ( 10 ) 9st(10 J XNE T #ULLT AX OLLT AV EV toFba HFOV.
I VF[149XAGv XN XSC UVERSC 9dNHI TE SHTAD *DISC 9TA.vTJ9ANGLEtMOMeFST ARA
JIOTAU, VEL*FLLECTLRAP= LE (1I
IFC';RA;'.taTo0.0) CALL ALINLY(ERUPFLLAM9XL9FREU, 10) ______
IF(EHAP.GT.0.0h GU TO ý,0L-RU.)=1.,'(1.4FLAM/FELEC.T)**2)**0.5
500O CUONTlNULI ~FRAP=X3( I)£r(FkA,'.GT.0.O) CALL ALINL.(FRUPvPLAM9X8.0-RL0.1OkIFUNWAP.(jT.').0) GU TO 501
a0l CJNTIN'JE
NET Uk.4 ----
95
SUokUUJTINL CAMt4A(X'VV.YTý'I.FU.GHUPoG#AQPFLAM)Cc TV CA-ILR~A MTF
C JI%lkýNSIkY4 XT4(I0)9Y-V(I0) .FHLOC 0)
CAI-L ALINLY(GRUP#FLAN.XTVl-RrQ. 0)
CALL- ALINEY( GHt)PFLAM.V rv*F<tu,10)
LNL)
SUBROUTINL4 EMIT( RUP*RUPFLAM)
C_ LLD LMIrTLH MTF
WEAL IOTAUCUM14ON/NAME4/ Xr-o L,,'F%1O),S(iO)oXNET*OLLTAXOULLIyyVrLY.-RMI-t4HF()v,
1VIFOV *XMA6. XN aXNSC 9OVkSC *tk ITE S.l AD sL)SC sTok *T G.ANGL.L 9MUM F iT Awe
3 J10TA$J.VELFELf-C TIF(XY*EQ.0.Ob GUi TO 70H1Ff FLAMvEJ.0.0) kUP=I.Q1-( FLAA4.EU.0.0) k~OP=1.OI ~~IF(FLAA4.GT.J.0)O RUP=SIN(4. 14*FLAM4*,' ),(3. 14*1LAMi*KYI
IF(FLAP4.(ýT.O0*0 RfJPs1Nt(3.14*FLA,'4*XYL)/(J. 1~4ILAM*.)YL)
708 1F(XY*E.(O.U.) RIIP=19Oii 1F(X%'L.LQ).0.0) cJP=1.0
END
SUbROUrTIN s)SPLY(LUP*ZOPoFLAle)
C JISPLAY A4TFC
I4tAi IUTAU
LOMMUN/NAME4/ Xso Lm.*F(vrf0).Kt410)XEDELTAXOELTAYLYLTM.F#RMFOV,1VFJV.EMAG9XNxN.ANC,0 E~VEk. E.ILSRVAO.D SC.TAs~rO.ANc4..e.MUMFSTAR92XLA,4 , FNU MBe OC X KAXe.:XYAYt.FMAX.XS1CLS.YSZGLC.XAYA.IKK.e
(I(KK.oGT*I) 6UL TO 807
IF(KK.-.ýZPEP-Af 4412
Ii-(K'KK.EU.1.AN0).FLAMoE0*0s0) 'tUP=1.0
IFO(KK.aEU. 1.ANL~d'LAMm(iT*0*C) ZUP.SS1N(3.1t*ELAi#JLAid.L.tL-AedF' AMKA-
iF(KKK*L!tU. 1.ANI).f-LAM.GT.0.0) ZOP-SIN(3.14*FLAAI*YA)/3.14,"FLAM/YA
96
C
C L05S I-TAaIL IZATL'JN
C;Us,4ONN#,NML4/ XAM LWt.F(IC).3(10).ANLT.uJEL1AAL)LýLTAYLvETMFReHFLIVI
31i11l A~Jsvt:LsFLf~-C. IUir-i-NSIUN AIL( I )) sYPML( 10) ,I'i..O 10i
H,.cP=X4L(1
IF( HAP)GT~..~ CALL &L INL V t#UP9FLAMsXMLsFRF 09 Ic
lIýJIAP GT .-.2.) CALL AL vY kPFL~Y~f4~ l
1ý J PtJ lU= X'F) '(-YSIGLS*FLAfA**2)
N cT Li .N
SUNUTN 4)E3LU~oRoLM
CI
c EtbALL MTF
2XLAM8sFNU~4a3FOCoKK~sFtiAXF 9AY oXYL*FiAX*XS1GLSoYS1GLCs*XA@ VA*IKI(K
3 lOTAU9VFL .FkLECT
D[MENSI&ON SLSEV~)6KL(9,
DATA SLS/&..1.18.k.S5.l.
8*2'" ,2.R.3.4.4.1 .4.6/
DATA L3..1..1 -2 -3..S
AXXLuALOGIOC kI TE)
CALL AL INEY( SSLSA XXL sSL SoXL 91
GA1414A=SSLS*l .626btb
~UkPP(-rPAMMAS*FLAM/~XMAG)uvRP=LXP(C-GAA4MA*FLAM0XMAU)
kETUkN
END '
97
SL~dF4UU I INL KNU I S(FOCUTUFFoUDST AN sALMSAGUAO.ZS.FQQJ ICC).4MON/tAMEJ/JFLAG aJPR IN T.DITMioDEXEMPA-DPE.AK-r.fF r~nlIINAK. LADEN. RMAKII4MINLUPOJUTPUTAHTARKINPUT.KLVAR.IAFL.GCUMMONt'NAME4/ Ks, LSI(10).S(10).ANET.OtLTfl.D)'tTAV~A-YETS4 R*FgO~tiF.o
IVF'JV,*NAG. XN..XNSC,OVERSC,,BkI TE.SRTAO.~DISC.TA.* ;PA,ANILEsMOM.FSTAR9eKLAMI3.FNUMB.oFUC.KKFMAKF ,XYýXYLeFM4AoX.SIGLSsYSIGLCXAoA.VAXKKa -
.$iUCTAUaVtL.FdELEC T ______ ___________________________
UIMdIASIUN C' STAR( 103.XB(IaFQt) 1- _____)___
OI'MP'N5IUN (fl.TARt 161:
VIMENltUN KLMUIA( .0)--DIMENSILIN KZAPUT(1O),OUUTPUT(I0)FN=FNUIMdDELAM=O. IXL=X ------- __ __ __
Uii cI2 J=1.LWXL: XLtf~tLANICALL. ALLNtiY(UD.XLOOST&.R.XLMBA.10)
41o1 D. sTARIJ)=GUtMO*OO*1.OOE+10P1:3.14159CALL 0oP(3Q30,ri9ZDSTARDF.LAM-)--.______-
CALL dDOWT(FQ,*UE..TAF.#CUTOFF.oXP3.FGQ)LILTjA=ANGLE*0.0I tb
IF(,4U4*E.C)XNT=4.O*FN**2*D)ELTAF**05.5*fPI/ESRTAO*2.54)/1A/TO/MHZ#
4(01SC**0.5)*SLN(dJLTA) . .l.. ____._____
* j f(40M.LUJ.2) KNI-TA4.0*FN**2*(PI*IO1AUA.40b**0.5#fPl/(SRTAD*2.54J3/TA/TO/HZ/tIOISC**0.5)OOI-F=$ 1*IOTAUt'4.0IF(JPNIŽ'4T.E-J.Q) GU TO 1500
FIF ( IAFLG.EQ . 1)WR I TE( 6.7000)7000 FL3R4 At (34(/?5Ht fea1O~a.1HKNDL-SUOLITPiLTLD<tttZ..
WwITE(9.~0Qo) HZDtLTAFDDFF100 julOWfMAT(IHIZTHINTEGRAL OF D-SiTAR*0-PHIMELk0.~3/.IH *2Z2JEKACT NOES
* IL UANUwIDTHMEI~O3/.IH 922HWHITE NOISE bANOSIOTNW,&I0.3flwRtITL(r.10lI) VEL --
1011 FOJFRMAT(IN *Z4HSCAN VLLOCI1Y IN M41'SECULIO.3)AFt MOM.*EQ.OI wRITEI6.ISS) Xq4Tlr......1tt$4LMotw*l) SRITE(6.161) XNETIF(A04.%4EU.2) wRITE(6.6b61 XNEY
Ibb FOR'4AT(IH .22HOET NOISL LIMITED NETMEIO.3)2101 FQR.4AT(IN 923HSHOT raISE LIMITED NtTU.EIO.3)sa6c FURk4 AVT(1IN .I 6HwHI Tf NU ISL NE T N.9EAO i)i 500 (L, riwE
WLTU4N i
a 98

SUJROUTINC Umý t sHZeSTAR9UE LAM)
k4eAL i(.LAMF~f-AL IuIALD
C.UM(40.4/,NAl4t.4/ KaW,. LW*F( 10) sS( 11 ANL:T ULLT AX l.LT AY vi:Y L 4.Fk.Ht OV.
IVI-]V.KMAG.KN.(N'iC ,UVt~fRSC.HF~i Tt9SH-TAD.#JISC rATUsAN.ýLL9MO~qF~tAw
XKL AM , F NUM vF C sXK vF MA K ýsXL9F MV~N AAK v X S ILS s YSI (jL(s AA sY A v.KKK s.3IUlAUsVEL *FtLECI
LAM=XWd*I.OE-0t,)Do) 100 Jý-1.LwLAM4=LAtgI+0F1LAM*1 .'0L-Gtj
LJL) Jk=hKP( U 2
04=C2/( r**e)/LAý.
f ~RAUI(Jh=RA)It Jl*L)STARCJ)JOC CLINT INUL
CALL I~f-F_(ULLA4,A9PC ,AvLw)
HZ= ACL W 1I . E- 10etL IURNLNU
SWiROJTINE a~UT4FO.DELTAFvCUT0PF.%Xd,9OQ)REAL LOTAU
JhAME~jj~. EIQ.) wSl IQ) &XNET .flE.L~T *EI AV wLVLIU&Fi~ttFkV.
31UTAU9VELf#FFLFCTDIMENSION 0(lks)T(15)
DIMENS ION )Cd( 10,,FOQQ 10)J
CALL. ALINEY(SFOXFO.SF*8)FN=F MA XF * 6L
XLFIRE.)0.5DO 10 Jul.915XLFREO-XLFI4E r0.6
--C.ALL ALliKLY.tITa.XLFkREQ.SaF.a3IFITTsLT.o.0) TI=0.0
V ~FSeRo" IUTAUt~eO4 FR~tl~IO.0**XLFIPE04 IF(FRZQoLT#CU1OFF) 363*0.0
* IF(FREQ9EO.(iE.)TUFF) 46GtI.,'( + (FREU-CUTOFI-)VPFZtERO)**2)**0.5
IFI XKeGT.OO.) N= 41K- ,20*I-O(.I*Vr~M
IQ T(J )urT*( CoG**2)*,'***2*I 0.**XLFHEO/PSFC *2.30
CALL OTFEl0s59Ts.8,I5)
*j* RETURN
99
SUBRtOUTINE, XRN CTF*J~ýfM hsaeG~tý
C NCH a I INCLUL)ESS9 EQUALS 2 NU SC XN.FF ARRHAYS TO BE INTE6RATE.0 OlVER__C S.F POW~ER SPECTRUM OF NOIIVF ARRAYS 6C A EQUAL.S NIOTH OF TH4E BAR __
C MIIAG S YSTEM I4AGIPICAT[ION
C NXH NUMBER OF POINTS IN ARRAY XHC CUTOFF - LOIN FRAýQUENCY CUTOFF
* C NS a NUMbER OF POINTS IN ARRAY S* C
C
DIMENSION XH(1)tFFPI1).FFF( I).KI 1000I.GAM'(10) .089(10).UMN'N 4 'w.W LW.F!11I(0) SX) .NETaDELLTAX.DELT-AI..E"ITM.WD.I4EflW.
IVF3V.KMAG.MN.KNSC.0VERSC.6AIT~,SRTAO09ISC.TA.TO.ANGLE.MOMFSTAR.
3 10TAU, VEL ,FELEC T
C . B a LOG OF TNt ON1HY~1NESS
CC
* ~~DATA a.L..-.-.-.-.-.-.c1HvjuALOGI0( b8)CALL AL INEY( GAMM*5BWoGAM90dk49I 0)
GAMMA= GA MM XM A'.*G0RN
LnEG=200.0...................___ _________
G~aA14XI~A9I(A.1FF (114kIGFzI o/GF----I)F~ZGF
0)0 Cc3NTINU.A
IF(T9GT*0.50*00l) GFuGF+DF
IF(T*LT.095-09011 GF-GF-0F
C IF(T.LT90ob-O.O1) GO TO 100
C WFG S40ULD AT LLAST EQUAL 100 _
OELF-AMI NI 4OELFsFF4 NEM )d*WLE)1)0 200 JaI.IEG
* ~GFzJ *OtLFCALL ALINEY( TvGF *XH*Ff NXH)IF(NCN.~O1I) CALL ALI NEY(G*GF vS9FFF 91S)LF(rQ*LTvOiQ1 iQO......IF(NCM*EQ.2) Gale
P0I.0-CUTOFF/.(CUTO FF 0*2GFa*,Z)**0*5__X(J)UG*(T*SIN(,(GF*AI.EXP(-GA'4MA*GfI*0P**N
200 CJ'4TINUECALL QTPE(UELF .X9XvIEG)
100
A 2r D LL
KI-(NCH.I.U.a) GL) TU 40C(-RAS5m1,OtCUTUFF**2/~DLLF**?LCC.*CRA!$**O .bGRASIQ*IL)+fLfV**24'CUTOdF **
Do SOO LLL=Iob
50 1.=SU..LL)'U sS(LLL+ 1)
130C cUm fIN ULIF(FRIM~,c.).o *) G.O TJ 400A2zD.3*UCLF-.~r*~GILFUF~)CrJf*.*r~D.F
.)-2*Q*CUTUI-F/UL.Ll *CCC)/'CCL)V',) ANS =AI +A 2*2 . 0
#i TVANNLNU
SWRI~OUT INf- PLANK( T.I T vP 9AR T kAN oRifI
CC DEL.TA W IN W.CM-2.MI(.MUNv TRANSMISSION ANO U-STA~i UNITLk-S59 T Ic CA".CULATLS INTEGkAL OF DELTA w K tRANSM1iIQLN X U-STAR aN4EkLEC AND T2 IN ULGREkLS C, P IN U,/CA42
RL&.L LOTAW
'~OMMONeNAME*,o XW9 LW*F( I0).S(10),KNET.oE)LTAKU'.L!AV.EYITM~iH.FHIUVaIVFOVeXMAG.X(N.XNSC90VLSCL3MITtLStTALo.DlijC.TAetU.ANGLL.MUM.P$1AR.I2XLA#40* NUMH*IPMoAKoFMAXF s XY o AKKof- MAX YSI UG Y CLC s AvYJ KKKl(v310TAUsVEL#FELLCT
DIMENSION ARTRANfI0O)vRSPXt20)
DATA C211 .3tiJ+4O4,CKi'3.3991E4O4/
TITaT +73
KLAMR KU
A.LAM4JdKLAH0 I.
100 MA03(J$-ARTi4ANIJ)*RSPX(J)*(PAO1(J)-RAOi)ZJflCALL. 4TFE(0oLIotA039A9Lv#)P=A( LU
END
101L.
CUMVFUN #4KV~4M(KK)*NMTF1F.KI ____2O
CJLM0NLNAME/F.~oPt 5.0TUTkoDEKFL~aaL~LDLXý.
00 10 K12
X51DX1Otm~o
'102 C0TNUF.CJA4
CALL KRINGI(C.0.KMXMTFsFFI'. 20~8XIEIA~~~OCALL XINGx(0o.G9YMTFWFFF9 20 9,8.YSILvE2 *ANT o2.1*01
(QQUEANS#ANTUtiADT Ci )UXWN' T *SNR / XS iuE L~/YSI L3LI /,on*( OELTAY *VLL *UUstELT AlFFR.'EYEYm#OIVERSC 1**O.ýn
U-4AUO(0.K)z1.0/KSI0EIF(KK.EU*2b) GU TO 103 -_______
IF(UMOT(IKK).GE.0.001.UR.KK.Lr.10) GO TO 10210i CONTINUL
IF(JPRINToliJ.0) GU TO 1000IF ( 1A.FL6 .bLU9 I)WRI TE( 6o7000)
?COO Fwiý4At(34(/)v.iH I',,oIOK~lbNP4OT OUTPUT DATA*//.)
fl4~ NUMAT( 1NI,40H-24EUiCTIFL) MINIMUM' DETECTABLE TEMPERATURE)Wk1Tletib~J)(LMRAU(I).OMDT(1),1-I.KK)
83 F ~4AT(2X9I7HrAI4GFT SIZE<**-1.7K.3MM0T,'/(8X.E10.3.5X.L1O.35)h..00 CONTkNUL
ENET) N
I 102
4 -. ---- - ______MAL_

SUBROUTINE ATMG;RLCVILRANGE,1EF.AP.NUMIDY.WAVkEIWA1L2,IPkINT.IGUISTAATE. AFCRL)
C THIS SUtMUUTINt COMPUTES GROUND LEVEL ATMOSPHERIC, 'RANSMI'iJIUWl PIN .1 :4I-ýtJN
C; NTERVAL FOR ANY IlANU lNeTmEEN 2.0 AND Iui.0 MICOONS,. I T h~i A SIMUJLI [I-) I'C. VERSION OJI LOWIRANs THE AFCRL ATMOSPHkZIC MUDEL AS UI JUNE AV7A.*
C DIMENSION AFCkRiA6Ih IN THE CALLING ROUTINE.
C
c INCLUDE. THE STAftEMENT WITH ARRAYS OF DIMENS1Oý 9c CUM4MON #'SPC.ATMtSPCLAM.SPCTHN
rC. IN THE CALLING ROUTINE. THESE TwO ARRAYS SU)PPLY INFUR:4ATION FUN OPTIONAL.C BELLS LAAS tLILUZNL5a WHEN SUC-H CALCULATIONS ARE REQUIRED, SP.LAM4I A) IS AL-4C WAYS EQUAL TO ATEW AND SPCLAM(2) IS ALWAYS 4 BLANKS. THE UTHER I E-LLM2NT:;
U c ARE wAVELENGTHS BETWEEN 2.0 AA4L) 16.0 MICRONS, CUARLUSPOINUINU TO D\TA INAC SPCTRW. FOR THE CASE UP: A Lt3ERS LAW ATTENUATION CALCULATION. SPC-TNN( II
C EQUALS TQTLe SPCTRN(2) IS ALWAYS 4 3LAr;KS. AND THE DiHEH F ELEMENTS ARCC TOTAL TRANSMISSIUtIS PER KILO2METER F04 EACH WAVELENkaIN IN SPCLAM. IFUN Ti-tt C---SLR.2& SCJTERING CALCULATION, SPCTRN(I) tWJAL4 SCAT. SPCTR'II.J
C IS ALWAYS 4 BLANKS. AND &tit OTHET ?7 ELfEMENTS ARE SCATTERING TRANZMIS~iIUciSC PER LILOMETER FOR EACH WAVELLNGTH IN SPCLAM. TOTAL TRANSMISSION 1S CALLU-C LATED IN THIS CASE BY COMSINING THIS ROUTINE WkTH THE ATMCRL AbSDR.011IN P1)0-
C TINE. ALL CCFP$ICIENTS PEN *I 4ICA4ON INTERVAL AWE OBTAINED 13Y LINLAN 'NILi4-
C POLAT ION USING -SUBROUTINE ALINEY. CONSEQUENTLY, THIS SUBROUTINE I,,, NO* AN4ýC -. LBLrGRAL PAft! .UF A t~C-RLt..
c R^GE -PAbHLENGTH IN KILOMETERS.
C HUMIDY RELATIVE HUMIDITY AS A DECIMAL.
C AVEl THE FIRST SAVELLNGTH IN MICRONS FOR WHICH TRAN5MISaIUN lI NE-C ~QUIRED. IT MUST HE A MULTIPLE OF *I AND CAN BL. PHUM 2.C TOC 15.9 MICRONS.
c WAVE2 -THE LAST WAVELENGTH IN MICRONS FUR WHICH TRANSMIS5ION iS 0F-f . - . Q AUlkILDA IT ALSU MUST LIE A MULTIPLE Of .1 AND CAN LIE FROM 2.1
c TO 16.0 MICRONS.C. IPRINT - A DIAGNOSTIC PRINT VARIABLE- WHICH CAN T94KE ON THREE VALULS'C 0 DN B3LANK - NO PRINTOUT FROM SUBROUTINE.
c I - ~~ABB3REVIATED PRINTOUT LISTING INIAT IAL. CONDI1TIUNz~ ANDc ABSORBER CONCENTRATIONS PEW KILOMETER.
2 - DETAILLED PRINTOUT LISTING INITIAL CONDITIONS,c ~ABiSORBER CONCENTRATIONS PINk KILOMELTERP AND ALL CUR-c ~PUTED CONSTITUENT TRANSM4ISSIONS.
C AGO - INDEX USED TO DESIGNATE BYPASSING PART UF THE SUlIROUlINLE WHEN
AL CONDITIONS ARE THE SAME EXCEPI FOR THE RANGE ANDUN~ IPNINT.C IT CAN TAKE ON 2 VALUES:
&~.L-AM1Dt LM CNCLRTRATIONS ARE CLOMPUTED.C 2 - TRANSMISSION IS COMPUTED ONAECTLY FROM AULONBIR CONCENTRAk-7C TIONS CALCULATED FROM A PREVIWS CALL T3 THIS ROUTINE.
*C INITIAL CONDITIONS AND ABSUORBE CONCENTRATIONS WILL NOT nLC ftEPRINTEDo BUT IF IPRINT EQUALS 2, TOTA'. AND CUNSrITUENTC TRANSMISSIONS WILL BE LISTED FOR EACH %I MICRON INTERVAL.
£..1 lTl-kA.MQ-LbNFLSICkt ALYS SPECIAL CALCUI,%TIONS. INDICES 1-4 ARE RAINC MODELS. THE VISIBILITY NEED NOT FIE DE:FINED FUR RAIN CALCULA-
C TIONS SINCE. IT IS DEFINED IM4PLICITLY IN THE INDIA.C WHCN ZIA IS USED. SPCLAM AND SPCTRN MUST HE- FILL(.V IN THEC CALLING ROUTINE AND SPCTRN(11 MUST BE SCAT. WHEN 41 IS USEDo
C TWA SAME IS TRUE ONLY SPCTRNII) MUST BE TOTL.
f 103

AI
C 01 - LIGHT RAIN - 2 KILOMETER VISIS.&ITV *--
c OZ - MODERATE RAIN - 6 KILOMETER VISIBILITYc 03 - HEAVXY MAIN. ; 2 kILOMETERa VI&LBZML~t._
C 04 - VERY HEAVY RAIN - 0.5 KILOM4ETER VISIBILITY _______
C I - 3EERS LAW SCATTERING -__
C 41 - BEERS LAW ATTENUATION
Cj ~~C IN ORDER TU APPflO::IMATE THE SIX MODEL AXJJOsp)-A'f INtfLkmT.Afta. .LffuIIb
c TLMUJERArURL AND RELATIVE HUMIDITY COMBINAT IONS LISTED BELOW ALONG WITH
C VISIUJILIT" RANGE OF ELTHa:R 5.0 OR 23.0 KILONET;RSe
C
C US STANDARD 1.5.0. . .04a59.......... ..
C TROPZCAL 26.84 .75Ic MILJLAT SUMMEN 20:84 .75--C MIL2LAT WINTER -1.16 .75C SUBjAHCT IC SUMMER 1 3.8 4 075C SUdA4RCTIC WvIN1TE:. -15.06 -. 75C
C
C rTHIS PROIGRAM OCTERMINES .1 MICRON INTERVAL TRANSMISSION BETWEEN 3.0 ANDk tinG%c MICRONS TO WITHIN 3 PERCEN T OF THE I1 MI CRON INTERVAL TRANSMISSION CALCU-
C LATE) DY AV AGNG THE TOTAL WEIGHrZn TRANSMISSIONS IN 'HE INERVAL AS .COM.-C -2uTED bsY LOUwTRAN AT ITS FI.NEST RESOLUTION. .1 MI1CRON INTERVAL TRANSMISSIONC UE~reLEN 2.0 AND 3.0 M ICRUNS, IS ALSO. CALCUL<ED .XO MLTHIM.3 PERCEW. E1CE121.--C F~k THE 2.0,2.2Z AND 2.6 MICttON INTERVALS WHICH ARE CALCULATED TO WITHIN 6.4C A1U) 5 FENCLNT ACCURACY RSPECTIVELY OVER THE RANGE OF THE TEST VALIDATION.C .1 MICRON INTERVAL TR4ANSMISSION GENERALLY COMPARES TO WI1THIN 1 PERCENT FORC WAVEL-ENjTH INTERbALS GREATER THAN 71S MICRONS. SOME MINOR AD)JUSTMENTS. TOc THt Cl ANDl C2 AR1RAYS HAVE BEEN MADE TO ACHIEVE THIS ACCURACY. THE RESULTS
C F hE .7R5 GRAM s-AVE SEEN VA.LIDATED.T TO L FW..LOW~biG [MOLD IWN ...C I KM PATHLENGTH. 9 KM VISIB3ILITY RANGE.' US STANDARD ATMOSPHiEQE
C kKMPATHLENGTH, 23 KM VISIB.ILITY RANGE. US STANDARD ATMOSPHERE
C
41 ~~~DII4ENSAO1N AFCRMLLI611 . .
DIMENSION SPJCLAhM(9).9SVCTRN( 9)PLAjYl1(7)goPLAY2 (7)
DIMENSION sIORE(I6XhsAIJ'lHA(%).BETAI4)DIMENSION w( 7) . rX 85 tEOC 7)DIMENSION TRtb?).9FWL67I.*FO(67).9VADENS(69JUIMi-NSIUN CI(I41).C2(141),t'3(130),C4112).'5II5),C7(28).VX128)DIM1E NSIOUN XN AMLCi .( 10 . - .. . .
COMMUN /SPCATM/SPC-LAK.SPCTRNDATA TESTI.IEST2.TEST3/4H4TDTL.4HSCAr.4HATEM/- -
DATA ALPHA/I 2.O.6.0,2.0,0.5/DATA XNAME/4HLT .4HRAIN,4HMOD .4HPAIN.4HHVY .4HRAIN.4I1VHV%@4NRAISi
A/ T/. - . . . . . . . . -
1 0.999, 0.998. 0.91F6, 0.994. 0.992. 0.990. 0.9830, 0.9709 0.96P.*20.960. 0.940. O.9,ý0. 0.'420 0s .VIO. 0.9C00 0.8MG. 0.Ah0. 0.8"40.30.82C, 0.800. 0.7009 0.760. 0.143.o 0.720. 0.700. 0.660. 0.660.
4 0.640. 0.6td0. 0.Q00. 0.580. 0-5609 0.5409 2.520. 0.50L.0. 0.489........
S0;(60#. 0.440, .%420, 0.400, 0.380. 0.3609 0.340. 0.320o 0.3009t02 . 2b0 0.2 4.D 0.w22.0 s. ".2 00.as Uf La~lsl.±Afta &0LMALa.aQan.... a.
*1 7 0.100o 0.080o 0.0609 0.040. 0.030. 0.020. 01015. 0.010. 0.008.
S8 0.006. 0.00#. 0.002. 00001/
DATA Fw.#* j~-do *.36...3,-l.69V0r1.e461b.'1.32799-I.2O0?.-0.7625.0.e5229ft
*-0.3468.-0.193ti.0.0665, 0.0414. 0.1353. 0.24309 0.33249 0943M2af 104
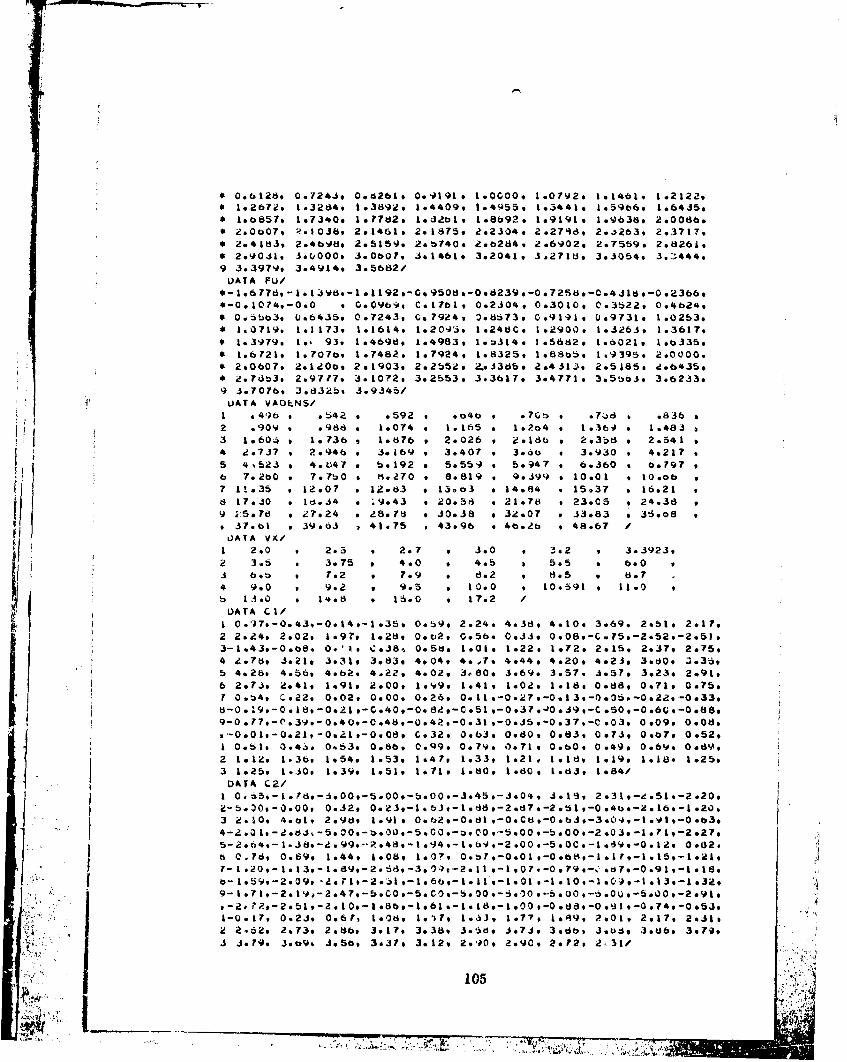
* 0.6128. 0.7243. 0.6261. 0.9191. 1*00.0 1.0792. 1.1461@ 1.2122,* 1.2672o 1.3284. 1.3892. 1.4409. 1.14Q559 1..j441* 1.59669, 1.6435.* 1.68574. 1.7340. 1.7702. 1.32cb1. lo8b92o 1.9191. 1.9636. 2*0086.* 2*0ta079 .O8 2.14619 2.1875, 2.2304. 2.274do 2.-$263, 2.3717.* 2. 41 d3.s 2.*4 WJ 8, 2.5159.* 2&.b740.9 2.b284. 9 2.6902.9 2.7559. 2. d2b s* 2.9041.* 3.0000. 3.060?, 3*14619 3.2041. 3&271l1, 3.3054. 3.*-444.
9 3.3979. 3.4Y14* 3.5682/UATA FU/
0-0.10740-000 * C.0*09b'. C*1761,p 0.2304. 0.3010. 0.35229 0.4b2'..* 0.Sbb3. 0.64.359 0.7243, 0*79241 .s3 0.91491 0.9731. 1.0253.* 1.0719, 1.t1173. 1.1614. 1.2049.. 1.*248r0. 1.29009 1.32639 1.3617.
* 1. 3979. te- 93. 1 .4698.9 1.4983. 1 . :31 4 * 15682. 1 .60219 1 eb3359* 1.6721. 1.*707b. 1.7482. lo7924, 1.8325. 1.88b5. 1.9395. Z.0000.
* 2.0607. 2*120OO* 2.o1903o 2& 265i!9. 2.33db 294 31 Js 2.5185. deb435** 2. 7dt3o3 2.9717. 3 .1072.9 3.2553. 3.3617. 3.4771. 3.5t363. 3.62339
93.7076. 3od3Zbo393s
UATA VAULNS/1 .49 6 o .542 s .592 * ao4u o .7 Qn . .7ýd b .836a2 .909 0 .988 s 1.074 4 1.165 s 1.204 * 1.0364 * 1.483a
K13 1 .604 s 1*.736 s I1.876 9 2.026 * Z .1 I * 2.3b8 * 2.541v
t ~4 4.737 v 2.446 9 3.169 9 3.407 9 3.4b * 3.930 * 4.217s
5 4,52.3 s 4.U47 9 b. 192 * 5.5569 5*6947 9 6o360 % * 96 7. 260 9 7.?b0 9 Me.270 # 8.819 v Qo9.3 99 10.01 * I0.Ob7 1 E. 35 * 12.07 * 1 !. 63 * 13*03 o 14.84 p 15*37 s 16.21 18 17.30 0 18.44 f 9. 43 f 20. 3d v 21.78 * 23.C5 s 24.38
9 i5.78 e 27.24 0 28.75 * 40.38 o 32.07 m 43.83 *36.oeS
37.b1 * 39.63 1 41.75 2 43.96 . 46.26 9 48.67
1 2.0 9 2.5 9 2.7 0 3.0 # 3.2 9 3.3923.
2 3.5 * 3.75 e 4.0 0 4.5 1 5.5 1 bo.0
43 6 .5 7.2 9 7.9 * 8.2 9 8.5 9 8.7
4 9.0 * 92 9.5 # 10.0 *10.591 . 11.0b 13.#0 *14.8 , 16.0 t 17.2 /
UATA C1/
1 0 .)7*-0. 43% -0. 14 o-1.35* 0.59. 2.24. 4.38. 4.o10. 093.69. 2.61. 2.17.
2 2.249 2902v 1.91. 1.28. O.t'2t 0.56. 0.44. 0.089-C.?5o-2*52.-2.51.3-1.43.-0.b8, 0.# ' o. 38- 0.58.I .0 1.* 1.*22.v 1.72. 2.15. 2.37. 2.75,4 eo.78. 3.21. 3*319 3.83. 4.04. 4.&.?.9 4.44. 4.20. 4.23. 3.80. 3 .35,5 4.28. 4.56, 4.6Ž. 4.22. 4.029 3e80. 3.69. 3.57. 3.579 3.23. 2.91.6 2.74.3 4.41.p 1.91, 2.00. 1.99. 1.41.o 1.02. 1.118. 0.88.3 0.71. 0.75.
7 0.!249 C.22, 0.02. 0.00. 0.26. 0.I1,-0.279-0.13.-0.05.p-0.22.-0.339
9-0.77,-C.39.-0.40.-C.48.9-U.42.-0.3l,-0.45.-0.37.-C.03. 0.09. 0.08..--0.01.-0.2IP-0%.Z1-0.08v C9329 0.63. 0.80. 0.83, 0.73, 0.67. 0.52.1 0.51. 0.4S. 0,53. 0.86. O.q9o 0.79. 0.71. 0.60. 0.49, 0 .6Y9. 0.89.2 1.:12: 1.:369 1.s54. 1 .53.9 1.*47. 1.93 3, 1.*2 1 #* 1.18. 1.19, 1.o18. 1.*25.1-3 1.25. 1.30. 1.39. 1.51. 1.71 * 1.60t 1.80. 1.83, 1.84/
8-.5.20. 20l-329 . 31-1 s66,3-1 od1,-2.d7 *-2 *~ 1-0 -1.CI-l .16.-1.320
3 Z-. PŽ,-2.01.-2.9d 10-.1.91 O .~-1. 18,-1.Cti .- 0b..883*0.49 .-0174.-0.5j.~
1-0.17,e 0.24,3 0.6?, 1.08 1. 37f, 1.633# 1.*77. *.692,?019 2.17, 2.31.s
V ~2 2.52. 2.73. 2.86, 3917# 3.38% . Sti. 3.74, 3.66,i 3.8. .3.86. 3.79.
4 4. F99 3% t9oJ .56. 3.a37. 3. 12,v 2.940,s 2.90.o 2.2.o 2 3 1
105

ICATA C3/'
3-1- 2.13. 9-0 0*66O49.-109.84-0.80-0. 189-0.358.-1 -269- 1 ft,-3o.059-5.009
4-'-.00.-5.00.-5.0',.-5.*00.-5.00.-5.00 *-5.00 P-tb .00 9 -5.03 o-6*0CC-5.00,
6 0.19. 0.48. 0.Sam 0.53v 0.36. 0.30.o 0.43. 1.01. 2.0?. 2.d2. 2.59,7 2.70. 2.80. 2.58, 2.23, 1.909 1.30. ..90,0bs-.0-.d
* 0.02. 0.14. 0.Zb. 0.4Zv~ 0.49. 0e56* 0.btse 0.78. C.bCs 0.d3. 0.83.1 0.79. 0.b8o 0.64. 0.08# C.729 0*76* 3.79. 0.72. 0.'359 0.bdo 0.52.
2 0.529 0.4J. 0.32. C).2'6, 0.12. 0.02s O.02v-,-.IC.-O.29/
I 27.834E- 02.4.b0E.02.2. 16E-02*..$3bL-03.3.bb0--04/DATA C5/
120~.? .20.7 .14..0 910.7 * 9.02. 7.06* 0.689 5.6$. bJ4* 5.-4.9 5.34,2 6.34. 3.509 1.7J. 0900/DATA C71
.1. a 0351 f .0260 * .0267# 9 0224 s*.021b o .02092 .021 0 .019:i 9 .0162 * lbT? .0136 9 .0119i C0121 0 .0133 9 .007849 O00dO9q .c15j * 02194 00238 * .0235 9*.0185 * O01b? 0 .0135 * .01225 .00938. .Q00279 .01C1 0 .011/114AxIF IM (WAVEI + .00 1 *10 .
IF(SPCTkN(l).EOQTLSrl.OR.SPCrkN(I ).kQ.rLST2) GO TO lt303 1FUIi4J.EQ.2) GU TU 7
IF( ISTATE.GE.*I .ANO I STATE.LE.4) Vi S=ALP11A( ISrATE)
~1 MLLHOM=HUM1D VXTEM=TEMP
4 K.EPz3O-IFlIXI AfS( XTEM))PI=AESKP+XL-FXXt0)*VUN(L)V~N(L-)
GO TO b5 KE-m=30 IFXI M)%TEM)
6 I9(V1S.LL.A.O, RkLHUMl.*0
0 HmRLLHUM*PIt:KTEN4ETkm~2 73.16PPWm4.56E-0b*uwt*XTLMMALEr'0023*44/VI5-214*446Qwo 0. f 40 OOE- O'4
DU020.1WHwt I)=0*TS**0.45
w(2IzTS*01.375W(3)u4b6.5bb?*WU*TS**0.2ml 4)xa.d*TS**1*5
TOGO FUR MAt 14 t / : 9 5H 10 H A TMC RL OU TPU T UA IA 9//)I
Jo
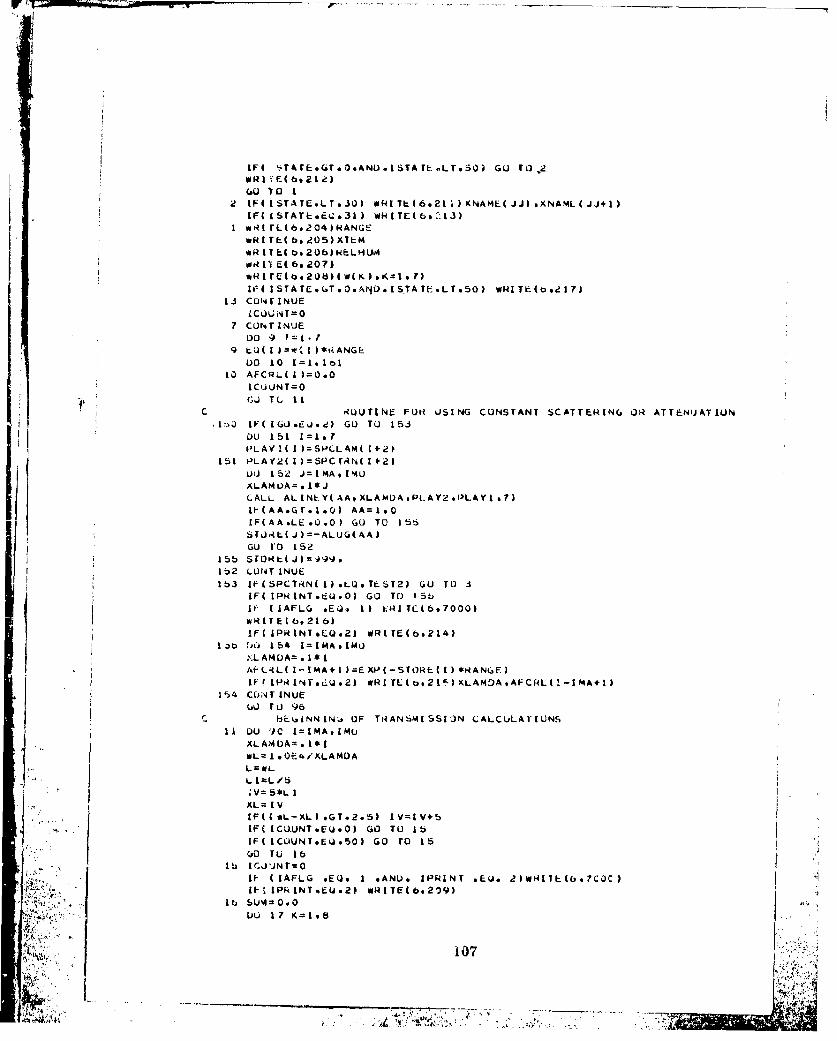
IF( '$TAfE*GT.o.ANO.1STATE.-LTo30i GO rO 2
(AU TO I
2 IF'( STATE.LT.30) IRTL.(6.2t1KNAML(JJl.XNAM4L(JJ,1)
IFCISTATE.EQ631) WHITE(be..13)I a*RIrL(69204)ANGE
wk I rECb.205) XTEM
wR 11 ( b.20b)kELHUi4
£IF( 1 STA T. (.T. *0. 'JO * IS.TATE * LT .50) wRI1TE (oe 17)14 CUO4FINUE
4C 04.NT =07 CUNT INtJE
DO 9~ F=I
9 LU ( II ) *kANG1-00 10 11.tlol
10 AFCRL.( I)ý0.0
ICOU NT =0(;J TL I1I
C RiOUTINE FUR OSING CONSTANT SCATTERING OR ATTENUJAT ION
I.1J0 IF( IGJ.E~J.e) GO TO 154DU 151 jjsfi)LAYHI)S5PCLkMU+2?
151 PLAY2C1)=SPCTrAN(It2JVii 152 J~iMA.IMUXLAN LA~o * 1*CALL ALINE.Y(AA.XLAWDA,PL.AY2.PILAYI,7)
IF(AA.LE.0.0) GO TO 155
STJrAL( J )=-LUG( AAGO 1'0 152
155 SFORLJ)=49'.
I I'132 CONTINUE
153 IF(SPCTrkNt1).LU.TEST2) GO TO 3IF( IPR INT EU .O0) GO TO I 5bIf- (IAFLG *EQ4 11 VERITL-(b.7000)
wR I TE ( ,.21 6)lF(IPRINTi.L*~2) WR1TE(b*214)
loo ýu 154 1=IMA.IMC):ýLAMOA=.1*IAi-LmiL( I-IMA+I )=EXP(-ST0RE 1) *RANGE)J
IF ILPIN~ot:U.2) WRITL(o.2i'-)XLAMDAAFCRL(l-IMA+Il
154 CON~T INUEuU TO 96
c bEtiNN INJ OF' TRANS'4ISS13N CALCULATIUNS
11 DO P)C 1MIMA.IMU
XL AM UAm I Ik 1 .0E4 /XLAMDA
L=WL
;V= 5*L I
XL=I(VIF((tL-XL)*GT.2.5) 1V=1V+5
* * IF(ICU.UNT.EU.0) GO0 TO 15IF(ICUUNT.EO.50) GO TO 15
GO Tu IbIS IGJ'.IJNtW0
If- (IAFLG *EUe I *ANU* IPRINT *EU. 2)WkITL-(bsC0C)
16 5U%420. 0
UU 17 K=198
107
7 --- '7 -777 7
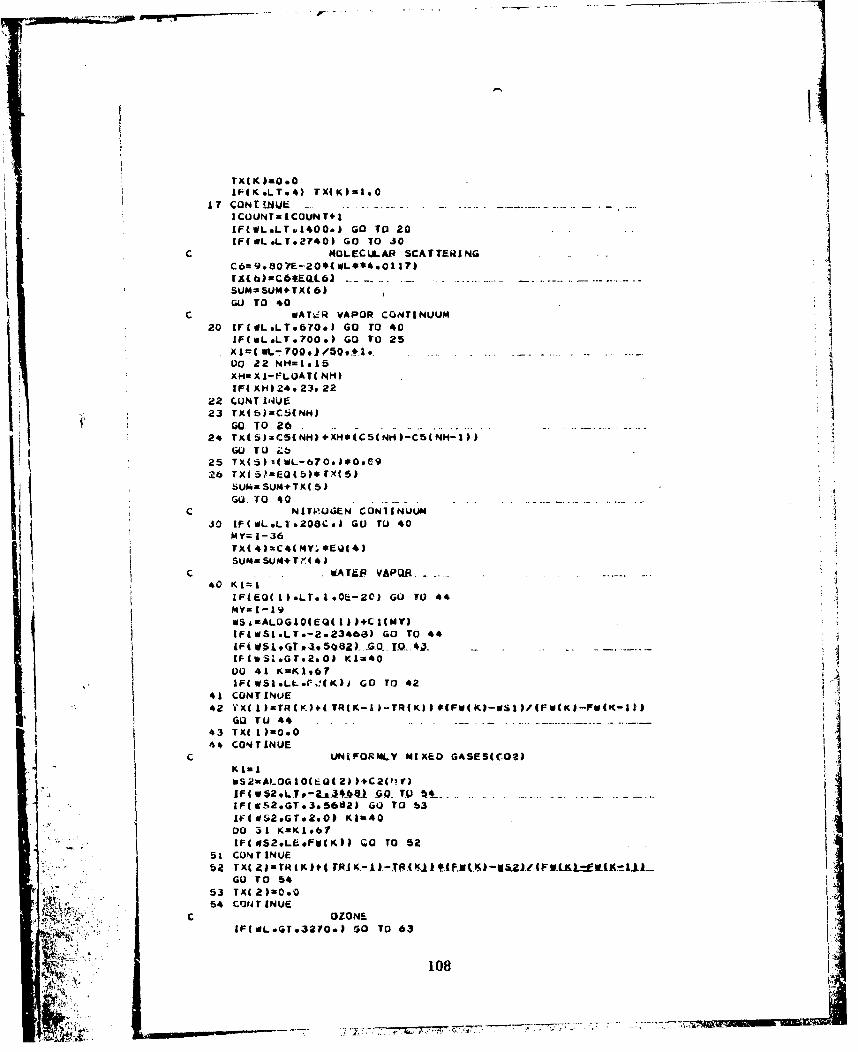
17 .CONT !±UE ..- -~-
ICOUNT. ICOUN Tel
IF(WL*LTid400&) GO TO 2-0.IF(UL*LTe27401 GO TO 30I
C MOLECULAR SCATTERI1NGC6=9.80fE-20*(WL**4e0Ilh
SUM=SUAI4TX(6)
GO TO 40c WAT,.iR VAPOR CONTINUUM
20 1rgNL*LT*670*) Go To 4oIF(uL<.700*) GO TO 25Xlut WL7000)/'509*l.Do 22 NH-1915XH= X -FLOAT( NH)IF( XHI 24 23v 22
22 CCINTI"iIJE23 TX(5)mC5(NH)
GO- TO26. .- .... . . . - . . .
24 TXI5).CS(NHI4XH*(C5(NtIIC5(NH-1I)Gu O 1 Zb
25 TX(!5) -( kL-670.*100C-926 TX(VEQ(51* TX( 5)
Sul4SUM+TX(5)raU.TO 4 iJ
C NITI.OGEN CONIINUUM30 IF(WLeLT&208C@) GO T0 40
MY=1-36TX(4J=C4(MY,*EQ1(4)SUMASUM+T?,(4)
C . ATEIR VAPO.R. -. ..
IF(%SaeGT*2*01 K1=40DO 41 K=K1967IF(WSI.LLk.F.(K).) GO T0 42
41 CONTINUE
43 TX( I)=O.O
C44 CONTINUE UNIFORMLY MIXED GASESICO?2)
wSZ ALOG 101 QI 2) lIC2V fI F W5.2 9LTP.-ZA 4-64..1 -6 TV !ý4 . -. .-.-
IF(vc52*GT*3*56tl2) GO TO 63 IIf(d$.52*GT*2901 KI-40
DO 31 K-KI#67 IIF(0JS2.LE*PW(Kl) QO TO 52
51 CONrTINtUE
GO TO 5453 TX(2)0.0O54 CQdT INUE
c OZONEIF(vlLeGTe32?0*l G0 TO 63
108
Iv- ~ .
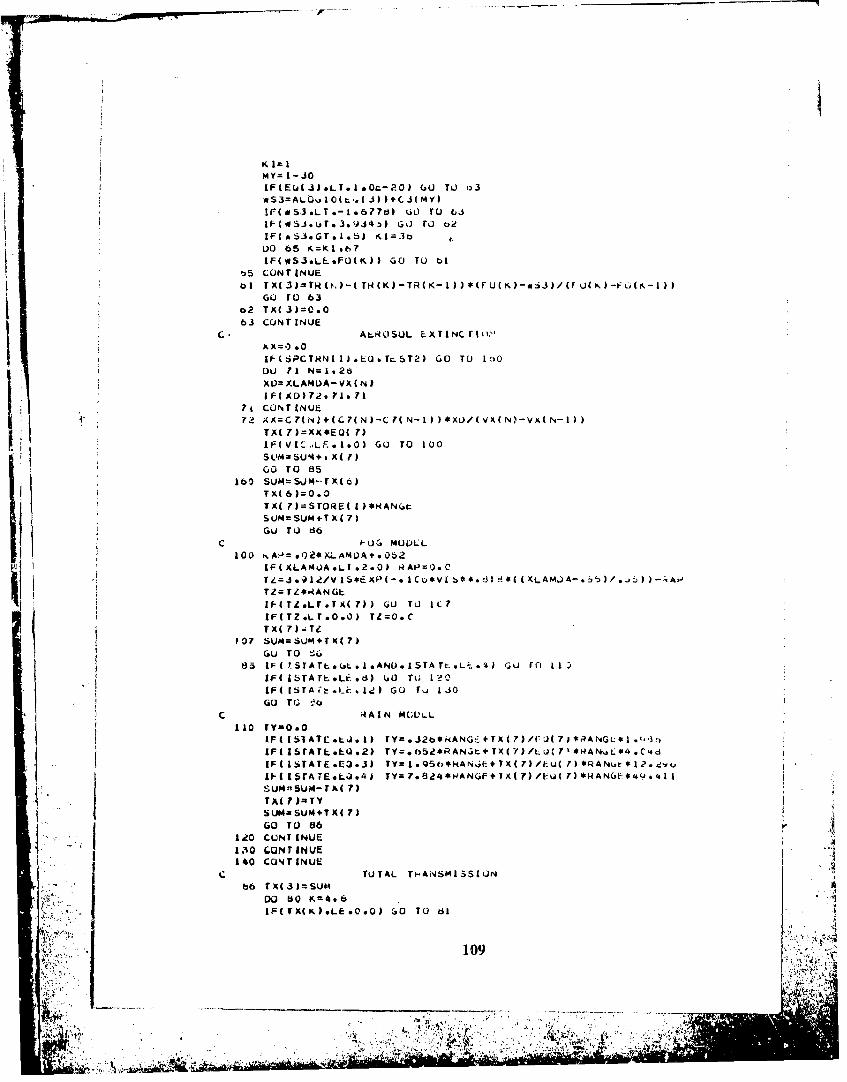
Kl=I
IF=(Ecd3J.LT*.1.--?.O) (3U TO t33wS3=AL.QuI0(r,.t 3)+CJ(MY)
lr(liSJ.LT.-1.677l() 60 rO bi
IF(S3.T.15)KI=3000 65 K=K1.b7IF(WSJ*LL*FO(K)) GO TO 61
-.5 CONTINUE
62O TX(3)=C.O63 CONTINUE
C. ALR 0SUL I X T INC ruxx, .0
IF ( PCTRN( I) *L0 . ~TL T) GO TO I ý)O
XOVXLAMUA-VX(N)
IFCD)729 1171?t CONTINUE
TX(C 7 )=XX*EU( 7)IF(V[L...LF..1.0) GU TO 100
bOSU.M=SUM--G. dC)
TXC 6)=0.O
TXC1)=STORE( £)*HAN."
SUM=SUMtT xt?)Gu TO d6
C #-OG MUDLL100 tA.-4.fO2*XLAMDA+*Q52
IFC(XLAMUA;L:;2.0() RAP=O.cIn I TZ= TZ*RANGLIF(TZLTL1TXC 7)) GO TU LL?
IF( TZ .L T.0.0) TL=O. CTX( 7)-Ti
P 07 SUM=SUM+TXC7)
GO TO -'i
85 IF (tSTA TL. (,L . IANO. ISTA T-LiLf .~4 GU f0 I I
IF( ISTA ý.1-& .L 1,! ) GO rj I joGU T Q t b
C 4tA1N MC;VLL110 TYO.O0
AF(ISTATE.LJ.1) TY=.326*NANGtiTX(7)/f(-J$I)ANGL.."'3.-
IF(1SrATL*LU92) TYe'5*AtT()/U1*4NP*.,cIF(1STAtE.EQ.3) TY=1.95t,*kANFTX(7)/ILU(I)*RANije*1,'.jvu
IPHLSrATE..~4k TY=7.8a4*IOAN(,F+TX(7)/F~O(?3*NAN3f:*49.411sumnSUM-TAL( )
TAC ?J-TYSMaSUtJF+TX( 7)
GO TO 86120 CUNTINUE
3 ONTINUE TTLTAS15O140 CCJITINUE
b6T x13 ):-SUm ADO 50 Ký4#6 AIF(r'O(K)*Lf: .0*0G TO al
V 109 <
IF(T*IK).LE.0.I) GU TO 82IF(TX(KI.GT.;2O.) GU TO 83
TXK(K I X2( -T ACK) I
GO TO 80al XCKhl.C
* 81 GO TO 6O
b2 TaCK )fI.Q-TMK)+0.b*TXCK)*TKCK.)GO TO 80
83 TX(K)0.odo CUNrINUE
AFCRL I )=TXACI)*T'C2I*TK(3)*TX(Lk)WIF IPNRINT.EQ.i21 WRI TE(6t2I0) IV.KLAMOA.AFCRL(I ),(TXCK).K=I.1)
90 CONT INULC
ILT=IMLO-IMAt IDO 45 I1,1ILT
95 AFC;-tI.(1)=AFCtL( IMA-ItI)9b CO.arIN UE
200 F-ONMAT(?O0H týAST GROUND LEVEL VERSION OIF AIR PORCL ATMO0SPHERIC PROG.
ANAt4.LtJWTRAN 11//I)
II 201 FQtt,4AT(IIOKZHI9b2 US STANOARL) ATMUSPHERE)
202 FJNMAAT(10KI~khdANL)WIDTH ,FA.I.SH - ,F4.I,32H MICRONS IN .1 MICARLON INCREMENTS)
20.3 FDRhiAT(IOXZYHVISIt'ILITY RANGiE a ,FS.2.41H KM.)204 FuRiAAT(IOA(,IJHPATHLENGTH a ,Fý3.I,1lM KILOMETERS)205 F~jMAT(104.I4HTLMPLR-ATURE- 4 *Fb.1.IOH DEGREES L)
20u FORM4AT(IlOA,2QH~t-LATIVE HUMIDITY #?.Of FORM1AT CIIK.A2HEihUIVALENT SEA LLVEL AE3SORHL-R AMOJUNtS PERs
I9HKILOMETLR,/,2XVHHZU VAPDH,2X,8H-C02f ETC. ,AX.SHOZUJNE,
24Y., dN29CJNT<,2 Ks4HH20/LNT<.1IX.8HMM.L. SCAT.93X,
Jlr$AtROSJL,/9aKVHGM CM-2,oX,2HKMoX9bHATM CM,
206Atx291KM. VHGM CM-i!,BK.2HKM,8?(.2IIKMS/)
204 FORMATCIMISH I-QEls2A*OHLAMIIJA,2X.S3HTOTAL.3X,
SMHCM-I.4X.2HUMI,4KSHTRAM4S.SCZASHTRANS),4X.I ~4BHTR AN!;. JK.SHTtANSI2ý10 tCJrt4AT(IXeIC,*6CI\,tFO4)gZCZA.eF6.4),JXF6.4)
*211 FORMATCIOX.2IIIWEATNEN CONDITION IS .2A4)22 F3*t4ATCI0X.2oHWLATHER CONDITION IS CLEAR)23FO)RMAT(lOZ.28HBEERS L-Aw SCATTERING ASSUMED)
24FUf'MATCIOX#Z1H WAVELENG*TH TOTAL */14X.THMICkONS*3K*5HTWANS/)
216FORAT(k09Z9vd~RS AOATTENUATION ASSUMC-r2,///)
?I? FOFNMAT(1I9HO THE tiCATTERING EQUIVALENT SEA LLVEL AdSOd~iEN AMOUNT
AS ARE N!iT APPLICAdLE TO THE FOLLOWING TRANSMISSION CALCULATIONS.)
PLTUWNENt)
C 110
tC
SUSROUTIME 14UTSNR I MXM9 YMVM FFFFUKC TFFPN.UELT AF 9HANGt e TRAN4S 9 PROB9I SNET 90)
-- DlAJMlE &LLN.*AJLI )..JYMiML Ja.)FEEII kA 4iI(
DIMENSION OUTPUT(10)*X.INPUT(1O)DIMENSION ROSSHRIII)P)(OBD(IflCOMMON #SNRMOT,,ft)XMTF( 20) .DYMT.F(201COM*OWN/AM&E3/JFLAG sJPRINT.DD TT SOETEMP .DPEAK.P ACT .IDELT(-. IDILLX*IIRDAXipROIN. IRM4A K.IRMIN.LUMJ .OU TPUT. KHTAW . INPUT. XLT AN,IAFLG
1VFOVoX$MAG*XN% XNSC*OVERSC *SRI TE*SRTA139DISC slk TATrANGLE*MOMoFStAR*2XLAMU.FAU4UNBFOC.XI(.FMAXF .XV.KYL.FM4AK.KSIGLS.YSIGL.S.KA.YAKK~.310OTAU9VEL*FELECTDATA ROSSNR/5e5.s.A.1.o3.73eS3.1 .2.eB2e5.2.3.2.0.1.b*j.0.0DATA PRODD/1.00,.9,0.8,0.7,O.6,0.S.0.4 .0.5 .0.P.0-1 0.0/f.LAL.i -IJIRI TEL 6,.00-1~. - ......
7000 FOR1MAT(34(/).vI4 91*',,1X*1IBHMTSNR OUTPUT DATA9,/e)C IF I IAFLG mNEb I )tRITE(46.3I
XSODEu LT AR/RAv4GEYSI 0EaXBTAR/RANGETANROXS IOE*YSIODi
I Ic IF 4 IAFL.6 eEQ. I)URITE(697000)CALL XRING(XCTFF*DICMTF.FI-FF* 20.I4.d*XSIDE,1.ANSZv1*0) :
CALL XRING(O0*.OYMTF.PFFFF, 20sH*8*YSI0E#29ANT,?. 1.0)C IF (IAFI..G *LQ. 1)ORITEIO.70001
QOOzANt482&O*ANT
CALL ARING(O0.*M'VMYMFFFFs R0*Hp8vYSIL)E,*29ANT92*1 .0)
000. ANS*ANTD3TO*TAMRD*QOO/SNET*1.0/(OELTAY*VLL*QD/OELTAF/FR/LYETM4/QVERSC)**.bCALL ALINEY(SPRO8.UPQRD.4boOSSNk.1I)IF(SPMDB*3LT.0.'n) SPRO=C .0
END
.........

%.UuR.OUT INE UI- AULT (FRtU XMrF #II KK()Dl%4tM-NS ION X)w( 5C) 900T( t0) sTSf-A 0) sSE $Lb0) *SOML(50) 9XFRkv(500 D"5TK
2xomrf- ,' . XLIPMTF(2C) 9ELMTF( PO) 9HMrF(L'OI XTVMTF(20) @XEMTF(2O).
4X~iTF .0 AMNTFLS( ie0) .MXYMTF (20) sAXMRNTI-0)D 141'. S IUN X I NJU I( 10) # JUTPUT (10I
LcýMMON/NAMF,x6TAUI-,o()H4TF.)t).M~XPM ELMdL TF,3MTF~xrvmTF.XEMTF*&.(oSMrF.KaMTfLb9XýYMTF
C~(POpA4/KUCUM,4UN/NAML4OJFL.AG 9 JVRNNT*VD TTO0ETEMP UP~EAK 9 ACT$ IDELTR9 IDhLLE1IN::AX:.AI~eiN:AX:AHMINoLUPU.0UfPU1.PCMTAHEINIPtT9XLTAH.LtAFLG
C JMM0CN/NAMf-f(/D'XlDR5O0,bDEI(50)9DDf4TX(50)
lf-(LAILG 9N-.* Ilv#4ITL(698OIQJIF ( A~FL(i F-Q. I )'WHI TtI( ?000)
?,-C: f-UHMAT( 34( /) ,,M I1 *Ie.AK s IHUUr-UT DA IA v//I63C I C $ o-4NAT( AM I 1 H IIHOU TPU T OA I /,'/ i
IF(IKUr.cdt(j.I.ANU.JFLA(ý.LL.')) GU TO d007
WR I I E (, b0 20 )1) C 2. FJ R 14AT H 2M .'X J 1 HX MUO UL A T IIN T WAN ýif-tR F UNC, T I ONS//I
L4Ir Lod .d3 F ,-~U ( I XA0UM T F X 8M BiF ( A XUM T F( I A ORMT'AI ) s L MTýi m r II( Iv A T ( I t M u ( I) X ~D timrF ( I) XMT FL S ( IA LY MT F F I P
A C 2 F J 1'AA T( IH ,4H F Rt0. I X H OFT I L I 3HGGUN, #I X 9 5 HUT FC 01 X 05 H~S FN$
2JHE YL//)
fF(IUA FL G N. NF I)wR I E( 6 98 C 1O0IF ( IAFLf.; *EJ I)WRITE(6970001
AH Iw T L 68040 b- ý T 91=1920
-00CONTIANUE
IAt- ( IAF L Nt.. . I k .Itt' .8C)10)
d 0 o FLu.,IArLAMJ *'.OrHi-FUICTI-t MdI NIAUM NHES(LVAt3LL TE-MPERATURE)
R C.PC hLGRA AT , IH is#F,4tJ..I 5~JAX~bM) MRT// ( ýEi2.3 I P~c o.3))lU( I A-L-( *NL . I )%ý,jL ( oHC Is
-3C 07 CuN T INUF
ad- I TE ( n t;1 1) )0.TE48 3 A~ A T ( I H s At4O c F A~) r~ E 0
w R I T L ( 6. s dC 9'0QY 9 )H, T( IH ,~,A1~ cI UN PNFUr4MANCki/!.7@I!NHOV P1.,:FURMAN'CE)
t3IC. FOMATC5,WikANGL 5XP.tITNANS,4iSSION,5X.1IMX VLLCCtIUN/a2&xI2H!uaI AAJI..ITY/( .XFb.*2,Fl I .2,FAl. 2))
811C FUlkA4ATL/*Itl @z3Xvl6HW4FOV PLRFflR'ANCIE)
IICAILu, Nc. I)ORATE~u.8010)It- (IAAILG .NL. AD(ýU TO 200C*NITcCIc
2C' 20 A L ONE :ci20 ) X*HPfRL)EPENDANT PbQ
810FIJK4ATiIH5A23H U( 01 FUHMAN
I F uk M A C I-
112.
*&. -A
*141 L(t%,111l40)(UXbJR( I),JLUUTC1I),tiOKTX(I),stflItK)
d I 3 FUHM AT( bA.5H#4AM1GF sbM* I2MTW AN SMISS ILON 9bXtIJHA R-CUGN It1IUN/SS.33IAiHPR
xE TURN
f.Nu
SUdRUUTlNE ALlNty(NA~t3tiA,A3*N)OIMU)4S(UN AC 1)90(1I
WIF W1 e~).GT J( 2)) GO TO 2
WA 3$LE.13( A))I GO TO 40
IF IBb6.GF-.atN)Lb GO tL3 50LF I
LL- N
IC CONTINUe
J=4LL4LF UZ
IF (t6dhI .Lt UJ ) IQ0 TO
IF(t 63.GM.tt~ 4)) GO TO Lb -
5 LLzJIV( LL-I.EO.LF) Q0) TO 40
GO TO 10
Ii LFtJI F LF +I&t1.U. LL ) G L TO .30
GO TO IC
4U AA.'A4 I )41 A(t I-A(C2) ) /04( 1-2 1 1 *Ct30U-c( I1))
50 AM=A(CN)4IA(NA(N(NII)I/( 6( N-1 )-b(N)*(fl4(f
Nt T W14N
2 IF( -(Mr*CL.H( It GO YO 4kt
lt-dt.LC b(NWI') GO I0v0
to CurAI INUF I
zIF-(t~J.GT.CIJ)) CIU TO ?'0
6 LL=J.1 l(L.LI.LULP ICL) TO 41,
Ir(LF-"A.&J.LL) 0' TO 3C
113
W1

SUBRO~CUTINE LUTFkIi4,Y9*N0IM)C S1,10ROUTINt a1'FE
c P URPOS'..ýC TO --MPUTE THIE VECTOR OF INTEGRAL VALULS FOR A GIVENC EQUIDiSTANT TA13LE Of rUNCTION VALUuS.
C
C CALL uTFE (HsV.ZsNDLN)1
C DSCIPIO Uf-PARAMETLRS £MYOI Y - TEtPIVC~ FFNTO AUSC z -THREUTN tCUOFITGA AU e *YEC IULNTICAL WITH1 Y.
C NOIM -THE JIMENSION or VZICTORS Y AND Z.
CC REMAR~KSC 4O ACT ION IN CASE NU)LM LtSS TH-AN I*
CC SuUHUUTI4LS AND FUNCTLUN SUU.PRUGHALMS lRLQULRLO.
C NiNL
C M4ETHJU
C bI:GILN4Nua~ WITH Z( 1)=0s EVALUATIUN OF~W ViCTUN 15 IS NL AC MEANS UF TI-APCZUIDAL RULL tStCUND OmUER FCPMULA~s
¶ C #-.d;.HI4LUL)LRANIfl, INTRODUCTIOUN TO NUMERICAL ANALYSIS*
CC )MNIJ .... .. . . . . .... ....
C
C INTt:(*H-ATI()N LUJ'jO3 2 1=2.NUIM
S:iM I =SUM2SUM Ž2-SUŽ14? $ IH* Yi V ) i YI-Il
Zi (iNJ 1A S UM 24 ETlURNLNL)
IPM Application Program, Syalem/360 Scientific Subroutine Package.
Ve~rsion ITT, (360A-CM-03X)
¶9 114
FLJNCTILJN SINCU(XLUATA R 1/3. 1tlqb926 54/
A=P I*X
HLTItNN
Ico SINC*1.OCO
IýNU
0 a i F UNC T 1W A#4CJS(X I00)0 Ak.l=V6
0003 R r-TUH
C0115

APPENDIX D.
NIGHT VISION LABORATORY STATIC P1ERFOKM /!CiMODEL FOR THERMAL VIEW!NG SYSTI:NIS
USER'S GUIDE
CONTENTS
Section Titl l('g
IlIntrodtiction 117
11Systemis Analysis 118
III A Simple Data Deck 127
IV MutpeRun D~ata Deck 131
e131
B. 'Chang-ing System Parameters 133
VAn Exariip~ 135V.VA. The Simple Input Deck 135B. Catput Listings 143C. A Multiple Run Deck with Target and Atmospheric
*. Changes 16,qD.A Multiple Run Deck with System Paramnetei Changes 172
E. A Mixed Multiple Run Deck 172
vi Supplements 172
1. I'rget 173
3. Optics 178I.4. Scanner 1835. Deteetor 1846. Zlectronics 1887. Display 190
'I
8. Sy-Aein 1929. Stabilization 19410. Eye 19511. Program Cards 19612. Specialized Options and Diagnostics 198
116~
-"Bit,
1. Introduction
The NVL Static Ferformance Model for Thermal Viewing Systems has been con-structed so thatt it is now possible for a person who has some familiarity with thermalimaging systems to perform sophisticated analyses of complete sensort, in a relativelysimple fashion. Furthermore, the capabilities of this model allow the user to easily per.
form parametric sensitivity studies. The user has at his disposal the ability to put to-gether systems, component by component, and to see what effects different subsystemcharaeteristios have on dc vice performance. lie can alsc test his system against a widevariety of envirovmental conditions that will be of interest.
Essentially, the model generates a target representation and modifies it first by ac-counting for any atmospheric effects. Thon, the attenuated scene representation istaken through each of tht major syswnc cmponents successively. The result is furthermodified by the observer's response usirg standard informxnltion theory teohni ues.There are basically six performance measures that are calculated:
1. System Modulation Transfer Fanction (MTF)2. Minimum Resolvable Temperature (MRT)3. Minimum Detectable Temperature (MDT)4. System NFAT
5. Static Recognition Probability vs Range6. Static Detection Probability vs Range
Probability ,in:vdictions can be specified as Oither power based or temperature based,aid they are performed for both the x and y dimensiens.
This piogram has been specifically designed for ease of use and, while it may atfirst look foreboding, a little time spent with it will show that it is not difficult to use.
Data can be entered into the program in either af two way. All input data is printedout clearly so that the user can easily cheek to see if he is modelling the system he reallywants. Various error checks are made on the input data, and many of the obvious er-rors that we anticipate will be made are flagged. Certain limited default features existin this version. Also, the program has the ability to do several performance calculationsusing one input deck.
In the following pages, we will go through in detail the procedure ,o be used whenprediction- are required from ihe NVL Static Performance Model for Thermal ViewingSystems. We will discuss how you should look at your system in •i way that will aid youin understanding the computer program requirements. We will efully go throughwhat parameters you must specify and how you must specify i. We will cover allaspects of physically setting up the required data deck. W". v plain what procedures
117
.4 '
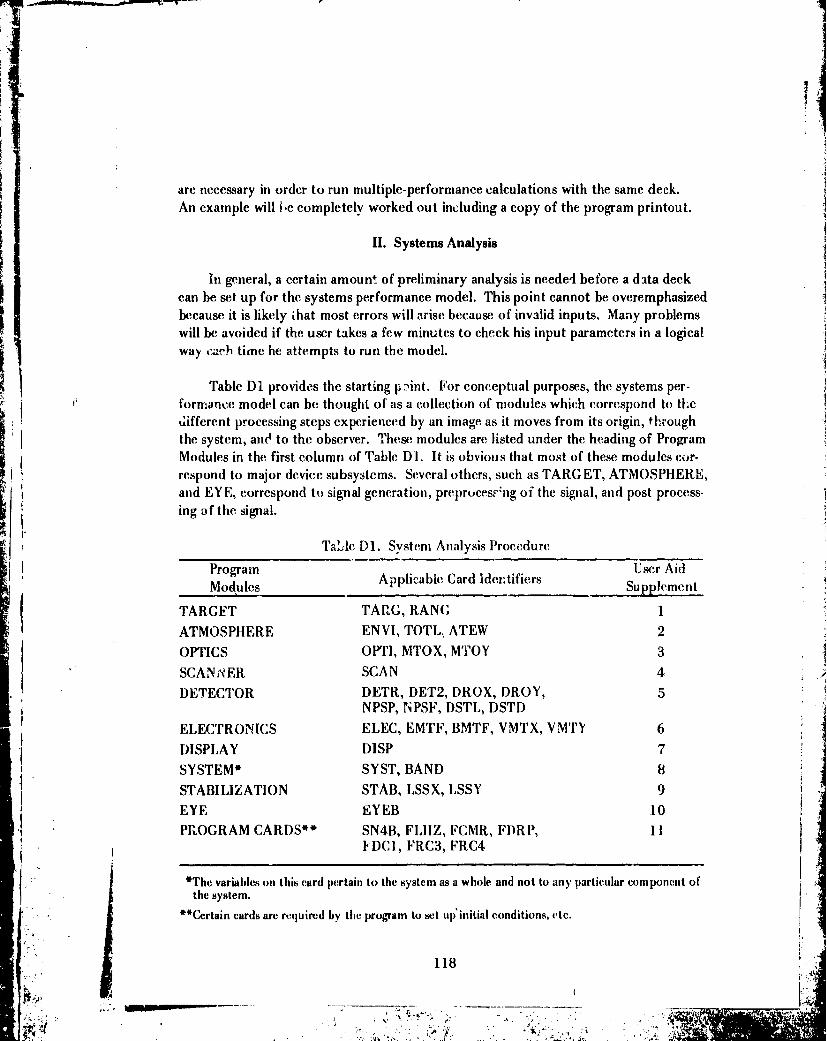
4.14
are necessary in order to run multiple-performance calculations with the same deck.An example will i-e completely worked out including a copy of the program printout.
1I. Systems Analysis
In general, a certain amount of preliminary analysis is needed before a data deckcan be set up for the systems performance model. This point cannot be overemphasizedbecause it is likely that most errors will arise because of invalid inputs. Many problemswill be avoided if the user takes a few minutes to check his input parameters in a logicalway each time he attempts to run the model.
Table D1 provides the starting paint. For conceptual purposes, the systems per-fornmancc model can be thought of as a collection of modules which correspond to thed1ifferent processing steps experienced by an image as it moves from its origin, týroughthe system, anO to the observer. These modules are listed under the heading of ProgramI! Modules in the first column of Table DI. It is obvious that most of these modules cor-respond to major device subsystems. Several others, such as TARG ET, ATMOSPHERE,and EYE, correspond to signal generation, preprOcesF:ng of the signal, and post process-ing of the signal.
TaLlc DI. System Analysis Procedure
Program User Aid° Modules Applicabie Card identifiers Supplement
TARGET TARG, RANG 1ATMOSPHERE ENVI, TOTL, ATEW 2
OPTICS OPl'I, MTOX, MTOY 3
SCANNER SCAN 4DETECTOR DETR, DET2, DROX, DROY, 5
NPSP, NPSF, DSTL, DSTDELECTRONICS ELEC, EMTF, BMTF, VMTX, VMTY 6
DISPLAY DISP 7
SYSTEM* SYST, BAND 8
STABILIZATION STAB, LSSX, LSSY 9EYE EYEB 10PROGRAM CARDS" SN4B, FLHZ, FCMR, FDRP, 1I
IYDCI, FRC3, FRC4
*The variables on this card pertain to the sy8tem as a whole and not to any particular component ofthe system.
"**Certain cards are required by the program to set up initial conditions, etc.
118
-7-
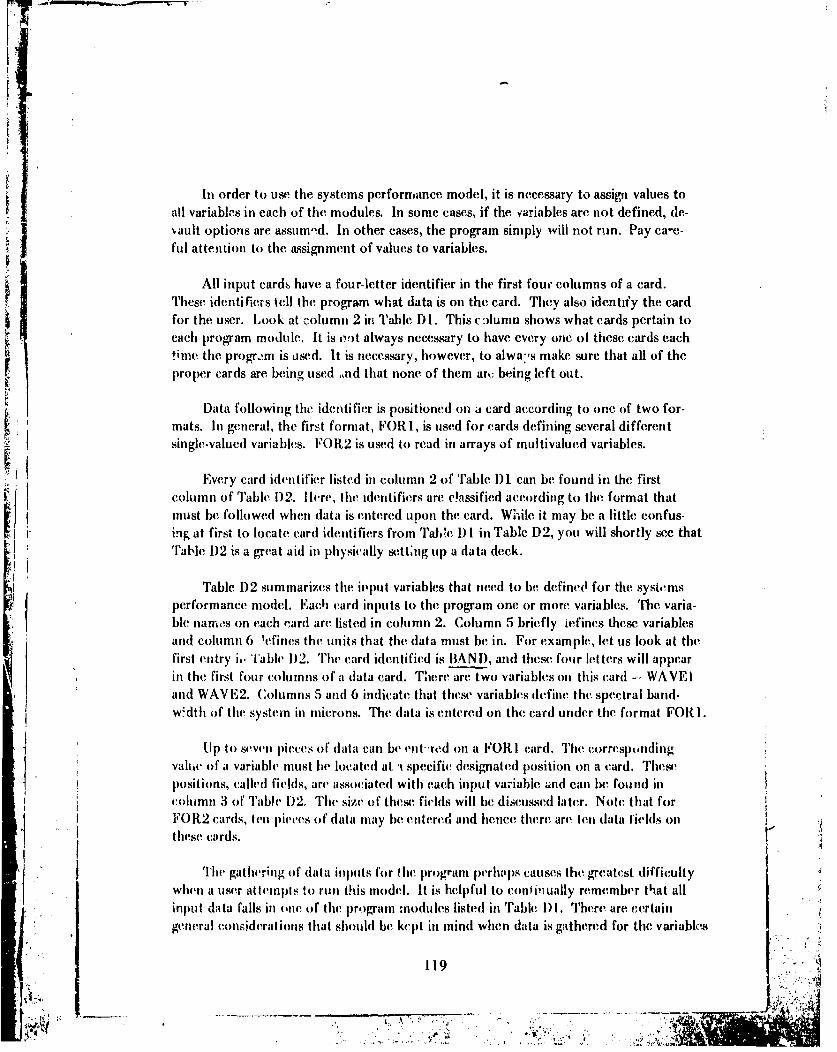
In order to use the systems performance model, it is necessary to assign values toall variables in each of the modules. In some cases, if the variables are not defined, de-fault options are assum'-d. In other cases, the program simply will not run. Pay ca-e-ful attention to the assignment of values to variables.
All input cards have a four-letter identifier in the first four columns of a card.These identifiers tell the program what data is onl the card. They also identify the cardfor the user. Look at column 2 in Table D1. This c-)lumn shows what cards pertain toeach program module. It is o.t always necessary to have every one of these cards eachtime the progr.im is used. It is necessary, however, to alwa-'s make sure that all of theproper cards are being used ,,nd that none of them at,. being left out.
Data following thc identifier is positioned on a card according to one of two for-mats. In general, the first format, FORI, is used for cards defining several different
S Isingle-valued variables. FOR2 is used to read in arrays of multivalued variables.
Every card idvntificr listcd in column 2 of Table D1 can be found in the firstcolumn of Table D)2. Ilere, the identifiers are cOassified according to the format thatmust be followed when data is entered upon the card. Whkile it may be a little confus-ing at first to locate card identifiers from TaWe D I in Table D2, you will shortly see that
: Table D2 is a great aid in physically setting tip a data deck.
Table D2 summarizes the |1'put variables that need to be defined for the systemsperformance model. Each card inputs to the program one or more variables. The varia-ble nan-,'s on each card are listed in column 2. Column 5 briefly lefines these variablesand column 6 lefines the units that the data must be in. For example, let us look at thefirst entry i.. Table D)2. The card identified is BAN [), and these four letters will appearin the first four columns of a data card. There are two variables on this card -- WAVEIand WAVE2. Columns 5 and 6 indicate that these variables define the spectral band-w~dtlt of the system in microns. The data is entered on the card under the format FORI.
Up to seven pieces of data can be enlt-red on a FORI card. The correspiundingvalue of a variable must be located at 'i specific designated position on a card. These
positions, called fields, are associated with each input variable and can be found incolumn 3 of Table D2. The size of these fields will bi discussed later. Note that forFOR2 cards, ten pieces of data may be entered and hence there are ten data Fields on
these cards.
''lTie gathering of data inputs for Ihe program ierhnps causes the greatest difficultywhen a user attempts to run this model. It is helpful to confic ually remember thlat allinput data falls in one of the program modules listed in Table 1)1. There are certain
general considerations that should b( k(pt in mind when data is gathered for the variables
119 ' "• e
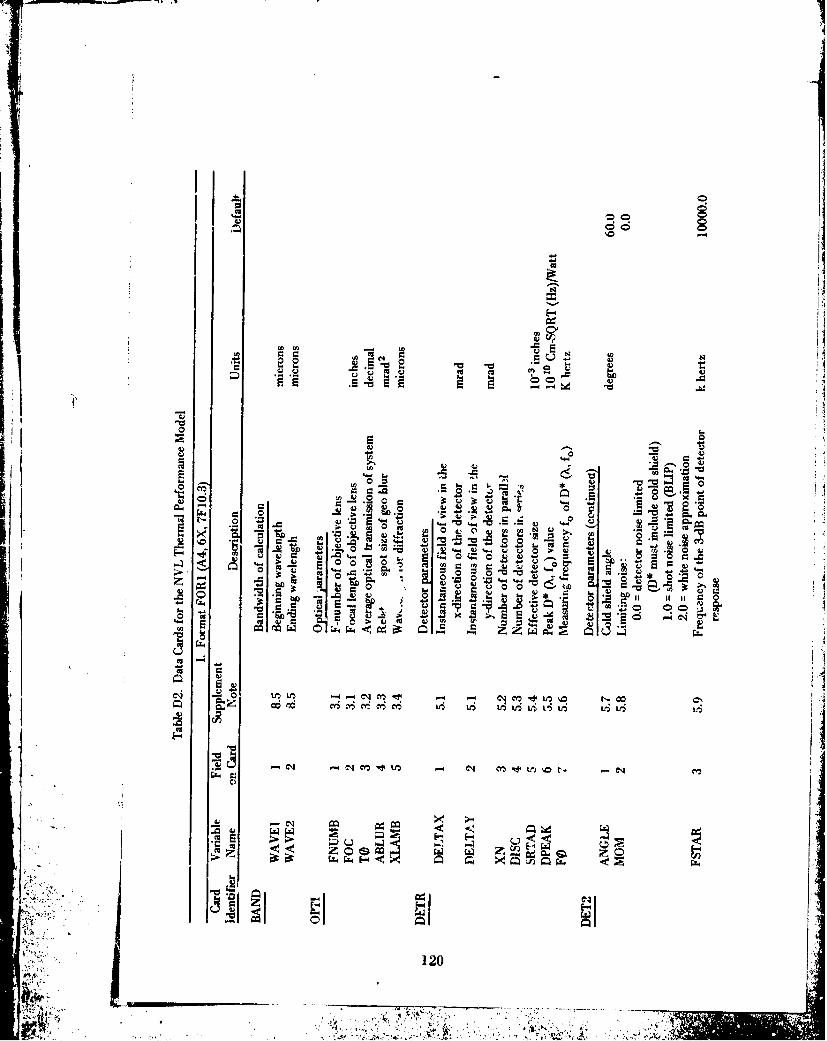
NN
4~41
U) U) - U
00D -o, 0 I- q,
L -h Q . r
W 0rA, = 5 -
0- M LOM R- -c
0 40
0 120
44 0
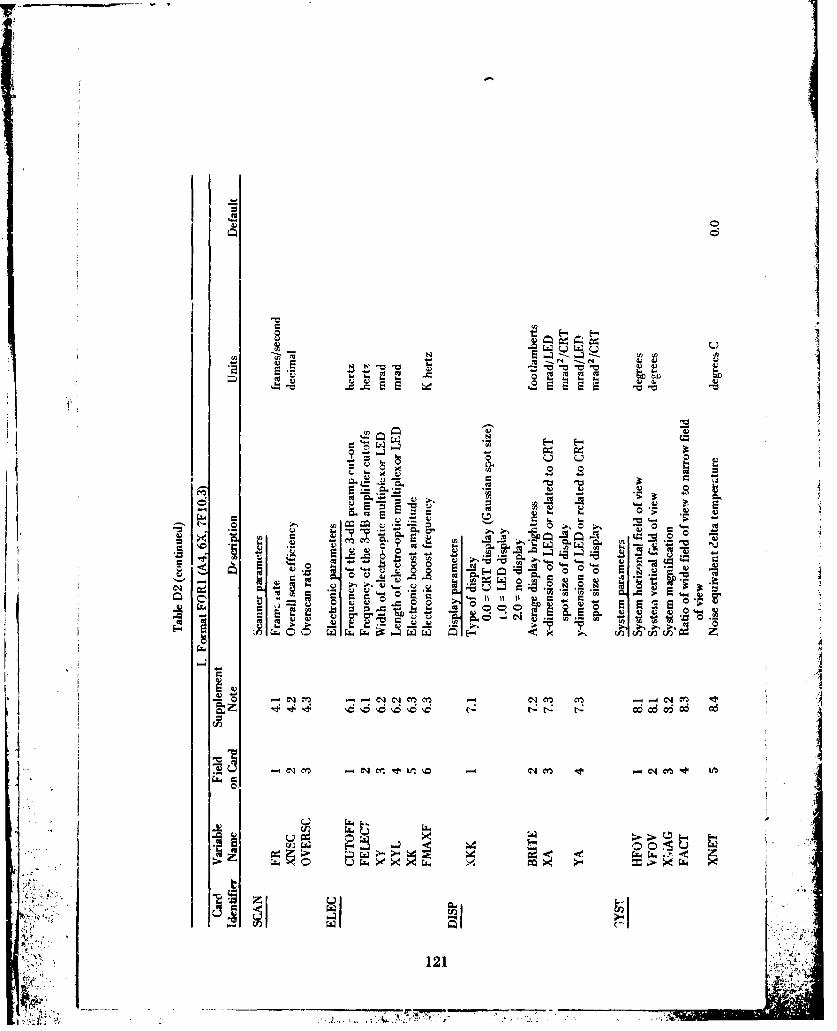
I
"I, 'i W
0-.o
• • ,-.,C-,
* ,y- ", ,,,,- -.
•- ,F4 E-,
w I! 0 0L
00
CiJ
CC C
C.121
C,)7

0a'
~~00
~~c S..~~
CXu
e0 4- -e
U) f)
a Z E-
122 c~ '
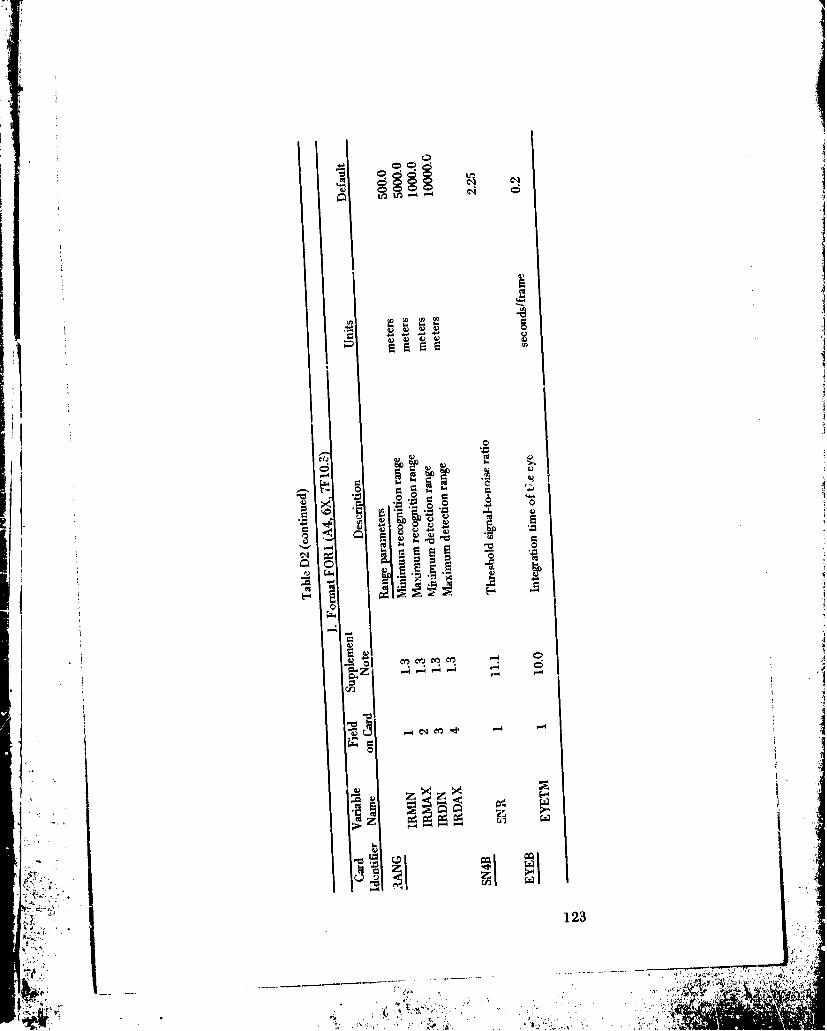
.4- 0 00
>4
c ga-
123
'4G.)-7777774

cci14 --
C)I~
IWO
1-4
124 Sbf
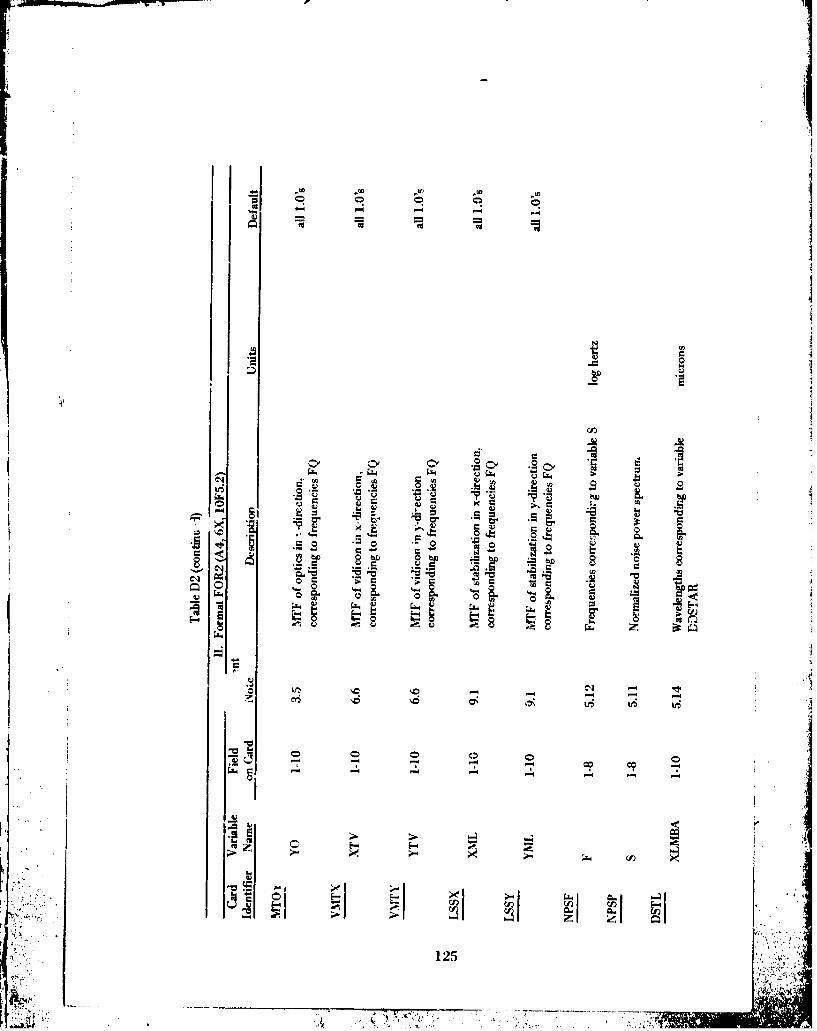
0 v
in 4.)
)Cl)
V co 0
r. Ch n cn c~ . ' -c .
~0 *-0 * 125
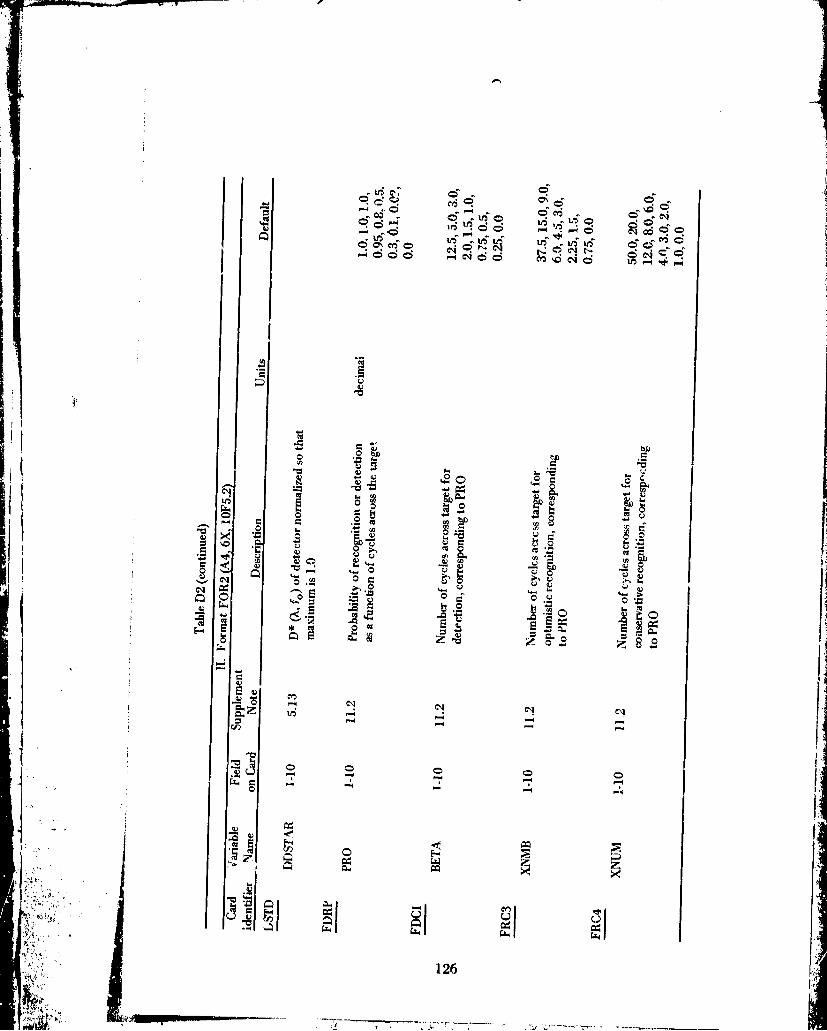
; li j2 -0 -0 ""- J L -
i "
.O
• -- -
lz
"• z C.,..8
:"=.':,126
ii -.
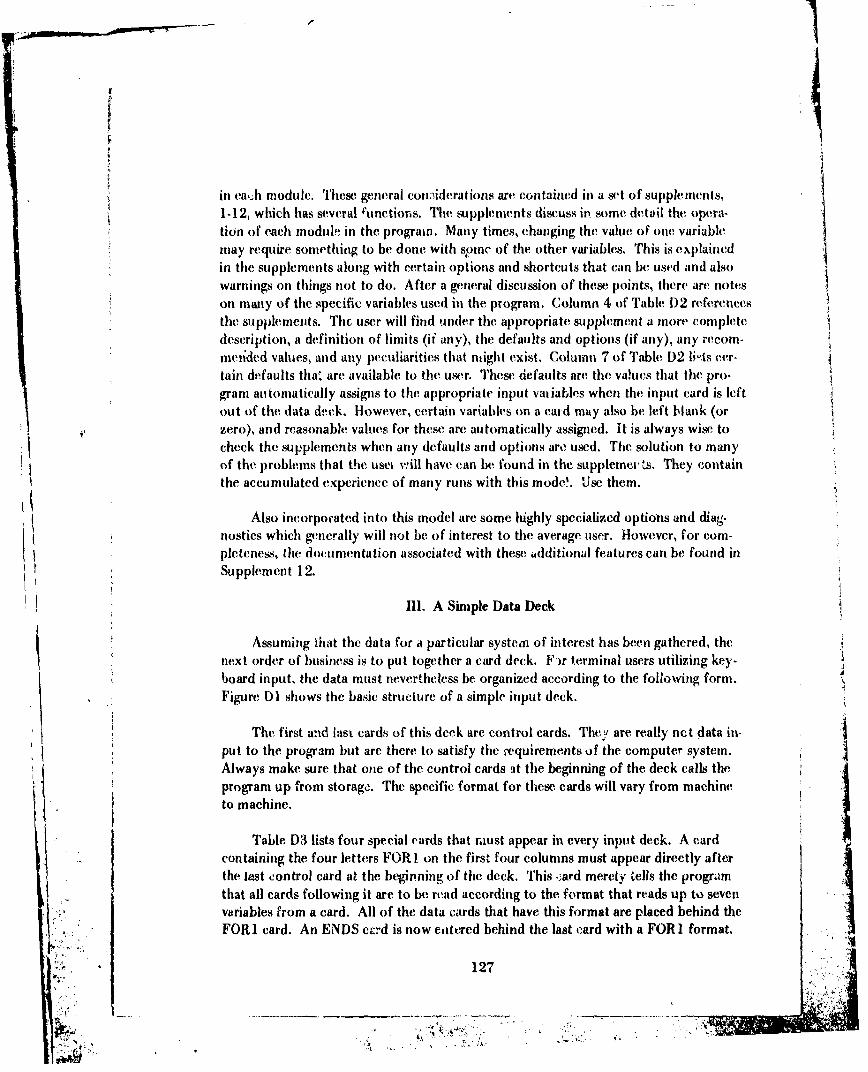
in eia,ih module. These general con.,iderations are contained in a set of supplements,1-12, which has several runctiors. The supplements discuss in some detail the opera-tion of each modul!, in the prograin. Many times, changing the value of one variablemay require something to be done with sý,mc of the other variables. This is explainedin the supplements along with certain options and shortcuts that can be used and alsowarnings on things not to do. After a general discussion of these points, there are noteson many of the specific variables used in the program. Column 4 of Table D2 referencesthe supplements. The. user will find under the appropriate supplement a more completedescription, a definition of limits (if any), the defaults and options (if any), any recom-meided values, and any peculiarities that might exist. Column 7 of Table D2 li-ts cer-tain defaults that are available to the user. These defaults are the va!ucs that the pro-gram automatically assigns to the appropriate input vaiiables when the input card is leftout of the data deck. However, certain variables on a card may also be left blank (orzero), and reasonable values for these are automatically assigned. It is always wise tocheck the supplements when any defaults and options aro used. The solution to manyof the problems that the usei Nwill have can be found in the supplemeris. They containthe accumulated experience of many runs with this mode.L Use them.
Also incorporated into this model are some highly specialized options and diag-nostics which generally will not be of interest to the average user. However, for com-pleteness, the documentation associated with these additional features can be found inSupplement 12.
SpmIt1. A Simple Data Deck
Assuming ihat the data for a particular system of interest has been gathered, thenext order of business is to put together a card deck. F-r terminal users utilizing key-board input, the data must nevertheless be organized according to the following form.Figure Dl shows the basic structure of a simple input deck.
The first and last cards of this deck are control cards. They are really net data in-put to the program but are there to satisfy the i-equirements of the computer system.Always make sure that one of the control cards at the beginning of the deck calls theprogram up from storage. The specific format for these cards will vary from machineto machine.
Table D3 lists four special cards that must appear in every input deck. A cardcontaining the four letters FORI on the first four columns must appear directly afterthe last control card at the beginning of the deck. This ý.ard merely tells the programthat all cards following it are to be read according to the format that reads up to sevenvariables from a card. All of the data cards that have this format are placed behind theFORI card. An ENDS cc.d is now entred behind the last card with a FOR I format.
127
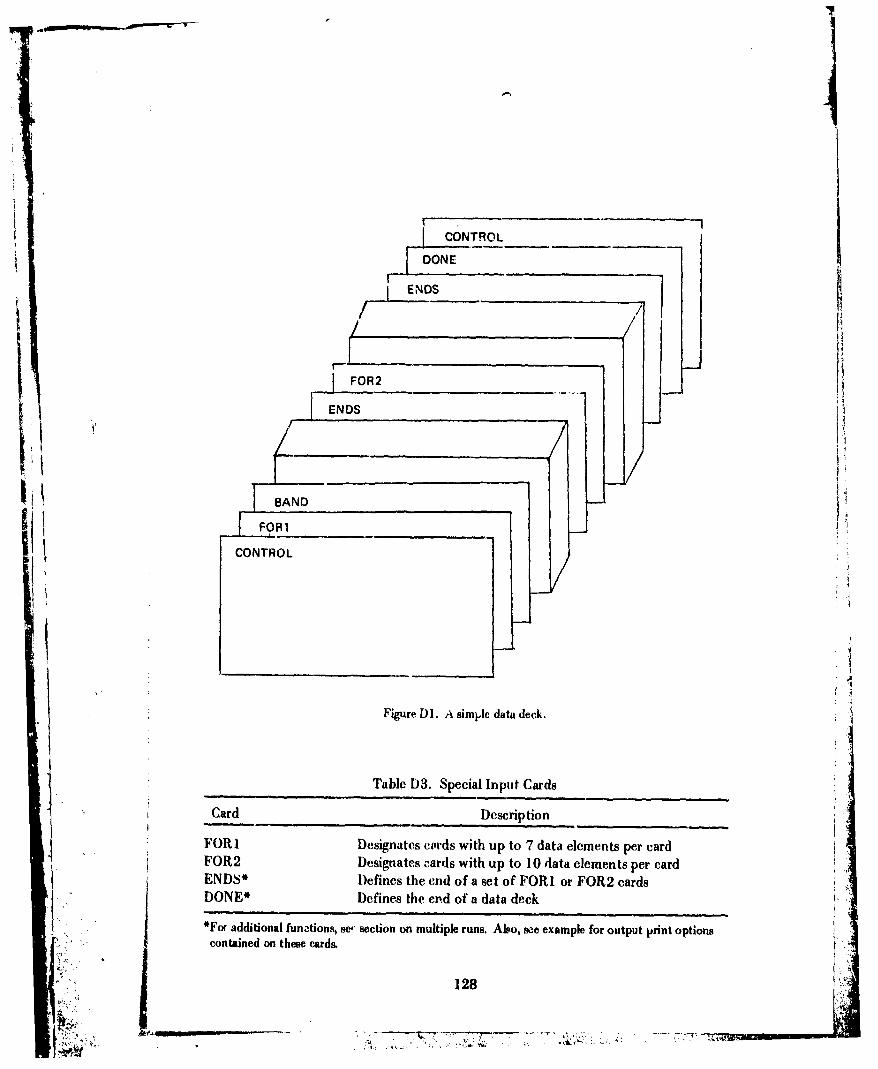
CONTROL
DONE
ENDS
ENDS
BAND--
FOR1 ______
CONTROL
Figure DI. A simple data deck.
Table D3. Special Input Cards
Card DescriptionFORI Designates c-rds with up to 7 data elements per cardFOR2 Designates cards with up to 10 data elements per card
ENDS* Defines the end of a set of FORI or FOR2 cardsDONE* Defines the end of a data deck
*For additional funztions, se' section on multiple runs. Also, see example for output print options• •,..-' ::contained on these cards.
128

The ENDS card tells the program that all data in a particular format has been read.The card itself simply contains the four letters ENDS in the first four columns.
In a like manner, the card FOR2 appears next. It identifies all of the input cards
that have up to ten elements of data per card. After these cards are placed in the inputdeck, another ENDS card must appear, Finally, after all data have been read into theprogram, the DONE card is used. It defines the end ef the data deck for the program.
There is only one simple rule that must be followed concerting the order of cardsafter the FORI card or the FOR2 card. This rule states that the card BAND must ap-pear imtmediately after the FORI card. This applies to any execution of the, progi am•which defines the spectral bandwidth of the system. Otherwise, data card. grouped by
identical fornat can appear in any order.
Information is entered on a card using a FORI format in the folloving way. AsI was stated earlier, the first four columns always contain one of the identifiers listed inl
'rabies DI and D2. The next six columns are at-vays blank. Starting with column 11,there are seven ten-column fields into which data can be entered. Field 1 consists ofcolumns II to 20, field 2 consists of columns 21 to 30, etc, The fields on each datacard are allocated to oarticular varables so care must be taken to enter data entirely inthe proper field. A decimal point must always he included with data. This rule even
* applies to variables which are not normally considered to have fractional values such asDISC-the number of detectors in series. Note this point well because the program willvery likely read your data incorrectly if you violate this rule. In checking to see thatdata appears in the appropriate field, it is useful to always enter data in the same columnof a field. In other words, regardless of the FORI format identifier, always start puttingdata for field 1 in column 11, for field 2 in column 21, etc. In this way, it is easy tocheck among cards to see if any data is out of its field.
In a similar manner, data is entered on cards that use a FOR2 format. Again, thetirst four columns contain the cvrd identifier and the next six columns are blnk. Start-ing in column 11, ten fields of five columns each are allocated to ten values of one par-ticular variable Thus, data will be contained in columns I1I to 15, 16 to LO0......56 to 60. As before, decimal points must be included with each entry.
Many times, two sets of identifiers are related. For example, consider the detectorresponse card DROX, This card contains the detector MTF as a function of frequency.The corresponding frequencies are found on the cit-d FLH, or are default values as"ligted in column 7 of Table D2. In either case, care should be taken to make sure thatthe data in field 1 of one card corresponds to the data in the firbt field of the othercard or the first default value. Make sure that the other fields simi'larly correspond.
"129
.*.L .-
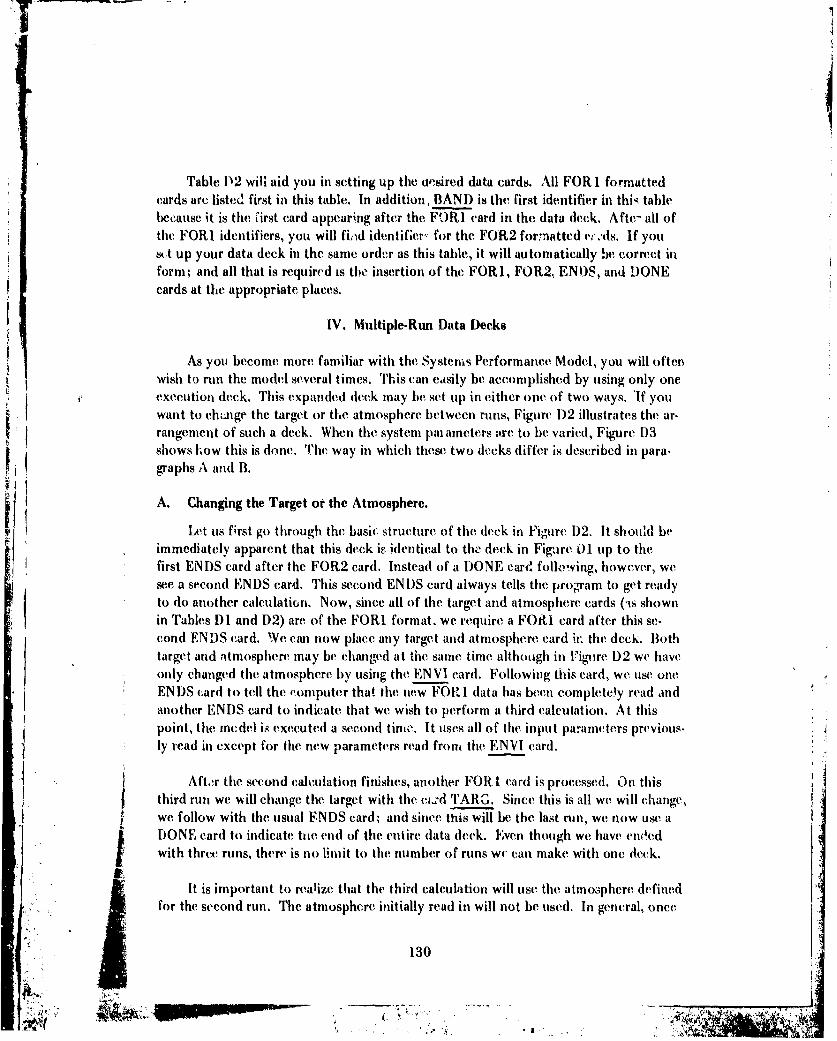
Table D2 will aid you in setting tip the uesired data cards. All FOR 1 formattedcards arc listed first in this table, In addition, BAND is the first identifier in thik tablebecause it is the Cirst card appearing after the FORI card in the data deck. Afte- all ofthe FORI identifiers, you will find identifier, for the FOR2 formatted cr :ds. If yous*At up your data deck in the same order as this table, it will automatically be correct inform; and all that is required is the insertion of the FORI, FOR2, ENDS, and DONEcards at the appropriate places.
IV. Multiple-Run Data Decks
As you become more familiar with the Systems Performance Model, you will oftenwish to run the model several times. This can easily be accomplished by using only oneexecution deck. This expanded (leek may be set up in etither one of two ways. 'If youwant to choLge the target or the atmosphere between runs, Figure D2 illustrates the ar-rangement of such a deck. When the system paiameters are to be varied, Figure D3shows how this is done. The way in which these two decks differ is described in para.graphs A and B.
A. Changing the Target or the Atmosphere.
Let us first go through the basic structure of the deck in Figure D2. It should beimmediately apparent that this deck is identical to the deck in Figure 01 up to thefirst ENDS card after the FOR2 card. Instead of a DONE card following, however, wesee a second ENDS card. This second ENDS card always tells the program to get readyto do another calculation. Now, since all of the target and atmosphere cards (is shownin Tables DI and D2) are of the FORI format. we require a FORU card after this se-cond ENDS card. We can now place any target and atmosphere card in: the deck. Bothtarget and atmosphere may be changed at the same time although in Figure D2 we haveonly changed the atmosphere by using the EN VI card. Following this card, we use oneENDS card to tell the computer that the new FORI data has been completely read andanother ENDS card to indicate that we wish to perform a third calculation. At thispoint, the mcdel ii executed a second tine, It uses all of the input parameters previous.ly read in except for the new parameters read from the ENVI card.
Aftr the second calculation finishes, another FOR 1 card is processed. On thisthird run we will change the target with the ciý;d TARG. Since this is all we will change,we follow with the usual ENDS card; and since this will be the last run, we now use a"DONE card to indicate tie end of the entire data deck. Even though we have endledwith threte runs, there is no limit to the number of runs we can make with one deck.
It is important to realize that the third calculation will use the atmos4phere definedfor the second run. The atmosphere initially read in will not be used. In general, once
130
"..
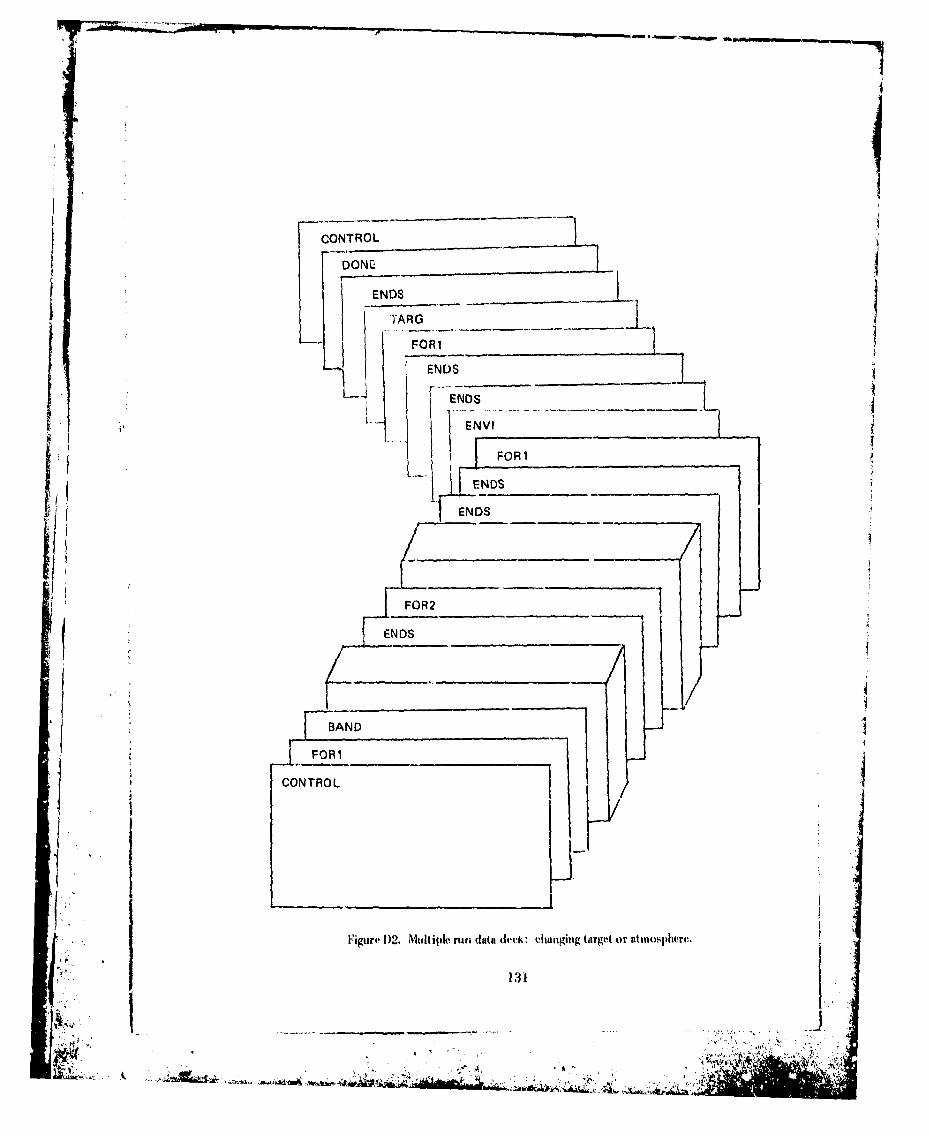
CONTROL
DONEL -
ENDS
TAR G___L _i . ENDSI FOR1 _
FENDS 7ELI NDS
S FOR1
ENDS
' FOR2
' BAND L
CONTROL
f /
Figure 1)2. Multiple run data deck: ehahungitg target or atmosphere.
, .. 131
k it ,:,,: .' .''.• , .
' ' " • •?,•"•• .,•5•6Dt•.•.J*K'. ,',
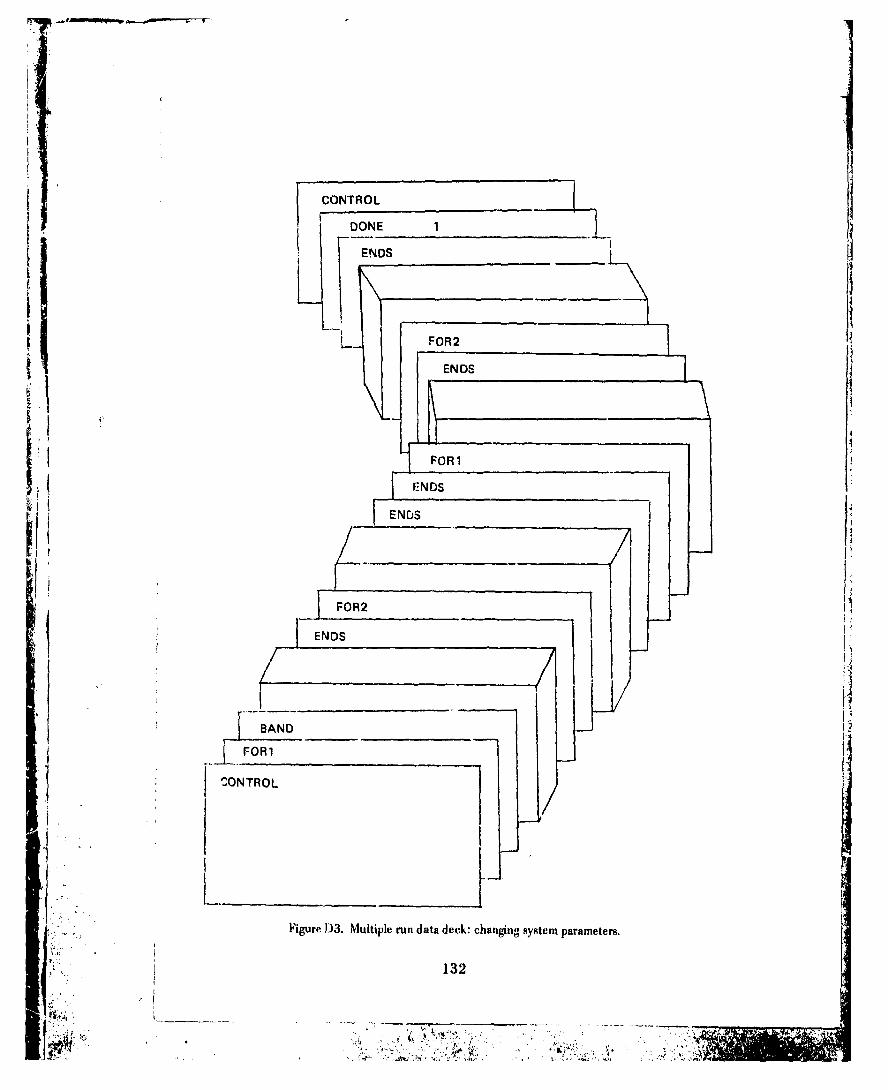
CONTROL
DONE 1I
RENDS-
FOR2
EN DS
I FOR1
ENDS
OFO R 2R_ _
ENDS
BAND _ _ _ _ _
FO 1R
IONTROL
Figure D3. Multiple run data deck: changing systcm parameters.
132
- - ----
lit:
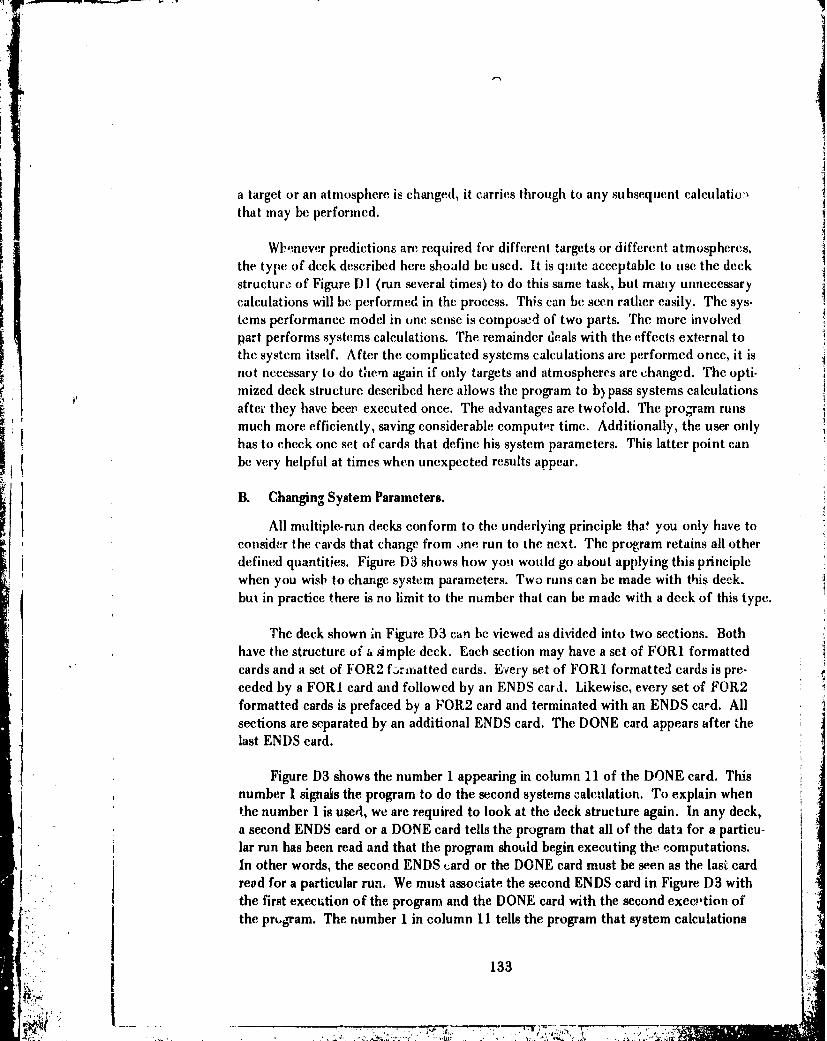
a target or an atmosphere is changed, it carries through to any subsequent calculaticuthat may be performed.
Wlwcnevcr predictions are required for different targets or different atmospheres,the type of deck described here should be used. It is quite acceptable to use the deckstructure of Figure D 1 (run several times) to do this same task, but many unnecessarycalculations will be performed in the process. This can be seen rather easily. The sys-tems performance model in one sense is composed of two parts. The more involvedpart performs systems calculations. The remainder deals with the effects external tothe system itself. After the complicated systems calculations are performed once, it isnot necessary to do them again if only targets and atmospheres are changed. The opti-mized deck structure described here allows the program to b) pass systems calculationsafter they have beer executed once. The advantages are twofold. The program runsmuch more efficiently, saving considerable computer time. Additionally, the user onlyhas to check one set of cards that define his system parameters. This latter point canbe very helpful at times when unexpected results appear.
B. Changing System Parameters.
All multiple-run decks conform to the underlying principle that you only have toconsider the cards that change from )ne- run to the next. The program retains all other
defined quantities. Figure D3 shows how you would go about applying this principlewhen you wish to change system parameters. Two runs can be made with this deck.but in practice there is no limit to the number that can be made with a deck of this type.
The deck shown in Figure D3 can be viewed as divided into two sections. Bothhave the structure of a smple deck. Each section may have a set of FORI formattedcards and a set of FOR2 fj.rmatted cards. Every set of FORI formattedl cards is pre-ceded by a FORI card and followed by an ENDS card. Likewise, every set of FOR2formatted cards is prefaced by a FOR2 card and terminated with an ENDS card. Allsections are separated by an additional ENDS card. The DONE card appears after thelast ENDS card.
Figure D3 shows the number 1 appearing hi column ' 1 of the DONE card. Thisnumber 1 signals the program to do the second systems calculation. To explain when
the number 1 is used, we are required to look at the deck structure again. In any deck,a second ENDS card or a DONE card tells the program that all of the data for a particu-lar run has been read and that the program should begin executing the computations.In other words, the second ENDS card or the DONE card must be seen as the last cardread for a particular run. We must associate the second ENDS card in Figure D3 withthe first execution of the program and the DONE card with the second exec!,tion ofthe prtigram. The number 1 in column 11 tells the program that system calculations
133

need to be performed on the second run.
The implications of this are clear. A second ENDS card must be viewed as doingmore that) just telling the program that there will be more data for another run coming.In a similar manner, the DONE card does more than tell the program that there will beno more inputs. It is thus natural to find options on the DONE card that pertain to thedata jvust read. The same options apply to the second ENDS card. Let us imagine thatwe are putting together a deck to do three sets of systems calculations. There would bethree sections to this deck. Each section would be separated by an additional ENDScard. Now, since we wish to do systems calculations in each run, the number 1 is alsorequired in column 11 of each second ENDS card and the DONE card. The programautomatically does a systems calculation for the first complete data set in any deck,however. Thus, the number 1 does not need to appear on the ENDS card between thefirst and second sections of this deck. This is also the reason why a number I does notappear on the DONE card in Figure D1 and on the second ENDS card in Figure D2.
To summarize, u.s a number 1 it column 11 of a second ENDS or DONE cardwhen multiple systems calculations are required from the same rin. Failure to observethis rule anywhere except on the second ENDS card following the first complete set ofdata will cause incorrect calculations to be performed. Do not worry about this featureif you are only changiag targets or atmospheres.
Returning to Figure D3, we note that the secood set of FORI and FOR2 format-ted cards are only those cards which have been changed from the first run. All othernecessary information is just carried over from thc first run to the second. Rememberthat if you change the card BAND it must come right aitei the FORI card. Target andatmosphere cards can be changed just like any of the others.
It is quite possible that all of the system changes that you wish to make are of theFORI format. In this case, just leave out the set of FOR2 cards. If there are no cardswith a FOR1 format, do not include a set of FORI cards.
Decks can be set up to efficiently do calculations when the user desires to varyboth system parameters and targets o. atmospheres. An example will help to illustrate.Let us aaime that we wish to analyze two systems against three targets. We could setup six decks fike in Figure D 1. We could also set up two decks according to Figure D2} • and run multiple targets on each. But we can set up on? dleck by ucing Figure D3. We,
do this very efficiently by working with two decks formed according to Figure D2.First, "e re•nuve all the control cards. We replace one of the DONE cards with anENDS card. In the other deck, we place a number 1 in colunm 11 of the second ENDScard following that part of the deck which redefines the system parameters. We puc. thisdeck behind the other and put control cards back at the beginning and at the end of the
134
L• ('--
deck. This is a mixed, multiple-run deck that combines the best features illustrated inFigures D2 and D3. There is only one special ENDS card because there is really onlyone change in system parameters. The versatility of the multiple.run option containedwithin this program should now he apparent.
One final note should be made with regard to changing system parameters. Witha bit of experience, the user will find it relatively easy io manipulate the input variablesof this program. It is easy to change a system variable using the multiple-run feature.But the variation Lf system parameters cannot be made without continually keeping inmind the realizable values of thesc variables and the impact that variations have on othersystem inputs. So use this option carefully in conjunction with the information con-tained in the supplements.
V. An Example
In this section, we will apply the methods and formalism thus far dei eloped to apractical problem. Let us assume that we wish to predict the performance of a certainprototype system. Our system will operate in the 8-14 micrometer region and have aCRT display. Specifications that might be commonly available are shown in Table D4.With this information, we wish to use the NVL Static Performance Model for Thermal
Viewing Systeme to predict the system MTF, the NEAT, the MRT, the MDT. and theprobabilities of detection and recognition. How this t1ane follows.
A. The Simple Input Deck.
Figure DI shows the basic form of the deck that we will'be setting up. In this ex-ample, we will include for completeness all of the cards listed in Table D2, even thougha careful recding of this documentation will reveal that some of these cards can be leftout. The cards that can be left out are those whose inputs are identical to the defaultvalues listed in colhnun 7 of Table D2. Figures D4 arid D5 show a chart of all the cardsthat a simple deck can contain. The appropriate input cards can be directly keypunchedfrom this ,•hart when it is filled out. We shall now systematically go through Table D2,card by card, in order to demonstrate how we have used the data in Table D4 to obtainthe entries for Figures D4 and D5. Consult the supplements when any of the followipgexplanations appear incomplete.
The operating bandwidth of the system is 8-14 micrometers, and it is these num-bers that appear for WAVE3 and WAVE2.
135
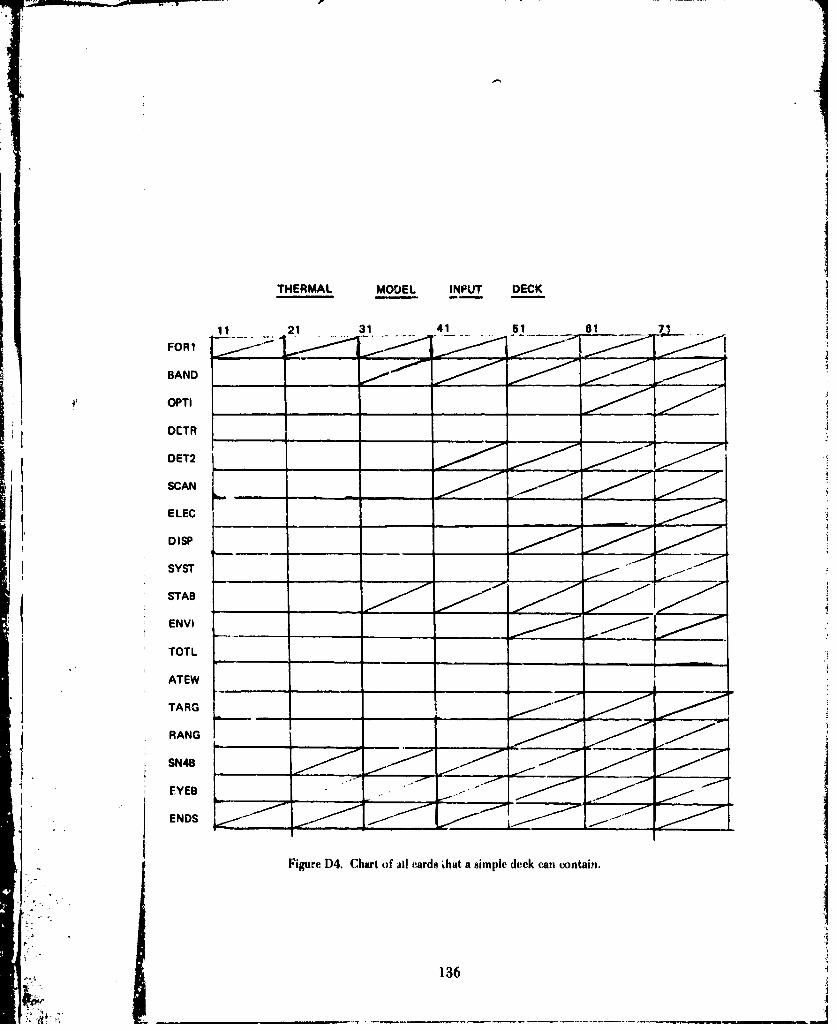
THERMAL MODEL INPUT DECK
21 _ 31 41 51_ 61
FORI
BAND _ _-
OPTI
DCTR
DET2 ____
[i SCANELEC
DISP-
SYST
STAB-;
ENVI
TOTL
ATEW
TARG
RANG
SN48
EYE-
ENDS _____
Figure D4. Chart of al1 cards ihat a simple deck can contain.
136
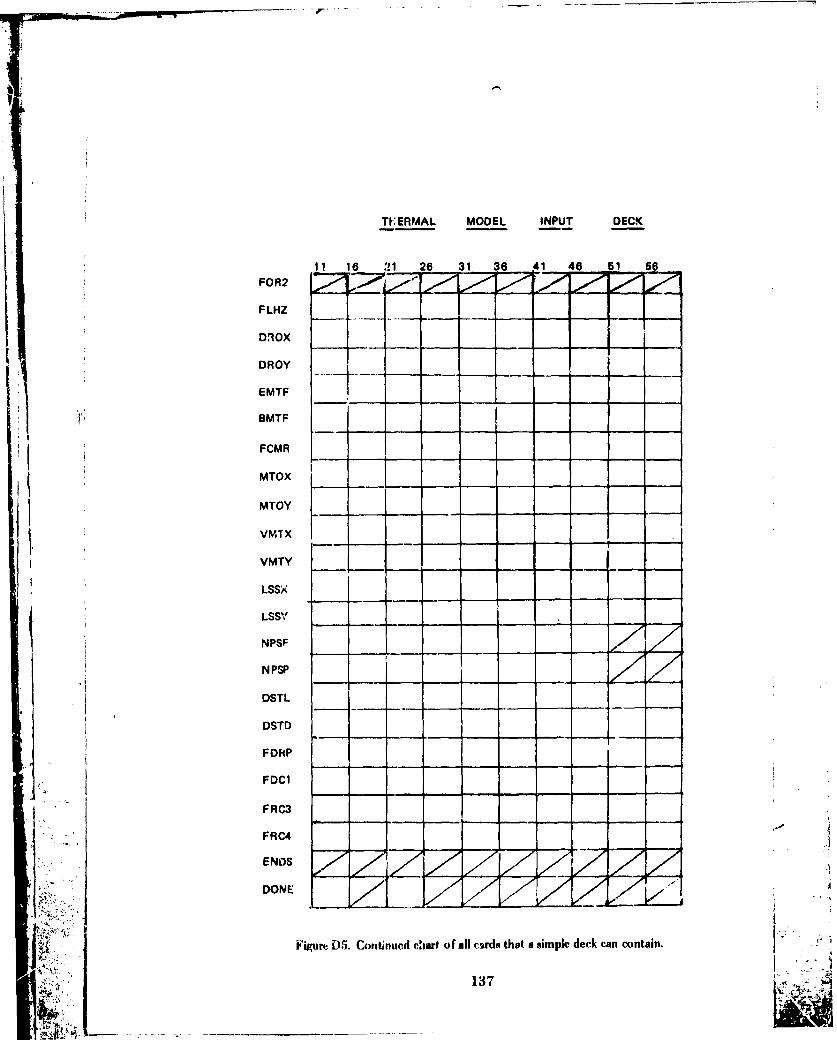
TI-VERMAL MODEL INPUT DECK
11 16 21 26 31 36 1 46 51 56FOR2 - -
FLHZ
DROX
DROY
EMTF
BMTF
FCMR
; ~MTOXit '
MTOY
1VM, TX
VMTY
LSSX
LSSY
NPSF DST z --DSTL
DSTD
FDRP
FDC1
FRC3
FRC4
ENDS
DONE - --
Figure D5. Contlnucd ciaarf of all curds that a simple deck can contain.
137
I:l •
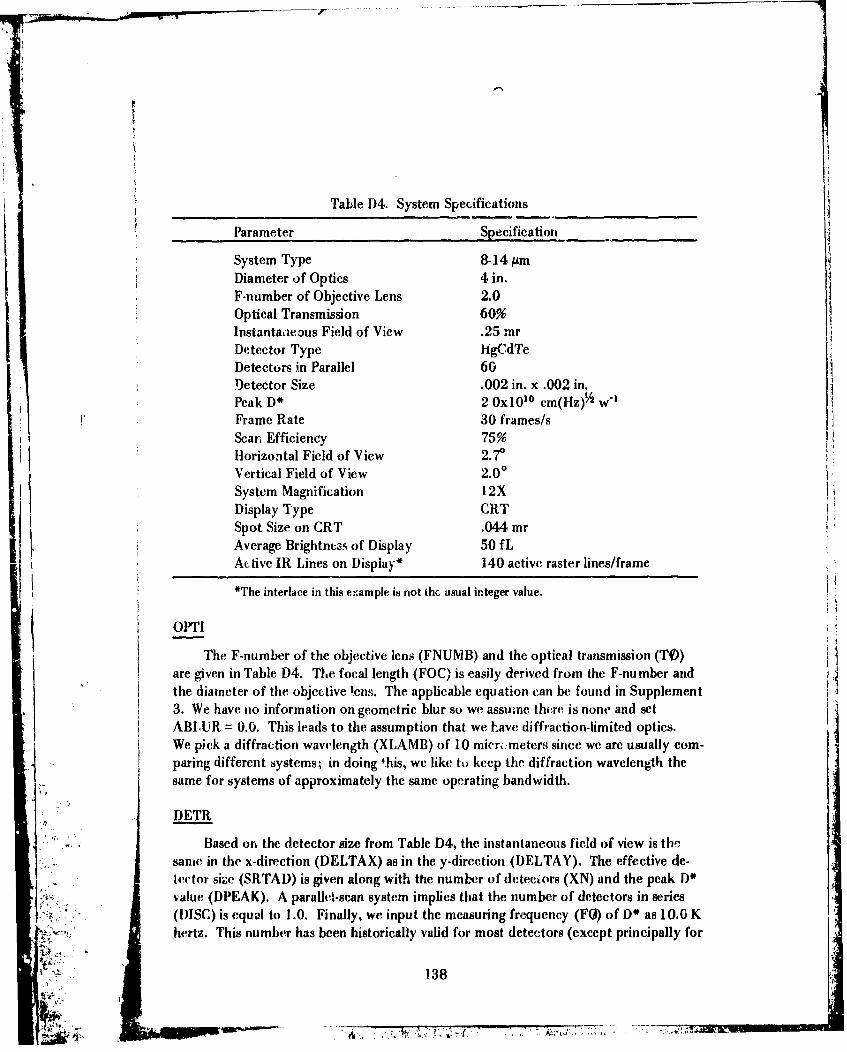
Table D4. System Specifications_________h
Parameter Specification
System Type 8-14 prmDiameter of Optics 4 in.F-number of Objective Lens 2.0Optical Transsmission 60%
Instantaneous Field of View .25 mrDetector Type HgCdTeDetectors in Parallel 6GDetector Size .002 in. x .002 in.Peak D* 2 OxlO' 0 cm(Hz)11 w"
Frame Rate 30 frames/s
HorzotalFildof View 27
VriaFilofView 2.00
System Magnification 12XDisplay Type CRTSpot Size on CRT .044 mrAverage IBrightntz.- of Display 50 fLActive IR Lines on Display* 140 active raster lines/frame
*The interlace in this example is not the usual irteger value.
aeThe F-number of the objective lens (FNUMB) and the optical transmission (TO)gie ven in Table D4. The focal length (FOC) is easily derived from the F-nu mber and
the diameter of the objective 1ens. The applicable equation. can be found in Supplement3. We have no information on geometric blur so we assume thture is none and setABLUR = 0.0. This leads to the assumption that we have diffraction-limited optics.
We pick a diffraction wavelength (XLAMI3) of 10 micrý-meters since we are usually com-paring different systems; in doing *his, we like to keep the diffraction wavelength thesame for systems of approximately the same operating bandwidth.
DETR
Based on the detector size from Table D4, the instantaneous field of view is th'csanme in the x-direction (DELTAX) as in the y-direction (DELTAY). The effective de-Iector size' (SRTAD) is given along with the number of deteciors (XN) and the peak l)*value (DPEAK). A paralleci-scan system implies that the number of detectors in series(DISC) is equal to 1.0. Finally, we input the measuring frequency (FO) of D* as 10.0 Khertz. This number has been historically valid for most detectors (except principally for
138

A''1
the low-performance detectors such as PbS), and lacking other information we chose. it.
DET2We will assume that our system is fletector-noisc-limited and thus MOM = 0.0.
Under a detector-noise-limited condition, the cold shield angle (ANGLE) is not used,
and we have arbitrarily assigned it the value of 60.0 degrees.
The HgCdTe d,'Iector is generally considered of high performance. In addition, aparallel array of these detectors indicates that the dwell time on each detector is rela-tively long. Therefore, in this example, we do not worry about the detector responserolling off before we have transferred a maximum amount of information. The band-width of this system is determined by the electronics arid is approximated by usingequations (22) and (23) in the main body of the report.. For our prototype sydem, theminimum required electronic bandwidth is computed to be 8,770 hertz. Since the roll-off of the detector response is negligible compared to the information rate bandwidthfrom the detector, an arbitrarily large number is used for FSTAR (a megahertz).
SCAN
The frame rate (FR) and the overall scan efficiency (XNSC) are given in Table D4.The overscan ratio is computed from the equation noted in Supplement 4 and comesout to 1.0.
S~ELECThe low-frequency 3-dB point (CUTOFF) ass;ociated with the electronics is not
given. It frequently is found to range between 9 and 7 hertz. We will choose 3 hertz.Weia are also not given any information on the high..:,requency amplifier 3-dB poin. Wewill ass-, n that our electronics am' of sufficient bandwidth such that they do not de-grade. Th-refore, we set FELECT equal to 0.0 so we can read in an electronics MTFwhi• w*,,i! set e i to 1.0. There qre no LED's in the sy3tem so their widths (XY)arkj 'Ihs (XU L) are all 0.0. Since there is no electronic boost in the system, theelectrr,~ic aperture corrcction amplitude (XK) and the electronic aperture correctionfrequency (FMAXF) are set to values of 0.0.
DISP
"The system has a CRT display so that KKK = 0.0. The average brightness (BRITE)on the display is given as 50.0 fL. In order to assign values to XA and YA, the two vari-ables associated with the spot -7e, several assumptions must be made. We will assume"that the spot -i n in ?Y. ,that it is symmetrical about the x and y axes, that ithas been measured by the inrinking raster method, and that the spot size quoted inTable D4 is the length w in Supplement 3 under 3.3, ABLUR, (4) (a). (See Supplement
139

•i•~-•'" ..j , - , - _________r____--________
• II
7 for further explanation.) The values for XA and YA can now be computed directly:(XA - YA = 0.019 mrad2 ).
SYST
The horizontal field of view (HFOV), the vertical field of view (VFOV), and thesystem magnification (XMAG) are taken directly from Table D4. Our system only hasone field of view; so FACT - 1.0. We wish to predict the NEAT; so XNET = 0.0.
STAB
There is no indicated degradation due to vibration; so XSIGLS z= YSIGLS = 0.0.
ENVI
We will predict performance through an atmosphere with an air temperature(AIRTMP) of 150 C, a relative humidity (RH) of 50%, and a visibility range (RVIS) of23.0 kilometers. This clear atmosphere requires the special atmospheric condition des-ignator (ISTATE) to be equal to 0.0.
TARG
We will choose a hot tank target whose length (XLTAR) is 5.25 meters, whosewidth (XHTAR) is 2.7 meters, and whose temperature (DETEMP) is 11.1' C abovethe background temperature (TBAC) of 12.00 C. The tank dimensions are discussedin Supplemen 1. The target and the backg,"und parameters are the default values.
RANG
Supplement 1.3 indicates that if we have a detector-limited system, the 50% prob-ability of detection will occur at a maximum of 10,800 meters and the 50% proabilityof recogitition will be at a maximum of 2,700 meters. In an attempt to calculate mostof the detection and recognition probability distributions, we chose the detection cal-culations to be performed between 2,000 meters (IRDIN) and 20,000 meters (IRDAX).The recognition calculations will be done between 1,000 meters (IRMIN) and 10,000meters (IRMAX).
SN4B
For the threshold signal-to-noise ratio (SNR), we use the default value of 2.25.
EYEB
For the integration time of the eye (EYETM), we use the default value of 0.2.
"140

FLHZ
We use the default values for frequencies in log hertz corresponding to the MTF'sof the electronics, the boost, and the letector temporal response. IDROX
Since we have already determined that the detector will have sufficient time torespond to an incident signal, we do not expect any associated detector MTF degrada-tion. Consequently, we set this MTF in the x direction equal to 1.0.
DROYThe MTF in the y direction due to detector temporal response is 1.0 for the same
reason as it is in the x direction.
EMTF
We have already decided that the MTF due to the electronics will be consideredi as1.0. We enter this on the card at all frequencies.
BMTF
We have no electronic boost in this system so the MTF on this card is unity.
FCMR
We use the default values for frequencies in cycles/mrad corresponding to theMTF's of the optics, the vidicon, and any unstabilizing factors.
MTOX
Our system is diffraction limited, so we must set all MTF values for the x directionequal to 0.0.
MTOY_.
All MTF values in the y direction are set equal to 0.0 for the same reason as thosein the x direction.
VMTX
There is no vidicon in the system so the MTF at all frequencies is equal to 1.0 inthe x direction.
141S...... T7T TA17,

r"
VMTY
Similarly, the MTF at all frequencies for the vidicon in the y direction is equal to1.0.
LSSX
We input the default values of 1.0 for the stabilization MTF in the x directionsince we have assumed no vibration.
LSSY
SAs on LSSX, the MTF for stabilization in the y direction is 1.0.
NPSF
These are the frequencies in log hertz that correspond to the noise power spt'ctrumon NPSP.
NPSP
No noise power spectrum is given for the detector. It must be obtained from pub.It lished material on detectors or from direct measurement. We have chosen a representa-
tive noise power spectrum of flgCdTe and normalized it tc, 1.0 at frequency Ph for thisexaimiple.
DSTL
DThese are the wavelengths in micrometers that correspond to the D" values on
DSTD.
DSTD
No detector performance curve is given in Table D4. This also must be determinedfrom published material or from direct mcisurement. Note that in using any of thestandard curves, they must bz normalized to a mnaximum of 1.0. We use here a typicalD* curve for HgCdTe.
FDRP
We will predict the probability of dete ion and recognition using the validationupon which this program is based. Conscqu intly, this card, as well as the next three,
C. will contain the default values found in Table D2. This card shows a set of probabilities.
142 .4
4X
II
FDCI
The number of cycles needed for detection at various probabilities of detectioncan be lourid on this card. The probabilities are those on FDRP.
F'RC3
The number of cycles needed for optimistic recognition at various probabilities ofrecognition can be found on this card. The probabilities are those on FDRP.
FRC4
The number of cycles needed for conservative recognition at various probabilitiesof recognition can be found on this card. The probabilities are those on FDRP.
[I The FRC4 card is the last input data card. We have now assigned values to all ofthe input variables. The simple deck we have just generated is illusti-ated iv, Figures D6[ !and 1)7. It is complete with the addition of a DONE card after the last card in FigureD7. This input deck quantifies the system described in Table D4. In general, errorswill occasionally be made in the preparation of a data deck. Many of these mistakescan be caught by carefully scrutinizing the first five tables in the output listing of anyrin. These tables reproduce an easily readable listing of the input quantities. For our
I example, Tables D5(a)-D5(e) were generated. It is easy and necessary to always checkSto validate the accuracy of the inputs.
B. Output Listings.
'1 here are essentially two types of output listings that can be obtained irom themodel. Tables D6(a)-D6(e) show the program output for the simple input deck thathas so far been described. The individual modulation transfer functions that must beconsidered in the x direction can be found in Table D6(a). These transfer ;unctionscorrespond to the diffraction limit of the optics (OPTICS), the geometrical blur of theoptics (GOBLUR), the spatial transfer aspects of the detector (DETEC), the temporalaspects of the detector (RSPNS), the electronics (ELECT), the electronic boost (BOOST),the vidicon (VIDCN), any LED arrays (LED), the display (DSPLY), the degradation dueto the destabilization (LOS), and the eye (EYE). Table D6(a) is in spatial frequency andcan only correspond to Table D5(d) for the inputs given in spatial frequency. All otherMTF's in Table D6(a) have been either converted to spatial frequency space or calcu-lated. The overall system MTF in the x directicn is shown ir 'fable D6(b). Table D6(c)displays the predicted minimum resolvable temperature in the x direction for our syst:'n.Finally, the eypected power-based detection and recognition performance proLabiliticsin the x direction appear in Tables D6(d) and D6(e). Since there is only one field ofview for the system, the two performance predictions in Table D6(d) are identical.
143
-, • . . -. ... . . . . . .. .. . . .

,• I D • , , , i l , i I l i I I t I i I Ii I I'END i . .. .. . . ....VEYE~
,RAMP A 0 0P . 100,00. 1 1 o ---. I- -00 00.-ITLR P, 7 , , 0.01 12.,o 00 , ,SIRAR 1p , 1.0 ,, I ." . .. .
,STAP , 0. o, .0 .. :. . .. .,•vs • .7, 0, .o, ,e., t ,. o, ,I o o,'.0,0 0t
ELE I iP0 0* t I I I i ,
t A I P o . , ,7 5 , , , 0. , , ,I I - I I I ,.ET .60,I .. 0.0. , O . , I, I I I I I C
-: ,l~tX T! ,25, 1 ,25, , 60., ,,.0, ..1 0, , .O,, .1 ,,OPT 8. O, ,O, .,0. , '..
:. .,.. . . . . . .n .r i .rO. ,, , , , , , .
,,,• ,,! ,,,,,, ,,, ,I, ,,, ,,, , n, , ,W , , ,,, ,, ,,, ,I,, , ,,,, W, mill a,, ,, , ; lo
I 4,, I l4,4 , ,4 4•i 1 41 1*1111 1
I I I I I I LI l 'l I Ia oi l .ll 10 it I 41 t a it a I N
*osilil ol solll gg illg~ ISOlit l jil AlI)I ililll Iull oa IIS IS
ll~lll~ll~lllllllllll~ll llllill 911 1111 1 l l~ll~l~ l11la l1l1l ll Itol 11 to Mlll
A41 .4 4 *I 1 1
Figure D6. A simple deck.
4 i"4..".
144
Tk,-T 7-

I~• i i i I I j , I I I I I, L I( L,RC4, I1., 50. 20. 12. 8.0 6.0 4.0 3.0 2.0 1.0 0.0
,RC 3?.5 15. 9.0, 6.0,4.5 3. 0 2.2515,? 0.,II,rF cA , A2.• % , , 3. o ,. n1. 1~' . 5,o. .75, 0.3 " ' '11. 5, -.0, 2,.0 1.5 l1, 0 . .?ý, 0..5 .2q, 0.0
,FDRP .J.0, 1., 1.0, .9 ,0.e 0.5 ,0.3, ,.1 0.0 IDSTp ,e.4C, . 7', ., .80 88 ' ,.o .,97 ,90o, 0.0D T- , 3.0, .. . . 11., . , 12.5 1,3. 13.P 1-4. ' ..,4Sp P2., 16. 4.0, 2.25.1.0 1.i 1.0 11.0 1 1 ,0.001 .0IIPsF , o.o, f,.0 0'•. 0,•- .3 4,.0'*0 65 .0 ,o.o1 0.0. 0 ",LSSY j.0, 1,0,.0, 1.0 ,.0 0, ,0, I,.0 1.0, .... ., 1.0, 1,, ,., 1.0 .1 .0 1.0 . .0, 1. 0 . 1.0. 1.0
,VMTY , ,1.0, 1.0 ,1.0, 1,10 1.0, 1.0 1.0, 1.0, 1.01 1,.0,MTOY I 0 I I, I 0 ,. I i I I 1.1'0.0, 0,0 ,0.0, 0,0 ,0.0 0.0 ,'0.0. 1,.0 ,0.0,. . ..
,MTr O 10 ,.0 , 10, 1.0 0 ,.0 10.0 ,.0.0, 1'.0 , I I I I I *I~~MTF 0.0, 1.0 4.0, 13 ~1 , 1 110 ~40 101 III
,lc•? '0 5,~o 5. 4•o o , . 0, , o ,4., 5,.0 , 6.0, 7.o0. . . .,MTr .1.0. 1,0 4. 110 L'., 1CA .0 ., 1'.0 ,1.0, 1.0 .. . . .. ..:,MTF l I• o F, 0 .o, it ,It., • o ,it .o1 I o 0 .o0, 1,.o'0,D R O Y ' , 0 , t , 0 ,1 . 0 , 1 • o ,1 . 0 , i , 0 . O. , 1 '. 0 ,z , 0 , '
.DREP .0 1,0 b., 110 .10 1 1.0. 10 10. n 1.0,LH. p.O, . l .1, 0.. 1,03. 0 P. 0.6, 0'. 1 1.0, 1,0.A ,III ý, e V ' ,M 67 , ,1 -.4,
II M. I I 11 1 P, I lt NA 1; 1? V 1.- 11111, iM 1I 11111 111
3333333333333333333 33313 33,3I;33111114111111, 4 j4 444444 4441441444414 44444 44k4444 44444444444 44444 4~444444 444,4444,444
ii -
6C- 6 6 6. 616 66,66 6S 56 6 6 6 S5.1.jli 6 $6e 6 wC -NIF TI4RE ~ R*..
of illoll lollIItscm if fl ip I oil 5 s s~ 111,1 q11 oi 19 11 1
I ~Figure [ 7. Continutiation of a simple deck.
.3A5
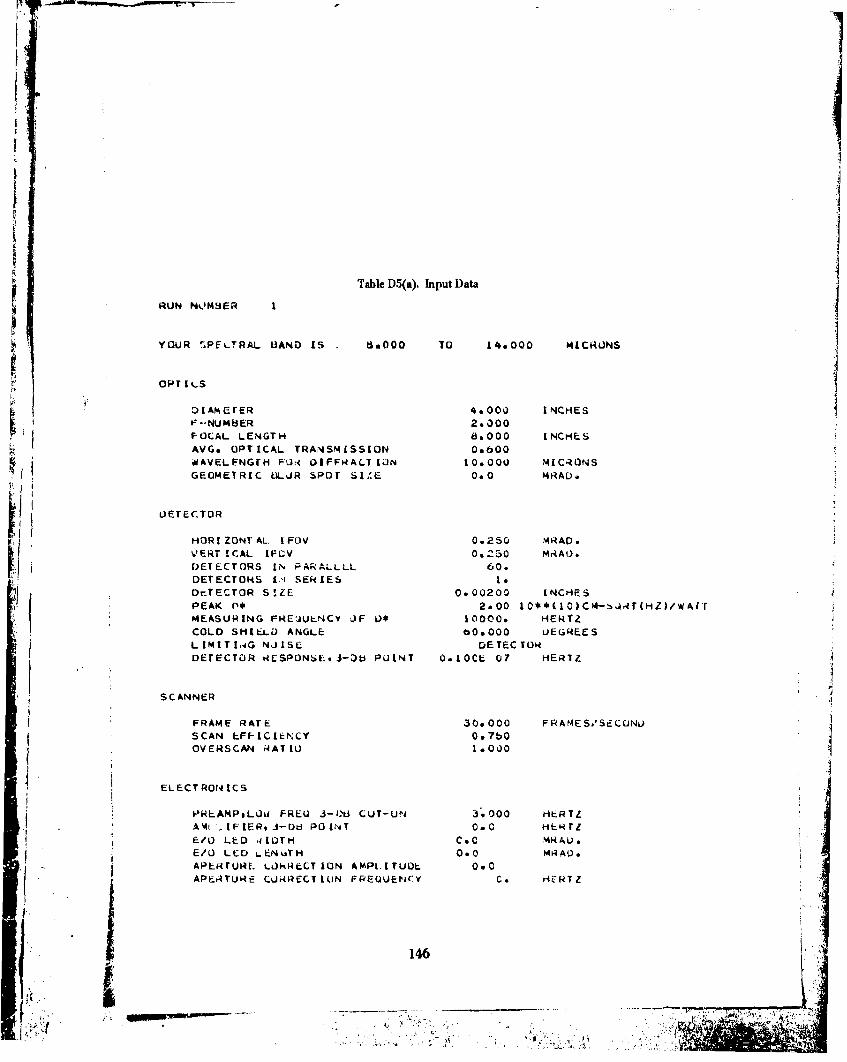
Table D5(a). Input Data
RUN NO.MBER I
YOUR "PF%-TRAL 13AND 1S 86000 70 14*000 MLCRLUNS
OPDIAMAETER 4*000 INCHES
F--NUMBER 2.000FOCAL LENGTH 8.000 INCHES .
AVG. OPTICAL TRANSMISSION 0.600WAVELFNGTH FLI~ OIFiekACTIZON 10.000 MtICR~ONS
GEOMETRIC h3LJR SPOT SIZE 0.0 MRAD.
L)ETECTOR
CHORIZONTAL- IFOV 0.250 MR~AD.I!DETECTORS IN PARALLLL 60.DETECTOkS I-,! SEkIES IDi-JECTOR S!ZE 0.00200 INCHESPEAK P* 2.00 IC**( I0)C*4-..jT(lZ)/WA(fri:fMEASURING FRNWUENCV .F U* 10000. HERTZCOLD SHIELLD ANGLE fbOs000 LEGREESLIMITI.,G NJISL DETECTORDETECTOR RSPON4E,,,i-,) PUINT 0,10CL 07 HERTZ
SCANNER
FRAME RATE 30.000 FRAMES.ISECC2NLSCAN EFF-ICIENLY 0.7b0OVERSCAN kATIJ 1000
ELECTRONICS
P-RHAMPoL0OI FREU 3-LIt3 CUT-UNA 3*.000 HERTZAW .IFIER93-06d POINT 0.0 HFERTZE/O LED .410TH C.0 MRAU9E/O LLD i-EN-.sTH 0.0 MRA~o
APEi~rURf. LJNRECT ION AMPLITUDL 0#0APE.PTURE CURECT EUN FREQUENCY co HERTZ
114
A, . . ,K_ _ _ _ _ _ _ _ _A
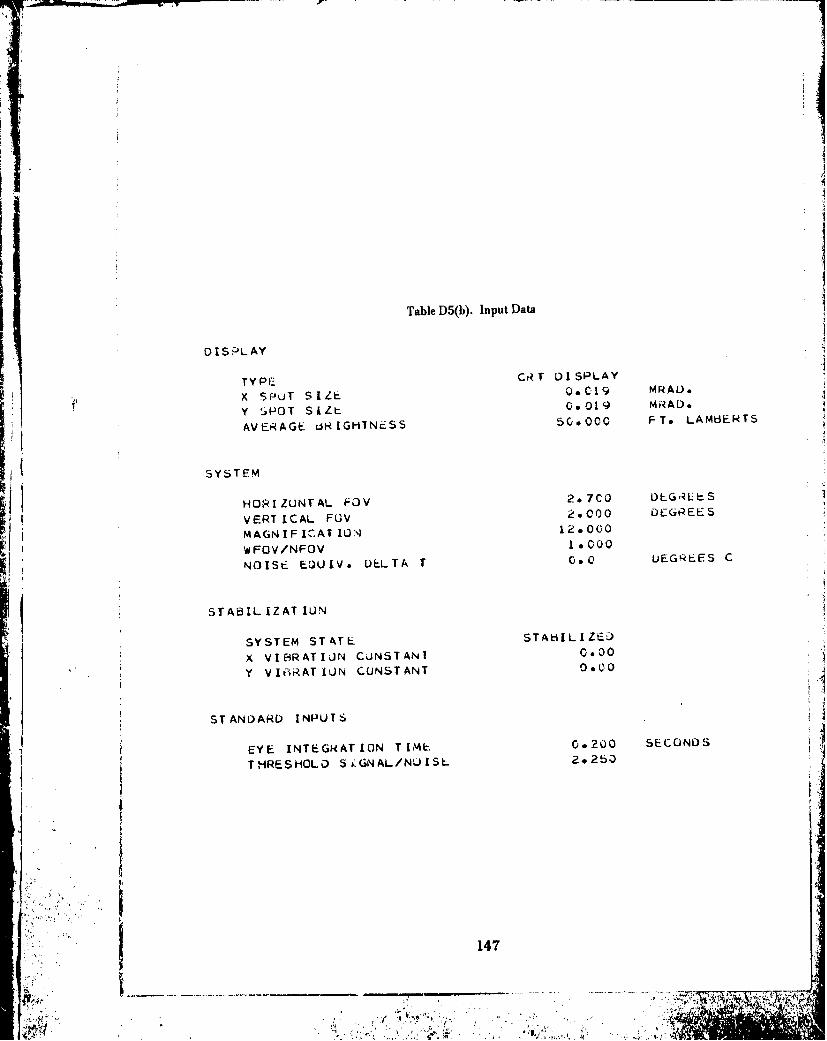
Table D5(b). Input Data
DISPLAY
TYPE CRT DISPLAY
X SPUT SIZE OsC'19 MRAO.
Y SPOT SIZL- 0.0l0 MRAD.
AVERAGE LSN[GH-NESS 50.000 FT. LAMBEkTS
V SYSTEM
HORIZUNTAL FOV 2.7C0 ULGRLES
VERTICAL FOV 2*000 DEGREES
MAGN I F ICAT I[UN 12o000
WFOV/NFOV 10000
NOISE E)UIV, DELTA T 0.,0 UEGQLES C
STABILIZAT IUN
SYSTEM STATE STABILIZED
X VIE4RATIJN CjNSTANT 0.30
Y VIRAT ION CUNSTANT 0.CO
STAND)ARD INPUTS
EYE INTEGRATION TiME 0,200 SECONDS
STHRESHOLD S.GNAL/NUISL 2.2b0
41 4
.':••, '147
.. --,----.-.-------- .,_______

Table D5(c). Input Data
ATMIJSPH~iý-C PA,-AMFTLxk.,
C UN L) IT I.-'.N CLL: AR
V 15 1 IL~r I Y A;'dCL 2,3 o J K IL LJ;AC-T&FRFPELAT IVE HUM1IIUIY b' 0C EEN T
AIR~ TEMPE,-.AT'JxE-' 15.* C, L L 5~ C
T ARGET & r3CK~-<)UI'JL)
T AkGET L cNGT o: 2 L) MLTL;TAR( LT ovILurril ý. 4 L :
TAPGET O)-LTAT 1 11.1C, U i-jL.,;0:ES CII HACKGROUNO 1WE¶P&.AT~itL L 2.Zo.C'C 0r i~GN '-Z m C
MAX. fkEOJ1vt~j C .i A'4(jL" ttJj( -ýr-UG* 1, 7I I - -
MAX(. PF,,JU r~nJ rýA)46tL Ftrk UL tTiFC ?Cc~ it) I~
148

0 C 0 0 N)0I3 ~C
II -l C
I . .o0 I30 0 0 3i 0 '3 C
tm 00 0 0 Q L, 000 0 '3
5 * 050 0- 0 ft0 0 0 0 0 0 0T
IL1 U5~ C . - V- 0 0
I I *% f.1 - 0 u Z otC3u I IL ~ -4 1-1.
jI 00. Ng N3~ 0 w l
ix 00W. I 000 0 oi *n05 000 05 000000M o 0 0 0i U
05 di a1 W0- 0 a -C 0 i 1
1%U j0I 1 0, a. -x c
tL~~~ I Wi ¶r .1 0a2,> AL L W A
149
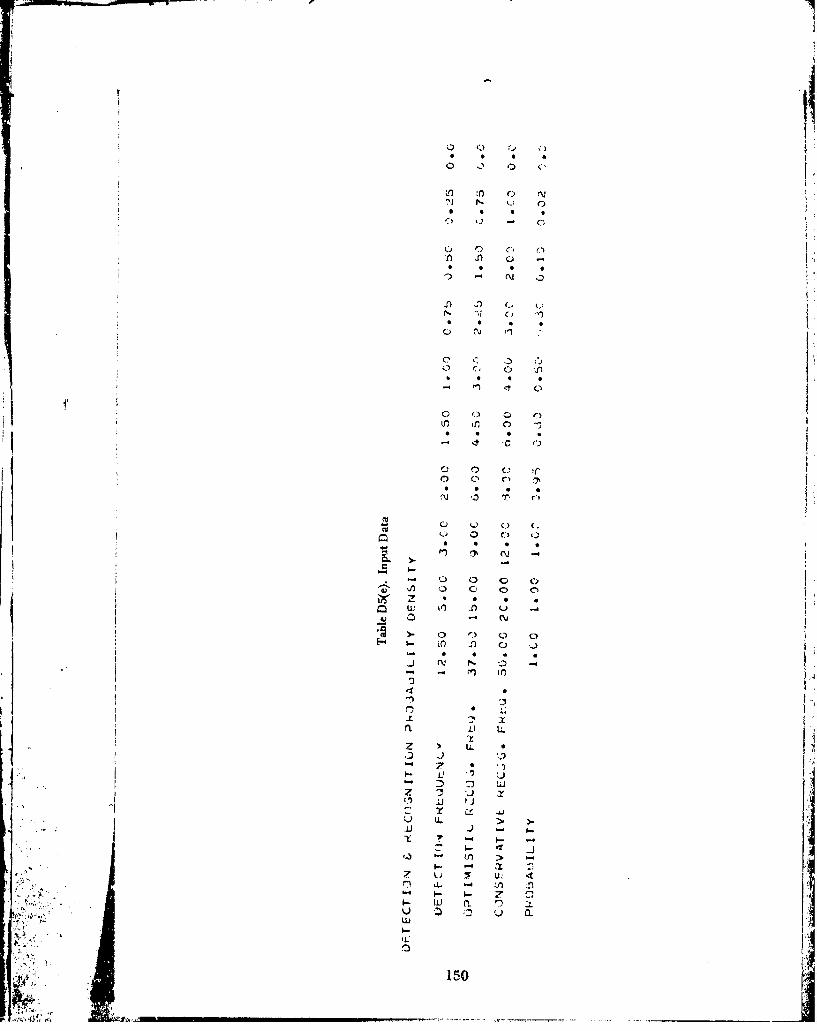
404
!) 0f C)
" j U, C
0 0
LO - ~ . .~
X
10'214 ( *

w 0 0 44 Q o 0 (a CO JD 30j M) N N . N9 f0 It 0~~0 0 10 9 0 0 10 10 10 0'
uI-0 0 0 a 0 0 0 eU a a 0 0 1.) 0 Q 0 0 QJ 0
o00 0 0 0 0) 0 0 0 0 0 C) 0 0 () 0 Q 0 00 o f 0 a 0 0 V 0 0 0 0 0 0 0 0 0 0 0 0 0
o . ) o 0 9 9 9k 9ý ON ON 9 m 0 V .0 M
~~~.~ 0 ~ 0 0 0 - 0 0 'a a o ' 0 0 0 0' 0' 0 0 a0 C.0 £ 0 1
0 9 a 9 0 9 0 0 0 * 9j 9 S 9
0 .0 0, 0 0 0 00 0 0 0 0 0 a 0
o - 00000 0 .0 0 U1 0 0 0 c C,
o 0 0 0 0 a c. a 0 0 0
'AU0 0000 0 0 0 0 000 JU0C0 000 00~- 0 .00000
oUN00000 0 0 0 o 0 0 0 0 0
CU0 0000000 0 0 0 0 0 0 0 0 0 0 0 a 0 0
N000000000 0 0 0 0 0 0 0 0 0 0 0
ww 0 -4i
'4 i00 0 0 0 0 0 0 0 0 0 0 0 0 0 0 0 0 0 0
U0 0 a 0 a ' 0 0 0 0 0 0 0 U 0 a
4 o 0 0 0 . **0N~N'0 ' AI
151

Table D6(b). Output Data
SYSTEM MODULArION TRANSFER FUNCTIONFREG X MTF
0.0 i.00
0020,0.97
0.40 0.93
0*60 0089
0.80 0.83
1.00 0*.77
1.20 0.7.1
1.40 C.84
1.60 0.bb
2.40 0.31
2,- 0.26
2.80 0.21
3.00 0016
3,*0 0.12
3.60 0.05
3.80 0.02
152
....................................7
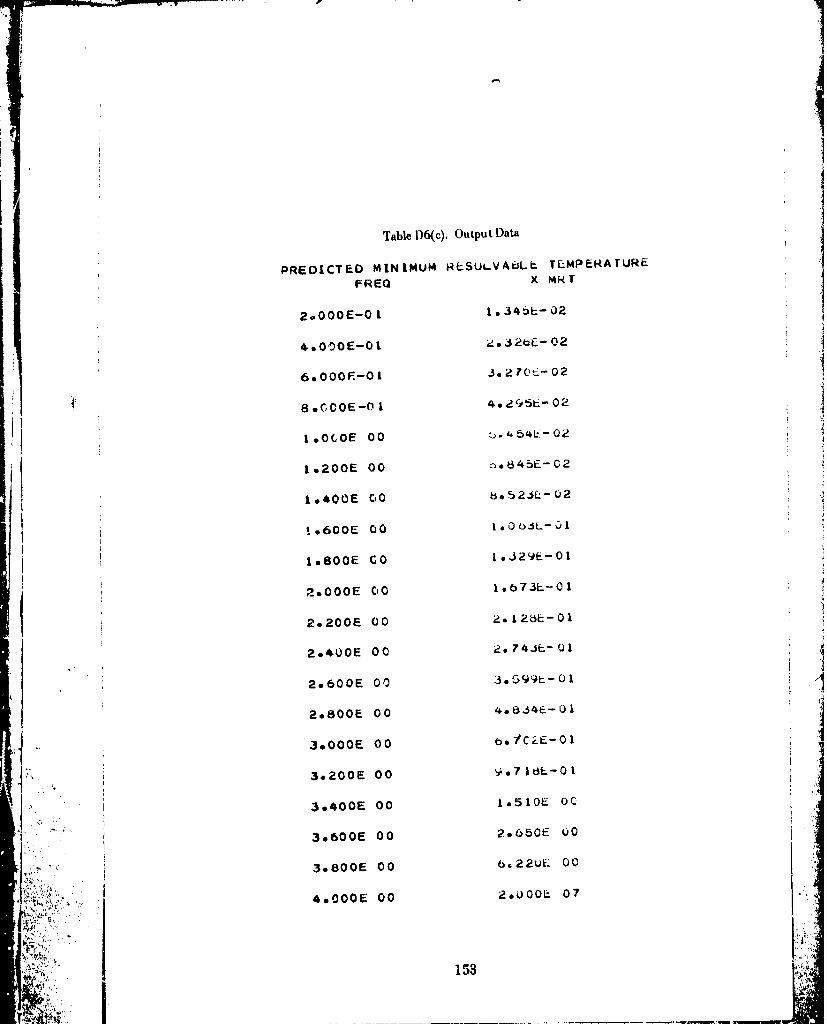
Table D6(c). Outpu t Data
PREDICTED MINIMUM RLSULVAtaLL TU,4PEH.ArUREFREQ X MRT
2o000E-01 3±.i!h- 02
6sOOOF.-0I .302 7c"-:02
8*(C O0E -0 1 *e7t 0
190O0E 00 0
1o200E 00 -t.*345E-C2
I.400E 0C8 5-.2i$L- U2
!9.600E 00 1 .0ObL- Q1
i.800E GO 1.J29E-01
2*OOOE Co0 lob73L-01
2.200E 00 201 26E- 01
2.4UOE 00 .41-O
29600E 00 '
2*800E 00 4.b.34E-0I
30OOOE 00 ia-O
3s2OOE 00 *.7 IdL-0 I
3*400E 00 Is5I0E OC
3*600E 00 2*650E 00
3o800E 00 b,22UEL 00
4.O0OE 00 2.0)00L 07
153

Irr
Table D6(d). Output Dat:DELTA T= O*tIIE 02DETECTION PEHFUFRMANCE
NFOV PERFORMANCLRANGE T RANSM I SS1ON x DETECTION
PR08BA ILI[TY
2o30 0.66 lo00
4.00 0.51
6.00 0.40 0.85
8.00 0*32 0.b3
10.00 0*26 0.46
12.00 0.21 0.31
14.00 0*17 0*2C
16.00 0. 14 012
18.00 0.12 0.08
20*00 Go.10 0.06WFOV PERFORMANCE
RANGE TRANSM I;,510N x DETECTIONPRO8A6 1L ITY
2.00 O.60 1.co
S4*00 0051 0 .98
6.00 0.40 Ob5
8.00 0.32 0.63
"10.00 0.26 0.4t)
"12.00 0.21 0.31
14o00 0.17 0.20
16w,00 0.14 0*12
s- 18.00 0.12 0.08
20.00 0.10 0.06
154
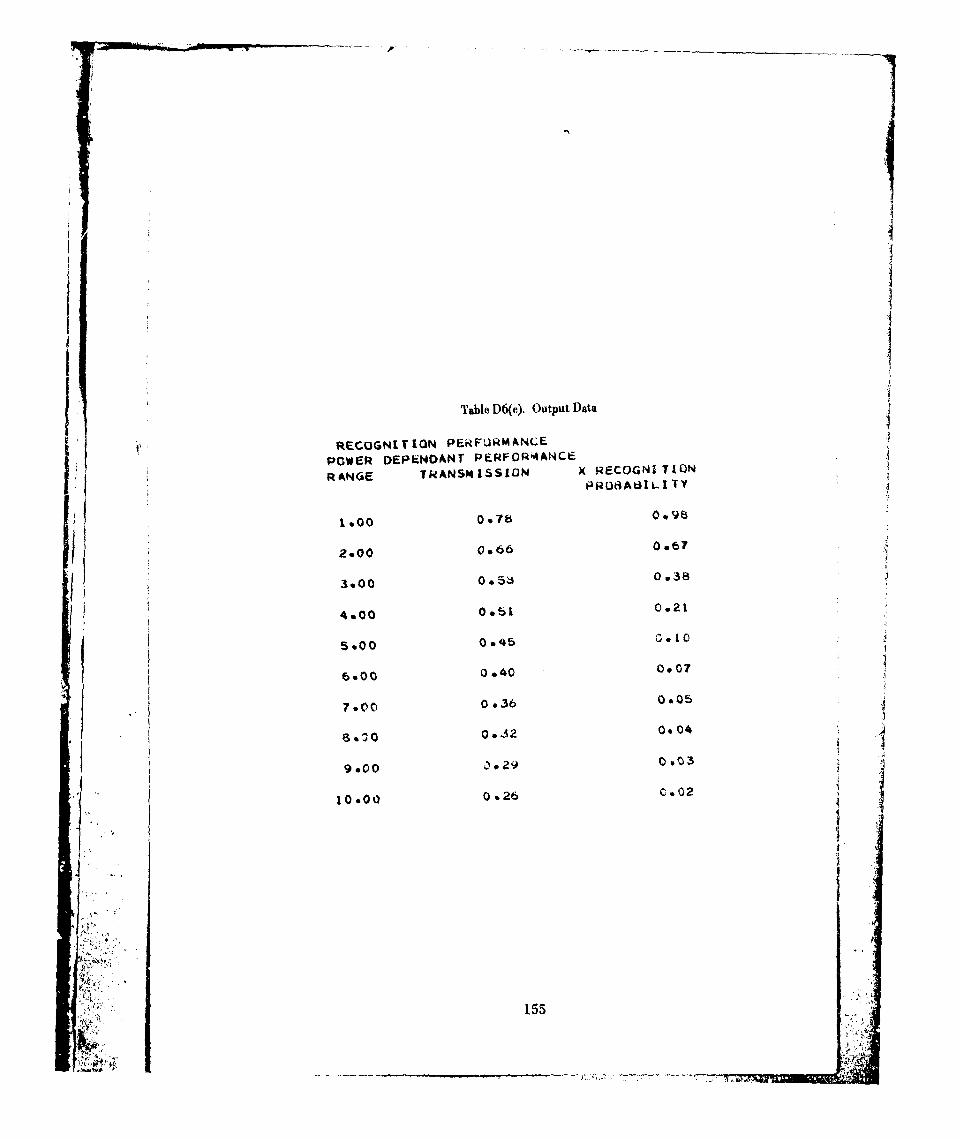
TAle D6(e), Output Data
V ~RECO3GN[ITION PEFURMANCE~POWER DEPENOANT PE.RF0R4ANCE
RANGE TRANSM ISS ION X RECOGNITION
PROO A 51 1 TY
1.00o 0178 0.96'V2.00 0066 0.67
3.00 0656S 0.38
4.00 0.81 0.21
5*00 0.45 01
6.00 0.40 0.07
7.00 0.36 0.05
Salo 0.32 0.04
9.00 002 0003
10.00 0.26 C0
155
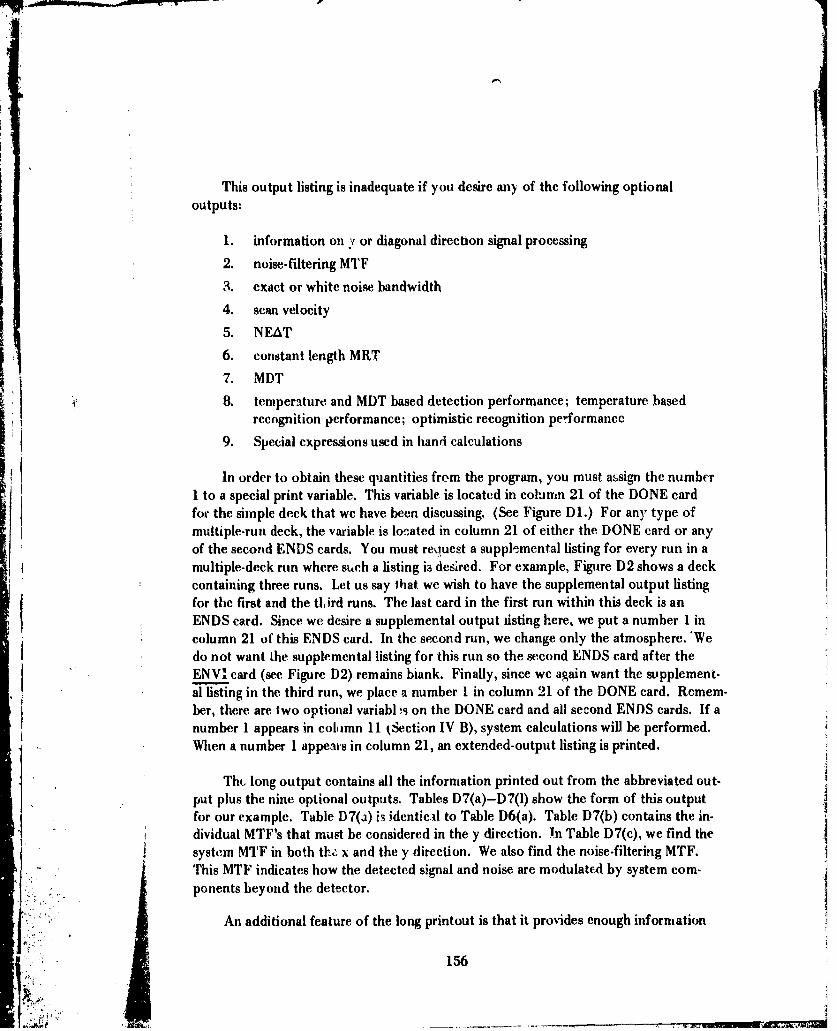
This output listing is inadequate if you desire any of the following optionaloutputs:
1. information on v or diagonal direction signal processing
2. noise-filtering MTF
3. exact or white noise bandwidth
4. scan velocity5. NEAT6. constant length MRT
7. MDT
8. temperature and MDT based detection performance; temperature basedrecognition performance; optimistic recognition performance
9. Special expressions used in hand calculations
In order to obtain these quantities from the program, you must assign the number1 to a special print variable. This variable is located in column 21 of the DONE cardfor the simple deck that we have been discussing. (See Figure DI.) For any type ofmultiple-run deck, the variable is lofcated in column 21 of either the DONE card or anyof the second ENDS cards. You must request a suppl'emental listing for every run in amultiple-deck run where such a listing is desired. For example, Figure D2 shows a deckcontaining three runs. Let us say that we wish to have the supplemental output listingfor the first and the tlird runs. The last card in the first run within this deck is anENDS card. Since we desire a supplemental output uisting here, we put a number I incolumn 21 of this ENDS card. In the second run, we change only the atmosphere. 'Wedo not want the supplemental listing for this run so the second ENDS card after theENVI card (see Figure D2) remains biank. Finally, since we again want the supplement-al listing in the third run, we place a number I in column 21 of the DONE card. Remem-ber, there are two optional variabl .s on the DONE card and all second ENDS cards. If anumber 1 appears in col'i mn 11 tSection IV B), system calculations will be performed.When a number I appears in column 21, an extended-output listing is printed.
Thu long output contains all the information printed out from the abbreviated out-put plus the nine optional outputs. Tables D7(a)-D7(l) show the form of this outputfor our example. Table D7(a) is identicil to Table D6(a). Table D7(b) contains the in-dividual MTF's that must be considered in the y direction. in Table D7(c), we find thesystem MTF in both tFz x and the y direction. We also find the noise-filtering MTF.This MTF indicates how the detected signal and noise are modulated by system com-ponents beyond the detector.
j An additional feature of the long printout is that it provides enough information
156
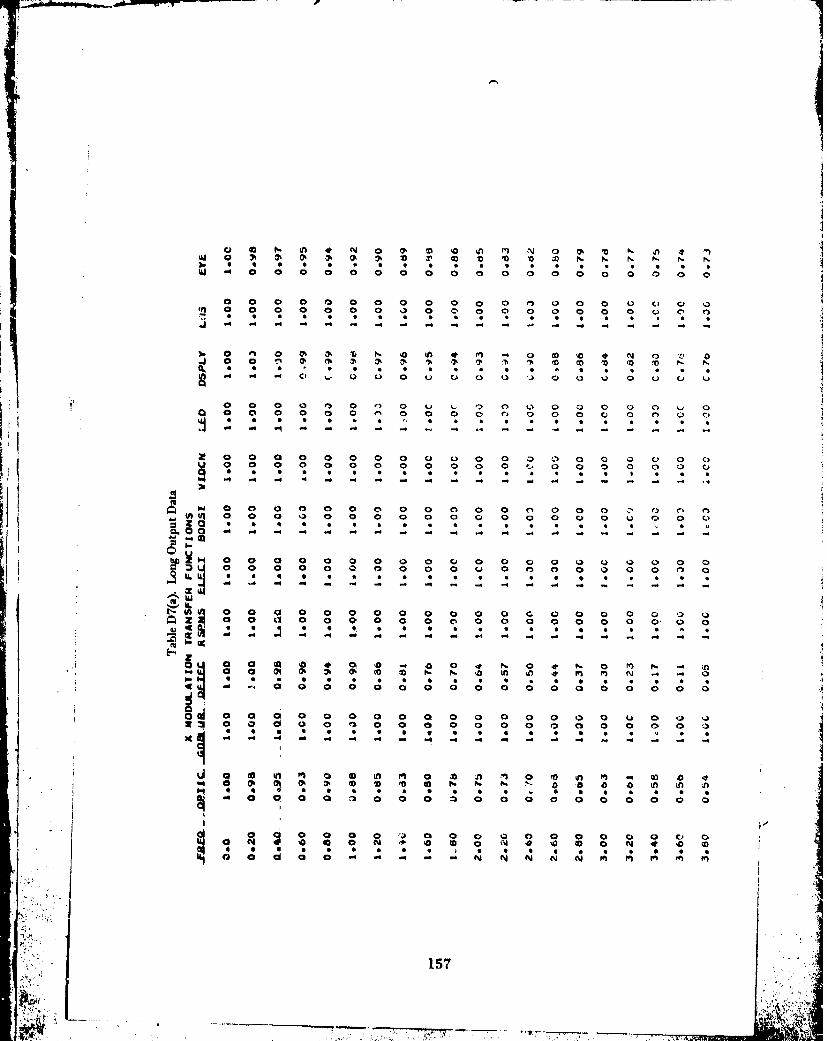
LU Q 7 ~ . 7 .0 0 0 '0 '0 Nb 0 N
). 0 0 0 S S 5 0 0 0 0 0
LU - 0 0 0 0 00 04 0 0 # m 0 c0 0 0 0 W 0
0 0 0 0 0e. 0 0 0 0 0 0 0 0 0 0 0 0 C ) C'0 0 0 0 0 0 0 C 0 0 0 0 0 0 Q) 0 0 0 C,
.5 4 - - - - - - - - - - - - - - - - --
~. 0 '5 0 ~ ' 0 0 0 0 0 '0 4 N 0 C ..50 0 0 7. 7. 3' 3' 0. CA Q. 7 . ' 0 ' 0 '
1' 0 0 0 0 C 0 . C)0 0 . 0 C 0 .. 0~ 0 0 0 0 E' 0 0 C0% 0 0 0 C 0 0 0
a 0 0) 0 C 0 0 0 0 C
m C ) 0 D U k0
~w 0 0 0a 0 0 0 0 0 0 0 0 ' I 0 0
0 0 0 0 0j 0 0 0 0 0 0 0 C, ) C 0 C
to 0 0 0 0 00 Q1
a 0
0 ' * 0 0 0 * N 0 N 15N7
Ij47q 7 ' '0 ' 0 0 . - C
MWS S S S S S S
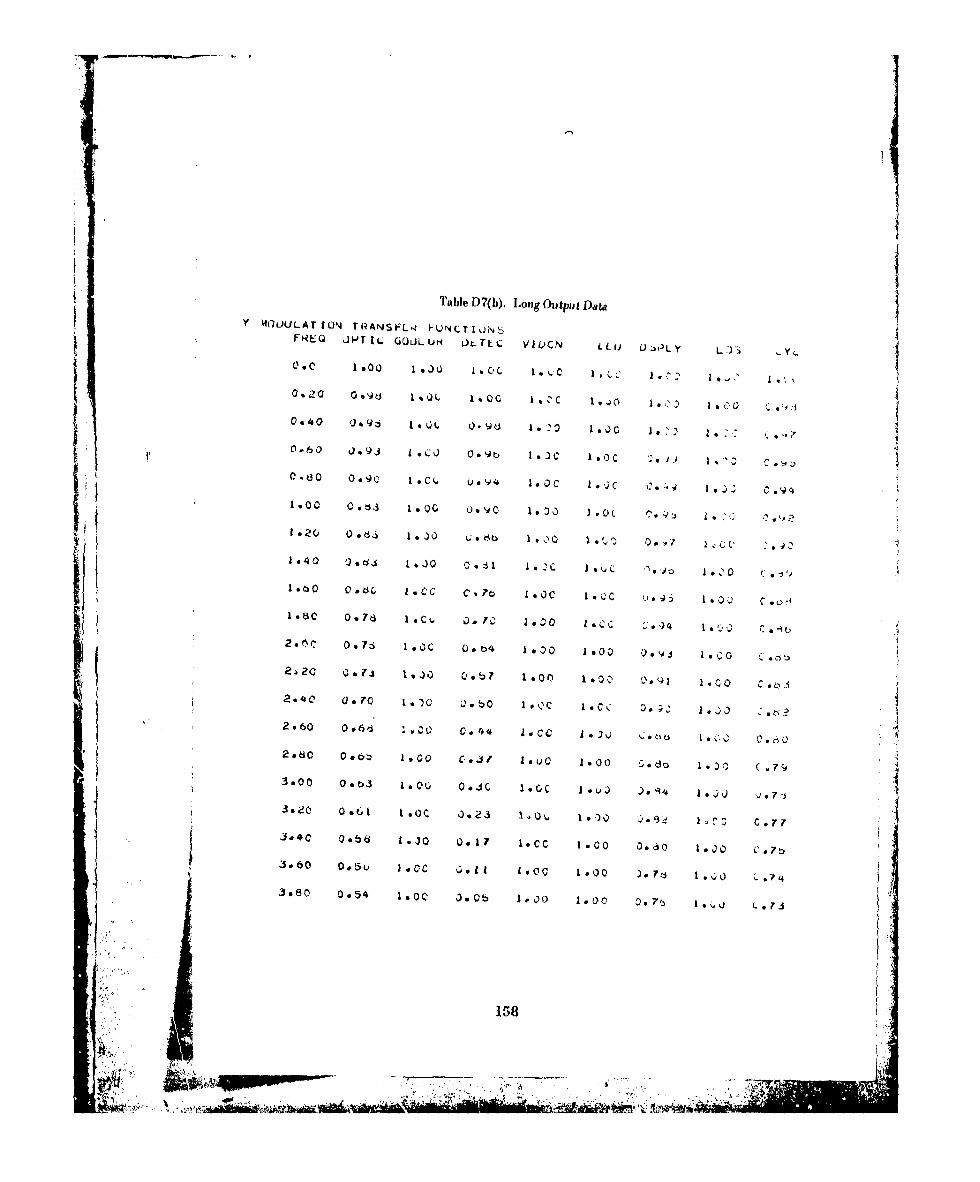
Tatble 07(b). Long1 Output DataY 4OL0JLATION TRANSFL ,4 FUNCLT ILJN S
FRF:Q JPT I( GULJLLH Or-TE VIVC.N LL PL f"Y L T3 YL
L,.C 1.00 1W eC 10 K70K20.40r 11. 9 1.O Q(.t 1.ya
3.00 0 dc. 1 0 C( C, 1.OC 1.i C~>5 K7S I I ) 1 6 0 1o
0 .ir 10 0 .,0 7 158 0
1 000'
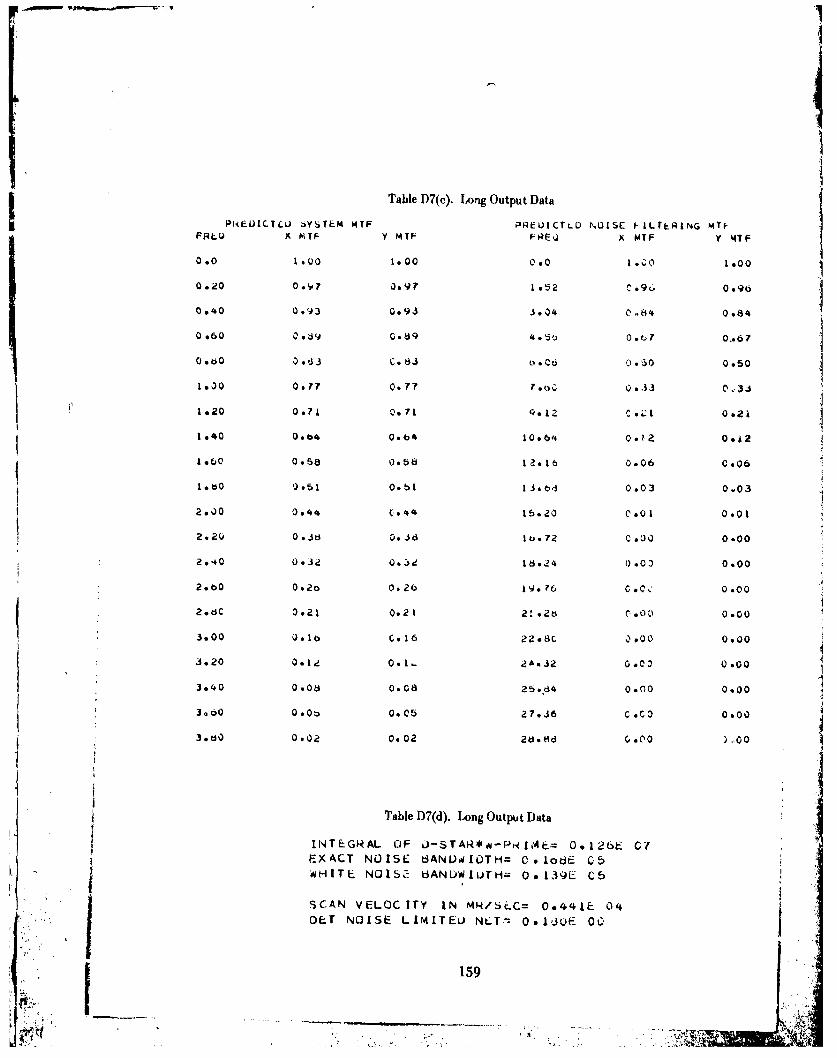
Table D7 (c). Loig Output Data
PN•EUCTLU 4YST-M MTF PiREUICTLO NUISE f-|LtFRING MITFFRLU A PITF Y MTF FR e X MTF Y MTF
0.0 1.00 .00 c.o I.C0 1.00
0.20 0697 0.97 1*52 .96 0906
0.40 0.93 0.93 3.04 0 .84 0.84
0.60 Cod9 0.89 4o.S 0t, 7 0.067
0.o0 00d 3 C.83 (. 06 0.'30 0.50
1.30 0.17 0.77 00,33 003.
1.20 0.71 0. 71 9o12 C0 ,, 0*21
1.40 0.b4 0.64 10. 64 0 02 0o 2
1 .60 0058 0.58 1 ;., lb 0.06 Co06
1.0 03.51 0.b1 13.bd 0.03 0.03
2:00 044: C. 44 15.20 0:01 0,01
2.20 0 .l 3. J? It.72 0 600 0-00
2.40 0.32 06 .3d 16.24 0.00 0.00
2.O 0.2o 0.20 19•. 76 C ,cC' 0.00
2.8C 0.21 0.21 2!.2t' r.03 0.00f 3.00 Oslo Co16 22.8C 0 '00 0.00
3020 0.1 0.1- 2A.32 0.03 0.00
3o40 0 oOd 0.08 25.84 0.00 0.000
3*00 OoOt 0.05 27,36 Coco 0.00
3.8O 0.02 0.02 28. ad (.00 )..00
Table D7(d). Long Output Data
114T EGR AL OF L-STAR* -PNI M L= 0 12 GE C7SEXACT NOISE t3ANWIOTH= C .Iod. C5WHITE NOISZ. BANUWIurNTH-- 0. 139L 05
"" SCAN VELOCITY IN MR/S.C= O*441E 04DLT NOISE LLMITEU NLTT. 0IJU- 0
159
; "I".

Table D7(e). Long Output Data
FILTERED NOISE
09200E 00 1w 910 b E 01 0o..47E. 01
0s40CE 00 0 1 40E 01 0 3;5-"1 01
C*6OCE 00 0.1(IoIE t.1 094283E 01
098COE r0i C i 7 6E 01 0*472E 01
0 * I0CE 01 0 1 92r- 0 1 0,.il-tz 01
Os 120E 01 002CUL %DI 0oo49E CL
0.140E 01 0.2'ICit 01 Oe:5;5L CI
0.0160C 01 0 2.$J0Li 0)1 0, b94E 01
0*1.59cE 01 C,9ý 41c 01 0.6C7E 01
0 *2 0 0 01 062t),E 01 ý,.b617L 01
0.220E. 01 Oq.tiz-, 01 0, .-62E 01
C).240F. 0 1 dl.271 01 QbE01
C.2b0it: 01 Q.?-bcc 01 Of :-26E 01
C *28CL 01 -C3F 0 1 Opru1bE 01
0 30~ 01: 01)5f E J 0.c2 3E 01
C.3 2C L 0! 0 9 .3L. L1 0. b2. 01
r' 34 OF 01 C, 0i % d;. 01 0 O.uLýE: 01
C0360t 03 14 E 1 61 ItCI
'1 C'.J~~~CE C' U~~t )1 (0~ 01j
C94OCE 01 U .2 ',) 01 %~04t-- 0-1
160
'"1 ~ 7-1
TIM
N N - - - - -4 - - - - - - - 4 0 0 '
o) 0 C) 0 1' 0 ) U . 0 0 0 0 (A4 0 '14 Q 0
IE w I I .1 Il "I gi LI Wu jI j l
In N f', .4i N ID 0 I 0 Ln - ) 4 N 4 17 M) 0'0 ID * S4 N i rn nf 1) 0 n 4 .- (0 Nn v3 i ICI)~ ~ ~
IvN N - - - . 4 -' .
4- 0 0 0 0 0 0 C) 0 0 0 0 0 0 0 0 Z 0 0 U 0
IIIL U LU U L U LU W L U L LIU U 11 1.1 Lu .1 Il LUJ
~J 0 in-4 4~I 0 ' C l " In e D m~ 10
0In N 1C~ N -n M 4t '0 N~N3 - N Ci 0 -0N
N 0 ON 0' fil N 11 to -l -p -'0 it jW D N0 l 0 0) 0ý S. 0 0 0 0 N W 0 N
I ;o
I! I -~~h 4 () 0' 0 r^j N ' ' 4) 0 4 0 In N C 0 N 4( n 0 '0 0' .0 0 ~ - 0 N N 0 C3 '0 0 LU 0
I N I I ' I I I I I IO I I I n 0 I I I4 ' I
LU4 In I 0 N '0 * 4 N 0 N N 0 a tfl N. 4. 0
N N N N N N N ' - . 4 .9 .4 . 4 0 0 Ca 0 a 0 C) 0 0 0 0 0)0 C 0 0 C) 0 0 0 0
- U U L LUU 'LU LU LU wk LU LU LUS .0 10 a n In 1% 3% Nt 0N 0' N o In 0
,-~~C N. . 0 N ' N .4 ' ' 0 N* 0% m J) 0 IN 0o 0 - 4) N 4 0 - 40 .~ N 4' V- In 0
....- L N 40 ' 10 - 4 . N N 4') 11 -J D ' - N 4 N
x N N N N --4 0 .S -a. 04 0 0 CS 0 N0 0 0 00n 0 a 0 0 0 0 0 a e 0
I , I II a IL I l A W W IL Ld Il w I j u
aI . 0 0f 0 0f 40 44 0' 0 " 0 0' 4 N 0 0 0) ai0) a 0' 'A 0 N 0 N N C E 0' 4) 0 -a 0 N 0
C. a0 N a to I 0 'C. '1 ' 0 N N. ' 0 - C t N
CY (A N N0 N mA '0 In .4l 4 N 44 ' N .
-JI
YA
wU'ce- - 4 0 0 0 0 a
~0 0 0 9 0 0 C 0 0 C C) C)61
--U -- - -- I IICC ~ ~ ~ ~ ~ ~ ~ ~ ~ ~ ~ oiil~ .U L U L U L U L U L U U L U L L U L U L
U. ~~~~~~" 11101 M. 0 0 0 0 0 0 C
Table D7(g). Long Output Data
PF C'IGNIT IC;N PLkF0!1imANCLTARGE.T L)LLTA T~NI-,PEA[UrL L.~ IS. I Ii~L C
TEMPFPATuRF- L 0EPENLANr i-'Fkd-R<.AN%:~AN GL A rM T RA N S X LJ N S L-ýV A T IVE YCLU N5 -HV A TI Vr 4twCUNSLIRVAT Vi:
I Co0. 7ý 0 . ?,1 0:'.d 0: ý
2.0 c0 0 .5.50bjC 9J
I .d C6 0.37
7.0 c ~ C.050o13 ̂I0 0.z2 0:4:C 0.i0 0 :.
* ~0 * .* C- 0 2 0 *C2
10.00 0 2f, C. i2 0.*0G2 0.02LANG A; A TtiANS X0.TI,,r1IrIc. YUPTIMI S TIC 4Z)OPrjIqIT IC
1. 01.0 0 .7")1 CI.O 1.00:
2 2. CJ 0.e ti)8 . 0 a it 0 .o
4.00 0*51 H.e Co.37 0.j0
) '. 10 34 ~ 0.24 0.23 3.22
0.kC0 o4ký 0.14 0.13 01
70 CO0.3u0.090* 0J 90
4 aC C 0 *3 ? C.01 O0~ 00 000
9. r 0 0 a _, 0 .0:3 0 0:5 0 0:
10.*0 0 0.2o (..04 0.04 00.OA
16
77

4*t
Tal D() Long Output Data
CREC0GN1T ION Pt.RFUR-4ANCETANGE:T UELTA JEMtPE'4ATJRL LS 1101c, OLOWELS L..POWLN OEPENDAN! 3RNFOr'MANCE
RANGE ATM TRAN65 ACL-NSLRVAT1VEL YCONSEIv-VATIWL 4SCQNSEHVATIVL
1.00 0.7d 0.S &V0 .96 4ý~
0.00Qeb 0. t)7 0.6 737 0.67
3.0 CC-0bu 0.ý3a C038 03.7
4*C0 0.s ýi 0.21 00.20 0. 19
%*C3 0.4u 0.10 C,0.1, 0.10
O: C0.40 0:07 0* 07 0.07
S.00 0 .3o 2 0.04 0.03 0.03
9.c0 0 .49 ?)0.3 0.02 0.020
1110.00 0.,20 0.02P 0.02 0.0RANGE ATA TRANS XJ-ITPAIMST1IC YOPTIMISTIC 4SUJPTLIMI$c.TICL
1.00 0.76 LOC0 100 .00 ~ 3
2.00 0.ob 0.66~ C.bb 0 .80
39Pc 0.4t, 0.24* 0.bS 0922
4.00 0.40 0.14 0.13 0.13
7000 003600909 0.09
'110.03 0.26 0.04 0.0C4 0.03
163J
Table D7(i). Long Output Data'RE f ICT ED M1N1%4U, OTECTAO.LL, TtA4-M'EFA TURe(TAR~GET S1ZFti)*,i1 mo r
0*200E 02 CYbt 01
0. 100L 02 0 65 01
C .66?E 01 J. 600 G0 .500E Cl C,. t24L 00
0.400F- 01 0.*463E 00
0 0333E 01 0.275F. 00
0*2-t16E 0i 0.2~21E 00L0.250E U1 0 - dt:E 00
0*200E 01 0 .14 OL 00
0*82 01 00j~C X
06167?t 01 Os 116,E 00
0*1b'4E 01 C'10 6 00
0!*14SE 01 v 0L0
0025 --I* Ot i4fgE-0
0-11L~ 01 0. 754f- 0
00105C 01 0. 71 b- 0
0.100E 01 *SE0
0052 00 65e0
0.90ge 00 0*(2E
0087Qa 00 Oo599L-01
06800E 00 5 et~bE 01
164

Tabie 0%(). Long Output Data
OETECT I-JN B3ASED ON juT
TARGEET DJELTA rcMP rAruk(t IS L L ,L0 OF(;CLS L
RNEATM IkANti ýi/N PRt3OAUIL[I'Y
2.00 0.003 0(18b,.?00
6.0 .Q1o.329 1.0000
8.00 0.~e ~ 4.A100C0
10.00 06200 30*031 1.0000
12.00 0 0 21 1a 9.143 1.0000
14.00 0.113 I 1.000
* ~.-10.000
180000 013.75.0080I
165 I
Al"' t '..
Table D7(k). Long Output Data
* CETECI ION PERFUkI14ANCE.TARGL~T DELTA rEMPERPTU.;L S I I1.IQ LtGRiýS CNFOV PERFUNMANLL
TiEMPENRMURE UEPL-NCENT PERFORMANCr-
RANGF ATA4 TRANS X UET T Y DCT T 4zj OET T
2.00 0 obb L .00 1.00 1.00
4.03 0.31 0911 0610600aý
6.00 064C 6.~ 034 0.83i
6000 0 v3e 00b3 0.b 0.59j
13.600 0026 0.o 460.43 0.41
12.00 0.*21 0.31 02 CS2 0020
k.4 4CO 00 0.11U20 0.1i7 0.*15
16*0. o14 C061 0.071 0 064
2.,00 0.t a.0 1. t00 Of.000
20000 0;510 0 b Do 05 0.~ *; 4
R.0 A.4 G.b F- A ATRAN YOTP
2000 0. 1b o0. 1 0 0
10.00 0.2 0.4 0.43 ID b
2000.a217 Ž& Co1 1 i31
14 - 0 0 *17
160.C'1 0.14 .1 .1 c
1 8*00 Ov.12 C Coc 0C 7
?j 0.cC10 C C., Cc c5
166
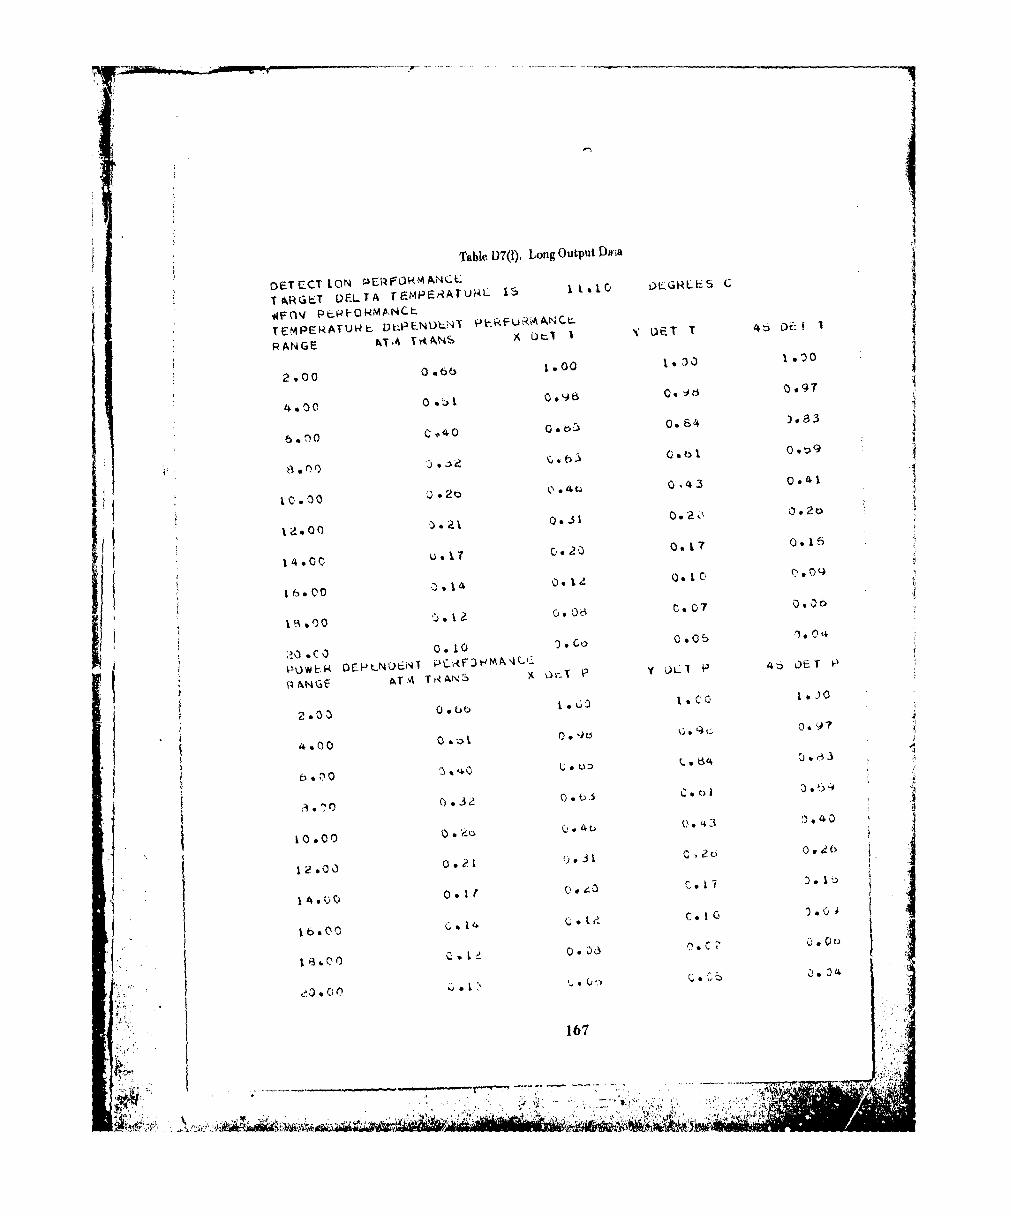
Table D7(l). Long Output Da-A
[DETErCT ION PERFLIKAANC~L
TARGI-T U)ELTA TEMPERAFuRL 15 Leto ~ G)~R~
TEmPERATU~t DtPNULN-f PkkUMNt V 1T4) E
RANGE h-T.A T A AN'.' 1 -~ E.
2 00. 1.00 to 31 1'0
4.s00, 0.~ . ~ 0 ~09
Q.2 C.4t 0,43 0.41
14.00 ... .0.1705
0 o.10
16.00
o.C 1.0
0,.)o 0.b97
A.00 0.o.
10.00 0 .'& 09t- .43 0~
1 4. U0 0.11 ~ Q.) ~ C
66
F tw
"~iii. al
for hand calculations of performance. Such calculations may be used to check the pro.gram computations. The two quantities in Table D7(e) and the first four quantities inTable D7(d) reference variaic's in the mathematical formulation of the static perform-ance model. See equations (26), (27), (24), (21), (22), and (12) in the main body ofthe report foi their definition and uae. The last item in T'ble D7(d) is the NE4T ofthe system.
Table D7(f) containh various predicted system MRT's. Those in the x-direction(XMRT) and y-direction (YMRT) correspond to laboratory measurements. XLMRTand YLMRT are MRT's in the x and y directions adjusted so that the length of a super-imposed bar pattern will match the target length. These MRT's are used in the calcula-tion of performance. The 450 MRT is the square root of the sum of the squared x direc-tion MRT and the squared y direction MRT. Table D7(i) presents the system MDT.
Detection performance based on temperature and power for three directions andtwo fields of view can be found in Tables 7(k) and D7(l). Detection probability basedon the MDT and Rosell's criteria can be located in Table D7Tj). Finally, in Tables D7(g)and D7(h), we have the power- and temperature-based recognition performance in threedirections. The conservative and optimistic predictions correspond to a recognition cri-teria based on 4 cycles and 3 cycles, respectively. Note that the short listing displays theconservative prediction.
C. A Multiple-Run Deck with Target and Atmospheric Changes.
In order to illustrate the multiple-run features of this program, we will expand ourexample a bit in the next three sections. In this section, we will develop a deck alongthe lines of Figure D2 where we do three runs changing the atmosphere and ther, thetarget. We know that the simple deck discussed in Sections A and B and portrayed inFigures D6 and D7 is complete with the addition of a DONE card after the last card inFigure D7. When we change this card to an ENDS card, we arv. ready for more runs.Let us first do predictions when the air temperature rises to 200 C. Then, we will seewhat haippens when the target temperature is lowered to 50 C over the background.The total deck for this multiple run will consist of the cards illustrated in Figures D6,D7 and D8. Note that the first and the third listing will be ir, the extended form.
For economy, the output from this multiple deck will differ from what would beexpected if three decks were run separately. Three listings of the inputs will be printedsince the inputU change each time. System calculations are performed only once, how.ever, so they are printed only onec. In this case, Tables D7(a)-D7(f) aad Table D7(i)define the system predictions and will be produced by the first .un along with TablesD7(g), D7(h), P7(j), and D7(I). The second run will produce results consisting of thenew input listing and tables in the form of D6(d) and D6(c). Finally, the last run of
168
,. , • . ill,' • " , - . . . . . ' . - : i . .. ' . . . • " '
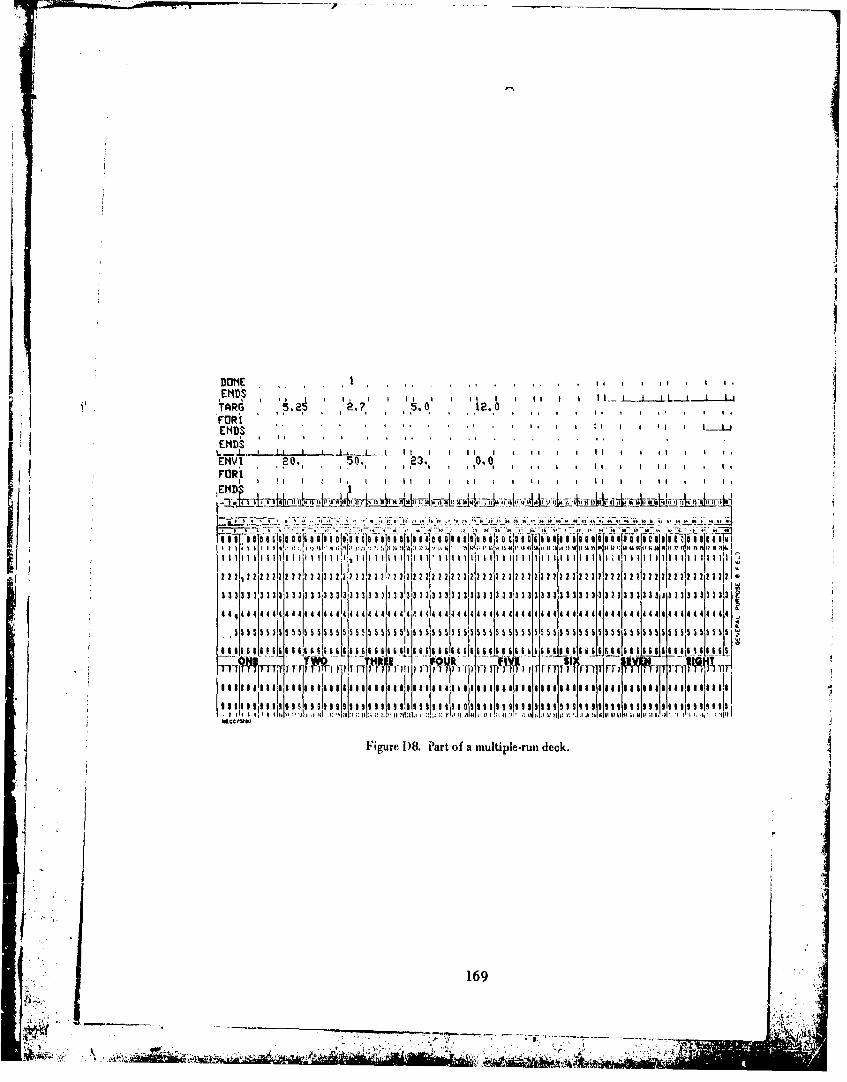
DONE II
UEND,
ENDS'I II
ENVI .0. 50., 23., 0.0FtIRl I I
0i01'006 1 I, I I 1000i iTO0 1$ - f i ii I II a6ii "I I I I I~i ' 1 I I II I 1
I0 1 I II I Qm 1 I 1 11:1:!:: 1 I V II Q;: il U 1 0 41. I t .1 $1 ,0 1 Pl~ l A Hii F I~I W."UI ;11" I~ Itit 1U
33333 33 333133 ~ ~ ~33333,1333333333)3233333333333333 3
441O4444444444 44 4 44414444.4 44 44444 444 544444 4444444444 44444444
511i
*Figure D8. P~art of a multiple-run deck.
169
-.w
&"Ad,~.~ al aklbk

-M. 1.o o ..FDR2 I I Ii I I I [ J.__ • J
I , I i II II I I III I it RIM
to! t.0 It to to .o 0.o to to 1 t to a.,, t, I, I a I I I I I I a,4 ad 11% 111 IV M IP U MI
I 11ili ti,,iit s i[Is iii t ~il Is: ol $Ii; mt 1 611 11131 1 t i ttii
o f IS : i sU ~ a l I M UPI a
Figure D9. Part of a multiple-run deck. 1
bm 170
I" P I" "II '"P I"'I" " "' " ''K"" *' " ''-U + t' ' r l'r" r r l" ' " " """ " "' "" '' ,r,

TARG 7' *a , 5-0. -12-.0 I
IFl i i e I I .
ENDPS I 3 . ~ 5 0 0 I
I~0
t I 1 0.01
* C D 1, , ,I I I O L
1FAR? ý. 1 , 2.17.,. 68 05.20 6,' 12 0 , 4
E* SI S S . I 5 S
___ t 9-7ý'12 'E*sJ su 5i 0.s.m ' "__IDPT 0.0,1 ai i~eiri
IOP a.to I
,;;1*...2 r.wt 1P 1knia f, - 1 4 VT1 41t At
I i lo l)i~~ J)jm
,f171
It '7~1k- ]22 21t122 2 2 2 2 22 2 1 1 21
22 tit

this deck prints another itipu t listing and a new set of tables in the f ormn of D 7(h)- D (1).Remembcr that these last tables pertain to pre-lictions made for an atmospheric air tem-perature of 200 C and a target temperature of 50 C. All changes carry through to sub-sequent runs.I D. A Multiple-Run Deck with System Parameter Changes.
In like manner, we pitt together a multiple-run deck with system changes accord-ing to Figure D3. Let us consider a new optical system for our example which has anMTF in the x and y directions aq well as a transm~ssion of 40%. The multiple-run deckwe obtain is the combination oi Figures bj6, D)7, and D9. Tiiere will be two sets of
Tables D5 and D6 in our output listing.
E. A Mixed, Multiple-Run Dock.
Finally, let us take the two systems in Section D) and predict performance for the-three conditions in Section C. The single deck that will do these six runs can be con-structed by biringing together Figures D6, D7, and D 10, successively. The output listingwill follow the patterns sketched in Sections B, C, and D).
VI. Supplemento
The supplements contain miany specific rcferý_nces to the theoretical treatment ofthe Night Vision Laboratory Static Performance Model for Thermal Viewing Systems.AUl references to "the main body of this report" reter to pages 1.34. Specific equationsfrom the main body of the report are referenced whenever appropt iate.
-. 4
172
40 'i1z. z
Supplement 1
Target
A discussion of the target model can be found in the theoretical treatment of the:erformance model under Section 11, Target, Background, and Atmosphere, Table 1,& ction II, describes a selection of target models that can be nsed as inputs. Thesemodels are for a tank, an A PC, a 2½&-ton truck, and a man.
The TARG card may be excluded from the input deck: (1) if one has no particulartat get requirement, or (2) if one is only interested in the predicted system NIRT or MDTrather than field performance. When the TARG card is not included in the data deck,
Sthe default parameters listed in Table D2 are iutpul to the model.
Probabilities of system performanc, are predieted as a function of range. Range isdefined as the distance between the observer and the target. The RANG card specifiesthe positions of the target whikh are of interest to the uslr for detection and recognitionperformance. ideaily, one would receve an adequate span of rvnge predictions to plot
a continuous curve of the probabilities frotm 100% to 0% of deteciion and reenguition.Possibly, one would only have interest in a range of specified probability. Ilowever, atthis time, there is no search procedure for the initial, terminal, or percentage of interestran g.
1.1 XLTAR, XlITAR - The real target's critic-i dimension is XIITAR. For mostArmy vehicular targets and for all targets used in the validation of the main body ofthis report, the critical dimension i, the mivnimum dimension whether it be the width ofa man or tie height of a tank. The real target is modelled in the computer program by arectangle with uniform Al. 'he snaller dimension of this rectangle is X ItTAR.XI4TAR is the rectangle length that when multiplied by the critical dimension will yieldthe thermal area of the real target. As an example, Table I shows that for a tank/side,SXIITAI{ 2:..7 in and XITAR -5.25 i. All dinwtesions are in nieters and may takc onany vwlue greater than 0.0.
1.2 DETEMI, TBAC - DETEMP is the absolute valwu of the average temperaturedit'frence ATAv(; defitted by equations (1) and (2). DETEEMP must he greater than0.0' C; negative differences are not valid inpiuts. TIBAC, tle background hemperature,is usually 12.00 C, If the riser omits the value of TBAC on his data car-t or inpu r(- 0.9,the value o.' 12.0 will be input. Therefore, it i. impossible to spceify a 0.00 background,hiclh may be a true representation of a sky baclground. To dodge this fault, input
0.010 C or sonic very small number to approximate 0.00 C.
1.3 IRNMIN, 'iRMAX, IRIDN, 1Rt)AX - T'he minimum and maximum ranges of
173
I 7'-' t ~ ci4' 4

interest for recognition, IRMIN and IRMAX, respEttively, and foi' detection, IRDINand IRDAX, are required by the program. Given a minimum range and maximum rangefor recognition performance, the model wid calculate the probability of recognition
starting it the minimum range, continuing for additional ranges in increments of(IRMAX-IRMIN)/9 until the maximum range is reached for a total of ten ranges. Like-wise, the model will calculate the probability of detection starting at range IRDIN torange IRDAX in increments of (IRDAX-IRDIN)/9. IRMAX must be g'eater thanSIRMIN and IRDAX must be greater than IRDIN. All four ranges must be greater than0.0 and in units of meters.
SThe RANG card may be omitted from the data deck and the default option inTable D)2 will be input. Selection of input ranges comes with experience. TheoreticalIN,if" everything is ideal and the syste-a is oidv limited by the detectoi, the 50% probabilityrange of system performance can be approximated by
XIITAR * 1000RANG F :-________
,Et.TAX * XCYCLES
where XCY-'LES is 1.0 for the suggested d,&tection criteria. XCYCLES is 4.0 for thesuggested rccogpition criteria. Whcre no prih," knowledge of system performance exists,it is suggested that the user first try the default to the RANG card. T'hen, adjust theRANG card based on these results.
I.•
174
R
---- - - -
22~

Supplement 2
Atmosphere
In this program, there are two different ways to account for atmospheric effects.
A modified version of an atmospheric transmission model developed by the Air ForceCambridge Research Laboratory can be used by placing an EN VI card in the input deck.This card supplies the inputs to the atmospheric model.
The model requires values for the relative humidity. the air temperature, and thevisibilit% range of the atmosphere. These are all continuous variables and any number,subject to certain restrictions, can be used. In order to aid the user, however, Table D8associates typical discrete values of these variables with commonly observed atmospher-ic conditions. Temperature and relative humidity are grouped into three classes. Theseoto variables together determine the water vapor concentration of the atmospherewhich is often the prelorminant cause of atmospheric attenuation in the IR. Figure D IIcan be used as a guido in determining an appropriate temperature-relative humidityCombim, tion. When using low visibility ranges, check to make sure that the RANG cardis specified properly. It! general, below a 2-kilometcr visibility range, anticipate the
, Kpossiili!ty of low performance ranges.
Table D8. Atmospheric Models and Inputs
Type Visibility Range Temperature/Relative(km) llumidity*
Very clear 40 1Clear 23 ILight haze 9 II
h.ze 5IIHeavy haze 2 IILight fog 1 IIIHeavy fog .2 911Light rain 12 IIModerate rain 6 I1Heavy rain 2 II1Very heavy rain .5 III
I I - low water vapor content.II - moderate water vapor content.
III - high water vapor content.
175
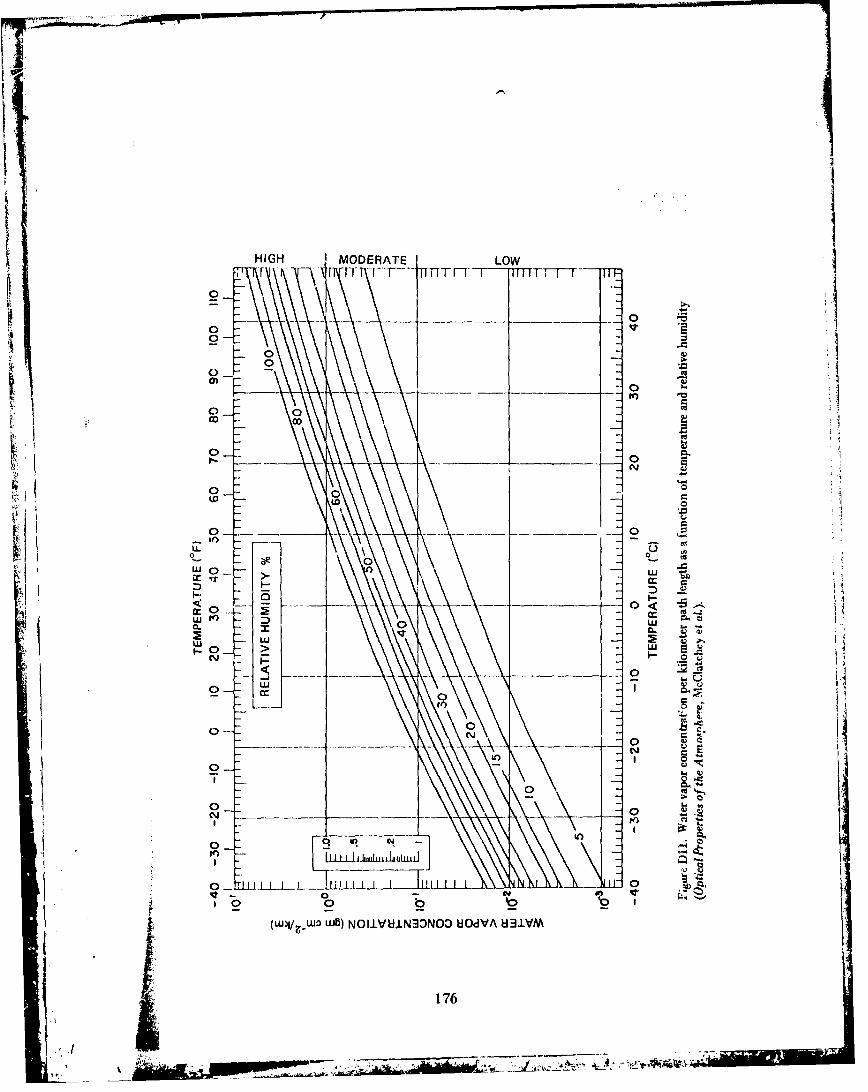
_ HIGH MODERATE jM LOWr TI -1-T -- TV I - r
0 c o
C.)
j4 0
LI.
WV f) 0 w
w
0
ato
o b o
(W)I/,-WO wO) NOIIVUIN~3NOD )IOdVA U3.LVM
176
If spectral atmospheric transmission data per kilometer is available, a simple Beer'sLaw attenuation calculation can be performed. Atmospheric transmission is determined
in 0.1-micron intervals by linearly interpolating data supplied by the TOTL card. WhenTOTL is used, the ENVI card is riot necessary. If the transmissions on the TOTL card
correspond to the default wavelengths for a 3-5 micrometer system stored in the WAVEarray (see Table D2), the card ATEW is not ncrded when using TOTL. When the userhas a choice between the two methods of accounting for atmospheric effects, he should
use the transmission model needing the ENVI input card. It has more validity than aBeer's Law calculation.
It is perfectly correct to exclude all atmospheric cards. In this case, calculationsare performed for a clear standard atmosphere having a visibility range of 23.0 kilome-ters, an air temperature of 15.00 C, and a relative humidity of 46%. Specific referencenotes on individual parameters follow:
2.1 AIRTMP - the air temperature may take on any value from -29.e° C to38.00 C. See Figure D 11, RVIS (2.3), and ISTATE (2.4).
2.2 RII - the relative humidity may take on any value from 0.0 to 100.0. SeeFigure DI1, RVIS (2.3), and ISTATE (2.4).
2.3 RVIS - the visibility range in kilometers may take on any value greater thanzero. A visibility range of less than or equal to 1.0 kilometer is defined as a fog. RH isignored when RVIS 4 1.0 and set equal to 100%. See Table D8 and ISTATE (2.4).
24 ISTATE - is an index which designates special atmospheric conditions thatmay occur. If ISTATE equals 1-4, a rain model is used. RVIS is predefined accordingto Table D2, so any RVIS input is ignored. However, AIRTMP and RH must still bedefined. The only exception to this is when ISTATE equals 4. Then, any RH input is6ignlored and RH is set equal to 100%. When ISTATE equals 1-3, a recommended value
for RH is 75%.
2.5 SIGMA, WAVE - are each arrays having seven fields and, whenever they areused, all seven fields must contain values. If only the band transmission per kilometeris known, repeat the same transmission seven times on the TOTL card. Then, assume• ~~either the default wavelengths for SIGMA or select seve?ý wavelengths contained betw,.•n...
WAVE1 and WAVE2 on the BAND card. Any wdvelengths contained on the ATEWcard need not start exactly at the beginning of the band or end exactly at the end of theband but they must increase monotonically from smaller to larger values. Wavelengthsdo not need to be equally spaced from one another. When the default option is usedfor ATEW, the appropriate 3-5 micrometer spectral band is supplied.
177
I'1
Supplement 3
Optics
The specifications for the system's optics are on cards OPTI, MTOX, and MTOY.Cards MTOX and MTOY describe the MTF of the optics in the horizontal and verticaldirections, respectively. Input values for these two cards need not be the same. The
total MTF of the optical component is the product of the MTF of the optics (Note 3.5)and the MTF due to geometric blur (Note 3.3). Notes on the individual iqputs follow:
3.1 FNUMi, FOC - FNUMB is the F-number of !he objective lens. The F-num-ber is a positive, unitless decimal number. Reference Section III, par. Al, MTF,OPTICS, equation (10), (F#), and Section 111, par. B, NEAT, equations (24) and (25),(F), for its use. FOC is the focal length of the objective lens. It is a positive decimal
value in inches. Reference Scztion 111, par. Al, MTF, OPTICS, equation (! 0) for its use.An example of interaction of variables is illustrated by the following relatiuas!,.; 3.
FNUMB = FOC/Diameter of the objective lens (inches).
Although the diameter of the objective leni i• not an input, the diameter which satisfiesthe above equation should be checked to see it it is within rc.,sonable bounds of tech-nology. Another examnplc of interaction which must be hanA checked by the user forconsistency is SRTAD/FOC f!,r square detectors
)x-dimension of detector (mils)DELTAX =tewC
FOG
LDELTAX, the detector IFOV in the x-direction in units of milliradians, and SRTAD,the siq.Uare root of the detectPr area in units of mils, are defined in Supplement 5. It isimporfa-i to note that FOC is related to detector characteristics and that a change inany of the three variableh above affects at least one of the other two.
"3.2 TO - TO is the optical transmission averaged over the spectral bandwidthwhich is specified by card BAND). For perfect transmission, TO = 1.0; odiherwise,o0.x < TO < 1.0. TO (T.) appears in equations (24) and (25).
3.3 AI•LUR - The purpose of ABLUR is to calculate an MTF due to the geo-metric blur of the optics. An assumption necessary to the model is that the spot sizeof the geometric blur is gaussian and, therefore, the fourier transform of the spot size
results in a gaussian MTF. The form of the MTF (H BLUR) is in Section III, par. AL.MTF, OPHICS, equatiom (11), and is repeated below for further reference:
178 {
5'' ': d•ISl" °•A (•• . ..
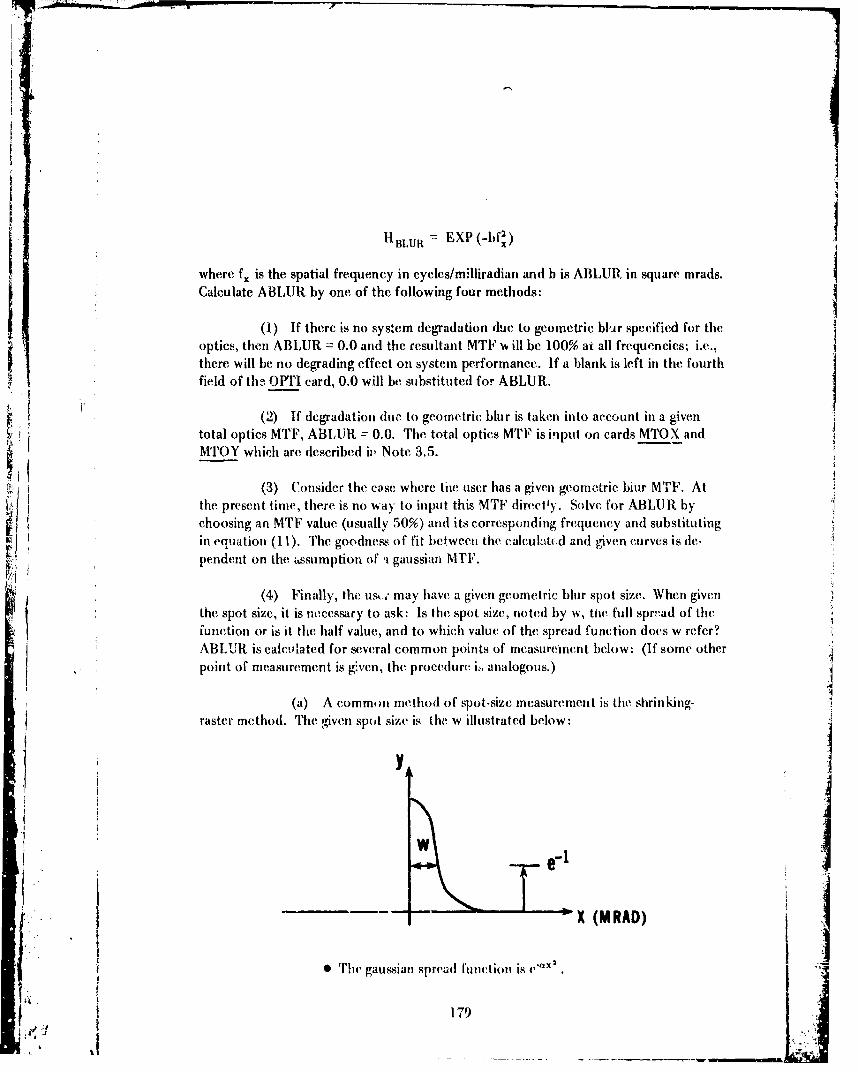
HBLUR EXP(-bf2)
where fx is the spatial frequency in cycles/milliradian and b is ABLUR in square mrads.Calculate ABLUR by one of the following four methods:
(1) If there is no system degradation due to geometric blur specified for the
optics, then ABLUR = 0.0 and the resultant MTF % ill be 100% ai all frequencies; i.e.,there. will be no degrading effect on system performance. If a blank is left in the fourthfield of th, OPTI card, 0.0 will be substituted for ABLUR.
(2) If degradation due to geometric blur is taken into account in a giventotal optics MTF, ABIUR = 0.0. The total optics MTF is input on cards MTOX and
MTOY which are described iv Note 3.5.
(3) Consider the ease where the user has a given geometric biur MTF. At[ I the present time, there is no way to input this MTF directly. Solve for ABLUR by
choosing an MTF value (usually 50%) and its corresponding frequency and substitutingin equation (11). The goodness of fit between the calculatd and gven curves is de-pendent on the L4ssumption of i- gaussian MTIF.
! (4) Finally, the usk.," may have a given geometric blur spot size. When given
the spot size, it is necessary to ask: Is the spot size, noted by w, twe full spread of thefunction or is it the half value, and to which value of the spread function does w refer?ABLUR is calcllated for several common points of measuremient below: (If some otherpoint of measurement is givcn, the procedure i-, analogous.)
(a) A common method of spot-size measurement is the shrinking.raster method. The given spot size is the. w illustrated below:
SX (M RAD)
0 TInh gaussian s unction is " x- ( A.
179
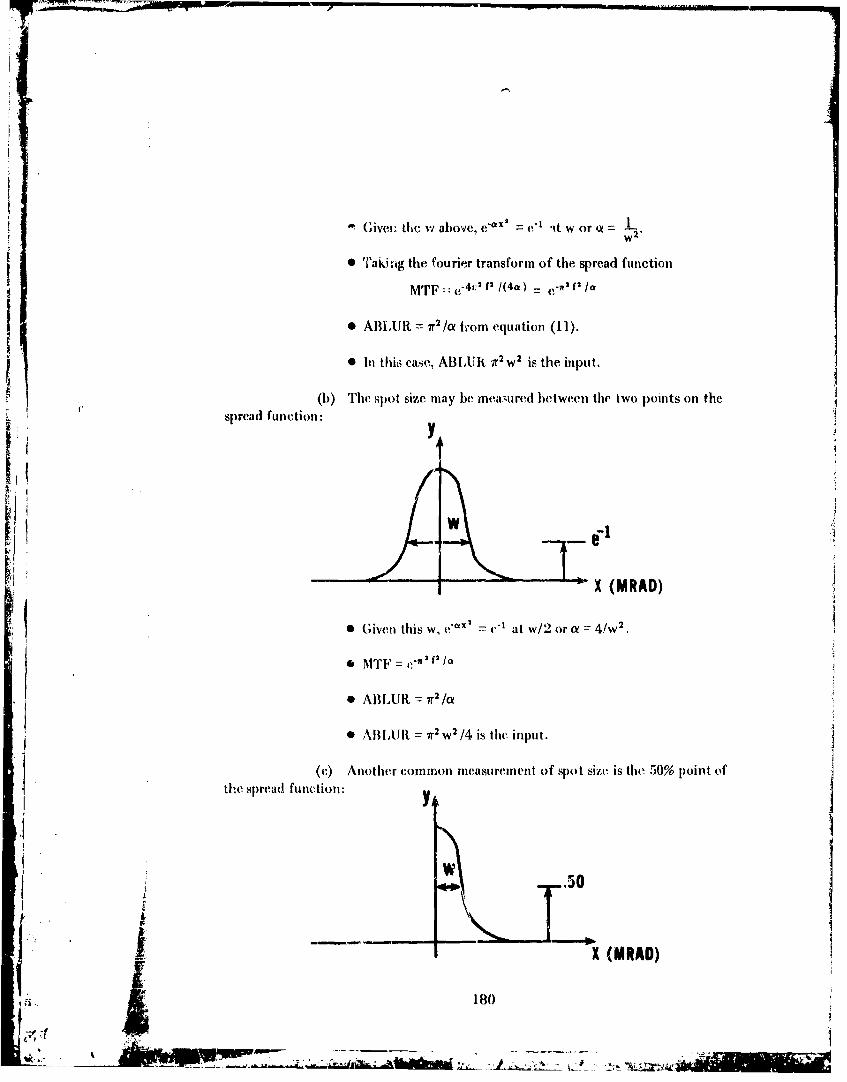
Giveu, the w above, e"x 2 = i 't w or Q 2
'Taking the fourier transform of the spread function= 2 f•/
MTF :: "4 ' f2 /(4&) - V/
* ABILUR = r2/a trom equatioi (11).
* In thizs case, ABLUR ;r2 w2 is the input.
(b) The spot size may be mea,;ured between the two points on thespread function:
iy
" X (MRAD)
SGiven this w, e"a'= c' at w/2 or o= 4!w 2 .
SMTF = e-2f c""
* ABLUR= 7r2//a
* A',L --R 7r rW2 /4 is the input.
(c) Another common measurement of spot size is the 50% point of
the spread function: J-I
• -.-. 50
K ,- - X (URAD)
180
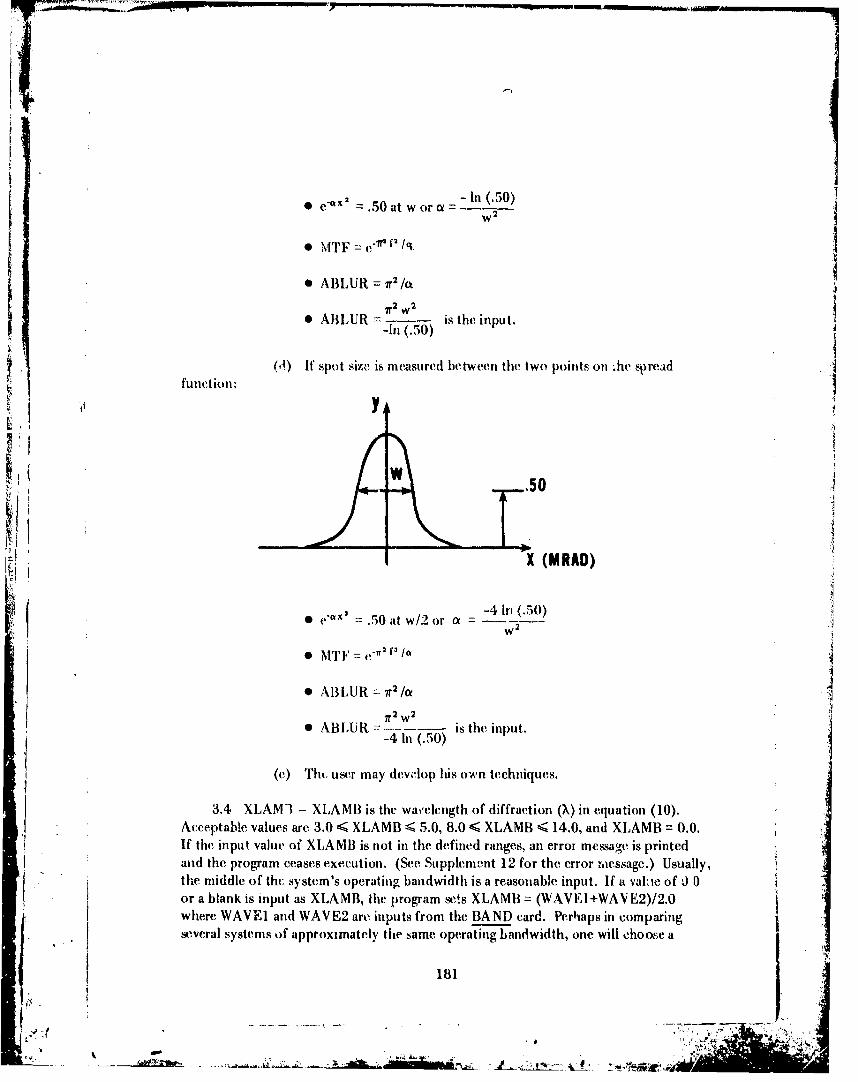
* e"x= .50atwor a= In (.50)w 2
0 MTF =c,"• V /q.
• ABLUR = 7r2 /./I.2 w 2
* ABLUR - (0 is the input.-In (.50)
function. (!(d) If spot size is measured between the two points on ýhc spread
YA
.50
X (MRAD)
0 ("•X .50at w/2 or -4 In (.50)w 2
* ABLUR = ir 2 /a71"2 W2
• ABLUR =w is the input.-4in (.50)
(e) Tht. user may develop his own techniques,
3.4 XLAM-I - XLAMB is the wa,'clength of diffraction (N) in equation (10).Acceptable values are 3.0 < XLAMB < 5.0, 8.0 < XLAMB < 14.0, and XLAMB = 0.0.If the input value of XLAMB is not in the defined ranges, an error messagc is printedand the program ceases execution. (See Supplement 12 for the error raessage.) Usually,the middle of the system's operating bandwidth is a reasonable input. If a valne of J 0or a blank is input as XLAMB, the program :ets XLAMB = (WAVEI+WAVE2)/2.0where WAVEI and WAVE2 are inputs from the BAND card. Perhaps in comparingj several systems of approximately the same operating bandwidth, one will choose a
-181
A g . ' ''

Ccommon value of XLAMB. If the user is assuming a diffraction limited MTF of theoptics as in equations (9) and (10), XLAMB is used in the predictions. However, if anoptics MTF is input, predictions do not depend on XLAMB.
3.5 XO, Y() - XO is an array on card MTOX of the MTF values of the optics inihe x-dircction which ,crresponds to the array of increasing spatial frequencies on cardFCMR. YO is all array on card MTOY of the MTF values of the optics in the y-directionwhich corresponds to the array of increasiaig spatial frequencies on card FCMR. Accept-able values range troi, ,. to 0.0. Three methods exi,,ct for inputs to cards MTOX andMTOY:
(I) If there is no system degradation due to the optics (i.e., an WIF of100%), input ten 1.0's for arrays X0 and YO. If theN MTOX card or NITOY card orboth are left out, the default option is all 1.0's for the respective array.
(2) If one, is given a measured or known optical MTF, input ten MTF valuesoff this known curve which correspond to the FQ array on tihte FCMR card for the relat-ed caid (MTOX, MTOY, or hoth).
(3) If a predicted MTFF based on the as-umption of a diffraction-limitedsystern is desired, input ten 0.0's for arrays XO and \ 0. A diffraction-limited MTF as
a function of spatial frequency may be calculahed ini both the x and y directions bye-quations (9) and (10).
!
pI
Supplement 4
Scanner
The inputs of the SCAN card are essential to the NEAT, MRT, and MDT predic-
tion,. Notes on the individual variables t.ollow:
4.1 FR - FR is the irame rate of the scanning system in frames/second. Theframe time is the time required for one complete scan of the field of view; frame rateis the inverse of framc. time Any positive value of FR is acceptable. FR(FR ) is an in-put to lhe calculation of the number of resolution elements in Section III, par. B,NEAT, equation (23); the MRT prediction in Section III, par. C, MRT, equations (26)and (27), and the MDT prediction in Section III, par. D, MDT, equation (28).
4.2 XNSC - XNSC, the overall scan efficiency, is the percent of time the scanneris ,n the detectors. XNSC is a decimal greater than 0.0 and less than or equal to 1.0.
An input of 1.0 means 100% scan efficiency. "Overall" in the above definition meansthat the scan efficiency is the product of the horizontal scan efficiency and the ve-ticalscan efficiency. XNSC is an input to equation (23).
4.3 OVERSC - OVERSC is the overscan in the IR field by the detectors and isdefined by the following ratio:
DELTAYOVERSC :
raster spacing (mrad)where,
I #active raster lines/frameraster spacing V FOV x 17.45 (mrad/deg)
where DELTAY is the vertical instantaneous field of view of the detector input oncard DETK and VFOV is the system's vertical field of view input on card SYST.OVERSC is positive and unitless. Equations (23), (26), (27), and (28) are a functionof OVERSC. For overscan on the display, see Supplement 10.
183
- __ __ -. -•'7-
Supplement 5
Detector
Characteristics of tb-" detector are input on cards DETR, DET2, DROX, DKOY,
NPSP, NPSF, DSTD, and DSTL. The user may exclude the DET2, DROX, or DROYcard, and the default options listed in Table D2 will be input. -'
Notes onl the individual variables on card DETR follow:
5.1 DELTAX, DELTAY - DELTAX and DELTAY are the instantaneous fieldsof view of the detector in the horizontal and vertical directions, respectively. DETAX,DELTAY > 0.0 and are in units of milliradians. Both variables (Ax, Ay) are necessary
inputs to calculate the number of resolution clements/s in Sectien III, par. B, NEAT,equation (23). DELTA Y (Ay) is used in MRT calculations, equations (26) and (27),
S~~and( it! the MDT calculation, equation (28). Interactions with othe(r systemipt
include:
SRTAD/FOC square detectorx-dimension of detector (mils)IDELTAX ddotherwise
and
IV.ERSC -- )DELTAYraster spacing (inrad)
5.2 XN - XN is the number of active detectors in parallel. XN ) 1.0. XN (n) isused to calculate the number of resolution elcments/s in equation (23).
5.3 DISC - DISC is the number of active detectors in each row of the detectorarray, i.e., in series. DISC > 1.0. DISC (N) is a necessary input to the NEAT cadcula-lion in equation (24) or (25).
5.4 SRTAD - The effective detector size in units of mils (10" in.) is calculatedas follows:
SRTAI w idth of Tthe detector (mils) x height of the detector (mils)
SRTAD > 0.0. SRTAi)(AY')is used in th, NEAT calculation i, equations (24) or (25),
SIt interacts with olther inputs byf I)EIlTAX v SRTAI)/FO')C. (for sqluaredetectors)
184
.. ~~ia a .

5.5 DPEAK - DPEAK is the peak D* (X, fQ) value in units of 1010 cm-sqrt(hertz)/watt. DPEAK > 0.0. The DDSTAR array is input on card DSTD as a relativecurve notmalized such that the input D* (X, fQ) at DPEAK equals 1.0. The programthen calculates D*(X, f%) : DPEAK * DDSTAR.
5.6 FO - FO is the measuring frequency of D* (X, f.). F0 > 0.0 and is input
jin units of K hertz. For most HgCdTe detectors, FO = 10.0 K hertz. See Supplement5.11 where S(FO) = 1.0.I
Notes on the individual variables on card DET2 follow:
5.7 ANGLE - ANGLE is the cold shield half angle ia degrees. ANGLE > 0.0.
ANGLE (0/2) is used in the shot-noise-limited system NEAT calculation in equation(25). If MOM = 0.0 is input in field two of this card, then the value of ANG LE is notused in any system calculations and therefore may be input as anything.
5.8 MOM - MOM indicates to the computer program which of three methods tochoose for the NEAT calculation. If MOM = 0.0, thei NEAT for a detector-n-oise-limited system in equation (24) is computed:
NEAT = tF T :.kfn) d
where tie bandwidth Afl is defined by equation (21) and the inpvt DDSTAR. array is
1)t which was measured in the dewar with its internal cold shield. If MOM = 1.0, theNEAT for the shAt-noise-limitcd system in equation (25) is computed:
4F2 (Af,,)Y Sin (0/2)NEAT = r,, _0 D** ,Ir Ad T., o fvN ax D nx' dX
wh-re Afn is defined by equation (21) and the input I)DSTAR array is l)** which wasnot measured to include the cold shield. If MOM = 2,0, the NEAT is calculated byequation (24): howevcr, Af, is the white noise approximation defined in equation (22).MOM must be equal to cither 0.0, 1.0, or 2.0.
5.9 l"STAR - FSTAR is the frequency of the 3.di poinf o.f tle detectot response.It is ai inltiut I) thei calculation of the detector's temporal Irunsfer fur, ction in equation(14). (f*). For this calculation, FSTAR > 0.0 and in units of K hertz. The detector'sSte-nporial \t'l'l',- ar' eal,'ulated by the program only if either array XI' on card I)ROXor YD ron ard IDROY i. all zer,,.. If the detector temporal MTF's are not calculated,FST WR I!. nt l4I t. itn al s stem calculations; thus, the rmwcr may input. any value for
I..
-- -.t, - _
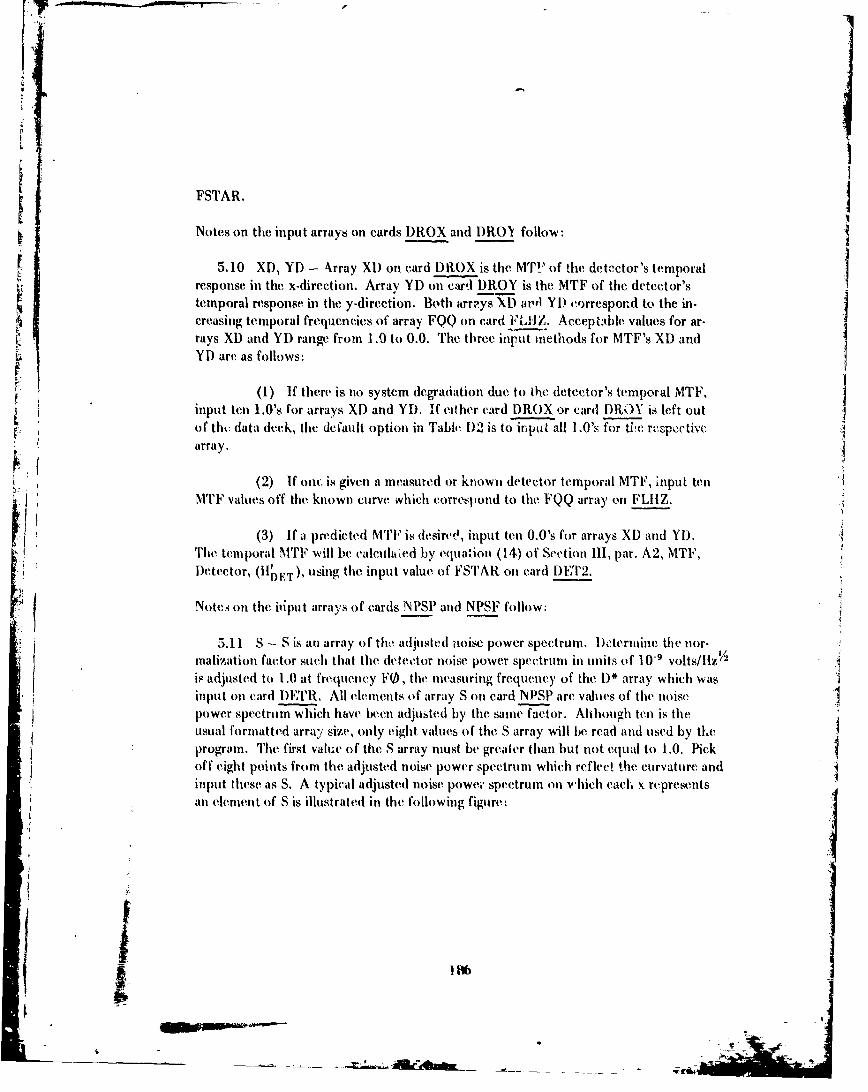
FSTAR.
Notes on the input arrays on cards DROX and DROIt follow:
5.10 XD, YD - 4,rray XD on card DROX is the NMTF of the detector's temporal
response in the x-direction. Array YD on card DROY is the MTF of the detector'stemporal response in the y-direction. Both arrryalD avd YD correspond to the in.creasirg temporal frequencies of array FQQ on card FLZ. Acceptable values for ar-rays XD and YD range from 1.0 to 0.0. The three input methods for MTF's XD andYD are as follows:
(1) If there is no system degradation due to the detector's temporal MTF,input ten 1.0's for arrays XD and YD. If either card DROX or card lROY is left outof tht: data deck, the default option in Table D)2 is to input all 1.0's for ti6w respective
array,
(2) If ont, is given a measuretd or known detector temporal MTF, input tenMTF values off the known curve which correspond to the FQQ array on FLIIZ.
(3) If a predicted MTF is desire,, input ten 0.0's for arrays XD and YD.The temporal MTF will be calculatted by equation (14) of Scotion III, par. A2, MTF,Detector, (11I)FT), using the input value of FSTAR on card I)ET2.
Notes on the input arrays of cards NPSP and NPSF follow:
5.11 S - S is an array of tho adjusted noise power spectrum. Determine the nor-malization factor such that the detector noise power spectrum in units of 10-9 volts/llz½ iis adjusted to 1.0 at frequency FO , the measuring frequency of the D* array which wasinput on card DETR. All elements of array S on card NPSP are values of the noisepower spectrum which have been adjusted by the same factor. Alhhough ten is theusual formatted array size, only eight values of the S array will be read and used by tLeprogram. The first value of the S array must be greater than but not equal to 1.0. Pickoff eight points from the adjusted noise power spectrum which reflehc the curvature andinput these as S. A typical adjusted noise powei- spectrum on which cach x repre•sntsan element of S is illustrated in the following figure:
j
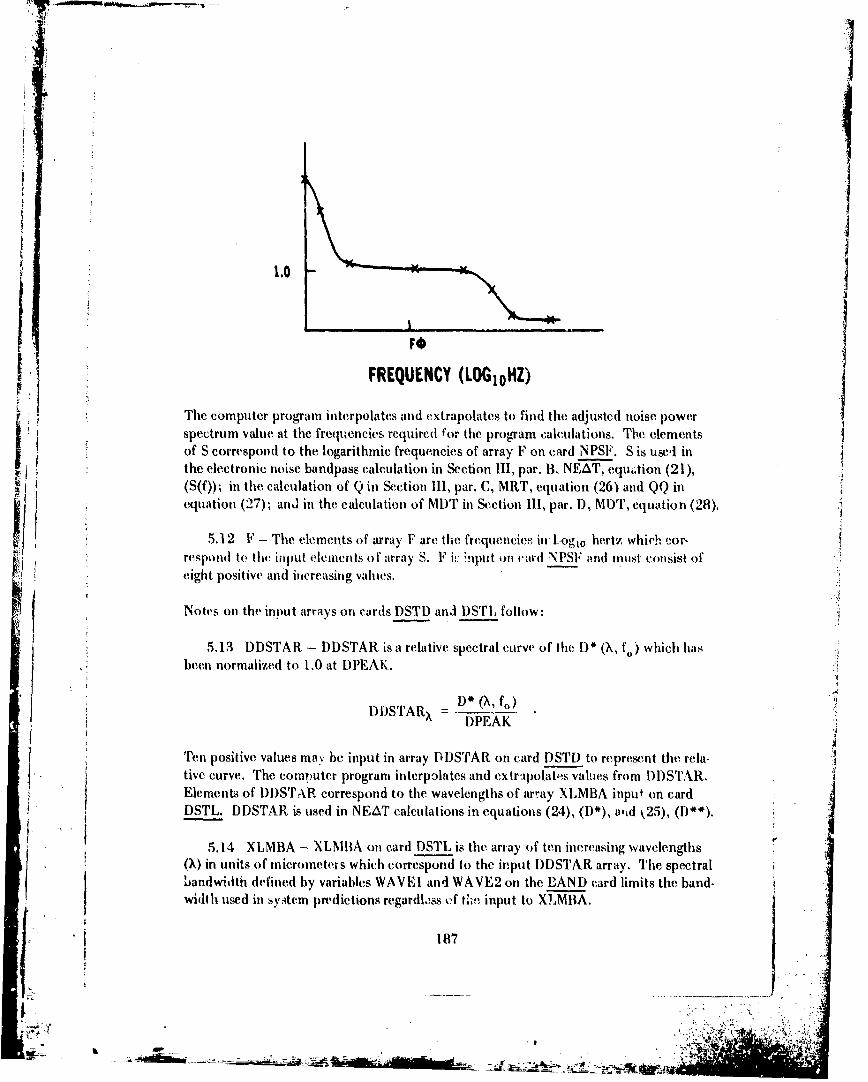
F$
S! FREQUENCY (LOGIoHZ)
S! : The computer program interpolates and extrapolates to find the adjusted noise power• i spectrum value, at the frequencies required f'or the proggam calculations. The, elements
S~of S correspon~d to the logarithmic frequencies of array F on card NPSF. S is use,,t in•/÷ ' ! ~the electronic noise bandpass calculation in Section 111, par. B, NEAT, e'-''qui~tion (21),"•i i (S(f)); in the. calculation of Q in Section 111, par. C, MRT, equation (26)} and QQ ini[! equation (27); and in the calculation of MDT in Section 111, par. 1D, MOrT" equation (28).
5.12 F - The elements of irray F are the frequencies, in'Lo-l0 hertz which eor-girespond tO thV iinput ('eHlement of array S. F Lin !put on vard NPSQF and nitst consi'st ofl eight positive and increasing values.
Notes on the input arrays on ca~rds DSTD andi DSTI, follow:
5.13 DDSTAR - DDSTAR is a relative, spectral curve of the I)* (X, fo) which has :
been normaiized to 1.0 at DPEAK.
DFR U (X, fNY) ;JO 0
DDSTARx,="DPA .
l ~ Ten positive values maý be input in array DDSTAR. on card DSTD to represent the rela- •tive curve. The computer program interpolates and extrrpolates valts from DDSTAR.
SElementr of DDSTAR correspond to the wavelengths of array XLMBA inpus on cardDSTL. DDSTAR is used in NEAT calculations in equations (24), (D*), and Q25), (Dn ).
5.14 XLMBA - XLMBA on card DST is the array of ten increasing wavelengths(.) in units of micrometers which correspond S o the input DDSTAR array. The spectralLandwidti defined by variables WAVEI and WAVE2 on the EAND card limits the band-width used in sybtem predictions regardless of o11-z r input to r tMBA.
S" 187
cuv.Tecmue pormitroaesadetnplts ausfo DTR

Supple-nent 6
Electronics
The ýystem's electronics are described by the input on cards ELEC, EMTF, BMTF,VMTX, and VNITY. Default values for cards BMTF, VMTX, and VNMTY are listed inTable D2. Default options do not exist for cards ELEC and EMTF. Since four of thesecards, EMTF, BNITF, VMTX, and VMTY, represent component MTF's, the general pro.cedure for MTF data is outlined below. Deviations from the rer.ral j•.occdure will beexplained in the notes on the individual variables.
General Procedure foc Inputs of MTF's
(1) If there is no system degradation due to the component (i.e., an MTF of 100%)or if the component is not a part of the system, input ten 1.0's for the array.
(2) If one is given a measured or known MTF, input ten values off this knowncurve which correspond to the ten frequencies on FCMR for spatial response or FLHZfor temporal respone.
(3) If a predicted MTF is desired, input ter, 0.0's and the reowired variables forcalculations.
Notes on the individual variables on card ELEC follow:
6.1 CUTOFF, FELECT - CUTOFF is the frequency of the 3-dB preamplifiercut-on in units of hertz. CUTOFF > 0.0. Common values of CUTOFF range between
3.0 and 7.0 hertz. FELECT is the frequency of the 3-dB amplifier cutoff in units ofhertz. FELECT > 0.0. Both inputs are illustrated in the following figure:
.707 - - - - - - - - - - - - - - -
CUTOFF FELE:CT • '
FREQUENCY (Hz)
The value of CUTOFF is a necessary input; however, FELECf is not. FELECT is usedby the prograuk in the prediction of the electronic MTF, Section III, par. A3, MTF,Electronics, equation (15), (f.). The electronic MTF (HEIECT) is predicted only if
188
• ,ingm~g ~mm2
4~Ai.- -,• . ,. , . -.- I.•
array XE on card EMTF is all 0.0's. If HELECT i3 not calculated, FELECT is not usedby the program and may be input as anything.
6.2 XY, XYL - XY awl XYL are the angular subtense in objeat space in Ithex-direction and the y-direction, respectively, of the electro-optic multiplexor LED. Ifthe system has no multiplexor, then XY and XYL = 0; otherwise, XY, XYL > 0.0and are in units of milbradians. XY and XYL are used to predict the LED filter function(HLED) in equation (17), (xl.
6.3 XK, FMAXF - XK is the amplitude of the electronic boost at frequencyFMAXF, If the system does not have an electronic boost, then XK and FMAXF = 0.0.If a predicted boost MTF is desired as in equation (16), (He,), then XK(K) > 0,FMAXF (fMAX) > 0, and FMAXF is in units of K hertz. The boost MTF is predicted
I only if the array XB on card BMTF is all 0.0's. If a known Doost MTF is input oncard BMTF, then XK = 0.0 and FMAXF 0.0.
Notes on card EMTF follow:
6.4 XE - XE is the MTF of the electrenicg. XE is an array of 10 values whichScorrespond to the increasing frequencies of array FQQ on card FLHZ. All values of XE
must be >' 0.0. The general procedure for input of MTF's is applicable. The requiredinput for method (3) of the general procedure is FELECT on card ELEC. The predictedMTF is calculated by equation (15). There is no default option.
Notes on Frd BMTF follow:
6.5 XB - XB is the MTF of the electronic boost. XB is an array of 10 valueswhich correspond to the increasing frequencies of array FQQ on card FLHZ. All valuesof XB must be > 0.0. The general procedure for input of MlrF's is applicable. The re-quired inputs for method (3) of the general procedu.•; are XK and FMAXF on cardELEC. The predicted MTF is calculated by equation (16). The default option in Table"D2 is to assign all 1.0's to the array BMTF.
Notes on cards VMTX and VMTY follow:
" .... 6.6 XTV, YTV - XTV and YTV are the MTF's of the vidicon in the x-directionand y-directi'rn, respectively. Both XTV aiid YTV are arrays of 10 values which cor-
-... respond to the increasing spatial frequencies of array FQ op card FCMR. AU values of-: -. XTV and YTV must be > 0.0. Methods (1) and (2) of the general procedure for input
of MTF's apply. Method (3) does not exist as an option, i.e., there is no option topredict the MTF of the vidicon. The default option in Table D2 is to assign all 1.0'sto the arraya XTV and YTV.
189
- .-. - -:.4.:0--.
Supplement 7
Display
Three display options exist to the user of the thermal model: a CRT display, a
LED display, or no display. In each case, the MTF of the dijplay is calculated by theprogram in both spatial dimensions. Presently, there is no available method to directlyinput a display MTF. For overscan on the display, see Supplement 10. Notes on indi-vidual parameters of the DISP card follow:
7.1 KKK - KKK indicates the type of display. Three correct inputs exist:
0 0.0 = CRT display. Based on the assumption of a gaussian spot sike and a gaussiantransfer function, the display MTF is calcutated in Section 111, par. A4, MTF, Display,
•' equation (18), which is
"ifCRT (f) = EXP(-af 2 ).
The frequency f is in units of cycles/milliradian. The variable a is defined in7.3. ,
I ~1.0 = LED display. The MTF calculation for this display is described in Section III,par. A3 and A4, MTF, Electronics and Display, equation (17).
0 2.0 = no display. An MTF of 100% is calculated in both spatial dimensions for thedisp!ay. A warning is due here. If the noise-filter function from the detector to thedisplay iN (f) in Section III, par. C, MRT, equation (26), does not roll off in both thex-direction and the y-direction, the computer program will blaw up. The noise-filtering MTF's ih the x-direction and y-direction, respectively, are:
"HN (fx) " "ELECT "iH 1"VID "LED "LOS "HDISPL4Y
and
HN (fy):-= 1V.IL,,-Lt o • IIL os 1 •,0 HDISPLAY
where HELECT electronic MTF
"JIB = bost MTF
,HVID = vidicon MTF
190
"•[ )r
. 1VA""ii
HLED = LED MTF
tlLOS = stabilization MTF
HDISPLAY = display MTF.
7.2 BRII E - BRITE is the average display brightness from the scene in units offootlamberts. The MTF'of the eyeball is a function of BRITE (light level) as explainedir Section HI, pu:. A6, MTF, Eyeball, equaton (20) and Section III, par. A6, Table 3.A typical value is 10.0 fL.
7.3 XA. YA-
* If KKK - 0.0, then XA and YA are the inputs to the MTF calculation of the CRT,iispiay in equ'tion (18) (the value of a) for the horizontal and vertical spatial dimen-sions, respectively. XA and YA are to be calculated in the same manner as ABLURby methods (3) ond (4) of Supplement 3, par. 3.3. Acceptable inputs are positiveand in units of square milliradians.
I If KKK = 1.0. XA and YA are the angular subtense of the LED in the horizontaland vertical dimensions then the display MTF is a sinc function. XA and YA are
the values of x in equation (17). Acceptable inputs are positive and in units o i milli-.a'ians. If one is given an MTF of an LED display, solve equation (17) by mn thod(3), ABLUR, Supplement 3, par. 3.3.
* If KKK = 2.0, the values of XA and YA are overridden.
191
Supplement 8
System
Input variables on the SY ST card and the BAND card pertain to the whole systemrather than to any particular component. Notes on ihidividual variables follow:
8.1 HFOV, VFOV - HFOV and VFOV are the system's field of view in the hori.zontal and vertical directions, respectively. Both inputs must be greater than 0.0 andless than or equal to 360.0 in units of degrees. In Section II, par. B, NEAT, equation(23), the number of resolution elements per second is dependent upon the svstem'sfield of view. An important check must be made by the user to insure consistency.
# active raster lines/frame x DELTAY
VFOV----OVERSC x 17.45
This is the same relationship as stated in Supplement 4.3. A change in one variable willaffect another. One is often given specifications for a particular atpect ratio for thefield of view. An exaniple of a chain of interactions which might occur is if one changesDELTAY which affects VFOV which affects HFOV to maintain an aspect ratio.
8.2 XMAG - XMAG is the system's magnification. XMAG > 0.0. XMAG isused in the calculation of the eyeball MTF of Section III, par. A6, MTF, Eycball, equa-tion (20), (M). The system includes the device and observer; therefore, magnificationis dependent on where the observer is in relation to the display. One method to calcu-late XMAG follows:
XMA(;-- display size (in.) x 1000viewing distance (in.) x VVFV x 17.45
"Note that a change in VFOV will affect XMAG. However, since the viewing distance isusually rrbitrary, there is no need to adjust XMAG for every small change in VFOV.
8.3 FACT - FACT is the ratio of the wide VFOV to the narrow VFOV of a sys-tem. Some systems opcrate in either a narrow field of view or a wide field t)f view.mode. The wide field of view is usually preferred for a detection task. Predictions forrecognition arc in the input field of view but predictions for detection are in both theinput (usually narrow) ,nd adjusted (wide) field-, of view. The narrow field of view"system and wide field of view system differ in inputs of IlFOV, VFOV, XMAG,DELTAX, DELTAY, FQ, FNUMB, XY, XYL, XSIGLS, YSIGLS, XA, and YA by aconstant factcr. This constant is FACT. In order to save the user from making allthese adjustments and rinning a second system, the model automatically calculates adetection prediction based on the wide field of view system. FACT > 0.0. If the
19?
system has only one mode of ope'ation, input eACT - 1.0 and ignore t.F(! output fordetection in the wide field of view.
8.4 XNET - Two options exist for input to XNET:
(1) If the user wishes the model to predict the noise equivalent temperaturedifference (NEAT) by the dei'initions of Section HII, par. B, NEAT, then input XNET0.0.
(2) If the user wishes to specify the NEAT and not use. the model's calcula-
tion, he may input the value for XNET. XNET > 0.0 and in units of degrees centigrade.
Inputs of the BAND card follow:
8.5 WAVEI, WAVE2 - WAVEI and WAVE2 define the spectral bandwidth forall system and atmospheric calculations executed by the program. Values for WAVEIand WAV E2 are determined by the operating spectral bandwidth of the system and arein units of micrometers. NAVE1 > 2.0 and WAV E2 < 16.0. Throughout this report,wavelength is noted by X and the spectral bandpass, by AX.
193
Supplement 9
Stabilization
The line of sight stabilization is discussed in Section 111, par. A5, MTF, Stabiiiza-tion. Three input cards, STAB, LSSX, and LSSY, generate the stabilization MTF. In-puts of LSSX and LSSY follew:
tion XMex YML - XML of card LSSX is the array of MTF values of the stabiliza-ti~nilktheY iirection, and YML of card I.SSY is the MTF of the stabilization in the
y-direction. The airays of MTF values correspond to the array of spatial frequencies oncard FCMR. Acceptable values range 'rom 1.0 to 0.0. !nput values of arrays XML andYML need not be the same. Three options exist for inputs tc; the XML and YML arrays:
(1) If ther:n is no system degradation due to the lack of stabilization, inputten 1.0's; or because the default option ;s all 1.0's, leave cards LSSX and JASSY out ofthe data deck.
(2) If one is given a measured or known stabilization MTF, input ten MTFvalues off this known curve. which correspond to the FQ array on the FCMR cafd.
(3) If ten 0.0's are input for arrays XMI andI YML, an MTF which is as-sumed to) be gaussian is calculated from equation (1"9. Inpiuts XSICLS and YSJGLSreplace p in equation (19) and are necessary inputs on card STAB.
Inpits of the STAB card follow:
9.2 XSIGLS, YSIGLS - XSIGLS, the x-direction vibration constant, end YSIGLS,the y-direction vibration constant, are necessary for the calculation of the stabilization
MTF in method (3) in par. 9. 1. If method (3) is not used to generate the MTF, the
values or, the STAB card are overridden. Default values ire XSIGLS =0.0 and YSIGLS:-0.0. XSIG;,S and YSIGLS need not be equal but must be >' 0.0 and in units of square
milliradians. Refer to Suppitment 3.3 and the description of ABLUR. for the methodto '-alculate XSIGLS and YSIGLS.
AY,
194
7 ''7
Supplement 10
Eye
EYETM on card EYEB is the integratior tnimu ;t- the eye. It is used in the MRTprediction3 in Section 111, par. C, MRT, equations (26) ond~ (27), (ZE)' and in SectionIII, par. D, 1ADT, equation (28). Most model validation of predicted MRT versus mea-sured MRT and predicted performance versus measured field performence is based onEYETM = 0.2 second/frame. If there is any over,-an in the display, EYETM may besomething other tha*n 0.2. Overscan -in the d~splay exists if, for any scan of the dete-tor elements, the display element is greater than tie detectcr's instantaneous field ofview in the vertical direetion. The overscan in the display is not to be confused 'Vith thevariable OVERSC, the overscan in ihe JR field, in Supplement 4.3. The input value ofEYETM which includes any ovcrscan in the display is calculated by:
EYET = 02 *vertical IFO VLEDEYETM0.2*vertical IFOVDE
where the vertical IFOYLED is the input variable YA for an LED disjpiay or, caurd DISPand WVDFTis the inp'it variable I)ELTAY on card DETR. The default for leavingan FVF
card EYEB out of the data deck is EYETM =0.2.
AA
195
77S -
Q1-,,~
Stkpplement 11
Program Cards
Most users should not inpui cards SN4B, FDRP, FDCII FRC3, tind FRC4. If thecards are excluded from the data deck, the default values in TaLle D2 will be substituted.The validation of the model is based on the defmult inputs. The option to input valuesother than the default is for research purposes only but is presented here for comiplete-ness.
11.1 SNR on card SN4B is the threshold signal-to.noise ratio used in Section III,par. C, MRT, equations (26) and (27)ý, (SNR), and MDT predictions in 3ection IjI, par.D, MDT, equation (28), (S'). Validation performed to date is based on SNR = 2.25.By excluding the SN4B card frow the data deck, the. default option sets SNR = 2.25.
H 1.2 Cards FDRP, FDCI, FRC3, and FRC4 express the relationship between prob-ability of recognition or detection and the number of resolution yoles across a target'scritiva, dimensie,;. The relationship is based on the Johnson method. FI)RP containsthe dccrvasing probabilities of recognitioni or detection which range from 1.0 to 0.0.FRC3 anci FRC4 cmtain the number of cycies across a target which are rquiired forrecognition and correspond to the probabilities on FDRF. Ai 50% probability, threebars are the default value on FRC3 and fovr bars. onl FRC4: the model output describesthese as optimistic and conservatve criteria. The Recognition section (I'") in the mainbody of the report considers other ahernatives. The field to model comparisons in theValidation section (VI) in the main body of the report are based oa the four-vycle cri-teria. Therefore, unless the user has measured data mtpportmg another criteria, heshould use the def'ult options of FRC4 and FRC3. Fi.ially, F9C_.C I contains the numberof cycles required for detection. Thest cycles correspond to the 1v"obabilities on FDRP.The default opti'n in Table D2 is the sarne as lis',-d in Table V of the l)Detecton section(V) of the main body of the report. Iaput values on FDRP are :n desending order, buton FDCI, FRO3, arid FRC4 input values ave in ascending order.
11.3 FQ of the FCMR card is anl array of ten spatiel feequet:xeiis in units of eycles/milliradian. MTF values of the optics input on cards MTOX and MTOY, vidicon inputon cards VNITX and VNITY, -,id stabilization input on cards LSSX and LSSY must cor-
-. ! respond to the spatial frequencies on FCMR. Freq.uencies must be in ascending order.A default option is listed in Table D2. If :to +;iven MTF's are inptit on ally of the above
'4card,!, then array FQ is not uised. In thiei case., input arty values onl FCMR or It-awe thecard out of the data deck.
1. 1.4 FQQ on the FLU2 card is an array of ten temporal frequencies in leglo hertz.NMTF values of the deW -tor response input on card& D)ROX and DROY, eiectronics input
196
' J
on EMTF, and the boost input on BMTF must correspond to the temuporai frequencieson FLH2. Array values must be in ascending order on FLH2. A default option is listedin Table D2. If no given MTF's are. input on any of the above cards, array FQQ is notused and the user may input any values on FCMR or exclude the card from the datadeck.
1
•":" 197
Supplement 12
Specialized Options and Diagnostics
There arv several special options whici, have been included inl the model. TIheseoptions have to do with env. ronmental inputs, mevasured MRT inputs, and an interactiveterminal user mtode.
12.1 ENV IRON MENTAL I NPUTS - Variable ISTATE has two othor values whichgive special optio.ý. If ISTATE = 31.0, certain write statements tire setl up in the atin)-spheric subrouitine and the Beer's La~w scattering option is utsed. It must be used with aSCAT card (below) and IPRINT (below). If ISTATE =4 1.0, certain write statementsare- eet tap inl tite atmosphere subrouitine andI the Beer's La~w total tittentiation option is
uised. It must be tised with a TOTI, ca-d tind IPRtINT (below).
Variable- IPBHllN'I is anl option which prints certait, diagnostic information di-rectly from the atitnioplicric suibrouitine. It (till also hei toed to find mit aitmosphericconstituient transmnission as a funiction of w.1velength. lIPRINT is~ the fifth variable onlthe ENVI card. It can take onl a valuies:
0 or blank - 11o prm touti
I - abbreviated printout listinig initial conditions and abso.rber conceti.rtitions
per kilometer.
2 - detailed printouit listing initial coniditions, absorber coiicentratioits perkilonmeter, and aill coniptitell ('olsti Iittiet tranismissions as a funlction of Iwaivelength.
Another opini o hiti t spoc scattrn tranmision per kilometer
onl the SC ATr card where the scattering traiisinission is inl decimal form for any seven 1wavvilengthls Within the( bandl in whicht the systemi operates. A FOR)l I format is required.All seveni fields mutst Ile filled tind., like the TOll. ctard, it requires the( ATEW cardI orjits(-., the WAVE defauilts (see able D)2). This -option allows (the user to directly inputscattering attenutation (if tiny) tand to let the program computet the( attenuiation duie toabsorption (Hi2 0 C0.A2 , vic.). Consequently, anl EN VI card is requnired to inititilly deffiiie
* I ~the temnperatuire aind relative hnniidity unless the defauilt ')ptions aire- desiretd. The variai-bles H VIS tand ISTATE are always ignored wheni usinig this opt ion so the( rain and fogmodels canniot hei uised along withI SC AT.
12.2 Mecasiurt(I NI ItT - This option allows the use'r to iniput a measured Nli( for~~ ~performnitmce calcuilations. It might be ol interest to ati ser who wishes to compare mnea-
stireI iNIB T performance with predicted NiRT performance. Twenty valuecs are neede'd* for anl NRT These correspond to specific frequtencies witl'in the spatial freqtiency)
198
resolutio)n band of Qic device. The MRT vahues are- to be input on the followiing cards:NIRT I (fields 1.7), LIRT2 (fields 1-7), an~d MRH T3 (fields 1-6). These ca, (1 all use theFOR I tortuat. T'he selected M WI' values must correspond to frequencies th~at the pro.grant~ will generate. These frt'quneI~its are definvd by the variable DL)lTA x onl tlt( card
-ET. 1'requcitcy incremtents are -alculated by
X1,-20.9) 1ELTAX
In field onle oila~' Nt'IRT, it t~ieasured NI RT is enItered which ('orres1)orcds to the spa.-tial frequency XI,. lit field two, enter the( meas~ire(1 MRI' that corresponds to twotimies Xl.. Simuilarly, cont inue until fields 1-7 oil card NIRT I and mRT2 are filled aswell at; fields 1-6 on card NIRT3. All NIRT values should be in units of 1I* 0~ C.
The following cakrds must be usedl when inputting a mea'sured NIRT: BAND,DETI'R, SYST, DS'lD, and l)S'lL. Ili addition, the I'NVI, TARG, anid RANG cards aremost often included whien using this option. The output listing is always in the abbrev~-Inate-d forviat; however, the detection and recogntition performance is temperature
12.3 INTERACTIV E - There exists anl ability to use the thermial model in anl
interactive miode. The iinttractive aspects van he used with a CDC 6600 computer anda4012 Tektronix terminial. Subroutine [NIT checks to find ouit if the, user is runningbatch or interactive niode. Ini order .1o run inttcradtive, the user inus, give, the command:swi'rch, I. IAFLG is the variable used to indicate' batch (IA FLG =0) or interactive(lA1'LC I ) miode. Subroutine REAI)F allows the interactive user to input his varia
bles ill a' free-field format.
.4 Ini ordIer to enter input data, the four-letter identifier should be entered first.Theni, after prompting, all inputs may be typed in. Each must be separated by a commila.Under this format, decimal points may be omitted for Anteger valutes. At the end of the',data list associated with anl identifier, a slash (/) mus-t lit entered. All program cards anddata cadis- are vntt'red in it similar manner. After the DONE card is, inpuit, th- program.begins execution anid pirints out an input listing similar to the computer printout.
Before any calculations take place, the program will ask if any values need
proramtoreciv corecios. ex ty~eFORt or FOR2. Read in the appropriateidetifem n4 igoiatd vlue fo th vaiabesto be changed. After all changes h~ave.
been ~ go and fnshwt the progam EN illn DONE combination. When all inputs arecorrctentr "o" nd he rogam illexecute. Input and output lietingsl are e.asen-
tilytesame as those obtained when the program is used non-interactively. Some
199
-w-7- -~- ,' ' .q
small modifications hve been made, however, so all tistings will easily fit on the CRTdisplay. Hard copies cai, be ioade directly from Al[. CRT display when the appropriatehardware is available.
12.4 DIAGNOSTICS -. There are four diagnostic messagcs that may appear in thisvcrsion of the themal model:
(1) Error has been made on input card - do's not conform to properCOntven tion.
(2) An input system card for FORI has not been recognized.
(3) An input system cird for FOR2 has not been recognized.
(4) Your input value of XLAMB is xxx.xx and is not in.ide the specifiedranges.
Error message (1) flags .r, invalid special input card. Error messages (2) andk3) inform the user that an attempt has been made to read an invalid identific- in eitherthe FOR! or FO R2 format. Check all identifiers and special input c rds against TablesD2 and D3. Also make sure that all FORI and FOR2 firmatted cards are behind theirappropriate special input card.
Error message (4) pertains to the variable XLAMB on the OPTI card. Chc'-kSupplnement 3 in order to identify the pr'lIem.
2
I,
'20
= 1-"j '


![Myastenie Gravis1 kučerová [Režim kompatibility] · -- jiné autoimunitní onem jiné autoimunitní onem. . (autoimun. onem.(autoimun. onem. ŠŽ ó 튎, lupus erytemathodes,](https://img.pdfslide.net/doc/110x75/5c91dd0809d3f24c328c8589/myastenie-gravis1-kucerova-rezim-kompatibility-jine-autoimunitni-onem.jpg)